Embed Size (px)
Citation preview

Who cares about the Chinese Yuan?
Vimal Balasubramaniam, Ila Patnaik, Ajay Shah
Working Paper 2011-89
May 2011
NIPFP-DEA Research Program on Capital Flows and their ConsequencesNational Institute of Public Finance and Policy
New Delhi
http://www.nipfp.org.in/nipfp-dea-program/index.html

Who cares about the Chinese Yuan?
Vimal Balasubramaniam∗ Ila Patnaik Ajay Shah
May 3, 2011
Abstract
The rise of China in the world economy and in international trade has raised thepossibility of a rise of the Yuan as an international currency, particularly after theChinese authorities have undertaken policy initiatives such as Yuan settlement andYuan swap lines. In this paper, we measure one dimension of Yuan internationali-sation: the role of the Yuan in the exchange rate arrangements of other economies.While the magnitudes are small, our findings show that as many as 34 currenciesin the world have been sensitive to movements in the Yuan. This suggests that theYuan potentially has a significant role to play in global exchange rate arrangements.Contrary to popular belief, however, we find a limited role of the Yuan among Asianeconomies.
JEL Code: F31, F33Key words: Renminbi, Yuan, Exchange rate regime, Internationalisation, East Asia
∗This paper was written under the aegis of the National Institute of Public Finance and Policy -Department of Economic Affairs, Ministry of Finance Research Program. We are grateful to JoshuaAizenman and Tarun Ramadorai for useful discussions on an earlier version of this paper. Correspondence:[email protected]
1

Contents
1 Introduction 3
2 Motivation 52.1 Larger implications . . . . . . . . . . . . . . . . . . . . . . . . . . . . . . . 7
3 Methodology 8
4 Results 134.1 A Yuan bloc? . . . . . . . . . . . . . . . . . . . . . . . . . . . . . . . . . . 134.2 An East Asian Yuan bloc? . . . . . . . . . . . . . . . . . . . . . . . . . . . 144.3 What is the magnitude of the role of the Yuan? . . . . . . . . . . . . . . . 15
5 Conclusion 17
A Who cared about the Chinese Yuan? 20
2

1 Introduction
There are two mechanisms through which China’s exchange rate policy can have spilloversupon the policy choices of other economies. First, economies which compete with China inexport markets may be averse to appreciation against the Yuan. Second, economies thatare part of the Asian production network may have an incentive to lower bilateral exchangerate volatility against the Yuan, to the extent that their firms are engaged in internationaltransactions denominated in Yuan. This second class of motivations has been highlightedin recent years, with Chinese initiatives on Yuan settlement, Yuan swap lines and Yuandenominated bonds that aim to establish the Yuan as an international currency.
In this paper, we trace the role of the Yuan in exchange rate arrangements worldwide sinceJuly 2005. In this setting, we ask three questions. First, has there been a role for theYuan in worldwide exchange rate arrangements? Second, has there been a particularlyimportant role for the Yuan in exchange rate arrangements in Asia? Third, what has beenthe magnitude of the role of the Yuan? In the first two cases, we test the null hypothesisof no-effect, and in the third, we measure the magnitude of the relationship.
This work is important in understanding the role of China in the world economy, thenew phenomenon of Yuan internationalisation, the evolution of exchange rate arrangmentsamong emerging markets and developing economies, and the Asian production network. Ityields a measure for one dimension of Yuan internationalisation: its role in the exchangerate regime outcomes of other currencies.
One additional dimension which motivates this work lies in the extent to which Chineseappreciation is important for global rebalancing. The Chinese current account surplusis 0.74 per cent of world GDP. Even if a substantial appreciation took place in China,it would have a relatively modest impact upon global aggregate demand. If, however, aChinese appreciation encouraged or enabled many other economies to also appreciate, thenthe overall impact upon global aggregate demand would be larger. Thus, if we find thatthe Yuan has come to play a significant role in global exchange rate regimes, there is agreater importance of Yuan exchange rate regime reform for global rebalancing.
We use the exchange rate regression, where percentage changes in an exchange rate againsta numeraire currency are regressed on changes in the dollar, the pound, the yen and the euro(Haldane and Hall, 1991; Frankel and Wei, 1994; Frankel, 2009). We focus on the periodfrom October 2005 to February 2011, a period in which there have been modest changes inthe CNY/USD rate. A natural extension of this model would involve an additional CNYregressor. However, weekly changes in the CNY/CHF rate have a correlation coefficient of0.988 against the USD/CHF rate. Hence, we construct a time-series (d log(CNYo/CHF ))by extracting the autonomous movement of the Chinese exchange rate, that is, independentof movements in the USD/CHF rate.
This regression suffers from the problem of structural change, either owing to changingpolicies on the part of authorities in a country, or owing to changes in external shocks.
3

We draw on recent developments in the econometrics of structural change in the exchangerate regime in order to obtain a set of break dates of structural change (Zeileis, Shah, andPatnaik, 2010). This permits estimation of the coefficient of the CNYo in each sub-period.
An analysis of 132 currencies reveals 375 periods in global exchange rate arrangements.Of these, there are 85 instances with a statistically significant role for the autonomousmovements in the Chinese exchange rate. These reveal an interesting picture of the foot-print of Chinese exchange rate policy, including large developing economies (e.g. Indiaduring Oct-2005 to Mar-2007), many economies in Africa, strategic allies (e.g. Pakistanfrom Dec-2007 to Nov-2008) and even one OECD country (Israel between Oct-2005 andDec-2007).
Turning to East Asia, there are three periods where there was a statistically significantCNYo coefficient: Malaysia (from 2005 to 2007), Viet Nam (after 2009) and Taiwan (allthrough). Barring these three periods, the remainder of East Asia has not exhibiteddependance upon China’s exchange rate arrangement.
We turn to the examination of GDP-weighted mean of the CNYo coefficient in order toascertain the economic significance of the footprint of Chinese exchange rate policy. At aglobal level, we find a small value in the years 2006 and 2007. However, from early 2008onwards, Chinese exchange rate policy has not influenced global exchange rate arrange-ments. Similar results hold when analysing the group of emerging markets and developingeconomies: Here there is a marginally stronger value in 2006 and 2007. Again, from early2008 onwards, the null hypothesis of no role for the Chinese Yuan cannot be rejected.
In Asia, the role of Chinese exchange rate policy in its exchange rate arrangment is absentthrough most of the post-2005 experience, other than a short period during the crisis wherewe obtain a point estimate of 0.03 with a 95% confidence interval running from 0.01 to0.07.
These results suggest that while China has made enormous strides in terms of achievinga major role in international trade, in establishing Yuan settlement mechanisms and inestablishing Yuan swap lines to many economies, there is relatively limited evidence of theemergence of the Yuan as an international currency in one key dimension: The role of theYuan in the exchange rate regime arrangement of other economies. The average Asiancountry appears to appreciate by roughly 0.05 per cent when China appreciates by 1 percent.
A surprising result is the footprint of the Chinese Yuan well beyond Asia. If these economiescare about Chinese exchange rate flexibility, to the extent of their revealed preferences, alarger autonomous movement of the Yuan can play a significant role on global exchangerate arrangements in the future.
4

Table 1 China’s bilateral currency swap agreements as of Jan’11
Country Date Maturity Amount RenewableKorea 12-Dec-2008 3 yrs 180bn Yuan X
38tn WonHong Kong 20-Jan-2009 3 yrs 200bn Yuan X
227bn HKDMalaysia 08-Feb-2009 3 yrs 80bn Yuan X
40bn RinggitBelarus 11-Mar-2009 3 yrs 20bn Yuan X
8000bn Belarusian rubleIndonesia 23-Mar-2009 3 yrs 100bn Yuan X
175tn RupiahArgentina 30-Mar-2009 3 yrs 70bn Yuan X
38bn PesoIceland 10-Jun-2010 3 yrs 3.5bn Yuan XSingapore 24-Jul-2010 3 yrs 150bn Yuan X
30bn Singaporean DollarSource: Xinhuanet, ASEAN, HKMA.
2 Motivation
With 30 years of high growth rates of imports and exports, China has emerged as a majorpart of international trade. In merchandise trade, China is the world’s largest exporter andthe second largest importer. Through this rise to prominence on the international stage,Chinese exchange rate policy has come to matter beyond China.
How might Chinese exchange rate policy matter to other economies?
In many less developed economies (LDCs) and emerging markets (EMs), governmentshave hindered exchange rate flexibility. One motivation for this ‘fear of floating’ lies inconcerns about export competitiveness. To the extent that a country competes againstChinese exports, a Chinese appreciation would tend to improve export competitiveness,and reduce the resistance to flexibility. Through this mechanism, China’s policy choiceson the exchange rate could have effects beyond China. Pontines and Siregar (2010) pointout the role of the Chinese Renminbi in the attempts in East and Southeast Asia to avoidappreciation.
In recent years, Chinese authorities have embarked on a set of policy initiatives that couldpotentially result in certain kinds of Yuan internationalisation: Relaxing restrictions onYuan deposits in Hong Kong, issue of Yuan-denominated bonds by Chinese and Foreigncompanies in Hong Kong, trade settlement for Chinese companies in Yuan and currencyswap agreements with foreign central banks.
Since December 2008, swap lines worth about 800 billion Yuan have been put in place. The
5

timing of such agreements suggest that the Chinese authorities could have been concernedabout the global disruption of trade financing at that time. However, such lines were ar-ranged with economies such as Belarus, Argentina and Iceland, which are not importanttrading partners to China. The intention to internationalise the Yuan became more pro-nounced when trade settlement for companies in five Chinese cities with counterparties inHong Kong, Macau and other economies in the Asian production network was announcedin July 2009. By December 2010, some estimates suggest that over 60 thousand companieshave settled trade in the Yuan.
Trade settlement agreements have been routed through banks. In 2010, Bank of China’stotal volume of Yuan-denominated cross-border trade settlement reached about 510 billionYuan ($77.6 bn). Industrial and Commercial Bank of China reported 150 billion Yuan intrade settlement business over the July 2009 to March 2011 period. A survey by HSBCreported that about 30% of cross-border trade of small and medium size companies in HKin 2010 was settled in Yuan.1
In another round of reforms, the Hong Kong Monetary Authority (HKMA) announced thatnon-financial corporations from China will be allowed to issue Yuan-denominated bondsin Hong Kong in February 2010. The first year of Yuan-denominated bonds totalled 17.5billion Yuan, with Yuan denominated deposits growing fivefold from a year earlier to 407.7billion Yuan.2
A mechanism through which cross-country spillovers of exchange rate policy could arise isrooted in the rise of complex production chains in Asia, centred in China. China is nowthe nerve centre of a complex and large production chain, where elements of economicactivity take place across Asia (Branson and Healy, 2005; Zhang, 2008). The initiatives inrecent years may have influenced the extent to which contracts within the Asian productionnetwork are denominated in the Yuan. To the extent that invoicing relationships in theAsian production chain is expressed in the US Dollar or other international currencies,exchange rate policy in China does not influence other Asian economies. However, if (say)a Malaysian producer sells into China with invoicing in Chinese Renminbi, then this createsan interest in stability of the MYR-CNY exchange rate on the part of this producer. Ifthere is a sufficiently large mass of such producers, the Malaysian authorities may come todesire a reduction in the volatility of the MYR-CNY exchange rate.
This suggests that two kinds of motivations might encourage an LDC or an EM to takeheed of Chinese exchange rate policy: concerns about export competitiveness, and Yuan-denominated international transactions either in the private or in the public sector.
To the extent that (say) the Malaysian authorities are concerned about export competitive-ness, they are more likely to appreciate the MYR/USD exchange rate when the CNY/USDexchange rate has appreciated. And to the extent that the Malaysian authorities are con-cerned about achieving low volatility of the CNY/MYR exchange rate, they would adjust
1Sources: http://goo.gl/CVZtd; http://goo.gl/bo1JU2Bloomberg, as on 22, April 2011.
6

the MYR/USD exchange rate alongside changes in the CNY/USD exchange rate.
While China has made an impressive start on the problem of Yuan internationalisation,many critical elements of an international currency are absent in China. The Yuan isperhaps decades away from becoming a serious alternative to the US dollar, Euro, BritishPound and the Japanese Yen(Lee, 2010b). The currency distribution of global foreignexchange market turnover suggests that the US dollar remains the dominant currency (at84.9%) with the Euro as the distant second (at 39.1%). The Yuan’s role fell from 0.7% in2007 to 0.3% in 2010.3 A paper by the State Administration of Foreign Exchange Taskforce4
lists various steps that the Chinese authorities could take to potentially accelerate Yuaninternationalisation. Factors such as Value Added Tax (VAT) rebate restrictions, andforeign exchange control have been identified by the authorities as important steps forward.Further, strengthening the range of domestic financial services is also seen as an importantstepping stone for an international Yuan.
To the extent that such reforms have a direct bearing upon the role of China’s exchangepolicy in the exchange rate arrangements of other economies, it could have significantglobal ramifications. It is in this perspective that an examination of the Yuan’s role since2005 gains significance. Specifically, in this paper, we ask three questions:
1. Which currencies in the world care about the Yuan?
2. Is there an East Asian bloc where the Yuan matters?
3. How large are these effects?
While two kinds of motivations may shape the thinking of economies in taking heed ofChinese exchange rate policy, our goal is to measure the overall role of China in theexchange rate regime, in East Asia and elsewhere. We do not seek to disentangle the twofactors.
2.1 Larger implications
An understanding of these questions is interesting from the viewpoint of understanding in-ternational currencies, Asian production networks, Yuan internationalisation, and the roleof China in the world economy. While there are many aspects to international currenciesand Yuan internationalisation, in this paper we concretely measure one dimension: therole of a country in the exchange rate regime outcomes of other economies.
In addition, the extent to which such phenomena are at work is of importance in thedebate about global imbalances. Some economists and governments believe that a Yuanappreciation would help increase global aggregate demand. There are two channels through
3Since two currencies are involved in any transaction, the percentage mentioned here are on 200 andnot on 100. Source: Bank of International Settlements (2010), Table 3.
4’The use of renminbi for trade and non-trade denomination and settlement’
7

Table 2 Current account surpluses: China and other parts of Asia
(Per cent of World GDP)China Newly Industrialised Developing
Asia Asia2001 0.05 0.15 0.122005 0.35 0.17 0.372008 0.74 0.14 0.71Source: World Economic Outlook database
which this would work. First, it would have a direct impact upon the Chinese currentaccount surplus. In addition, to the extent that some other economies also appreciate inresponse to a Chinese appreciation, this would yield an additional impact.
Table 2 shows that in 2008, the Chinese current account surplus was 0.74 per cent ofworld GDP. However, the remainder of Asia had a current account surplus adding up to0.85 per cent of world GDP. Appreciation in China would have a certain impact upon theChinese current account surplus. However, if other Asian economies would also appreciate,in response to a Chinese appreciation, then the potential impact upon global aggregatedemand is potentially larger. In this case, Chinese exchange rate policy is an importantelement of global macroeconomic policy. If, alternatively, we find that other economiesare not greatly influenced by Chinese exchange rate regime choices, then Chinese exchangerate regime reform would have a more muted significance for the world at large.
3 Methodology
Our work supplements Ito (2010) and Lee (2010b). Both Ito (2010) and Lee (2010b)measure internationalisation as the percentage of world reserves denominated in the Yuanand using simulations project likely scenarios in 2035. In doing so, Lee (2010b) suggeststhat the Yuan has the potential to move from about 3% to 12% of international reserves by2035. We offer specific estimation strategies and a measure of Yuan’s role in the exchangerate arrangement of economies across the world.
Table 1 shows the time-series of the CNY/USD exchange rate. On 22 July 2005, theChinese departed from the fixed-but-adjustable rate to the USD which had prevailed untilthen. Hence, in this analysis, we only focus on the data following this reform. Weeklypercentage changes in the CNY/USD exchange rate prove to be near-zero until October2005. Hence, the analysis of this paper starts in October and not July 2005. Over thisperiod, we see a certain variability in the exchange rate, which can potentially supportestimation of the spillovers on other currencies.
A natural starting point for this analysis is the exchange rate regression (Haldane andHall, 1991; Frankel and Wei, 1994). In this approach, an independent currency, such asthe Swiss Franc (CHF), is chosen as an arbitrary ‘numeraire’. If estimation involving the
8

Figure 1 The Yuan exchange rate arrangement
1995 2000 2005 2010
5.5
6.0
6.5
7.0
7.5
8.0
8.5
12 Jan '94 01 Nov '02 28 Aug '05 01 Jan '08 21 Jun '10
2.03 yrs
8.80 yrs
2.82 yrs
2.84 yrs
1.97 yrs
Basket peg
Dollar peg
Dollar peg
Crawling peg
Dollar peg
9

Figure 2 Squared weekly orthogonalised Yuan returns
2006 2007 2008 2009 2010 2011
0.0
0.1
0.2
0.3
0.4
0.5
0.6
Squ
ared
wee
kly
retu
rns
of O
rtho
gona
lised
CN
Y
Malaysian Ringgit is desired, the model estimated is:
d log
(MYR
CHF
)= β1 + β2d log
(USD
CHF
)+ β3d log
(GBP
CHF
)+ β4d log
(JPY
CHF
)+β5d log
(DEM
CHF
)+ ε
This model can be extended to have an explanatory variable CNY/CHF, where a β6 param-eter would pickup the extent to which the Malaysian authorities respond to a unit changein the CNY/CHF exchange rate. A number of studies have attempted to extract the roleof the Yuan in the exchange rate arrangements of other currencies using this methodologyand have also pointed to the shortcomings of this approach (Ito, 2008; Ma and McCauley,2010). One of the main problems this approach would suffer is that of multicollinearity:the high correlation between the percentage changes in the USD/CHF and CNY/CHFexchange rates. As an example, from 2005 to 2010, weekly percentage changes in thesetwo currencies had a correlation of 0.988.
Hence, we first orthogonalise the CNY/CHF exchange rate with respect to the USD/CHFexchange rate, in order to purge it of this high correlation. This is done using the regression:
d log
(CNY
CHF
)= γ1d log
(USD
CHF
)+ ε
The ε from this regression represents the autonomous movement of the CNY. We term thisd log
(CNYo
CHF
). This time-series is plotted in Figure 2.5 With this in hand, an augmented
exchange rate regression can be considered:
5Some studies have pointed out to different exchange rate arrangements for the Yuan since July 2005
10
d log
(MYR
CHF
)= β1 + β2d log
(USD
CHF
)+ β3d log
(GBP
CHF
)+ β4d log
(JPY
CHF
)+β5d log
(DEM
CHF
)+ β6d log
(CNYo
CHF
)+ ε
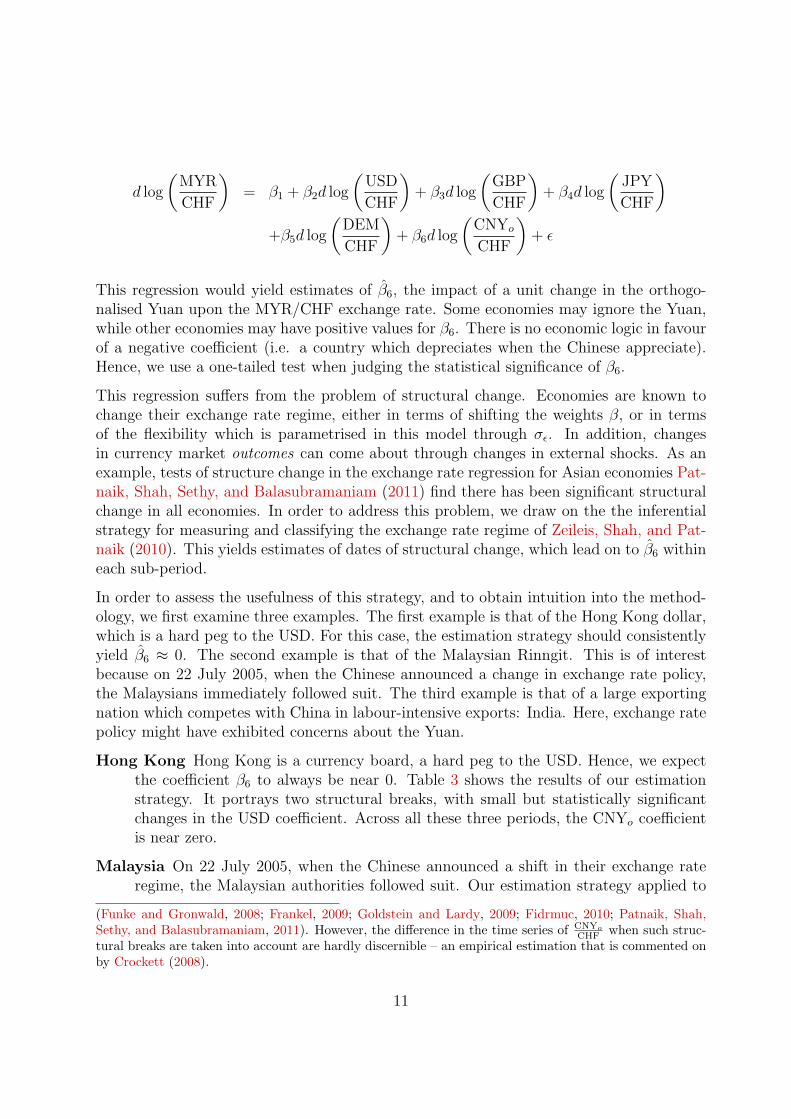
This regression would yield estimates of β̂6, the impact of a unit change in the orthogo-nalised Yuan upon the MYR/CHF exchange rate. Some economies may ignore the Yuan,while other economies may have positive values for β6. There is no economic logic in favourof a negative coefficient (i.e. a country which depreciates when the Chinese appreciate).Hence, we use a one-tailed test when judging the statistical significance of β6.
This regression suffers from the problem of structural change. Economies are known tochange their exchange rate regime, either in terms of shifting the weights β, or in termsof the flexibility which is parametrised in this model through σε. In addition, changesin currency market outcomes can come about through changes in external shocks. As anexample, tests of structure change in the exchange rate regression for Asian economies Pat-naik, Shah, Sethy, and Balasubramaniam (2011) find there has been significant structuralchange in all economies. In order to address this problem, we draw on the the inferentialstrategy for measuring and classifying the exchange rate regime of Zeileis, Shah, and Pat-naik (2010). This yields estimates of dates of structural change, which lead on to β̂6 withineach sub-period.
In order to assess the usefulness of this strategy, and to obtain intuition into the method-ology, we first examine three examples. The first example is that of the Hong Kong dollar,which is a hard peg to the USD. For this case, the estimation strategy should consistentlyyield β̂6 ≈ 0. The second example is that of the Malaysian Rinngit. This is of interestbecause on 22 July 2005, when the Chinese announced a change in exchange rate policy,the Malaysians immediately followed suit. The third example is that of a large exportingnation which competes with China in labour-intensive exports: India. Here, exchange ratepolicy might have exhibited concerns about the Yuan.
Hong Kong Hong Kong is a currency board, a hard peg to the USD. Hence, we expectthe coefficient β6 to always be near 0. Table 3 shows the results of our estimationstrategy. It portrays two structural breaks, with small but statistically significantchanges in the USD coefficient. Across all these three periods, the CNYo coefficientis near zero.
Malaysia On 22 July 2005, when the Chinese announced a shift in their exchange rateregime, the Malaysian authorities followed suit. Our estimation strategy applied to
(Funke and Gronwald, 2008; Frankel, 2009; Goldstein and Lardy, 2009; Fidrmuc, 2010; Patnaik, Shah,Sethy, and Balasubramaniam, 2011). However, the difference in the time series of CNYo
CHF when such struc-tural breaks are taken into account are hardly discernible – an empirical estimation that is commented onby Crockett (2008).
11

Table 3 A pure peg to the US dollar: Hong Kong
Start date End date R2 USD ... CNYo Variance2005-10-14 2009-03-20 1.00 1.00 ... -0.01 0.00
(77.93) ... (-0.22)2009-03-27 2009-12-11 1.00 0.99 ... -0.02 0.00
(175.68) ... (-0.59)2009-12-18 2011-02-11 1.00 1.01 ... 0.00 0.00
(38.91) ... (0.01)
Table 4 The role of the CNY in the Malaysian Ringgit
Start Date End Date R2 USD ... CNYo Variance2005-10-14 2007-06-01 0.89 1.23 ... 1.13 0.13
(5.31) ... (2.89)2007-06-08 2011-01-14 0.71 1.01 ... 0.22 0.56
(9.28) ... (0.87)
Malaysia, yields results (Table 4) that are consistent with this. For the first period,which runs till 1 June 2007, the point estimate for β6 is 1.13 and H0 : β6 = 1 cannotbe rejected. In other words, for each 1% appreciation by the Chinese, the Malaysiansappreciated by roughly the same amount.
However, this exchange rate regime was abandoned on 8 June 2007, where theMalaysian authorities simultaneously dropped the β6 to zero, and increased flexi-bility, with the regression R2 going down from 0.89 to 0.71.
This analysis thus shows that there were spillovers of Chinese exchange rate policyinto Malaysia from 2005 till 2007, but not thereafter.
India India exports labour-intensive manufacturing, and it can be argued that the au-thorities should be concerned about export competitiveness. Our analysis revealsa period, until 16 March 2007, when there was a small β6 coefficient with a pointestimate of 0.86, and a t statistic of 1.67 which is significant using a one-tailed test.
On 23 March 2007, India had a structural break in the exchange rate regime, shiftingtowards greater flexibility. The regression R2 went down from 0.86 to 0.60. As a partof this reform, the role of Yuan was extinguished.
These three examples encourage us about the usefulness of this estimation strategy. Itis then applied across 132 economies. For each country, a set of structural breaks areidentified, and then a β6 coefficient is identified within each of these sub-periods.
In examining this large set of results, seeking statistically significant values of β6, there isa possibility of data-mining bias. Even if H0 : β6 = 0 were always true, if 100 tests areconducted, on average there would be five rejections at a 95% level of significance. Hence,the frequency of rejection should be compared against the size of the test in assessingwhether the results merely reflect data mining.
12

Table 5 The Indian rupee
Start Date End Date R2 USD ... CNYo Variance2005-10-14 2007-03-16 0.86 1.28 ... 0.86 0.18
(4.30) ... (1.67)2007-03-23 2011-02-25 0.60 1.37 ... 0.10 1.04
(9.33) ... (0.27)
Table 6 Where did the Yuan ever matter (post-2005)?
Angola Argentina Bosnia and Herzegovina BurundiBolivia Belarus Algeria EstoniaEritrea Fiji Ethiopia Gibraltar
Honduras Israel India KuwaitLibya Madagascar Macedonia MaldivesOman Pakistan Serbia Saudi Arabia
Sierra Leone Suriname Seychelles Sao Tome and PrincipeTunisia Tanzania Taiwan Viet Nam
Indonesia
4 Results
We analyse a total of 132 currencies of the world. This analysis reveals 375 currency-periods. Of these, there are 85 significant coefficients for the Yuan. This rejection rate, of22.66%, well exceeds the size of the test. These results are also consistent with the findingsby Chen and Cheung (2011) that the current role of Yuan is quite small.
4.1 A Yuan bloc?
Table 6 shows the economies where, in the post-2005 period, there was even one sub-periodwhere the Yuan coefficient was significant at a 95% level of significance. Detailed resultsfor these currency-periods, where the Yuan mattered, are presented in Appendix A. Thisreveals an interesting footprint of Chinese exchange rate policy, in some large developingeconomies (e.g. India), many economies in Africa, some close allies (e.g. Pakistan) andeven one OECD country (Israel).
In seven of the thirty-four economies for which the Yuan is significant, gross trade withthe USA is higher than that with China. For the rest, China is one of the biggest gross(and net) trading partner and surpasses that with the USA. Table 7 presents one of thetwo underlying channels of influence: trade relationship with China for a sample set ofeconomies. The other channel of influence, export competitiveness, is also likely to haveplayed a role in all these economies. For instance, although China is India’s largest grosstrading partner, it competes with China on export of certain goods and services to commondestinations such as Europe and North America.
13

Table 7 Gross trade with China and USAper cent of total gross trade
2001 2010China USA China USA
Angola 9.25 33.21 37.22 22.37Argentina 8.18 13.18 14.14 8.89Ethiopa 5.48 5.84 18.82 5.83Belarus 0.64 1.41 3.61 0.76India 3.44 13.69 11.56 9.40Kuwait 3.22 12.06 10.75 11.11Libya 0.44 0.25 10.25 4.87Madagascar 4.10 14.27 15.79 5.22Oman 5.42 4.79 19.47 2.88Pakistan 4.41 15.92 15.77 9.95Saudi Arabia 4.49 18.72 13.62 12.66Sierra Leone 4.06 5.89 10.17 8.12Tanzania 3.04 2.56 20.75 2.50Indonesia 4.56 12.54 13.57 8.05
Source: IMF Direction of Trade Statistics.
Table 8 To whom does the Yuan matter in East Asia?Start Date End Date R2 USD CNY VarianceMalaysia2005-10-14 2007-06-11 0.89 1.23 1.13 0.13
(5.31) (9.28)Taiwan2005-10-14 2011-02-11 0.83 1.03 0.45 0.26
(14.23) (2.67)Viet Nam2009-10-16 2011-02-11 0.71 0.82 1.39 0.72
(3.90) (2.51)
4.2 An East Asian Yuan bloc?
For this analysis, we define East Asia as: Malaysia, Indonesia, Philippines, South Korea,Taiwan, Hong Kong, Singapore, Thailand and Viet Nam. When our estimation strategy isapplied to these 9 economies, 23 currency-periods are identified. Of these, there are threesituations where the CNYo coefficient is significant using a 95% level of significance. Thisrejection rate of H0 : β6 = 0, of 13%, exceeds the size of the test.
As seen in Table 8, the Malaysian exchange rate regime involved a role for the Yuan, butthis ended in June 2007. In Viet Nam’s case, from 16 October 2009 onwards, there is astatistically significant β6. Here also, the null hypothesis of H0 : β6 = 1 cannot be rejected,so we can say that the Viet Namese authorities appreciate by 1% for each 1 percentagepoint appreciation in China. Finally, the Taiwanese exchange rate regime has not had anystructural break through this period, and the point estimate for β6 is 0.45.
14

Figure 3 GDP-weighted CNY coefficient
2006 2007 2008 2009 2010 2011
−0.
4−
0.2
0.0
0.2
0.4
CN
Y c
oeffi
cien
t
Ordering these events in time, we see that in October 2005, Taiwan and Malaysia bothcared about the Yuan. In June 2007, the Malaysians stepped away from the Yuan. InOctober 2009, the Viet Namese initiated a role for the Yuan in their exchange rate regime.Thus, in February 2011, two of the nine economies of Asia had a role for the Yuan in theirexchange rate regime.
4.3 What is the magnitude of the role of the Yuan?
In order to obtain a summary statement about the role of the Yuan in international ex-change rate arrangements, at each point in time, we compute the GDP-weighted averageof the β̂6 for all economies. Bootstrap inference is used to construct the 95% confidenceinterval for this estimate.
These results are shown in Figure 3. They show a period from 2006 to 2008, where theoverall average coefficient was teetering into significance. However, by early 2008, manystructural breaks appear to have taken place in exchange rate regimes. From early 2008onwards, the overall GDP-weighted average coefficient for CNYo is indistinguishable fromzero.
Given that the economies with the biggest GDPs in the world tend to have floating exchangerates, we turn to the set of emerging markets and LDCs. This analysis is shown in Figure4. Here also, we see that from early 2006 till late 2007, there was statistical significance inthe GDP-weighted Yuan coefficient. But from early 2008 onwards, this has subsided.
Finally, Figure 4 focuses only on Asia. Here, it appears that from mid-2006 onwards, therehas been statistical significance, other than a crisis interlude in which this was interrupted.At the same time, the developments on Yuan internationalisation from 2009 onwards havenot, as yet, led to a change in the role of the Yuan in the Asian exchange rate arrangement.
15

Figure 4 The CNY in EMs and LDCs
2006 2007 2008 2009 2010 2011
−0.
4−
0.2
0.0
0.2
0.4
CN
Y c
oeffi
cien
t
Figure 5 The CNY in Asia
2006 2007 2008 2009 2010 2011
−0.
4−
0.2
0.0
0.2
0.4
CN
Y c
oeffi
cien
t
16

5 Conclusion
The emergence of China as a very large economy, with a very high trade/GDP ratio, hasled many observers to expect that the Yuan will become a major international currency. Inrecent years, the Chinese authorities have undertaken significant moves on Yuan interna-tionalisation, with the establishment of payments mechanisms for Yuan settlement, swaplines in Yuan, and controlled convertibility with Hong Kong.
In this paper, we have utilised recent advances in measurement of the exchange rate regimein order to measure one dimension of Yuan internationalisation: the role of the Yuan inglobal exchange rate regimes.
Our results suggest that the role of the Yuan in the exchange rate arrangements of othercurrencies was significant when the Yuan was not pegged to the USD. As many as 34currencies were influenced by the Chinese exchange rate. However, with the reinstatementof the peg to the dollar in 2008, the role of the Yuan declined.
Throughout the period of analysis, the footprint in East Asia has been small and restrictedto Malaysia (between October 2005 and June 2007), Taiwan (throughout) and Viet Nam(October 2009 till date). In February 2011, at the end of the dataset, the role of theYuan was relatively modest. While the null hypothesis of zero can be rejected, the GDP-weighted coefficient of the autonomous movements in the Yuan in Asia is small. TheGDP-weighted coefficient is roughly zero when computed at the level of LDCs and EMsand when computed for the entire world.
These results must also be viewed in the context of small movements in the Yuan-Dollarrate in the recent period. The Yuan may have decades to go before it gains economicsignificance as an internationalised currency and the process, as Lee (2010b) concludes, maybe systematic and drawn out. However, as our analysis shows, a large number of economiesin the world have cared about the Yuan despite small movements in the Yuan-Dollar ratesince 2005. Though the magnitude of Yuan’s role in the exchange rate arrangementsof economies across the world has been subdued, it could potentially rise with greaterflexibility in the Yuan-Dollar rate.
17

References
Azis, I., and N. Puttanapong (2008): “A regional trend towards a basket peg system,”International Journal of Trade and Global Markets, 1(2), 144–162.
Branson, W., and C. Healy (2005): “Monetary and Exchange Rate Policy Coordination inASEAN,” NBER Working Paper.
Chen, H., and W. Peng (2007): “The potential of the renminbi as an international currency,”China Economic Issues, 7.
Chen, X., and Y.-W. Cheung (2011): “Renminbi Going Global,” UCSC Working Paper.
Cheung, Y., M. Chinn, and E. Fujii (2009): China’s current account and exchange rate.March.
Colavecchio, R., and M. Funke (2009): “Volatility dependence across Asia-Pacific onshoreand offshore currency forwards markets,” Journal of Asian Economics, 20(2), 174–196.
Crockett, A. (2008): “Commenary,” Debating China’s Exchange Rate Policy, pp. 341–344.
Fidrmuc, J. (2010): “Time-Varying Exchange Rate Basket in China from 2005 to 2009,” Com-parative Economic Studies.
Frankel, J. (2009): “New estimation of China’s exchange rate regime,” Pacific EconomicReview, 14(3), 346–360.
Frankel, J., and S.-J. Wei (1994): “Yen bloc or dollar bloc? Exchange rate policies of theEast Asian countries,” in Macroeconomic linkage: Savings, exchange rates and capital flows,ed. by T. Ito, and A. Krueger. University of Chicago Press.
Funke, M., and M. Gronwald (2008): The Undisclosed Renminbi Basket: Are the MarketsTelling us something about where the Renminbi–US Dollar Exchange Rate is Going. April.
Girardin, E. (2011): “A De Facto Asian-Currency Unit Bloc in East Asia: It Has Been Therebut We Did Not Look for It,” .
Goldstein, M., and N. Lardy (2009): The future of China’s exchange rate policy. PetersonInstitute.
Haldane, A. G., and S. G. Hall (1991): “Sterling’s relationship with the dollar and thedeutschemark: 1976-89,” The Economic Journal, 101, 436–443.
Ito, T. (2008): Debating China’s Exchange Rate Policychap. Influence of the renminbi on Ex-change rate policies of other Asian currencies. Peterson Institute.
Ito, T. (2010): “China as Number One: How about the Renminbi?,” Asian Economic PolicyReview, 5(2), 249–276.
Lee, J. (2010a): “Comment on China as Number One: How about the Renminbi?,” AsianEconomic Policy Review, 5(2), 277–278.
18

(2010b): Will the renminbi emerge as an international reserve currency? Asian Devel-opment Bank.
Ma, G., and R. McCauley (2010): “The evolving renminbi regime and implications for Asiancurrency stability,” Journal of the Japanese and International Economies.
Patnaik, I., A. Shah, A. Sethy, and V. Balasubramaniam (2011): “The exchange rateregime in Asia: From crisis to crisis,” International Review of Economics and Finance, 20(1),32–43.
Pontines, V., and R. Siregar (2010): “Fear of Appreciation in East and Southeast Asia: TheRole of the Chinese Renminbi,” .
Shu, C., N. Chow, and J. Chan (2007): “Impact of the Renminbi Exchange Rate on AsianCurrencies,” China Economic Issues, 3.
Takagi, S. (2010): “Comment on China as Number One: How about the Renminbi?,” AsianEconomic Policy Review, 5(2), 279–280.
Zeileis, A., A. Shah, and I. Patnaik (2010): “Testing, Monitoring, and Dating StructuralChanges in Exchange Rate Regimes,” Computational Statistics & Data Analysis.
Zhang, Z. (2008): “Can Demand from China Shield East Asian Economies from Global Slow-down?,” .
19

A Who cared about the Chinese Yuan?
Table 9: Who cared about the Chinese Yuan?
Start Date End Date R2 USD CNY VarianceRepublic of Angola2006-11-24 2007-05-18 0.71 0.85 6.24 0.79
(0.71) (3.29)People’s Democratic Republic of Algeria2008-10-17 2009-04-10 0.59 1.67 4.43 3.85
(2.67) (1.79)Argentine Republic2005-10-14 2008-09-05 0.90 0.98 0.33 0.18
(7.20) (1.68)2008-09-12 2009-04-10 0.84 1.28 2.63 0.97
(4.59) (2.31)Republic of Belarus2007-12-28 2008-11-14 1.00 1.01 0.11 0.01
(36.12) (2.12)Plurinational State of Bolivia2007-06-15 2009-06-12 0.97 1.10 0.35 0.10
(16.82) (2.41)Republic of Bosnia and Herzegovina2005-10-14 2008-08-08 0.61 1.15 0.78 0.56
(4.53) (2.17)Republic of Burundi2009-10-16 2011-02-25 0.96 1.00 0.45 0.08
(14.85) (2.51)Western African Franc2007-04-20 2007-12-07 1.00 1.97 0.05 0.00
(97.14) (2.00)2008-07-04 2009-01-30 0.92 1.87 0.80 0.13
(15.27) (2.42)2009-02-06 2011-02-25 0.99 1.96 0.20 0.01
(95.53) (3.33)Central African Republic2008-02-01 2009-01-30 0.93 1.97 0.45 0.10
(23.27) (2.36)Republic of Estonia2005-10-14 2010-01-08 0.96 2.00 0.11 0.02
(71.06) (1.82)Federal Democratic Republic of Ethiopia2009-01-09 2010-02-26 0.47 1.33 8.54 2.11
(2.23) (1.87)Republic of the Fiji Islands2005-10-14 2008-10-03 0.63 1.65 0.75 0.52
(7.66) (2.27)French Polynesia2005-10-14 2009-05-08 0.37 1.82 0.92 1.19
(8.70) (2.08)
20

Republic of Honduras2009-02-06 2009-10-02 1.00 0.99 0.21 0.00
(157.92) (3.78)Republic of India2005-10-14 2007-03-16 0.86 1.28 0.86 0.18
(4.30) (1.67)State of Israel2005-10-14 2007-12-07 0.63 2.45 1.51 0.66
(6.27) (2.55)State of Kuwait2007-05-25 2008-10-03 0.96 1.02 0.28 0.07
(9.99) (1.86)2008-10-10 2009-04-03 0.92 1.03 1.45 0.39
(5.43) (1.90)Socialist People’s Libyan Arab Jamahiriya2005-10-14 2011-02-25 0.71 1.31 0.45 0.62
(12.00) (1.72)The Former Yugoslav Republic of Macedonia2005-10-14 2008-07-04 0.62 1.43 0.69 0.40
(6.51) (2.21)Republic of Madagascar2005-10-14 2008-09-05 0.48 1.12 0.81 0.86
(3.75) (1.87)Republic of Maldives2007-06-01 2011-02-25 1.00 0.99 0.04 0.00
(140.44) (2.58)Sultanate of Oman2010-01-29 2011-02-25 1.00 1.00 0.04 0.00
(211.64) (3.01)Islamic Republic of Pakistan2007-12-28 2008-11-21 0.73 1.57 2.15 1.78
(3.52) (2.32)Democratic Republic of Sao Tome and Principe2008-02-15 2009-03-27 1.00 1.00 0.10 0.00
(69.86) (2.68)Kingdom of Saudi Arabia2008-09-26 2009-06-26 1.00 0.96 0.13 0.00
(60.00) (2.06)Republic of Serbia2005-10-14 2006-06-23 0.68 3.41 2.14 0.17
(5.59) (2.06)Republic of Seychelles2007-10-12 2008-08-08 1.00 1.04 0.14 0.01
(23.25) (2.12)Republic of Sierra Leone2005-10-14 2006-04-07 0.99 1.10 0.75 0.02
(4.76) (1.68)Republic of Suriname2005-10-14 2006-04-07 0.99 1.10 0.75 0.02
(4.76) (1.68)
21

Taiwan, Province of China2005-10-14 2011-02-25 0.83 1.05 0.45 0.27
(14.57) (2.64)United Republic of Tanzania2005-10-14 2007-10-05 0.56 0.27 2.06 0.94
(0.50) (2.49)Republic of Tunisia2008-10-10 2011-02-25 0.82 1.54 0.44 0.20
(20.47) (1.93)Socialist Republic of Viet Nam2009-10-16 2011-02-25 0.72 0.84 1.36 0.71
(4.05) (2.49)
22