Embed Size (px)
Citation preview
South Australian Monitoring and Surveillance System (SAMSS)
Which South Australians Experience Psychological Distress? Kessler Psychological Distress 10-item Scale July 2002 – June 2004 Jodie Avery Eleonora Dal Grande Anne Taylor Tiffany Gill Population Research and Outcome Studies
2
This work is copyright. It may be reproduced and the Population Research and Outcome Studies Unit (PROS) welcomes requests for permission to reproduce in the whole or in part for work, study or training purposes subject to the inclusion of an acknowledgment of the source and not commercial use or sale. PROS will only accept responsibility for data analysis conducted by PROS staff or PROS supervision. Published June 2004 by the South Australian Department of Health Population Research and Outcome Studies Unit PO Box 287 Rundle Mall 5000 South Australia, Australia
The National Library of Australia Cataloguing-in-Publication entry:
Which South Australians experience psychological distress? : Kessler psychological distress 10-item scale July 2002-June 2004. Bibliography. ISBN 0 7308 9376 6. 1. Mental health - South Australia. 2. Mental illness - South Australia. 3. Public health - South Australia. 4. Health surveys - South Australia. I. Title. 362.2099423
In accordance with the Copyright Act 1968 a copy of each book published must be lodged with the National Library. Under relevant State or Territory Legislation a copy must also be lodged with the appropriate library or libraries in the state of publication. For information about Legal Deposit, see the website at: http://www.nla.gov.au/services/ldeposit.html or contact the Legal Deposit Unit, National Library of Australia on 02 6262 1312. This document can be found online at: http://www.dh.sa.gov.au/pehs/PROS.html Last printed 20.09.2004
3
TABLE OF CONTENTS
EXECUTIVE SUMMARY...............................................................................7
Main Findings ................................................................................................................7
CHAPTER 1: INTRODUCTION ................................................................... 13
CHAPTER 2: BACKGROUND AND METHODOLOGY................................ 17
2.1 Aims of SAMSS .....................................................................................................18
2.2 Methodology..........................................................................................................19
2.3 Data Analysis ........................................................................................................22
CHAPTER 3: KESSLER PSYCHOLOGICAL DISTRESS SCALE (K10) ...... 25
3.1 Description ............................................................................................................26
3.2 Scoring...................................................................................................................26
3.3 K10 Population Norms for South Australia .......................................................27
3.4 Prevalence .............................................................................................................27
CHAPTER 4: POPULATION TRENDS OF PSYCHOLOGICAL DISTRESS IN SOUTH AUSTRALIA .................................................................................. 31
CHAPTER 5: DEMOGRAPHIC PROFILE OF PSYCHOLOGICAL DISTRESS35
5.1 General demographic profile...............................................................................36
5.2 Education, income and employment profile .....................................................37
5.3 Household and family structure profile .............................................................38
CHAPTER 6: DIFFERENT POPULATION GROUPS AND PSYCHOLOGICAL DISTRESS................................................................... 39
6.1 South Australian Health Regions .......................................................................40
6.2 SEIFA......................................................................................................................41
6.3 Accessibility/Remoteness Index of Australia (ARIA) .......................................43
CHAPTER 7: PSYCHOLOGICAL DISTRESS AND HEALTH STATUS, CHRONIC CONDITIONS AND CO-MORBIDITY.......................................... 45
7.1 Overall Health Status............................................................................................54
7.2 Diabetes .................................................................................................................47
7.3 Asthma ...................................................................................................................47
7.4 Other respiratory conditions ...............................................................................48
7.5 Cardiovascular conditions ..................................................................................49
Table of Contents
4
7.6 Arthritis ..................................................................................................................50
7.7 Osteoporosis.........................................................................................................51
7.8 Disability ................................................................................................................52
7.9 Multiple chronic conditions.................................................................................52
CHAPTER 8: PSYCHOLOGICAL DISTRESS AND HEALTH RISK FACTORS .................................................................................................. 55
8.1 High Blood Pressure ............................................................................................56
8.2 High Cholesterol ...................................................................................................57
8.3 Body Mass Index...................................................................................................58
8.4 Smoking Status.....................................................................................................59
8.5 Alcohol Consumption ..........................................................................................60
8.6 Physical Activity ...................................................................................................61
8.7 Multiple Risk Factors............................................................................................62
CHAPTER 9: PSYCHOLOGICAL DISTRESS AND MENTAL HEALTH....... 65
9.1 Self Reported Mental Health Condition..............................................................66
9.2 Multiple Mental Health conditions ......................................................................70
9.3 Suicidal Ideation ...................................................................................................71
CHAPTER 10: PSYCHOLOGICAL DISTRESS AND HEALTH SERVICES UTILISATION ............................................................................................. 73
10.1 Medical Health Services.....................................................................................74
10.2 Allied Health Services ........................................................................................78
10.3 Mental Health Services ......................................................................................82
10.4 Dental Health Services .......................................................................................84
CHAPTER 11: PSYCHOLOGICAL DISTRESS BY PSYCHOSOCIAL EVENTS ..................................................................................................... 87
11.1 Unplanned loss of job ........................................................................................90
11.2 New job ................................................................................................................90
11.3 Family or domestic violence .............................................................................91
11.4 Death of someone close ....................................................................................91
11.5 Discrimination.....................................................................................................92
11.6 Moved house.......................................................................................................93
11.7 Robbed or home burgled...................................................................................93
11.8 Marriage or relationship breakdown ................................................................94
Table of contents
5
11.9 Serious injury ......................................................................................................94
11.10 Serious illness...................................................................................................95
11.11 Illness in family member or friend..................................................................95
11.12 Birth or pregnancy............................................................................................96
11.13 Financial Stress ................................................................................................96
11.14 Family issues / problems.................................................................................97
11.15 Mental illness / severe mental disturbance – family member .....................97
11.16 Surgical operation ............................................................................................98
11.17 Other major event .............................................................................................99
11.18 No event .............................................................................................................99
11.19 Multiple Psychosocial Events .......................................................................100
CHAPTER 12: PSYCHOLOGICAL DISTRESS AND SOCIAL CAPITAL ... 103
12.1 Neighbourhood Safety .....................................................................................104
12.2 Neighbourhood trust ........................................................................................105
12.3 Home safety.......................................................................................................105
12.4 Locus of control................................................................................................106
CHAPTER 13: DAYS LOST OR LIMITED BECAUSE OF HEALTH........... 109
13.1 Days off from usual activities due to health..................................................110
13.2 Limited in the amount of work done due to health.......................................111
REFERENCES ......................................................................................... 113
Table of Contents
6
EXECUTIVE SUMMARY
Main Findings
South Australia’s Strategic Plan ‘Creating Opportunity’ involves selecting a number of quantifiable indicators to measure and track the state's economic, social and environmental health, creating targets for improvement. The second major objective of the Plan is ‘Improving Wellbeing’. One target considered under this objective is to address psychological distress in South Australia, bringing it to a level equal or lower than the Australian average within 10 years. Psychological distress can be measured using the Kessler 10 Psychological Distress Scale (K10).
The K10 was developed in 1992 for use in the United States National Health Interview Survey, to measure psychological distress in the anxiety-depression spectrum. It includes ten questions regarding negative emotional states experienced by respondents in the four weeks prior to the interview.
This report summarises the K10 Psychological Distress norms for South Australians aged 16 years and over, from surveys conducted by the Population Research and Outcome Studies (PROS) Unit, South Australian Department of Health. Normative data, or norms, represent the normal or average proportion experiencing a condition, such as psychological distress for any given survey question across various categories of illness. Norms are used to provide a benchmark for comparison with other groups of respondents, such as those experiencing particular illnesses. The data in this report are primarily obtained from the South Australian Monitoring and Surveillance System (SAMSS), from July 2002 to June 2004, and demonstrate associations between psychological distress and chronic conditions, risk factors, health regions and other variables of interest relating to health and wellbeing.
The following points highlight differences between groups that are statistically significant for people with high or very high psychological distress.
Population norms
• For the high and very high psychological distress categories, there were a higher proportion of females aged 16 years and over in South Australia than males.
• For high psychological distress, the proportion of respondents aged 25 to 34 years is higher and aged from 35 to 44 years and 75 years or more is lower. For very high psychological distress, the proportion of respondents aged 25 to 34
Executive Summary SAMSS July 2002 – June 2004
8
and 45 to 54 years is higher and for those in groups aged 65 years or more is lower.
Trends over time
• There is a no significant trend over time in the proportion of respondents with high or very high psychological distress.
Demographic profile
• Females make up the higher proportion experiencing high or very high psychological distress, when compared with males.
• The proportion of those with high or very high psychological distress in the 25 to 34 year age group was higher, and the proportion of respondents in the 65 to 74 year and 75 years plus age group with high or very high psychological distress was lower.
• Those born in Europe and those respondents who spoke a language other than English at home had a higher proportion of high or very high psychological distress.
• There was no significant difference in the level of high or very high psychological distress for Aboriginal or Torres Strait Islanders and those who were not.
• There was a higher proportion of high or very high psychological distress in respondents who had not completed high school, who did home duties and unable to work, those with a household income up to $20,000, and who had spent more money than they received, or had just enough money to get through.
• Respondents who were separated, divorced or never married, who lived alone, who lived in a household with three or more children, those who lived in households made up of single parents with children or related adults had higher proportions of high or very high psychological distress.
• Those who rented either from the government or privately experienced higher levels of high or very high psychological distress.
SAMSS July 2002 – June 2004 Executive Summary
9
Different population groups
• The proportion of respondents with high or very high psychological distress living in South Australian country regions was lower than in the South Australian metropolitan region.
• Respondents who lived in a postcode within the lowest Socio economic Inde for Areas, Index of Relative Disadvantage (SEIFA IRSD) quintile had a higher level of high or very high psychological distress and the proportion of respondents with high or very high psychological distress, who lived in the highest SEIFA IRSD quintile was lower than the other quintiles.
• There was no difference in the proportion of respondents with high or very high psychological distress who lived in each Accessibility/Remoteness Index of Australia (ARIA) category.
Health status, chronic conditions and co morbidity
• Respondents who rated their health fair or poor, had diabetes, asthma, another respiratory condition, coronary artery disease, stroke, arthritis, osteoporosis, or a disability experienced a higher proportions of high or very high psychological distress than those without the conditions.
• Respondents with two, or more chronic conditions experienced a higher proportion of high or very high psychological distress than those with none or one chronic condition.
Health risk factors
• Respondents who reported current or previous high cholesterol, who were classified as underweight or obese, who were smokers, and who did no physical activity experienced higher proportions of high or very high psychological distress than those without these risk factors.
• Respondents who were non drinkers had a higher proportion of high or very high psychological distress.
Executive Summary SAMSS July 2002 – June 2004
10
Mental health
• The proportion of respondents with high or very high psychological distress who reported anxiety, depression, a stress related problem, any other mental health problem was higher than those without these conditions.
• Respondents currently receiving treatment for a mental health problem experienced higher proportions of high or very high psychological distress than those not receiving treatment.
• The proportion of respondents with high or very high psychological distress who indicated suicidal ideation, was higher than those who did not.
• Respondents with one or more mental health conditions, experienced higher proportions of high or very high psychological distress than those without the problem.
Health services utilisation
• Respondents who visited the general practitioner, a hospital accident and emergency department, had a hospital admission, visited a hospital clinic, a specialist doctor, a district or community nurse, a chiropractor, an occupational therapist, an audiologist, a psychologist, a psychiatrist, or another community mental health service at least once within the previous four weeks, had a higher proportion with high or very high psychological distress than those who had not visited these health services.
• The proportion of respondents with high or very high psychological distress who visited the physiotherapist or an alternative therapist at least twice within the previous four weeks was higher than those who had not visited these health services.
Psychosocial events
• Respondents with high or very high psychological distress who experienced an unplanned loss of job, family or domestic violence, the death of someone close, discrimination, a house move, a marriage or relationship breakdown, a serious injury, a serous illness, an illness in a family or friend, financial stress, family issues or problems, mental illness or disturbance of a family member, a surgical
SAMSS July 2002 – June 2004 Executive Summary
11
operation or another major event had a higher proportion than those who had not experienced any of these events.
• The proportion of respondents with high or very high psychological distress who experienced two or more psychosocial events was higher than those who had experienced less than two events.
Social capital
• The proportion of respondents with high or very high psychological distress who felt their neighbourhood was not a safe place to live, was higher than those who felt their neighbourhood was a safe place to live.
• The proportion of respondents with high or very high psychological distress, who did not think that people in their neighbourhood could trust each other, was higher than those who could trust their neighbours
• The proportion of respondents with high or very high psychological distress who did not feel safe in their own home all of the time was higher than those who felt all of the time.
• The proportion of respondents with high or very high psychological distress, who agreed, were neutral, disagreed or strongly disagreed that that had control over their life decisions, was higher than those who strongly agreed that that had control over their life decisions.
Days lost or limited because of health
• Respondents with high or very high psychological distress who experienced at least two days where they were totally unable to work or carry out their normal duties because of their health, or were partially unable to work or carry out their normal duties because of their health had a higher proportion than those experiencing one or less days.
The K10 measures non-specific psychological distress, and may be able to distinguish community cases based on severity, through population surveys. Distinctions can be made between severe and less severe mental disorder cases in order to plan appropriate policies for this area.
Executive Summary SAMSS July 2002 – June 2004
12

CHAPTER 1: INTRODUCTION
Introduction SAMSS July 2002 – June 2004
14
South Australia’s Strategic Plan ‘Creating Opportunity’, launched in March 2004, outlines a number of targets that set out a pathway to prosperity, helping create and seize new opportunities. The second major objective is ‘Improving Wellbeing’. This works towards further improving quality of life and the wellbeing of the community and individual citizens. The focus will be on being healthier and fitter, having less crime and feeling safer, and with a particular emphasis on preventative measures, including education programs. The Strategic Plan sets out some important measuring tools, targets and priority actions designed to address these challenges. One target considered under the objective of ‘Improving Wellbeing’, is addressing psychological distress in South Australia (Plan Reference No T2.4). According to the Strategic Plan, South Australia has the highest proportion of people with high and very high levels of psychological distress of all Australian States1. The aim is to bring the level of psychological distress to equal or lower than the Australian average within 10 years. It is suggested that this be measured by non specific psychological distress, and a tool often used for this is the Kessler 10 Psychological Distress Scale (K10)2,
A number of non-specific distress scales are available for use in community surveys such as the Short Form 36 (SF36)3, the Short Form 12 (SF12)4, the Composite International Diagnostic Interview (CIDI)5 and the General Health Questionnaire (GHQ)6. In population surveys, such as the South Australian Monitoring and Surveillance System (SAMSS), it is important to have a scale brief enough to address the time constraints associated with large telephone surveys. One such scale is the K10, which consists of ten questions regarding non-specific psychological distress7.
The K10 was developed in 1992 for use in the redesigned United States National Health Interview Survey (US-NHIS), to measure psychological distress in the anxiety-depression spectrum. The instrument assesses the level of current anxiety and depressive symptoms experienced by the individual in the month leading up to interview and has been used in a number of Australian population health surveys: the Australian National Mental Health Survey8; the Collaborative Health and Wellbeing Survey9; the 1997 and 1998 NSW Health Surveys10; the Victorian Population Health Surveys11,12; as well as 2001 National Health Survey13, using various methods of scoring.
The K10 continues the theme of using dimensional measures of non-specific psychological distress, so as to distinguish community cases based on severity,
SAMSS July 2002 – June 2004 Introduction
15
through population surveys. This means that distinctions can be made between severe and less severe mental disorder cases for policy planning2.
The K10 has been compared with other measures of anxiety and depression, such as the CIDI, where a medical diagnosis of anxiety and affective disorders is made. A strong association can be found between this and the K107. The K10 has also been validated in a two stage clinical reappraisal survey, has been found to have good precision in the 90th to 99th percentile range of the population distribution, and consistent psychometric properties across major sociodemographic subsamples3. The K10 has also been validated against the General Health Questionnaire (GHQ), the SF-12, and the number of consultations for a mental problem in the last twelve months8.
This report examines the relationship between health-related issues and psychological distress as measured by the K10, using information collected from the South Australian Monitoring and Surveillance System (SAMSS). In this early stage of SAMSS development, only cross-sectional information is provided. Later reports assessing the health status of South Australians by psychological distress will include longer time series and trend data.

Introduction SAMSS July 2002 – June 2004
16
CHAPTER 2: BACKGROUND AND METHODOLOGY
Background and Methodology SAMSS July 2002 – June 2004
18
2.1 Aims of SAMSS
The main objective of SAMSS is to systematically monitor the trends of diseases, health related problems, risk factors and other health services issues relevant to the SA Department of Health (DH), over time.
The aim of this system is to address the needs of the whole of the department and to monitor key risk factor and population trends in priority chronic disease areas so that programs and policies can respond to changes in trends. These data monitor state and national health priority areas and will determine and measure the effectiveness of DH programs, interventions and strategic plans.
This system is ongoing collection of data at the population level on the priority health areas and main indicators pertinent to DH policies. The risk factors included in the system are those critical to national and state health priority areas. SAMSS ensures that appropriate, timely and valid population health information is available to monitor health status, respond to population changes and support planning implementation and evaluation of health services and programs. Trend and time series analyses using SAMSS will detect changes over time. SAMSS addresses these needs on the whole South Australian population and interviews (or surrogate interviews) are conducted with people of all ages.
Other objectives of SAMSS are to:
• Provide high quality, representative data;
• Characterise the problem or issue over time;
• Detect epidemics or changes in the topic occurrence;
• Identify high risk groups or risk factors associated with the problem or topic and suggest hypotheses for further investigation;
• Estimate the burden of the problem or issue;
• Evaluate human services initiatives, prevention and control programs including the effectiveness of these programs (directly or indirectly);
SAMSS July 2002 – June 2004 Background and methodology
19
• Highlight gaps in information and services that affect South Australians’ general health and wellbeing;
• Disseminate findings to professionals and administrators within the DH, and other health services professionals or organisations in South Australia and Australia.
• Project future health care needs;
• Set priorities for allocation of resources; and
• Strengthen the network for surveillance and monitoring of issues relevant to the DH to improve information gathering and exchange.
2.2 Methodology
2.2.1 Questions
Issues included in the questionnaire were based on Department of Health and national/state priority areas and indicators with the intention of gathering appropriate data on key indicators. Topics that were included in SAMSS were developed by the Population Research and Outcome Studies (PROS) Unit in consultation with key personnel within the Department of Health, including relevant experts. Every month, a core set of questions is asked with additional questions asked in alternate months. These questions are based on previous work undertaken in Australian states and territories. Where possible, questions that had previously been included in other surveys, and had indicated their reliability/validity, were used or modified14.
The full list of questions asked in SAMSS can be obtained at15:
http://www.dh.sa.gov.au/pehs/PROS/samss-tech-paper2-survey.pdf
2.2.2 Sample Selection
All households in South Australia with a number listed in the Electronic White Pages (EWP) are eligible for selection in the sample. For the period July 2002 to December 2003, 860 South Australian residential telephone numbers per month were randomly

Background and Methodology SAMSS July 2002 – June 2004
20
selected. Since January 2004, 1000 South Australian residential telephone numbers per month have been randomly selected.
2.2.3 Introductory letter
A letter introducing SAMSS was sent to the household of each selected telephone number. Within each household, the person who had their birthday last was selected for interview. There was no replacement for non-contactable persons. The letter informed people of the purpose of the survey and indicated that they could expect a telephone call within the time frame of the survey. During July 2002 to June 2004, 84.6% of those who participated indicated that they received a letter.
2.2.4 Data collection
Data was collected every month by a contracted agency and interviews were conducted in English.
2.2.5 CATI
The CATI III (Computer Assisted Telephone Interview) system was used to conduct the interviews. This system allows immediate entry of data from the interviewer’s questionnaire screen to the computer database. The main advantages of this system are the precise ordering and timing of call-backs and correct sequencing of questions as specific answers are given. The CATI system enforces a range of checks on each response with most questions having a set of pre-determined response categories. In addition, CATI automatically rotates response categories, when required, to minimise bias. When open-ended responses are required, these are transcribed exactly by the interviewer.
2.2.6 Call backs
At least ten call-backs were made to the telephone number selected to interview household members. Different times of the day or evening were scheduled for each call-back. If a person could not be interviewed immediately they were re-scheduled for interview at a time suitable to them. Where a refusal was encountered, another interviewer (generally at the discretion of the supervisor) called later, in an endeavour to obtain the interview(s). Replacement interviews for persons who could not be contacted or interviewed were not permitted.

SAMSS July 2002 – June 2004 Background and methodology
21
2.2.7 Validation
Of each interviewer’s work, 10% was selected at random for validation by the supervisor. The contracted agency is a member of Interviewer Quality Control Australia (IQCA).
2.2.8 Data Processing
After each occurrence of data collection, the raw data from the CATI system was imported into SPSS for analysis. Open-ended responses were saved in Excel format and the responses was either coded numerically and brought into the main SPSS database, or brought into SPSS as a string variable if necessary.
2.2.9 Weighting
The data presented in this report were weighted by age, gender, area (metropolitan /rural) and probability of selection in the household to the most recent ABS census data. Probability of selection in the household was calculated on the number of adults in the household and the number of listings in the White Pages. Weighting was used to correct for the disproportionality of the sample with respect to the populations of interest. The weights reflect unequal sample inclusion probabilities and compensate for differential non-response. The data were weighted using the most recent Australian Bureau of Statistics census or estimated residential population data so that the health estimates calculated would be representative of the adult populations of those areas.
The weighting of the data results in occasional rounding effects for the numbers. In all instances the percentages should be the point of reference, rather than the actual number of respondents.
2.2.10 Response Rates
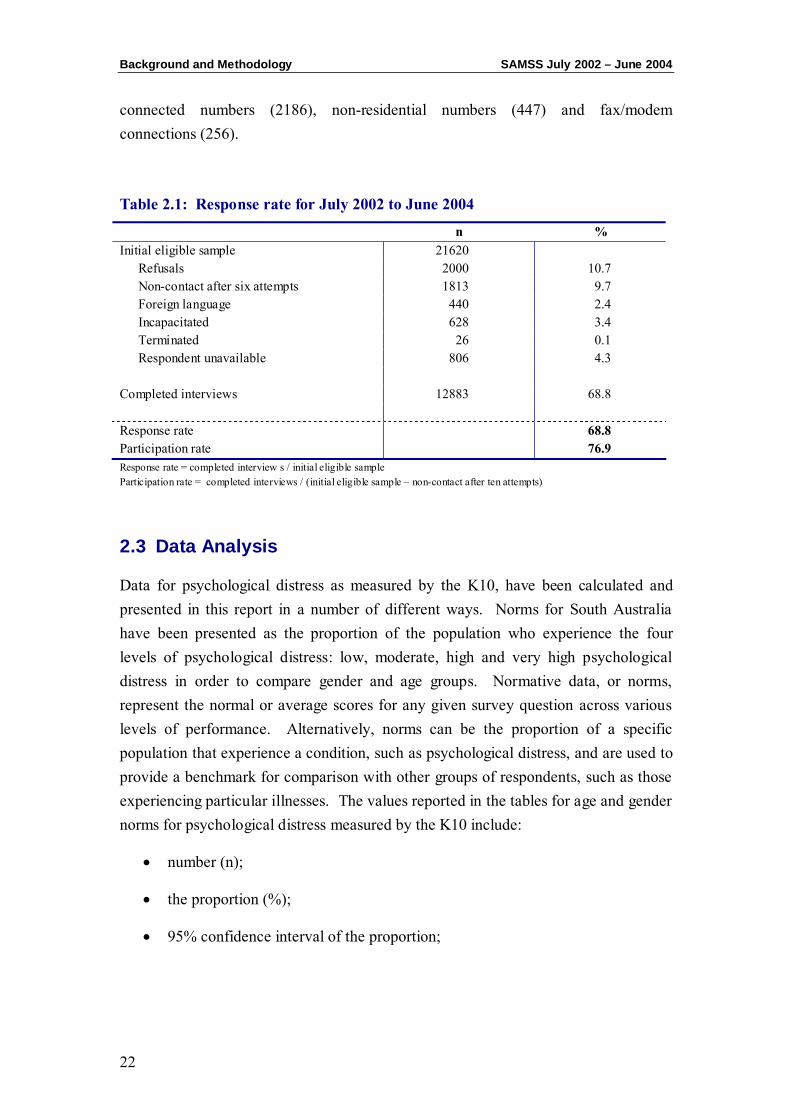
The overall response rate of SAMSS for the 24 month period was 68.8%. Over the two years a sample of 21620 was drawn. Sample loss of 5713 occurred due to non-
Background and Methodology SAMSS July 2002 – June 2004
22
connected numbers (2186), non-residential numbers (447) and fax/modem connections (256).
Table 2.1: Response rate for July 2002 to June 2004
n % Initial eligible sample 21620 Refusals 2000 10.7 Non-contact after six attempts 1813 9.7 Foreign language 440 2.4 Incapacitated 628 3.4 Terminated 26 0.1 Respondent unavailable 806 4.3 Completed interviews 12883 68.8 Response rate 68.8 Participation rate 76.9 Response rate = completed interview s / initial eligible sample Participation rate = completed interviews / (initial eligible sample – non-contact after ten attempts)
2.3 Data Analysis
Data for psychological distress as measured by the K10, have been calculated and presented in this report in a number of different ways. Norms for South Australia have been presented as the proportion of the population who experience the four levels of psychological distress: low, moderate, high and very high psychological distress in order to compare gender and age groups. Normative data, or norms, represent the normal or average scores for any given survey question across various levels of performance. Alternatively, norms can be the proportion of a specific population that experience a condition, such as psychological distress, and are used to provide a benchmark for comparison with other groups of respondents, such as those experiencing particular illnesses. The values reported in the tables for age and gender norms for psychological distress measured by the K10 include:
• number (n);
• the proportion (%);
• 95% confidence interval of the proportion;
SAMSS July 2002 – June 2004 Background and methodology
23
The prevalence of psychological distress as measured by the K10, for 2000, 2001, 2002, 2003 and 2004 were standardised to the 2003 South Australian estimated residential population aged 18 and over population to account for the changing age-gender population structure over time. χ2 test for trend was used to test for statistical significance over time. To compare between genders for the four categories of psychological distress, univariate t-tests were used to test for statistical significance. The conventional 5% level of statistical significance was used.
Comparison of the proportion of psychological distress between population groups, overall health status, those with and without a particular condition or health risk factor, mental health status, psychosocial factors, issues of social capital and effects on work life, have also been made. Population groups examined include the new South Australian Health Regions, quintiles of the Socio-Economic Index for Areas (Index of Relative Socio-Economic Disadvantage), and Accessibility / Remoteness Index of Australia (ARIA) categories. The chronic conditions analysed were diabetes, asthma, other respiratory conditions, cardiovascular conditions, arthritis, osteoporosis, disability and mental health conditions. The health risk factors analysed were high blood pressure, high cholesterol, body mass index, smoking status, alcohol use and physical activity. Co-morbidity and multiple risk factors were also considered in this analysis. To compare the proportion of those experiencing psychological distress, in those with and without a condition, χ2 test was used to test for statistical significance. Again, the conventional 5% level of statistical significance was used.
Background and Methodology SAMSS July 2002 – June 2004
24
CHAPTER 3: KESSLER PSYCHOLOGICAL DISTRESS
SCALE (K10)
The Kessler 10 SAMSS July 2002 – June 2004
26
3.1 Description
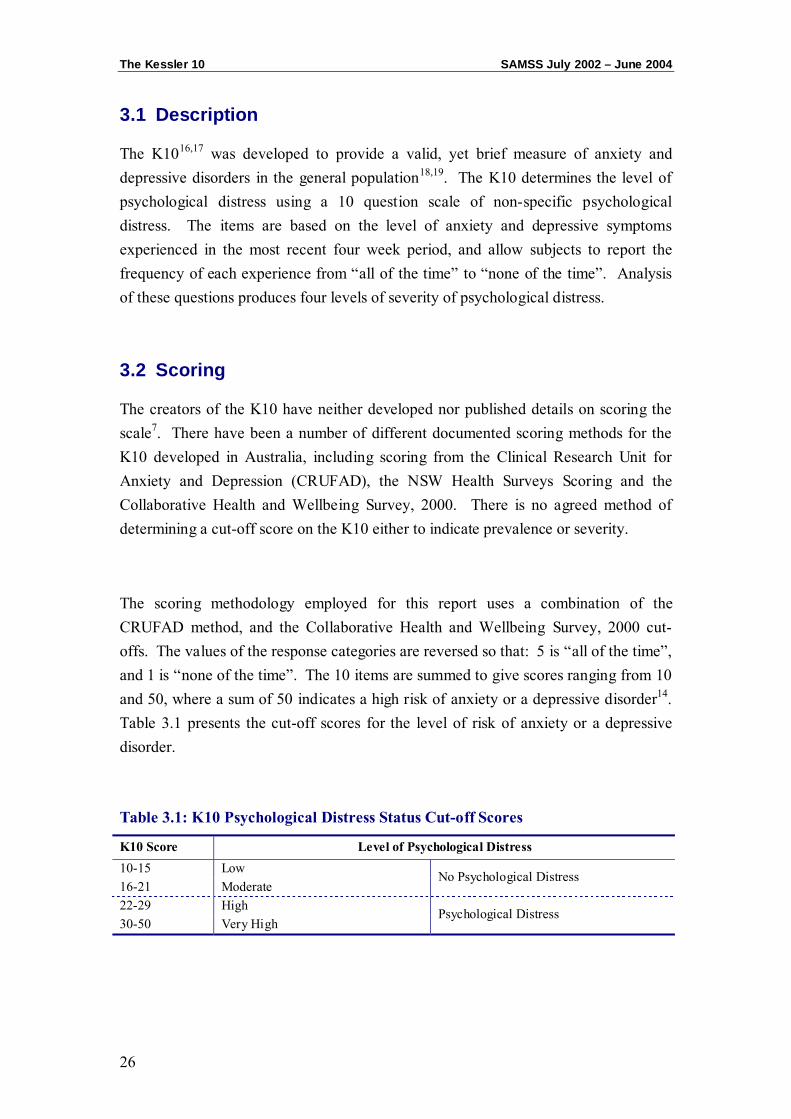
The K1016,17 was developed to provide a valid, yet brief measure of anxiety and depressive disorders in the general population18,19. The K10 determines the level of psychological distress using a 10 question scale of non-specific psychological distress. The items are based on the level of anxiety and depressive symptoms experienced in the most recent four week period, and allow subjects to report the frequency of each experience from “all of the time” to “none of the time”. Analysis of these questions produces four levels of severity of psychological distress.
3.2 Scoring
The creators of the K10 have neither developed nor published details on scoring the scale7. There have been a number of different documented scoring methods for the K10 developed in Australia, including scoring from the Clinical Research Unit for Anxiety and Depression (CRUFAD), the NSW Health Surveys Scoring and the Collaborative Health and Wellbeing Survey, 2000. There is no agreed method of determining a cut-off score on the K10 either to indicate prevalence or severity.
The scoring methodology employed for this report uses a combination of the CRUFAD method, and the Collaborative Health and Wellbeing Survey, 2000 cut-offs. The values of the response categories are reversed so that: 5 is “all of the time”, and 1 is “none of the time”. The 10 items are summed to give scores ranging from 10 and 50, where a sum of 50 indicates a high risk of anxiety or a depressive disorder14. Table 3.1 presents the cut-off scores for the level of risk of anxiety or a depressive disorder.
Table 3.1: K10 Psychological Distress Status Cut-off Scores
K10 Score Level of Psychological Distress 10-15 Low 16-21 Moderate
No Psychological Distress
22-29 High 30-50 Very High
Psychological Distress
SAMSS July 2002 – June 2004 The Kessler 10
27
An alternative scoring method of the K10 has been used in the NSW 1997 and 1998 Health Surveys, conducted by the Epidemiology and Surveillance Branch, NSW Health Department10. This scoring method is no longer used by NSW or any other state.
3.3 Prevalence
Various cut-offs to determine low, moderate, high and very high psychological distress have been developed9-12,15. Saunders and Daly (2001) have developed cut-offs based on their work on psychological distress in Western Australia in the Collaborative Health and Wellbeing Survey16 and these have been adapted for this report. Respondents who are considered to have high or very high psychological distress (22-50) will be considered cases with ‘Psychological Distress’.
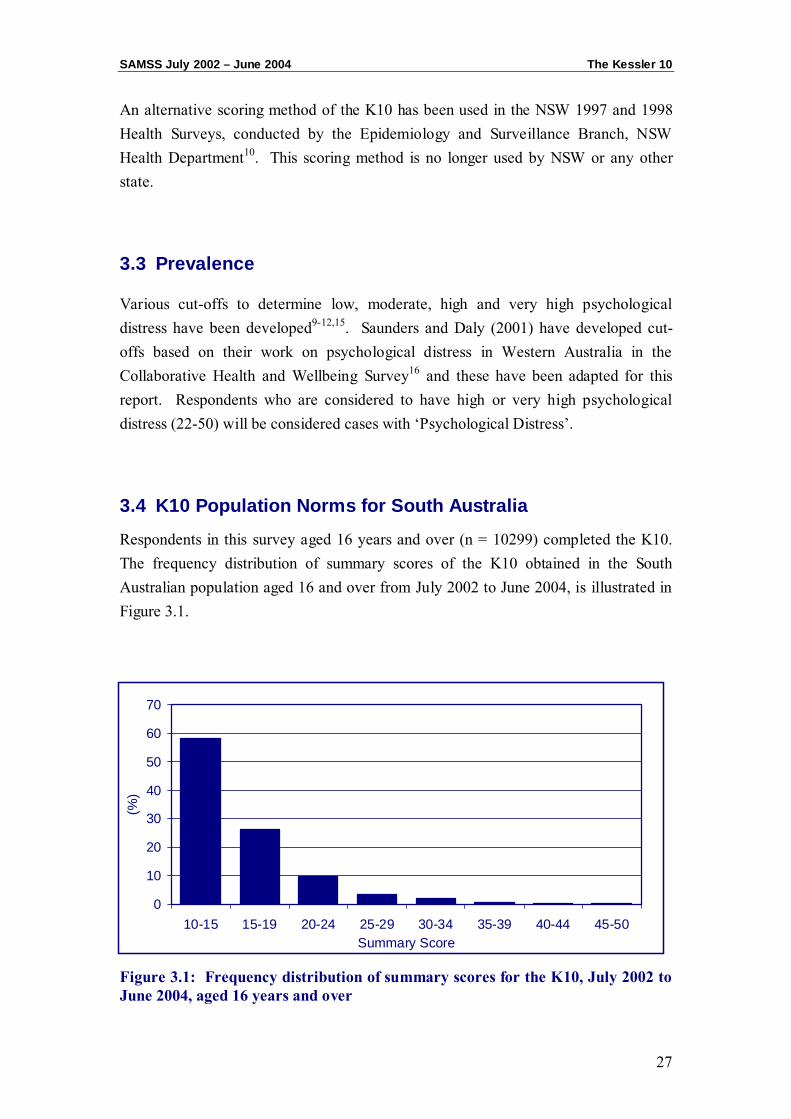
3.4 K10 Population Norms for South Australia
Respondents in this survey aged 16 years and over (n = 10299) completed the K10. The frequency distribution of summary scores of the K10 obtained in the South Australian population aged 16 and over from July 2002 to June 2004, is illustrated in Figure 3.1.
Figure 3.1: Frequency distribution of summary scores for the K10, July 2002 to June 2004, aged 16 years and over
0
10
20
30
40
50
60
70
10-15 15-19 20-24 25-29 30-34 35-39 40-44 45-50Summary Score
(%)
The Kessler 10 SAMSS July 2002 – June 2004
28
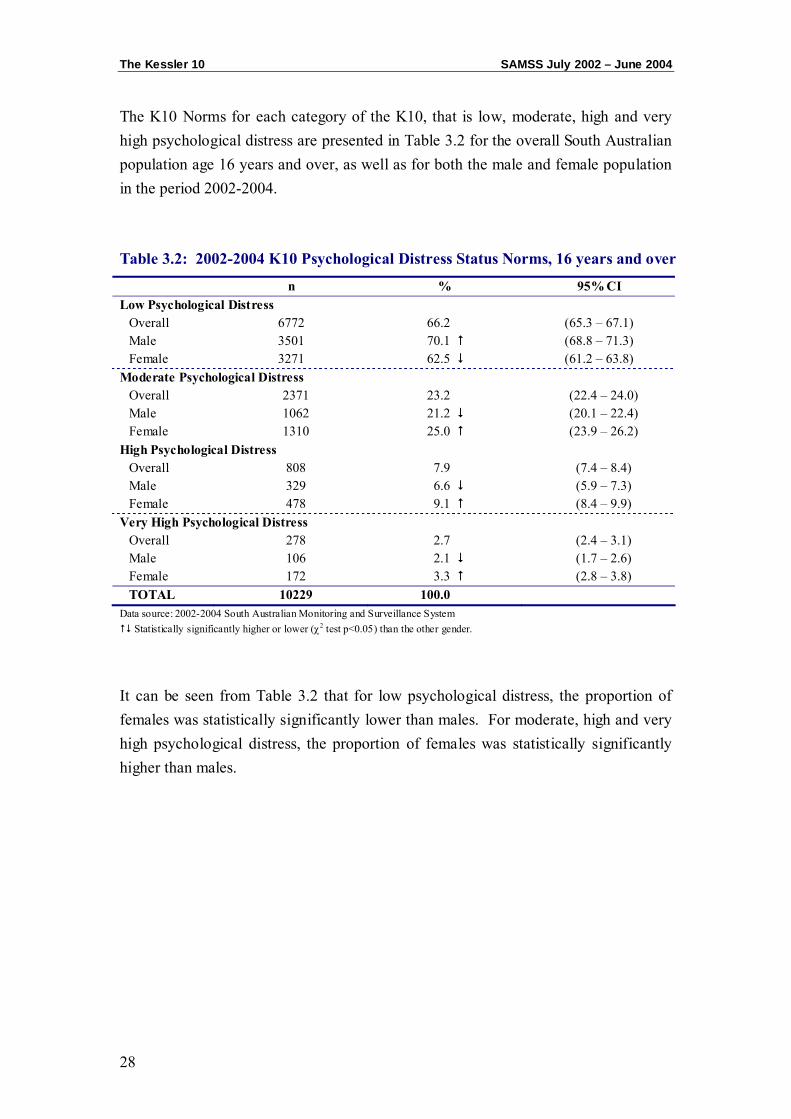
The K10 Norms for each category of the K10, that is low, moderate, high and very high psychological distress are presented in Table 3.2 for the overall South Australian population age 16 years and over, as well as for both the male and female population in the period 2002-2004.
Table 3.2: 2002-2004 K10 Psychological Distress Status Norms, 16 years and over
n % 95% CI Low Psychological Distress
Overall 6772 66.2 (65.3 – 67.1) Male 3501 70.1 (68.8 – 71.3) Female 3271 62.5 (61.2 – 63.8)
Moderate Psychological Distress Overall 2371 23.2 (22.4 – 24.0) Male 1062 21.2 (20.1 – 22.4) Female 1310 25.0 (23.9 – 26.2)
High Psychological Distress Overall 808 7.9 (7.4 – 8.4) Male 329 6.6 (5.9 – 7.3) Female 478 9.1 (8.4 – 9.9)
Very High Psychological Distress Overall 278 2.7 (2.4 – 3.1) Male 106 2.1 (1.7 – 2.6) Female 172 3.3 (2.8 – 3.8) TOTAL 10229 100.0
Data source: 2002-2004 South Australian Monitoring and Surveillance System Statistically significantly higher or lower (χ2 test p<0.05) than the other gender.
It can be seen from Table 3.2 that for low psychological distress, the proportion of females was statistically significantly lower than males. For moderate, high and very high psychological distress, the proportion of females was statistically significantly higher than males.

SAMSS July 2002 – June 2004 The Kessler 10
29
Table 3.3 shows the proportion of respondents experiencing levels of psychological distress, as measured by the K10, by age group.
Table 3.3: 2002–2004 K10 Psychological Distress Status, by age group 16 years and over
n % 95% CI
Low Psychological Distress 16 to 24 years 856 56.5 (54.0 – 59.0) 25 to 34 years 1137 64.9 (62.6 – 67.1) 35 to 44 years 1284 65.7 (63.6 – 67.8) 45 to 54 years 1235 67.7 (65.5 – 69.9) 55 to 64 years 910 69.6 (66.9 – 72.0) 65 to 74 years 720 73.4 (70.5 – 76.1) 75 years plus 629 70.4 (67.2 – 73.3)
Moderate Psychological Distress 16 to 24 years 491 32.4 (30.1 – 34.8) 25 to 34 years 383 21.9 (19.9 – 23.8) 35 to 44 years 477 24.4 (22.5 – 26.4) 45 to 54 years 379 20.8 (18.9 – 22.7) 55 to 64 years 259 19.8 (17.7 – 22.1) 65 to 74 years 180 18.4 (16.0 – 20.9) 75 years plus 203 22.6 (20.0 – 25.6)
High Psychological Distress 16 to 24 years 137 9.0 (7.7 – 10.6) 25 to 34 years 171 9.8 (8.4 – 11.3) 35 to 44 years 131 6.7 (5.7 – 7.8) 45 to 54 years 145 7.9 (6.7 – 9.3) 55 to 64 years 104 7.9 (6.6 – 9.5) 65 to 74 years 67 6.8 (5.4 – 8.6) 75 years plus 53 5.9 (4.5 – 7.7)
Very High Psychological Distress 16 to 24 years 31 2.1 (1.4 – 2.9) 25 to 34 years 61 3.5 (2.7 – 4.5) 35 to 44 years 61 3.1 (2.4 – 3.9) 45 to 54 years 65 3.5 (2.8 – 4.5) 55 to 64 years 36 2.8 (1.9 – 3.8) 65 to 74 years 13 1.4 (0.7 – 2.3) 75 years plus 10 1.1 (0.6 – 2.0) TOTAL 10229 100.0
Data source: 2002-2004 South Australian Monitoring and Surveillance System Statistically significantly higher or lower (χ2 test p<0.05) than the other age groups.
The Kessler 10 SAMSS July 2002 – June 2004
30
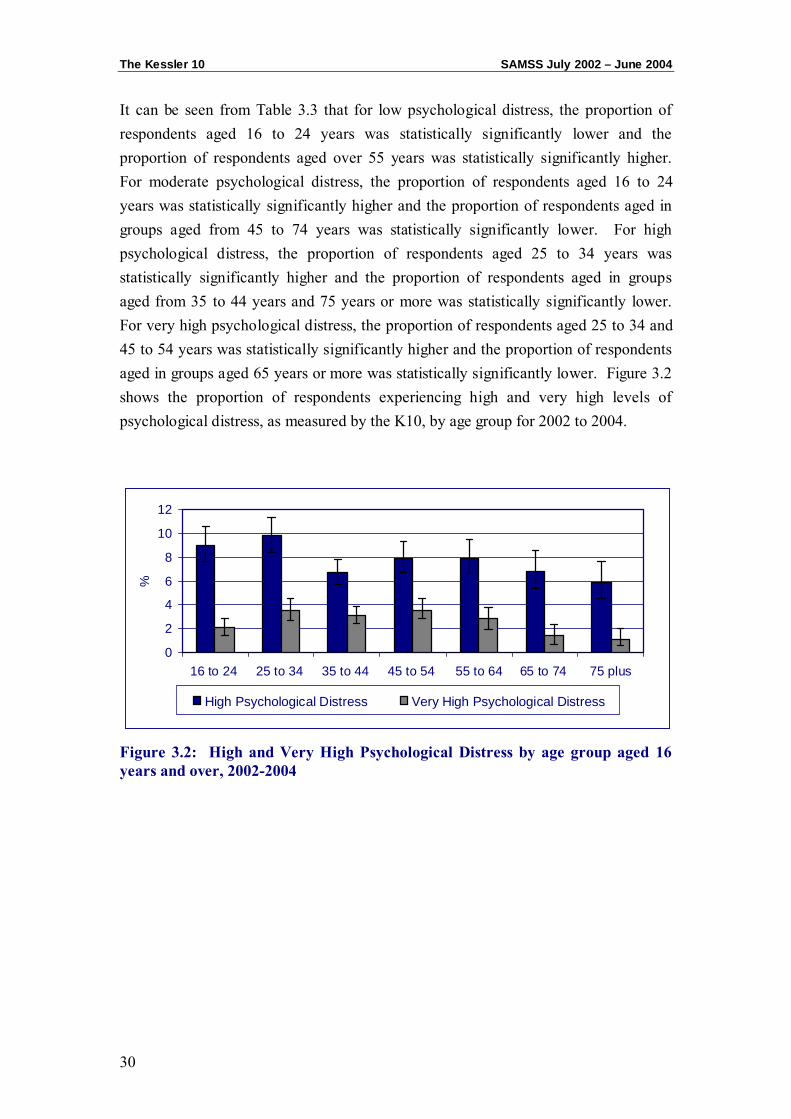
It can be seen from Table 3.3 that for low psychological distress, the proportion of respondents aged 16 to 24 years was statistically significantly lower and the proportion of respondents aged over 55 years was statistically significantly higher. For moderate psychological distress, the proportion of respondents aged 16 to 24 years was statistically significantly higher and the proportion of respondents aged in groups aged from 45 to 74 years was statistically significantly lower. For high psychological distress, the proportion of respondents aged 25 to 34 years was statistically significantly higher and the proportion of respondents aged in groups aged from 35 to 44 years and 75 years or more was statistically significantly lower. For very high psychological distress, the proportion of respondents aged 25 to 34 and 45 to 54 years was statistically significantly higher and the proportion of respondents aged in groups aged 65 years or more was statistically significantly lower. Figure 3.2 shows the proportion of respondents experiencing high and very high levels of psychological distress, as measured by the K10, by age group for 2002 to 2004.
Figure 3.2: High and Very High Psychological Distress by age group aged 16 years and over, 2002-2004
0
2
4
6
8
10
12
16 to 24 25 to 34 35 to 44 45 to 54 55 to 64 65 to 74 75 plus
%
High Psychological Distress Very High Psychological Distress
CHAPTER 4: POPULATION TRENDS OF PSYCHOLOGICAL
DISTRESS IN SOUTH AUSTRALIA
Population Trends SAMSS July 2002 – June 2004
32
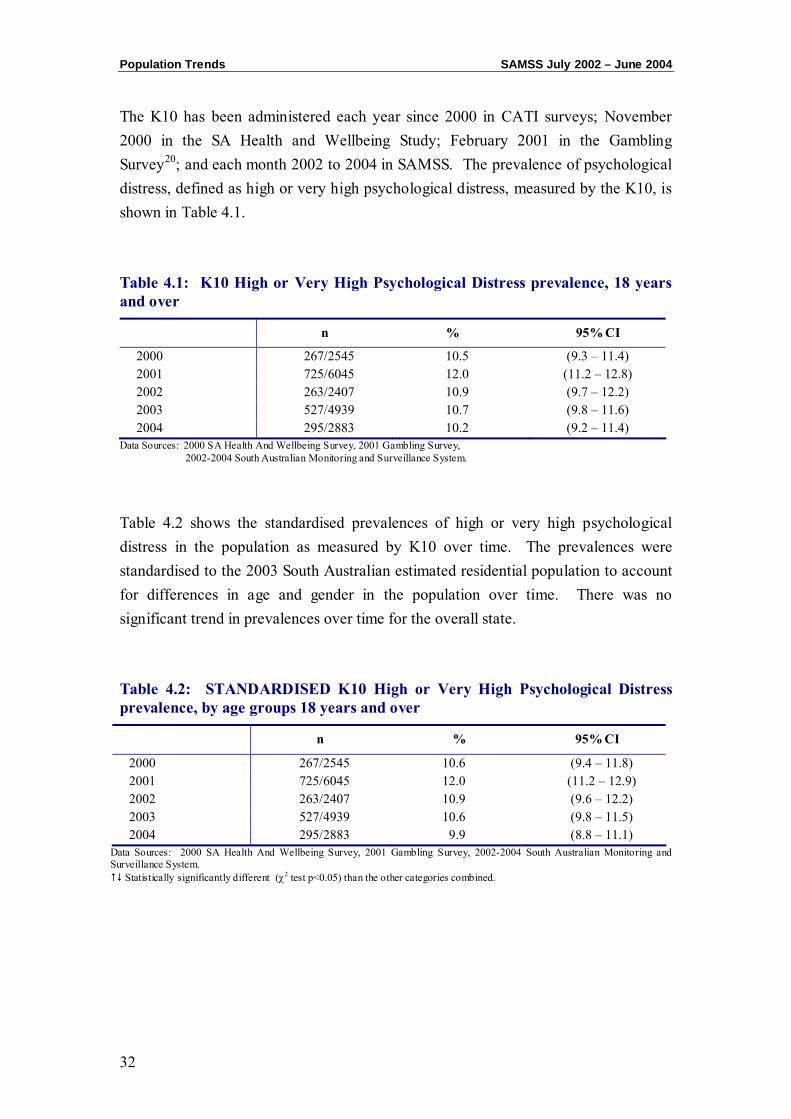
The K10 has been administered each year since 2000 in CATI surveys; November 2000 in the SA Health and Wellbeing Study; February 2001 in the Gambling Survey20; and each month 2002 to 2004 in SAMSS. The prevalence of psychological distress, defined as high or very high psychological distress, measured by the K10, is shown in Table 4.1.
Table 4.1: K10 High or Very High Psychological Distress prevalence, 18 years and over
n % 95% CI
2000 267/2545 10.5 (9.3 – 11.4) 2001 725/6045 12.0 (11.2 – 12.8) 2002 263/2407 10.9 (9.7 – 12.2) 2003 527/4939 10.7 (9.8 – 11.6) 2004 295/2883 10.2 (9.2 – 11.4)
Data Sources: 2000 SA Health And Wellbeing Survey, 2001 Gambling Survey, 2002-2004 South Australian Monitoring and Surveillance System.
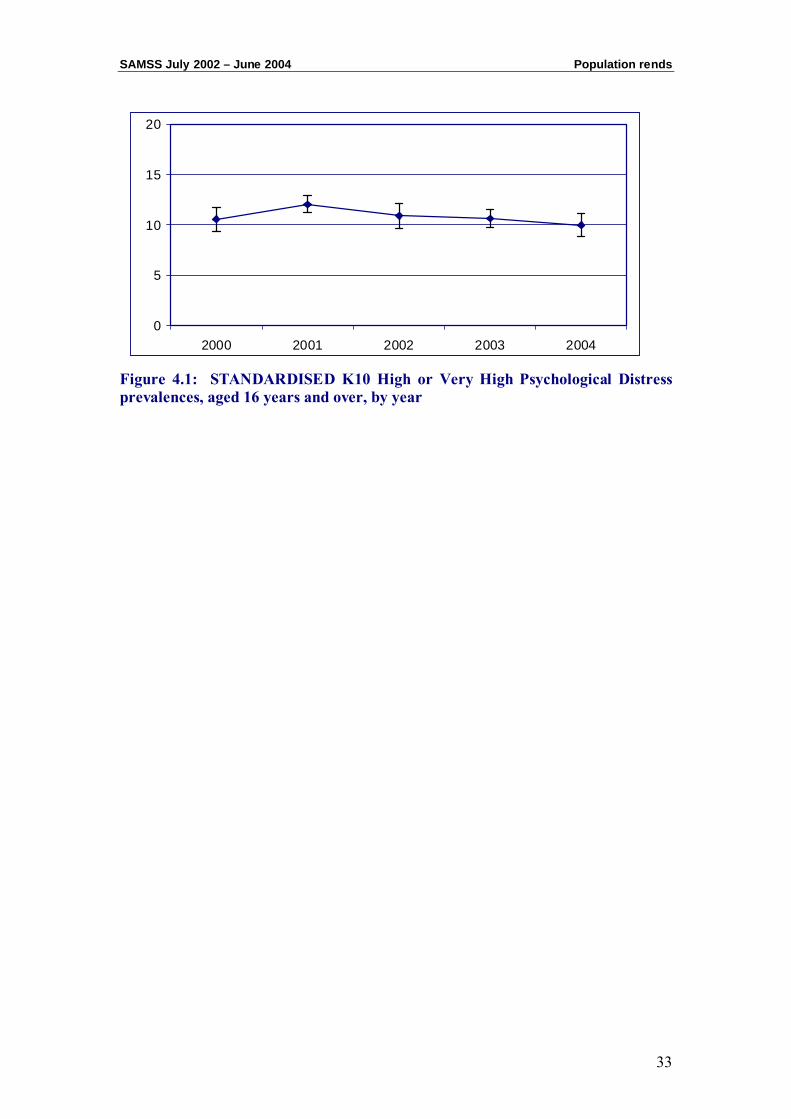
Table 4.2 shows the standardised prevalences of high or very high psychological distress in the population as measured by K10 over time. The prevalences were standardised to the 2003 South Australian estimated residential population to account for differences in age and gender in the population over time. There was no significant trend in prevalences over time for the overall state.
Table 4.2: STANDARDISED K10 High or Very High Psychological Distress prevalence, by age groups 18 years and over
n % 95% CI
2000 267/2545 10.6 (9.4 – 11.8) 2001 725/6045 12.0 (11.2 – 12.9) 2002 263/2407 10.9 (9.6 – 12.2) 2003 527/4939 10.6 (9.8 – 11.5) 2004 295/2883 9.9 (8.8 – 11.1)
Data Sources: 2000 SA Health And Wellbeing Survey, 2001 Gambling Survey, 2002-2004 South Australian Monitoring and Surveillance System.
Statistically significantly different (χ2 test p<0.05) than the other categories combined.
SAMSS July 2002 – June 2004 Population rends
33
Figure 4.1: STANDARDISED K10 High or Very High Psychological Distress prevalences, aged 16 years and over, by year
0
5
10
15
20
2000 2001 2002 2003 2004
Population Trends SAMSS July 2002 – June 2004
34
CHAPTER 5: DEMOGRAPHIC PROFILE OF PSYCHOLOGICAL
DISTRESS
Demographic Profile SAMSS July 2002 – June 2004
36
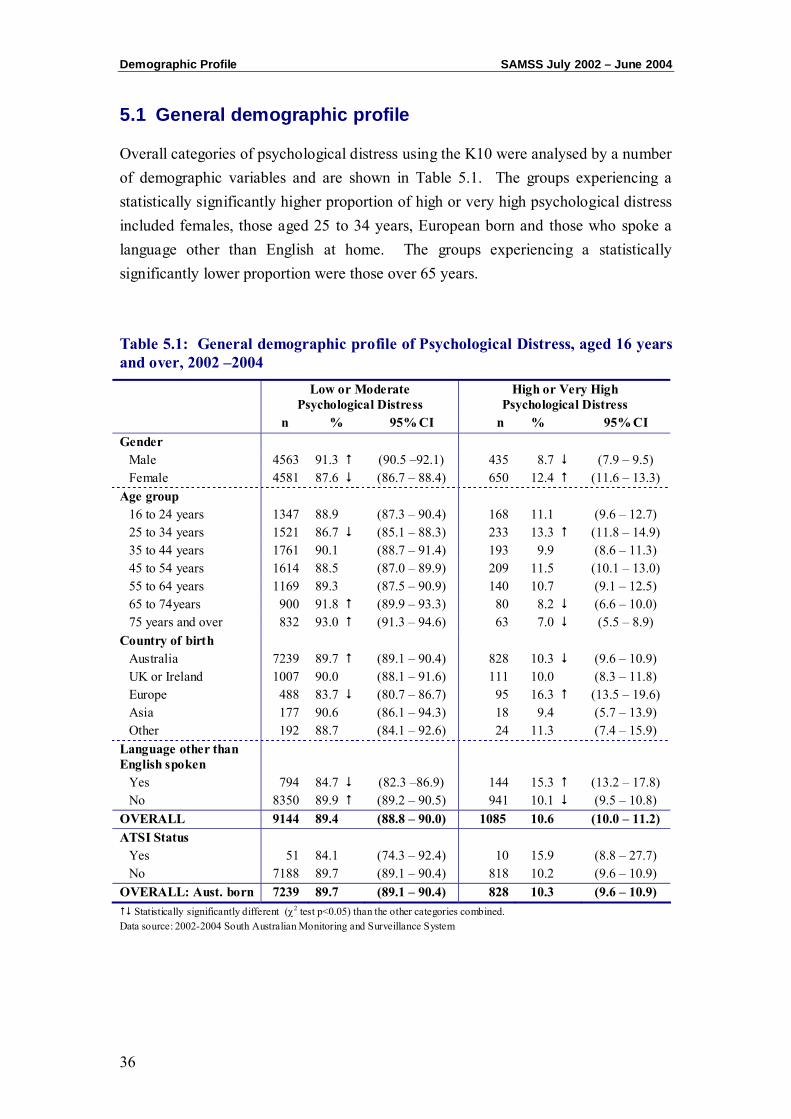
5.1 General demographic profile
Overall categories of psychological distress using the K10 were analysed by a number of demographic variables and are shown in Table 5.1. The groups experiencing a statistically significantly higher proportion of high or very high psychological distress included females, those aged 25 to 34 years, European born and those who spoke a language other than English at home. The groups experiencing a statistically significantly lower proportion were those over 65 years.
Table 5.1: General demographic profile of Psychological Distress, aged 16 years and over, 2002 –2004
Low or Moderate Psychological Distress
High or Very High Psychological Distress
n % 95% CI n % 95% CI Gender
Male 4563 91.3 (90.5 –92.1) 435 8.7 (7.9 – 9.5) Female 4581 87.6 (86.7 – 88.4) 650 12.4 (11.6 – 13.3)
Age group 16 to 24 years 1347 88.9 (87.3 – 90.4) 168 11.1 (9.6 – 12.7) 25 to 34 years 1521 86.7 (85.1 – 88.3) 233 13.3 (11.8 – 14.9) 35 to 44 years 1761 90.1 (88.7 – 91.4) 193 9.9 (8.6 – 11.3) 45 to 54 years 1614 88.5 (87.0 – 89.9) 209 11.5 (10.1 – 13.0) 55 to 64 years 1169 89.3 (87.5 – 90.9) 140 10.7 (9.1 – 12.5) 65 to 74years 900 91.8 (89.9 – 93.3) 80 8.2 (6.6 – 10.0) 75 years and over 832 93.0 (91.3 – 94.6) 63 7.0 (5.5 – 8.9)
Country of birth Australia 7239 89.7 (89.1 – 90.4) 828 10.3 (9.6 – 10.9) UK or Ireland 1007 90.0 (88.1 – 91.6) 111 10.0 (8.3 – 11.8) Europe 488 83.7 (80.7 – 86.7) 95 16.3 (13.5 – 19.6) Asia 177 90.6 (86.1 – 94.3) 18 9.4 (5.7 – 13.9) Other 192 88.7 (84.1 – 92.6) 24 11.3 (7.4 – 15.9)
Language other than English spoken
Yes 794 84.7 (82.3 –86.9) 144 15.3 (13.2 – 17.8) No 8350 89.9 (89.2 – 90.5) 941 10.1 (9.5 – 10.8)
OVERALL 9144 89.4 (88.8 – 90.0) 1085 10.6 (10.0 – 11.2) ATSI Status
Yes 51 84.1 (74.3 – 92.4) 10 15.9 (8.8 – 27.7) No 7188 89.7 (89.1 – 90.4) 818 10.2 (9.6 – 10.9)
OVERALL: Aust. born 7239 89.7 (89.1 – 90.4) 828 10.3 (9.6 – 10.9) Statistically significantly different (χ2 test p<0.05) than the other categories combined.
Data source: 2002-2004 South Australian Monitoring and Surveillance System
SAMSS July 2002 – June 2004 Demographic Profile
37
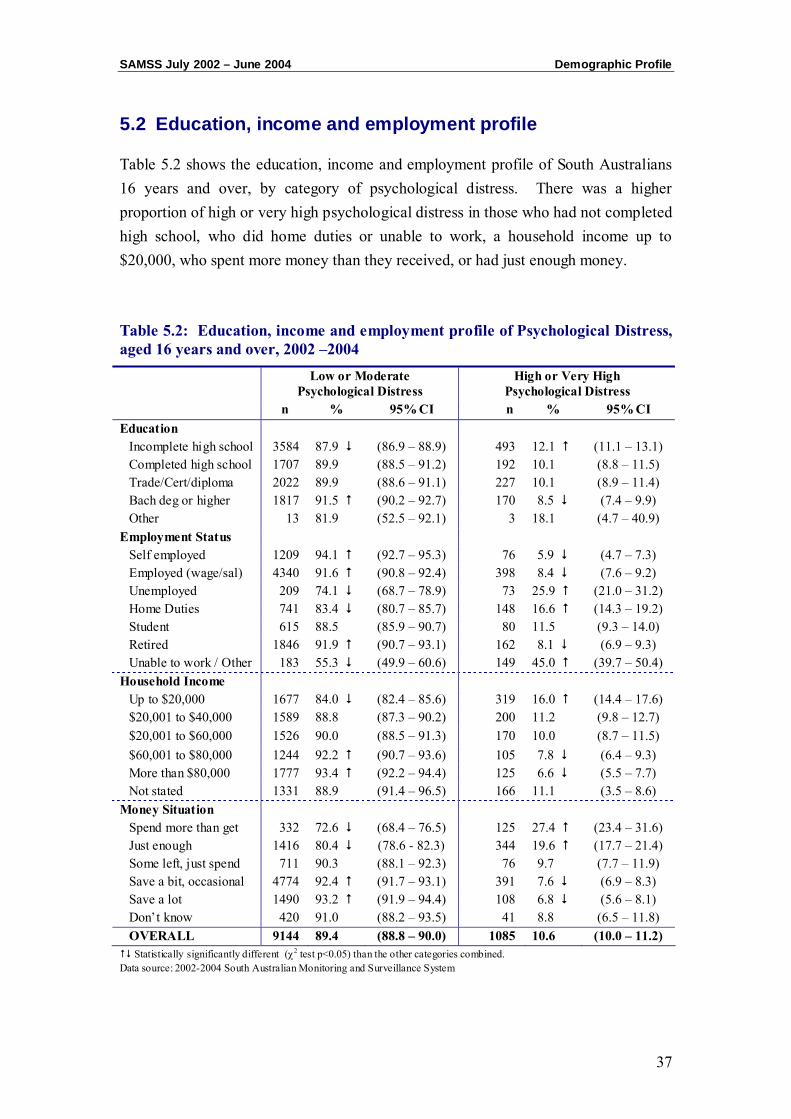
5.2 Education, income and employment profile
Table 5.2 shows the education, income and employment profile of South Australians 16 years and over, by category of psychological distress. There was a higher proportion of high or very high psychological distress in those who had not completed high school, who did home duties or unable to work, a household income up to $20,000, who spent more money than they received, or had just enough money.
Table 5.2: Education, income and employment profile of Psychological Distress, aged 16 years and over, 2002 –2004
Low or Moderate Psychological Distress
High or Very High Psychological Distress
n % 95% CI n % 95% CI Education
Incomplete high school 3584 87.9 (86.9 – 88.9) 493 12.1 (11.1 – 13.1) Completed high school 1707 89.9 (88.5 – 91.2) 192 10.1 (8.8 – 11.5) Trade/Cert/diploma 2022 89.9 (88.6 – 91.1) 227 10.1 (8.9 – 11.4) Bach deg or higher 1817 91.5 (90.2 – 92.7) 170 8.5 (7.4 – 9.9) Other 13 81.9 (52.5 – 92.1) 3 18.1 (4.7 – 40.9)
Employment Status Self employed 1209 94.1 (92.7 – 95.3) 76 5.9 (4.7 – 7.3) Employed (wage/sal) 4340 91.6 (90.8 – 92.4) 398 8.4 (7.6 – 9.2) Unemployed 209 74.1 (68.7 – 78.9) 73 25.9 (21.0 – 31.2) Home Duties 741 83.4 (80.7 – 85.7) 148 16.6 (14.3 – 19.2) Student 615 88.5 (85.9 – 90.7) 80 11.5 (9.3 – 14.0) Retired 1846 91.9 (90.7 – 93.1) 162 8.1 (6.9 – 9.3) Unable to work / Other 183 55.3 (49.9 – 60.6) 149 45.0 (39.7 – 50.4)
Household Income Up to $20,000 1677 84.0 (82.4 – 85.6) 319 16.0 (14.4 – 17.6) $20,001 to $40,000 1589 88.8 (87.3 – 90.2) 200 11.2 (9.8 – 12.7) $20,001 to $60,000 1526 90.0 (88.5 – 91.3) 170 10.0 (8.7 – 11.5) $60,001 to $80,000 1244 92.2 (90.7 – 93.6) 105 7.8 (6.4 – 9.3) More than $80,000 1777 93.4 (92.2 – 94.4) 125 6.6 (5.5 – 7.7) Not stated 1331 88.9 (91.4 – 96.5) 166 11.1 (3.5 – 8.6)
Money Situation Spend more than get 332 72.6 (68.4 – 76.5) 125 27.4 (23.4 – 31.6) Just enough 1416 80.4 (78.6 - 82.3) 344 19.6 (17.7 – 21.4) Some left, just spend 711 90.3 (88.1 – 92.3) 76 9.7 (7.7 – 11.9) Save a bit, occasional 4774 92.4 (91.7 – 93.1) 391 7.6 (6.9 – 8.3) Save a lot 1490 93.2 (91.9 – 94.4) 108 6.8 (5.6 – 8.1) Don’t know 420 91.0 (88.2 – 93.5) 41 8.8 (6.5 – 11.8) OVERALL 9144 89.4 (88.8 – 90.0) 1085 10.6 (10.0 – 11.2) Statistically significantly different (χ2 test p<0.05) than the other categories combined.
Data source: 2002-2004 South Australian Monitoring and Surveillance System
Demographic Profile SAMSS July 2002 – June 2004
38
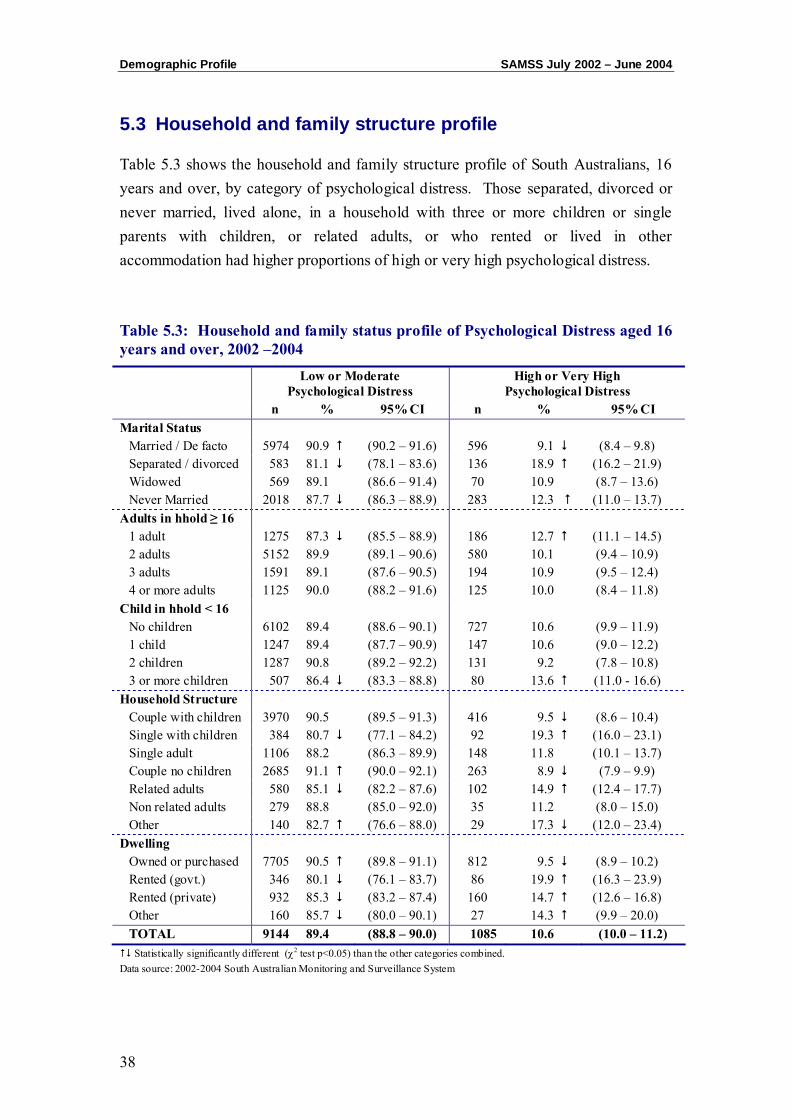
5.3 Household and family structure profile
Table 5.3 shows the household and family structure profile of South Australians, 16 years and over, by category of psychological distress. Those separated, divorced or never married, lived alone, in a household with three or more children or single parents with children, or related adults, or who rented or lived in other accommodation had higher proportions of high or very high psychological distress.
Table 5.3: Household and family status profile of Psychological Distress aged 16 years and over, 2002 –2004
Low or Moderate Psychological Distress
High or Very High Psychological Distress
n % 95% CI n % 95% CI Marital Status
Married / De facto 5974 90.9 (90.2 – 91.6) 596 9.1 (8.4 – 9.8) Separated / divorced 583 81.1 (78.1 – 83.6) 136 18.9 (16.2 – 21.9) Widowed 569 89.1 (86.6 – 91.4) 70 10.9 (8.7 – 13.6) Never Married 2018 87.7 (86.3 – 88.9) 283 12.3 (11.0 – 13.7)
Adults in hhold ≥ 16 1 adult 1275 87.3 (85.5 – 88.9) 186 12.7 (11.1 – 14.5) 2 adults 5152 89.9 (89.1 – 90.6) 580 10.1 (9.4 – 10.9) 3 adults 1591 89.1 (87.6 – 90.5) 194 10.9 (9.5 – 12.4) 4 or more adults 1125 90.0 (88.2 – 91.6) 125 10.0 (8.4 – 11.8)
Child in hhold < 16 No children 6102 89.4 (88.6 – 90.1) 727 10.6 (9.9 – 11.9) 1 child 1247 89.4 (87.7 – 90.9) 147 10.6 (9.0 – 12.2) 2 children 1287 90.8 (89.2 – 92.2) 131 9.2 (7.8 – 10.8) 3 or more children 507 86.4 (83.3 – 88.8) 80 13.6 (11.0 - 16.6)
Household Structure Couple with children 3970 90.5 (89.5 – 91.3) 416 9.5 (8.6 – 10.4) Single with children 384 80.7 (77.1 – 84.2) 92 19.3 (16.0 – 23.1) Single adult 1106 88.2 (86.3 – 89.9) 148 11.8 (10.1 – 13.7) Couple no children 2685 91.1 (90.0 – 92.1) 263 8.9 (7.9 – 9.9) Related adults 580 85.1 (82.2 – 87.6) 102 14.9 (12.4 – 17.7) Non related adults 279 88.8 (85.0 – 92.0) 35 11.2 (8.0 – 15.0) Other 140 82.7 (76.6 – 88.0) 29 17.3 (12.0 – 23.4)
Dwelling Owned or purchased 7705 90.5 (89.8 – 91.1) 812 9.5 (8.9 – 10.2) Rented (govt.) 346 80.1 (76.1 – 83.7) 86 19.9 (16.3 – 23.9) Rented (private) 932 85.3 (83.2 – 87.4) 160 14.7 (12.6 – 16.8) Other 160 85.7 (80.0 – 90.1) 27 14.3 (9.9 – 20.0) TOTAL 9144 89.4 (88.8 – 90.0) 1085 10.6 (10.0 – 11.2) Statistically significantly different (χ2 test p<0.05) than the other categories combined.
Data source: 2002-2004 South Australian Monitoring and Surveillance System
CHAPTER 6: DIFFERENT POPULATION GROUPS AND PSYCHOLOGICAL DISTRESS
Population Groups SAMSS July 2002 – June 2004
40
Psychological distress categories using the K10 were analysed by different population groups, in order to examine whether where respondents lived, and their socioeconomic status affected levels of psychological distress. By using postcode, respondents were analysed according to where they lived using the South Australian health regions, quintiles of Socio-Economic Index for Areas (Index of Relative Socio-Economic Disadvantage) (SEIFA IRSD), and the Accessibility Remoteness Index of Australia (ARIA).
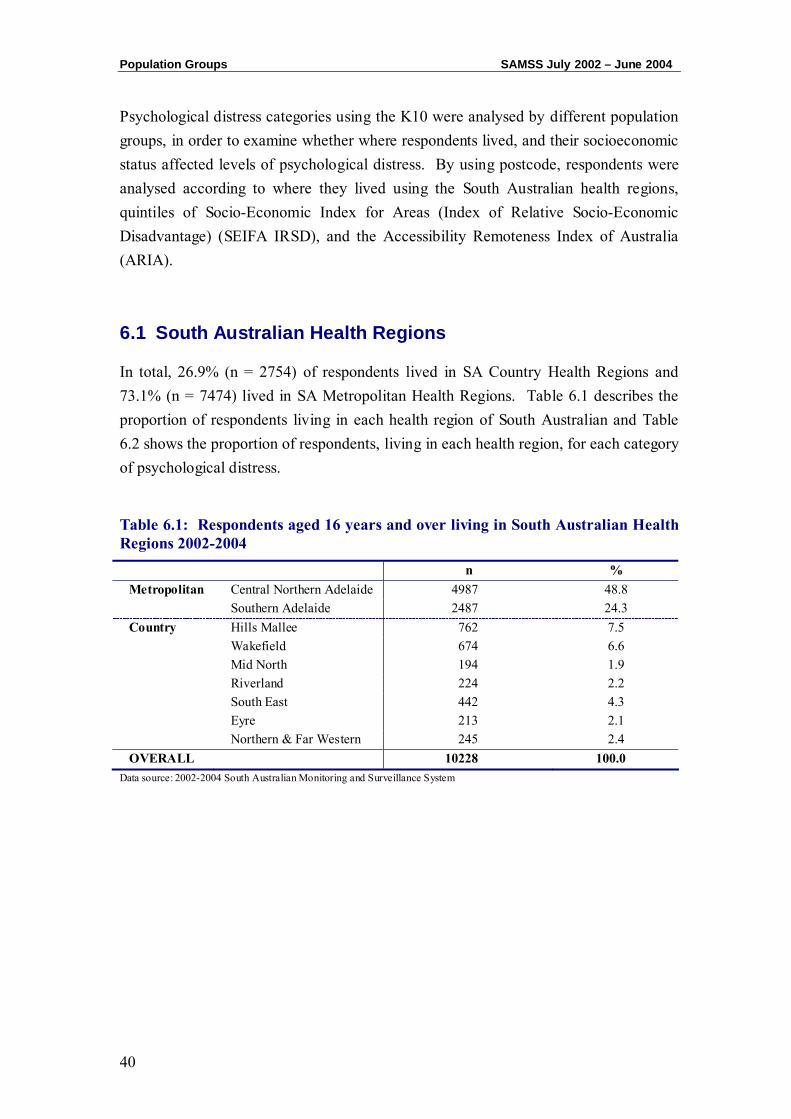
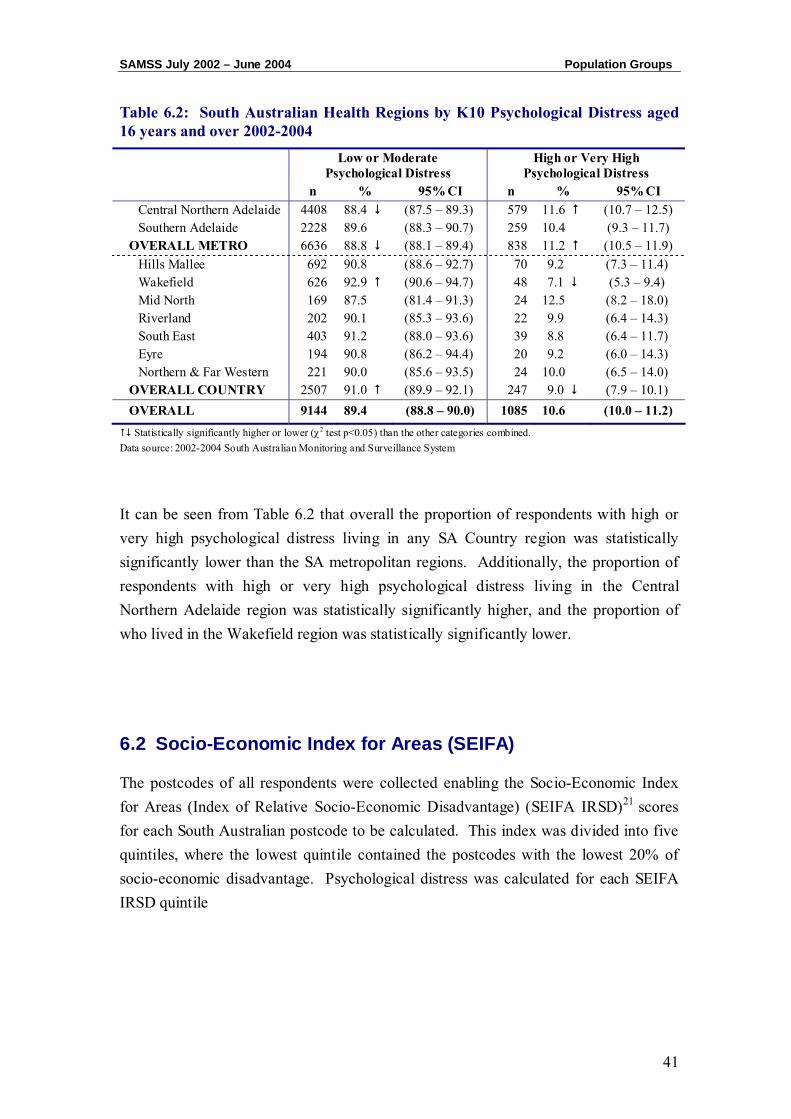
6.1 South Australian Health Regions
In total, 26.9% (n = 2754) of respondents lived in SA Country Health Regions and 73.1% (n = 7474) lived in SA Metropolitan Health Regions. Table 6.1 describes the proportion of respondents living in each health region of South Australian and Table 6.2 shows the proportion of respondents, living in each health region, for each category of psychological distress.
Table 6.1: Respondents aged 16 years and over living in South Australian Health Regions 2002-2004
n % Metropolitan Central Northern Adelaide 4987 48.8 Southern Adelaide 2487 24.3 Country Hills Mallee 762 7.5 Wakefield 674 6.6 Mid North 194 1.9 Riverland 224 2.2 South East 442 4.3 Eyre 213 2.1 Northern & Far Western 245 2.4 OVERALL 10228 100.0
Data source: 2002-2004 South Australian Monitoring and Surveillance System
SAMSS July 2002 – June 2004 Population Groups
41
Table 6.2: South Australian Health Regions by K10 Psychological Distress aged 16 years and over 2002-2004
Low or Moderate Psychological Distress
High or Very High Psychological Distress
n % 95% CI n % 95% CI Central Northern Adelaide 4408 88.4 (87.5 – 89.3) 579 11.6 (10.7 – 12.5) Southern Adelaide 2228 89.6 (88.3 – 90.7) 259 10.4 (9.3 – 11.7)
OVERALL METRO 6636 88.8 (88.1 – 89.4) 838 11.2 (10.5 – 11.9) Hills Mallee 692 90.8 (88.6 – 92.7) 70 9.2 (7.3 – 11.4) Wakefield 626 92.9 (90.6 – 94.7) 48 7.1 (5.3 – 9.4) Mid North 169 87.5 (81.4 – 91.3) 24 12.5 (8.2 – 18.0) Riverland 202 90.1 (85.3 – 93.6) 22 9.9 (6.4 – 14.3) South East 403 91.2 (88.0 – 93.6) 39 8.8 (6.4 – 11.7) Eyre 194 90.8 (86.2 – 94.4) 20 9.2 (6.0 – 14.3) Northern & Far Western 221 90.0 (85.6 – 93.5) 24 10.0 (6.5 – 14.0)
OVERALL COUNTRY 2507 91.0 (89.9 – 92.1) 247 9.0 (7.9 – 10.1) OVERALL 9144 89.4 (88.8 – 90.0) 1085 10.6 (10.0 – 11.2) Statistically significantly higher or lower (χ2 test p<0.05) than the other categories combined.
Data source: 2002-2004 South Australian Monitoring and Surveillance System
It can be seen from Table 6.2 that overall the proportion of respondents with high or very high psychological distress living in any SA Country region was statistically significantly lower than the SA metropolitan regions. Additionally, the proportion of respondents with high or very high psychological distress living in the Central Northern Adelaide region was statistically significantly higher, and the proportion of who lived in the Wakefield region was statistically significantly lower.
6.2 Socio-Economic Index for Areas (SEIFA)
The postcodes of all respondents were collected enabling the Socio-Economic Index for Areas (Index of Relative Socio-Economic Disadvantage) (SEIFA IRSD)21 scores for each South Australian postcode to be calculated. This index was divided into five quintiles, where the lowest quintile contained the postcodes with the lowest 20% of socio-economic disadvantage. Psychological distress was calculated for each SEIFA IRSD quintile

Population Groups SAMSS July 2002 – June 2004
42
Table 6.3 describes the proportion of respondents living in each SEIFA IRSD quintile of South Australia.
Table 6.3: Respondents living in each SEIFA IRSD quintile 2002-2004
n % 1st quintile (Lowest) 1679 16.5 2nd quintile 1982 19.5 3rd quintile 2208 21.7 4th quintile 2010 19.7 5th quintile (Highest) 2308 22.7 OVERALL 10187 100.0
Data source: 2002-2004 South Australian Monitoring and Surveillance System
The proportion of respondents, by category of psychological distress in each SEIFA IRSD quintile is detailed in Table 6.4.
Table 6.4: SEIFA IRSD by Psychological Distress, aged 16 years and over 2002-2004
Low or Moderate Psychological Distress
High or Very High Psychological Distress
n % 95% CI n % 95% CI
1st quintile (Lowest) 1468 87.5 (5.9 – 89.0) 210 12.5 (11.0 – 14.2) 2nd quintile 1756 88.6 (87.1 – 89.9) 226 11.4 (10.1 - 12.9) 3rd quintile 1982 89.8 (88.4 – 91.0) 226 10.2 (9.0 – 11.6) 4th quintile 1794 89.3 (87.8 – 90.6) 215 10.7 (9.4 – 12.2) 5th quintile (Highest) 2105 91.2 (90.0 – 92.3) 203 8.8 (7.7 – 10.0) OVERALL 9105 89.4 (88.8 – 90.0) 1081 10.6 (10.0 – 11.2) Statistically significantly higher or lower (χ2 test p<0.05) than the other categories combined.
Data source: 2002-2004 South Australian Monitoring and Surveillance System
It can be seen from Table 6.4 that the proportion of respondents with high or very high psychological distress who lived in a postcode within the lowest SEIFA IRSD quintile was statistically significantly higher, and the proportion of respondents with high or very high psychological distress who lived in a postcode area within the lowest SEIFA IRSD quintile was statistically significantly lower.
SAMSS July 2002 – June 2004 Population Groups
43
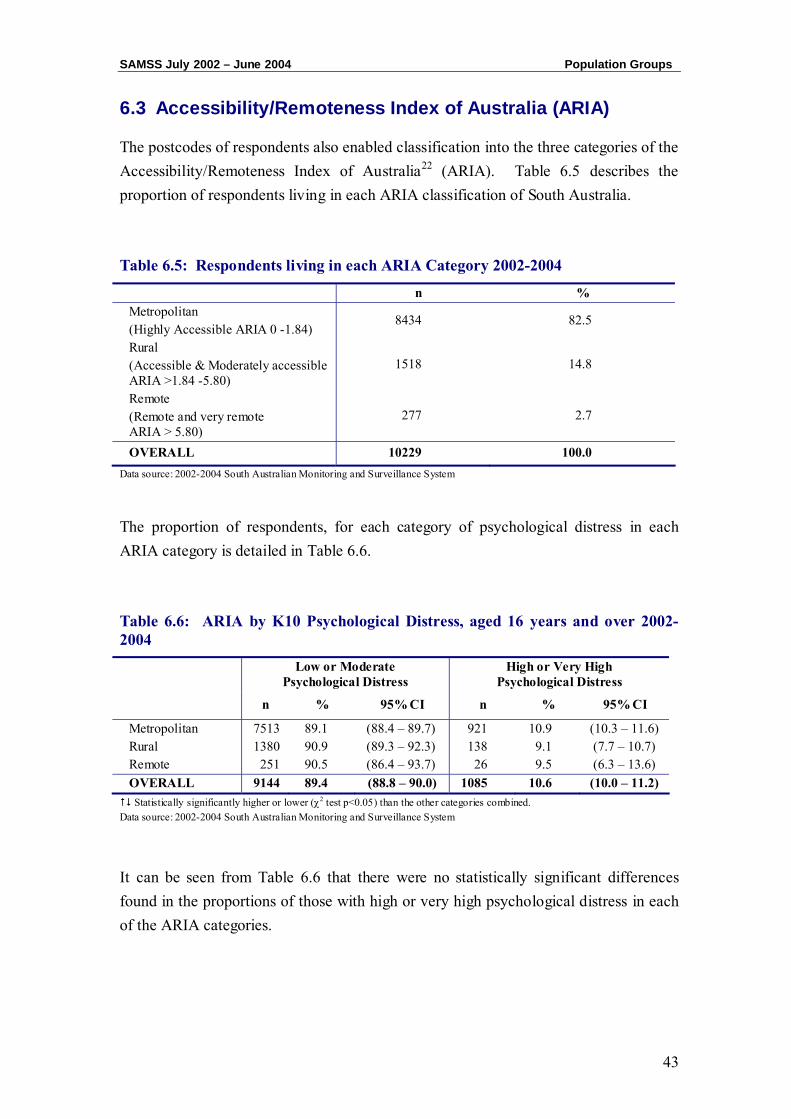
6.3 Accessibility/Remoteness Index of Australia (ARIA)
The postcodes of respondents also enabled classification into the three categories of the Accessibility/Remoteness Index of Australia22 (ARIA). Table 6.5 describes the proportion of respondents living in each ARIA classification of South Australia.
Table 6.5: Respondents living in each ARIA Category 2002-2004
n % Metropolitan (Highly Accessible ARIA 0 -1.84)
8434 82.5
Rural (Accessible & Moderately accessible ARIA >1.84 -5.80)
1518 14.8
Remote (Remote and very remote ARIA > 5.80)
277 2.7
OVERALL 10229 100.0 Data source: 2002-2004 South Australian Monitoring and Surveillance System
The proportion of respondents, for each category of psychological distress in each ARIA category is detailed in Table 6.6.
Table 6.6: ARIA by K10 Psychological Distress, aged 16 years and over 2002-2004
Low or Moderate Psychological Distress
High or Very High Psychological Distress
n % 95% CI n % 95% CI
Metropolitan 7513 89.1 (88.4 – 89.7) 921 10.9 (10.3 – 11.6) Rural 1380 90.9 (89.3 – 92.3) 138 9.1 (7.7 – 10.7) Remote 251 90.5 (86.4 – 93.7) 26 9.5 (6.3 – 13.6) OVERALL 9144 89.4 (88.8 – 90.0) 1085 10.6 (10.0 – 11.2) Statistically significantly higher or lower (χ2 test p<0.05) than the other categories combined.
Data source: 2002-2004 South Australian Monitoring and Surveillance System
It can be seen from Table 6.6 that there were no statistically significant differences found in the proportions of those with high or very high psychological distress in each of the ARIA categories.
Population Groups SAMSS July 2002 – June 2004
44
CHAPTER 7: PSYCHOLOGICAL DISTRESS AND CHRONIC
CONDITIONS, CO-MORBIDITY AND HEALTH STATUS
Chronic Conditions SAMSS July 2002 – June 2004
46
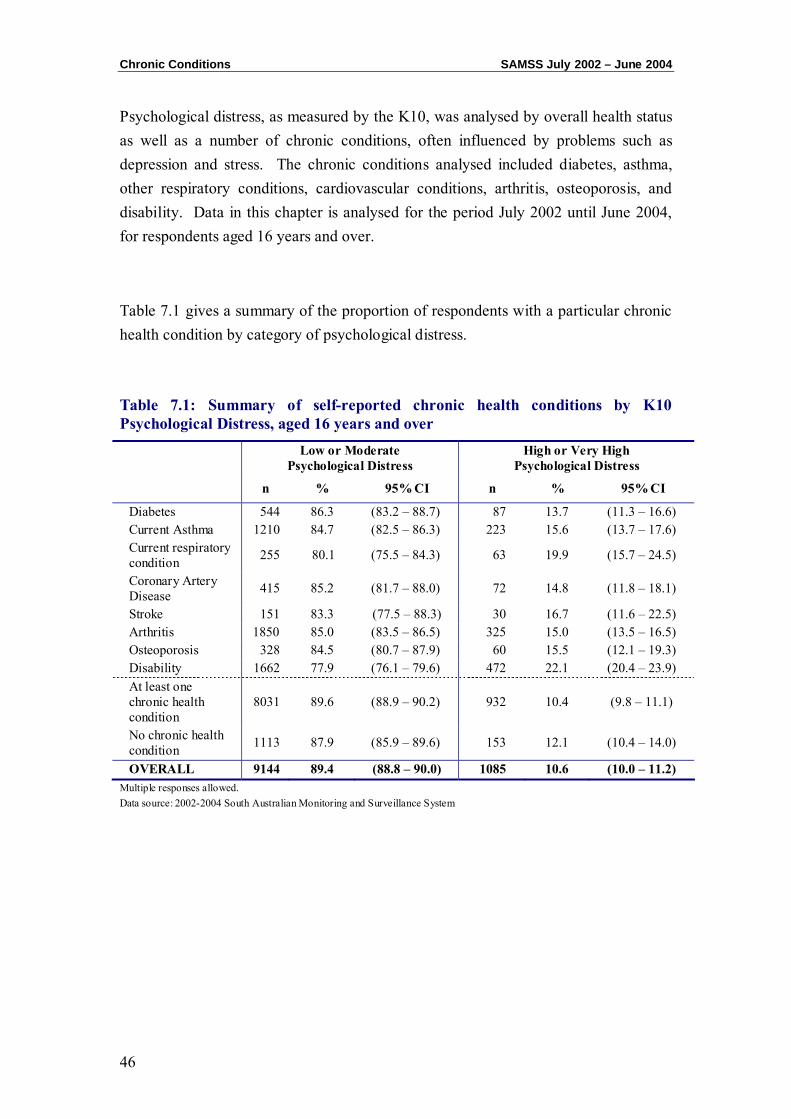
Psychological distress, as measured by the K10, was analysed by overall health status as well as a number of chronic conditions, often influenced by problems such as depression and stress. The chronic conditions analysed included diabetes, asthma, other respiratory conditions, cardiovascular conditions, arthritis, osteoporosis, and disability. Data in this chapter is analysed for the period July 2002 until June 2004, for respondents aged 16 years and over.
Table 7.1 gives a summary of the proportion of respondents with a particular chronic health condition by category of psychological distress.
Table 7.1: Summary of self-reported chronic health conditions by K10 Psychological Distress, aged 16 years and over
Low or Moderate Psychological Distress
High or Very High Psychological Distress
n % 95% CI n % 95% CI
Diabetes 544 86.3 (83.2 – 88.7) 87 13.7 (11.3 – 16.6) Current Asthma 1210 84.7 (82.5 – 86.3) 223 15.6 (13.7 – 17.6) Current respiratory condition 255 80.1 (75.5 – 84.3) 63 19.9 (15.7 – 24.5)
Coronary Artery Disease 415 85.2 (81.7 – 88.0) 72 14.8 (11.8 – 18.1)
Stroke 151 83.3 (77.5 – 88.3) 30 16.7 (11.6 – 22.5) Arthritis 1850 85.0 (83.5 – 86.5) 325 15.0 (13.5 – 16.5) Osteoporosis 328 84.5 (80.7 – 87.9) 60 15.5 (12.1 – 19.3) Disability 1662 77.9 (76.1 – 79.6) 472 22.1 (20.4 – 23.9) At least one chronic health condition
8031 89.6 (88.9 – 90.2) 932 10.4 (9.8 – 11.1)
No chronic health condition 1113 87.9 (85.9 – 89.6) 153 12.1 (10.4 – 14.0)
OVERALL 9144 89.4 (88.8 – 90.0) 1085 10.6 (10.0 – 11.2) Multiple responses allowed. Data source: 2002-2004 South Australian Monitoring and Surveillance System
SAMSS July 2002 – June 2004 Chronic Conditions
47
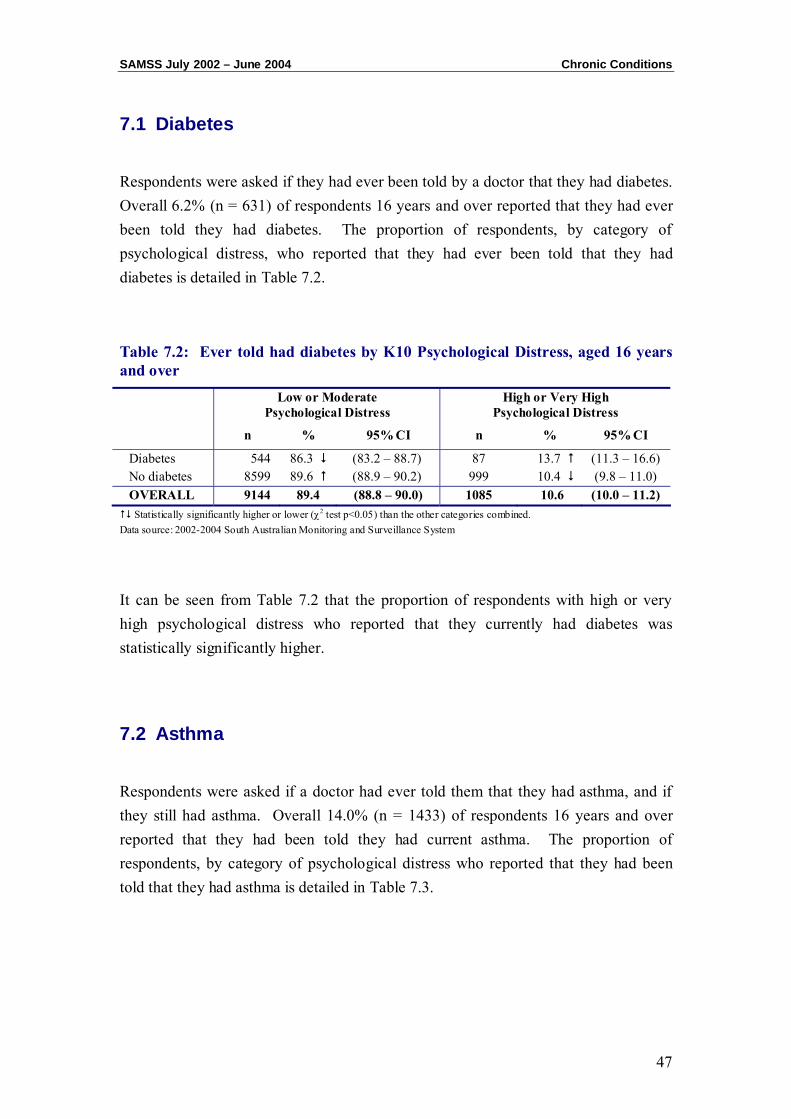
7.1 Diabetes
Respondents were asked if they had ever been told by a doctor that they had diabetes. Overall 6.2% (n = 631) of respondents 16 years and over reported that they had ever been told they had diabetes. The proportion of respondents, by category of psychological distress, who reported that they had ever been told that they had diabetes is detailed in Table 7.2.
Table 7.2: Ever told had diabetes by K10 Psychological Distress, aged 16 years and over
Low or Moderate Psychological Distress
High or Very High Psychological Distress
n % 95% CI n % 95% CI
Diabetes 544 86.3 (83.2 – 88.7) 87 13.7 (11.3 – 16.6) No diabetes 8599 89.6 (88.9 – 90.2) 999 10.4 (9.8 – 11.0) OVERALL 9144 89.4 (88.8 – 90.0) 1085 10.6 (10.0 – 11.2) Statistically significantly higher or lower (χ2 test p<0.05) than the other categories combined.
Data source: 2002-2004 South Australian Monitoring and Surveillance System
It can be seen from Table 7.2 that the proportion of respondents with high or very high psychological distress who reported that they currently had diabetes was statistically significantly higher.
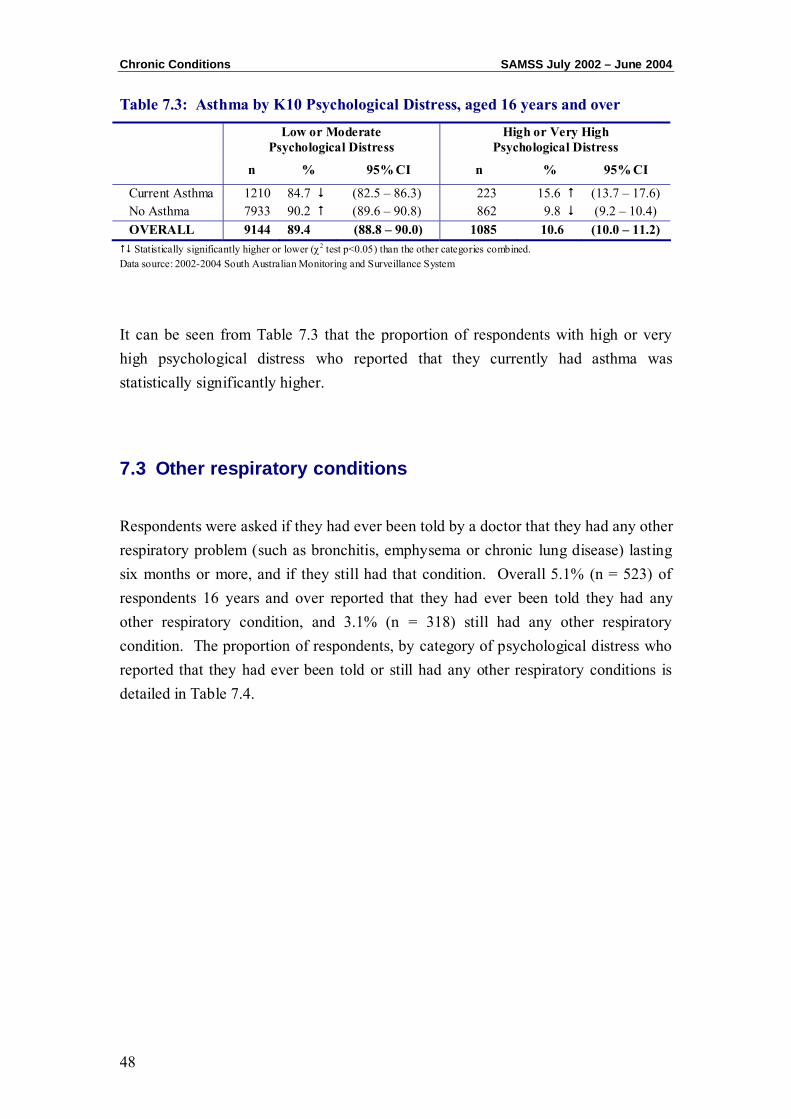
7.2 Asthma
Respondents were asked if a doctor had ever told them that they had asthma, and if they still had asthma. Overall 14.0% (n = 1433) of respondents 16 years and over reported that they had been told they had current asthma. The proportion of respondents, by category of psychological distress who reported that they had been told that they had asthma is detailed in Table 7.3.
Chronic Conditions SAMSS July 2002 – June 2004
48
Table 7.3: Asthma by K10 Psychological Distress, aged 16 years and over
Low or Moderate Psychological Distress
High or Very High Psychological Distress
n % 95% CI n % 95% CI
Current Asthma 1210 84.7 (82.5 – 86.3) 223 15.6 (13.7 – 17.6) No Asthma 7933 90.2 (89.6 – 90.8) 862 9.8 (9.2 – 10.4) OVERALL 9144 89.4 (88.8 – 90.0) 1085 10.6 (10.0 – 11.2) Statistically significantly higher or lower (χ2 test p<0.05) than the other categories combined.
Data source: 2002-2004 South Australian Monitoring and Surveillance System
It can be seen from Table 7.3 that the proportion of respondents with high or very high psychological distress who reported that they currently had asthma was statistically significantly higher.
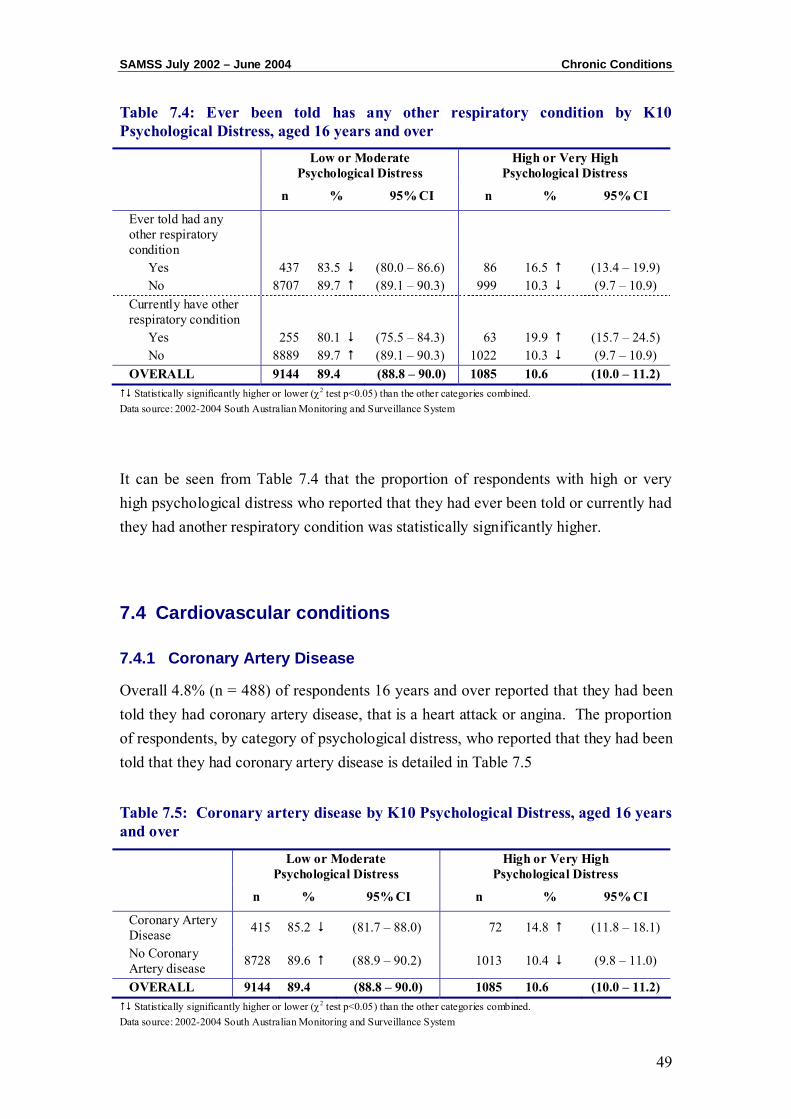
7.3 Other respiratory conditions
Respondents were asked if they had ever been told by a doctor that they had any other respiratory problem (such as bronchitis, emphysema or chronic lung disease) lasting six months or more, and if they still had that condition. Overall 5.1% (n = 523) of respondents 16 years and over reported that they had ever been told they had any other respiratory condition, and 3.1% (n = 318) still had any other respiratory condition. The proportion of respondents, by category of psychological distress who reported that they had ever been told or still had any other respiratory conditions is detailed in Table 7.4.
SAMSS July 2002 – June 2004 Chronic Conditions
49
Table 7.4: Ever been told has any other respiratory condition by K10 Psychological Distress, aged 16 years and over
Low or Moderate Psychological Distress
High or Very High Psychological Distress
n % 95% CI n % 95% CI
Ever told had any other respiratory condition
Yes 437 83.5 (80.0 – 86.6) 86 16.5 (13.4 – 19.9) No 8707 89.7 (89.1 – 90.3) 999 10.3 (9.7 – 10.9)
Currently have other respiratory condition
Yes 255 80.1 (75.5 – 84.3) 63 19.9 (15.7 – 24.5) No 8889 89.7 (89.1 – 90.3) 1022 10.3 (9.7 – 10.9)
OVERALL 9144 89.4 (88.8 – 90.0) 1085 10.6 (10.0 – 11.2) Statistically significantly higher or lower (χ2 test p<0.05) than the other categories combined.
Data source: 2002-2004 South Australian Monitoring and Surveillance System
It can be seen from Table 7.4 that the proportion of respondents with high or very high psychological distress who reported that they had ever been told or currently had they had another respiratory condition was statistically significantly higher.
7.4 Cardiovascular conditions
7.4.1 Coronary Artery Disease
Overall 4.8% (n = 488) of respondents 16 years and over reported that they had been told they had coronary artery disease, that is a heart attack or angina. The proportion of respondents, by category of psychological distress, who reported that they had been told that they had coronary artery disease is detailed in Table 7.5
Table 7.5: Coronary artery disease by K10 Psychological Distress, aged 16 years and over
Low or Moderate Psychological Distress
High or Very High Psychological Distress
n % 95% CI n % 95% CI
Coronary Artery Disease 415 85.2 (81.7 – 88.0) 72 14.8 (11.8 – 18.1)
No Coronary Artery disease 8728 89.6 (88.9 – 90.2) 1013 10.4 (9.8 – 11.0)
OVERALL 9144 89.4 (88.8 – 90.0) 1085 10.6 (10.0 – 11.2) Statistically significantly higher or lower (χ2 test p<0.05) than the other categories combined.
Data source: 2002-2004 South Australian Monitoring and Surveillance System
Chronic Conditions SAMSS July 2002 – June 2004
50
It can be seen from Table 7.5 that the proportion of respondents with high or very high psychological distress who reported that they had coronary artery disease was statistically significantly higher.
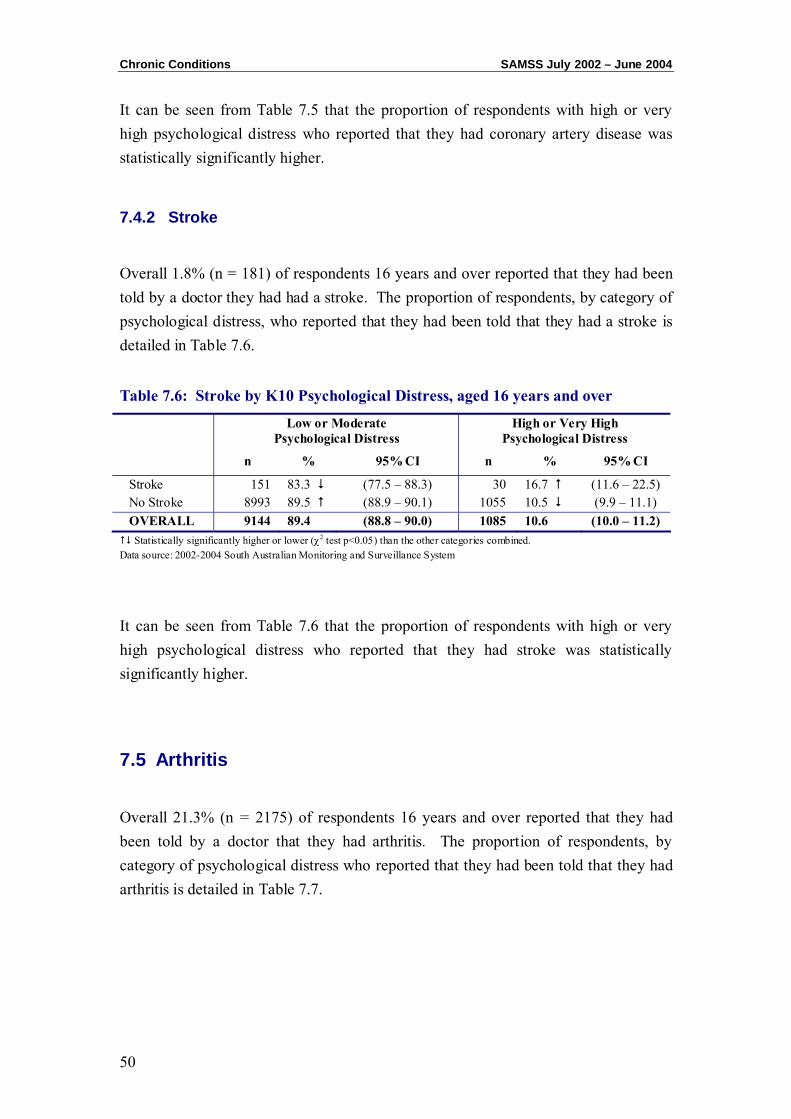
7.4.2 Stroke
Overall 1.8% (n = 181) of respondents 16 years and over reported that they had been told by a doctor they had had a stroke. The proportion of respondents, by category of psychological distress, who reported that they had been told that they had a stroke is detailed in Table 7.6.
Table 7.6: Stroke by K10 Psychological Distress, aged 16 years and over
Low or Moderate Psychological Distress
High or Very High Psychological Distress
n % 95% CI n % 95% CI
Stroke 151 83.3 (77.5 – 88.3) 30 16.7 (11.6 – 22.5) No Stroke 8993 89.5 (88.9 – 90.1) 1055 10.5 (9.9 – 11.1) OVERALL 9144 89.4 (88.8 – 90.0) 1085 10.6 (10.0 – 11.2) Statistically significantly higher or lower (χ2 test p<0.05) than the other categories combined.
Data source: 2002-2004 South Australian Monitoring and Surveillance System
It can be seen from Table 7.6 that the proportion of respondents with high or very high psychological distress who reported that they had stroke was statistically significantly higher.
7.5 Arthritis
Overall 21.3% (n = 2175) of respondents 16 years and over reported that they had been told by a doctor that they had arthritis. The proportion of respondents, by category of psychological distress who reported that they had been told that they had arthritis is detailed in Table 7.7.
SAMSS July 2002 – June 2004 Chronic Conditions
51
Table 7.7: Arthritis by K10 Psychological Distress, aged 16 years and over
Low or Moderate Psychological Distress
High or Very High Psychological Distress
n % 95% CI n % 95% CI
Arthritis 1850 85.0 (83.5 – 86.5) 325 15.0 (13.5 – 16.5) No Arthritis 7294 90.6 (89.9 – 91.2) 760 9.4 (8.8 – 10.1) OVERALL 9144 89.4 (88.8 – 90.0) 1085 10.6 (10.0 – 11.2) Statistically significantly higher or lower (χ2 test p<0.05) than the other categories combined.
Data source: 2002-2004 South Australian Monitoring and Surveillance System
It can be seen from Table 7.7 that the proportion of respondents with high or very high psychological distress who reported that they had arthritis was statistically significantly higher.
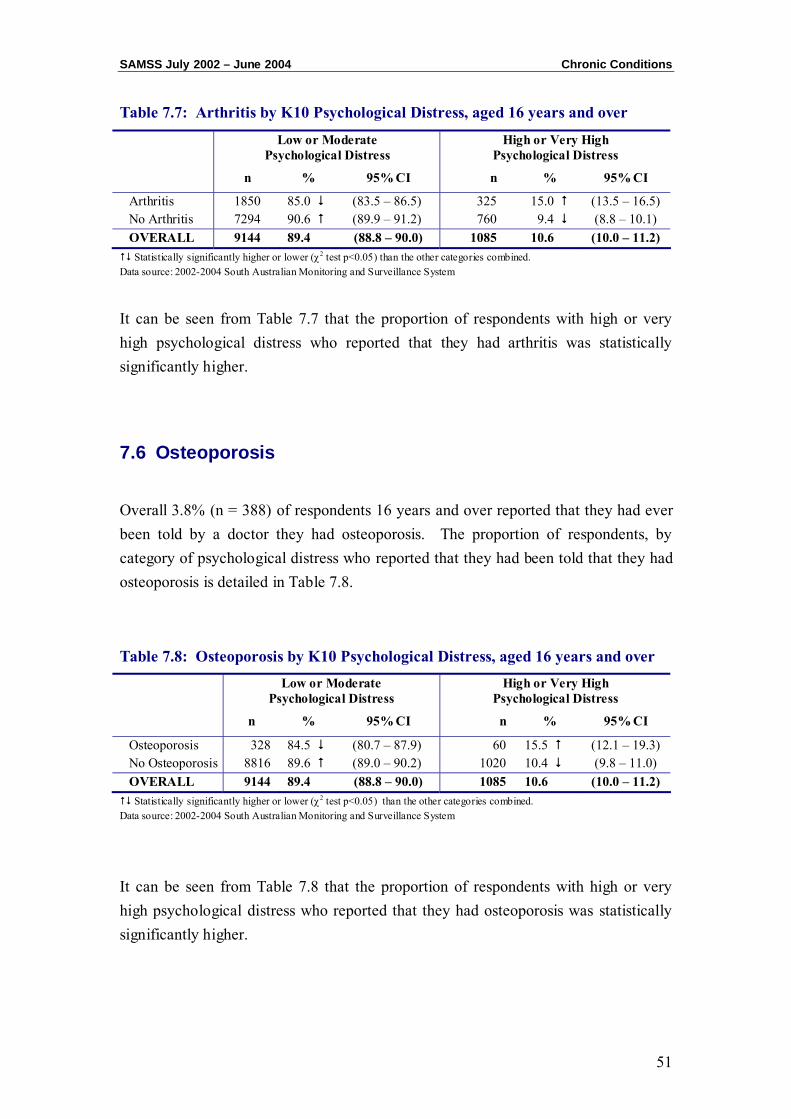
7.6 Osteoporosis
Overall 3.8% (n = 388) of respondents 16 years and over reported that they had ever been told by a doctor they had osteoporosis. The proportion of respondents, by category of psychological distress who reported that they had been told that they had osteoporosis is detailed in Table 7.8.
Table 7.8: Osteoporosis by K10 Psychological Distress, aged 16 years and over
Low or Moderate Psychological Distress
High or Very High Psychological Distress
n % 95% CI n % 95% CI
Osteoporosis 328 84.5 (80.7 – 87.9) 60 15.5 (12.1 – 19.3) No Osteoporosis 8816 89.6 (89.0 – 90.2) 1020 10.4 (9.8 – 11.0) OVERALL 9144 89.4 (88.8 – 90.0) 1085 10.6 (10.0 – 11.2) Statistically significantly higher or lower (χ2 test p<0.05) than the other categories combined.
Data source: 2002-2004 South Australian Monitoring and Surveillance System
It can be seen from Table 7.8 that the proportion of respondents with high or very high psychological distress who reported that they had osteoporosis was statistically significantly higher.
Chronic Conditions SAMSS July 2002 – June 2004
52
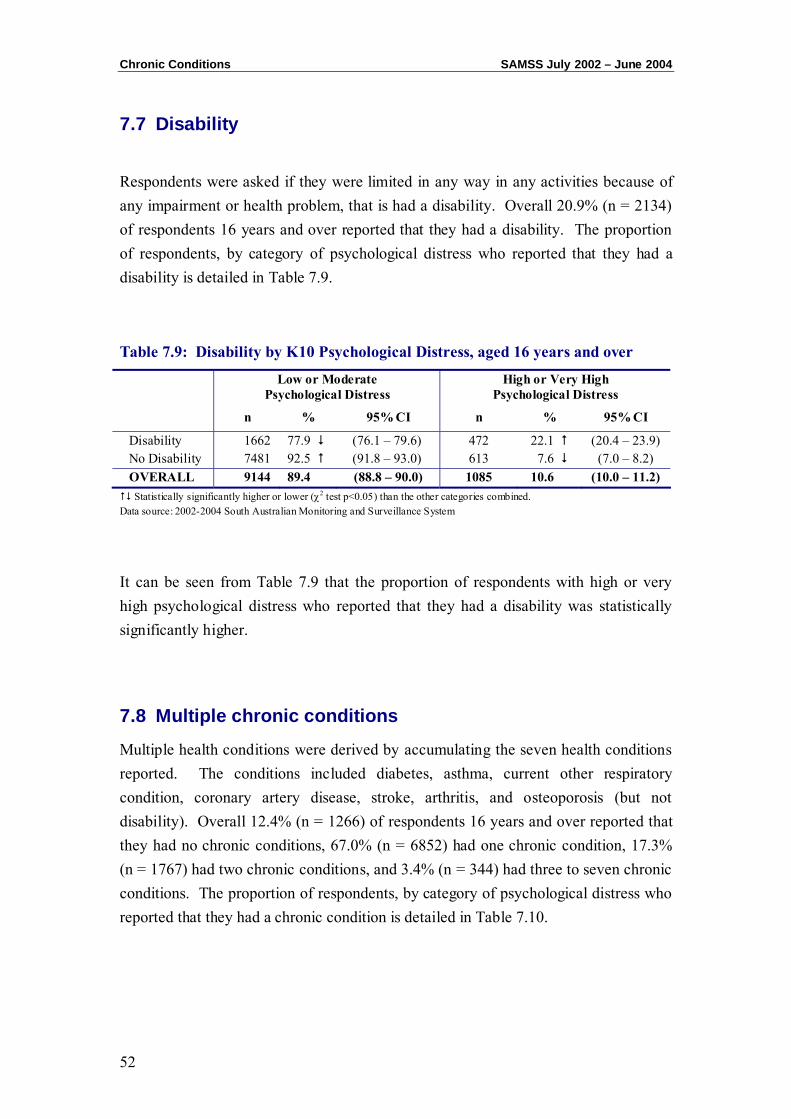
7.7 Disability
Respondents were asked if they were limited in any way in any activities because of any impairment or health problem, that is had a disability. Overall 20.9% (n = 2134) of respondents 16 years and over reported that they had a disability. The proportion of respondents, by category of psychological distress who reported that they had a disability is detailed in Table 7.9.
Table 7.9: Disability by K10 Psychological Distress, aged 16 years and over
Low or Moderate Psychological Distress
High or Very High Psychological Distress
n % 95% CI n % 95% CI
Disability 1662 77.9 (76.1 – 79.6) 472 22.1 (20.4 – 23.9) No Disability 7481 92.5 (91.8 – 93.0) 613 7.6 (7.0 – 8.2) OVERALL 9144 89.4 (88.8 – 90.0) 1085 10.6 (10.0 – 11.2) Statistically significantly higher or lower (χ2 test p<0.05) than the other categories combined.
Data source: 2002-2004 South Australian Monitoring and Surveillance System
It can be seen from Table 7.9 that the proportion of respondents with high or very high psychological distress who reported that they had a disability was statistically significantly higher.
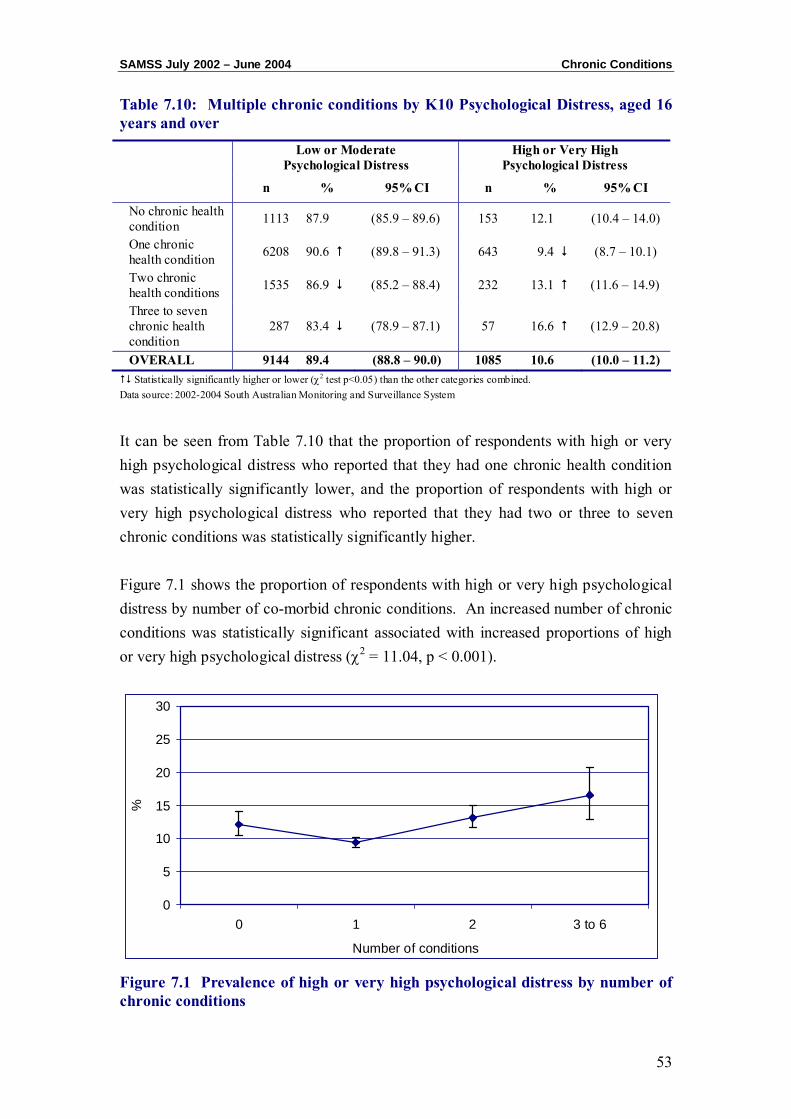
7.8 Multiple chronic conditions
Multiple health conditions were derived by accumulating the seven health conditions reported. The conditions included diabetes, asthma, current other respiratory condition, coronary artery disease, stroke, arthritis, and osteoporosis (but not disability). Overall 12.4% (n = 1266) of respondents 16 years and over reported that they had no chronic conditions, 67.0% (n = 6852) had one chronic condition, 17.3% (n = 1767) had two chronic conditions, and 3.4% (n = 344) had three to seven chronic conditions. The proportion of respondents, by category of psychological distress who reported that they had a chronic condition is detailed in Table 7.10.
SAMSS July 2002 – June 2004 Chronic Conditions
53
Table 7.10: Multiple chronic conditions by K10 Psychological Distress, aged 16 years and over
Low or Moderate Psychological Distress
High or Very High Psychological Distress
n % 95% CI n % 95% CI
No chronic health condition 1113 87.9 (85.9 – 89.6) 153 12.1 (10.4 – 14.0)
One chronic health condition 6208 90.6 (89.8 – 91.3) 643 9.4 (8.7 – 10.1)
Two chronic health conditions 1535 86.9 (85.2 – 88.4) 232 13.1 (11.6 – 14.9)
Three to seven chronic health condition
287 83.4 (78.9 – 87.1) 57 16.6 (12.9 – 20.8)
OVERALL 9144 89.4 (88.8 – 90.0) 1085 10.6 (10.0 – 11.2) Statistically significantly higher or lower (χ2 test p<0.05) than the other categories combined.
Data source: 2002-2004 South Australian Monitoring and Surveillance System
It can be seen from Table 7.10 that the proportion of respondents with high or very high psychological distress who reported that they had one chronic health condition was statistically significantly lower, and the proportion of respondents with high or very high psychological distress who reported that they had two or three to seven chronic conditions was statistically significantly higher. Figure 7.1 shows the proportion of respondents with high or very high psychological distress by number of co-morbid chronic conditions. An increased number of chronic conditions was statistically significant associated with increased proportions of high or very high psychological distress (χ2 = 11.04, p < 0.001).
0
5
10
15
20
25
30
0 1 2 3 to 6
Number of conditions
%
Figure 7.1 Prevalence of high or very high psychological distress by number of chronic conditions
Chronic Conditions SAMSS July 2002 – June 2004
54
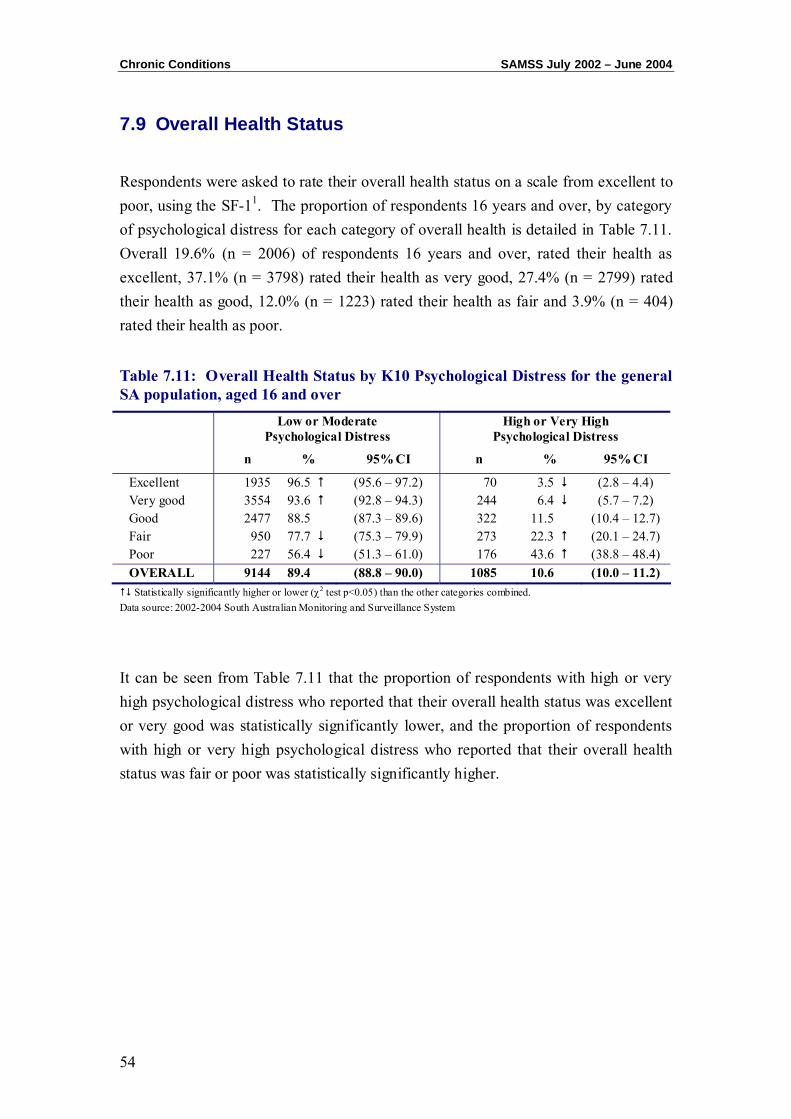
7.9 Overall Health Status
Respondents were asked to rate their overall health status on a scale from excellent to poor, using the SF-11. The proportion of respondents 16 years and over, by category of psychological distress for each category of overall health is detailed in Table 7.11. Overall 19.6% (n = 2006) of respondents 16 years and over, rated their health as excellent, 37.1% (n = 3798) rated their health as very good, 27.4% (n = 2799) rated their health as good, 12.0% (n = 1223) rated their health as fair and 3.9% (n = 404) rated their health as poor.
Table 7.11: Overall Health Status by K10 Psychological Distress for the general SA population, aged 16 and over
Low or Moderate Psychological Distress
High or Very High Psychological Distress
n % 95% CI n % 95% CI
Excellent 1935 96.5 (95.6 – 97.2) 70 3.5 (2.8 – 4.4) Very good 3554 93.6 (92.8 – 94.3) 244 6.4 (5.7 – 7.2) Good 2477 88.5 (87.3 – 89.6) 322 11.5 (10.4 – 12.7) Fair 950 77.7 (75.3 – 79.9) 273 22.3 (20.1 – 24.7) Poor 227 56.4 (51.3 – 61.0) 176 43.6 (38.8 – 48.4) OVERALL 9144 89.4 (88.8 – 90.0) 1085 10.6 (10.0 – 11.2) Statistically significantly higher or lower (χ2 test p<0.05) than the other categories combined.
Data source: 2002-2004 South Australian Monitoring and Surveillance System
It can be seen from Table 7.11 that the proportion of respondents with high or very high psychological distress who reported that their overall health status was excellent or very good was statistically significantly lower, and the proportion of respondents with high or very high psychological distress who reported that their overall health status was fair or poor was statistically significantly higher.
CHAPTER 8: PSYCHOLOGICAL DISTRESS AND HEALTH RISK
FACTORS

Risk Factors SAMSS July 2003 – June 2004
56
Psychological distress, as measured by the K10, was analysed by a number of health risk factors. The risk factors included high blood pressure and cholesterol, overweight and obesity according to body mass index, smoking, risky alcohol consumption and insufficient physical activity. Data in this chapter are analysed for the period July 2003 until June 2004, for respondents aged 16 years and older (n = 5367).
Table 8.1 gives a summary of the proportion of respondents with a particular health risk factor by category of psychological distress.
Table 8.1: Summary of self-reported health risk factor by K10 Psychological Distress, aged 16 years and over
Low or Moderate Psychological Distress
High or Very High Psychological Distress
n % 95% CI n % 95% CI
Current high blood pressure 626 88.0 (85.5 – 90.3) 86 12.0 (9.8 – 14.6)
Current high cholesterol 467 85.5 (82.2 – 88.2) 79 14.5 (11.7 – 17.7)
Overweight or Obese 2378 89.6 (88.4 – 90.8) 274 10.3 (9.2 – 11.6) Smoker 828 82.3 (79.9 – 84.7) 178 17.7 (15.4 – 20.2) Risky or High Risk of harm from alcohol in long term
995 87.5 (85.5 – 89.4) 141 12.4 (10.6 – 14.5)
Insufficient physical activity 2463 87.0 (85.7 – 88.2) 368 12.9 (12.4 – 15.0)
At least one health risk factor 4433 89.2 (88.3 – 90.1) 536 10.7 (9.9 – 11.7)
No health risk factors 362 91.1 (87.6 – 93.5) 36 8.9 (6.5 – 12.4) OVERALL 4795 89.3 (88.5 – 90.2) 572 10.7 (9.9 – 11.5)
Multiple responses allowed. Data source: 2003-2004 South Australian Monitoring and Surveillance System
8.1 High Blood Pressure
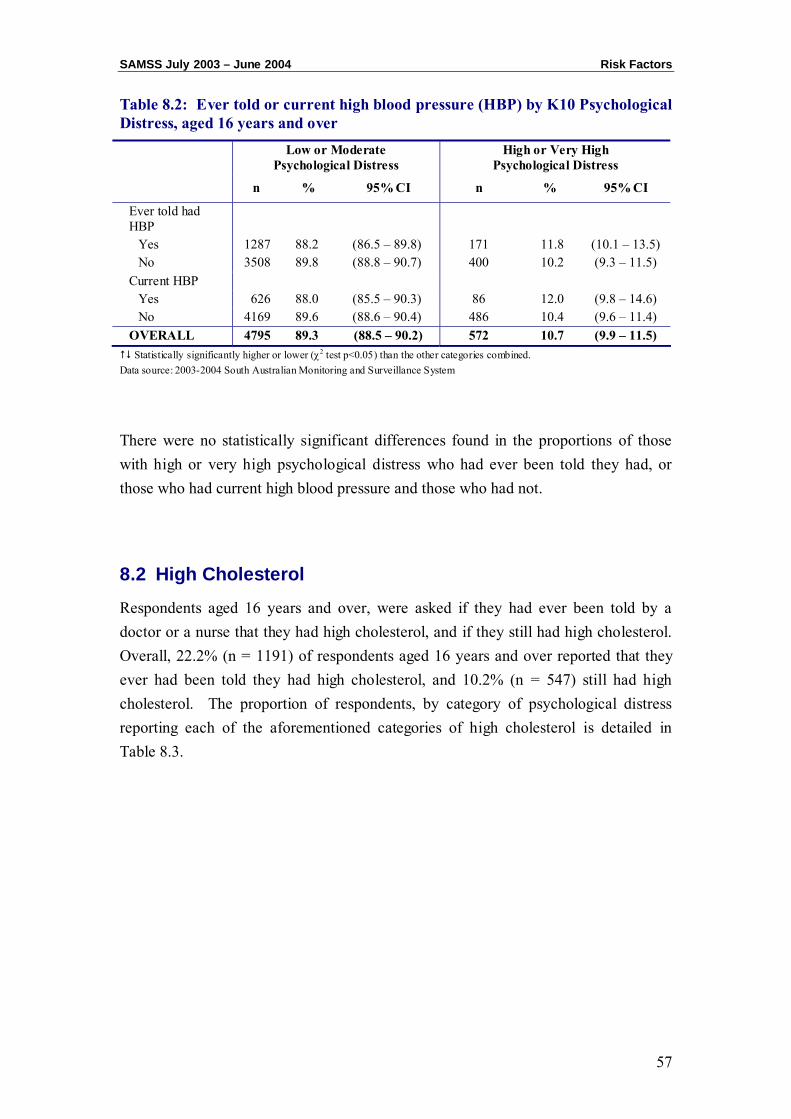
Respondents, age 16 years and older, were asked if they had ever been told by a doctor or a nurse that they had high blood pressure, and if they currently had high blood pressure (HBP). Overall, 27.2% (n = 589) of respondents between over 16 years reported that they had ever been told they had high blood pressure and 13.3% (n = 711) had current high blood pressure. The proportion of respondents, by category of psychological distress reporting each of the aforementioned categories of high blood pressure is detailed in Table 8.2.
SAMSS July 2003 – June 2004 Risk Factors
57
Table 8.2: Ever told or current high blood pressure (HBP) by K10 Psychological Distress, aged 16 years and over
Low or Moderate Psychological Distress
High or Very High Psychological Distress
n % 95% CI n % 95% CI
Ever told had HBP
Yes 1287 88.2 (86.5 – 89.8) 171 11.8 (10.1 – 13.5) No 3508 89.8 (88.8 – 90.7) 400 10.2 (9.3 – 11.5)
Current HBP Yes 626 88.0 (85.5 – 90.3) 86 12.0 (9.8 – 14.6) No 4169 89.6 (88.6 – 90.4) 486 10.4 (9.6 – 11.4)
OVERALL 4795 89.3 (88.5 – 90.2) 572 10.7 (9.9 – 11.5) Statistically significantly higher or lower (χ2 test p<0.05) than the other categories combined.
Data source: 2003-2004 South Australian Monitoring and Surveillance System
There were no statistically significant differences found in the proportions of those with high or very high psychological distress who had ever been told they had, or those who had current high blood pressure and those who had not.
8.2 High Cholesterol
Respondents aged 16 years and over, were asked if they had ever been told by a doctor or a nurse that they had high cholesterol, and if they still had high cholesterol. Overall, 22.2% (n = 1191) of respondents aged 16 years and over reported that they ever had been told they had high cholesterol, and 10.2% (n = 547) still had high cholesterol. The proportion of respondents, by category of psychological distress reporting each of the aforementioned categories of high cholesterol is detailed in Table 8.3.
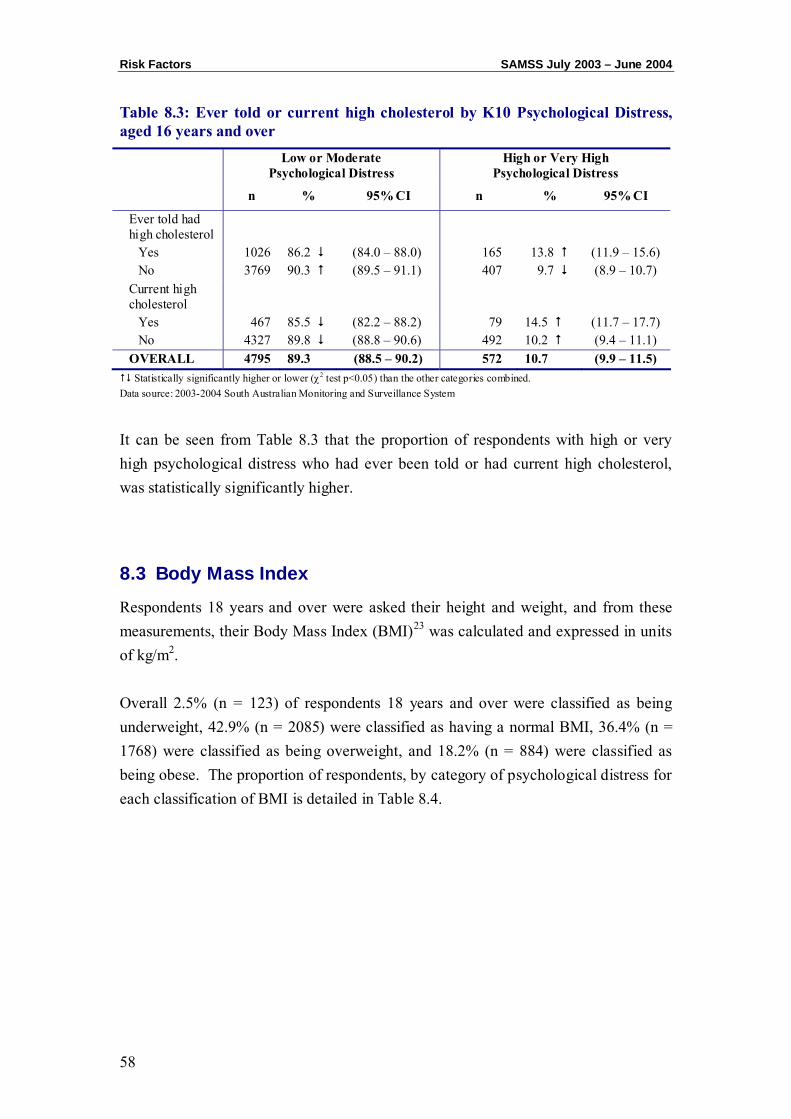
Risk Factors SAMSS July 2003 – June 2004
58
Table 8.3: Ever told or current high cholesterol by K10 Psychological Distress, aged 16 years and over
Low or Moderate Psychological Distress
High or Very High Psychological Distress
n % 95% CI n % 95% CI
Ever told had high cholesterol
Yes 1026 86.2 (84.0 – 88.0) 165 13.8 (11.9 – 15.6) No 3769 90.3 (89.5 – 91.1) 407 9.7 (8.9 – 10.7)
Current high cholesterol
Yes 467 85.5 (82.2 – 88.2) 79 14.5 (11.7 – 17.7) No 4327 89.8 (88.8 – 90.6) 492 10.2 (9.4 – 11.1)
OVERALL 4795 89.3 (88.5 – 90.2) 572 10.7 (9.9 – 11.5) Statistically significantly higher or lower (χ2 test p<0.05) than the other categories combined.
Data source: 2003-2004 South Australian Monitoring and Surveillance System
It can be seen from Table 8.3 that the proportion of respondents with high or very high psychological distress who had ever been told or had current high cholesterol, was statistically significantly higher.
8.3 Body Mass Index
Respondents 18 years and over were asked their height and weight, and from these measurements, their Body Mass Index (BMI)23 was calculated and expressed in units of kg/m2. Overall 2.5% (n = 123) of respondents 18 years and over were classified as being underweight, 42.9% (n = 2085) were classified as having a normal BMI, 36.4% (n = 1768) were classified as being overweight, and 18.2% (n = 884) were classified as being obese. The proportion of respondents, by category of psychological distress for each classification of BMI is detailed in Table 8.4.
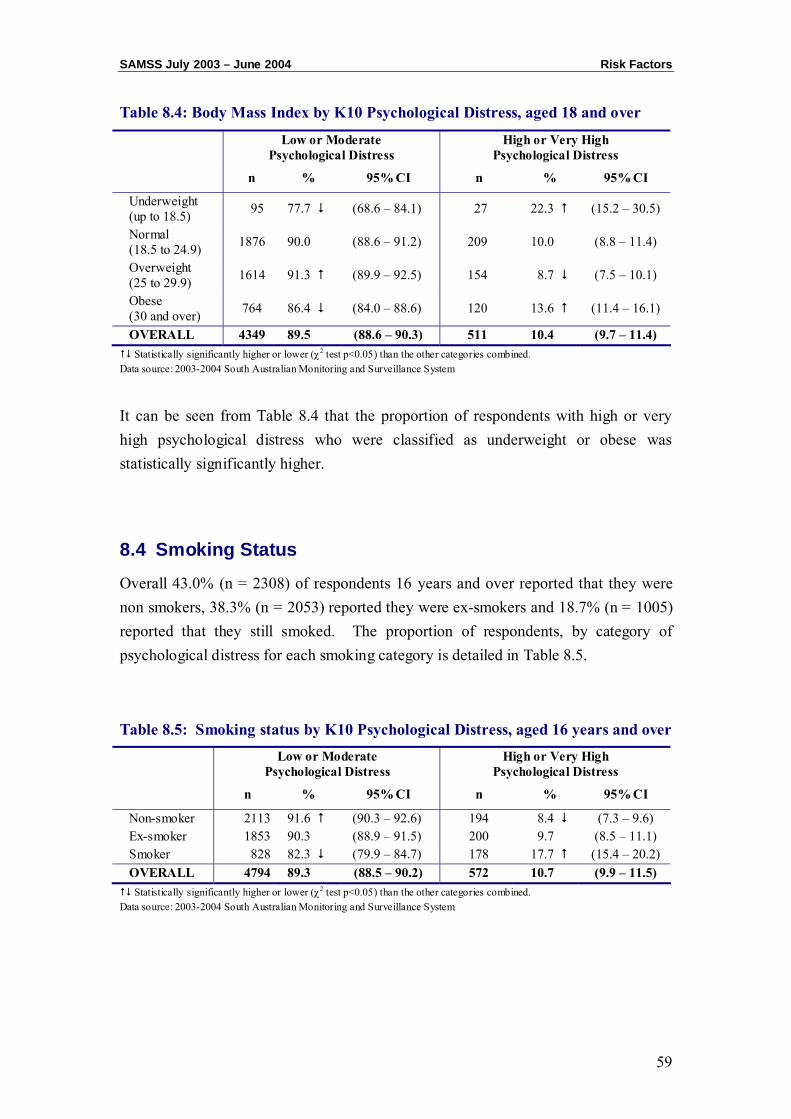
SAMSS July 2003 – June 2004 Risk Factors
59
Table 8.4: Body Mass Index by K10 Psychological Distress, aged 18 and over
Low or Moderate Psychological Distress
High or Very High Psychological Distress
n % 95% CI n % 95% CI
Underweight (up to 18.5) 95 77.7 (68.6 – 84.1) 27 22.3 (15.2 – 30.5)
Normal (18.5 to 24.9) 1876 90.0 (88.6 – 91.2) 209 10.0 (8.8 – 11.4)
Overweight (25 to 29.9) 1614 91.3 (89.9 – 92.5) 154 8.7 (7.5 – 10.1)
Obese (30 and over) 764 86.4 (84.0 – 88.6) 120 13.6 (11.4 – 16.1)
OVERALL 4349 89.5 (88.6 – 90.3) 511 10.4 (9.7 – 11.4) Statistically significantly higher or lower (χ2 test p<0.05) than the other categories combined.
Data source: 2003-2004 South Australian Monitoring and Surveillance System
It can be seen from Table 8.4 that the proportion of respondents with high or very high psychological distress who were classified as underweight or obese was statistically significantly higher.
8.4 Smoking Status
Overall 43.0% (n = 2308) of respondents 16 years and over reported that they were non smokers, 38.3% (n = 2053) reported they were ex-smokers and 18.7% (n = 1005) reported that they still smoked. The proportion of respondents, by category of psychological distress for each smoking category is detailed in Table 8.5.
Table 8.5: Smoking status by K10 Psychological Distress, aged 16 years and over
Low or Moderate Psychological Distress
High or Very High Psychological Distress
n % 95% CI n % 95% CI
Non-smoker 2113 91.6 (90.3 – 92.6) 194 8.4 (7.3 – 9.6) Ex-smoker 1853 90.3 (88.9 – 91.5) 200 9.7 (8.5 – 11.1) Smoker 828 82.3 (79.9 – 84.7) 178 17.7 (15.4 – 20.2) OVERALL 4794 89.3 (88.5 – 90.2) 572 10.7 (9.9 – 11.5) Statistically significantly higher or lower (χ2 test p<0.05) than the other categories combined.
Data source: 2003-2004 South Australian Monitoring and Surveillance System
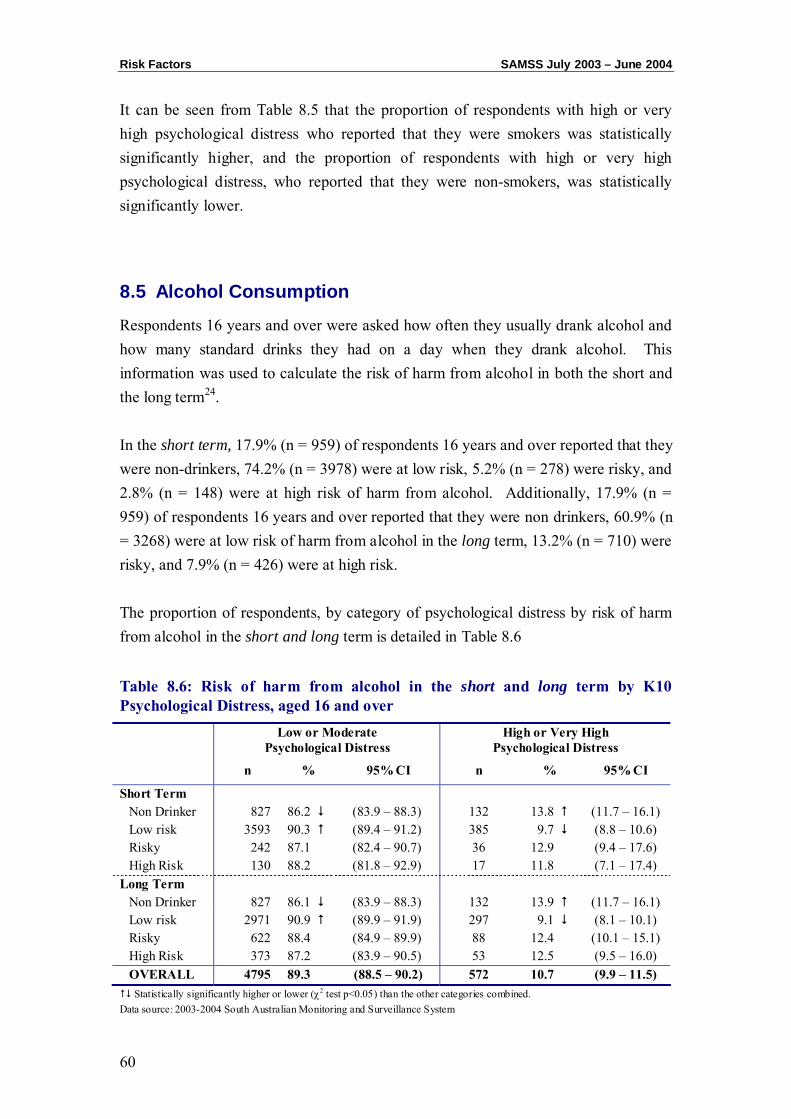
Risk Factors SAMSS July 2003 – June 2004
60
It can be seen from Table 8.5 that the proportion of respondents with high or very high psychological distress who reported that they were smokers was statistically significantly higher, and the proportion of respondents with high or very high psychological distress, who reported that they were non-smokers, was statistically significantly lower.
8.5 Alcohol Consumption
Respondents 16 years and over were asked how often they usually drank alcohol and how many standard drinks they had on a day when they drank alcohol. This information was used to calculate the risk of harm from alcohol in both the short and the long term24. In the short term, 17.9% (n = 959) of respondents 16 years and over reported that they were non-drinkers, 74.2% (n = 3978) were at low risk, 5.2% (n = 278) were risky, and 2.8% (n = 148) were at high risk of harm from alcohol. Additionally, 17.9% (n = 959) of respondents 16 years and over reported that they were non drinkers, 60.9% (n = 3268) were at low risk of harm from alcohol in the long term, 13.2% (n = 710) were risky, and 7.9% (n = 426) were at high risk. The proportion of respondents, by category of psychological distress by risk of harm from alcohol in the short and long term is detailed in Table 8.6 Table 8.6: Risk of harm from alcohol in the short and long term by K10 Psychological Distress, aged 16 and over
Low or Moderate Psychological Distress
High or Very High Psychological Distress
n % 95% CI n % 95% CI
Short Term Non Drinker 827 86.2 (83.9 – 88.3) 132 13.8 (11.7 – 16.1) Low risk 3593 90.3 (89.4 – 91.2) 385 9.7 (8.8 – 10.6) Risky 242 87.1 (82.4 – 90.7) 36 12.9 (9.4 – 17.6) High Risk 130 88.2 (81.8 – 92.9) 17 11.8 (7.1 – 17.4)
Long Term Non Drinker 827 86.1 (83.9 – 88.3) 132 13.9 (11.7 – 16.1) Low risk 2971 90.9 (89.9 – 91.9) 297 9.1 (8.1 – 10.1) Risky 622 88.4 (84.9 – 89.9) 88 12.4 (10.1 – 15.1) High Risk 373 87.2 (83.9 – 90.5) 53 12.5 (9.5 – 16.0) OVERALL 4795 89.3 (88.5 – 90.2) 572 10.7 (9.9 – 11.5) Statistically significantly higher or lower (χ2 test p<0.05) than the other categories combined.
Data source: 2003-2004 South Australian Monitoring and Surveillance System
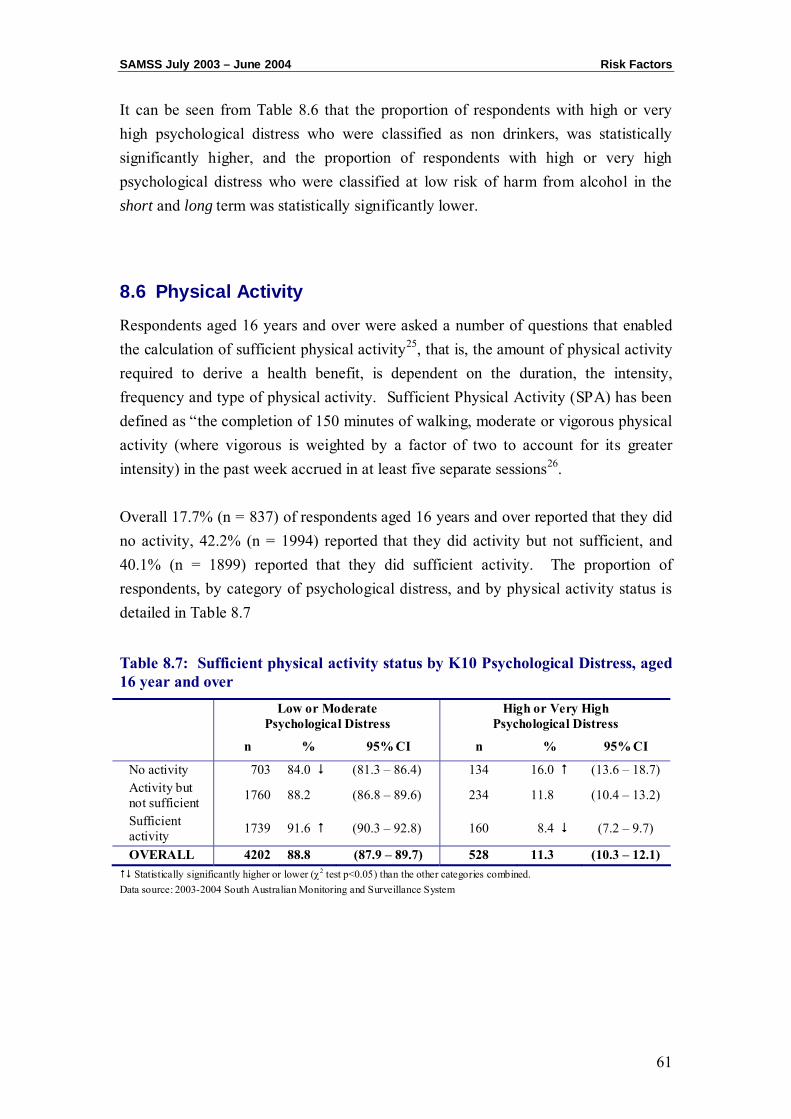
SAMSS July 2003 – June 2004 Risk Factors
61
It can be seen from Table 8.6 that the proportion of respondents with high or very high psychological distress who were classified as non drinkers, was statistically significantly higher, and the proportion of respondents with high or very high psychological distress who were classified at low risk of harm from alcohol in the short and long term was statistically significantly lower.
8.6 Physical Activity
Respondents aged 16 years and over were asked a number of questions that enabled the calculation of sufficient physical activity25, that is, the amount of physical activity required to derive a health benefit, is dependent on the duration, the intensity, frequency and type of physical activity. Sufficient Physical Activity (SPA) has been defined as “the completion of 150 minutes of walking, moderate or vigorous physical activity (where vigorous is weighted by a factor of two to account for its greater intensity) in the past week accrued in at least five separate sessions26. Overall 17.7% (n = 837) of respondents aged 16 years and over reported that they did no activity, 42.2% (n = 1994) reported that they did activity but not sufficient, and 40.1% (n = 1899) reported that they did sufficient activity. The proportion of respondents, by category of psychological distress, and by physical activity status is detailed in Table 8.7
Table 8.7: Sufficient physical activity status by K10 Psychological Distress, aged 16 year and over
Low or Moderate Psychological Distress
High or Very High Psychological Distress
n % 95% CI n % 95% CI
No activity 703 84.0 (81.3 – 86.4) 134 16.0 (13.6 – 18.7) Activity but not sufficient 1760 88.2 (86.8 – 89.6) 234 11.8 (10.4 – 13.2)
Sufficient activity 1739 91.6 (90.3 – 92.8) 160 8.4 (7.2 – 9.7)
OVERALL 4202 88.8 (87.9 – 89.7) 528 11.3 (10.3 – 12.1) Statistically significantly higher or lower (χ2 test p<0.05) than the other categories combined.
Data source: 2003-2004 South Australian Monitoring and Surveillance System
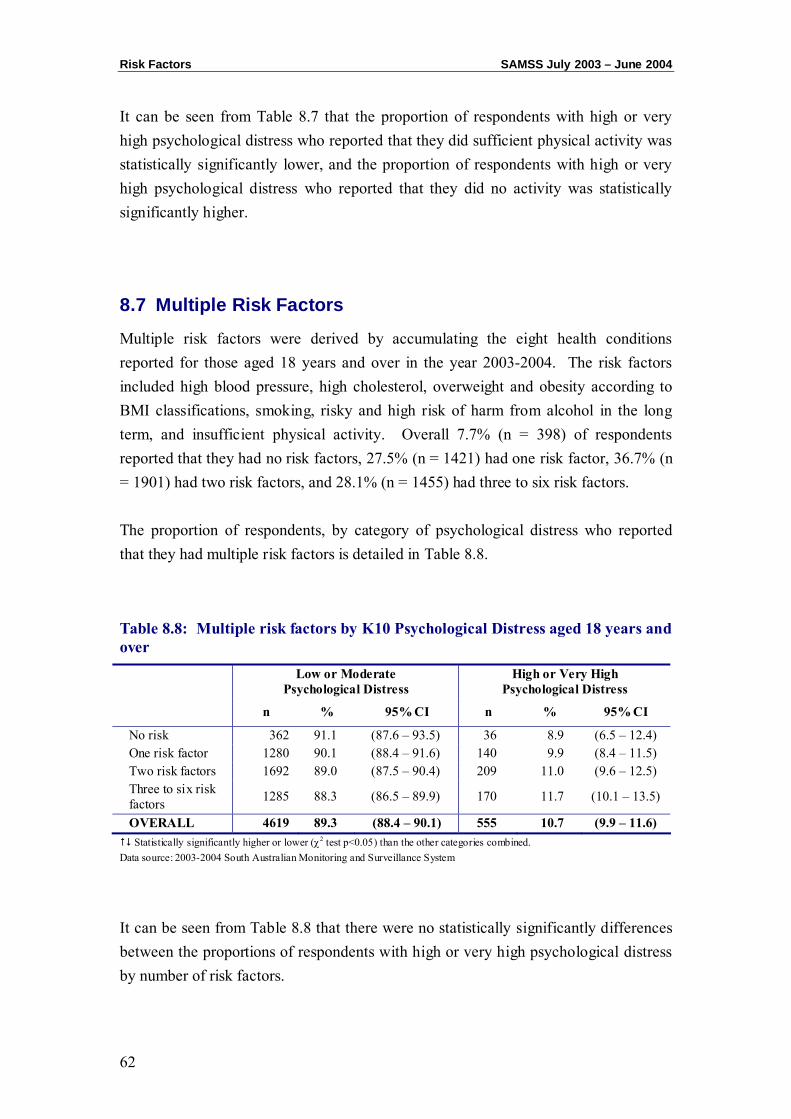
Risk Factors SAMSS July 2003 – June 2004
62
It can be seen from Table 8.7 that the proportion of respondents with high or very high psychological distress who reported that they did sufficient physical activity was statistically significantly lower, and the proportion of respondents with high or very high psychological distress who reported that they did no activity was statistically significantly higher.
8.7 Multiple Risk Factors
Multiple risk factors were derived by accumulating the eight health conditions reported for those aged 18 years and over in the year 2003-2004. The risk factors included high blood pressure, high cholesterol, overweight and obesity according to BMI classifications, smoking, risky and high risk of harm from alcohol in the long term, and insufficient physical activity. Overall 7.7% (n = 398) of respondents reported that they had no risk factors, 27.5% (n = 1421) had one risk factor, 36.7% (n = 1901) had two risk factors, and 28.1% (n = 1455) had three to six risk factors. The proportion of respondents, by category of psychological distress who reported that they had multiple risk factors is detailed in Table 8.8.
Table 8.8: Multiple risk factors by K10 Psychological Distress aged 18 years and over
Low or Moderate Psychological Distress
High or Very High Psychological Distress
n % 95% CI n % 95% CI
No risk 362 91.1 (87.6 – 93.5) 36 8.9 (6.5 – 12.4) One risk factor 1280 90.1 (88.4 – 91.6) 140 9.9 (8.4 – 11.5) Two risk factors 1692 89.0 (87.5 – 90.4) 209 11.0 (9.6 – 12.5) Three to six risk factors 1285 88.3 (86.5 – 89.9) 170 11.7 (10.1 – 13.5)
OVERALL 4619 89.3 (88.4 – 90.1) 555 10.7 (9.9 – 11.6) Statistically significantly higher or lower (χ2 test p<0.05) than the other categories combined.
Data source: 2003-2004 South Australian Monitoring and Surveillance System
It can be seen from Table 8.8 that there were no statistically significantly differences between the proportions of respondents with high or very high psychological distress by number of risk factors.
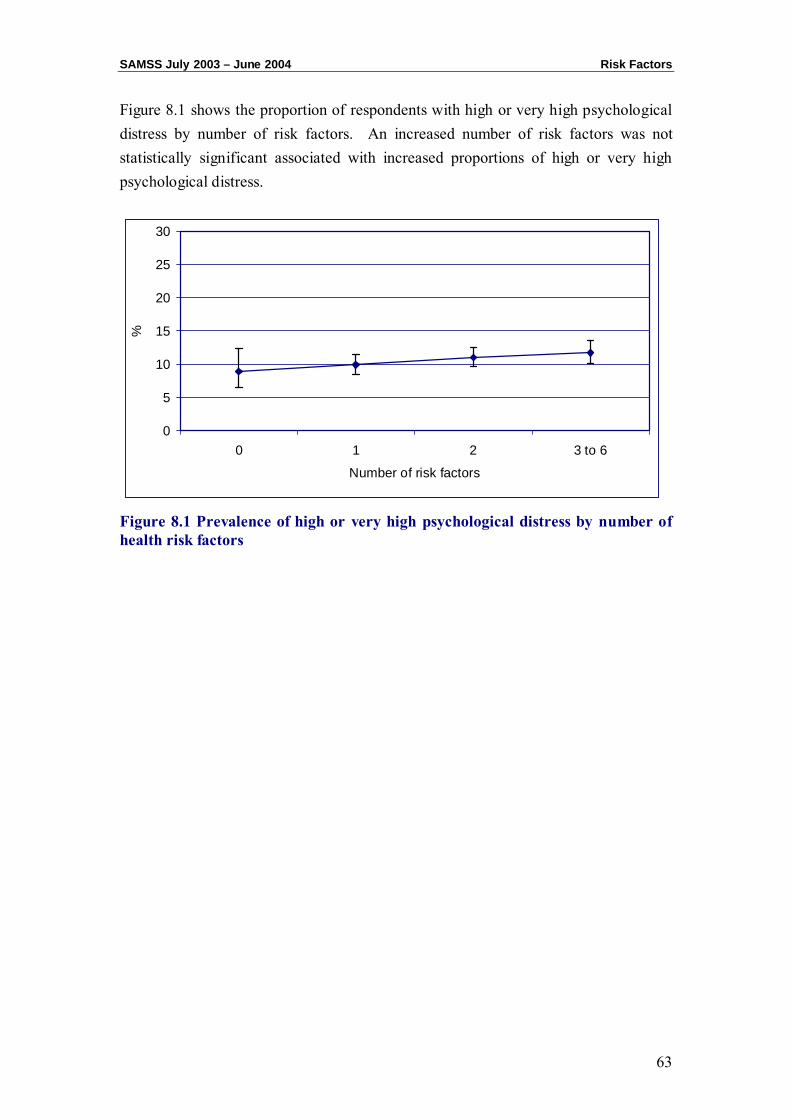
SAMSS July 2003 – June 2004 Risk Factors
63
Figure 8.1 shows the proportion of respondents with high or very high psychological distress by number of risk factors. An increased number of risk factors was not statistically significant associated with increased proportions of high or very high psychological distress.
Figure 8.1 Prevalence of high or very high psychological distress by number of health risk factors
0
5
10
15
20
25
30
0 1 2 3 to 6
Number of risk factors
%

Risk Factors SAMSS July 2003 – June 2004
64
CHAPTER 9: PSYCHOLOGICAL DISTRESS AND MENTAL HEALTH
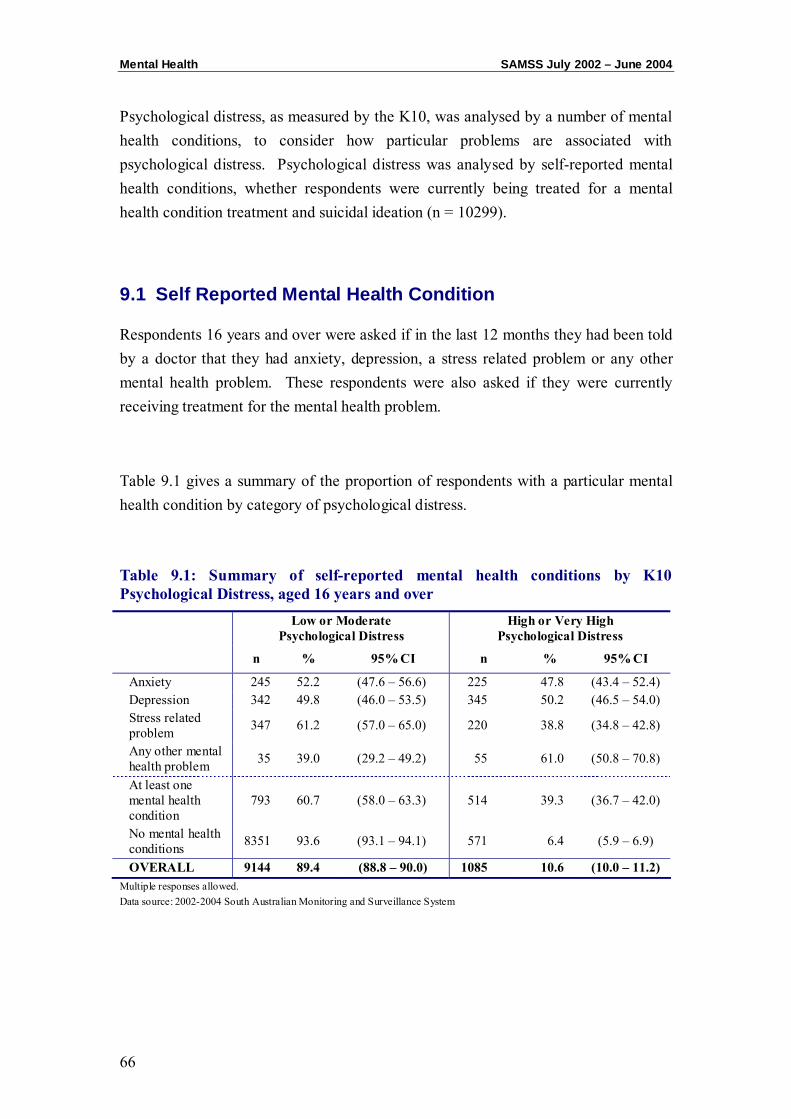
Mental Health SAMSS July 2002 – June 2004
66
Psychological distress, as measured by the K10, was analysed by a number of mental health conditions, to consider how particular problems are associated with psychological distress. Psychological distress was analysed by self-reported mental health conditions, whether respondents were currently being treated for a mental health condition treatment and suicidal ideation (n = 10299).
9.1 Self Reported Mental Health Condition
Respondents 16 years and over were asked if in the last 12 months they had been told by a doctor that they had anxiety, depression, a stress related problem or any other mental health problem. These respondents were also asked if they were currently receiving treatment for the mental health problem.
Table 9.1 gives a summary of the proportion of respondents with a particular mental health condition by category of psychological distress.
Table 9.1: Summary of self-reported mental health conditions by K10 Psychological Distress, aged 16 years and over
Low or Moderate Psychological Distress
High or Very High Psychological Distress
n % 95% CI n % 95% CI
Anxiety 245 52.2 (47.6 – 56.6) 225 47.8 (43.4 – 52.4) Depression 342 49.8 (46.0 – 53.5) 345 50.2 (46.5 – 54.0) Stress related problem 347 61.2 (57.0 – 65.0) 220 38.8 (34.8 – 42.8)
Any other mental health problem 35 39.0 (29.2 – 49.2) 55 61.0 (50.8 – 70.8)
At least one mental health condition
793 60.7 (58.0 – 63.3) 514 39.3 (36.7 – 42.0)
No mental health conditions 8351 93.6 (93.1 – 94.1) 571 6.4 (5.9 – 6.9)
OVERALL 9144 89.4 (88.8 – 90.0) 1085 10.6 (10.0 – 11.2) Multiple responses allowed. Data source: 2002-2004 South Australian Monitoring and Surveillance System
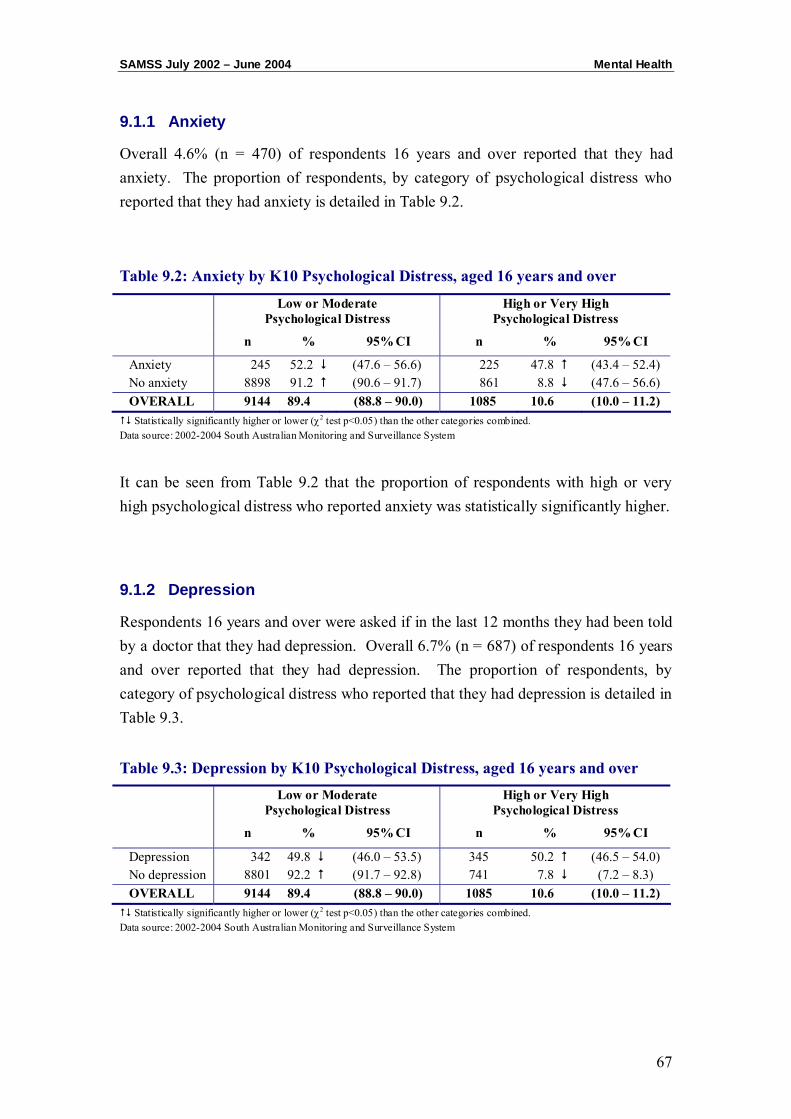
SAMSS July 2002 – June 2004 Mental Health
67
9.1.1 Anxiety
Overall 4.6% (n = 470) of respondents 16 years and over reported that they had anxiety. The proportion of respondents, by category of psychological distress who reported that they had anxiety is detailed in Table 9.2.
Table 9.2: Anxiety by K10 Psychological Distress, aged 16 years and over
Low or Moderate Psychological Distress
High or Very High Psychological Distress
n % 95% CI n % 95% CI
Anxiety 245 52.2 (47.6 – 56.6) 225 47.8 (43.4 – 52.4) No anxiety 8898 91.2 (90.6 – 91.7) 861 8.8 (47.6 – 56.6) OVERALL 9144 89.4 (88.8 – 90.0) 1085 10.6 (10.0 – 11.2) Statistically significantly higher or lower (χ2 test p<0.05) than the other categories combined.
Data source: 2002-2004 South Australian Monitoring and Surveillance System
It can be seen from Table 9.2 that the proportion of respondents with high or very high psychological distress who reported anxiety was statistically significantly higher.
9.1.2 Depression
Respondents 16 years and over were asked if in the last 12 months they had been told by a doctor that they had depression. Overall 6.7% (n = 687) of respondents 16 years and over reported that they had depression. The proportion of respondents, by category of psychological distress who reported that they had depression is detailed in Table 9.3.
Table 9.3: Depression by K10 Psychological Distress, aged 16 years and over
Low or Moderate Psychological Distress
High or Very High Psychological Distress
n % 95% CI n % 95% CI
Depression 342 49.8 (46.0 – 53.5) 345 50.2 (46.5 – 54.0) No depression 8801 92.2 (91.7 – 92.8) 741 7.8 (7.2 – 8.3) OVERALL 9144 89.4 (88.8 – 90.0) 1085 10.6 (10.0 – 11.2) Statistically significantly higher or lower (χ2 test p<0.05) than the other categories combined.
Data source: 2002-2004 South Australian Monitoring and Surveillance System
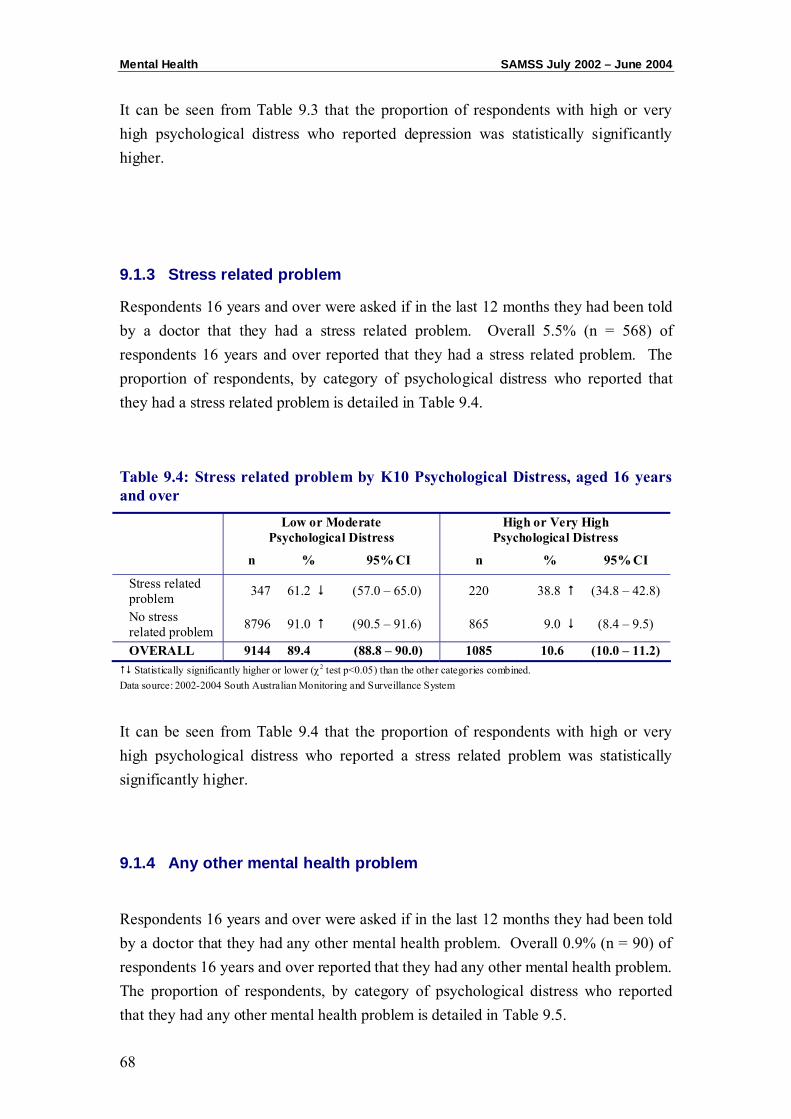
Mental Health SAMSS July 2002 – June 2004
68
It can be seen from Table 9.3 that the proportion of respondents with high or very high psychological distress who reported depression was statistically significantly higher.
9.1.3 Stress related problem
Respondents 16 years and over were asked if in the last 12 months they had been told by a doctor that they had a stress related problem. Overall 5.5% (n = 568) of respondents 16 years and over reported that they had a stress related problem. The proportion of respondents, by category of psychological distress who reported that they had a stress related problem is detailed in Table 9.4.
Table 9.4: Stress related problem by K10 Psychological Distress, aged 16 years and over
Low or Moderate Psychological Distress
High or Very High Psychological Distress
n % 95% CI n % 95% CI
Stress related problem 347 61.2 (57.0 – 65.0) 220 38.8 (34.8 – 42.8)
No stress related problem 8796 91.0 (90.5 – 91.6) 865 9.0 (8.4 – 9.5)
OVERALL 9144 89.4 (88.8 – 90.0) 1085 10.6 (10.0 – 11.2) Statistically significantly higher or lower (χ2 test p<0.05) than the other categories combined.
Data source: 2002-2004 South Australian Monitoring and Surveillance System
It can be seen from Table 9.4 that the proportion of respondents with high or very high psychological distress who reported a stress related problem was statistically significantly higher.
9.1.4 Any other mental health problem
Respondents 16 years and over were asked if in the last 12 months they had been told by a doctor that they had any other mental health problem. Overall 0.9% (n = 90) of respondents 16 years and over reported that they had any other mental health problem. The proportion of respondents, by category of psychological distress who reported that they had any other mental health problem is detailed in Table 9.5.

SAMSS July 2002 – June 2004 Mental Health
69
Table 9.5: Any other mental health problem by K10 Psychological Distress, aged 16 and over
Low or Moderate Psychological Distress
High or Very High Psychological Distress
n % 95% CI n % 95% CI
Any other mental health problem
35 39.0 (29.2 – 49.2) 55 61.0 (50.8 – 70.8)
No other mental health problem
9109 89.8 (89.2 – 90.4) 1030 10.2 (9.6 – 10.8)
OVERALL 9144 89.4 (88.8 – 90.0) 1085 10.6 (10.0 – 11.2) Statistically significantly higher or lower (χ2 test p<0.05) than the other categories combined.
Data source: 2002-2004 South Australian Monitoring and Surveillance System
It can be seen from Table 9.5 that the proportion of respondents with high or very high psychological distress who reported they had any other mental health problem was statistically significantly higher.
9.1.5 Mental health condition treatment
Respondents 16 years and over were asked if in they were current receiving treatment for anxiety, depression, stress related problems or any other mental health problem. Overall 7.8% (n = 794) of respondents 16 years and over reported that they were currently receiving treatment. The proportion of respondents, by category of psychological distress who reported that they were currently receiving treatment is detailed in Table 9.6.
Table 9.6: Current treatment for mental health problem by K10 Psychological Distress, aged 16 years and over
Low or Moderate Psychological Distress
High or Very High Psychological Distress
n % 95% CI n % 95% CI
Treatment 437 55.0 (51.6 – 58.5) 357 45.0 (41.5 – 48.4) No treatment / Refused 8707 92.3 (91.6 – 92.7) 728 7.7 (7.2 – 8.3)
OVERALL 9144 89.4 (88.8 – 90.0) 1085 10.6 (10.0 – 11.2) Statistically significantly higher or lower (χ2 test p<0.05) than the other categories combined.
Data source: 2002-2004 South Australian Monitoring and Surveillance System
It can be seen from Table 9.6 that the proportion of respondents with high or very high psychological distress who reported they were currently receiving treatment for a mental health problem was statistically significantly higher.
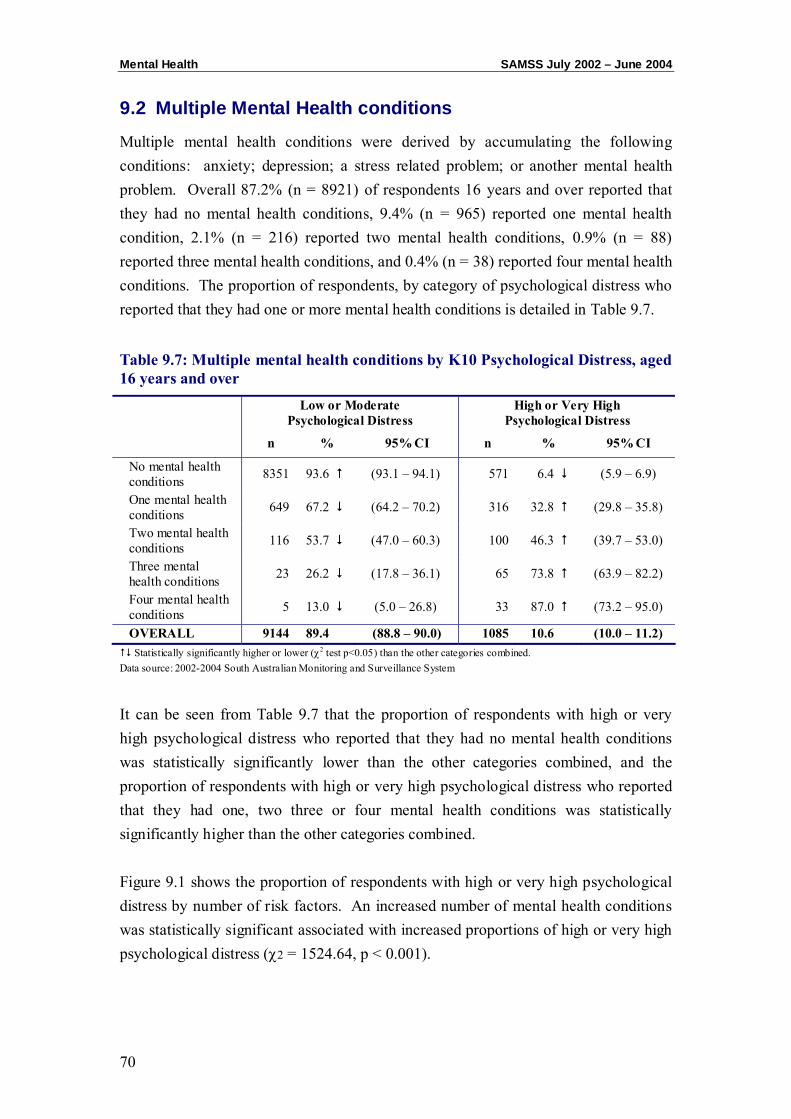
Mental Health SAMSS July 2002 – June 2004
70
9.2 Multiple Mental Health conditions
Multiple mental health conditions were derived by accumulating the following conditions: anxiety; depression; a stress related problem; or another mental health problem. Overall 87.2% (n = 8921) of respondents 16 years and over reported that they had no mental health conditions, 9.4% (n = 965) reported one mental health condition, 2.1% (n = 216) reported two mental health conditions, 0.9% (n = 88) reported three mental health conditions, and 0.4% (n = 38) reported four mental health conditions. The proportion of respondents, by category of psychological distress who reported that they had one or more mental health conditions is detailed in Table 9.7.
Table 9.7: Multiple mental health conditions by K10 Psychological Distress, aged 16 years and over
Low or Moderate Psychological Distress
High or Very High Psychological Distress
n % 95% CI n % 95% CI
No mental health conditions 8351 93.6 (93.1 – 94.1) 571 6.4 (5.9 – 6.9)
One mental health conditions 649 67.2 (64.2 – 70.2) 316 32.8 (29.8 – 35.8)
Two mental health conditions 116 53.7 (47.0 – 60.3) 100 46.3 (39.7 – 53.0)
Three mental health conditions 23 26.2 (17.8 – 36.1) 65 73.8 (63.9 – 82.2)
Four mental health conditions 5 13.0 (5.0 – 26.8) 33 87.0 (73.2 – 95.0)
OVERALL 9144 89.4 (88.8 – 90.0) 1085 10.6 (10.0 – 11.2) Statistically significantly higher or lower (χ2 test p<0.05) than the other categories combined.
Data source: 2002-2004 South Australian Monitoring and Surveillance System
It can be seen from Table 9.7 that the proportion of respondents with high or very high psychological distress who reported that they had no mental health conditions was statistically significantly lower than the other categories combined, and the proportion of respondents with high or very high psychological distress who reported that they had one, two three or four mental health conditions was statistically significantly higher than the other categories combined. Figure 9.1 shows the proportion of respondents with high or very high psychological distress by number of risk factors. An increased number of mental health conditions was statistically significant associated with increased proportions of high or very high psychological distress (χ2 = 1524.64, p < 0.001).
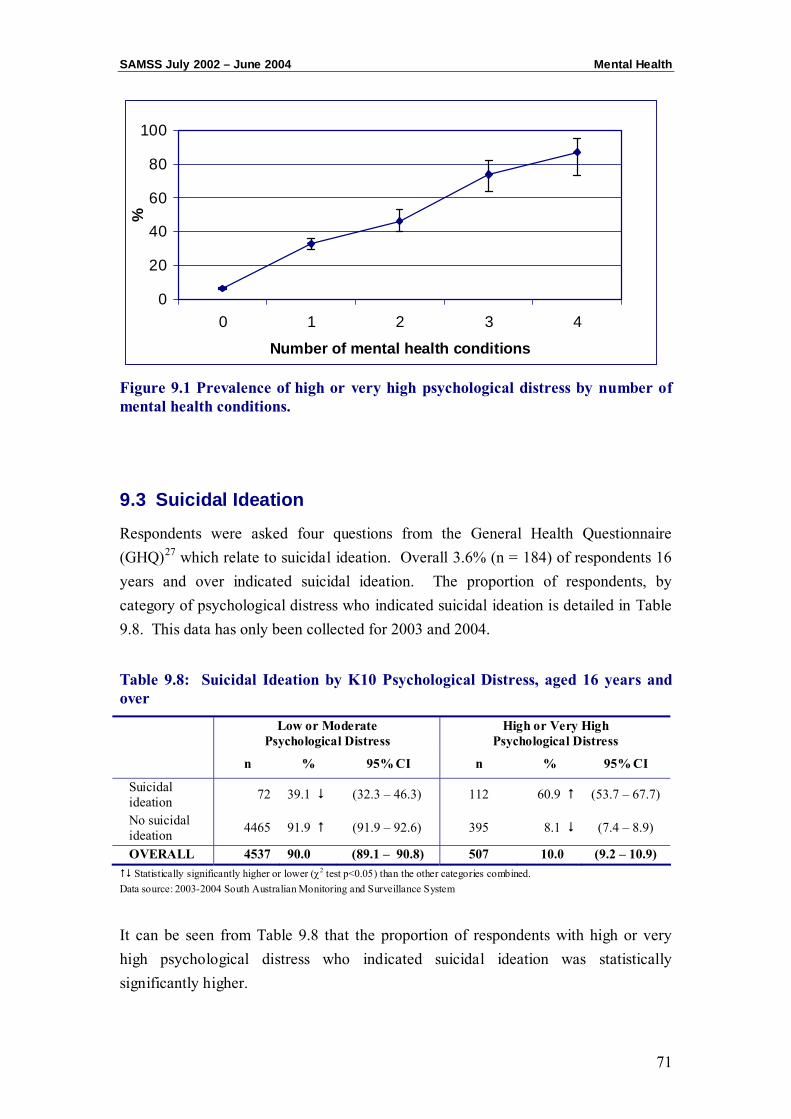
SAMSS July 2002 – June 2004 Mental Health
71
0
20
40
60
80
100
0 1 2 3 4
Number of mental health conditions
%
Figure 9.1 Prevalence of high or very high psychological distress by number of mental health conditions.
9.3 Suicidal Ideation
Respondents were asked four questions from the General Health Questionnaire (GHQ)27 which relate to suicidal ideation. Overall 3.6% (n = 184) of respondents 16 years and over indicated suicidal ideation. The proportion of respondents, by category of psychological distress who indicated suicidal ideation is detailed in Table 9.8. This data has only been collected for 2003 and 2004.
Table 9.8: Suicidal Ideation by K10 Psychological Distress, aged 16 years and over
Low or Moderate Psychological Distress
High or Very High Psychological Distress
n % 95% CI n % 95% CI
Suicidal ideation 72 39.1 (32.3 – 46.3) 112 60.9 (53.7 – 67.7)
No suicidal ideation 4465 91.9 (91.9 – 92.6) 395 8.1 (7.4 – 8.9)
OVERALL 4537 90.0 (89.1 – 90.8) 507 10.0 (9.2 – 10.9) Statistically significantly higher or lower (χ2 test p<0.05) than the other categories combined.
Data source: 2003-2004 South Australian Monitoring and Surveillance System
It can be seen from Table 9.8 that the proportion of respondents with high or very high psychological distress who indicated suicidal ideation was statistically significantly higher.
Mental Health SAMSS July 2002 – June 2004
72
CHAPTER 10: PSYCHOLOGICAL DISTRESS AND HEALTH SERVICES
UTILISATION
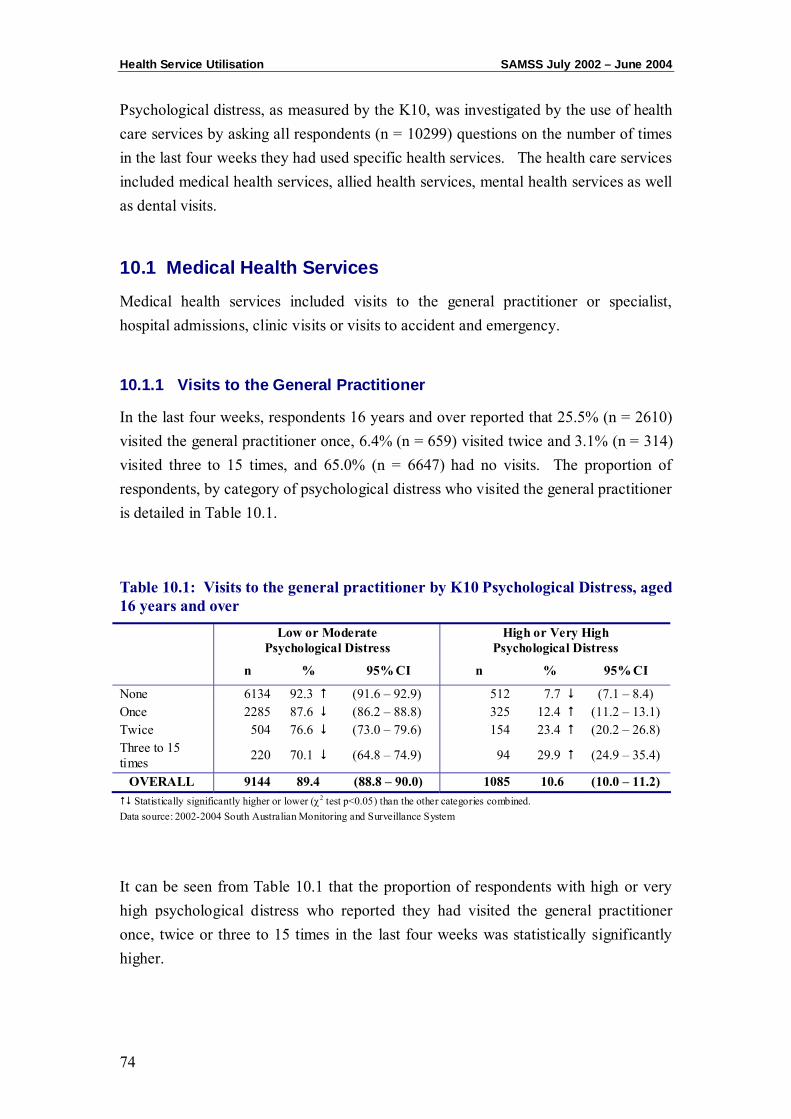
Health Service Utilisation SAMSS July 2002 – June 2004
74
Psychological distress, as measured by the K10, was investigated by the use of health care services by asking all respondents (n = 10299) questions on the number of times in the last four weeks they had used specific health services. The health care services included medical health services, allied health services, mental health services as well as dental visits.
10.1 Medical Health Services
Medical health services included visits to the general practitioner or specialist, hospital admissions, clinic visits or visits to accident and emergency.
10.1.1 Visits to the General Practitioner
In the last four weeks, respondents 16 years and over reported that 25.5% (n = 2610) visited the general practitioner once, 6.4% (n = 659) visited twice and 3.1% (n = 314) visited three to 15 times, and 65.0% (n = 6647) had no visits. The proportion of respondents, by category of psychological distress who visited the general practitioner is detailed in Table 10.1.
Table 10.1: Visits to the general practitioner by K10 Psychological Distress, aged 16 years and over
Low or Moderate Psychological Distress
High or Very High Psychological Distress
n % 95% CI n % 95% CI
None 6134 92.3 (91.6 – 92.9) 512 7.7 (7.1 – 8.4) Once 2285 87.6 (86.2 – 88.8) 325 12.4 (11.2 – 13.1) Twice 504 76.6 (73.0 – 79.6) 154 23.4 (20.2 – 26.8) Three to 15 times 220 70.1 (64.8 – 74.9) 94 29.9 (24.9 – 35.4)
OVERALL 9144 89.4 (88.8 – 90.0) 1085 10.6 (10.0 – 11.2) Statistically significantly higher or lower (χ2 test p<0.05) than the other categories combined.
Data source: 2002-2004 South Australian Monitoring and Surveillance System
It can be seen from Table 10.1 that the proportion of respondents with high or very high psychological distress who reported they had visited the general practitioner once, twice or three to 15 times in the last four weeks was statistically significantly higher.
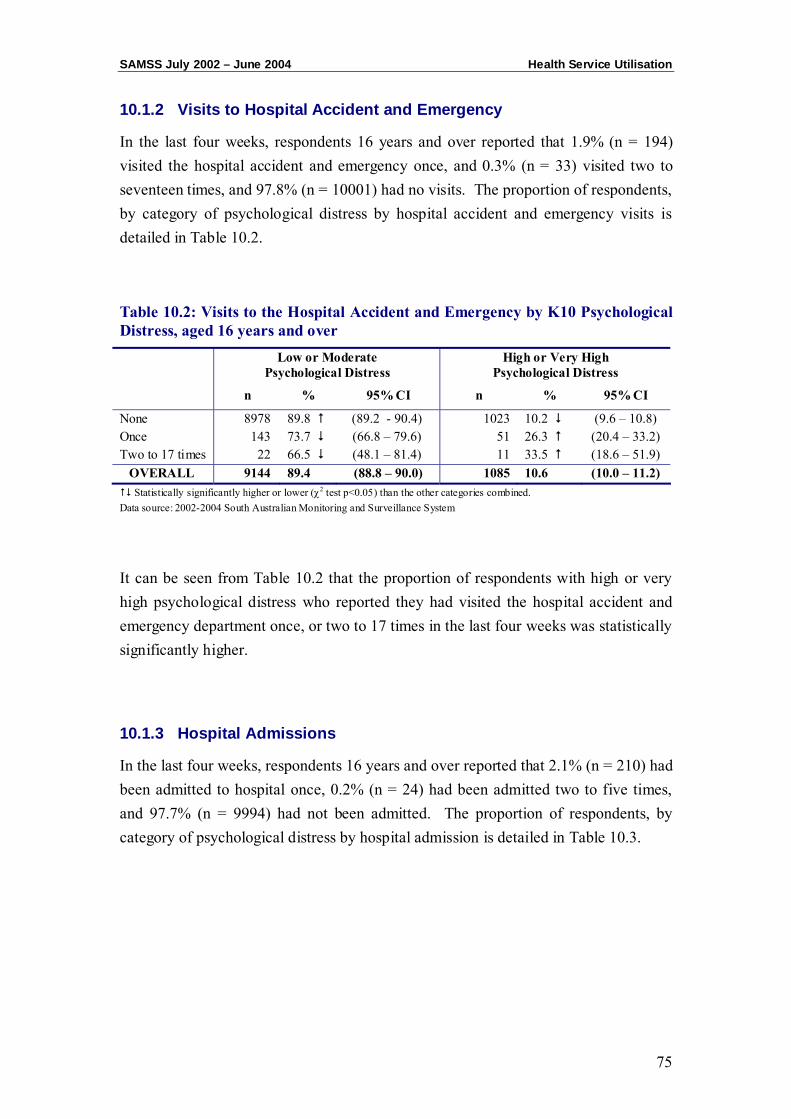
SAMSS July 2002 – June 2004 Health Service Utilisation
75
10.1.2 Visits to Hospital Accident and Emergency
In the last four weeks, respondents 16 years and over reported that 1.9% (n = 194) visited the hospital accident and emergency once, and 0.3% (n = 33) visited two to seventeen times, and 97.8% (n = 10001) had no visits. The proportion of respondents, by category of psychological distress by hospital accident and emergency visits is detailed in Table 10.2.
Table 10.2: Visits to the Hospital Accident and Emergency by K10 Psychological Distress, aged 16 years and over
Low or Moderate Psychological Distress
High or Very High Psychological Distress
n % 95% CI n % 95% CI
None 8978 89.8 (89.2 - 90.4) 1023 10.2 (9.6 – 10.8) Once 143 73.7 (66.8 – 79.6) 51 26.3 (20.4 – 33.2) Two to 17 times 22 66.5 (48.1 – 81.4) 11 33.5 (18.6 – 51.9)
OVERALL 9144 89.4 (88.8 – 90.0) 1085 10.6 (10.0 – 11.2) Statistically significantly higher or lower (χ2 test p<0.05) than the other categories combined.
Data source: 2002-2004 South Australian Monitoring and Surveillance System
It can be seen from Table 10.2 that the proportion of respondents with high or very high psychological distress who reported they had visited the hospital accident and emergency department once, or two to 17 times in the last four weeks was statistically significantly higher.
10.1.3 Hospital Admissions
In the last four weeks, respondents 16 years and over reported that 2.1% (n = 210) had been admitted to hospital once, 0.2% (n = 24) had been admitted two to five times, and 97.7% (n = 9994) had not been admitted. The proportion of respondents, by category of psychological distress by hospital admission is detailed in Table 10.3.
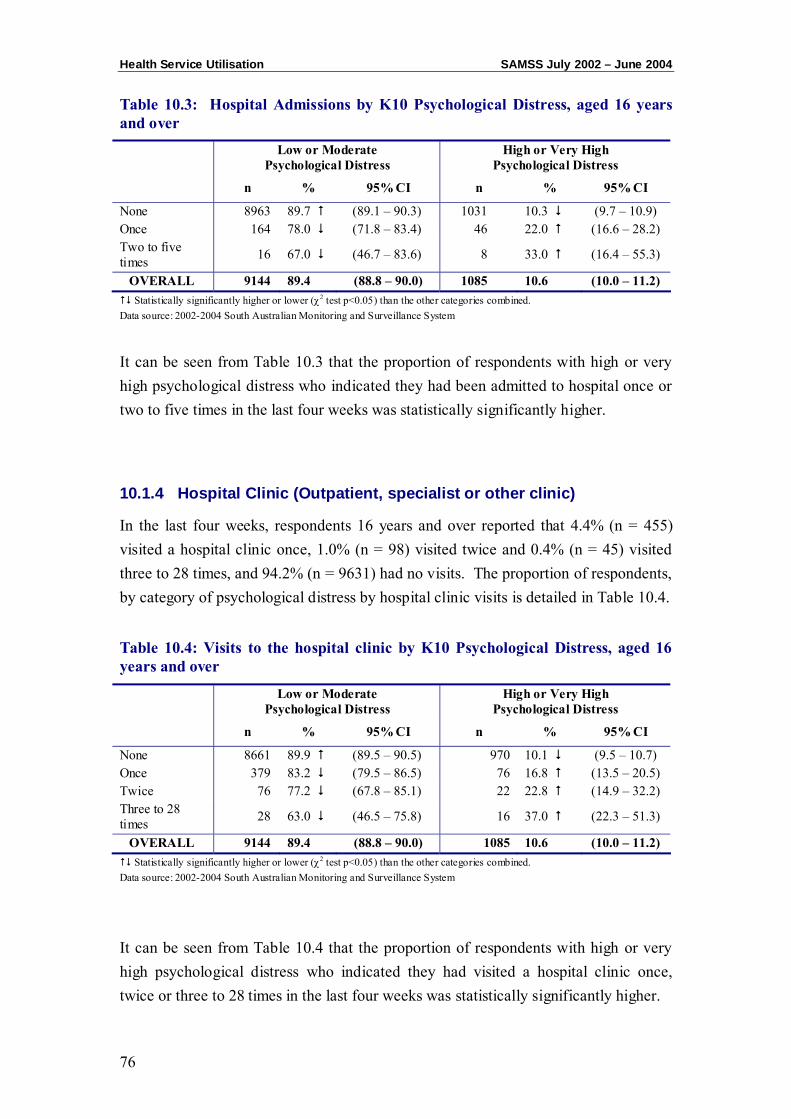
Health Service Utilisation SAMSS July 2002 – June 2004
76
Table 10.3: Hospital Admissions by K10 Psychological Distress, aged 16 years and over
Low or Moderate Psychological Distress
High or Very High Psychological Distress
n % 95% CI n % 95% CI
None 8963 89.7 (89.1 – 90.3) 1031 10.3 (9.7 – 10.9) Once 164 78.0 (71.8 – 83.4) 46 22.0 (16.6 – 28.2) Two to five times 16 67.0 (46.7 – 83.6) 8 33.0 (16.4 – 55.3)
OVERALL 9144 89.4 (88.8 – 90.0) 1085 10.6 (10.0 – 11.2) Statistically significantly higher or lower (χ2 test p<0.05) than the other categories combined.
Data source: 2002-2004 South Australian Monitoring and Surveillance System
It can be seen from Table 10.3 that the proportion of respondents with high or very high psychological distress who indicated they had been admitted to hospital once or two to five times in the last four weeks was statistically significantly higher.
10.1.4 Hospital Clinic (Outpatient, specialist or other clinic)
In the last four weeks, respondents 16 years and over reported that 4.4% (n = 455) visited a hospital clinic once, 1.0% (n = 98) visited twice and 0.4% (n = 45) visited three to 28 times, and 94.2% (n = 9631) had no visits. The proportion of respondents, by category of psychological distress by hospital clinic visits is detailed in Table 10.4.
Table 10.4: Visits to the hospital clinic by K10 Psychological Distress, aged 16 years and over
Low or Moderate Psychological Distress
High or Very High Psychological Distress
n % 95% CI n % 95% CI
None 8661 89.9 (89.5 – 90.5) 970 10.1 (9.5 – 10.7) Once 379 83.2 (79.5 – 86.5) 76 16.8 (13.5 – 20.5) Twice 76 77.2 (67.8 – 85.1) 22 22.8 (14.9 – 32.2) Three to 28 times 28 63.0 (46.5 – 75.8) 16 37.0 (22.3 – 51.3)
OVERALL 9144 89.4 (88.8 – 90.0) 1085 10.6 (10.0 – 11.2) Statistically significantly higher or lower (χ2 test p<0.05) than the other categories combined.
Data source: 2002-2004 South Australian Monitoring and Surveillance System
It can be seen from Table 10.4 that the proportion of respondents with high or very high psychological distress who indicated they had visited a hospital clinic once, twice or three to 28 times in the last four weeks was statistically significantly higher.
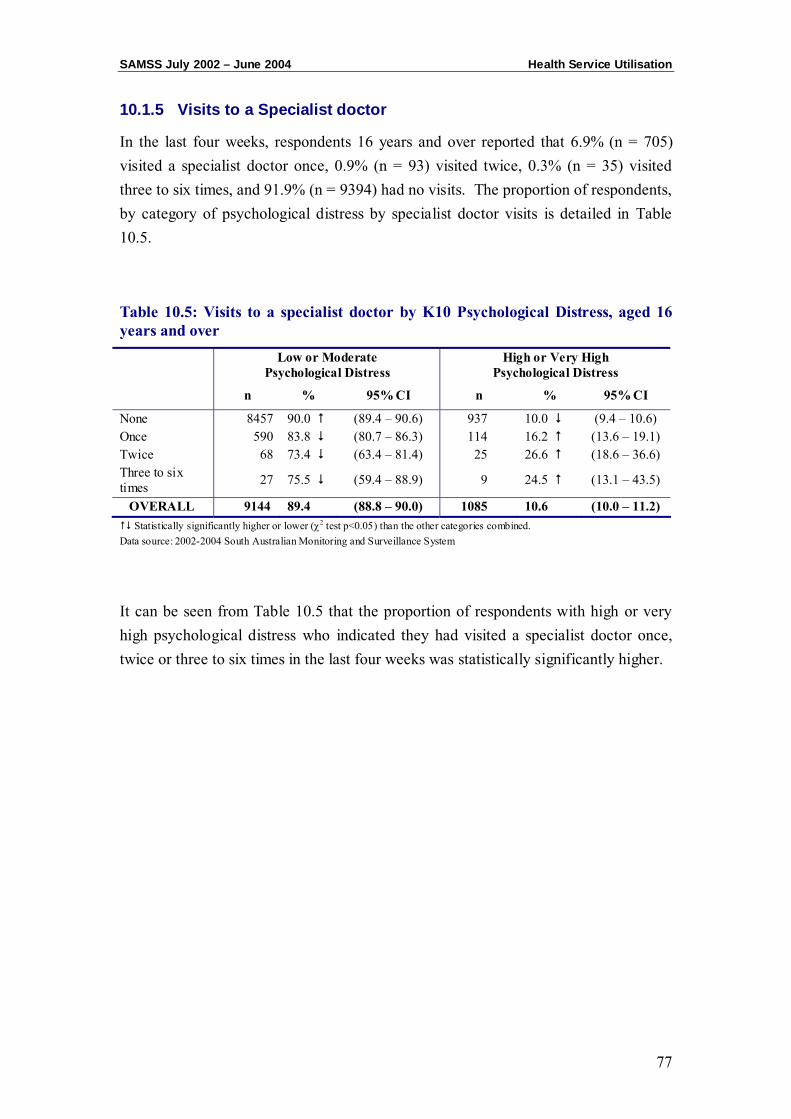
SAMSS July 2002 – June 2004 Health Service Utilisation
77
10.1.5 Visits to a Specialist doctor
In the last four weeks, respondents 16 years and over reported that 6.9% (n = 705) visited a specialist doctor once, 0.9% (n = 93) visited twice, 0.3% (n = 35) visited three to six times, and 91.9% (n = 9394) had no visits. The proportion of respondents, by category of psychological distress by specialist doctor visits is detailed in Table 10.5.
Table 10.5: Visits to a specialist doctor by K10 Psychological Distress, aged 16 years and over
Low or Moderate Psychological Distress
High or Very High Psychological Distress
n % 95% CI n % 95% CI
None 8457 90.0 (89.4 – 90.6) 937 10.0 (9.4 – 10.6) Once 590 83.8 (80.7 – 86.3) 114 16.2 (13.6 – 19.1) Twice 68 73.4 (63.4 – 81.4) 25 26.6 (18.6 – 36.6) Three to six times 27 75.5 (59.4 – 88.9) 9 24.5 (13.1 – 43.5)
OVERALL 9144 89.4 (88.8 – 90.0) 1085 10.6 (10.0 – 11.2) Statistically significantly higher or lower (χ2 test p<0.05) than the other categories combined.
Data source: 2002-2004 South Australian Monitoring and Surveillance System
It can be seen from Table 10.5 that the proportion of respondents with high or very high psychological distress who indicated they had visited a specialist doctor once, twice or three to six times in the last four weeks was statistically significantly higher.
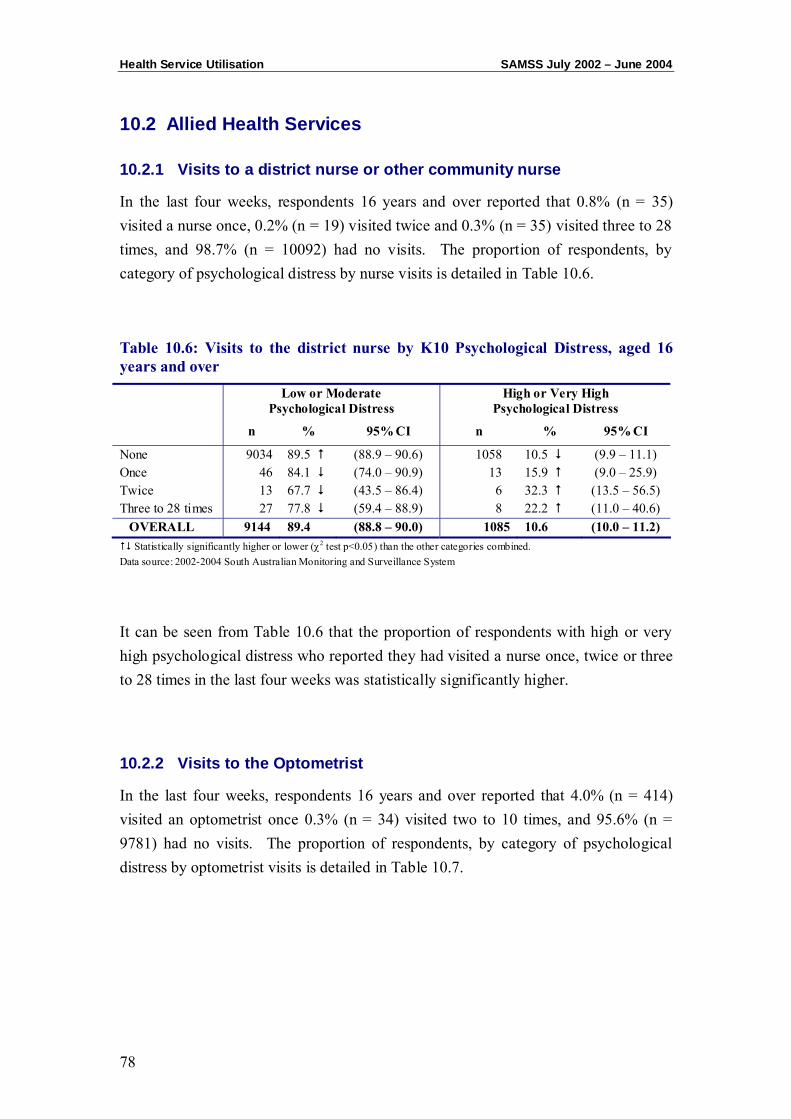
Health Service Utilisation SAMSS July 2002 – June 2004
78
10.2 Allied Health Services
10.2.1 Visits to a district nurse or other community nurse
In the last four weeks, respondents 16 years and over reported that 0.8% (n = 35) visited a nurse once, 0.2% (n = 19) visited twice and 0.3% (n = 35) visited three to 28 times, and 98.7% (n = 10092) had no visits. The proportion of respondents, by category of psychological distress by nurse visits is detailed in Table 10.6.
Table 10.6: Visits to the district nurse by K10 Psychological Distress, aged 16 years and over
Low or Moderate Psychological Distress
High or Very High Psychological Distress
n % 95% CI n % 95% CI
None 9034 89.5 (88.9 – 90.6) 1058 10.5 (9.9 – 11.1) Once 46 84.1 (74.0 – 90.9) 13 15.9 (9.0 – 25.9) Twice 13 67.7 (43.5 – 86.4) 6 32.3 (13.5 – 56.5) Three to 28 times 27 77.8 (59.4 – 88.9) 8 22.2 (11.0 – 40.6)
OVERALL 9144 89.4 (88.8 – 90.0) 1085 10.6 (10.0 – 11.2) Statistically significantly higher or lower (χ2 test p<0.05) than the other categories combined.
Data source: 2002-2004 South Australian Monitoring and Surveillance System
It can be seen from Table 10.6 that the proportion of respondents with high or very high psychological distress who reported they had visited a nurse once, twice or three to 28 times in the last four weeks was statistically significantly higher.
10.2.2 Visits to the Optometrist
In the last four weeks, respondents 16 years and over reported that 4.0% (n = 414) visited an optometrist once 0.3% (n = 34) visited two to 10 times, and 95.6% (n = 9781) had no visits. The proportion of respondents, by category of psychological distress by optometrist visits is detailed in Table 10.7.
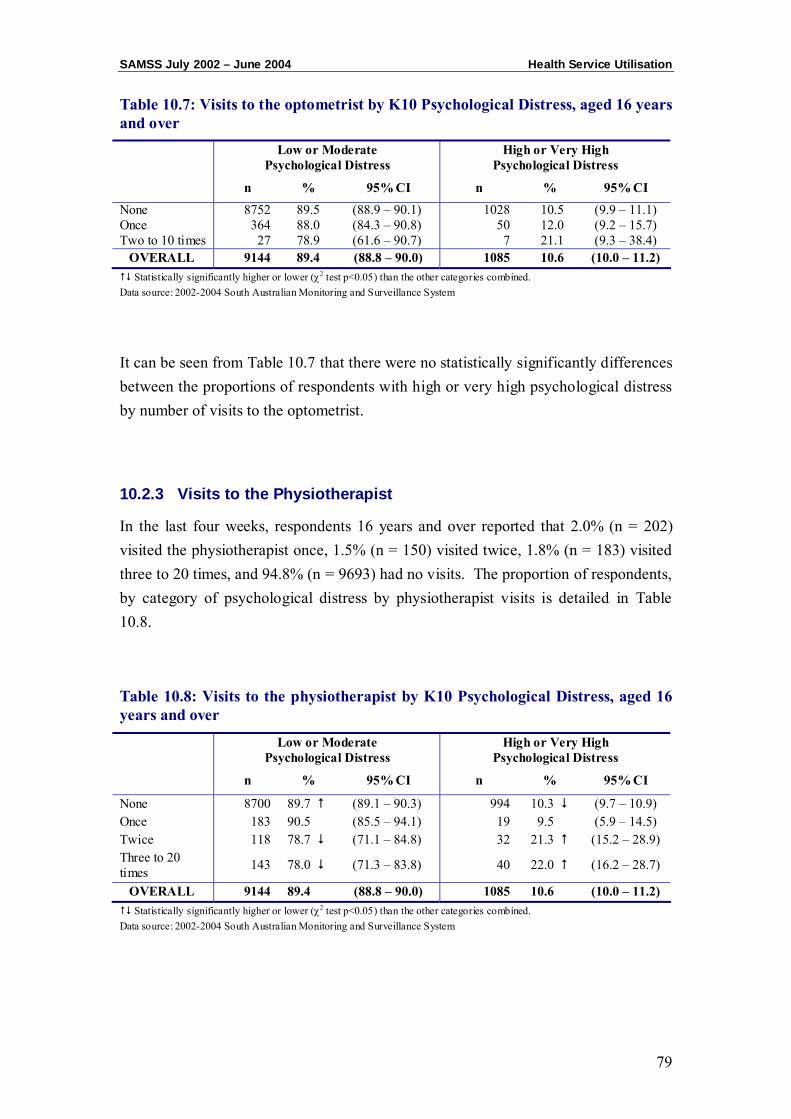
SAMSS July 2002 – June 2004 Health Service Utilisation
79
Table 10.7: Visits to the optometrist by K10 Psychological Distress, aged 16 years and over
Low or Moderate Psychological Distress
High or Very High Psychological Distress
n % 95% CI n % 95% CI
None 8752 89.5 (88.9 – 90.1) 1028 10.5 (9.9 – 11.1) Once 364 88.0 (84.3 – 90.8) 50 12.0 (9.2 – 15.7) Two to 10 times 27 78.9 (61.6 – 90.7) 7 21.1 (9.3 – 38.4)
OVERALL 9144 89.4 (88.8 – 90.0) 1085 10.6 (10.0 – 11.2) Statistically significantly higher or lower (χ2 test p<0.05) than the other categories combined.
Data source: 2002-2004 South Australian Monitoring and Surveillance System
It can be seen from Table 10.7 that there were no statistically significantly differences between the proportions of respondents with high or very high psychological distress by number of visits to the optometrist.
10.2.3 Visits to the Physiotherapist
In the last four weeks, respondents 16 years and over reported that 2.0% (n = 202) visited the physiotherapist once, 1.5% (n = 150) visited twice, 1.8% (n = 183) visited three to 20 times, and 94.8% (n = 9693) had no visits. The proportion of respondents, by category of psychological distress by physiotherapist visits is detailed in Table 10.8.
Table 10.8: Visits to the physiotherapist by K10 Psychological Distress, aged 16 years and over
Low or Moderate Psychological Distress
High or Very High Psychological Distress
n % 95% CI n % 95% CI
None 8700 89.7 (89.1 – 90.3) 994 10.3 (9.7 – 10.9) Once 183 90.5 (85.5 – 94.1) 19 9.5 (5.9 – 14.5) Twice 118 78.7 (71.1 – 84.8) 32 21.3 (15.2 – 28.9) Three to 20 times 143 78.0 (71.3 – 83.8) 40 22.0 (16.2 – 28.7)
OVERALL 9144 89.4 (88.8 – 90.0) 1085 10.6 (10.0 – 11.2) Statistically significantly higher or lower (χ2 test p<0.05) than the other categories combined.
Data source: 2002-2004 South Australian Monitoring and Surveillance System
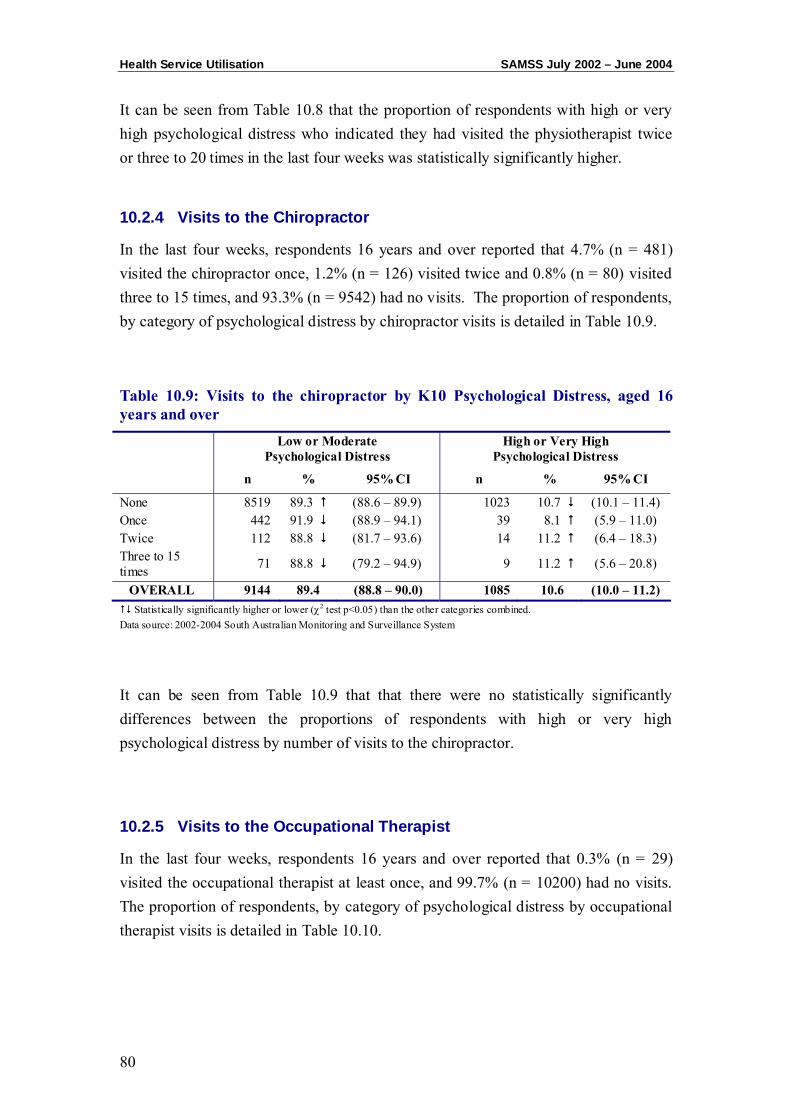
Health Service Utilisation SAMSS July 2002 – June 2004
80
It can be seen from Table 10.8 that the proportion of respondents with high or very high psychological distress who indicated they had visited the physiotherapist twice or three to 20 times in the last four weeks was statistically significantly higher.
10.2.4 Visits to the Chiropractor
In the last four weeks, respondents 16 years and over reported that 4.7% (n = 481) visited the chiropractor once, 1.2% (n = 126) visited twice and 0.8% (n = 80) visited three to 15 times, and 93.3% (n = 9542) had no visits. The proportion of respondents, by category of psychological distress by chiropractor visits is detailed in Table 10.9.
Table 10.9: Visits to the chiropractor by K10 Psychological Distress, aged 16 years and over
Low or Moderate Psychological Distress
High or Very High Psychological Distress
n % 95% CI n % 95% CI
None 8519 89.3 (88.6 – 89.9) 1023 10.7 (10.1 – 11.4) Once 442 91.9 (88.9 – 94.1) 39 8.1 (5.9 – 11.0) Twice 112 88.8 (81.7 – 93.6) 14 11.2 (6.4 – 18.3) Three to 15 times 71 88.8 (79.2 – 94.9) 9 11.2 (5.6 – 20.8)
OVERALL 9144 89.4 (88.8 – 90.0) 1085 10.6 (10.0 – 11.2) Statistically significantly higher or lower (χ2 test p<0.05) than the other categories combined.
Data source: 2002-2004 South Australian Monitoring and Surveillance System
It can be seen from Table 10.9 that that there were no statistically significantly differences between the proportions of respondents with high or very high psychological distress by number of visits to the chiropractor.
10.2.5 Visits to the Occupational Therapist
In the last four weeks, respondents 16 years and over reported that 0.3% (n = 29) visited the occupational therapist at least once, and 99.7% (n = 10200) had no visits. The proportion of respondents, by category of psychological distress by occupational therapist visits is detailed in Table 10.10.
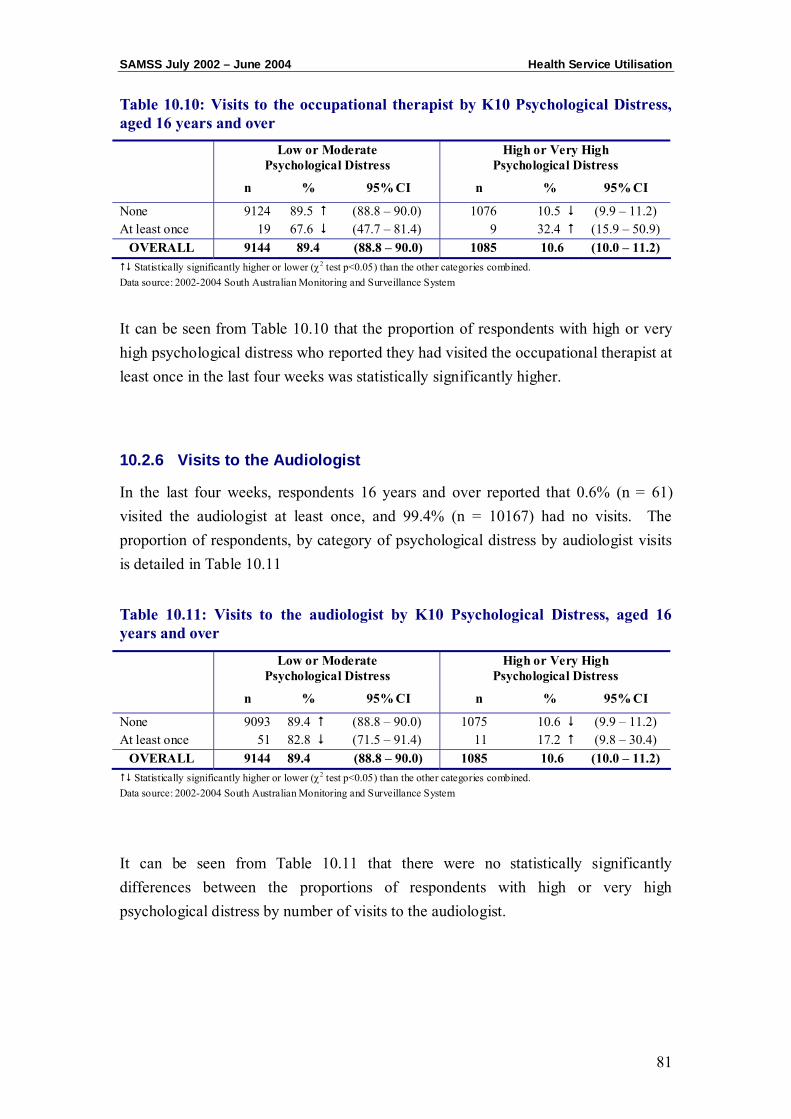
SAMSS July 2002 – June 2004 Health Service Utilisation
81
Table 10.10: Visits to the occupational therapist by K10 Psychological Distress, aged 16 years and over
Low or Moderate Psychological Distress
High or Very High Psychological Distress
n % 95% CI n % 95% CI
None 9124 89.5 (88.8 – 90.0) 1076 10.5 (9.9 – 11.2) At least once 19 67.6 (47.7 – 81.4) 9 32.4 (15.9 – 50.9)
OVERALL 9144 89.4 (88.8 – 90.0) 1085 10.6 (10.0 – 11.2) Statistically significantly higher or lower (χ2 test p<0.05) than the other categories combined.
Data source: 2002-2004 South Australian Monitoring and Surveillance System
It can be seen from Table 10.10 that the proportion of respondents with high or very high psychological distress who reported they had visited the occupational therapist at least once in the last four weeks was statistically significantly higher.
10.2.6 Visits to the Audiologist
In the last four weeks, respondents 16 years and over reported that 0.6% (n = 61) visited the audiologist at least once, and 99.4% (n = 10167) had no visits. The proportion of respondents, by category of psychological distress by audiologist visits is detailed in Table 10.11
Table 10.11: Visits to the audiologist by K10 Psychological Distress, aged 16 years and over
Low or Moderate Psychological Distress
High or Very High Psychological Distress
n % 95% CI n % 95% CI
None 9093 89.4 (88.8 – 90.0) 1075 10.6 (9.9 – 11.2) At least once 51 82.8 (71.5 – 91.4) 11 17.2 (9.8 – 30.4)
OVERALL 9144 89.4 (88.8 – 90.0) 1085 10.6 (10.0 – 11.2) Statistically significantly higher or lower (χ2 test p<0.05) than the other categories combined.
Data source: 2002-2004 South Australian Monitoring and Surveillance System
It can be seen from Table 10.11 that there were no statistically significantly differences between the proportions of respondents with high or very high psychological distress by number of visits to the audiologist.

Health Service Utilisation SAMSS July 2002 – June 2004
82
10.2.7 Visits to an Alternative Therapist
In the last four weeks, respondents 16 years and over reported that 1.9% (n = 195) visited an alternative therapist once, 1.9% (n = 61) visited twice and 0.3% (n = 31) visited three to 12 times, and 97.2% (n = 9941) had no visits. The proportion of respondents, by category of psychological distress by alternative therapist visits is detailed in Table 10.12.
Table 10.12: Visits to the alternative therapist by K10 Psychological Distress, aged 16 years and over
Low or Moderate Psychological Distress
High or Very High Psychological Distress
n % 95% CI n % 95% CI
None 8908 89.6 (88.9 – 90.2) 1034 10.4 (9.8 – 11.0) Once 170 87.3 (81.5 – 91.4) 25 12.7 (8.6 – 18.5) Twice 45 72.7 (60.7 – 83.8) 17 27.3 (17.5 – 41.0) Three to 12 times 21 68.4 (48.5 – 82.6) 10 31.6 (48.5 – 82.7)
OVERALL 9144 89.4 (88.8 – 90.0) 1085 10.6 (10.0 – 11.2) Statistically significantly higher or lower (χ2 test p<0.05) than the other categories combined.
Data source: 2002-2004 South Australian Monitoring and Surveillance System
It can be seen from Table 10.12 that the proportion of respondents with high or very high psychological distress who indicated they had visited the alternative therapist twice or three to 12 times in the last four weeks was statistically significantly higher.
10.3 Mental Health Services
10.3.1 Visits to the Psychologist
In the last four weeks, respondents 16 years and over reported that 0.7% (n = 71) visited a psychologist once, 0.3% (n = 29) visited two to eight times and 65.0% (n = 10129) had no visits. The proportion of respondents, by category of psychological distress by psychologist visits is detailed in Table 10.13.
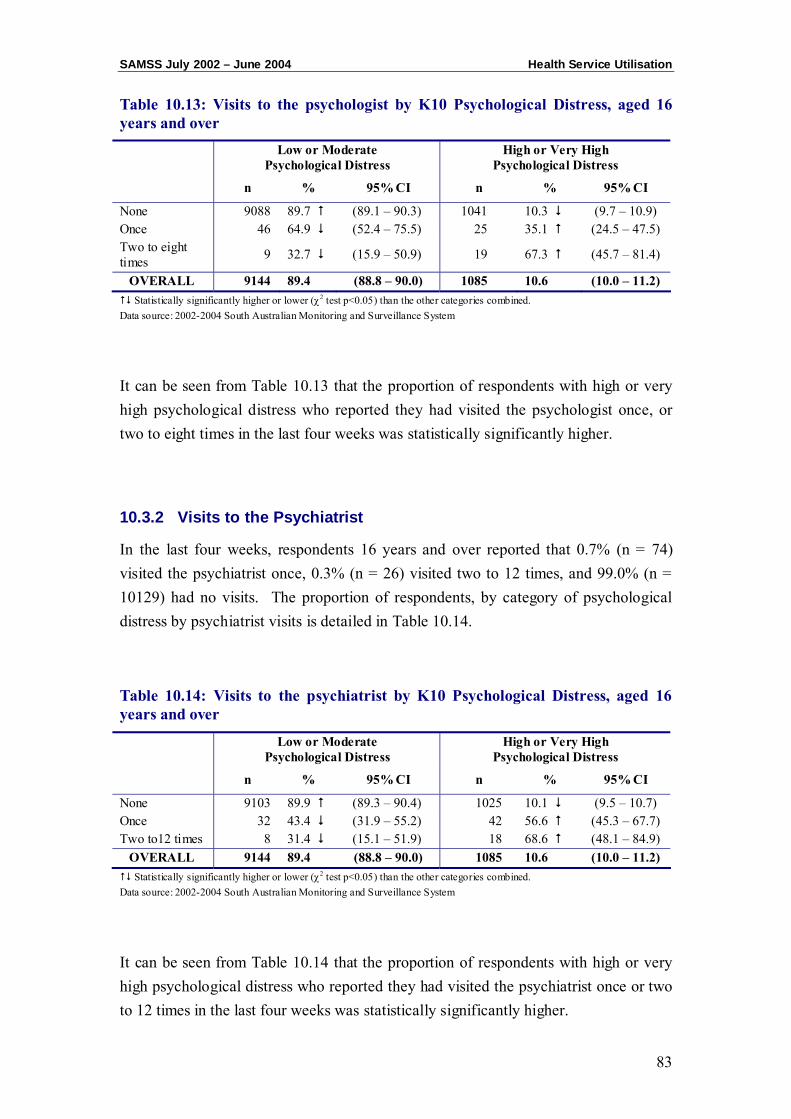
SAMSS July 2002 – June 2004 Health Service Utilisation
83
Table 10.13: Visits to the psychologist by K10 Psychological Distress, aged 16 years and over
Low or Moderate Psychological Distress
High or Very High Psychological Distress
n % 95% CI n % 95% CI
None 9088 89.7 (89.1 – 90.3) 1041 10.3 (9.7 – 10.9) Once 46 64.9 (52.4 – 75.5) 25 35.1 (24.5 – 47.5) Two to eight times 9 32.7 (15.9 – 50.9) 19 67.3 (45.7 – 81.4)
OVERALL 9144 89.4 (88.8 – 90.0) 1085 10.6 (10.0 – 11.2) Statistically significantly higher or lower (χ2 test p<0.05) than the other categories combined.
Data source: 2002-2004 South Australian Monitoring and Surveillance System
It can be seen from Table 10.13 that the proportion of respondents with high or very high psychological distress who reported they had visited the psychologist once, or two to eight times in the last four weeks was statistically significantly higher.
10.3.2 Visits to the Psychiatrist
In the last four weeks, respondents 16 years and over reported that 0.7% (n = 74) visited the psychiatrist once, 0.3% (n = 26) visited two to 12 times, and 99.0% (n = 10129) had no visits. The proportion of respondents, by category of psychological distress by psychiatrist visits is detailed in Table 10.14.
Table 10.14: Visits to the psychiatrist by K10 Psychological Distress, aged 16 years and over
Low or Moderate Psychological Distress
High or Very High Psychological Distress
n % 95% CI n % 95% CI
None 9103 89.9 (89.3 – 90.4) 1025 10.1 (9.5 – 10.7) Once 32 43.4 (31.9 – 55.2) 42 56.6 (45.3 – 67.7) Two to12 times 8 31.4 (15.1 – 51.9) 18 68.6 (48.1 – 84.9)
OVERALL 9144 89.4 (88.8 – 90.0) 1085 10.6 (10.0 – 11.2) Statistically significantly higher or lower (χ2 test p<0.05) than the other categories combined.
Data source: 2002-2004 South Australian Monitoring and Surveillance System
It can be seen from Table 10.14 that the proportion of respondents with high or very high psychological distress who reported they had visited the psychiatrist once or two to 12 times in the last four weeks was statistically significantly higher.
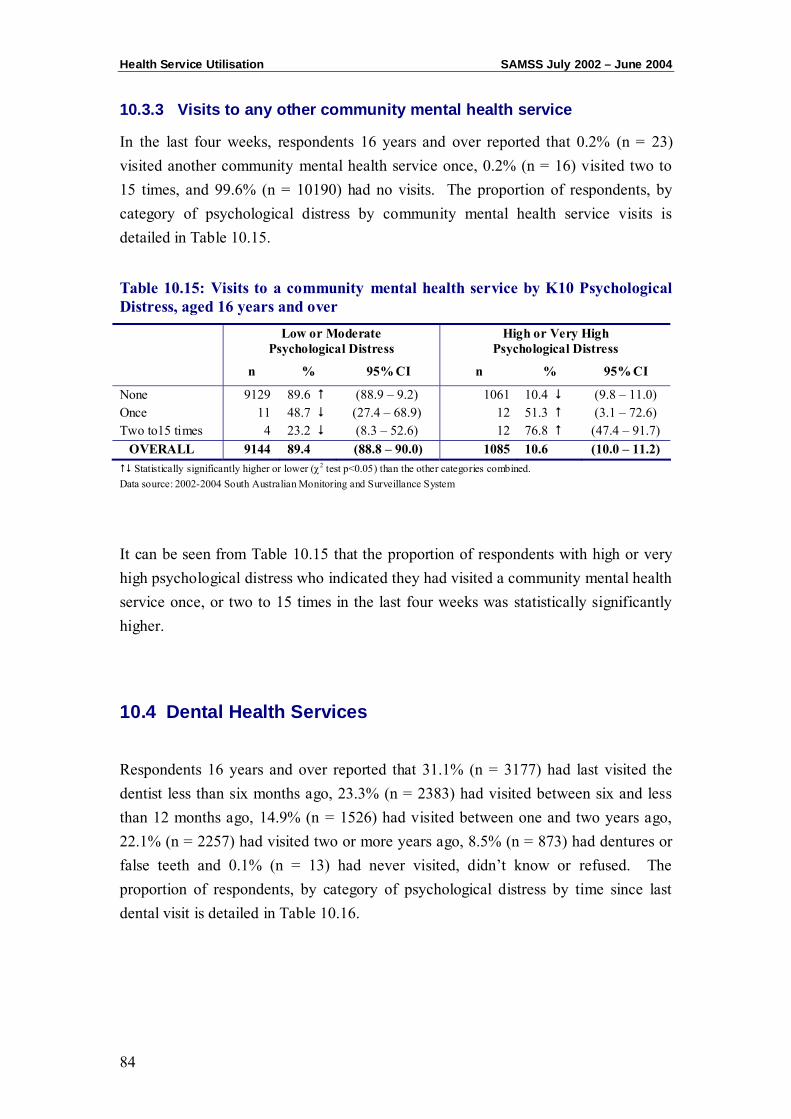
Health Service Utilisation SAMSS July 2002 – June 2004
84
10.3.3 Visits to any other community mental health service
In the last four weeks, respondents 16 years and over reported that 0.2% (n = 23) visited another community mental health service once, 0.2% (n = 16) visited two to 15 times, and 99.6% (n = 10190) had no visits. The proportion of respondents, by category of psychological distress by community mental health service visits is detailed in Table 10.15.
Table 10.15: Visits to a community mental health service by K10 Psychological Distress, aged 16 years and over
Low or Moderate Psychological Distress
High or Very High Psychological Distress
n % 95% CI n % 95% CI
None 9129 89.6 (88.9 – 9.2) 1061 10.4 (9.8 – 11.0) Once 11 48.7 (27.4 – 68.9) 12 51.3 (3.1 – 72.6) Two to15 times 4 23.2 (8.3 – 52.6) 12 76.8 (47.4 – 91.7)
OVERALL 9144 89.4 (88.8 – 90.0) 1085 10.6 (10.0 – 11.2) Statistically significantly higher or lower (χ2 test p<0.05) than the other categories combined.
Data source: 2002-2004 South Australian Monitoring and Surveillance System
It can be seen from Table 10.15 that the proportion of respondents with high or very high psychological distress who indicated they had visited a community mental health service once, or two to 15 times in the last four weeks was statistically significantly higher.
10.4 Dental Health Services
Respondents 16 years and over reported that 31.1% (n = 3177) had last visited the dentist less than six months ago, 23.3% (n = 2383) had visited between six and less than 12 months ago, 14.9% (n = 1526) had visited between one and two years ago, 22.1% (n = 2257) had visited two or more years ago, 8.5% (n = 873) had dentures or false teeth and 0.1% (n = 13) had never visited, didn’t know or refused. The proportion of respondents, by category of psychological distress by time since last dental visit is detailed in Table 10.16.
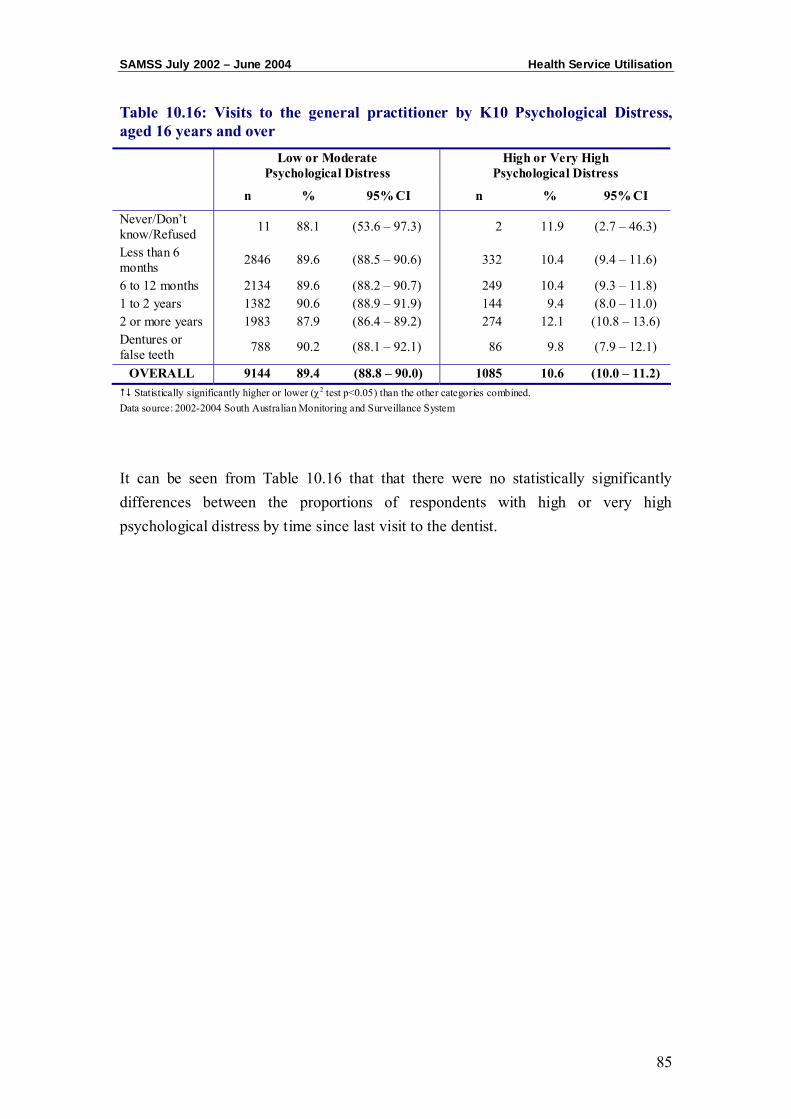
SAMSS July 2002 – June 2004 Health Service Utilisation
85
Table 10.16: Visits to the general practitioner by K10 Psychological Distress, aged 16 years and over
Low or Moderate Psychological Distress
High or Very High Psychological Distress
n % 95% CI n % 95% CI
Never/Don’t know/Refused 11 88.1 (53.6 – 97.3) 2 11.9 (2.7 – 46.3)
Less than 6 months 2846 89.6 (88.5 – 90.6) 332 10.4 (9.4 – 11.6)
6 to 12 months 2134 89.6 (88.2 – 90.7) 249 10.4 (9.3 – 11.8) 1 to 2 years 1382 90.6 (88.9 – 91.9) 144 9.4 (8.0 – 11.0) 2 or more years 1983 87.9 (86.4 – 89.2) 274 12.1 (10.8 – 13.6) Dentures or false teeth 788 90.2 (88.1 – 92.1) 86 9.8 (7.9 – 12.1)
OVERALL 9144 89.4 (88.8 – 90.0) 1085 10.6 (10.0 – 11.2) Statistically significantly higher or lower (χ2 test p<0.05) than the other categories combined.
Data source: 2002-2004 South Australian Monitoring and Surveillance System
It can be seen from Table 10.16 that that there were no statistically significantly differences between the proportions of respondents with high or very high psychological distress by time since last visit to the dentist.

Health Service Utilisation SAMSS July 2002 – June 2004
86
CHAPTER 11: PSYCHOLOGICAL DISTRESS BY PSYCHOSOCIAL
EVENTS
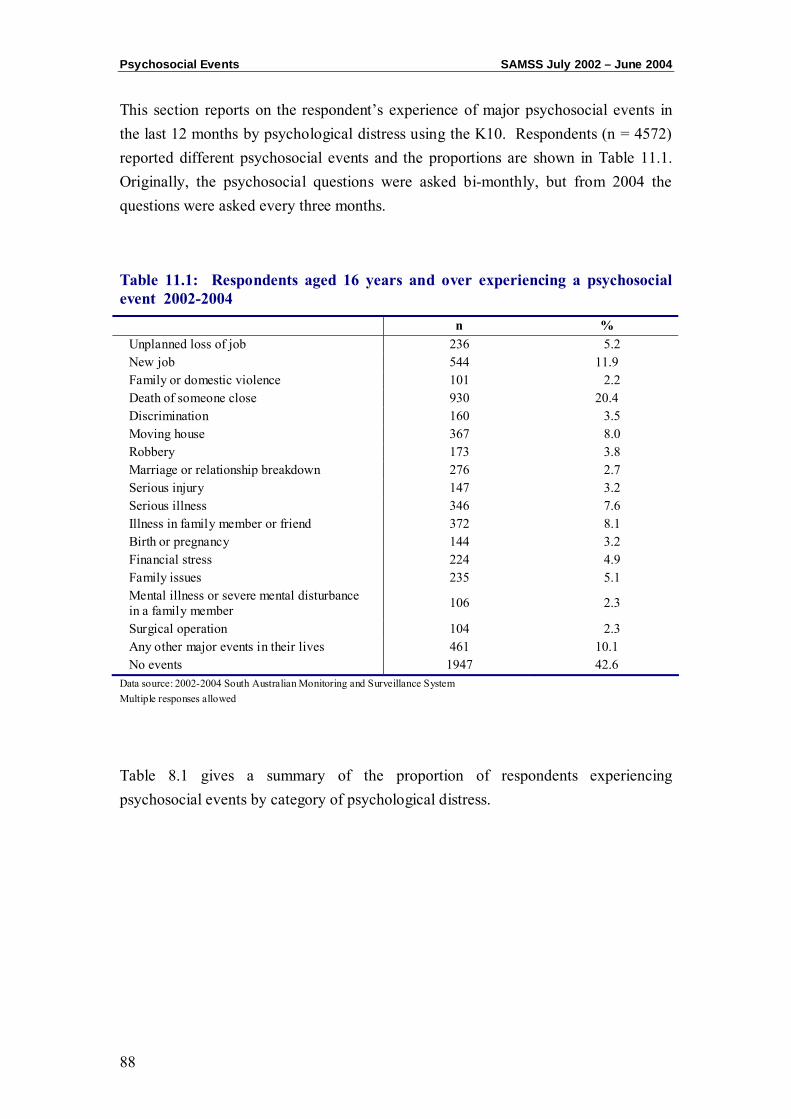
Psychosocial Events SAMSS July 2002 – June 2004
88
This section reports on the respondent’s experience of major psychosocial events in the last 12 months by psychological distress using the K10. Respondents (n = 4572) reported different psychosocial events and the proportions are shown in Table 11.1. Originally, the psychosocial questions were asked bi-monthly, but from 2004 the questions were asked every three months.
Table 11.1: Respondents aged 16 years and over experiencing a psychosocial event 2002-2004
n % Unplanned loss of job 236 5.2 New job 544 11.9 Family or domestic violence 101 2.2 Death of someone close 930 20.4 Discrimination 160 3.5 Moving house 367 8.0 Robbery 173 3.8 Marriage or relationship breakdown 276 2.7 Serious injury 147 3.2 Serious illness 346 7.6 Illness in family member or friend 372 8.1 Birth or pregnancy 144 3.2 Financial stress 224 4.9 Family issues 235 5.1 Mental illness or severe mental disturbance in a family member 106 2.3
Surgical operation 104 2.3 Any other major events in their lives 461 10.1 No events 1947 42.6
Data source: 2002-2004 South Australian Monitoring and Surveillance System Multiple responses allowed
Table 8.1 gives a summary of the proportion of respondents experiencing psychosocial events by category of psychological distress.
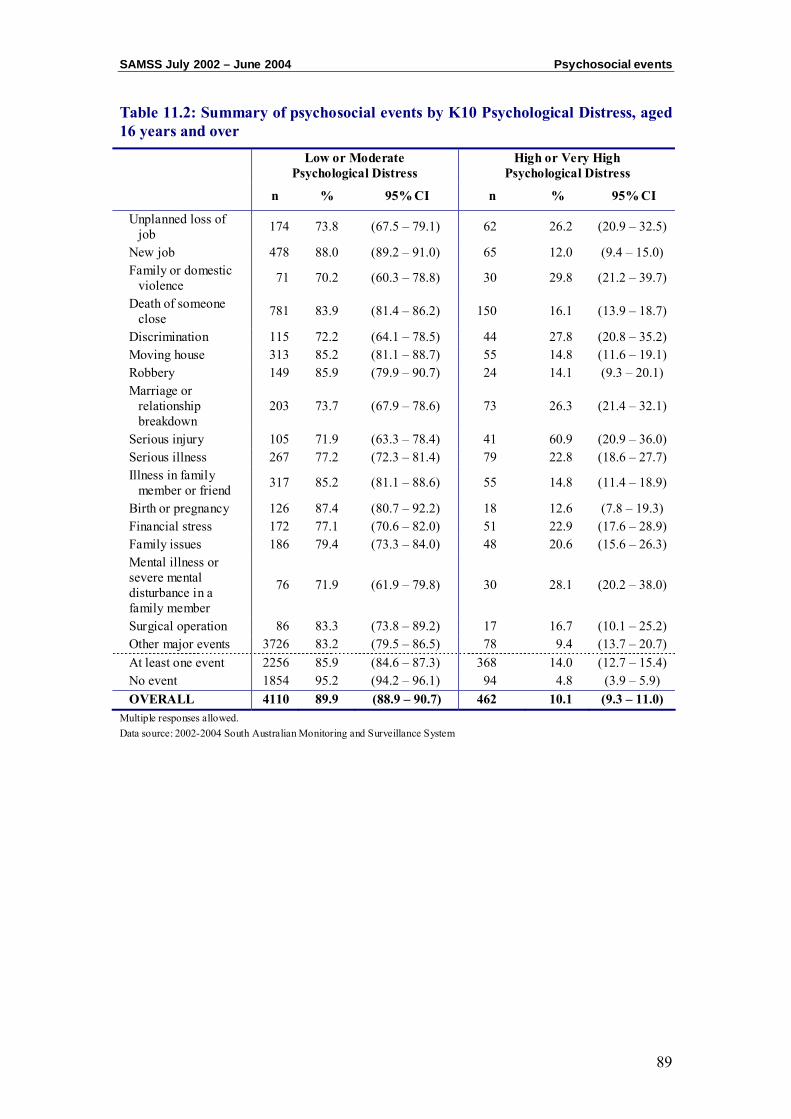
SAMSS July 2002 – June 2004 Psychosocial events
89
Table 11.2: Summary of psychosocial events by K10 Psychological Distress, aged 16 years and over
Low or Moderate Psychological Distress
High or Very High Psychological Distress
n % 95% CI n % 95% CI
Unplanned loss of job 174 73.8 (67.5 – 79.1) 62 26.2 (20.9 – 32.5)
New job 478 88.0 (89.2 – 91.0) 65 12.0 (9.4 – 15.0) Family or domestic
violence 71 70.2 (60.3 – 78.8) 30 29.8 (21.2 – 39.7)
Death of someone close 781 83.9 (81.4 – 86.2) 150 16.1 (13.9 – 18.7)
Discrimination 115 72.2 (64.1 – 78.5) 44 27.8 (20.8 – 35.2) Moving house 313 85.2 (81.1 – 88.7) 55 14.8 (11.6 – 19.1) Robbery 149 85.9 (79.9 – 90.7) 24 14.1 (9.3 – 20.1) Marriage or
relationship breakdown
203 73.7 (67.9 – 78.6) 73 26.3 (21.4 – 32.1)
Serious injury 105 71.9 (63.3 – 78.4) 41 60.9 (20.9 – 36.0) Serious illness 267 77.2 (72.3 – 81.4) 79 22.8 (18.6 – 27.7) Illness in family
member or friend 317 85.2 (81.1 – 88.6) 55 14.8 (11.4 – 18.9)
Birth or pregnancy 126 87.4 (80.7 – 92.2) 18 12.6 (7.8 – 19.3) Financial stress 172 77.1 (70.6 – 82.0) 51 22.9 (17.6 – 28.9) Family issues 186 79.4 (73.3 – 84.0) 48 20.6 (15.6 – 26.3) Mental illness or severe mental disturbance in a family member
76 71.9 (61.9 – 79.8) 30 28.1 (20.2 – 38.0)
Surgical operation 86 83.3 (73.8 – 89.2) 17 16.7 (10.1 – 25.2) Other major events 3726 83.2 (79.5 – 86.5) 78 9.4 (13.7 – 20.7) At least one event 2256 85.9 (84.6 – 87.3) 368 14.0 (12.7 – 15.4) No event 1854 95.2 (94.2 – 96.1) 94 4.8 (3.9 – 5.9) OVERALL 4110 89.9 (88.9 – 90.7) 462 10.1 (9.3 – 11.0)
Multiple responses allowed. Data source: 2002-2004 South Australian Monitoring and Surveillance System
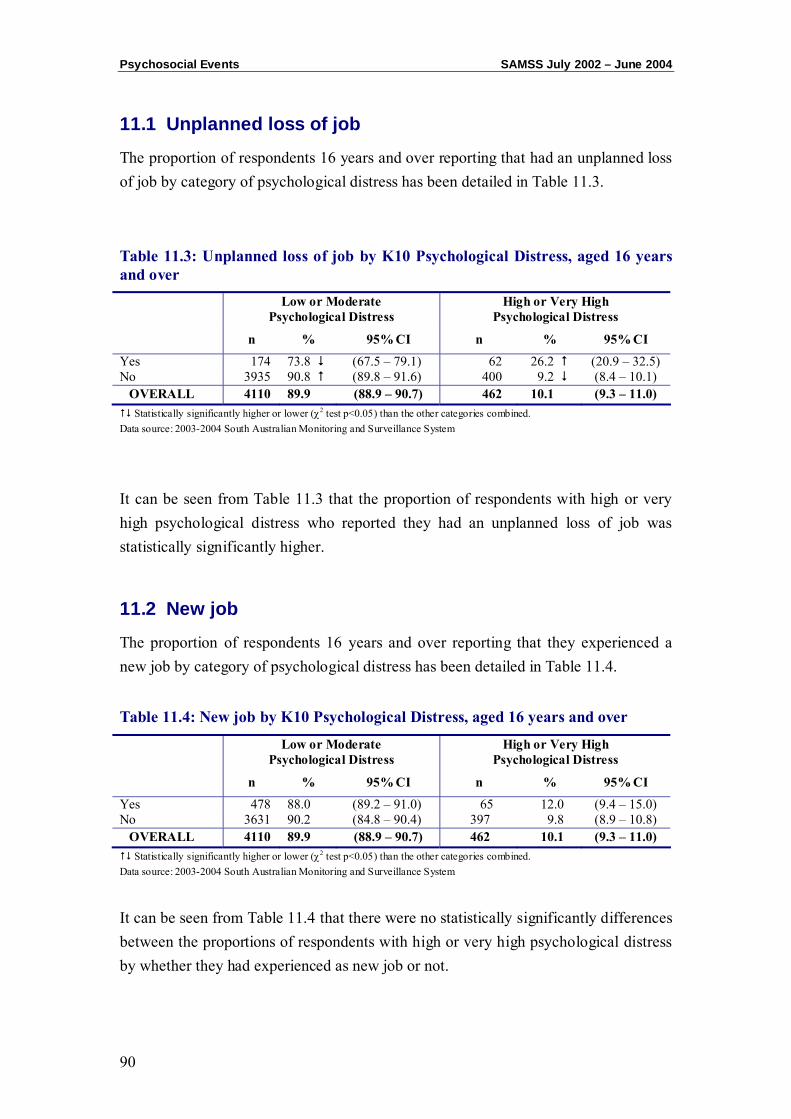
Psychosocial Events SAMSS July 2002 – June 2004
90
11.1 Unplanned loss of job
The proportion of respondents 16 years and over reporting that had an unplanned loss of job by category of psychological distress has been detailed in Table 11.3.
Table 11.3: Unplanned loss of job by K10 Psychological Distress, aged 16 years and over
Low or Moderate Psychological Distress
High or Very High Psychological Distress
n % 95% CI n % 95% CI
Yes 174 73.8 (67.5 – 79.1) 62 26.2 (20.9 – 32.5) No 3935 90.8 (89.8 – 91.6) 400 9.2 (8.4 – 10.1)
OVERALL 4110 89.9 (88.9 – 90.7) 462 10.1 (9.3 – 11.0) Statistically significantly higher or lower (χ2 test p<0.05) than the other categories combined.
Data source: 2003-2004 South Australian Monitoring and Surveillance System
It can be seen from Table 11.3 that the proportion of respondents with high or very high psychological distress who reported they had an unplanned loss of job was statistically significantly higher.
11.2 New job
The proportion of respondents 16 years and over reporting that they experienced a new job by category of psychological distress has been detailed in Table 11.4.
Table 11.4: New job by K10 Psychological Distress, aged 16 years and over
Low or Moderate Psychological Distress
High or Very High Psychological Distress
n % 95% CI n % 95% CI
Yes 478 88.0 (89.2 – 91.0) 65 12.0 (9.4 – 15.0) No 3631 90.2 (84.8 – 90.4) 397 9.8 (8.9 – 10.8)
OVERALL 4110 89.9 (88.9 – 90.7) 462 10.1 (9.3 – 11.0) Statistically significantly higher or lower (χ2 test p<0.05) than the other categories combined.
Data source: 2003-2004 South Australian Monitoring and Surveillance System
It can be seen from Table 11.4 that there were no statistically significantly differences between the proportions of respondents with high or very high psychological distress by whether they had experienced as new job or not.

SAMSS July 2002 – June 2004 Psychosocial events
91
11.3 Family or domestic violence
The proportion of respondents 16 years and over reporting that they experienced family or domestic violence by category of psychological distress has been detailed in Table 11.5.
Table 11.5: Family or domestic violence by K10 Psychological Distress, aged 16 years and over
Low or Moderate Psychological Distress
High or Very High Psychological Distress
n % 95% CI n % 95% CI
Yes 71 70.2 (60.3 – 78.8) 30 29.8 (21.2 – 39.7) No 4038 90.3 (89.4 – 91.2) 432 9.7 (8.8 – 10.6)
OVERALL 4110 89.9 (88.9 – 90.7) 462 10.1 (9.3 – 11.0) Statistically significantly higher or lower (χ2 test p<0.05) than the other categories combined.
Data source: 2003-2004 South Australian Monitoring and Surveillance System
It can be seen from Table 11.5 that the proportion of respondents with high or very high psychological distress who indicated they had experienced family or domestic violence was statistically significantly higher.
11.4 Death of someone close
The proportion of respondents 16 years and over reporting that someone close had died by category of psychological distress has been detailed in Table 11.6.
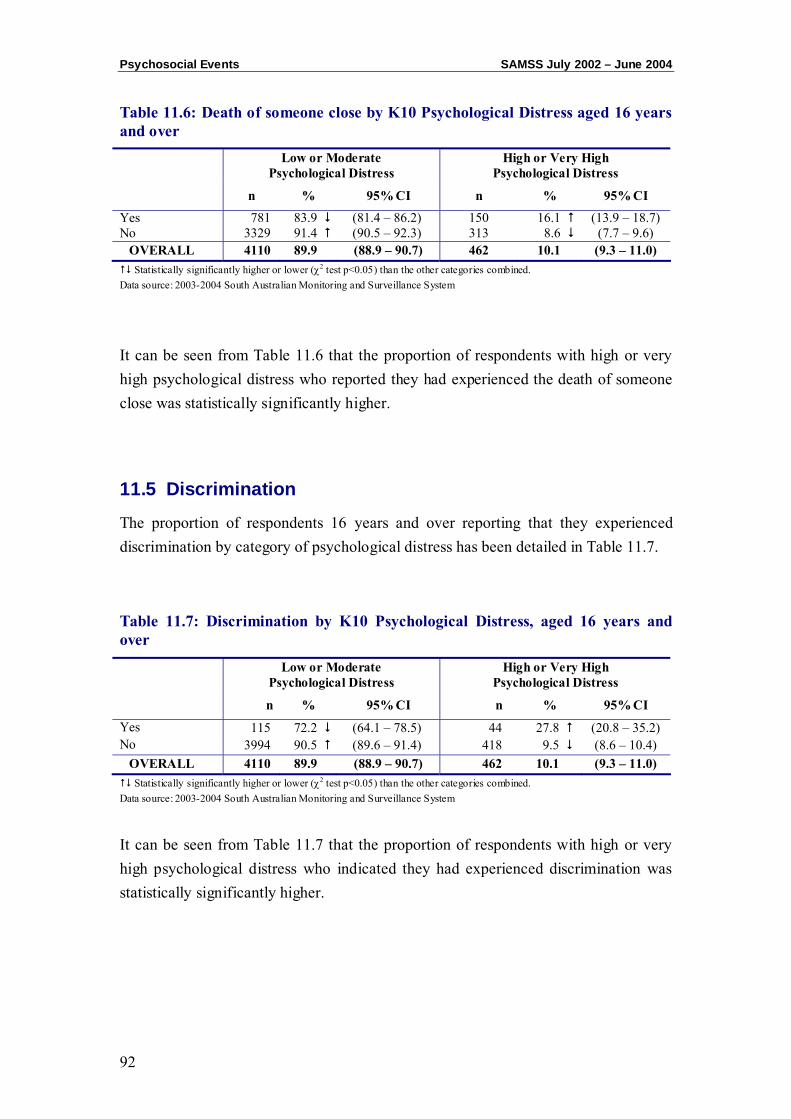
Psychosocial Events SAMSS July 2002 – June 2004
92
Table 11.6: Death of someone close by K10 Psychological Distress aged 16 years and over
Low or Moderate Psychological Distress
High or Very High Psychological Distress
n % 95% CI n % 95% CI
Yes 781 83.9 (81.4 – 86.2) 150 16.1 (13.9 – 18.7) No 3329 91.4 (90.5 – 92.3) 313 8.6 (7.7 – 9.6)
OVERALL 4110 89.9 (88.9 – 90.7) 462 10.1 (9.3 – 11.0) Statistically significantly higher or lower (χ2 test p<0.05) than the other categories combined.
Data source: 2003-2004 South Australian Monitoring and Surveillance System
It can be seen from Table 11.6 that the proportion of respondents with high or very high psychological distress who reported they had experienced the death of someone close was statistically significantly higher.
11.5 Discrimination
The proportion of respondents 16 years and over reporting that they experienced discrimination by category of psychological distress has been detailed in Table 11.7.
Table 11.7: Discrimination by K10 Psychological Distress, aged 16 years and over
Low or Moderate Psychological Distress
High or Very High Psychological Distress
n % 95% CI n % 95% CI
Yes 115 72.2 (64.1 – 78.5) 44 27.8 (20.8 – 35.2) No 3994 90.5 (89.6 – 91.4) 418 9.5 (8.6 – 10.4)
OVERALL 4110 89.9 (88.9 – 90.7) 462 10.1 (9.3 – 11.0) Statistically significantly higher or lower (χ2 test p<0.05) than the other categories combined.
Data source: 2003-2004 South Australian Monitoring and Surveillance System
It can be seen from Table 11.7 that the proportion of respondents with high or very high psychological distress who indicated they had experienced discrimination was statistically significantly higher.
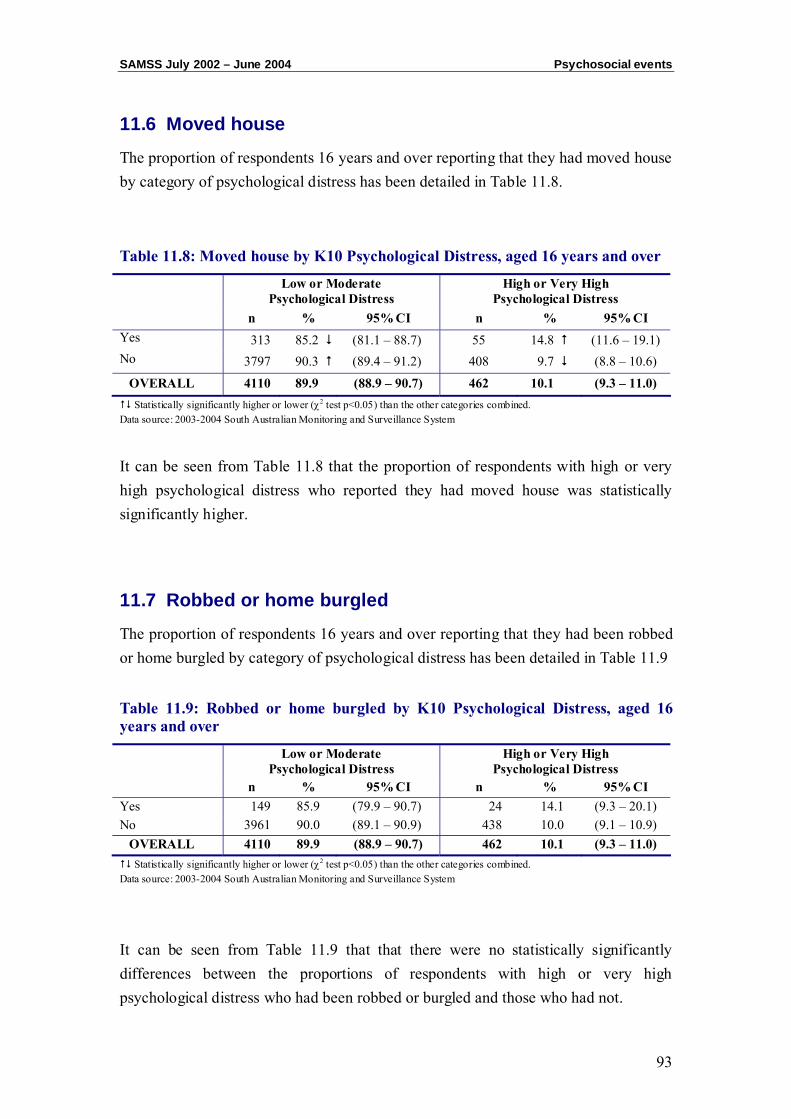
SAMSS July 2002 – June 2004 Psychosocial events
93
11.6 Moved house
The proportion of respondents 16 years and over reporting that they had moved house by category of psychological distress has been detailed in Table 11.8.
Table 11.8: Moved house by K10 Psychological Distress, aged 16 years and over
Low or Moderate Psychological Distress
High or Very High Psychological Distress
n % 95% CI n % 95% CI Yes 313 85.2 (81.1 – 88.7) 55 14.8 (11.6 – 19.1) No 3797 90.3 (89.4 – 91.2) 408 9.7 (8.8 – 10.6)
OVERALL 4110 89.9 (88.9 – 90.7) 462 10.1 (9.3 – 11.0) Statistically significantly higher or lower (χ2 test p<0.05) than the other categories combined.
Data source: 2003-2004 South Australian Monitoring and Surveillance System
It can be seen from Table 11.8 that the proportion of respondents with high or very high psychological distress who reported they had moved house was statistically significantly higher.
11.7 Robbed or home burgled
The proportion of respondents 16 years and over reporting that they had been robbed or home burgled by category of psychological distress has been detailed in Table 11.9
Table 11.9: Robbed or home burgled by K10 Psychological Distress, aged 16 years and over
Low or Moderate Psychological Distress
High or Very High Psychological Distress
n % 95% CI n % 95% CI Yes 149 85.9 (79.9 – 90.7) 24 14.1 (9.3 – 20.1) No 3961 90.0 (89.1 – 90.9) 438 10.0 (9.1 – 10.9)
OVERALL 4110 89.9 (88.9 – 90.7) 462 10.1 (9.3 – 11.0) Statistically significantly higher or lower (χ2 test p<0.05) than the other categories combined.
Data source: 2003-2004 South Australian Monitoring and Surveillance System
It can be seen from Table 11.9 that that there were no statistically significantly differences between the proportions of respondents with high or very high psychological distress who had been robbed or burgled and those who had not.

Psychosocial Events SAMSS July 2002 – June 2004
94
11.8 Marriage or relationship breakdown
The proportion of respondents 16 years and over reporting that they experienced a marriage or relationship breakdown by category of psychological distress has been detailed in Table 11.10.
Table 11.10: Marriage or relationship breakdown by K10 Psychological Distress, aged 16 years and over
Low or Moderate Psychological Distress
High or Very High Psychological Distress
n % 95% CI n % 95% CI Yes 203 73.7 (67.9 – 78.6) 73 26.3 (21.4 – 32.1) No 3906 90.9 (90.0 – 91.8) 389 9.1 (8.2 – 9.9)
OVERALL 4110 89.9 (88.9 – 90.7) 462 10.1 (9.3 – 11.0) Statistically significantly higher or lower (χ2 test p<0.05) than the other categories combined.
Data source: 2003-2004 South Australian Monitoring and Surveillance System
It can be seen from Table 11.10 that the proportion of respondents with high or very high psychological distress who indicated they had experienced a marriage or relationship breakdown, was statistically significantly higher.
11.9 Serious injury
The proportion of respondents 16 years and over reporting that they experienced a serious injury by category of psychological distress has been detailed in Table 11.11.
Table 11.11: Serious injury by K10 Psychological Distress aged 16 years and over
Low or Moderate Psychological Distress
High or Very High Psychological Distress
n % 95% CI n % 95% CI Yes 105 71.9 (63.3 – 78.4) 41 60.9 (20.9 – 36.0) No 4004 90.5 (89.6 – 91.3) 421 9.5 (89.6 – 91.3)
OVERALL 4110 89.9 (88.9 – 90.7) 462 10.1 (9.3 – 11.0) Statistically significantly higher or lower (χ2 test p<0.05) than the other categories combined.
Data source: 2003-2004 South Australian Monitoring and Surveillance System
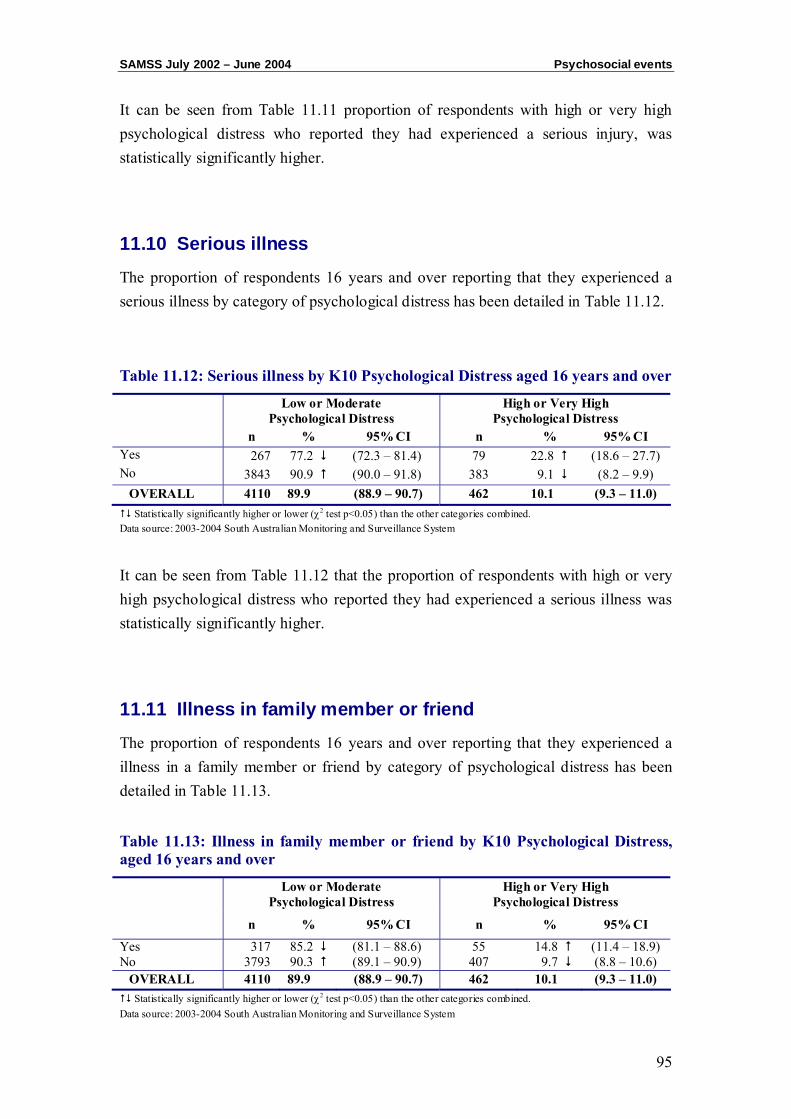
SAMSS July 2002 – June 2004 Psychosocial events
95
It can be seen from Table 11.11 proportion of respondents with high or very high psychological distress who reported they had experienced a serious injury, was statistically significantly higher.
11.10 Serious illness
The proportion of respondents 16 years and over reporting that they experienced a serious illness by category of psychological distress has been detailed in Table 11.12.
Table 11.12: Serious illness by K10 Psychological Distress aged 16 years and over
Low or Moderate Psychological Distress
High or Very High Psychological Distress
n % 95% CI n % 95% CI Yes 267 77.2 (72.3 – 81.4) 79 22.8 (18.6 – 27.7) No 3843 90.9 (90.0 – 91.8) 383 9.1 (8.2 – 9.9)
OVERALL 4110 89.9 (88.9 – 90.7) 462 10.1 (9.3 – 11.0) Statistically significantly higher or lower (χ2 test p<0.05) than the other categories combined.
Data source: 2003-2004 South Australian Monitoring and Surveillance System
It can be seen from Table 11.12 that the proportion of respondents with high or very high psychological distress who reported they had experienced a serious illness was statistically significantly higher.
11.11 Illness in family member or friend
The proportion of respondents 16 years and over reporting that they experienced a illness in a family member or friend by category of psychological distress has been detailed in Table 11.13.
Table 11.13: Illness in family member or friend by K10 Psychological Distress, aged 16 years and over
Low or Moderate Psychological Distress
High or Very High Psychological Distress
n % 95% CI n % 95% CI
Yes 317 85.2 (81.1 – 88.6) 55 14.8 (11.4 – 18.9) No 3793 90.3 (89.1 – 90.9) 407 9.7 (8.8 – 10.6)
OVERALL 4110 89.9 (88.9 – 90.7) 462 10.1 (9.3 – 11.0) Statistically significantly higher or lower (χ2 test p<0.05) than the other categories combined.
Data source: 2003-2004 South Australian Monitoring and Surveillance System
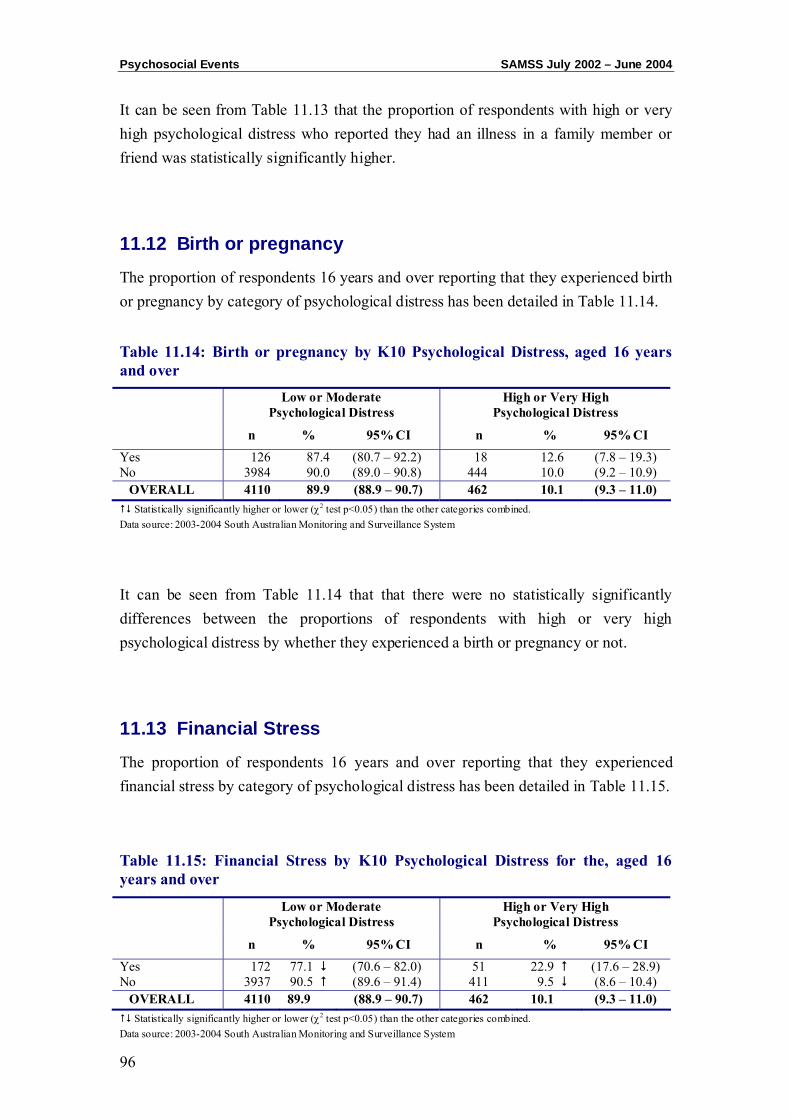
Psychosocial Events SAMSS July 2002 – June 2004
96
It can be seen from Table 11.13 that the proportion of respondents with high or very high psychological distress who reported they had an illness in a family member or friend was statistically significantly higher.
11.12 Birth or pregnancy
The proportion of respondents 16 years and over reporting that they experienced birth or pregnancy by category of psychological distress has been detailed in Table 11.14.
Table 11.14: Birth or pregnancy by K10 Psychological Distress, aged 16 years and over
Low or Moderate Psychological Distress
High or Very High Psychological Distress
n % 95% CI n % 95% CI
Yes 126 87.4 (80.7 – 92.2) 18 12.6 (7.8 – 19.3) No 3984 90.0 (89.0 – 90.8) 444 10.0 (9.2 – 10.9)
OVERALL 4110 89.9 (88.9 – 90.7) 462 10.1 (9.3 – 11.0) Statistically significantly higher or lower (χ2 test p<0.05) than the other categories combined.
Data source: 2003-2004 South Australian Monitoring and Surveillance System
It can be seen from Table 11.14 that that there were no statistically significantly differences between the proportions of respondents with high or very high psychological distress by whether they experienced a birth or pregnancy or not.
11.13 Financial Stress
The proportion of respondents 16 years and over reporting that they experienced financial stress by category of psychological distress has been detailed in Table 11.15.
Table 11.15: Financial Stress by K10 Psychological Distress for the, aged 16 years and over
Low or Moderate Psychological Distress
High or Very High Psychological Distress
n % 95% CI n % 95% CI
Yes 172 77.1 (70.6 – 82.0) 51 22.9 (17.6 – 28.9) No 3937 90.5 (89.6 – 91.4) 411 9.5 (8.6 – 10.4)
OVERALL 4110 89.9 (88.9 – 90.7) 462 10.1 (9.3 – 11.0) Statistically significantly higher or lower (χ2 test p<0.05) than the other categories combined.
Data source: 2003-2004 South Australian Monitoring and Surveillance System
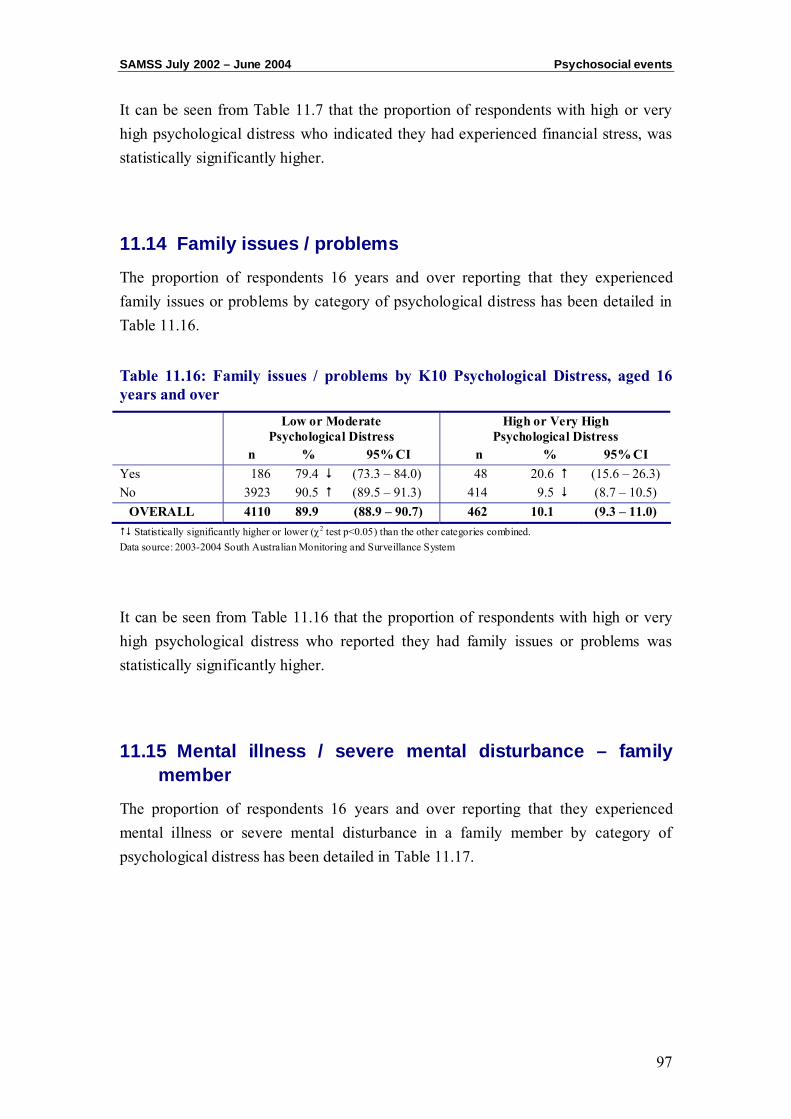
SAMSS July 2002 – June 2004 Psychosocial events
97
It can be seen from Table 11.7 that the proportion of respondents with high or very high psychological distress who indicated they had experienced financial stress, was statistically significantly higher.
11.14 Family issues / problems
The proportion of respondents 16 years and over reporting that they experienced family issues or problems by category of psychological distress has been detailed in Table 11.16.
Table 11.16: Family issues / problems by K10 Psychological Distress, aged 16 years and over
Low or Moderate Psychological Distress
High or Very High Psychological Distress
n % 95% CI n % 95% CI Yes 186 79.4 (73.3 – 84.0) 48 20.6 (15.6 – 26.3) No 3923 90.5 (89.5 – 91.3) 414 9.5 (8.7 – 10.5)
OVERALL 4110 89.9 (88.9 – 90.7) 462 10.1 (9.3 – 11.0) Statistically significantly higher or lower (χ2 test p<0.05) than the other categories combined.
Data source: 2003-2004 South Australian Monitoring and Surveillance System
It can be seen from Table 11.16 that the proportion of respondents with high or very high psychological distress who reported they had family issues or problems was statistically significantly higher.
11.15 Mental illness / severe mental disturbance – family member
The proportion of respondents 16 years and over reporting that they experienced mental illness or severe mental disturbance in a family member by category of psychological distress has been detailed in Table 11.17.
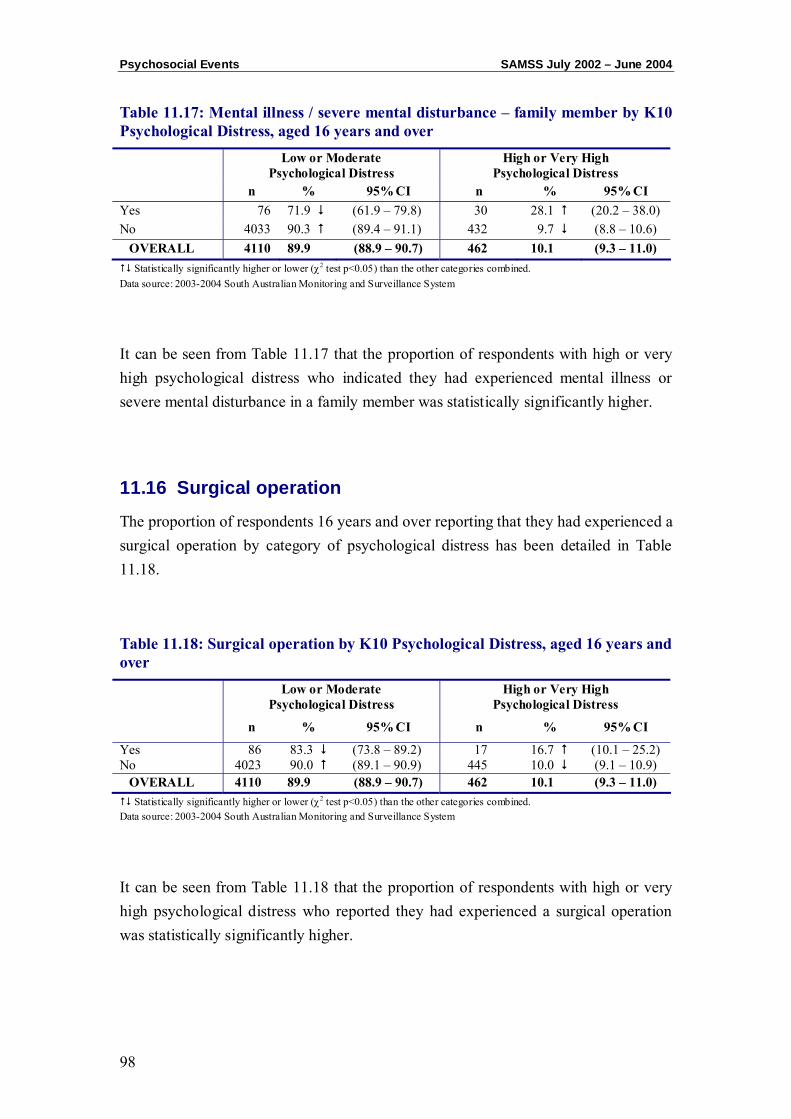
Psychosocial Events SAMSS July 2002 – June 2004
98
Table 11.17: Mental illness / severe mental disturbance – family member by K10 Psychological Distress, aged 16 years and over
Low or Moderate Psychological Distress
High or Very High Psychological Distress
n % 95% CI n % 95% CI Yes 76 71.9 (61.9 – 79.8) 30 28.1 (20.2 – 38.0) No 4033 90.3 (89.4 – 91.1) 432 9.7 (8.8 – 10.6)
OVERALL 4110 89.9 (88.9 – 90.7) 462 10.1 (9.3 – 11.0) Statistically significantly higher or lower (χ2 test p<0.05) than the other categories combined.
Data source: 2003-2004 South Australian Monitoring and Surveillance System
It can be seen from Table 11.17 that the proportion of respondents with high or very high psychological distress who indicated they had experienced mental illness or severe mental disturbance in a family member was statistically significantly higher.
11.16 Surgical operation
The proportion of respondents 16 years and over reporting that they had experienced a surgical operation by category of psychological distress has been detailed in Table 11.18.
Table 11.18: Surgical operation by K10 Psychological Distress, aged 16 years and over
Low or Moderate Psychological Distress
High or Very High Psychological Distress
n % 95% CI n % 95% CI
Yes 86 83.3 (73.8 – 89.2) 17 16.7 (10.1 – 25.2) No 4023 90.0 (89.1 – 90.9) 445 10.0 (9.1 – 10.9)
OVERALL 4110 89.9 (88.9 – 90.7) 462 10.1 (9.3 – 11.0) Statistically significantly higher or lower (χ2 test p<0.05) than the other categories combined.
Data source: 2003-2004 South Australian Monitoring and Surveillance System
It can be seen from Table 11.18 that the proportion of respondents with high or very high psychological distress who reported they had experienced a surgical operation was statistically significantly higher.
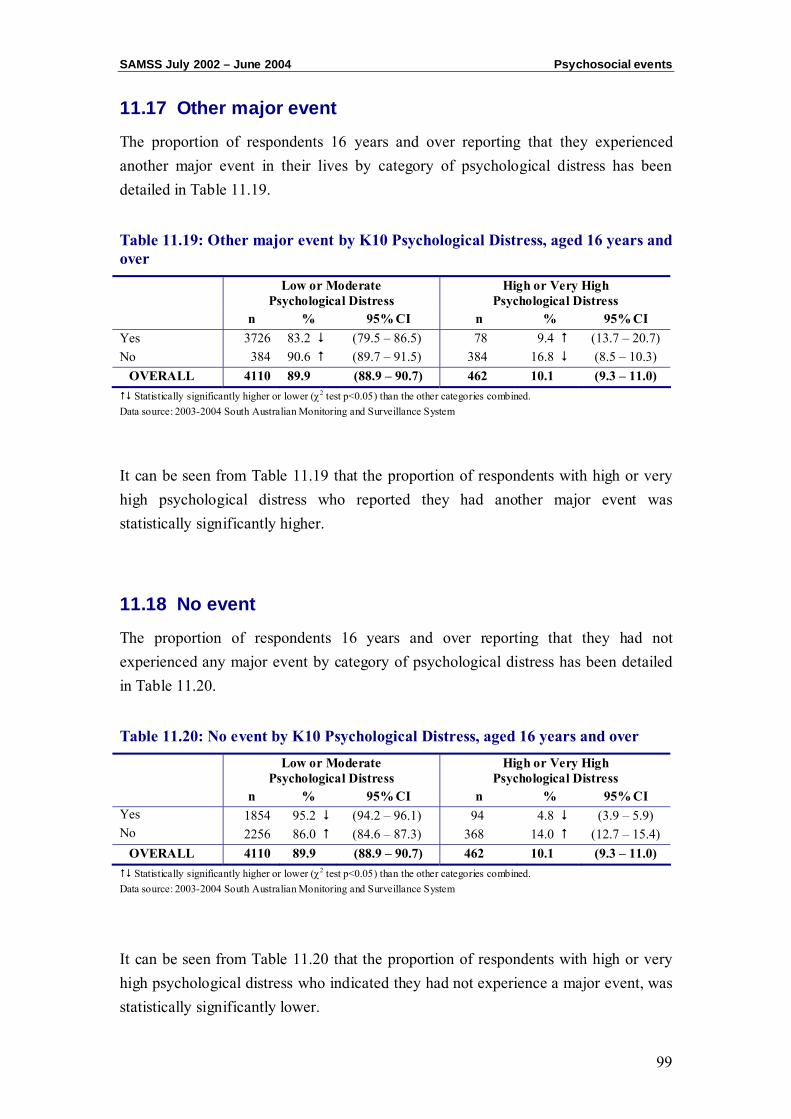
SAMSS July 2002 – June 2004 Psychosocial events
99
11.17 Other major event
The proportion of respondents 16 years and over reporting that they experienced another major event in their lives by category of psychological distress has been detailed in Table 11.19.
Table 11.19: Other major event by K10 Psychological Distress, aged 16 years and over
Low or Moderate Psychological Distress
High or Very High Psychological Distress
n % 95% CI n % 95% CI Yes 3726 83.2 (79.5 – 86.5) 78 9.4 (13.7 – 20.7) No 384 90.6 (89.7 – 91.5) 384 16.8 (8.5 – 10.3)
OVERALL 4110 89.9 (88.9 – 90.7) 462 10.1 (9.3 – 11.0) Statistically significantly higher or lower (χ2 test p<0.05) than the other categories combined.
Data source: 2003-2004 South Australian Monitoring and Surveillance System
It can be seen from Table 11.19 that the proportion of respondents with high or very high psychological distress who reported they had another major event was statistically significantly higher.
11.18 No event
The proportion of respondents 16 years and over reporting that they had not experienced any major event by category of psychological distress has been detailed in Table 11.20.
Table 11.20: No event by K10 Psychological Distress, aged 16 years and over
Low or Moderate Psychological Distress
High or Very High Psychological Distress
n % 95% CI n % 95% CI Yes 1854 95.2 (94.2 – 96.1) 94 4.8 (3.9 – 5.9) No 2256 86.0 (84.6 – 87.3) 368 14.0 (12.7 – 15.4)
OVERALL 4110 89.9 (88.9 – 90.7) 462 10.1 (9.3 – 11.0) Statistically significantly higher or lower (χ2 test p<0.05) than the other categories combined.
Data source: 2003-2004 South Australian Monitoring and Surveillance System
It can be seen from Table 11.20 that the proportion of respondents with high or very high psychological distress who indicated they had not experience a major event, was statistically significantly lower.
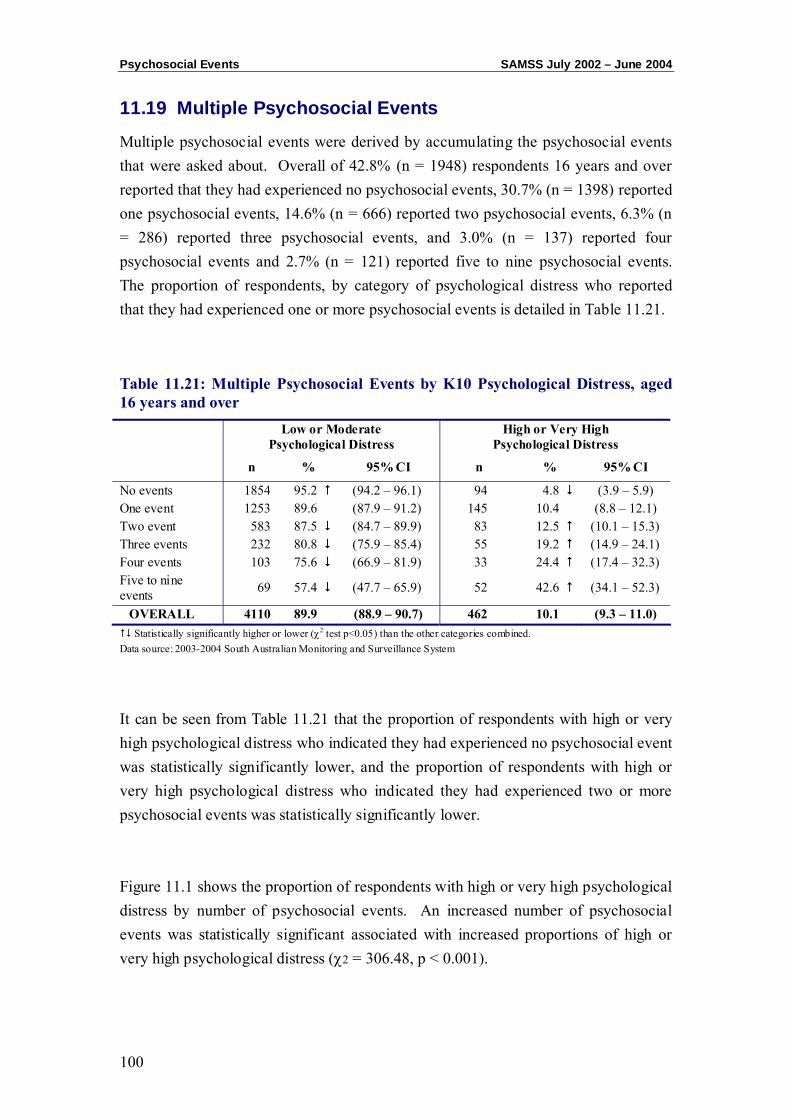
Psychosocial Events SAMSS July 2002 – June 2004
100
11.19 Multiple Psychosocial Events
Multiple psychosocial events were derived by accumulating the psychosocial events that were asked about. Overall of 42.8% (n = 1948) respondents 16 years and over reported that they had experienced no psychosocial events, 30.7% (n = 1398) reported one psychosocial events, 14.6% (n = 666) reported two psychosocial events, 6.3% (n = 286) reported three psychosocial events, and 3.0% (n = 137) reported four psychosocial events and 2.7% (n = 121) reported five to nine psychosocial events. The proportion of respondents, by category of psychological distress who reported that they had experienced one or more psychosocial events is detailed in Table 11.21.
Table 11.21: Multiple Psychosocial Events by K10 Psychological Distress, aged 16 years and over
Low or Moderate Psychological Distress
High or Very High Psychological Distress
n % 95% CI n % 95% CI
No events 1854 95.2 (94.2 – 96.1) 94 4.8 (3.9 – 5.9) One event 1253 89.6 (87.9 – 91.2) 145 10.4 (8.8 – 12.1) Two event 583 87.5 (84.7 – 89.9) 83 12.5 (10.1 – 15.3) Three events 232 80.8 (75.9 – 85.4) 55 19.2 (14.9 – 24.1) Four events 103 75.6 (66.9 – 81.9) 33 24.4 (17.4 – 32.3) Five to nine events 69 57.4 (47.7 – 65.9) 52 42.6 (34.1 – 52.3)
OVERALL 4110 89.9 (88.9 – 90.7) 462 10.1 (9.3 – 11.0) Statistically significantly higher or lower (χ2 test p<0.05) than the other categories combined.
Data source: 2003-2004 South Australian Monitoring and Surveillance System
It can be seen from Table 11.21 that the proportion of respondents with high or very high psychological distress who indicated they had experienced no psychosocial event was statistically significantly lower, and the proportion of respondents with high or very high psychological distress who indicated they had experienced two or more psychosocial events was statistically significantly lower. Figure 11.1 shows the proportion of respondents with high or very high psychological distress by number of psychosocial events. An increased number of psychosocial events was statistically significant associated with increased proportions of high or very high psychological distress (χ2 = 306.48, p < 0.001).
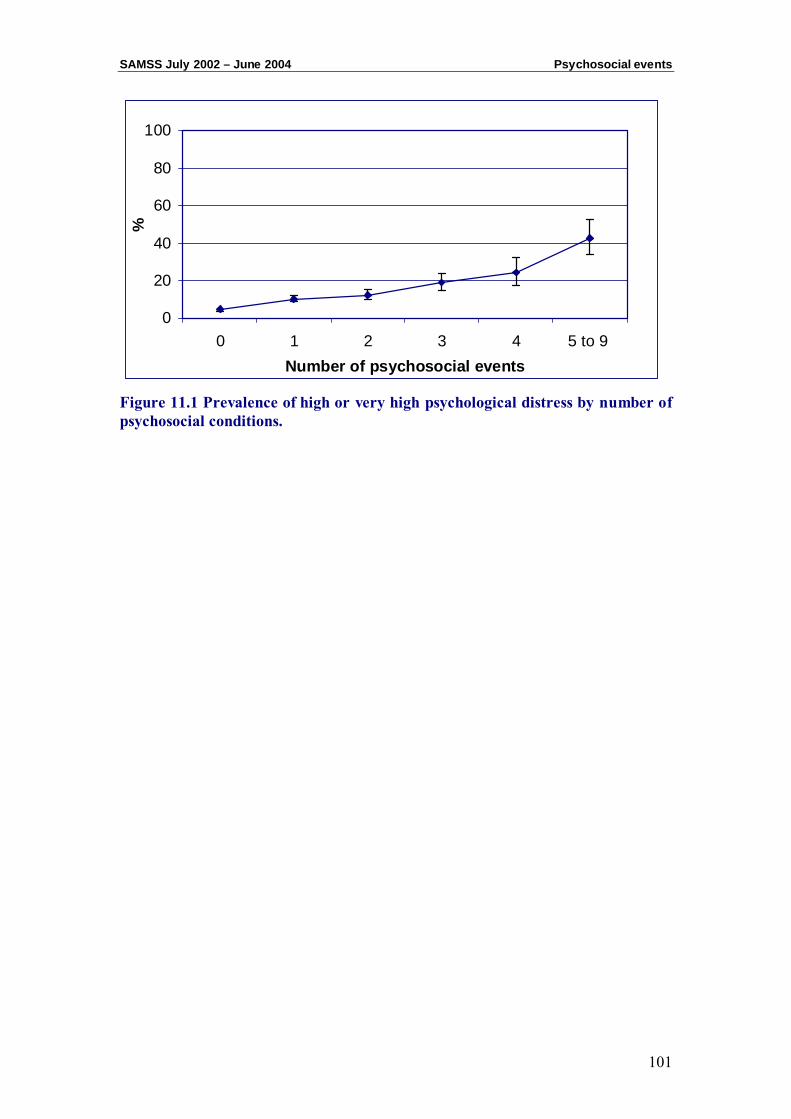
SAMSS July 2002 – June 2004 Psychosocial events
101
0
20
40
60
80
100
0 1 2 3 4 5 to 9 Number of psychosocial events
%
Figure 11.1 Prevalence of high or very high psychological distress by number of psychosocial conditions.

Psychosocial Events SAMSS July 2002 – June 2004
102

CHAPTER 12: PSYCHOLOGICAL DISTRESS AND SOCIAL CAPITAL
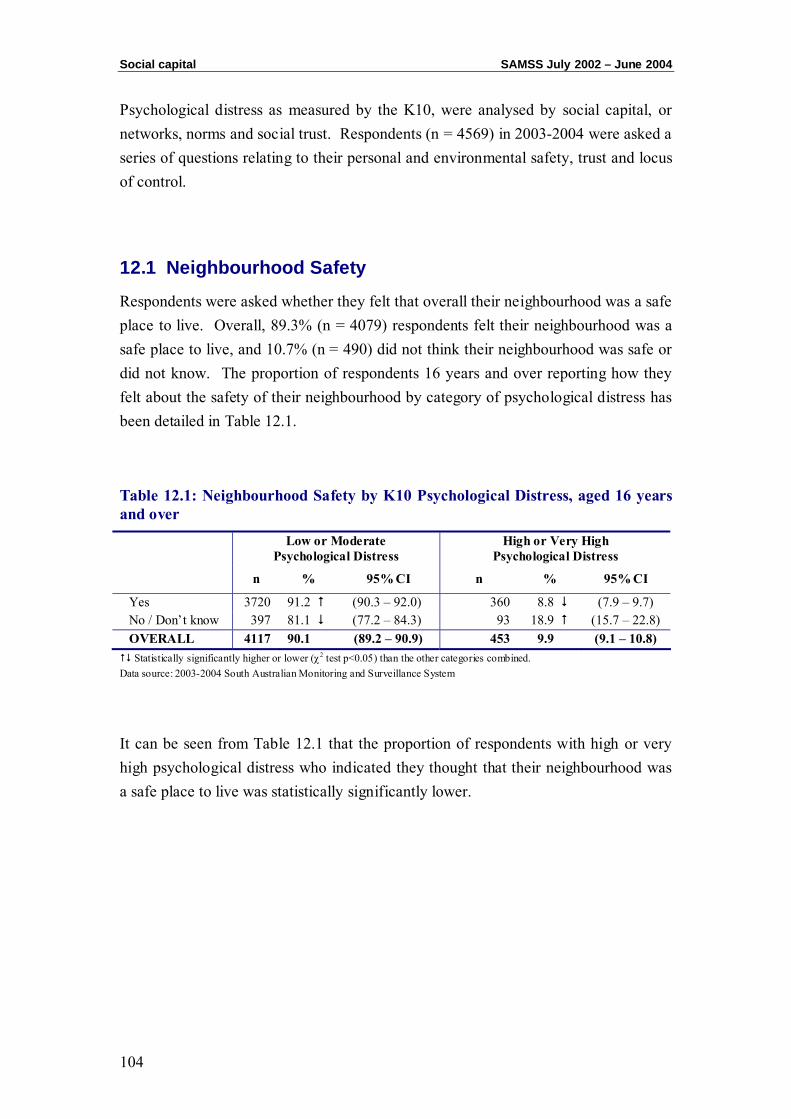
Social capital SAMSS July 2002 – June 2004
104
Psychological distress as measured by the K10, were analysed by social capital, or networks, norms and social trust. Respondents (n = 4569) in 2003-2004 were asked a series of questions relating to their personal and environmental safety, trust and locus of control.
12.1 Neighbourhood Safety
Respondents were asked whether they felt that overall their neighbourhood was a safe place to live. Overall, 89.3% (n = 4079) respondents felt their neighbourhood was a safe place to live, and 10.7% (n = 490) did not think their neighbourhood was safe or did not know. The proportion of respondents 16 years and over reporting how they felt about the safety of their neighbourhood by category of psychological distress has been detailed in Table 12.1.
Table 12.1: Neighbourhood Safety by K10 Psychological Distress, aged 16 years and over
Low or Moderate Psychological Distress
High or Very High Psychological Distress
n % 95% CI n % 95% CI
Yes 3720 91.2 (90.3 – 92.0) 360 8.8 (7.9 – 9.7) No / Don’t know 397 81.1 (77.2 – 84.3) 93 18.9 (15.7 – 22.8) OVERALL 4117 90.1 (89.2 – 90.9) 453 9.9 (9.1 – 10.8) Statistically significantly higher or lower (χ2 test p<0.05) than the other categories combined.
Data source: 2003-2004 South Australian Monitoring and Surveillance System
It can be seen from Table 12.1 that the proportion of respondents with high or very high psychological distress who indicated they thought that their neighbourhood was a safe place to live was statistically significantly lower.
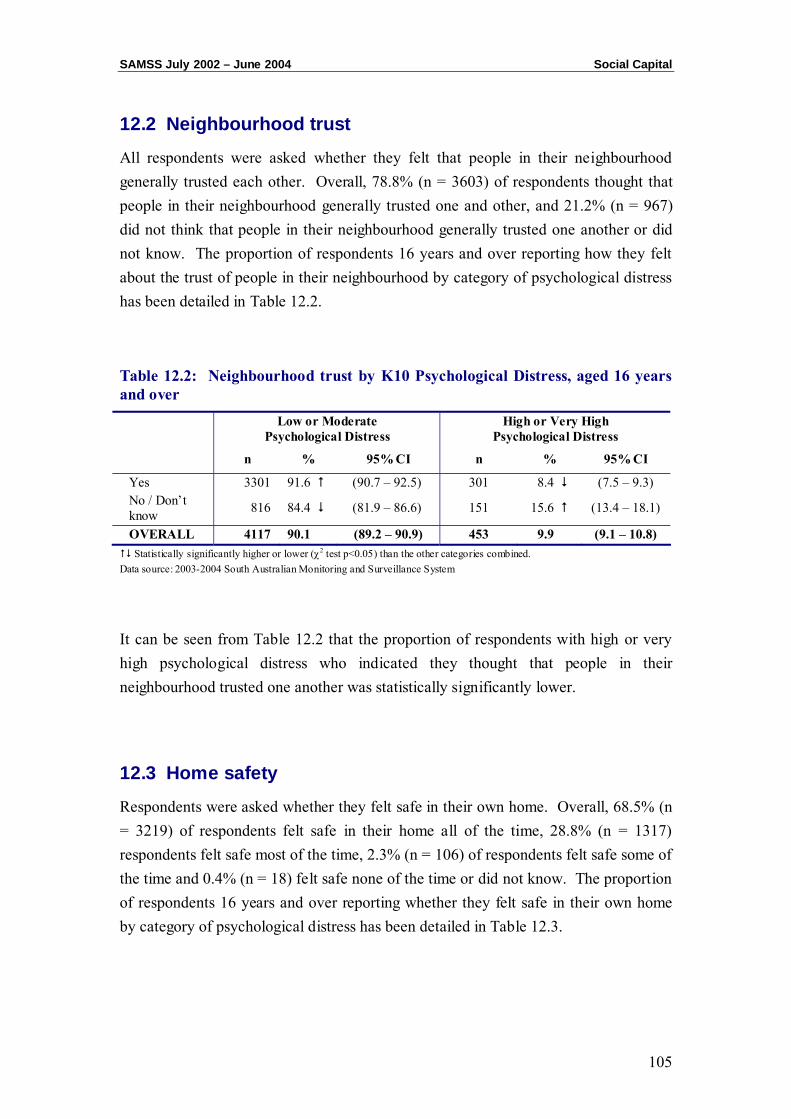
SAMSS July 2002 – June 2004 Social Capital
105
12.2 Neighbourhood trust
All respondents were asked whether they felt that people in their neighbourhood generally trusted each other. Overall, 78.8% (n = 3603) of respondents thought that people in their neighbourhood generally trusted one and other, and 21.2% (n = 967) did not think that people in their neighbourhood generally trusted one another or did not know. The proportion of respondents 16 years and over reporting how they felt about the trust of people in their neighbourhood by category of psychological distress has been detailed in Table 12.2.
Table 12.2: Neighbourhood trust by K10 Psychological Distress, aged 16 years and over
Low or Moderate Psychological Distress
High or Very High Psychological Distress
n % 95% CI n % 95% CI
Yes 3301 91.6 (90.7 – 92.5) 301 8.4 (7.5 – 9.3) No / Don’t know 816 84.4 (81.9 – 86.6) 151 15.6 (13.4 – 18.1)
OVERALL 4117 90.1 (89.2 – 90.9) 453 9.9 (9.1 – 10.8) Statistically significantly higher or lower (χ2 test p<0.05) than the other categories combined.
Data source: 2003-2004 South Australian Monitoring and Surveillance System
It can be seen from Table 12.2 that the proportion of respondents with high or very high psychological distress who indicated they thought that people in their neighbourhood trusted one another was statistically significantly lower.
12.3 Home safety
Respondents were asked whether they felt safe in their own home. Overall, 68.5% (n = 3219) of respondents felt safe in their home all of the time, 28.8% (n = 1317) respondents felt safe most of the time, 2.3% (n = 106) of respondents felt safe some of the time and 0.4% (n = 18) felt safe none of the time or did not know. The proportion of respondents 16 years and over reporting whether they felt safe in their own home by category of psychological distress has been detailed in Table 12.3.
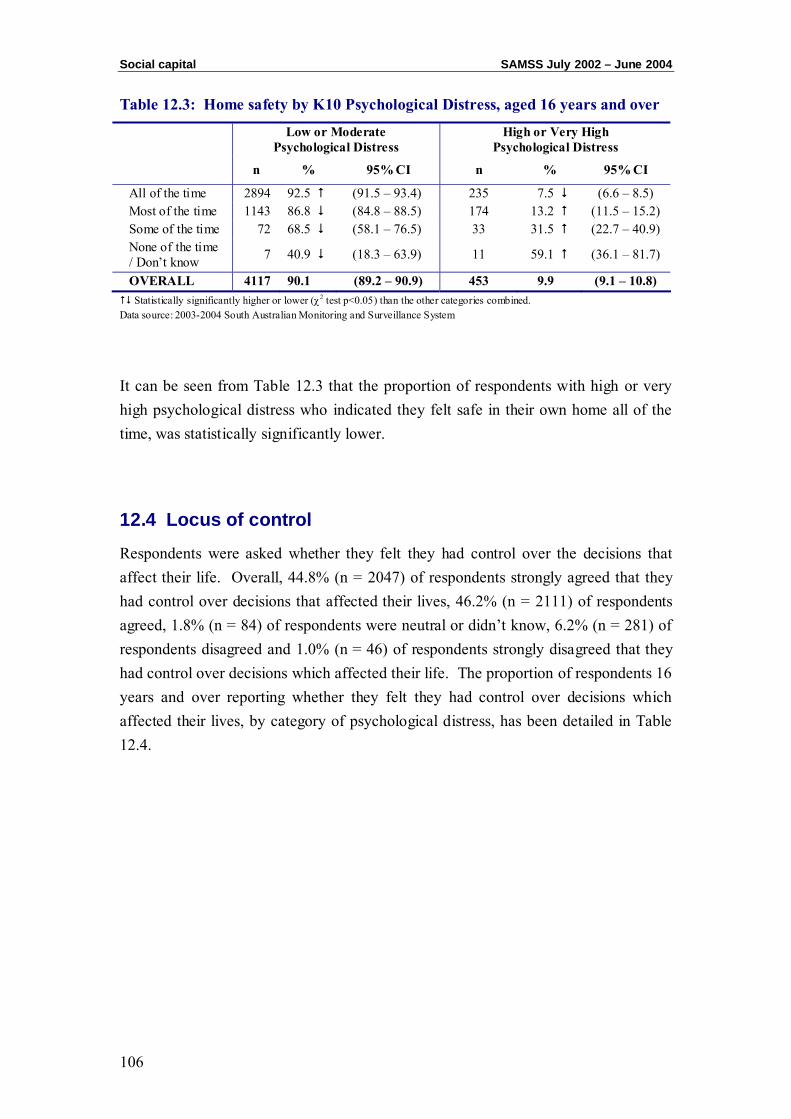
Social capital SAMSS July 2002 – June 2004
106
Table 12.3: Home safety by K10 Psychological Distress, aged 16 years and over
Low or Moderate Psychological Distress
High or Very High Psychological Distress
n % 95% CI n % 95% CI
All of the time 2894 92.5 (91.5 – 93.4) 235 7.5 (6.6 – 8.5) Most of the time 1143 86.8 (84.8 – 88.5) 174 13.2 (11.5 – 15.2) Some of the time 72 68.5 (58.1 – 76.5) 33 31.5 (22.7 – 40.9) None of the time / Don’t know 7 40.9 (18.3 – 63.9) 11 59.1 (36.1 – 81.7)
OVERALL 4117 90.1 (89.2 – 90.9) 453 9.9 (9.1 – 10.8) Statistically significantly higher or lower (χ2 test p<0.05) than the other categories combined.
Data source: 2003-2004 South Australian Monitoring and Surveillance System
It can be seen from Table 12.3 that the proportion of respondents with high or very high psychological distress who indicated they felt safe in their own home all of the time, was statistically significantly lower.
12.4 Locus of control
Respondents were asked whether they felt they had control over the decisions that affect their life. Overall, 44.8% (n = 2047) of respondents strongly agreed that they had control over decisions that affected their lives, 46.2% (n = 2111) of respondents agreed, 1.8% (n = 84) of respondents were neutral or didn’t know, 6.2% (n = 281) of respondents disagreed and 1.0% (n = 46) of respondents strongly disagreed that they had control over decisions which affected their life. The proportion of respondents 16 years and over reporting whether they felt they had control over decisions which affected their lives, by category of psychological distress, has been detailed in Table 12.4.

SAMSS July 2002 – June 2004 Social Capital
107
Table 12.4: Locus of Control by K10 Psychological Distress aged 16 years and over
Low or Moderate Psychological Distress
High or Very High Psychological Distress
n % 95% CI n % 95% CI
Strongly Agree 1960 95.8 (94.8 – 96.6) 86 4.2 (3.4 – 5.2) Agree 1873 88.7 (87.3 – 90.0) 238 11.3 (9.9 – 12.7) Neutral/Don’t know 61 72.4 (61.6 – 81.5) 23 27.6 (18.5 – 38.4)
Disagree 204 72.4 (66.9 – 77.6) 78 27.6 (22.7 – 33.5) Strongly Disagree 20 52.0 (29.2 – 58.8) 27 58.0 (43.3 – 72.7) OVERALL 4117 90.1 (89.2 – 90.9) 453 9.9 (9.1 – 10.8) Statistically significantly higher or lower (χ2 test p<0.05) than the other categories combined.
Data source: 2003-2004 South Australian Monitoring and Surveillance System
It can be seen from Table 12.3 that the proportion of respondents with high or very high psychological distress who indicated they strongly agreed they had control over decisions which affected their lives, was statistically significantly lower.

Social capital SAMSS July 2002 – June 2004
108
CHAPTER 13: DAYS LOST OR LIMITED BECAUSE OF HEALTH

Days lost or limited SAMSS July 2002 – June 2004
110
Respondents (n = 10299) were asked a series of questions about how their health affected their usual day-to-day activities and working life.
13.1 Days off from usual activities due to health
Respondents aged 16 years and over were asked, during the last four weeks, how many days they were totally unable to work or carry out their normal duties because of their health. Overall, 83.8% (n = 8567) of respondents had no days off or didn’t know, 4.9% (n = 498) had one day off, 3.7% (n = 377) had two days off, 3.7% (n = 377) had three days off, 1.5% (n = 156) had four days off, 1.2% (n = 124) had five days off, 0.8% (n = 85) had six days off and 3.8% (n = 391) had seven to 28 days where they were unable to work. The proportion of respondents 16 years and over reporting how many days they were totally unable to work or carry out their normal duties because of their health by category of psychological distress has been detailed in Table 13.1.
Table 13.1: Days off from usual activities because of health by K10 Psychological Distress, aged 16 years and over
Low or Moderate Psychological Distress
High or Very High Psychological Distress
n % 95% CI n % 95% CI
None/Don’t know 7893 92.1 (91.5 – 92.7) 674 7.9 (7.3 – 8.5) One day 447 89.8 (86.7 – 92.2) 51 10.2 (7.8 – 13.3) Two days 305 80.8 (76.5 – 84.7) 72 19.2 (15.3 – 23.5) Three days 115 73.3 (65.9 – 80.3) 42 26.7 (20.3 – 34.7) Four days 87 70.5 (61.2 – 77.9) 36 29.5 (21.4 – 37.9) Five days 59 70.1 (58.3 – 78.7) 25 29.9 (20.3 – 40.4) Six days 18 59.0 (39.3 – 74.9) 13 41.0 (25.1 – 60.7) Seven to 28 days 219 56.0 (50.9 – 60.9) 172 44.0 (39.0 – 49.1) OVERALL 9144 89.4 (88.8 – 90.0) 1085 10.6 (10.0 – 11.2) Statistically significantly higher or lower (χ2 test p<0.05) than the other categories combined.
Data source: 2003-2004 South Australian Monitoring and Surveillance System
It can be seen from Table 13.1 that the proportion of respondents with high or very high psychological distress indicating they did not have any days where they were unable to work because of their health, or did not know was statistically significantly lower.
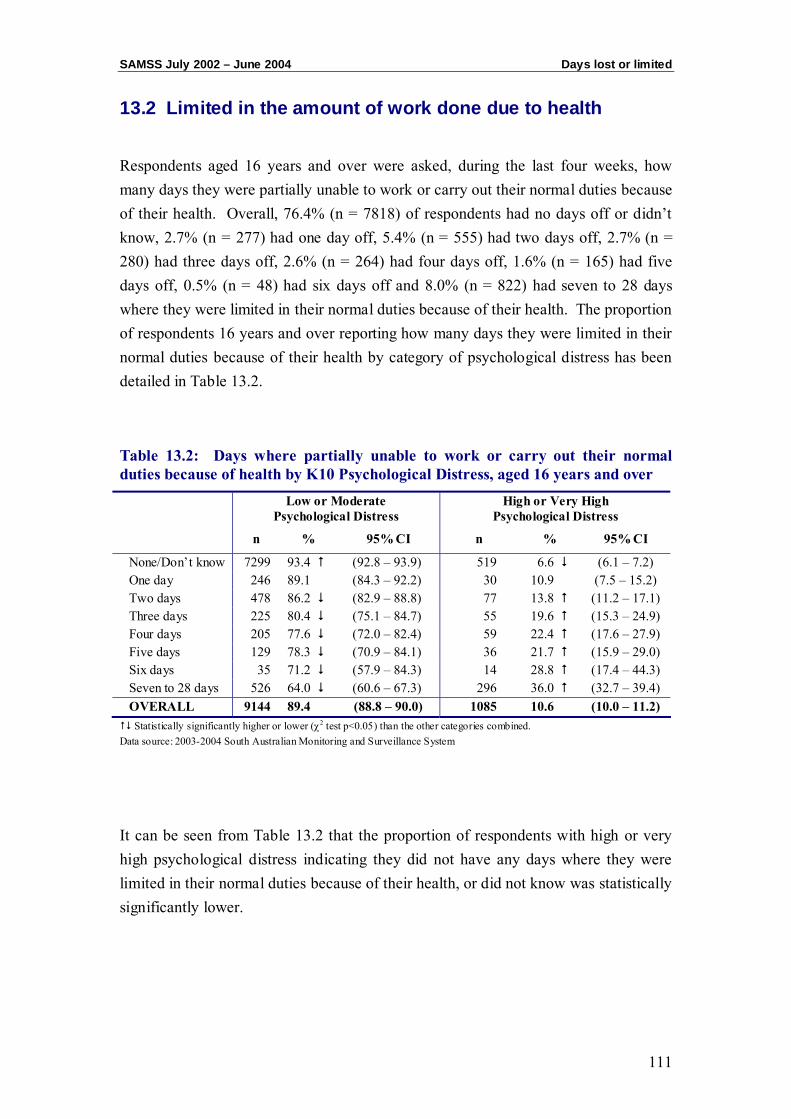
SAMSS July 2002 – June 2004 Days lost or limited
111
13.2 Limited in the amount of work done due to health
Respondents aged 16 years and over were asked, during the last four weeks, how many days they were partially unable to work or carry out their normal duties because of their health. Overall, 76.4% (n = 7818) of respondents had no days off or didn’t know, 2.7% (n = 277) had one day off, 5.4% (n = 555) had two days off, 2.7% (n = 280) had three days off, 2.6% (n = 264) had four days off, 1.6% (n = 165) had five days off, 0.5% (n = 48) had six days off and 8.0% (n = 822) had seven to 28 days where they were limited in their normal duties because of their health. The proportion of respondents 16 years and over reporting how many days they were limited in their normal duties because of their health by category of psychological distress has been detailed in Table 13.2.
Table 13.2: Days where partially unable to work or carry out their normal duties because of health by K10 Psychological Distress, aged 16 years and over
Low or Moderate Psychological Distress
High or Very High Psychological Distress
n % 95% CI n % 95% CI
None/Don’t know 7299 93.4 (92.8 – 93.9) 519 6.6 (6.1 – 7.2) One day 246 89.1 (84.3 – 92.2) 30 10.9 (7.5 – 15.2) Two days 478 86.2 (82.9 – 88.8) 77 13.8 (11.2 – 17.1) Three days 225 80.4 (75.1 – 84.7) 55 19.6 (15.3 – 24.9) Four days 205 77.6 (72.0 – 82.4) 59 22.4 (17.6 – 27.9) Five days 129 78.3 (70.9 – 84.1) 36 21.7 (15.9 – 29.0) Six days 35 71.2 (57.9 – 84.3) 14 28.8 (17.4 – 44.3) Seven to 28 days 526 64.0 (60.6 – 67.3) 296 36.0 (32.7 – 39.4) OVERALL 9144 89.4 (88.8 – 90.0) 1085 10.6 (10.0 – 11.2) Statistically significantly higher or lower (χ2 test p<0.05) than the other categories combined.
Data source: 2003-2004 South Australian Monitoring and Surveillance System
It can be seen from Table 13.2 that the proportion of respondents with high or very high psychological distress indicating they did not have any days where they were limited in their normal duties because of their health, or did not know was statistically significantly lower.
Days lost or limited SAMSS July 2002 – June 2004
112
REFERENCES 1 Creating Opportunity - South Australia Strategic Plan. Department of Premier and
Cabinet, Government of South Australia, March 2004.
2 Kessler R, Andrews G, Colpe L, Hiripi E, Mroczek D, Normand D, Walters E & Zaslavsky A. Short screening scales to monitor population prevalences and trends in non-specific psychological distress. Psychological Medicine. 2002; 32: 959-976.
3 Ware JE. The SF-36 Health Survey, Manual and Interpretation Guide. Boston: The Health Institute, New England Medical Centre, 1993.
4 Ware J, Kosinski M, Keller S. A 12-Item Short–Form Health Survey: Construction of Scales and Preliminary Tests of Reliability and Validity. Medical Care. 1996; 34: 220-233.
5 Robins L, Wing J, Wittchen H, Helzer J, Babor T, Burke J, Farmer A, Jablenski A, Pickens R, Regier D, Sartorius N, & Towle L. The Composite International Diagnostic Interview: an epidemiologic instrument suitable for use in conjunction with different diagnostic systems and in different cultures. Archives of General Psychiatry 1988; 45: 1069-1077.
6 Goldberg, DP & Blackwell, B: Psychiatric illness in general practice. A detailed study using a new method of case identification. British Medical Journal 1970, 1: 439 443
7 Australian Bureau of Statistics. Information Paper - Use of the Kessler Psychological Distress Scale in ABS Health Surveys. No 4817.0.55.001 21/05/2003. [Online] Available at http://www.abs.gov.au/Ausstats [Accessed: 29/06/2004]
8 Andrews G, Henderson S, & Hall W. Prevalence, comorbidity, disability and service utilization: an overview of the Australian National Mental Health Survey. British Journal of Psychiatry. 2001; 187: 145-153
9 Collaborative Health and Wellbeing CATI survey of Adults living in Western Australia, Northern Territory and South Australia. report 1. Summary of results by state/territory, December 2000. Report prepared for Commonwealth Department of Health and Ageing.
References SAMSS July 2002 – June 2004
114
10 Using the K10 to measure psychological distress. In: The Health of the People of New South Wales - Report of the Chief Health Officer: Methods. Epidemiology and Surveillance Branch, NSW Health Department, Sydney. [Online] Available at:http://www.health.nsw.gov.au/public-health/chorep/toc/choindex.htm [Accessed: 29/06/2004]
11 Victorian Department of Human Services, Victorian Population Health Survey 2001, Selected Findings. Rural and Regional Aged Care Services, Victoria. 2002.
12 Victorian Department of Human Services, Victorian Population Health Survey 2003 Selected Findings. Rural and Regional Aged Care Services, Victoria. 2004.
13 Australian Bureau of Statistics. 4364.0 National Health Survey 2001 - Summary of Results, Australia. 2002. [Online] Available at http://www.abs.gov.au/Ausstats/[email protected] [Accessed: 24/08/2004]
14 Population Research & Outcome Studies Unit. The Social, Environmental and Risk Context Information System (SERCIS). Brief Report 2002-11. South Australian Department of Health. 2002 [Online] Available at http://www.dh.sa.gov.au/pehs/PROS/brief-reports-pros.html [Accessed: 25/11/2004]
15 Population Research & Outcome Studies Unit. SAMSS Technical Paper Series No2/04 Survey Questionnaire. South Australian Department of Health. August 2004 [Online] Available at http://www.dh.sa.gov.au/pehs/PROS/samss-tech-paper2-survey.pdf [Accessed: 25/11/2004]
16 Kessler R & Mroczek D. Final versions of our non-specific psychological distress scale. Michigan: Institute for Social Research, University of Michigan. 1994.
17 K10 Symptom Scale. Clinical Research Unit for Anxiety and Depression. A WHO Collaborating Center. School of Psychiatry, University of NSW, 2000. [Online] Available at: http://www.crufad.unsw.edu.au/K10/k10info.htm. [Accessed: 30/3/2001]
18 Saunders D & Daly A. 2000 Collaborative Health and Wellbeing Survey: Psychological distress in the Western Australian population. Health Department of Western Australia, June 2001.
19 Australian Bureau of Statistics. 4817.0.55.001 Information Paper – Use of the Kessler Psychological Distress Scale in ABS Health Surveys. 2003 [Online] Available at http://www.abs.gov.au/Ausstats/[email protected] [Accessed: 29/06/2004]
SAMSS July 2002 – June 2004 References
115
20 Taylor A, Dal Grande E, Gill T, Delfabbro P, Glen V, Goulding S et al. Gambling Patterns of South Australia and associated health indicators May 2001 Centre for Population Studies in Epidemiology, SA Department of Human Services, 2001.
21 Australian Bureau of Statistics. Census of Population and Housing. Socio-economic Indexes for Areas. Information paper. ABS Catalogue no. 2039.0. 1996.
22 Measuring Remoteness: Accessibility/Remoteness Index of Australia (ARIA). Information and Research Branch, Department of Health and Aged Care, and the National Key Centre for Social Applications of Geographical Information Systems (GISCA), University of Adelaide. Department of Health and Aged Care Occasional Papers: New Series No. 6, August 1999. Online [accessed: October 2000] http://www.health.gov.au/ari/aria.htm
23 World Health Organization. Obesity: preventing and managing the global epidemic. Report of a WHO consultation on obesity. Geneva, 3-5 1997. Geneva: WHO 2000.
24 NHMRC. Australian Alcohol Guidelines - Health Risks and Benefits. Commonwealth of Australia 2001.
25 Physical Activity Levels of South Australian Adults 2001. Health Promotion SA, South Australian Department of Human Services. 2003.
26 Armstrong T, Bauman A & Davies J. Physical Activity Patterns of Australian Adults. Results of the 1999 National Physical Activity Survey. August 2000 Australian Institute of Health and Welfare, Canberra. AIHW Cat No. CVD 10.
27 Goldberg D & Hilier V. A scaled version of the general health questionnaire. Psychological Medicine. 1979; 9: 139-145