Embed Size (px)
Citation preview

Wheat Quality Council
Hard Spring Wheat Technical Committee
2017 Crop
February 20-22, 2018
Kansas City, MO
2
Wheat Quality Council
Hard Spring Wheat Technical Committee
2017 Crop
Sponsored by the Wheat Quality Council February 20-22, 2018
Dave Green, Executive Vice President Wheat Quality Council
P.O. Box 19539 Lenexa, KS 66285
Phone: 913-634-0248 E-mail: [email protected]
Linda Dykes, Ph.D., Editor
USDA-ARS Hard Red Spring & Durum Wheat Quality Laboratory Cereal Crops Research Unit
Red River Valley Agricultural Research Center Harris Hall, North Dakota State University
Fargo, ND 58102 Phone: 701-239-1412
Email: [email protected]

3
Table of Contents
Introduction ................................................................................................................................... 4
Source of wheat ............................................................................................................................ 5
Field Plot Locations and Procedures ............................................................................................ 5
Field Production Data ................................................................................................................... 6
Climate, Disease, and Field Conditions ........................................................................................ 7
Description of 2017 Hard Spring Wheat Lines .............................................................................. 8
Wheat Production Sites .............................................................................................................. 10
Grain Cleaning and Milling Procedures ...................................................................................... 11
Methods of Analysis .................................................................................................................... 11
Test Bake Procedures ................................................................................................................ 13
Bake Cooperators ....................................................................................................................... 14
Quality Data of 2017 Hard Spring Wheat Lines .......................................................................... 15
SWQAC #1 – WB9719 ........................................................................................................ 15
SWQAC #2 – SD4465 ......................................................................................................... 21
SWQAC #3 – WB9616CLP ................................................................................................. 27
SWQAC #4 – LCS Rebel ..................................................................................................... 33
SWQAC #5 – MN13288-1 ................................................................................................... 43
SWQAC #6 – SY Rockford .................................................................................................. 49
SWQAC #7 – WB9479 ........................................................................................................ 55
SWQAC #8 – SD4579 ......................................................................................................... 65
SWQAC #10 – WB9590 ...................................................................................................... 71
Appendix ..................................................................................................................................... 81
Wheat Marketing Score ....................................................................................................... 82
Method #1 ....................................................................................................................... 82
Method #2 ....................................................................................................................... 83
Wheat Kernel Characteristics by Location ........................................................................... 84
Flour Characteristics by Location ........................................................................................ 85
Flour Protein Characteristics by Location ............................................................................ 86
Farinograph Characteristics by Location ............................................................................. 87
Mixograph Characteristics by Location ................................................................................ 88
Interpreting Mixogram Results ............................................................................................. 89
Extensograph Characteristics by Location .......................................................................... 90
Ash/Protein Content in Mill Streams .................................................................................... 93
Cooperators’ Bake Data .................................................................................................... 101 Hard Red Spring Wheat Breeding Quality Target Values .................................................. 124

4
Wheat Quality Council
Hard Spring Wheat Technical Committee
Introduction Breeders’ experimental lines of wheat are evaluated for overall quality before being released for commercial production. The Hard Spring Wheat Technical Committee provides milling and baking quality data on breeders’ experimental lines of wheat that are annually submitted to the Wheat Quality Council (WQC). The impact is the commercialization of high quality wheat for production and processing. Nine experimental lines of hard spring wheat were grown at up to six locations in 2017 and evaluated for kernel, milling, and bread baking quality against the check variety Glenn. To avoid any bias in the test procedures, code numbers were assigned to the experimental lines and maintained throughout the growing and harvesting of the plots and the milling and baking trials. Wheat samples were milled and analyzed at the USDA Hard Red Spring and Durum Wheat Quality Laboratory (WQL), Fargo, ND. Flour samples were shipped to independent laboratories and tested for bread baking quality. From this report: The WQC makes no representation regarding the accuracy or conclusiveness of the data developed by and received from the participating laboratories. The data has been scientifically determined and accurately reported from the perspective of the Hard Spring Wheat Technical Committee. The results relate only to test samples that were volunteered for testing in the 2017 crop year. Test results from other crop years may differ from those reported herein. The Hard Spring Wheat Technical Committee, by compilation of data and issuance of this report, does not make or intend any general recommendations or conclusions on its part with respect to the desirability of any wheat included in the tests. Mention of a vendor, product, proprietary product, or procedure does not constitute a guarantee or warranty of the vendor, product, or procedure by the Hard Spring Wheat Technical Committee or by cooperating laboratories, and does not imply its approval to the exclusion of other vendors, products, or procedures that may also be suitable. Data reported herein are not to be used in any publication or literature or for advertising or publicity purposes.

5
The 2017 Wheat Quality Testing Program
Source of Wheat
Source/Breeding Program SWQAC Code # Identification
WestBred 1 WB9719 South Dakota State University 2 SD4465 WestBred 3 WB9616CLP Limagrain 4 LCS Rebel University of Minnesota 5 MN13288-1 Syngenta 6 SY Rockford WestBred 7 WB9479 South Dakota State University 8 SD4579 North Dakota State University 9 Glenn (Check) WestBred 10 WB9590
Field Plot Locations and Procedures
Coordinators: Steve Sebesta, Ph.D., Director and Gonzalo Rojas-Cifuentes, Ph.D., Assistant Director, Foundation Seedstocks, Department of Plant Sciences, North Dakota State University. The experimental lines and check variety were grown at the following locations in the spring wheat region:
Northeast Research Station (Watertown), South Shore, SD South Dakota State University, Brookings, SD – Jack Ingemansen;
Agronomy Seed Farm, Casselton, ND – Brian Otteson; Northern Agricultural Research Center, Havre, MT – Peggy Lamb; Northwest Research and Outreach Center, Crookston, MN – Mark Hanson; North Central Agricultural Experiment Station, Minot, ND – Eric Eriksmoen; Williston Research Extension Center, Williston, ND – Kyle Dragseth.
Wheat was seeded in large-scale plots of ½ acre in size to approximate commercial production. Cultural practices such as tillage and weed control common to each area were used. Consideration was also given to germination, seed size, and planting depth to provide stand uniformity. Based on soil test results from each locations, nitrogen fertilizer was applied to the test plots at rates approaching higher levels than used commercially to more fully express the potential of each experimental line. Levels of phosphorus and potassium were applied in sufficient amounts so as not to be limiting factors. Each plot was individually harvested and the grain produced was thoroughly blended to obtain a uniform sample representing the entire plot.

6
Field Production Data
Variable Watertown Casselton Havre Crookston Minot Williston Planting Date 4/24/2017 5/6/2017 5/1/2017 5/15/2017 4/28/2017 5/10/2017 Harvest Date 8/31/2017 8/23/2017 8/7/2017 8/23/2017 8/17/2017 8/17/2017 Fertilizer (lb/A) N 250 170 100 171 125 89 P 192 31 20 4 ppm 54 225 ppm K 257 558 10 179 ppm 436 282 ppm Herbicide(rate/A) Broadleaf Wolverine 1.7 pt. Bronate 1 pt. Bromac 24 oz. Bromac 1 pt. Goldsky 1 pt. Goldsky 16 oz. Grass Puma 0.5 pt * Axial XL 16 oz. Goldsky 1 pt. Fungicide Folicur 4 oz. Prosaro 6.5 oz. * * * Tilt 3 oz.
*No application.
CLIMATOLOGICAL DATA
Average Temperature (°F) / Precipitation (in.) Month Watertown Casselton Havre Crookston Minot Williston April 43.9 / 1.94 43.6 / 1.25 44.4 / 0.25 42.8 / 0.79 43.0 / 0.47 45.3 / 0.48 May 55.2 / 1.39 56.1 / 0.97 54.3 / 0.45 55.0 / 0.94 56.0 / 0.63 58.3 / 0.89 June 66.6 / 5.00 66.8 / 4.78 63.8 / 1.57** 65.5 / 3.41 64.0 / 2.04 66.3 / 1.29 July 71.4 / 1.66 70.3 / 0.95 73.6 / 0.14 68.9 / 1.42 72.0 / 0.45 70.0 / 1.27 August 63.8 / 6.01 65.2 / 3.16 67.3 / 0.12 65.4 / 0.77 64.0 / 2.54 65.0 / 2.81
*Data not available. **Includes a single day 0.98” rain event.
YIELD DATA
Yield (bu/acre) / Test Weight (lb/bu) / % Moisture SWQAC Code # Watertown Casselton Havre Crookston Minot Williston
1 * * 28.7 / 60.3 / 9.5 * 45.0 / 58.8 / 11.0 ** / 55.2 / 12.7 2 57.9 / 57.0 / 12.0 72.3 / 60.0 / 12.0 * 72.0 / 62.0 / 13.5 * * 3 * * 24.8 / 57.1 / 9.5 * * ** / 56.4 / 12.2 4 43.8 / 57.0 / 12.3 73.3 / 62.0 / 12.7 28.0 / 59.4 / 9.5 78.0 / 64.0 / 14.3 62.0 / 59.5 / 11.0 ** / 55.3 / 12.3 5 * 72.1 / 58.0 / 12.0 30.4 / 58.3 / 9.3 75.0 / 60.0 / 12.9 * * 6 * * 30.6 / 57.4 / 9.4 * 66.0 / 57.4 / 11.0 ** / 54.6 / 11.7 7 61.8 / 57.0 / 11.8 86.7 / 60.0 / 11.6 * 72.0 / 62.0 / 12.9 58.0 / 59.4 / 11.0 ** / 54.5 / 11.3 8 53.5 / 57.5 / 12.4 74.6 / 61.0 / 12.1 * 66.0 / 61.0 / 13.5 * * 9 57.1 / 60.4 / 12.4 74.9 / 60.0 / 12.0 22.4 / 60.4 / 9.5 64.0 / 61.0 / 13.5 38.0 / 60.4 / 11.0 ** / 56.0 / 12.3
10 64.3 / 55.9 / 11.8 81.8 / 61.0 / 12.5 26.2 / 58.4 / 9.4 71.0 / 62.0 / 12.7 44.0 / 58.5 / 11.0 ** / 55.0 / 12.1 Site Totals 6 7 7 7 6 7
*Not increased at this site. ** Data not available
7
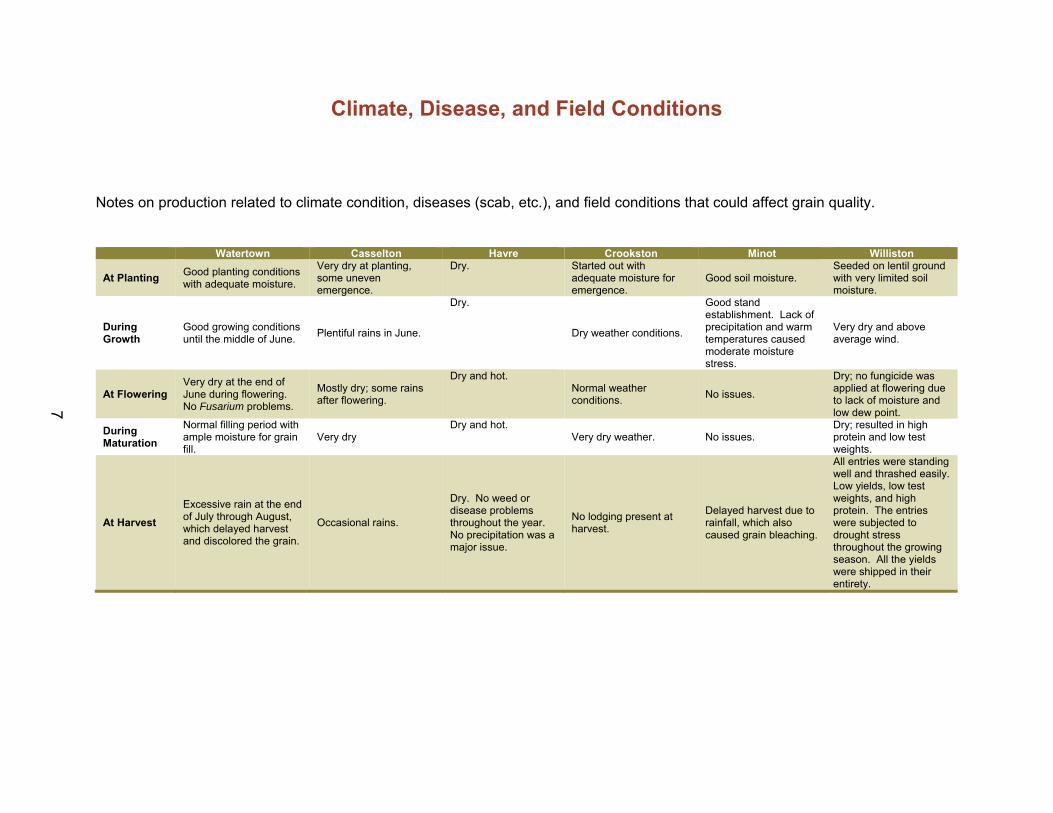
Climate, Disease, and Field Conditions
Notes on production related to climate condition, diseases (scab, etc.), and field conditions that could affect grain quality.
Watertown Casselton Havre Crookston Minot Williston
At Planting Good planting conditions with adequate moisture.
Very dry at planting, some uneven emergence.
Dry. Started out with adequate moisture for emergence.
Good soil moisture. Seeded on lentil ground with very limited soil moisture.
During Growth
Good growing conditions until the middle of June.
Plentiful rains in June.
Dry.
Dry weather conditions.
Good stand establishment. Lack of precipitation and warm temperatures caused moderate moisture stress.
Very dry and above average wind.
At Flowering Very dry at the end of June during flowering. No Fusarium problems.
Mostly dry; some rains after flowering.
Dry and hot. Normal weather conditions.
No issues.
Dry; no fungicide was applied at flowering due to lack of moisture and low dew point.
During Maturation
Normal filling period with ample moisture for grain fill.
Very dry Dry and hot.
Very dry weather. No issues. Dry; resulted in high protein and low test weights.
At Harvest
Excessive rain at the end of July through August, which delayed harvest and discolored the grain.
Occasional rains.
Dry. No weed or disease problems throughout the year. No precipitation was a major issue.
No lodging present at harvest.
Delayed harvest due to rainfall, which also caused grain bleaching.
All entries were standing well and thrashed easily. Low yields, low test weights, and high protein. The entries were subjected to drought stress throughout the growing season. All the yields were shipped in their entirety.

8
Description of 2017 Hard Spring Wheat Lines
SWQAC #1 – WB9719 WB9719 is a hard red spring wheat variety released by WestBred. It is above average yielding and average in grain protein, making it a well-balanced variety. WB9719 is of medium plant height and is a medium-late maturing variety. The straw strength for WB9719 is very good, similar to SY Ingmar and SY Soren. WB9719 is well adapted to high stress environments from moisture or temperature. The disease package for WB9719 is characterized by better scab tolerance than WB-Mayville, exceptional yellow rust resistance, and medium-susceptibility to both bacterial leaf streak and tan spot. WB9719 has very good milling and baking end-use quality. SWQAC #2 – SD4465 SD4465 is an F4 derived line selected from the population SD4078/SD4027. Over the years 2014 through 2016, SD4465 has been found to have good yield potential as well as slightly better than average test weight and average protein concentration. Its level of FHB resistance appears to be average or slightly below average, however, its BLS resistance is slightly better than average. Bread loaf volume is also similar to average. Due to lack of plant height uniformity, SD4465 has been discarded. SWQAC #3 – WB9616CLP
WB9616CLP is a hard red spring wheat variety released by WestBred. It is a two-gene clearfield tolerant variety for use with the clearfield system of weed management. It has average yield and grain protein, exceptional for a clearfield line. It is a medium-late maturing line with medium-short plant height. Standability for WB9616CLP is very good in Montana. WB9616CLP is well adapted to Montana. The disease package for WB9616CLP is characterized by very good resistance to bacterial leaf streak and strip rust, similar scab susceptibility ratings to WB-Mayville, medium-susceptibility to tan spot, and no resistance to wheat stem sawfly. SWQAC #4 – LCS Rebel LCS Rebel is a hard red spring wheat marketed by Limagrain Cereal Seeds. LCS Rebel was selected for a consistent combination of top end yield potential and 14%+ levels of protein content. The disease resistance package for this new release is highlighted by resistance to current races of stripe and stem rust. LCS Rebel is adapted to all growing regions in North Dakota and Minnesota, and performed very well across all Montana crop zones in 2017. SWQAC #5 – MN13288-1 MN13288-1 (Linkert/Sabin) is an early-mid maturity hard red spring wheat that has relatively high grain yield and protein and has good overall disease resistance, including Fusarium head blight resistance equivalent to the most resistant current varieties. Straw strength is average. MN13288-1 is resistant to preharvest sprouting and has exhibited good end-use quality characteristics.

9
SWQAC #6 – SY Rockford SY Rockford is a hard red spring wheat bred and developed by Syngenta Crop Protection, LLC for the Northern Plains and is best adapted for Montana and the Western areas of North and South Dakota. SY Rockford was selected from the cross of two Agripro experimental lines 02S0262-2-5 and 01S0236-6. It has medium heading, later than SY Ingmar but earlier than Jenna, with high test weight. It is a standard semidwarf hollow stemmed variety, similar in height to ‘Freyr’. Straw strength is good, similar to SY Rowyn. It is resistant to stem rust and intermediate to leaf rust. Tolerance to leaf spotting diseases has been very good; however, it is susceptible to Bacterial Leaf Streak. It is moderately resistant to FHB. Protein levels have been moderate slightly higher than ‘SY Rowyn’. Overall, bread making characteristics are acceptable. SWQAC #7 – WB9479 WB9479 is a hard red spring wheat variety released by WestBred. It has very similar attributes to the line WB-Mayville. It has well above average grain protein, with average to above average yield, making it a well-balanced variety for yield and protein. It has very strong straw, with standability similar to WB-Mayville, though lower than Linkert. The height of WB9479 is medium short and maturity is medium. WB9479 has better scab tolerance than WB-Mayville, exceptional yellow rust resistance, and is medium-susceptible to bacterial leaf streak and tan spot. The milling and baking quality for WB9479 is exceptional. SWQAC #8 – SD4579 SD4579 is an F4 derived line developed from the population SD4201/SD4178. SD4178 was released as ‘Prevail’ in 2013. SD4579 features a combination of grain yield potential, test weight, and protein concentration that are all above average. Its height, heading date, and level of FHB resistance are all within the range of acceptability. Its level of resistance to Fusarium Damaged Kernels is, however, significantly better than average. Its BLS resistance level is not high, though not significantly below average. Due to poorer than expected performance in 2016, SD4579 has been discarded. SWQAC #10 – WB9590 WB9590 is a hard red spring wheat variety released by WestBred. It is of short plant height and is of medium maturity. It has exceptional yield potential similar to Prosper, and average to above average grain protein, making it a well-balanced variety. WB9590 has very good straw strength, similar to SY Ingmar or SY Soren. It is broadly adapted across the Northern Plains and Montana. WB9590 has better scab tolerance than WB-Mayville, very good yellow rust resistance, and is medium-susceptible to bacterial leaf streak and tan spot. The milling and baking quality for WB9590 is good to very good.

10
Wheat Production Sites
SWQAC Production Sites Code # Entry Source Watertown Casselton Havre Crookston Minot Williston
1 WB9719 WestBred X X X 2 SD4465 SDSU X X X 3 WB9616CLP WestBred X X 4 LCS Rebel Limagrain X X X X X X 5 MN13288-1 UMN X X X 6 SY Rockford Syngenta X X X 7 WB9479 WestBred X X X X X 8 SD4579 SDSU X X X 9 Glenn NDSU X X X X X X 10 WB9590 WestBred X X X X X X

11
Grain Cleaning and Milling Procedures Wheat (approximately 1.5 bu/line) was cleaned in a Carter-Day Bulldog seed cleaner that was equipped with two rotating indent cylinders (#24 – coarse; #16 – fine), a sizer cylinder (#5), vibrator, and air aspiration. Cleaned wheat (70 lbs) was tempered to 16.5% moisture content and conditioned for approximately 24 hours before milling. Milling was performed on the Buhler MLU-202 following AACC method 26-21A. Feed rate was set at approximately 130 g/min. Flour blending: Six mill streams were blended to straight grade flour. Cumulative ash content was calculated based on product basis milling yield (14% moisture basis). Milling streams blended to straight grade – 1st Break (1 BK), 2nd Break (2 BK), 3rd Break (3 BK), 1st Reduction (1 R), 2nd Reduction (2 R), and 3rd Reduction (3 R). Calculation of flour extraction:
Tempered wheat basis (TWB, %): straight grade flour extraction percentage of tempered wheat (14% mb);
Total product basis (TPB, %): straight grade flour percentage of the total mill product (14% mb);
Pounds of straight grade flour / bushel wheat (FWB): estimated pounds of straight grade flour (14% mb) per bushel of wheat sample.
Methods of Analysis
Wheat Market Value Score;
DON levels - analyzed by NDSU, Department of Plant Sciences (gas chromatography
method, J. AOAC Int. 79:472, 1996);
Test weight (AACCI Method 55-10);
Wheat and flour protein (AACCI Method 46-30 – combustion method);
Wheat and flour ash (AACCI Method 08-01);
Kernel Size (Sieving according to USDA-ARS WQL);
Wheat and flour Falling Number (Perten Falling Number System);
Single kernel characteristics (Perten Single Kernel Characterization System – SKCS):
o Mean and standard deviation values were calculated from 300 kernels.
12
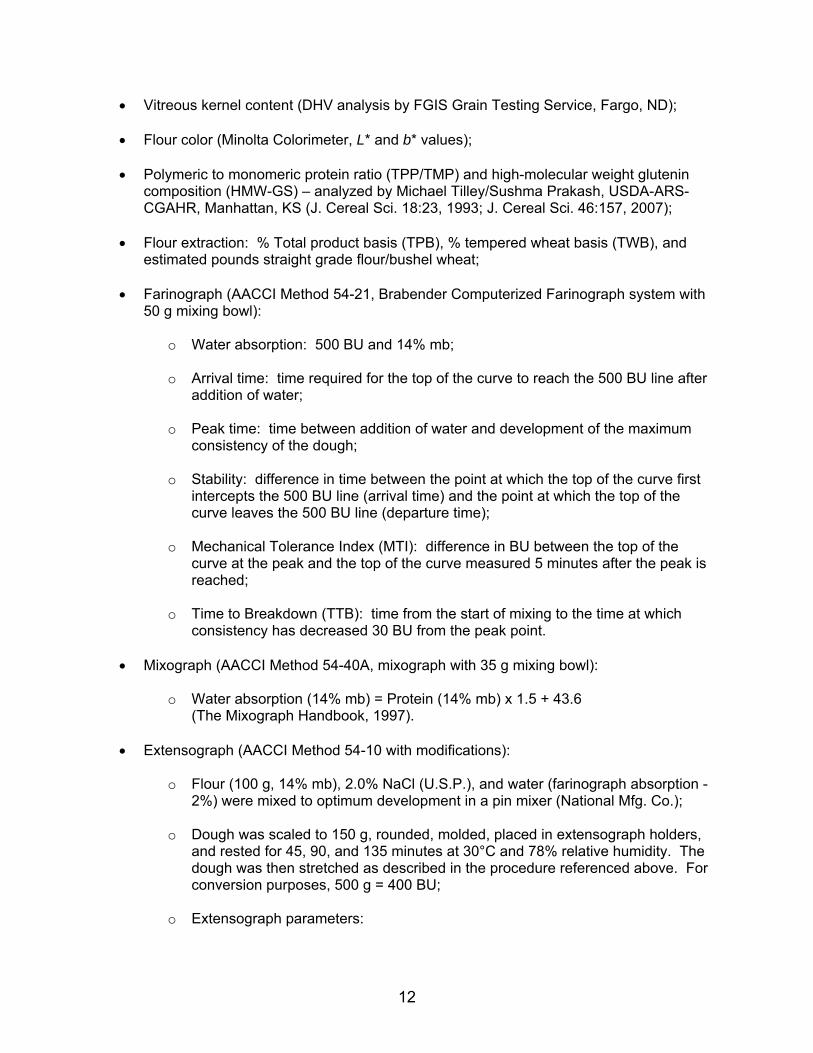
Vitreous kernel content (DHV analysis by FGIS Grain Testing Service, Fargo, ND);
Flour color (Minolta Colorimeter, L* and b* values);
Polymeric to monomeric protein ratio (TPP/TMP) and high-molecular weight glutenin composition (HMW-GS) – analyzed by Michael Tilley/Sushma Prakash, USDA-ARS-CGAHR, Manhattan, KS (J. Cereal Sci. 18:23, 1993; J. Cereal Sci. 46:157, 2007);
Flour extraction: % Total product basis (TPB), % tempered wheat basis (TWB), and
estimated pounds straight grade flour/bushel wheat;
Farinograph (AACCI Method 54-21, Brabender Computerized Farinograph system with 50 g mixing bowl):
o Water absorption: 500 BU and 14% mb;
o Arrival time: time required for the top of the curve to reach the 500 BU line after
addition of water;
o Peak time: time between addition of water and development of the maximum consistency of the dough;
o Stability: difference in time between the point at which the top of the curve first
intercepts the 500 BU line (arrival time) and the point at which the top of the curve leaves the 500 BU line (departure time);
o Mechanical Tolerance Index (MTI): difference in BU between the top of the
curve at the peak and the top of the curve measured 5 minutes after the peak is reached;
o Time to Breakdown (TTB): time from the start of mixing to the time at which
consistency has decreased 30 BU from the peak point.
Mixograph (AACCI Method 54-40A, mixograph with 35 g mixing bowl):
o Water absorption (14% mb) = Protein (14% mb) x 1.5 + 43.6 (The Mixograph Handbook, 1997).
Extensograph (AACCI Method 54-10 with modifications):
o Flour (100 g, 14% mb), 2.0% NaCl (U.S.P.), and water (farinograph absorption -
2%) were mixed to optimum development in a pin mixer (National Mfg. Co.);
o Dough was scaled to 150 g, rounded, molded, placed in extensograph holders, and rested for 45, 90, and 135 minutes at 30°C and 78% relative humidity. The dough was then stretched as described in the procedure referenced above. For conversion purposes, 500 g = 400 BU;
o Extensograph parameters:

13
Energy (cm2): area under the curve;
Resistance to extension (BU): height of the curve 50 mm after the beginning of torque increase;
Extensibility (cm): total length of the curve at the baseline;
Maximum resistance (BU): maximum curve height;
Ratio number: quotient of resistance to extension and extensibility;
Ratio number (max.): quotient of maximum resistance and extensibility.
Test Bake Procedures
Samples of flour were shipped to cooperators for evaluation of baking properties. The flour had been uniformly malted to a falling number of approximately 250 seconds. Bleach was not added to the flour. Each cooperator test baked the flour according to their standard method using straight dough, sponge and dough, or other test bake methods. Cooperator data were returned to the WQL for compilation of results.

14
Bake Cooperators
ADM Milling – Overland Park, KS;
Ardent Mills – Denver, CO;
Bay State Milling – Winona, MN;
General Mills – Minneapolis, MN;
Grain Craft – Wichita, KS;
Limagrain Cereal Seeds LLC – Fort Collins, CO;
North Dakota Mill – Grand Forks, ND;
North Dakota State University, Department of Plant Sciences – Fargo, ND;
Syngenta – Berthoud, CO;
USDA-ARS Hard Red Spring & Durum Wheat Quality Laboratory – Fargo, ND;
USDA-ARS Hard Winter Wheat Quality Laboratory – Manhattan, KS;
USDA-ARS Western Wheat Quality Laboratory – Pullman, WA;
Wheat Marketing Center – Portland, OR.
The Wheat Quality Council acknowledges the dedication and sacrifice of time by those individuals who are involved in test baking hard spring wheat samples. Your efforts are well appreciated by wheat breeders, commercial flour millers and bakers, and wheat marketing personnel who inspire the overall industry to improve the quality of U.S. wheat.
15
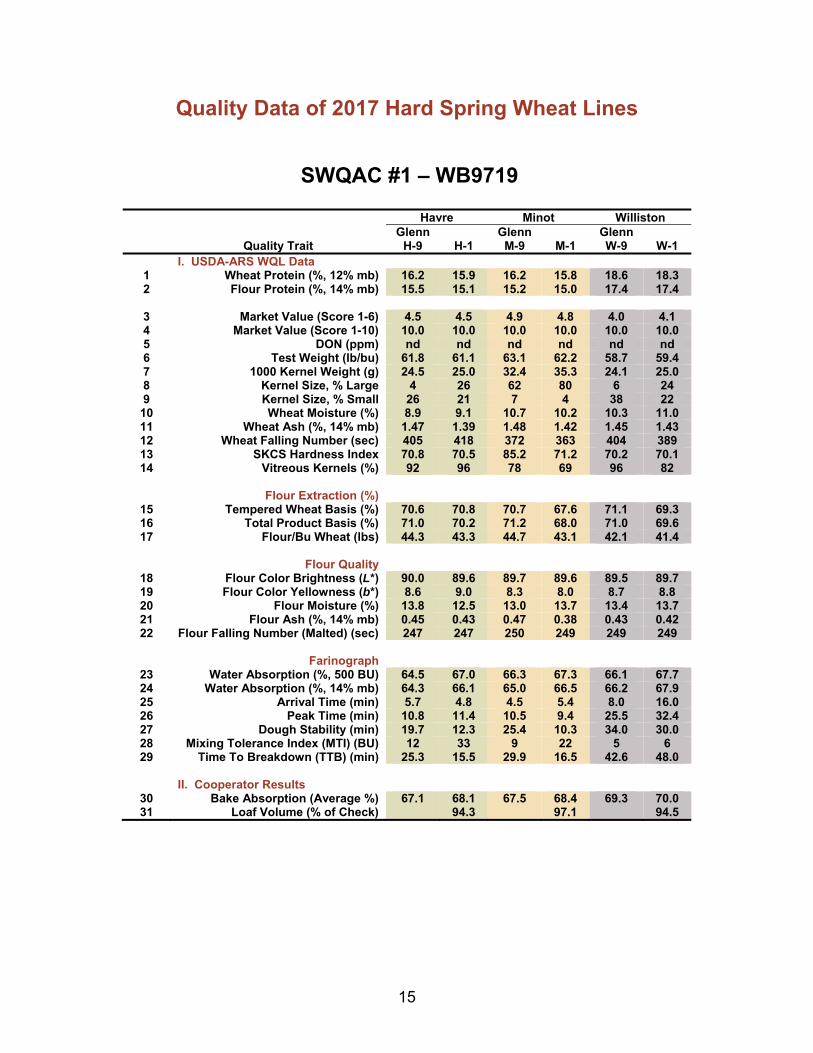
Quality Data of 2017 Hard Spring Wheat Lines
SWQAC #1 – WB9719
Havre Minot Williston
Quality Trait Glenn
H-9
H-1 Glenn M-9
M-1
Glenn W-9
W-1
I. USDA-ARS WQL Data 1 Wheat Protein (%, 12% mb) 16.2 15.9 16.2 15.8 18.6 18.3 2 Flour Protein (%, 14% mb) 15.5 15.1 15.2 15.0 17.4 17.4
3 Market Value (Score 1-6) 4.5 4.5 4.9 4.8 4.0 4.1 4 Market Value (Score 1-10) 10.0 10.0 10.0 10.0 10.0 10.0 5 DON (ppm) nd nd nd nd nd nd 6 Test Weight (lb/bu) 61.8 61.1 63.1 62.2 58.7 59.4 7 1000 Kernel Weight (g) 24.5 25.0 32.4 35.3 24.1 25.0 8 Kernel Size, % Large 4 26 62 80 6 24 9 Kernel Size, % Small 26 21 7 4 38 22
10 Wheat Moisture (%) 8.9 9.1 10.7 10.2 10.3 11.0 11 Wheat Ash (%, 14% mb) 1.47 1.39 1.48 1.42 1.45 1.43 12 Wheat Falling Number (sec) 405 418 372 363 404 389 13 SKCS Hardness Index 70.8 70.5 85.2 71.2 70.2 70.1 14 Vitreous Kernels (%) 92 96 78 69 96 82
Flour Extraction (%)
15 Tempered Wheat Basis (%) 70.6 70.8 70.7 67.6 71.1 69.3 16 Total Product Basis (%) 71.0 70.2 71.2 68.0 71.0 69.6 17 Flour/Bu Wheat (lbs) 44.3 43.3 44.7 43.1 42.1 41.4
Flour Quality
18 Flour Color Brightness (L*) 90.0 89.6 89.7 89.6 89.5 89.7 19 Flour Color Yellowness (b*) 8.6 9.0 8.3 8.0 8.7 8.8 20 Flour Moisture (%) 13.8 12.5 13.0 13.7 13.4 13.7 21 Flour Ash (%, 14% mb) 0.45 0.43 0.47 0.38 0.43 0.42 22 Flour Falling Number (Malted) (sec) 247 247 250 249 249 249
Farinograph
23 Water Absorption (%, 500 BU) 64.5 67.0 66.3 67.3 66.1 67.7 24 Water Absorption (%, 14% mb) 64.3 66.1 65.0 66.5 66.2 67.9 25 Arrival Time (min) 5.7 4.8 4.5 5.4 8.0 16.0 26 Peak Time (min) 10.8 11.4 10.5 9.4 25.5 32.4 27 Dough Stability (min) 19.7 12.3 25.4 10.3 34.0 30.0 28 Mixing Tolerance Index (MTI) (BU) 12 33 9 22 5 6 29 Time To Breakdown (TTB) (min) 25.3 15.5 29.9 16.5 42.6 48.0
II. Cooperator Results
30 Bake Absorption (Average %) 67.1 68.1 67.5 68.4 69.3 70.0 31 Loaf Volume (% of Check) 94.3 97.1 94.5

16
SWQAC #1 – WB9719
Havre Minot Williston
Quality Trait Glenn
H-9
H-1 Glenn M-9
M-1
Glenn W-9
W-1
II. Cooperator Results 32 Mixing Requirement
9 = Very Long 7 = Long
5 = Medium 3 = Short
1 = Very Short
6.1 5.2 6.2 4.8 7.5 7.5
33 Dough Characteristics
9 = Bucky – Tough 7 = Strong – Elastic
5 = Medium – Pliable 3 = Mellow – Very Pliable
1 = Weak – Short or Sticky
6.6 6.0 7.0 5.5 7.4 6.9
34 Mixing Tolerance
9 = Much More Tolerance Than Check 7 = More Tolerance Than Check
5 = Tolerance Equivalent To Check 3 = Less Tolerance Than Check
1 = Much Less Tolerance Than Check
4.2 3.5 4.6
35 Internal Crumb Color
9 = Much Brighter Than Check 7 = Brighter Than Check 5 = Equivalent To Check
3 = Poorer Than Check 1 = Much Poorer Than Check
4.7 5.1 5.0
36 Internal Grain and Texture
9 = Much Better Than Check 7 = Better Than Check
5 = Equivalent To Check 3 = Poorer Than Check
1 = Much Poorer Than Check
5.2 4.9 5.2
III. Cooperator Evaluation Quality Traits 1-2: Protein
9 = Much Better Than Check 7 = Better Than Check
5 = Equivalent To Check 3 = Poorer Than Check
1 = Much Poorer Than Check
4.8 4.6 5.0
Quality Traits 3-22: Milling
9 = Much Better Than Check 7 = Better Than Check
5 = Equivalent To Check 3 = Poorer Than Check
1 = Much Poorer Than Check
5.2 4.0 4.3
Quality Traits 23-36: Baking
9 = Much Better Than Check 7 = Better Than Check
5 = Equivalent To Check 3 = Poorer Than Check
1 = Much Poorer Than Check
4.7 4.8 4.8
Quality Traits 1-36: Overall Comparison
9 = Much Better Than Check 7 = Better Than Check
5 = Equivalent To Check 3 = Poorer Than Check
1 = Much Poorer Than Check
4.7 4.4 4.6

17
Cumulative Ash and Protein Curves

18
Farinograms
WB9719 (Havre, H-1) Glenn Check (Havre, H-9)
WB9719 (Minot, M-1) Glenn Check (Minot, M-9)
WB9719 (Williston, W-1) Glenn Check (Williston, W-9)

19
Mixograms
Glenn Check (Havre, H-9) WB9719 (Havre, H-1)
Glenn Check (Minot, M-9) WB9719 (Minot, M-1)
Glenn Check (Williston, W-9) WB9719 (Williston, W-1)

20
Extensograms
Glenn Check (Havre, H-9)
Glenn Check (Minot, M-9)
Glenn Check (Williston, W-9)
WB9719 (Havre, H-1)
WB9719 (Minot, M-1)
WB9719 (Williston, W-1)

21
SWQAC #2 – SD4465
Watertown Casselton Crookston
Quality Trait Glenn
B-9
B-2 Glenn
C-9
C-2 Glenn
K-9
K-2 I. USDA-ARS WQL Data
1 Wheat Protein (%, 12% mb) 14.4 13.9 14.8 14.1 13.1 12.6 2 Flour Protein (%, 14% mb) 13.5 12.8 13.9 13.0 12.2 11.5
3 Market Value (Score 1-6) 4.3 2.9 4.2 4.0 4.4 4.0 4 Market Value (Score 1-10) 10.0 8.0 10.0 8.6 10.0 8.8 5 DON (ppm) nd nd nd nd nd nd 6 Test Weight (lb/bu) 62.6 58.3 64.2 61.4 65.3 62.2 7 1000 Kernel Weight (g) 32.9 32.1 32.7 33.3 33.7 31.8 8 Kernel Size, % Large 61 60 66 65 70 47 9 Kernel Size, % Small 7 8 5 6 7 12
10 Wheat Moisture (%) 10.5 10.7 10.5 10.7 10.1 9.6 11 Wheat Ash (%, 14% mb) 1.42 1.53 1.55 1.50 1.36 1.41 12 Wheat Falling Number (sec) 365 335 344 373 404 413 13 SKCS Hardness Index 76.6 71.2 81.9 74.6 88.1 83.9 14 Vitreous Kernels (%) 28 19 91 45 88 62
Flour Extraction (%)
15 Tempered Wheat Basis (%) 69.1 72.2 73.1 73.5 71.8 72.7 16 Total Product Basis (%) 70.0 72.8 72.2 73.6 71.9 73.1 17 Flour/Bu Wheat (lbs) 43.7 42.2 47.5 45.5 47.3 46.2
Flour Quality
18 Flour Color Brightness (L*) 89.8 89.4 89.6 89.7 90.5 90.5 19 Flour Color Yellowness (b*) 7.8 8.6 8.2 9.2 8.5 10.0 20 Flour Moisture (%) 13.6 13.1 13.3 13.0 13.3 13.8 21 Flour Ash (%, 14% mb) 0.46 0.49 0.43 0.48 0.43 0.42 22 Flour Falling Number (Malted) (sec) 246 260 259 254 249 249
Farinograph
23 Water Absorption (%, 500 BU) 64.3 63.3 66.8 64.5 64.6 62.2 24 Water Absorption (%, 14% mb) 63.7 62.1 65.9 63.1 63.7 61.8 25 Arrival Time (min) 2.5 2.4 2.4 3.5 1.8 2.9 26 Peak Time (min) 4.7 6.2 6.3 6.5 5.0 5.7 27 Dough Stability (min) 9.4 8.5 8.7 6.2 9.7 6.6 28 Mixing Tolerance Index (MTI) (BU) 22 34 33 51 23 37 29 Time To Breakdown (TTB) (min) 11.1 10.6 11.0 9.3 11.0 9.6
II. Cooperator Results
30 Bake Absorption (Average %) 65.8 64.9 67.6 65.2 65.7 63.3 31 Loaf Volume (% of Check) 96.0 96.5 97.0

22
SWQAC #2 – SD4465
Watertown Casselton Crookston
Quality Trait Glenn
B-9
B-2 Glenn
C-9 C-2
Glenn K-9
K-2
II. Cooperator Results 32 Mixing Requirement
9 = Very Long 7 = Long
5 = Medium 3 = Short
1 = Very Short
6.8 6.4 5.5 4.7 6.6 4.6
33 Dough Characteristics
9 = Bucky – Tough 7 = Strong – Elastic
5 = Medium – Pliable 3 = Mellow – Very Pliable
1 = Weak – Short or Sticky
7.1 6.7 5.8 5.1 6.8 5.0
34 Mixing Tolerance
9 = Much More Tolerance Than Check 7 = More Tolerance Than Check
5 = Tolerance Equivalent To Check 3 = Less Tolerance Than Check
1 = Much Less Tolerance Than Check
5.0 3.8 3.8
35 Internal Crumb Color
9 = Much Brighter Than Check 7 = Brighter Than Check 5 = Equivalent To Check
3 = Poorer Than Check 1 = Much Poorer Than Check
5.2 4.8 4.6
36 Internal Grain and Texture
9 = Much Better Than Check 7 = Better Than Check
5 = Equivalent To Check 3 = Poorer Than Check
1 = Much Poorer Than Check
5.6 5.2 5.4
III. Cooperator Evaluation Quality Traits 1-2: Protein
9 = Much Better Than Check 7 = Better Than Check
5 = Equivalent To Check 3 = Poorer Than Check
1 = Much Poorer Than Check
4.1 3.6 3.9
Quality Traits 3-22: Milling
9 = Much Better Than Check 7 = Better Than Check
5 = Equivalent To Check 3 = Poorer Than Check
1 = Much Poorer Than Check
6.2 5.0 5.2
Quality Traits 23-36: Baking
9 = Much Better Than Check 7 = Better Than Check
5 = Equivalent To Check 3 = Poorer Than Check
1 = Much Poorer Than Check
5.2 4.8 4.7
Quality Traits 1-36: Overall Comparison
9 = Much Better Than Check 7 = Better Than Check
5 = Equivalent To Check 3 = Poorer Than Check
1 = Much Poorer Than Check
5.2 4.5 4.4
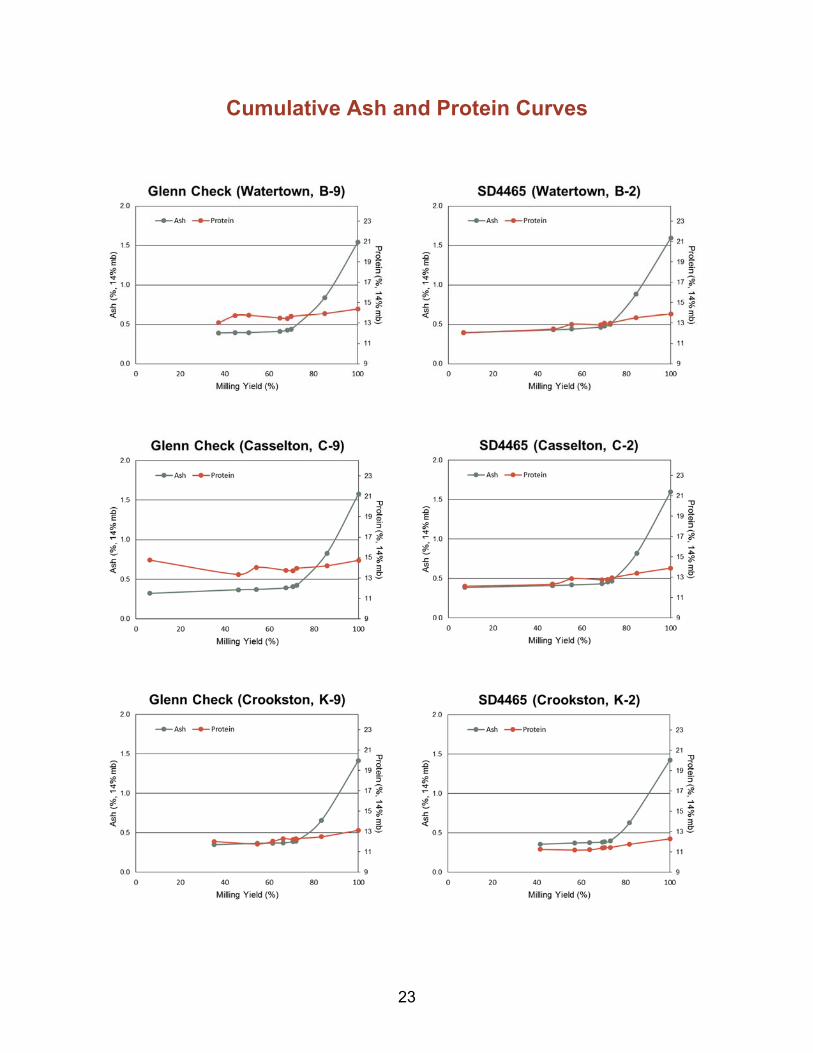
23
Cumulative Ash and Protein Curves

24
Farinograms
SD4465 (Watertown, B-2) Glenn Check (Watertown, B-9)
SD4465 (Casselton, C-2) Glenn Check (Casselton, C-9)
SD4465 (Crookston, K-2) Glenn Check (Crookston, K-9)

25
Mixograms
Glenn Check (Watertown, B-9) SD4465 (Watertown, B-2)
Glenn Check (Casselton, C-9) SD4465 (Casselton, C-2)
Glenn Check (Crookston, K-9) SD4465 (Crookston, K-2)

26
Extensograms
Glenn Check (Watertown, B-9)
Glenn Check (Casselton, C-9)
Glenn Check (Crookston, K-9)
SD4465 (Watertown, B-2)
SD4465 (Casselton, C-2)
SD4465 (Crookston, K-2)

27
SWQAC #3 – WB9616CLP
Havre Williston
Quality Trait Glenn
H-9
H-3 Glenn W-9
W-3
I. USDA-ARS WQL Data 1 Wheat Protein (%, 12% mb) 16.2 17.2 18.6 20.3 2 Flour Protein (%, 14% mb) 15.5 16.4 17.4 18.6
3 Market Value (Score 1-6) 4.5 3.7 4.0 3.4 4 Market Value (Score 1-10) 10.0 8.4 10.0 8.8 5 DON (ppm) nd nd nd nd 6 Test Weight (lb/bu) 61.8 58.0 58.7 58.6 7 1000 Kernel Weight (g) 24.5 21.0 24.1 26.2 8 Kernel Size, % Large 4 4 6 14 9 Kernel Size, % Small 26 33 38 22
10 Wheat Moisture (%) 8.9 9.2 10.3 10.7 11 Wheat Ash (%, 14% mb) 1.47 1.57 1.45 1.49 12 Wheat Falling Number (sec) 405 448 404 327 13 SKCS Hardness Index 70.8 71.6 70.2 66.2 14 Vitreous Kernels (%) 92 96 96 90
Flour Extraction (%)
15 Tempered Wheat Basis (%) 70.6 69.7 71.1 68.1 16 Total Product Basis (%) 71.0 69.6 71.0 68.2 17 Flour/Bu Wheat (lbs) 44.3 40.8 42.1 40.3
Flour Quality
18 Flour Color Brightness (L*) 90.0 90.3 89.5 90.2 19 Flour Color Yellowness (b*) 8.6 7.7 8.7 7.1 20 Flour Moisture (%) 13.8 13.2 13.4 13.6 21 Flour Ash (%, 14% mb) 0.45 0.42 0.43 0.42 22 Flour Falling Number (Malted) (sec) 247 254 249 253
Farinograph
23 Water Absorption (%, 500 BU) 64.5 63.9 66.1 66.1 24 Water Absorption (%, 14% mb) 64.3 63.1 66.2 65.3 25 Arrival Time (min) 5.7 3.7 8.0 10.6 26 Peak Time (min) 10.8 10.5 25.5 31.5 27 Dough Stability (min) 19.7 30.3 34.0 29.9 28 Mixing Tolerance Index (MTI) (BU) 12 11 5 5 29 Time To Breakdown (TTB) (min) 25.3 34.9 42.6 42.1
II. Cooperator Results
30 Bake Absorption (Average %) 67.1 66.8 69.3 69.8 31 Loaf Volume (% of Check) 102.6 93.5
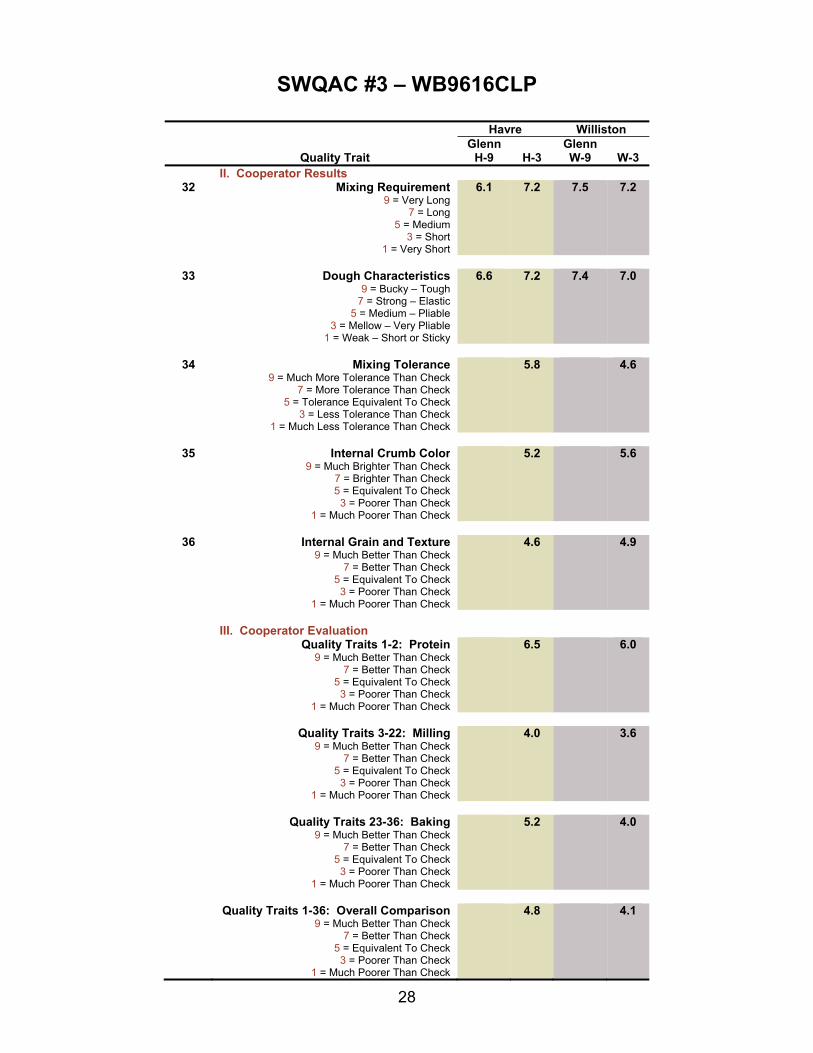
28
SWQAC #3 – WB9616CLP
Havre Williston
Quality Trait Glenn
H-9 H-3
Glenn W-9
W-3
II. Cooperator Results 32 Mixing Requirement
9 = Very Long 7 = Long
5 = Medium 3 = Short
1 = Very Short
6.1 7.2 7.5 7.2
33 Dough Characteristics
9 = Bucky – Tough 7 = Strong – Elastic
5 = Medium – Pliable 3 = Mellow – Very Pliable
1 = Weak – Short or Sticky
6.6 7.2 7.4 7.0
34 Mixing Tolerance
9 = Much More Tolerance Than Check 7 = More Tolerance Than Check
5 = Tolerance Equivalent To Check 3 = Less Tolerance Than Check
1 = Much Less Tolerance Than Check
5.8 4.6
35 Internal Crumb Color
9 = Much Brighter Than Check 7 = Brighter Than Check 5 = Equivalent To Check
3 = Poorer Than Check 1 = Much Poorer Than Check
5.2 5.6
36 Internal Grain and Texture
9 = Much Better Than Check 7 = Better Than Check
5 = Equivalent To Check 3 = Poorer Than Check
1 = Much Poorer Than Check
4.6 4.9
III. Cooperator Evaluation Quality Traits 1-2: Protein
9 = Much Better Than Check 7 = Better Than Check
5 = Equivalent To Check 3 = Poorer Than Check
1 = Much Poorer Than Check
6.5 6.0
Quality Traits 3-22: Milling
9 = Much Better Than Check 7 = Better Than Check
5 = Equivalent To Check 3 = Poorer Than Check
1 = Much Poorer Than Check
4.0 3.6
Quality Traits 23-36: Baking
9 = Much Better Than Check 7 = Better Than Check
5 = Equivalent To Check 3 = Poorer Than Check
1 = Much Poorer Than Check
5.2 4.0
Quality Traits 1-36: Overall Comparison
9 = Much Better Than Check 7 = Better Than Check
5 = Equivalent To Check 3 = Poorer Than Check
1 = Much Poorer Than Check
4.8 4.1

29
Cumulative Ash and Protein Curves

30
Farinograms
WB9616CLP (Havre, H-3) Glenn Check (Havre, H-9)
WB9616CLP (Williston, W-3) Glenn Check (Williston, W-9)

31
Mixograms
Glenn Check (Havre, H-9) WB9616CLP (Havre, H-3)
Glenn Check (Williston, W-9) WB9616CLP (Williston, W-3)
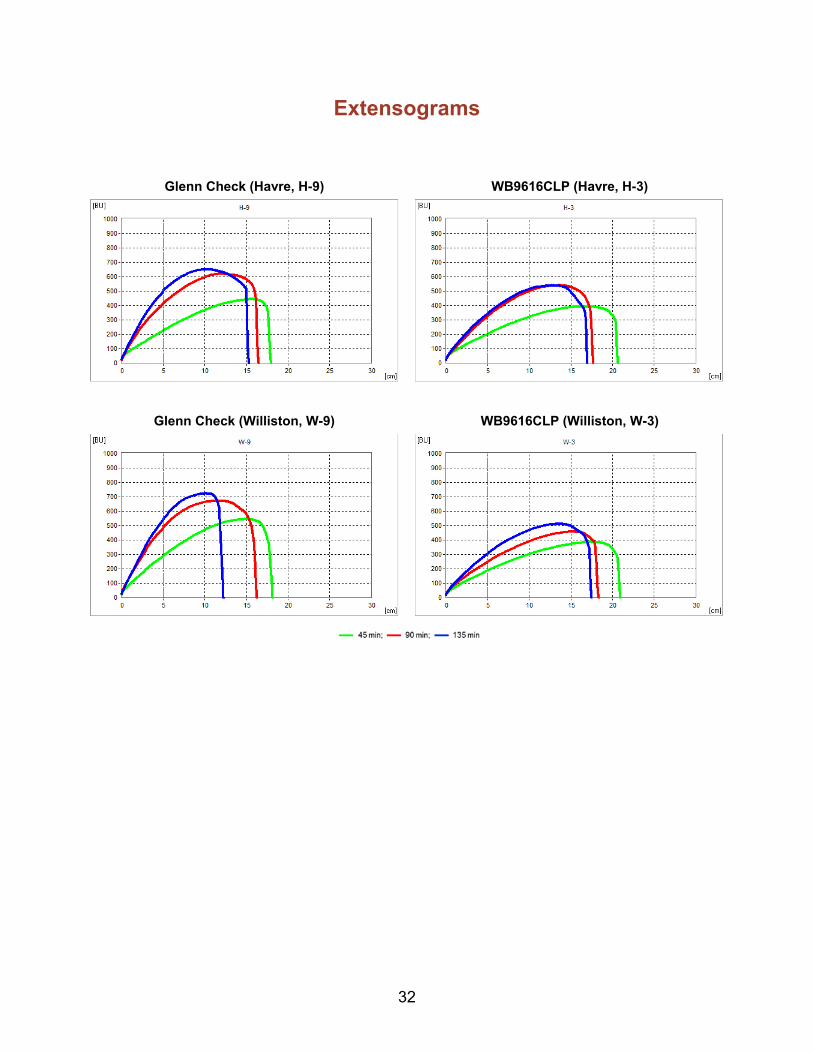
32
Extensograms
Glenn Check (Havre, H-9)
Glenn Check (Williston, W-9)
WB9616CLP (Havre, H-3)
WB9616CLP (Williston, W-3)

33
SWQAC #4 – LCS Rebel
Watertown Casselton Havre Crookston Minot Williston
Quality Trait Glenn
B-9
B-4 Glenn
C-9
C-4 Glenn
H-9
H-4 Glenn
K-9
K-4 Glenn
M-9
M-4 Glenn W-9 W-4
I. USDA-ARS WQL Data 1 Wheat Protein (%, 12% mb) 14.4 14.3 14.8 13.9 16.2 16.2 13.1 12.4 16.2 15.0 18.6 19.6 2 Flour Protein (%, 14% mb) 13.5 13.2 13.9 12.9 15.5 15.2 12.2 11.3 15.2 14.0 17.4 18.3
3 Market Value (Score 1-6) 4.3 3.1 4.2 4.3 4.5 4.4 4.4 4.5 4.9 3.8 4.0 2.9 4 Market Value (Score 1-10) 10.0 8.0 10.0 9.4 10.0 9.6 10.0 9.4 10.0 7.2 10.0 8.4 5 DON (ppm) nd nd nd nd nd nd nd nd nd nd nd nd 6 Test Weight (lb/bu) 62.6 59.9 64.2 63.3 61.8 60.0 65.3 64.5 63.1 61.3 58.7 57.3 7 1000 Kernel Weight (g) 32.9 34.6 32.7 34.0 24.5 25.2 33.7 36.8 32.4 35.2 24.1 24.0 8 Kernel Size, % Large 61 72 66 68 4 11 70 75 62 67 6 12 9 Kernel Size, % Small 7 7 5 5 26 26 7 5 7 6 38 34
10 Wheat Moisture (%) 10.5 10.8 10.5 10.6 8.9 8.9 10.1 10.2 10.7 9.9 10.3 10.7 11 Wheat Ash (%, 14% mb) 1.42 1.45 1.55 1.38 1.47 1.37 1.36 1.27 1.48 1.34 1.45 1.42 12 Wheat Falling Number (sec) 365 275 344 357 405 434 404 404 372 277 404 306 13 SKCS Hardness Index 76.6 65.1 81.9 73.7 70.8 69.2 88.1 77.6 85.2 71.0 70.2 69.4 14 Vitreous Kernels (%) 28 33 91 56 92 97 88 71 78 62 96 98
Flour Extraction (%)
15 Tempered Wheat Basis (%) 69.1 73.2 73.1 75.1 70.6 72.9 71.8 76.3 70.7 73.5 71.1 71.5 16 Total Product Basis (%) 70.0 73.9 72.2 75.9 71.0 73.1 71.9 76.4 71.2 74.1 71.0 71.7 17 Flour/Bu Wheat (lbs) 43.7 43.8 47.5 45.0 44.3 44.2 47.3 49.5 44.7 46.1 42.1 41.3
Flour Quality
18 Flour Color Brightness (L*) 89.8 89.6 89.6 89.9 90.0 90.1 90.5 90.6 89.7 90.3 89.5 89.7 19 Flour Color Yellowness (b*) 7.8 7.6 8.2 8.6 8.6 8.6 8.5 8.9 8.3 8.0 8.7 8.7 20 Flour Moisture (%) 13.6 12.8 13.3 13.0 13.8 13.4 13.3 13.4 13.0 13.5 13.4 13.6 21 Flour Ash (%, 14% mb) 0.46 0.45 0.43 0.41 0.45 0.39 0.43 0.39 0.47 0.40 0.43 0.42 22 Flour Falling Number (Malted) (sec) 246 269* 259 252 247 245 249 256 250 250 249 250
Farinograph
23 Water Absorption (%, 500 BU) 64.3 65.0 66.8 64.9 64.5 65.6 64.6 63.4 66.3 64.7 66.1 67.4 24 Water Absorption (%, 14% mb) 63.7 63.4 65.9 63.4 64.3 65.0 63.7 62.7 65.0 63.8 66.2 66.5 25 Arrival Time (min) 2.5 2.4 2.4 2.7 5.7 5.8 1.8 2.2 4.5 4.2 8.0 9.8 26 Peak Time (min) 4.7 5.2 6.3 7.0 10.8 13.2 5.0 6.8 10.5 10.4 25.5 32.3 27 Dough Stability (min) 9.4 8.1 8.7 8.3 19.7 14.4 9.7 9.0 25.4 15.4 34.0 41.8 28 Mixing Tolerance Index (MTI) (BU) 22 27 33 38 12 27 23 30 9 19 5 8 29 Time To Breakdown (TTB) (min) 11.1 10.6 11.0 10.6 25.3 18.6 11.0 11.2 29.9 18.5 42.6 51.9
*Flour not malted.

34
SWQAC #4 – LCS Rebel
Watertown Casselton Havre Crookston Minot Williston
Quality Trait Glenn
B-9
B-4 Glenn
C-9
C-4 Glenn
H-9
H-4 Glenn
K-9
K-4 Glenn
M-9
M-4 Glenn W-9 W-4
II. Cooperator Results 30 Bake Absorption (Average %) 65.8 66.2 67.6 65.9 67.1 67.6 65.7 64.3 67.5 66.9 69.3 70.5 31 Loaf Volume (% of Check) 97.8 98.4 98.4 99.3 99.7 96.2 32 Mixing Requirement* 6.8 6.3 5.5 5.5 6.1 6.2 6.6 5.5 6.2 6.4 7.5 8.1 33 Dough Characteristics** 7.1 6.7 5.8 6.3 6.6 6.8 6.8 6.2 7.0 6.9 7.4 7.5 34 Mixing Tolerance† 5.2 5.1 5.2 4.8 4.5 5.4 35 Internal Crumb Color†† 4.8 4.8 5.3 4.8 5.5 5.0 36 Internal Crumb Texture‡ 5.0 4.8 5.2 5.6 5.5 4.5
III. Cooperator Evaluation‡ Quality Traits 1-2: Protein 4.9 3.6 4.8 3.6 3.5 6.1 Quality Traits 3-22: Milling 6.4 6.5 6.4 7.8 6.2 5.0 Quality Traits 23-36: Baking 4.9 5.3 5.5 4.9 5.1 4.8 Quality Traits 1-36: Overall Comparison 5.3 5.2 5.7 5.5 5.3 4.9
*9 = Very long; 7 = Long; 5 = Medium; 3 = Short; 1 = Very short. **9 = Bucky – Tough; 7 = Strong – Elastic; 5 = Medium – Pliable; 3 = Mellow – Very Pliable; 1 = Weak – Short or Sticky. †9 = Much More Tolerance Than Check; 7 = More Tolerance Than Check; 5 = Tolerance Equivalent To Check; 3 = Less Tolerance Than Check; 1 = Much Less Tolerance Than Check. ††9 = Much Brighter Than Check; 7 = Brighter Than Check; 5 = Equivalent To Check; 3 = Poorer Than Check; 1 = Much Poorer Than Check. ‡9 = Much Better Than Check; 7 = Better Than Check; 5 = Equivalent To Check; 3 = Poorer Than Check; 1 = Much Poorer Than Check.

35
Cumulative Ash and Protein Curves

36
37
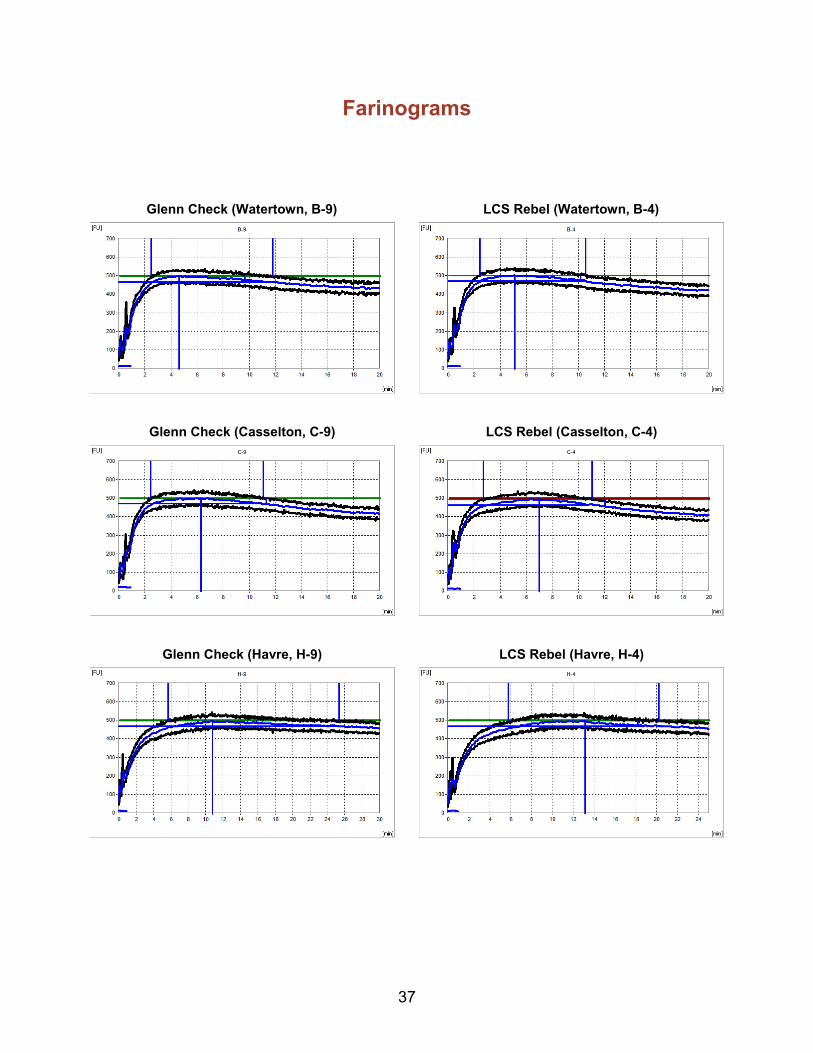
Farinograms
LCS Rebel (Watertown, B-4) Glenn Check (Watertown, B-9)
LCS Rebel (Casselton, C-4) Glenn Check (Casselton, C-9)
LCS Rebel (Havre, H-4) Glenn Check (Havre, H-9)

38
LCS Rebel (Crookston, K-4) Glenn Check (Crookston, K-9)
LCS Rebel (Minot, M-4) Glenn Check (Minot, M-9)
LCS Rebel (Williston, W-4) Glenn Check (Williston, W-9)

39
Mixograms
Glenn Check (Watertown, B-9) LCS Rebel (Watertown, B-4)
Glenn Check (Casselton, C-9) LCS Rebel (Casselton, C-4)
LCS Rebel (Havre, H-4) Glenn Check (Havre, H-9)

40
Glenn Check (Crookston, K-9) LCS Rebel (Crookston, K-4)
Glenn Check (Minot, M-9) LCS Rebel (Minot, M-4)
Glenn Check (Williston, W-9) LCS Rebel (Williston, W-4)
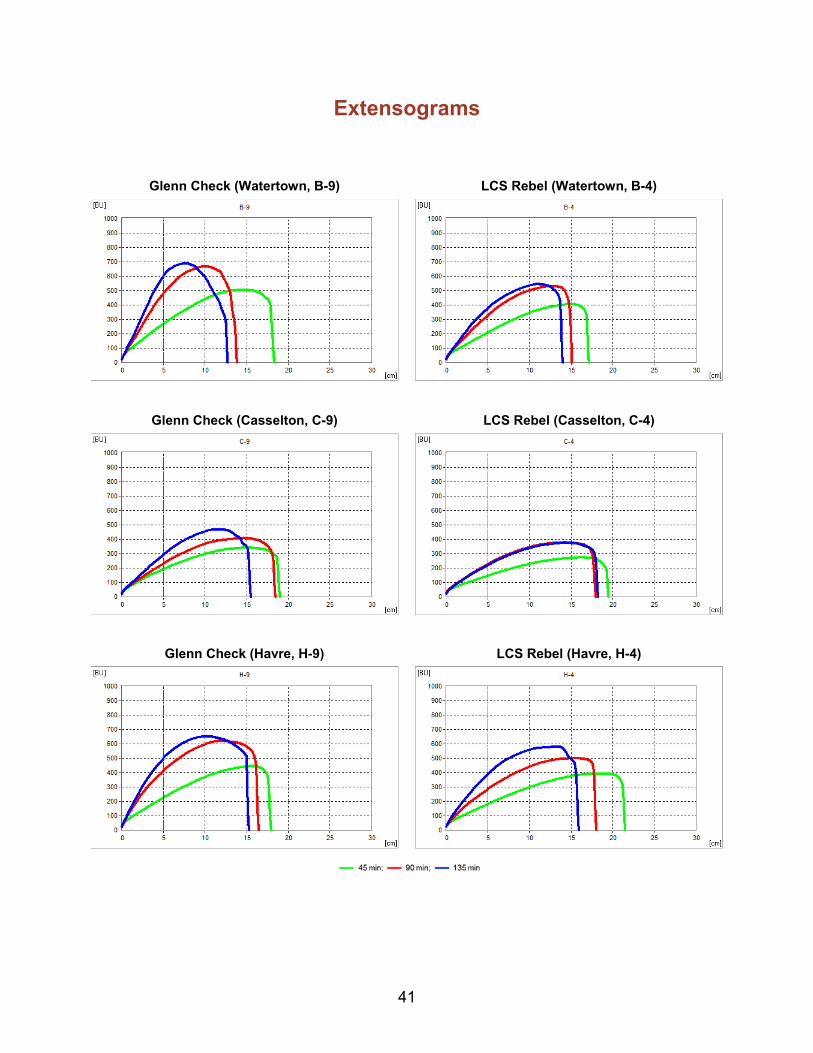
41
Extensograms
Glenn Check (Havre, H-9)
Glenn Check (Watertown, B-9)
Glenn Check (Casselton, C-9)
LCS Rebel (Watertown, B-4)
LCS Rebel (Casselton, C-4)
LCS Rebel (Havre, H-4)

42
Glenn Check (Minot, M-9)
Glenn Check (Williston, W-9)
Glenn Check (Crookston, K-9) LCS Rebel (Crookston, K-4)
LCS Rebel (Minot, M-4)
LCS Rebel (Williston, W-4)

43
SWQAC #5 – MN13288-1
Casselton Havre Crookston
Quality Trait Glenn
C-9
C-5 Glenn
H-9
H-5 Glenn
K-9
K-5 I. USDA-ARS WQL Data
1 Wheat Protein (%, 12% mb) 14.8 14.6 16.2 16.6 13.1 12.0 2 Flour Protein (%, 14% mb) 13.9 13.4 15.5 16.2 12.2 11.1
3 Market Value (Score 1-6) 4.2 4.0 4.5 4.1 4.4 4.0 4 Market Value (Score 1-10) 10.0 8.4 10.0 8.8 10.0 7.6 5 DON (ppm) nd nd nd nd nd nd 6 Test Weight (lb/bu) 64.2 60.4 61.8 58.0 65.3 62.0 7 1000 Kernel Weight (g) 32.7 30.6 24.5 27.8 33.7 32.8 8 Kernel Size, % Large 66 46 4 8 70 62 9 Kernel Size, % Small 5 14 26 30 7 8
10 Wheat Moisture (%) 10.5 10.1 8.9 8.9 10.1 9.5 11 Wheat Ash (%, 14% mb) 1.55 1.49 1.47 1.50 1.36 1.42 12 Wheat Falling Number (sec) 344 401 405 513 404 424 13 SKCS Hardness Index 81.9 78.7 70.8 66.5 88.1 82.2 14 Vitreous Kernels (%) 91 42 92 88 88 64
Flour Extraction (%)
15 Tempered Wheat Basis (%) 73.1 73.4 70.6 69.8 71.8 74.5 16 Total Product Basis (%) 72.2 74.2 71.0 70.2 71.9 74.5 17 Flour/Bu Wheat (lbs) 47.5 45.1 44.3 41.2 47.3 47.0
Flour Quality
18 Flour Color Brightness (L*) 89.6 89.6 90.0 90.1 90.5 90.5 19 Flour Color Yellowness (b*) 8.2 8.8 8.6 8.4 8.5 8.7 20 Flour Moisture (%) 13.3 13.3 13.8 14.0 13.3 13.4 21 Flour Ash (%, 14% mb) 0.43 0.50 0.45 0.43 0.43 0.46 22 Flour Falling Number (Malted) (sec) 259 250 247 250 249 251
Farinograph
23 Water Absorption (%, 500 BU) 66.8 61.6 64.5 62.1 64.6 59.7 24 Water Absorption (%, 14% mb) 65.9 60.6 64.3 62.3 63.7 58.9 25 Arrival Time (min) 2.4 2.4 5.7 3.6 1.8 1.6 26 Peak Time (min) 6.3 6.7 10.8 9.2 5.0 3.4 27 Dough Stability (min) 8.7 9.7 19.7 35.9 9.7 8.2 28 Mixing Tolerance Index (MTI) (BU) 33 29 12 6 23 17 29 Time To Breakdown (TTB) (min) 11.0 11.8 25.3 41.0 11.0 9.5
II. Cooperator Results
30 Bake Absorption (Average %) 67.6 64.1 67.1 66.0 65.7 61.4 31 Loaf Volume (% of Check) 99.9 101.2 96.3
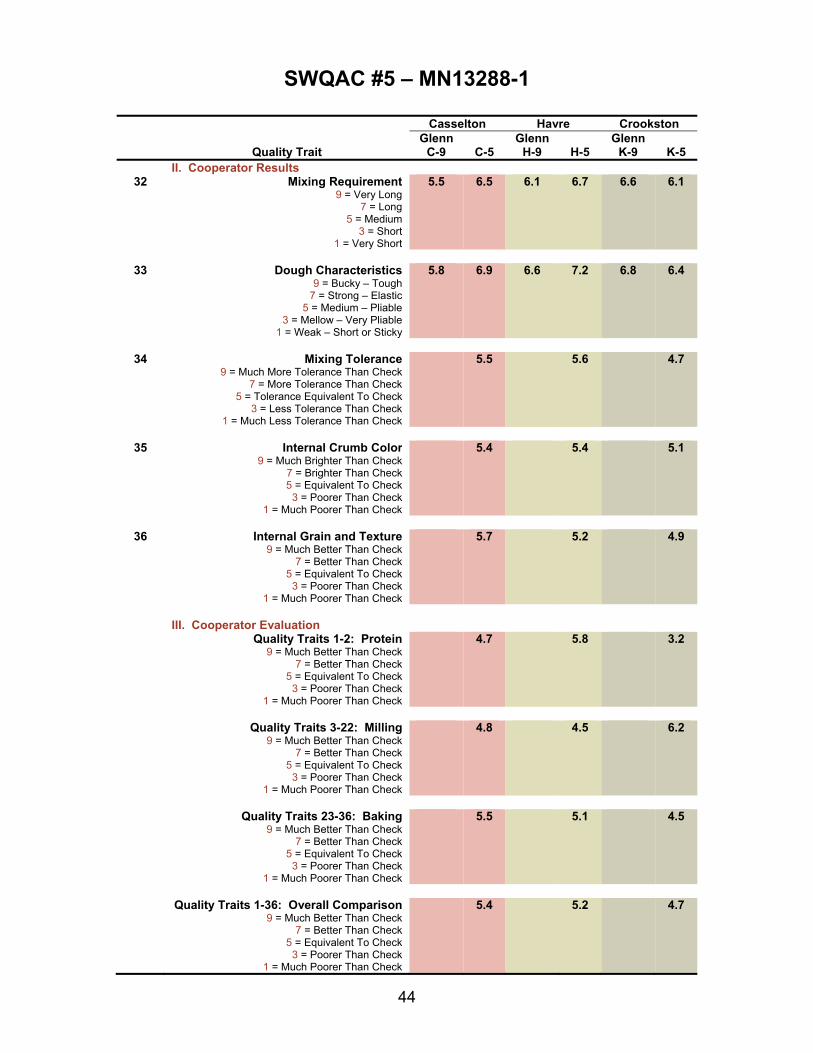
44
SWQAC #5 – MN13288-1
Casselton Havre Crookston
Quality Trait Glenn
C-9
C-5 Glenn
H-9 H-5
Glenn K-9
K-5
II. Cooperator Results 32 Mixing Requirement
9 = Very Long 7 = Long
5 = Medium 3 = Short
1 = Very Short
5.5 6.5 6.1 6.7 6.6 6.1
33 Dough Characteristics
9 = Bucky – Tough 7 = Strong – Elastic
5 = Medium – Pliable 3 = Mellow – Very Pliable
1 = Weak – Short or Sticky
5.8 6.9 6.6 7.2 6.8 6.4
34 Mixing Tolerance
9 = Much More Tolerance Than Check 7 = More Tolerance Than Check
5 = Tolerance Equivalent To Check 3 = Less Tolerance Than Check
1 = Much Less Tolerance Than Check
5.5 5.6 4.7
35 Internal Crumb Color
9 = Much Brighter Than Check 7 = Brighter Than Check 5 = Equivalent To Check
3 = Poorer Than Check 1 = Much Poorer Than Check
5.4 5.4 5.1
36 Internal Grain and Texture
9 = Much Better Than Check 7 = Better Than Check
5 = Equivalent To Check 3 = Poorer Than Check
1 = Much Poorer Than Check
5.7 5.2 4.9
III. Cooperator Evaluation Quality Traits 1-2: Protein
9 = Much Better Than Check 7 = Better Than Check
5 = Equivalent To Check 3 = Poorer Than Check
1 = Much Poorer Than Check
4.7 5.8 3.2
Quality Traits 3-22: Milling
9 = Much Better Than Check 7 = Better Than Check
5 = Equivalent To Check 3 = Poorer Than Check
1 = Much Poorer Than Check
4.8 4.5 6.2
Quality Traits 23-36: Baking
9 = Much Better Than Check 7 = Better Than Check
5 = Equivalent To Check 3 = Poorer Than Check
1 = Much Poorer Than Check
5.5 5.1 4.5
Quality Traits 1-36: Overall Comparison
9 = Much Better Than Check 7 = Better Than Check
5 = Equivalent To Check 3 = Poorer Than Check
1 = Much Poorer Than Check
5.4 5.2 4.7
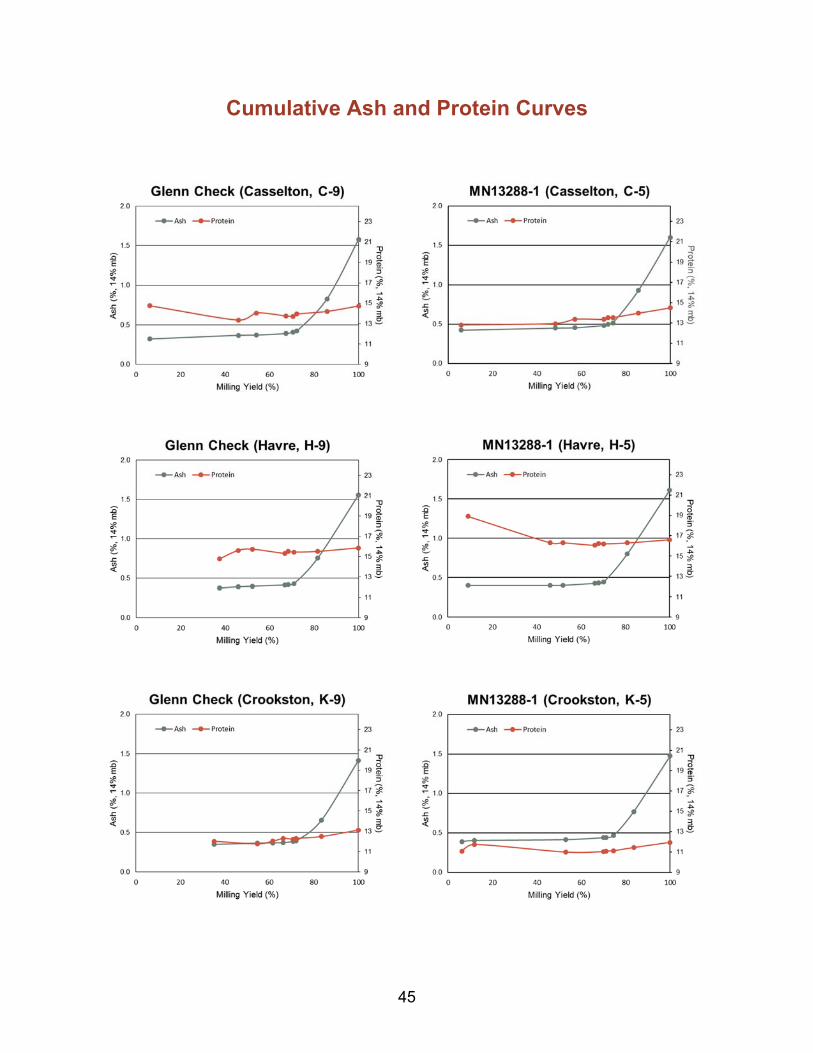
45
Cumulative Ash and Protein Curves

46
Farinograms
MN13288-1 (Casselton, C-5) Glenn Check (Casselton, C-9)
MN13288-1 (Havre, H-5) Glenn Check (Havre, H-9)
MN13288-1 (Crookston, K-5) Glenn Check (Crookston, K-9)

47
Mixograms
Glenn Check (Casselton, C-9) MN13288-1 (Casselton, C-5)
Glenn Check (Havre, H-9) MN13288-1 (Havre, H-5)
Glenn Check (Crookston, K-9) MN13288-1 (Crookston, K-5)

48
Extensograms
Glenn Check (Havre, H-9)
Glenn Check (Casselton, C-9)
Glenn Check (Crookston, K-9)
MN13288-1 (Casselton, C-5)
MN13288-1 (Havre, H-5)
MN13288-1 (Crookston, K-5)

49
SWQAC #6 – SY Rockford
Havre Minot Williston
Quality Trait Glenn
H-9
H-6 Glenn M-9
M-6
Glenn W-9
W-6
I. USDA-ARS WQL Data 1 Wheat Protein (%, 12% mb) 16.2 15.7 16.2 14.9 18.6 19.0 2 Flour Protein (%, 14% mb) 15.5 14.7 15.2 13.5 17.4 17.3
3 Market Value (Score 1-6) 4.5 3.9 4.9 4.3 4.0 3.3 4 Market Value (Score 1-10) 10.0 8.4 10.0 8.0 10.0 8.8 5 DON (ppm) nd nd nd nd nd nd 6 Test Weight (lb/bu) 61.8 57.7 63.1 60.2 58.7 57.1 7 1000 Kernel Weight (g) 24.5 26.8 32.4 35.1 24.1 27.4 8 Kernel Size, % Large 4 11 62 66 6 15 9 Kernel Size, % Small 26 28 7 6 38 27
10 Wheat Moisture (%) 8.9 8.7 10.7 10.3 10.3 10.4 11 Wheat Ash (%, 14% mb) 1.47 1.38 1.48 1.45 1.45 1.38 12 Wheat Falling Number (sec) 405 428 372 384 404 335 13 SKCS Hardness Index 70.8 65.6 85.2 67.2 70.2 69.0 14 Vitreous Kernels (%) 92 87 78 22 96 98
Flour Extraction (%)
15 Tempered Wheat Basis (%) 70.6 70.1 70.7 73.7 71.1 70.7 16 Total Product Basis (%) 71.0 70.3 71.2 73.5 71.0 70.8 17 Flour/Bu Wheat (lbs) 44.3 41.1 44.7 45.3 42.1 41.0
Flour Quality
18 Flour Color Brightness (L*) 90.0 90.2 89.7 90.3 89.5 89.7 19 Flour Color Yellowness (b*) 8.6 8.9 8.3 8.4 8.7 8.7 20 Flour Moisture (%) 13.8 13.9 13.0 13.2 13.4 13.9 21 Flour Ash (%, 14% mb) 0.45 0.41 0.47 0.40 0.43 0.47 22 Flour Falling Number (Malted) (sec) 247 249 250 245 249 250
Farinograph
23 Water Absorption (%, 500 BU) 64.5 66.2 66.3 67.1 66.1 68.2 24 Water Absorption (%, 14% mb) 64.3 66.3 65.0 66.1 66.2 68.2 25 Arrival Time (min) 5.7 5.0 4.5 3.9 8.0 8.2 26 Peak Time (min) 10.8 10.0 10.5 7.7 25.5 19.9 27 Dough Stability (min) 19.7 15.3 25.4 11.0 34.0 24.8 28 Mixing Tolerance Index (MTI) (BU) 12 17 9 25 5 11 29 Time To Breakdown (TTB) (min) 25.3 20.6 29.9 14.3 42.6 33.9
II. Cooperator Results
30 Bake Absorption (Average %) 67.1 68.0 67.5 68.3 69.3 70.3 31 Loaf Volume (% of Check) 97.1 97.4 98.6
*Flour not malted.

50
SWQAC #6 – SY Rockford
Havre Minot Williston
Quality Trait Glenn
H-9
H-6 Glenn M-9
M-6
Glenn W-9
W-6
II. Cooperator Results 32 Mixing Requirement
9 = Very Long 7 = Long
5 = Medium 3 = Short
1 = Very Short
6.1 4.8 6.2 5.0 7.5 6.4
33 Dough Characteristics
9 = Bucky – Tough 7 = Strong – Elastic
5 = Medium – Pliable 3 = Mellow – Very Pliable
1 = Weak – Short or Sticky
6.6 5.5 7.0 6.0 7.4 6.8
34 Mixing Tolerance
9 = Much More Tolerance Than Check 7 = More Tolerance Than Check
5 = Tolerance Equivalent To Check 3 = Less Tolerance Than Check
1 = Much Less Tolerance Than Check
4.5 3.6 4.2
35 Internal Crumb Color
9 = Much Brighter Than Check 7 = Brighter Than Check 5 = Equivalent To Check
3 = Poorer Than Check 1 = Much Poorer Than Check
4.8 5.4 5.2
36 Internal Grain and Texture
9 = Much Better Than Check 7 = Better Than Check
5 = Equivalent To Check 3 = Poorer Than Check
1 = Much Poorer Than Check
5.1 5.6 4.9
III. Cooperator Evaluation Quality Traits 1-2: Protein
9 = Much Better Than Check 7 = Better Than Check
5 = Equivalent To Check 3 = Poorer Than Check
1 = Much Poorer Than Check
3.9 3.2 5.1
Quality Traits 3-22: Milling
9 = Much Better Than Check 7 = Better Than Check
5 = Equivalent To Check 3 = Poorer Than Check
1 = Much Poorer Than Check
5.0 6.0 5.2
Quality Traits 23-36: Baking
9 = Much Better Than Check 7 = Better Than Check
5 = Equivalent To Check 3 = Poorer Than Check
1 = Much Poorer Than Check
4.8 5.3 4.8
Quality Traits 1-36: Overall Comparison
9 = Much Better Than Check 7 = Better Than Check
5 = Equivalent To Check 3 = Poorer Than Check
1 = Much Poorer Than Check
4.8 5.1 5.1

51
Cumulative Ash and Protein Curves

52
Farinograms
SY Rockford (Havre, H-6) Glenn Check (Havre, H-9)
SY Rockford (Minot, M-6) Glenn Check (Minot, M-9)
SY Rockford (Williston, W-6) Glenn Check (Williston, W-9)

53
Mixograms
Glenn Check (Havre, H-9) SY Rockford (Havre, H-6)
Glenn Check (Minot, M-9) SY Rockford (Minot, M-6)
Glenn Check (Williston, W-9) SY Rockford (Williston, W-6)

54
Extensograms
Glenn Check (Havre, H-9)
Glenn Check (Minot, M-9)
Glenn Check (Williston, W-9)
SY Rockford (Havre, H-6)
SY Rockford (Minot, M-6)
SY Rockford (Williston, W-6)

55
SWQAC #7 – WB9479
Watertown Casselton Crookston Minot Williston
Quality Trait Glenn
B-9
B-7 Glenn
C-9
C-7 Glenn
K-9
K-7 Glenn
M-9
M-7 Glenn W-9
W-7
I. USDA-ARS WQL Data 1 Wheat Protein (%, 12% mb) 14.4 15.0 14.8 14.0 13.1 12.2 16.2 16.1 18.6 19.1 2 Flour Protein (%, 14% mb) 13.5 14.1 13.9 13.4 12.2 11.5 15.2 15.0 17.4 17.9
3 Market Value (Score 1-6) 4.3 3.1 4.2 3.6 4.4 4.4 4.9 4.2 4.0 3.7 4 Market Value (Score 1-10) 10.0 6.8 10.0 7.8 10.0 9.0 10.0 7.6 10.0 9.6 5 DON (ppm) nd nd nd nd nd 0.89 nd nd nd nd 6 Test Weight (lb/bu) 62.6 58.6 64.2 61.1 65.3 63.3 63.1 61.1 58.7 58.4 7 1000 Kernel Weight (g) 32.9 34.7 32.7 34.5 33.7 35.1 32.4 37.2 24.1 24.2 8 Kernel Size, % Large 61 79 66 77 70 80 62 81 6 14 9 Kernel Size, % Small 7 4 5 4 7 4 7 3 38 31
10 Wheat Moisture (%) 10.5 10.5 10.5 10.5 10.1 9.8 10.7 10.8 10.3 10.2 11 Wheat Ash (%, 14% mb) 1.42 1.46 1.55 1.46 1.36 1.39 1.48 1.40 1.45 1.44 12 Wheat Falling Number (sec) 365 232 344 312 404 426 372 255 404 376 13 SKCS Hardness Index 76.6 63.5 81.9 67.0 88.1 75.3 85.2 65.2 70.2 67.7 14 Vitreous Kernels (%) 28 15 91 47 88 68 78 20 96 89
Flour Extraction (%)
15 Tempered Wheat Basis (%) 69.1 71.4 73.1 74.8 71.8 75.4 70.7 74.4 71.1 72.0 16 Total Product Basis (%) 70.0 72.5 72.2 75.3 71.9 75.7 71.2 74.2 71.0 71.4 17 Flour/Bu Wheat (lbs) 43.7 42.2 47.5 46.4 47.3 48.6 44.7 45.8 42.1 42.4
Flour Quality
18 Flour Color Brightness (L*) 89.8 89.5 89.6 89.6 90.5 90.5 89.7 89.5 89.5 89.1 19 Flour Color Yellowness (b*) 7.8 7.7 8.2 8.7 8.5 9.2 8.3 8.3 8.7 9.4 20 Flour Moisture (%) 13.6 13.2 13.3 13.5 13.3 13.5 13.0 13.3 13.4 13.7 21 Flour Ash (%, 14% mb) 0.46 0.46 0.43 0.42 0.43 0.40 0.47 0.42 0.43 0.41 22 Flour Falling Number (Malted) (sec) 246 217* 259 252 249 253 250 245 249 255
Farinograph
23 Water Absorption (%, 500 BU) 64.3 62.9 66.8 62.4 64.6 60.7 66.3 63.5 66.1 66.6 24 Water Absorption (%, 14% mb) 63.7 61.9 65.9 61.6 63.7 60.2 65.0 62.6 66.2 66.4 25 Arrival Time (min) 2.5 2.0 2.4 2.2 1.8 1.7 4.5 3.6 8.0 14.8 26 Peak Time (min) 4.7 4.5 6.3 6.7 5.0 2.7 10.5 10.3 25.5 28.7 27 Dough Stability (min) 9.4 7.5 8.7 11.2 9.7 9.7 25.4 24.1 34.0 31.8 28 Mixing Tolerance Index (MTI) (BU) 22 33 33 28 23 15 9 7 5 3 29 Time To Breakdown (TTB) (min) 11.1 8.9 11.0 11.8 11.0 10.5 29.9 26.4 42.6 48.0
II. Cooperator Results
30 Bake Absorption (Average %) 65.8 65.3 67.6 64.4 65.7 62.4 67.5 66.4 69.3 69.7 31 Loaf Volume (% of Check) 100.0 99.0 96.7 95.4 97.3
*Flour not malted.

56
SWQAC #7 – WB9479
Watertown Casselton Crookston Minot Williston
Quality Trait Glenn
B-9
B-7 Glenn
C-9
C-7 Glenn
K-9
K-7 Glenn
M-9 M-7
Glenn W-9
W-7
II. Cooperator Results 32 Mixing Requirement
9 = Very Long 7 = Long
5 = Medium 3 = Short
1 = Very Short
6.8 6.7 5.5 6.2 6.6 6.8 6.2 6.9 7.5 7.8
33 Dough Characteristics
9 = Bucky – Tough 7 = Strong – Elastic
5 = Medium – Pliable 3 = Mellow – Very Pliable
1 = Weak – Short or Sticky
7.1 6.7 5.8 6.6 6.8 6.8 7.0 6.6 7.4 7.1
34 Mixing Tolerance
9 = Much More Tolerance Than Check 7 = More Tolerance Than Check
5 = Tolerance Equivalent To Check 3 = Less Tolerance Than Check
1 = Much Less Tolerance Than Check
5.0 6.2 5.3 4.9 4.6
35 Internal Crumb Color
9 = Much Brighter Than Check 7 = Brighter Than Check 5 = Equivalent To Check
3 = Poorer Than Check 1 = Much Poorer Than Check
5.5 5.3 5.0 5.3 5.2
36 Internal Grain and Texture
9 = Much Better Than Check 7 = Better Than Check
5 = Equivalent To Check 3 = Poorer Than Check
1 = Much Poorer Than Check
5.3 5.5 5.2 4.8 5.5
III. Cooperator Evaluation Quality Traits 1-2: Protein
9 = Much Better Than Check 7 = Better Than Check
5 = Equivalent To Check 3 = Poorer Than Check
1 = Much Poorer Than Check
6.1 4.2 3.8 4.8 5.4
Quality Traits 3-22: Milling
9 = Much Better Than Check 7 = Better Than Check
5 = Equivalent To Check 3 = Poorer Than Check
1 = Much Poorer Than Check
5.8 6.2 6.9 6.5 5.2
Quality Traits 23-36: Baking
9 = Much Better Than Check 7 = Better Than Check
5 = Equivalent To Check 3 = Poorer Than Check
1 = Much Poorer Than Check
5.3 5.1 5.2 4.6 5.2
Quality Traits 1-36: Overall Comparison
9 = Much Better Than Check 7 = Better Than Check
5 = Equivalent To Check 3 = Poorer Than Check
1 = Much Poorer Than Check
5.5 5.2 5.4 5.2 5.2
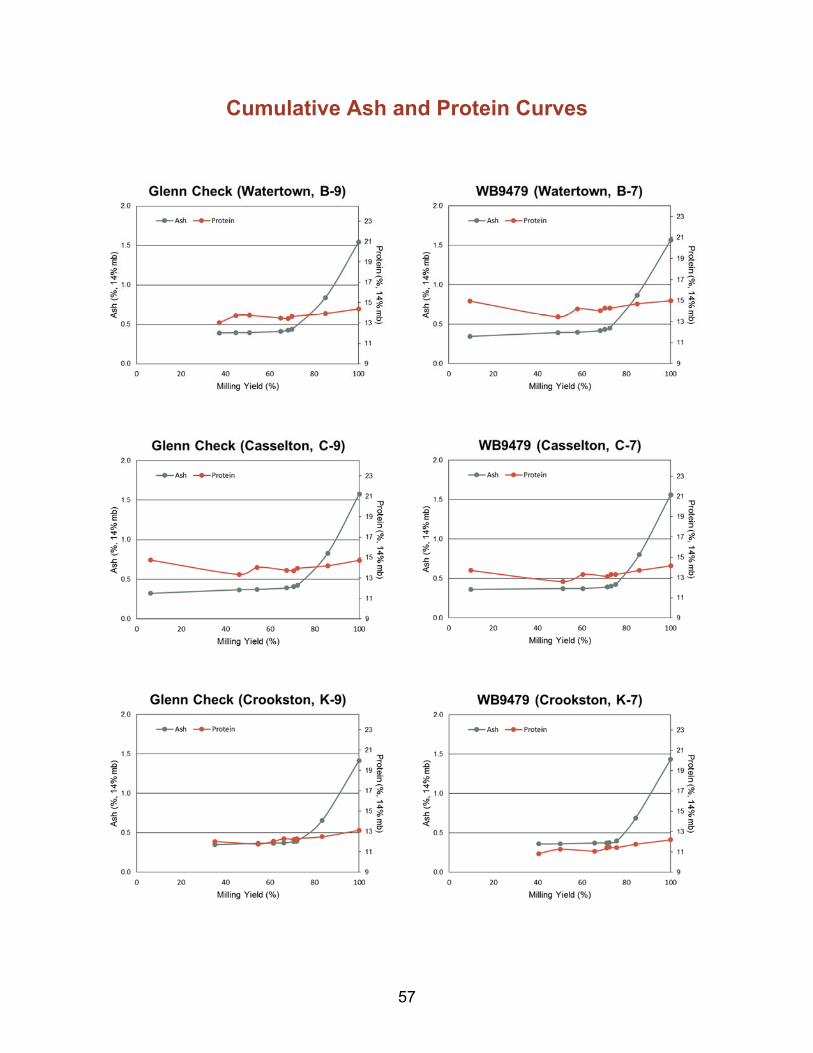
57
Cumulative Ash and Protein Curves

58

59
Farinograms
WB9479 (Watertown, B-7) Glenn Check (Watertown, B-9)
WB9479 (Casselton, C-7) Glenn Check (Casselton, C-9)
WB9479 (Crookston, K-7) Glenn Check (Crookston, K-9)

60
WB9479 (Minot, M-7) Glenn Check (Minot, M-9)
WB9479 (Williston, W-7) Glenn Check (Williston, W-9)

61
Mixograms
Glenn Check (Watertown, B-9) WB9479 (Watertown, B-7)
Glenn Check (Casselton, C-9) WB9479 (Casselton, C-7)
Glenn Check (Crookston, K-9) WB9479 (Crookston, K-7)

62
Glenn Check (Minot, M-9) WB9479 (Minot, M-7)
Glenn Check (Williston, W-9) WB9479 (Williston, W-7)
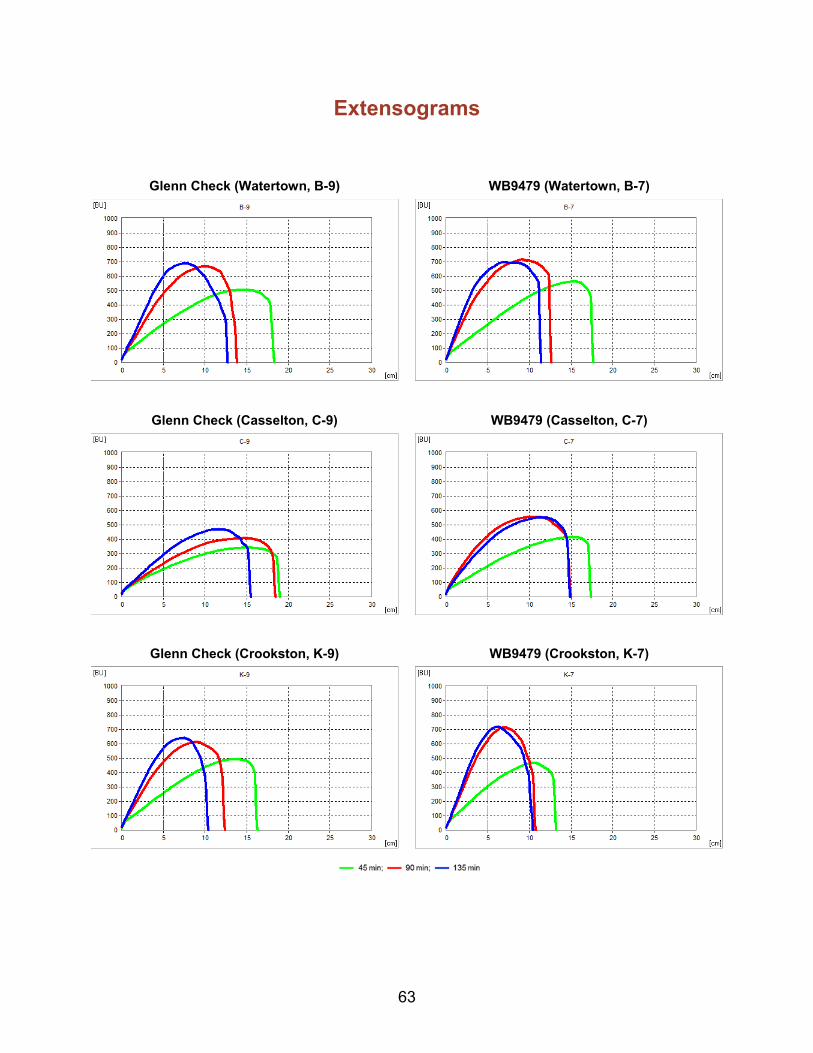
63
Extensograms
Glenn Check (Watertown, B-9)
Glenn Check (Casselton, C-9)
Glenn Check (Crookston, K-9)
WB9479 (Watertown, B-7)
WB9479 (Casselton, C-7)
WB9479 (Crookston, K-7)
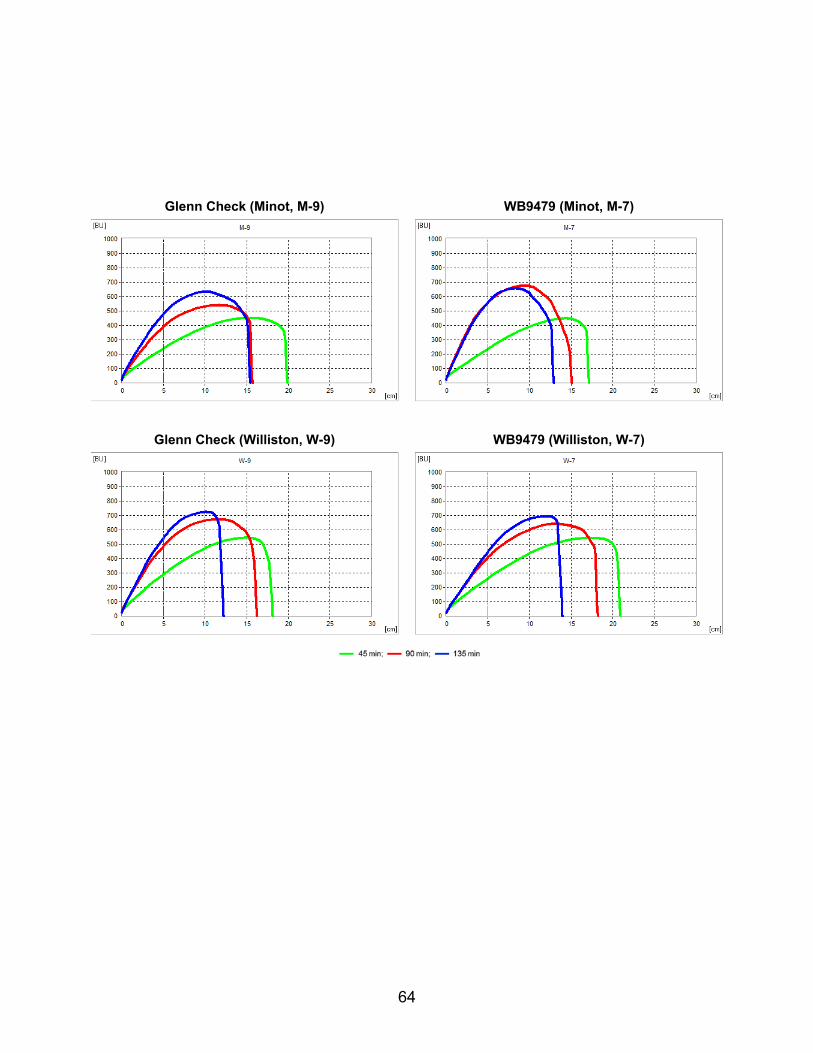
64
Glenn Check (Minot, M-9)
Glenn Check (Williston, W-9)
WB9479 (Minot, M-7)
WB9479 (Williston, W-7)

65
SWQAC #8 – SD4579
Watertown Casselton Crookston
Quality Trait Glenn
B-9
B-8 Glenn
C-9
C-8 Glenn
K-9
K-8 I. USDA-ARS WQL Data
1 Wheat Protein (%, 12% mb) 14.4 14.5 14.8 13.7 13.1 11.4 2 Flour Protein (%, 14% mb) 13.5 13.6 13.9 12.8 12.2 10.7
3 Market Value (Score 1-6) 4.3 3.6 4.2 3.7 4.4 3.5 4 Market Value (Score 1-10) 10.0 8.4 10.0 7.2 10.0 6.6 5 DON (ppm) nd nd nd nd nd nd 6 Test Weight (lb/bu) 62.6 59.4 64.2 61.0 65.3 62.9 7 1000 Kernel Weight (g) 32.9 29.9 32.7 29.9 33.7 29.1 8 Kernel Size, % Large 61 29 66 29 70 29 9 Kernel Size, % Small 7 17 5 19 7 17
10 Wheat Moisture (%) 10.5 10.6 10.5 10.6 10.1 9.9 11 Wheat Ash (%, 14% mb) 1.42 1.39 1.55 1.43 1.36 1.44 12 Wheat Falling Number (sec) 365 376 344 370 404 403 13 SKCS Hardness Index 76.6 55.5 81.9 59.1 88.1 65.9 14 Vitreous Kernels (%) 28 20 91 27 88 44
Flour Extraction (%)
15 Tempered Wheat Basis (%) 69.1 74.9 73.1 78.0 71.8 77.2 16 Total Product Basis (%) 70.0 75.6 72.2 78.5 71.9 77.7 17 Flour/Bu Wheat (lbs) 43.7 44.7 47.5 48.1 47.3 49.4
Flour Quality
18 Flour Color Brightness (L*) 89.8 90.0 89.6 89.8 90.5 90.8 19 Flour Color Yellowness (b*) 7.8 7.0 8.2 8.1 8.5 8.0 20 Flour Moisture (%) 13.6 13.3 13.3 13.3 13.3 13.7 21 Flour Ash (%, 14% mb) 0.46 0.40 0.43 0.44 0.43 0.44 22 Flour Falling Number (Malted) (sec) 246 250 259 247 249 251
Farinograph
23 Water Absorption (%, 500 BU) 64.3 61.6 66.8 61.3 64.6 58.5 24 Water Absorption (%, 14% mb) 63.7 60.7 65.9 60.3 63.7 57.8 25 Arrival Time (min) 2.5 3.5 2.4 3.0 1.8 1.9 26 Peak Time (min) 4.7 7.2 6.3 6.2 5.0 5.2 27 Dough Stability (min) 9.4 7.3 8.7 6.3 9.7 6.2 28 Mixing Tolerance Index (MTI) (BU) 22 44 33 42 23 45 29 Time To Breakdown (TTB) (min) 11.1 10.8 11.0 9.6 11.0 8.5
II. Cooperator Results
30 Bake Absorption (Average %) 65.8 63.7 67.6 63.4 65.7 60.4 31 Loaf Volume (% of Check) 95.0 93.8 91.3

66
SWQAC #8 – SD4579
Watertown Casselton Crookston
Quality Trait Glenn
B-9
B-8 Glenn
C-9 C-8
Glenn K-9
K-8
II. Cooperator Results 32 Mixing Requirement
9 = Very Long 7 = Long
5 = Medium 3 = Short
1 = Very Short
6.8 4.1 5.5 3.5 6.6 3.2
33 Dough Characteristics
9 = Bucky – Tough 7 = Strong – Elastic
5 = Medium – Pliable 3 = Mellow – Very Pliable
1 = Weak – Short or Sticky
7.1 4.3 5.8 3.4 6.8 3.9
34 Mixing Tolerance
9 = Much More Tolerance Than Check 7 = More Tolerance Than Check
5 = Tolerance Equivalent To Check 3 = Less Tolerance Than Check
1 = Much Less Tolerance Than Check
2.8 3.5 2.9
35 Internal Crumb Color
9 = Much Brighter Than Check 7 = Brighter Than Check 5 = Equivalent To Check
3 = Poorer Than Check 1 = Much Poorer Than Check
4.8 4.8 5.2
36 Internal Grain and Texture
9 = Much Better Than Check 7 = Better Than Check
5 = Equivalent To Check 3 = Poorer Than Check
1 = Much Poorer Than Check
4.7 4.6 5.2
III. Cooperator Evaluation Quality Traits 1-2: Protein
9 = Much Better Than Check 7 = Better Than Check
5 = Equivalent To Check 3 = Poorer Than Check
1 = Much Poorer Than Check
5.1 3.4 2.3
Quality Traits 3-22: Milling
9 = Much Better Than Check 7 = Better Than Check
5 = Equivalent To Check 3 = Poorer Than Check
1 = Much Poorer Than Check
6.9 6.7 7.2
Quality Traits 23-36: Baking
9 = Much Better Than Check 7 = Better Than Check
5 = Equivalent To Check 3 = Poorer Than Check
1 = Much Poorer Than Check
3.9 3.5 3.5
Quality Traits 1-36: Overall Comparison
9 = Much Better Than Check 7 = Better Than Check
5 = Equivalent To Check 3 = Poorer Than Check
1 = Much Poorer Than Check
4.4 3.7 3.5

67
Cumulative Ash and Protein Curves

68
Farinograms
SD4579 (Watertown, B-8) Glenn Check (Watertown, B-9)
SD4579 (Casselton, C-8) Glenn Check (Casselton, C-9)
SD4579 (Crookston, K-8) Glenn Check (Crookston, K-9)

69
Mixograms
Glenn Check (Watertown, B-9) SD4579 (Watertown, B-8)
Glenn Check (Casselton, C-9) SD4579 (Casselton, C-8)
Glenn Check (Crookston, K-9) SD4579 (Crookston, K-8)
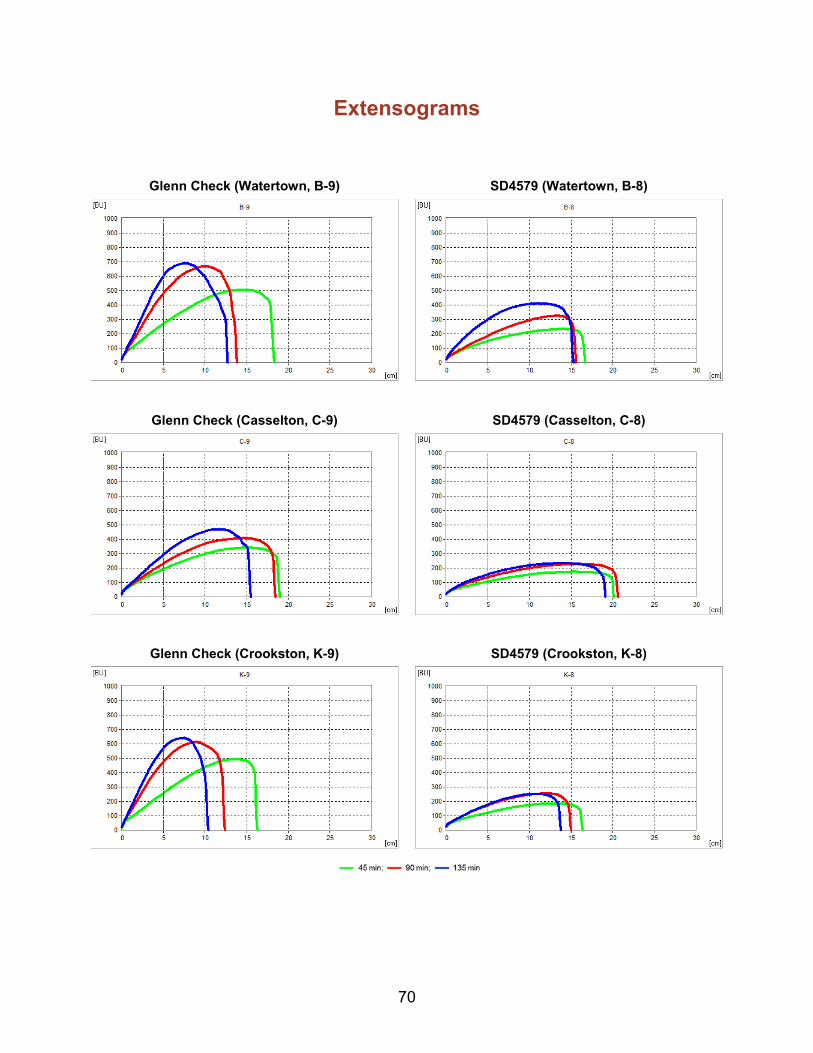
70
Extensograms
Glenn Check (Watertown, B-9)
Glenn Check (Casselton, C-9)
Glenn Check (Crookston, K-9)
SD4579 (Watertown, B-8)
SD4579 (Casselton, C-8)
SD4579 (Crookston, K-8)

71
SWQAC #10 – WB9590
Watertown Casselton Havre Crookston Minot Williston
Quality Trait Glenn
B-9
B-10 Glenn
C-9
C-10 Glenn
H-9
H-10 Glenn
K-9
K-10 Glenn
M-9
M-10 Glenn W-9 W-10
I. USDA-ARS WQL Data 1 Wheat Protein (%, 12% mb) 14.4 15.0 14.8 14.4 16.2 17.0 13.1 12.5 16.2 16.0 18.6 18.7 2 Flour Protein (%, 14% mb) 13.5 14.1 13.9 13.5 15.5 16.3 12.2 11.8 15.2 15.5 17.4 18.1
3 Market Value (Score 1-6) 4.3 2.9 4.2 3.9 4.5 4.2 4.4 4.6 4.9 4.1 4.0 3.2 4 Market Value (Score 1-10) 10.0 6.8 10.0 8.4 10.0 9.0 10.0 8.6 10.0 8.0 10.0 8.8 5 DON (ppm) nd nd nd nd nd nd nd 0.71 nd nd nd nd 6 Test Weight (lb/bu) 62.6 58.2 64.2 61.8 61.8 59.1 65.3 63.0 63.1 60.3 58.7 56.8 7 1000 Kernel Weight (g) 32.9 34.2 32.7 36.9 24.5 27.0 33.7 36.6 32.4 37.0 24.1 24.9 8 Kernel Size, % Large 61 68 66 84 4 27 70 84 62 73 6 19 9 Kernel Size, % Small 7 7 5 3 26 15 7 4 7 5 38 25
10 Wheat Moisture (%) 10.5 10.6 10.5 10.4 8.9 8.8 10.1 10.7 10.7 9.9 10.3 10.4 11 Wheat Ash (%, 14% mb) 1.42 1.50 1.55 1.48 1.47 1.61 1.36 1.21 1.48 1.38 1.45 1.41 12 Wheat Falling Number (sec) 365 261 344 305 405 455 404 447 372 299 404 335 13 SKCS Hardness Index 76.6 62.9 81.9 71.8 70.8 65.5 88.1 72.8 85.2 69.8 70.2 67.1 14 Vitreous Kernels (%) 28 17 91 60 92 87 88 67 78 18 96 96
Flour Extraction (%)
15 Tempered Wheat Basis (%) 69.1 69.3 73.1 74.5 70.6 69.1 71.8 74.1 70.7 72.6 71.1 69.8 16 Total Product Basis (%) 70.0 69.8 72.2 73.0 71.0 69.7 71.9 74.1 71.2 73.4 71.0 70.7 17 Flour/Bu Wheat (lbs) 43.7 40.7 47.5 46.4 44.3 41.4 47.3 47.5 44.7 44.4 42.1 40.1
Flour Quality
18 Flour Color Brightness (L*) 89.8 89.6 89.6 89.5 90.0 89.6 90.5 90.1 89.7 89.4 89.5 89.2 19 Flour Color Yellowness (b*) 7.8 7.9 8.2 8.5 8.6 9.2 8.5 9.3 8.3 8.5 8.7 9.0 20 Flour Moisture (%) 13.6 13.5 13.3 13.4 13.8 13.7 13.3 13.4 13.0 13.1 13.4 13.6 21 Flour Ash (%, 14% mb) 0.46 0.45 0.43 0.45 0.45 0.44 0.43 0.38 0.47 0.46 0.43 0.42 22 Flour Falling Number (Malted) (sec) 246 286* 259 251 247 251 249 250 250 251 249 250
Farinograph
23 Water Absorption (%, 500 BU) 64.3 63.4 66.8 65.1 64.5 65.5 64.6 60.9 66.3 65.1 66.1 66.6 24 Water Absorption (%, 14% mb) 63.7 62.7 65.9 64.2 64.3 65.1 63.7 60.1 65.0 64.1 66.2 66.5 25 Arrival Time (min) 2.5 2.8 2.4 3.4 5.7 5.6 1.8 2.1 4.5 4.8 8.0 7.7 26 Peak Time (min) 4.7 6.8 6.3 5.8 10.8 10.7 5.0 6.5 10.5 10.0 25.5 27.4 27 Dough Stability (min) 9.4 11.9 8.7 6.8 19.7 15.0 9.7 10.0 25.4 15.9 34.0 30.3 28 Mixing Tolerance Index (MTI) (BU) 22 23 33 34 12 19 23 24 9 19 5 6 29 Time To Breakdown (TTB) (min) 11.1 13.1 11.0 9.9 25.3 20.4 11.0 12.7 29.9 19.6 42.6 39.1
*Flour not malted.

72
SWQAC #10 – WB9590
Watertown Casselton Havre Crookston Minot Williston
Quality Trait Glenn
B-9
B-10 Glenn
C-9
C-10 Glenn
H-9
H-10 Glenn
K-9
K-10 Glenn
M-9
M-10 Glenn W-9 W-10
II. Cooperator Results 30 Bake Absorption (Average %) 65.8 65.4 67.6 66.4 67.1 67.9 65.7 62.8 67.5 67.4 69.3 69.8 31 Loaf Volume (% of Check) 99.0 94.3 94.3 97.1 96.9 94.7 32 Mixing Requirement* 6.8 6.6 5.5 4.5 6.1 5.4 6.6 5.8 6.2 6.3 7.5 7.0 33 Dough Characteristics** 7.1 6.7 5.8 5.2 6.6 5.8 6.8 5.6 7.0 6.2 7.4 6.9 34 Mixing Tolerance† 5.9 4.3 4.5 4.9 4.0 4.6 35 Internal Crumb Color†† 4.5 4.6 4.8 4.9 5.2 4.7 36 Internal Crumb Texture‡ 4.9 4.8 4.8 5.4 4.9 4.6
III. Cooperator Evaluation‡ Quality Traits 1-2: Protein 5.9 4.5 5.9 4.1 5.0 5.4 Quality Traits 3-22: Milling 4.8 5.6 4.1 7.1 6.0 4.8 Quality Traits 23-36: Baking 4.8 4.2 4.8 5.0 4.4 4.2 Quality Traits 1-36: Overall Comparison 4.9 4.3 4.6 5.4 5.2 4.6
*9 = Very long; 7 = Long; 5 = Medium; 3 = Short; 1 = Very short. **9 = Bucky – Tough; 7 = Strong – Elastic; 5 = Medium – Pliable; 3 = Mellow – Very Pliable; 1 = Weak – Short or Sticky. †9 = Much More Tolerance Than Check; 7 = More Tolerance Than Check; 5 = Tolerance Equivalent To Check; 3 = Less Tolerance Than Check; 1 = Much Less Tolerance Than Check. ††9 = Much Brighter Than Check; 7 = Brighter Than Check; 5 = Equivalent To Check; 3 = Poorer Than Check; 1 = Much Poorer Than Check. ‡9 = Much Better Than Check; 7 = Better Than Check; 5 = Equivalent To Check; 3 = Poorer Than Check; 1 = Much Poorer Than Check.

73
Cumulative Ash and Protein Curves

74
75
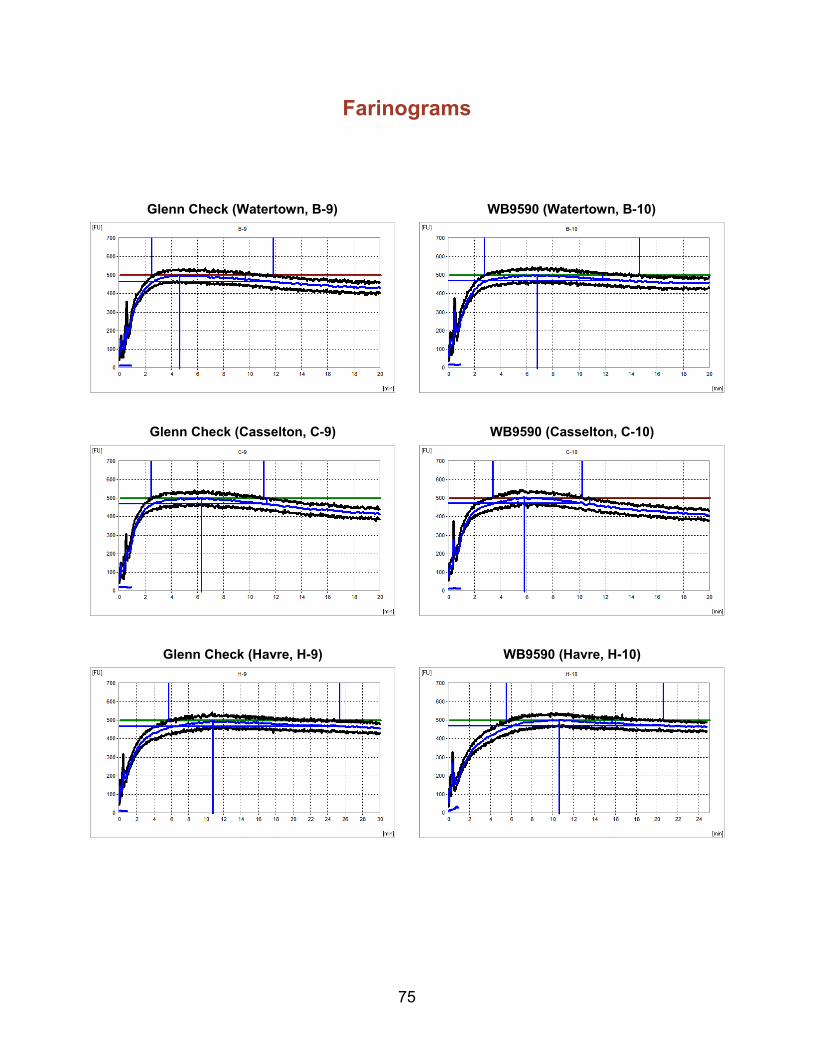
Farinograms
Glenn Check (Watertown, B-9) WB9590 (Watertown, B-10)
Glenn Check (Casselton, C-9) WB9590 (Casselton, C-10)
Glenn Check (Havre, H-9) WB9590 (Havre, H-10)

76
Glenn Check (Crookston, K-9) WB9590 (Crookston, K-10)
Glenn Check (Minot, M-9) WB9590 (Minot, M-10)
Glenn Check (Williston, W-9) WB9590 (Williston, W-10)

77
Mixograms
Glenn Check (Watertown, B-9) WB9590 (Watertown, B-10)
Glenn Check (Casselton, C-9) WB9590 (Casselton, C-10)
Glenn Check (Havre, H-9) WB9590 (Havre, H-10)

78
Glenn Check (Crookston, K-9) WB9590 (Crookston, K-10)
Glenn Check (Minot, M-9) WB9590 (Minot, M-10)
Glenn Check (Williston, W-9) WB9590 (Williston, W-10)

79
Extensograms
Glenn Check (Havre, H-9)
Glenn Check (Watertown, B-9)
Glenn Check (Casselton, C-9)
WB9590 (Watertown, B-10)
WB9590 (Casselton, C-10)
WB9590 (Havre, H-10)

80
Glenn Check (Minot, M-9)
Glenn Check (Williston, W-9)
Glenn Check (Crookston, K-9) WB9590 (Crookston, K-10)
WB9590 (Minot, M-10)
WB9590 (Williston, W-10)
81
Appendix
Wheat Marketing Score .............................................................................................................. 82
Method #1 ....................................................................................................................... 82
Method #2 ....................................................................................................................... 83
Wheat Kernel Characteristics by Location .................................................................................. 84
Flour Characteristics by Location ................................................................................................ 85
Flour Protein Characteristics by Location ................................................................................... 86
Farinograph Characteristics by Location .................................................................................... 87
Mixograph Characteristics by Location ....................................................................................... 88
Interpreting Mixogram Results .................................................................................................... 89
Extensograph Characteristics by Location .................................................................................. 90
Ash/Protein Content in Mill Streams ........................................................................................... 93
Cooperators’ Bake Data ............................................................................................................ 101 Hard Red Spring Wheat Breeding Quality Target Values ......................................................... 124

82
Wheat Marketing Score
The development of a Wheat Marketing Score (WMS) or Export Marketing Score was discussed at the Hard Spring Wheat Planning Meeting in March, 2004. The purpose for developing a WMS was to facilitate a better understanding of wheat quality in marketing systems. Two WMS methods were developed and tested. For each method, the quality variables of Test Weight (TW), 1000 Kernel Weight (KWT), Falling Number (FN), Wheat Protein (WP), and Wheat Ash (WA) were incorporated for calculating the WMS. Method #1 was developed on a scale of 0 to 6 where Glenn Check was evaluated along with the experimental lines for each growing locations. Method #2 was developed on a scale of 0 to 10 where the experimental lines were evaluated against the Glenn Check for each growing locations.
Wheat Marketing Score – Method #1
Wheat Marketing Score or Export Marketing Score
Score
Test Weight (lb/bu)
1000 KWT (g)
Falling Number
(sec)
Wheat Protein
(%, 12% mb)
Wheat Ash
(%, 14% mb)
6 63 39 425 16.5 1.35
5 62 36 400 15.5 1.45
4 61 33 375 14.5 1.55
Target Value 3 60 30 350 13.5 1.65
2 59 26 325 12.5 1.75
1 58 22 300 11.5 1.85
0 57 18 275 10.5 1.95
Variation (+/-) from Target Value 1 3 g up, 4 g down 25 1.0 0.10
Wheat Marketing Score = [(TW*2) + (1000 KWT*2) + (FN*2) + (WP *3) + WA] / 10

83
Wheat Marketing Score – Method #2
Component Score
Wheat Protein (%, 12% mb)
Test Weight (lb/bu)
Falling Number
(sec)
1000 Kernel Weight
(g)
Wheat Ash
(%, 14% mb)
0 Diff > 6.0 Diff > 10 Diff < -125 Diff > 20 Diff > 0.5
2 5.0 < Diff ≤ 6.0 8 < Diff ≤ 10 -125 ≤ Diff < -100 16 < Diff ≤ 20 0.4 < Diff ≤ 0.5
4 4.0 < Diff ≤ 5.0 6 < Diff ≤ 8 -100 ≤ Diff < -75 12 < Diff ≤ 16 0.3 < Diff ≤ 0.4
6 3.0 < Diff ≤ 4.0 4 < Diff ≤ 6 -75 ≤ Diff < -50 8 < Diff ≤ 12 0.2 < Diff ≤ 0.3
8 2.0 < Diff ≤ 3.0 2 < Diff ≤ 4 -50 ≤ Diff < -25 4 < Diff ≤ 8 0.1 < Diff ≤ 0.2
10 -0.5 ≤ Diff ≤ 2.0 -1 ≤ Diff ≤ 2 Diff ≥ -25 -2 ≤ Diff ≤ 4 Diff ≤ 0.1
8 -1.0 ≤ Diff < -0.5 -2 ≤ Diff < -1 -- -4 ≤ Diff < -2 --
6 -1.5 ≤ Diff < -1.0 -3 ≤ Diff < -2 -- -6 ≤ Diff < -4 --
4 -2.0 ≤ Diff ≤ -1.5 -4 ≤ Diff < -3 -- -8 ≤ Diff < -6 --
2 -2.5 ≤ Diff < -2.0 -5 ≤ Diff < -4 -- -10 ≤ Diff < -8 --
0 Diff < -2.5 Diff < -5 -- Diff < -10 -- Weight of each
factor 0.3 0.2 0.2 0.2 0.1
Wheat Marketing Score = (WP*0.3) + (TW*0.2) + (FN*0.2) + (1000 TKW*0.2) + (WA*0.1)

84
Wheat Kernel Characteristics by Location
Wheat 1000 Wheat Marketing Test Kernel Kernel Size Wheat Wheat Falling SKCS Vitreous Protein Score DON Weight Weight Large Small Moisture Ash Number Hardness Kernels
Location ID Entry (%, 12% mb) 1-6 1-10 (ppm) (lbs/bu) (g) (%) (%) (%) (%, 14% mb) (sec) Index (%)
Watertown
B-2 SD4465 13.9 2.9 8.0 nd 58.3 32.1 60 8 10.7 1.53 335 71.2 19 B-4 LCS Rebel 14.3 3.1 8.0 nd 59.9 34.6 72 7 10.8 1.45 275 65.1 33 B-7 WB9479 15.0 3.1 6.8 nd 58.6 34.7 79 4 10.5 1.46 232 63.5 15 B-8 SD4579 14.5 3.6 8.4 nd 59.4 29.9 29 17 10.6 1.39 376 55.5 20 B-9 Glenn 14.4 4.3 10.0 nd 62.6 32.9 61 7 10.5 1.42 365 76.6 28 B-10 WB9590 15.0 2.9 6.8 nd 58.2 34.2 68 7 10.6 1.50 261 62.9 17
Casselton
C-2 SD4465 14.1 4.0 8.6 nd 61.4 33.3 65 6 10.7 1.50 373 74.6 45 C-4 LCS Rebel 13.9 4.3 9.4 nd 63.3 34.0 68 5 10.6 1.38 357 73.7 56 C-5 MN13288-1 14.6 4.0 8.4 nd 60.4 30.6 46 14 10.1 1.49 401 78.7 42 C-7 WB9479 14.0 3.6 7.8 nd 61.1 34.5 77 4 10.5 1.46 312 67.0 47 C-8 SD4579 13.7 3.7 7.2 nd 61.0 29.9 29 19 10.6 1.43 370 59.1 27 C-9 Glenn 14.8 4.2 10.0 nd 64.2 32.7 66 5 10.5 1.55 344 81.9 91
C-10 WB9590 14.4 3.9 8.4 nd 61.8 36.9 84 3 10.4 1.48 305 71.8 60
Havre
H-1 WB9719 15.9 4.5 10.0 nd 61.1 25.0 26 21 9.1 1.39 418 70.5 96 H-3 WB9616CLP 17.2 3.7 8.4 nd 58.0 21.0 4 33 9.2 1.57 448 71.6 96 H-4 LCS Rebel 16.2 4.4 9.6 nd 60.0 25.2 11 26 8.9 1.37 434 69.2 97 H-5 MN13288-1 16.6 4.1 8.8 nd 58.0 27.8 8 30 8.9 1.50 513 66.5 88 H-6 SY Rockford 15.7 3.9 8.4 nd 57.7 26.8 11 28 8.7 1.38 428 65.6 87 H-9 Glenn 16.2 4.5 10.0 nd 61.8 24.5 4 26 8.9 1.47 405 70.8 92
H-10 WB9590 17.0 4.2 9.0 nd 59.1 27.0 27 15 8.8 1.61 455 65.5 87
Crookston
K-2 SD4465 12.6 4.0 8.8 nd 62.2 31.8 47 12 9.6 1.41 413 83.9 62 K-4 LCS Rebel 12.4 4.5 9.4 nd 64.5 36.8 75 5 10.2 1.27 404 77.6 71 K-5 MN13288-1 12.0 4.0 7.6 nd 62.0 32.8 62 8 9.5 1.42 424 82.2 64 K-7 WB9479 12.2 4.4 9.0 0.89 63.3 35.1 80 4 9.8 1.39 426 75.3 68 K-8 SD4579 11.4 3.5 6.6 nd 62.9 29.1 29 17 9.9 1.44 403 65.9 44 K-9 Glenn 13.1 4.4 10.0 nd 65.3 33.7 70 7 10.1 1.36 404 88.1 88 K-10 WB9590 12.5 4.6 8.6 0.71 63.0 36.6 84 4 10.7 1.21 447 72.8 67
Minot
M-1 WB9719 15.8 4.8 10.0 nd 62.2 35.3 80 4 10.2 1.42 363 71.2 69 M-4 LCS Rebel 15.0 3.8 7.2 nd 61.3 35.2 67 6 9.9 1.34 277 71.0 62 M-6 SY Rockford 14.9 4.3 8.0 nd 60.2 35.1 66 6 10.3 1.45 384 67.2 22 M-7 WB9479 16.1 4.2 7.6 nd 61.1 37.2 81 3 10.8 1.40 255 65.2 20 M-9 Glenn 16.2 4.9 10.0 nd 63.1 32.4 62 7 10.7 1.48 372 85.2 78 M-10 WB9590 16.0 4.1 8.0 nd 60.3 37.0 73 5 9.9 1.38 299 69.8 18
Williston
W-1 WB9719 18.3 4.1 10.0 nd 59.4 25.0 24 22 11.0 1.43 389 70.1 82 W-3 WB9616CLP 20.3 3.4 8.8 nd 58.6 26.2 14 22 10.7 1.49 327 66.2 90 W-4 LCS Rebel 19.6 2.9 8.4 nd 57.3 24.0 12 34 10.7 1.42 306 69.4 98 W-6 SY Rockford 19.0 3.3 8.8 nd 57.1 27.4 15 27 10.4 1.38 335 69.0 98 W-7 WB9479 19.1 3.7 9.6 nd 58.4 24.2 14 31 10.2 1.44 376 67.7 89 W-9 Glenn 18.6 4.0 10.0 nd 58.7 24.1 6 38 10.3 1.45 404 70.2 96
W-10 WB9590 18.7 3.2 8.8 nd 56.8 24.9 19 25 10.4 1.41 335 67.1 96

85
Flour Characteristics by Location
Flour Extraction Flour Flour TWB* TPB* Flour/bu Flour Color Moisture Protein Flour Ash Flour FN
Location ID Entry (%) (%) Wheat (lbs) L* b* L b (%) (%, 14% mb) (%, 14% mb) Malted (sec)
Watertown
B-2 SD4465 72.2 72.8 42.2 89.4 8.6 86.6 8.2 13.1 12.8 0.49 260 B-4 LCS Rebel 73.2 73.9 43.8 89.6 7.6 86.9 7.3 12.8 13.2 0.45 269** B-7 WB9479 71.4 72.5 42.2 89.5 7.7 86.7 7.4 13.2 14.1 0.45 217** B-8 SD4579 74.9 75.6 44.7 90.0 7.0 87.4 6.8 13.3 13.6 0.40 250 B-9 Glenn 69.1 70.0 43.7 89.8 7.8 87.2 7.5 13.6 13.5 0.46 246 B-10 WB9590 69.3 69.8 40.7 89.6 7.9 86.8 7.6 13.5 14.1 0.45 286**
Casselton
C-2 SD4465 73.5 73.6 45.5 89.7 9.2 87.0 8.8 13.0 13.0 0.48 254 C-4 LCS Rebel 75.1 75.9 45.0 89.9 8.6 87.2 8.2 13.0 12.9 0.41 252 C-5 MN13288-1 73.4 74.2 45.1 89.6 8.8 86.9 8.4 13.3 13.4 0.50 250 C-7 WB9479 74.8 75.3 46.4 89.6 8.7 86.9 8.3 13.5 13.4 0.42 252 C-8 SD4579 78.0 78.5 48.1 89.8 8.1 87.1 7.8 13.3 12.8 0.44 247 C-9 Glenn 73.1 72.2 47.5 89.6 8.2 86.8 7.9 13.3 13.9 0.43 259
C-10 WB9590 74.5 73.0 46.4 89.5 8.5 86.8 8.2 13.4 13.5 0.45 251
Havre
H-1 WB9719 70.8 70.2 43.3 89.6 9.0 86.8 8.6 12.5 15.1 0.43 247 H-3 WB9616CLP 69.7 69.6 40.8 90.3 7.7 87.7 7.4 13.2 16.4 0.42 254 H-4 LCS Rebel 72.9 73.1 44.2 90.1 8.6 87.5 8.3 13.4 15.2 0.39 245 H-5 MN13288-1 69.8 70.2 41.2 90.1 8.4 87.4 8.1 14.0 16.2 0.43 250 H-6 SY Rockford 70.1 70.3 41.1 90.2 8.9 87.6 8.5 13.9 14.7 0.41 249 H-9 Glenn 70.6 71.0 44.3 90.0 8.6 87.3 8.3 13.8 15.5 0.45 247
H-10 WB9590 69.1 69.7 41.4 89.6 9.2 86.9 8.7 13.7 16.3 0.44 251
Crookston
K-2 SD4465 72.7 73.1 46.2 90.5 10.0 87.9 9.5 13.8 11.5 0.42 249 K-4 LCS Rebel 76.3 76.4 49.5 90.6 8.9 88.1 8.6 13.4 11.3 0.39 256 K-5 MN13288-1 74.5 74.5 47.0 90.5 8.7 88.0 8.4 13.4 11.1 0.46 251 K-7 WB9479 75.4 75.7 48.6 90.5 9.2 88.0 8.8 13.5 11.5 0.40 253 K-8 SD4579 77.2 77.7 49.4 90.8 8.0 88.4 7.7 13.7 10.7 0.44 251 K-9 Glenn 71.8 71.9 47.3 90.5 8.5 88.0 8.2 13.3 12.2 0.43 249 K-10 WB9590 74.1 74.1 47.5 90.1 9.3 87.5 8.9 13.4 11.8 0.38 250
Minot
M-1 WB9719 67.6 68.0 43.1 89.6 8.0 86.8 7.6 13.7 15.0 0.38 249 M-4 LCS Rebel 73.5 74.1 46.1 90.3 8.0 87.7 7.7 13.5 14.0 0.40 250 M-6 SY Rockford 73.7 73.5 45.3 90.3 8.4 87.7 8.1 13.2 13.5 0.40 245 M-7 WB9479 74.4 74.2 45.8 89.5 8.3 86.7 7.9 13.3 15.0 0.42 245 M-9 Glenn 70.7 71.2 44.7 89.7 8.3 87.0 7.9 13.0 15.2 0.47 250
M-10 WB9590 72.6 73.4 44.4 89.4 8.5 86.7 8.1 13.1 15.5 0.46 251
Williston
W-1 WB9719 69.3 69.6 41.4 89.7 8.8 87.0 8.4 13.7 17.4 0.42 249 W-3 WB9616CLP 68.1 68.2 40.3 90.2 7.1 87.5 6.9 13.6 18.6 0.42 253 W-4 LCS Rebel 71.5 71.7 41.3 89.7 8.7 87.0 8.3 13.6 18.3 0.42 250 W-6 SY Rockford 70.7 70.8 41.0 89.7 8.7 87.0 8.3 13.9 17.3 0.47 250 W-7 WB9479 72.0 71.4 42.4 89.1 9.4 86.3 9.0 13.7 17.9 0.41 255 W-9 Glenn 71.1 71.0 42.1 89.5 8.7 86.7 8.3 13.4 17.4 0.43 249
W-10 WB9590 69.8 70.7 40.1 89.2 9.0 86.4 8.6 13.6 18.1 0.42 250
*TWB = Tempered wheat basis; TPB = Total product basis. **Flour not malted.

86
Flour Protein Characteristics by Location
HMW Glutenin Subunits Location ID Entry TPP/TMP† GLU-A1 GLU-B1 GLU-D1
Watertown
B-2 SD4465 0.927 2* 5+10 7+9 B-4 LCS Rebel 0.884 2* 5+10 7+9 B-7 WB9479 0.837 2* 5+10 7oe+8‡ B-8 SD4579 0.769 2* 5+10 7+9 B-9 Glenn 0.820 2* 5+10 7+9 B-10 WB9590 0.830 2* 5+10 7+9
Casselton
C-2 SD4465 0.996 2* 5+10 7+9 C-4 LCS Rebel 0.973 2* 5+10 7+9 C-5 MN13288-1 0.930 1 5+10 7+8 C-7 WB9479 0.939 2* 5+10 7oe+8 C-8 SD4579 0.833 2* 5+10 7+9 C-9 Glenn 0.822 2* 5+10 7+9
C-10 WB9590 0.859 2* 5+10 7+9
Havre
H-1 WB9719 0.839 2* 5+10 7+9 H-3 WB9616CLP 0.817 2*, 1 5+10 17+18 H-4 LCS Rebel 0.864 2* 5+10 7+9 H-5 MN13288-1 0.829 1 5+10 7+8 H-6 SY Rockford 0.709 2* 5+10 7+8 H-9 Glenn 0.795 2* 5+10 7+9
H-10 WB9590 0.821 2* 5+10 7+9
Crookston
K-2 SD4465 1.079 2* 5+10 7+9 K-4 LCS Rebel 0.992 2* 5+10 7+9 K-5 MN13288-1 0.934 1 5+10 7+8 K-7 WB9479 0.925 2* 5+10 7oe+8 K-8 SD4579 0.838 2* 5+10 7+9 K-9 Glenn 0.902 2* 5+10 7+9 K-10 WB9590 0.885 2* 5+10 7+9
Minot
M-1 WB9719 0.834 2* 5+10 7+9 M-4 LCS Rebel 0.930 2* 5+10 7+9 M-6 SY Rockford 0.714 2* 5+10 7+8 M-7 WB9479 0.828 2* 5+10 7oe+8 M-9 Glenn 0.793 2* 5+10 7+9
M-10 WB9590 0.757 2* 5+10 7+9
Williston
W-1 WB9719 0.787 2* 5+10 7+9 W-3 WB9616CLP 0.797 2*, 1 5+10 17+18 W-4 LCS Rebel 0.847 2* 5+10 7+9 W-6 SY Rockford 0.703 2* 5+10 7+8 W-7 WB9479 0.812 2* 5+10 7oe+8 W-9 Glenn 0.776 2* 5+10 7+9
W-10 WB9590 0.769 2* 5+10 7+9
†TPP/TMP = Total polymeric protein / total monomeric protein. ‡7oe = Over-expression of HMW glutenin subunit 7. Will need confirmation by PCR analysis.

87
Farinograph Characteristics by Location
Location ID Entry Water Abs. (%, 500 BU)
Water Abs. (%, 14% mb)
Arrival Time (min)
Peak Time (min)
Dough Stability
(min) MTI (BU)
TTB (min)
Watertown
B-2 SD4465 63.3 62.1 2.4 6.2 8.5 34 10.6 B-4 LCS Rebel 65.0 63.4 2.4 5.2 8.1 27 10.6 B-7 WB9479 62.9 61.9 2.0 4.5 7.5 33 8.9 B-8 SD4579 61.6 60.7 3.5 7.2 7.3 44 10.8 B-9 Glenn 64.3 63.7 2.5 4.7 9.4 22 11.1 B-10 WB9590 63.4 62.7 2.8 6.8 11.9 23 13.1
Casselton
C-2 SD4465 64.5 63.1 3.5 6.5 6.2 51 9.3 C-4 LCS Rebel 64.9 63.4 2.7 7.0 8.3 38 10.6 C-5 MN13288-1 61.6 60.6 2.4 6.7 9.7 29 11.8 C-7 WB9479 62.4 61.6 2.2 6.7 11.2 28 11.8 C-8 SD4579 61.3 60.3 3.0 6.2 6.3 42 9.6 C-9 Glenn 66.8 65.9 2.4 6.3 8.7 33 11.0
C-10 WB9590 65.1 64.2 3.4 5.8 6.8 34 9.9
Havre
H-1 WB9719 67.0 66.1 4.8 11.4 12.3 33 15.5 H-3 WB9616CLP 63.9 63.1 3.7 10.5 30.3 11 34.9 H-4 LCS Rebel 65.6 65.0 5.8 13.2 14.4 27 18.6 H-5 MN13288-1 62.1 62.3 3.6 9.2 35.9 6 41.0 H-6 SY Rockford 66.2 66.3 5.0 10.0 15.3 17 20.6 H-9 Glenn 64.5 64.3 5.7 10.8 19.7 12 25.3
H-10 WB9590 65.5 65.1 5.6 10.7 15.0 19 20.4
Crookston
K-2 SD4465 62.2 61.8 2.9 5.7 6.6 37 9.6 K-4 LCS Rebel 63.4 62.7 2.2 6.8 9.0 30 11.2 K-5 MN13288-1 59.7 58.9 1.6 3.4 8.2 17 9.5 K-7 WB9479 60.7 60.2 1.7 2.7 9.7 15 10.5 K-8 SD4579 58.5 57.8 1.9 5.2 6.2 45 8.5 K-9 Glenn 64.6 63.7 1.8 5.0 9.7 23 11.0 K-10 WB9590 60.9 60.1 2.1 6.5 10.0 24 12.7
Minot
M-1 WB9719 67.3 66.5 5.4 9.4 10.3 22 16.5 M-4 LCS Rebel 64.7 63.8 4.2 10.4 15.4 19 18.5 M-6 SY Rockford 67.1 66.1 3.9 7.7 11.0 25 14.3 M-7 WB9479 63.5 62.6 3.6 10.3 24.1 7 26.4 M-9 Glenn 66.3 65.0 4.5 10.5 25.4 9 29.9
M-10 WB9590 65.1 64.1 4.8 10.0 15.9 19 19.6
Williston
W-1 WB9719 67.7 67.9 16.0 32.4 30.0 6 48.0 W-3 WB9616CLP 66.1 65.3 10.6 31.5 29.9 5 42.1 W-4 LCS Rebel 67.4 66.5 9.8 32.3 41.8 8 51.9 W-6 SY Rockford 68.2 68.2 8.2 19.9 24.8 11 33.9 W-7 WB9479 66.6 66.4 14.8 28.7 31.8 3 48.0 W-9 Glenn 66.1 66.2 8.0 25.5 34.0 5 42.6
W-10 WB9590 66.6 66.5 7.7 27.4 30.3 6 39.1

88
Mixograph Characteristics by Location
Location ID Entry
Envelope Peak Time (min)
Envelope Peak Value
(%)
Envelope Peak Width
(%)
Midline Peak Time (min)
Midline Peak Value
(%)
Midline Peak Width
(%)
Midline Peak
Integral (% TQ*min)
Watertown
B-2 SD4465 4.8 70.7 28.9 4.9 55.8 28.4 210.8 B-4 LCS Rebel 5.0 73.1 30.4 4.9 57.4 29.8 213.5 B-7 WB9479 6.0 67.6 26.8 6.3 53.6 24.6 257.8 B-8 SD4579 2.9 66.2 29.1 3.4 51.2 24.1 134.8 B-9 Glenn 5.6 68.8 30.3 6.0 53.1 28.3 254.9 B-10 WB9590 4.8 71.1 30.5 5.4 55.8 28.0 230.6
Casselton
C-2 SD4465 2.7 73.5 32.2 3.4 58.0 28.5 146.3 C-4 LCS Rebel 4.0 73.2 33.5 3.9 55.1 33.1 163.9 C-5 MN13288-1 4.9 64.0 26.1 5.1 50.2 25.3 190.5 C-7 WB9479 4.6 69.7 30.8 5.4 54.6 24.4 228.3 C-8 SD4579 2.7 68.7 31.0 2.9 52.6 30.9 113.0 C-9 Glenn 4.3 74.9 30.0 4.0 60.1 28.1 176.1
C-10 WB9590 3.4 81.3 34.4 3.3 63.6 34.3 156.9
Havre
H-1 WB9719 3.4 74.1 33.0 3.8 58.4 26.6 155.5 H-3 WB9616CLP 4.6 69.1 29.3 5.0 54.1 27.0 193.9 H-4 LCS Rebel 4.0 79.7 33.4 4.3 63.2 31.1 179.1 H-5 MN13288-1 4.8 67.6 26.4 5.1 55.1 22.1 194.8 H-6 SY Rockford 3.0 76.0 27.4 3.1 62.5 27.0 140.8 H-9 Glenn 4.0 78.8 32.2 4.2 62.5 29.9 172.9
H-10 WB9590 3.5 76.4 32.2 3.6 60.4 32.1 143.5
Crookston
K-2 SD4465 3.6 73.9 31.7 3.8 57.1 31.9 158.5 K-4 LCS Rebel 3.8 73.8 32.3 4.1 56.8 29.6 180.2 K-5 MN13288-1 4.9 57.0 26.0 5.4 43.6 21.6 190.6 K-7 WB9479 7.7 57.1 26.3 8.0 43.5 25.7 267.8 K-8 SD4579 3.3 58.0 24.2 3.5 45.5 23.8 129.9 K-9 Glenn 5.3 69.6 28.2 4.9 54.6 25.9 208.4 K-10 WB9590 4.6 67.4 30.4 4.8 51.7 28.1 194.4
Minot
M-1 WB9719 3.1 77.6 31.8 3.4 62.7 29.4 147.8 M-4 LCS Rebel 4.0 79.4 35.2 4.5 61.9 31.8 196.5 M-6 SY Rockford 3.0 81.0 30.8 3.2 65.4 30.0 153.6 M-7 WB9479 4.9 75.3 31.8 5.5 59.1 29.1 232.7 M-9 Glenn 4.5 80.2 31.5 4.9 64.2 28.5 219.4
M-10 WB9590 4.1 72.4 28.9 4.2 58.5 28.9 170.0
Williston
W-1 WB9719 6.5 77.2 34.9 6.5 59.9 34.1 254.1 W-3 WB9616CLP 6.5 75.5 33.3 6.8 59.6 28.9 240.6 W-4 LCS Rebel 6.9 83.5 40.1 7.4 64.1 35.1 303.7 W-6 SY Rockford 4.2 84.0 38.5 4.4 64.8 35.7 194.3 W-7 WB9479 5.9 86.3 37.7 5.8 67.3 36.9 247.0 W-9 Glenn 6.4 79.4 33.4 6.3 62.5 33.4 250.1
W-10 WB9590 5.5 77.3 31.6 5.6 61.5 30.0 218.8

89
Interpreting Mixogram Results
Among the numbers on the previous page, the time to peak (maximum mixing resistance) for both the top of the envelope and midline is shown, including envelope and midline % of full value. These values are traditionally the most meaningful. A midline peak time around 3-5 minutes and 60% scale are usually about right for bread flour. Very steep slopes for left-of-peak and right-of-peak are undesirable, which indicate a flour sample with low tolerance and high sensitivity to mixing time. Delayed peaks and narrow widths (especially at about 8 minutes) are often taken as indicating “weakness.” Integral values for the midline section are for the areas beneath the midline from time 0 to the peak. Units are the vertical axis (% torque) multiplied by the horizontal axis (minutes). These values represent the work put into the flour and water in order to develop the dough. In summary, the midline time to peak and % peak values, the top line ascending and descending slopes, and the bandwidth at 8 minutes are the values most used. “Best” values are typically determined by the breeder, miller, and baker. (MixSmart Documentation and Instructions, A.E. Walker and C.E. Walker, 2004, National Manufacturing Company)
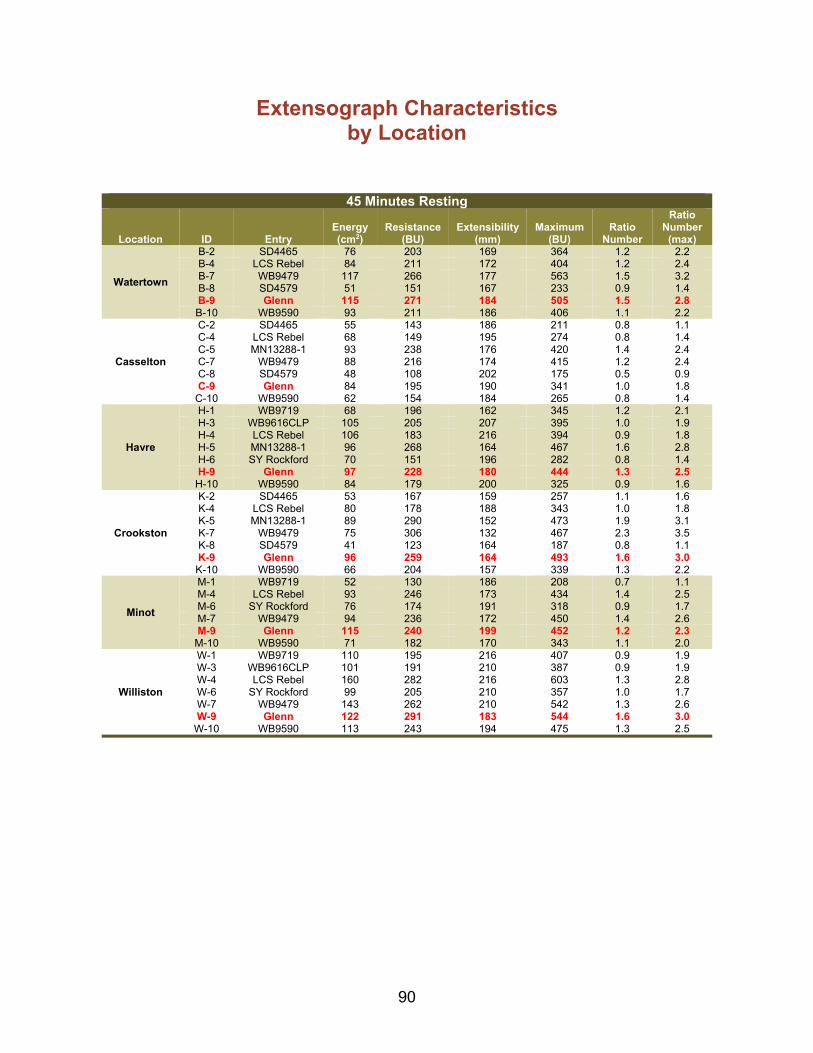
90
Extensograph Characteristics by Location
45 Minutes Resting
Location ID Entry Energy (cm2)
Resistance (BU)
Extensibility (mm)
Maximum (BU)
Ratio Number
Ratio Number
(max)
Watertown
B-2 SD4465 76 203 169 364 1.2 2.2 B-4 LCS Rebel 84 211 172 404 1.2 2.4 B-7 WB9479 117 266 177 563 1.5 3.2 B-8 SD4579 51 151 167 233 0.9 1.4 B-9 Glenn 115 271 184 505 1.5 2.8 B-10 WB9590 93 211 186 406 1.1 2.2
Casselton
C-2 SD4465 55 143 186 211 0.8 1.1 C-4 LCS Rebel 68 149 195 274 0.8 1.4 C-5 MN13288-1 93 238 176 420 1.4 2.4 C-7 WB9479 88 216 174 415 1.2 2.4 C-8 SD4579 48 108 202 175 0.5 0.9 C-9 Glenn 84 195 190 341 1.0 1.8
C-10 WB9590 62 154 184 265 0.8 1.4
Havre
H-1 WB9719 68 196 162 345 1.2 2.1 H-3 WB9616CLP 105 205 207 395 1.0 1.9 H-4 LCS Rebel 106 183 216 394 0.9 1.8 H-5 MN13288-1 96 268 164 467 1.6 2.8 H-6 SY Rockford 70 151 196 282 0.8 1.4 H-9 Glenn 97 228 180 444 1.3 2.5
H-10 WB9590 84 179 200 325 0.9 1.6
Crookston
K-2 SD4465 53 167 159 257 1.1 1.6 K-4 LCS Rebel 80 178 188 343 1.0 1.8 K-5 MN13288-1 89 290 152 473 1.9 3.1 K-7 WB9479 75 306 132 467 2.3 3.5 K-8 SD4579 41 123 164 187 0.8 1.1 K-9 Glenn 96 259 164 493 1.6 3.0 K-10 WB9590 66 204 157 339 1.3 2.2
Minot
M-1 WB9719 52 130 186 208 0.7 1.1 M-4 LCS Rebel 93 246 173 434 1.4 2.5 M-6 SY Rockford 76 174 191 318 0.9 1.7 M-7 WB9479 94 236 172 450 1.4 2.6 M-9 Glenn 115 240 199 452 1.2 2.3
M-10 WB9590 71 182 170 343 1.1 2.0
Williston
W-1 WB9719 110 195 216 407 0.9 1.9 W-3 WB9616CLP 101 191 210 387 0.9 1.9 W-4 LCS Rebel 160 282 216 603 1.3 2.8 W-6 SY Rockford 99 205 210 357 1.0 1.7 W-7 WB9479 143 262 210 542 1.3 2.6 W-9 Glenn 122 291 183 544 1.6 3.0
W-10 WB9590 113 243 194 475 1.3 2.5
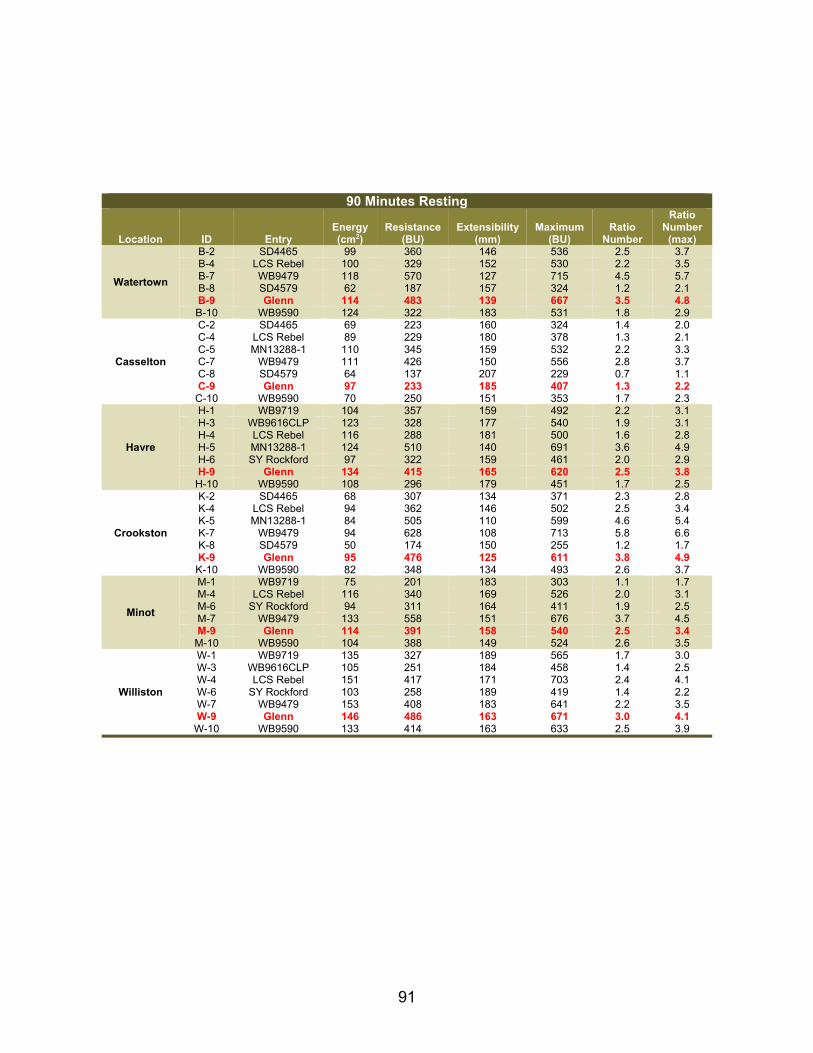
91
90 Minutes Resting
Location ID Entry Energy (cm2)
Resistance (BU)
Extensibility (mm)
Maximum (BU)
Ratio Number
Ratio Number
(max)
Watertown
B-2 SD4465 99 360 146 536 2.5 3.7 B-4 LCS Rebel 100 329 152 530 2.2 3.5 B-7 WB9479 118 570 127 715 4.5 5.7 B-8 SD4579 62 187 157 324 1.2 2.1 B-9 Glenn 114 483 139 667 3.5 4.8 B-10 WB9590 124 322 183 531 1.8 2.9
Casselton
C-2 SD4465 69 223 160 324 1.4 2.0 C-4 LCS Rebel 89 229 180 378 1.3 2.1 C-5 MN13288-1 110 345 159 532 2.2 3.3 C-7 WB9479 111 426 150 556 2.8 3.7 C-8 SD4579 64 137 207 229 0.7 1.1 C-9 Glenn 97 233 185 407 1.3 2.2
C-10 WB9590 70 250 151 353 1.7 2.3
Havre
H-1 WB9719 104 357 159 492 2.2 3.1 H-3 WB9616CLP 123 328 177 540 1.9 3.1 H-4 LCS Rebel 116 288 181 500 1.6 2.8 H-5 MN13288-1 124 510 140 691 3.6 4.9 H-6 SY Rockford 97 322 159 461 2.0 2.9 H-9 Glenn 134 415 165 620 2.5 3.8
H-10 WB9590 108 296 179 451 1.7 2.5
Crookston
K-2 SD4465 68 307 134 371 2.3 2.8 K-4 LCS Rebel 94 362 146 502 2.5 3.4 K-5 MN13288-1 84 505 110 599 4.6 5.4 K-7 WB9479 94 628 108 713 5.8 6.6 K-8 SD4579 50 174 150 255 1.2 1.7 K-9 Glenn 95 476 125 611 3.8 4.9 K-10 WB9590 82 348 134 493 2.6 3.7
Minot
M-1 WB9719 75 201 183 303 1.1 1.7 M-4 LCS Rebel 116 340 169 526 2.0 3.1 M-6 SY Rockford 94 311 164 411 1.9 2.5 M-7 WB9479 133 558 151 676 3.7 4.5 M-9 Glenn 114 391 158 540 2.5 3.4
M-10 WB9590 104 388 149 524 2.6 3.5
Williston
W-1 WB9719 135 327 189 565 1.7 3.0 W-3 WB9616CLP 105 251 184 458 1.4 2.5 W-4 LCS Rebel 151 417 171 703 2.4 4.1 W-6 SY Rockford 103 258 189 419 1.4 2.2 W-7 WB9479 153 408 183 641 2.2 3.5 W-9 Glenn 146 486 163 671 3.0 4.1
W-10 WB9590 133 414 163 633 2.5 3.9
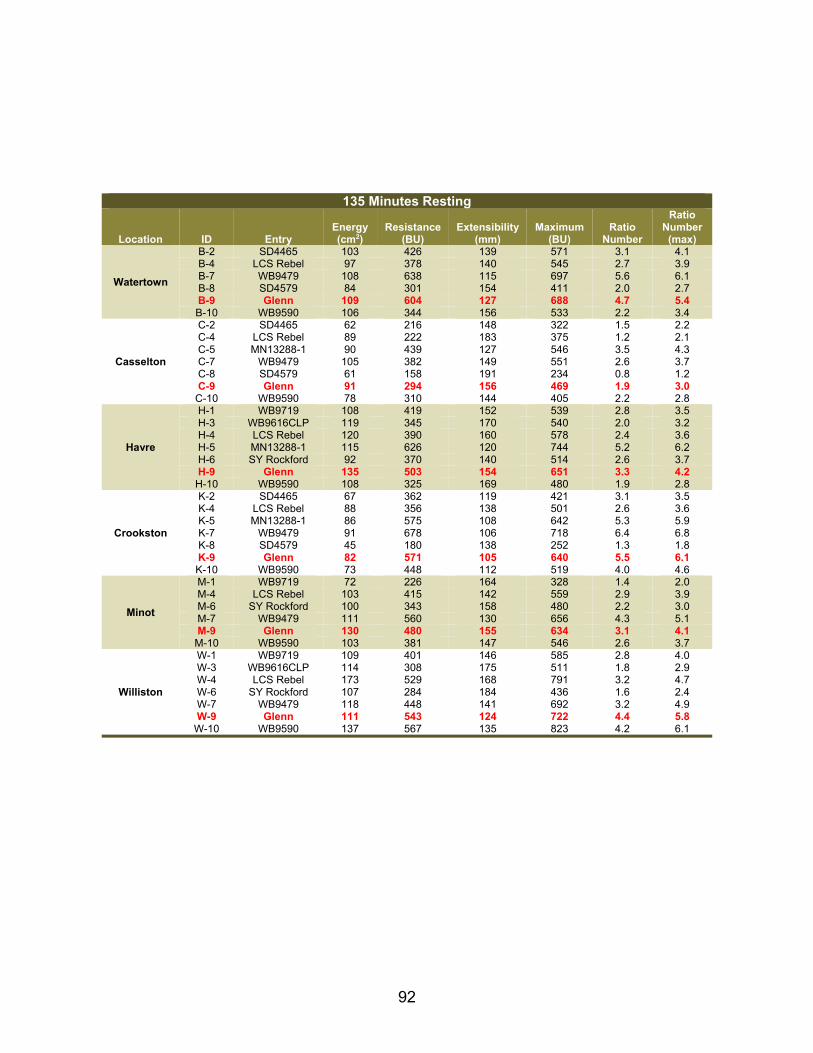
92
135 Minutes Resting
Location ID Entry Energy (cm2)
Resistance (BU)
Extensibility (mm)
Maximum (BU)
Ratio Number
Ratio Number
(max)
Watertown
B-2 SD4465 103 426 139 571 3.1 4.1 B-4 LCS Rebel 97 378 140 545 2.7 3.9 B-7 WB9479 108 638 115 697 5.6 6.1 B-8 SD4579 84 301 154 411 2.0 2.7 B-9 Glenn 109 604 127 688 4.7 5.4 B-10 WB9590 106 344 156 533 2.2 3.4
Casselton
C-2 SD4465 62 216 148 322 1.5 2.2 C-4 LCS Rebel 89 222 183 375 1.2 2.1 C-5 MN13288-1 90 439 127 546 3.5 4.3 C-7 WB9479 105 382 149 551 2.6 3.7 C-8 SD4579 61 158 191 234 0.8 1.2 C-9 Glenn 91 294 156 469 1.9 3.0
C-10 WB9590 78 310 144 405 2.2 2.8
Havre
H-1 WB9719 108 419 152 539 2.8 3.5 H-3 WB9616CLP 119 345 170 540 2.0 3.2 H-4 LCS Rebel 120 390 160 578 2.4 3.6 H-5 MN13288-1 115 626 120 744 5.2 6.2 H-6 SY Rockford 92 370 140 514 2.6 3.7 H-9 Glenn 135 503 154 651 3.3 4.2
H-10 WB9590 108 325 169 480 1.9 2.8
Crookston
K-2 SD4465 67 362 119 421 3.1 3.5 K-4 LCS Rebel 88 356 138 501 2.6 3.6 K-5 MN13288-1 86 575 108 642 5.3 5.9 K-7 WB9479 91 678 106 718 6.4 6.8 K-8 SD4579 45 180 138 252 1.3 1.8 K-9 Glenn 82 571 105 640 5.5 6.1 K-10 WB9590 73 448 112 519 4.0 4.6
Minot
M-1 WB9719 72 226 164 328 1.4 2.0 M-4 LCS Rebel 103 415 142 559 2.9 3.9 M-6 SY Rockford 100 343 158 480 2.2 3.0 M-7 WB9479 111 560 130 656 4.3 5.1 M-9 Glenn 130 480 155 634 3.1 4.1
M-10 WB9590 103 381 147 546 2.6 3.7
Williston
W-1 WB9719 109 401 146 585 2.8 4.0 W-3 WB9616CLP 114 308 175 511 1.8 2.9 W-4 LCS Rebel 173 529 168 791 3.2 4.7 W-6 SY Rockford 107 284 184 436 1.6 2.4 W-7 WB9479 118 448 141 692 3.2 4.9 W-9 Glenn 111 543 124 722 4.4 5.8
W-10 WB9590 137 567 135 823 4.2 6.1
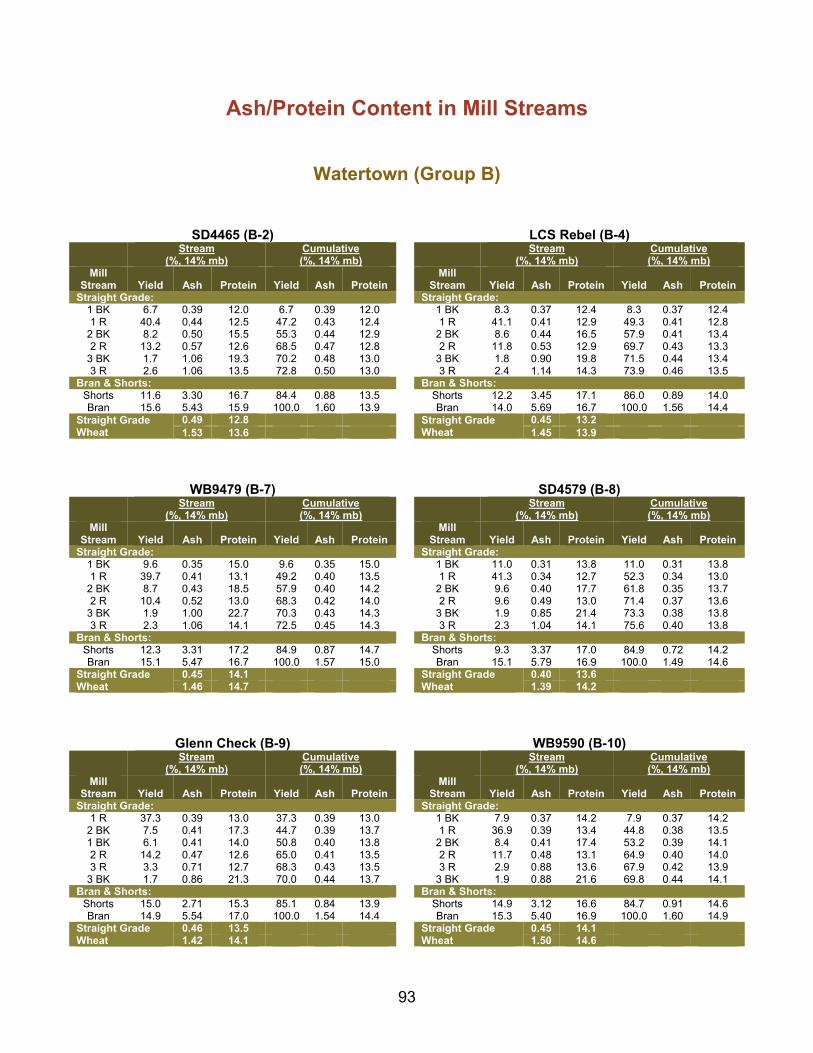
93
Ash/Protein Content in Mill Streams
Watertown (Group B)
SD4465 (B-2) LCS Rebel (B-4)
Stream
(%, 14% mb) Cumulative (%, 14% mb)
Stream
(%, 14% mb) Cumulative (%, 14% mb)
Mill Stream Yield Ash Protein Yield Ash Protein
Mill Stream Yield Ash Protein Yield Ash Protein
Straight Grade: Straight Grade: 1 BK 6.7 0.39 12.0 6.7 0.39 12.0 1 BK 8.3 0.37 12.4 8.3 0.37 12.4 1 R 40.4 0.44 12.5 47.2 0.43 12.4 1 R 41.1 0.41 12.9 49.3 0.41 12.8
2 BK 8.2 0.50 15.5 55.3 0.44 12.9 2 BK 8.6 0.44 16.5 57.9 0.41 13.4 2 R 13.2 0.57 12.6 68.5 0.47 12.8 2 R 11.8 0.53 12.9 69.7 0.43 13.3
3 BK 1.7 1.06 19.3 70.2 0.48 13.0 3 BK 1.8 0.90 19.8 71.5 0.44 13.4 3 R 2.6 1.06 13.5 72.8 0.50 13.0 3 R 2.4 1.14 14.3 73.9 0.46 13.5
Bran & Shorts: Bran & Shorts: Shorts 11.6 3.30 16.7 84.4 0.88 13.5 Shorts 12.2 3.45 17.1 86.0 0.89 14.0 Bran 15.6 5.43 15.9 100.0 1.60 13.9 Bran 14.0 5.69 16.7 100.0 1.56 14.4
Straight Grade Wheat
0.49 12.8 Straight Grade Wheat
0.45 13.2 1.53 13.6 1.45 13.9
WB9479 (B-7) SD4579 (B-8)
Stream
(%, 14% mb) Cumulative (%, 14% mb)
Stream
(%, 14% mb) Cumulative (%, 14% mb)
Mill Stream Yield Ash Protein Yield Ash Protein
Mill Stream Yield Ash Protein Yield Ash Protein
Straight Grade: Straight Grade: 1 BK 9.6 0.35 15.0 9.6 0.35 15.0 1 BK 11.0 0.31 13.8 11.0 0.31 13.8 1 R 39.7 0.41 13.1 49.2 0.40 13.5 1 R 41.3 0.34 12.7 52.3 0.34 13.0
2 BK 8.7 0.43 18.5 57.9 0.40 14.2 2 BK 9.6 0.40 17.7 61.8 0.35 13.7 2 R 10.4 0.52 13.0 68.3 0.42 14.0 2 R 9.6 0.49 13.0 71.4 0.37 13.6
3 BK 1.9 1.00 22.7 70.3 0.43 14.3 3 BK 1.9 0.85 21.4 73.3 0.38 13.8 3 R 2.3 1.06 14.1 72.5 0.45 14.3 3 R 2.3 1.04 14.1 75.6 0.40 13.8
Bran & Shorts: Bran & Shorts: Shorts 12.3 3.31 17.2 84.9 0.87 14.7 Shorts 9.3 3.37 17.0 84.9 0.72 14.2 Bran 15.1 5.47 16.7 100.0 1.57 15.0 Bran 15.1 5.79 16.9 100.0 1.49 14.6
Straight Grade Wheat
0.45 14.1 Straight Grade Wheat
0.40 13.6 1.46 14.7 1.39 14.2
Glenn Check (B-9) WB9590 (B-10)
Stream
(%, 14% mb) Cumulative (%, 14% mb)
Stream
(%, 14% mb) Cumulative (%, 14% mb)
Mill Stream Yield Ash Protein Yield Ash Protein
Mill Stream Yield Ash Protein Yield Ash Protein
Straight Grade: Straight Grade: 1 R 37.3 0.39 13.0 37.3 0.39 13.0 1 BK 7.9 0.37 14.2 7.9 0.37 14.2
2 BK 7.5 0.41 17.3 44.7 0.39 13.7 1 R 36.9 0.39 13.4 44.8 0.38 13.5 1 BK 6.1 0.41 14.0 50.8 0.40 13.8 2 BK 8.4 0.41 17.4 53.2 0.39 14.1 2 R 14.2 0.47 12.6 65.0 0.41 13.5 2 R 11.7 0.48 13.1 64.9 0.40 14.0 3 R 3.3 0.71 12.7 68.3 0.43 13.5 3 R 2.9 0.88 13.6 67.9 0.42 13.9
3 BK 1.7 0.86 21.3 70.0 0.44 13.7 3 BK 1.9 0.88 21.6 69.8 0.44 14.1 Bran & Shorts: Bran & Shorts:
Shorts 15.0 2.71 15.3 85.1 0.84 13.9 Shorts 14.9 3.12 16.6 84.7 0.91 14.6 Bran 14.9 5.54 17.0 100.0 1.54 14.4 Bran 15.3 5.40 16.9 100.0 1.60 14.9
Straight Grade Wheat
0.46 13.5 Straight Grade Wheat
0.45 14.1 1.42 14.1 1.50 14.6
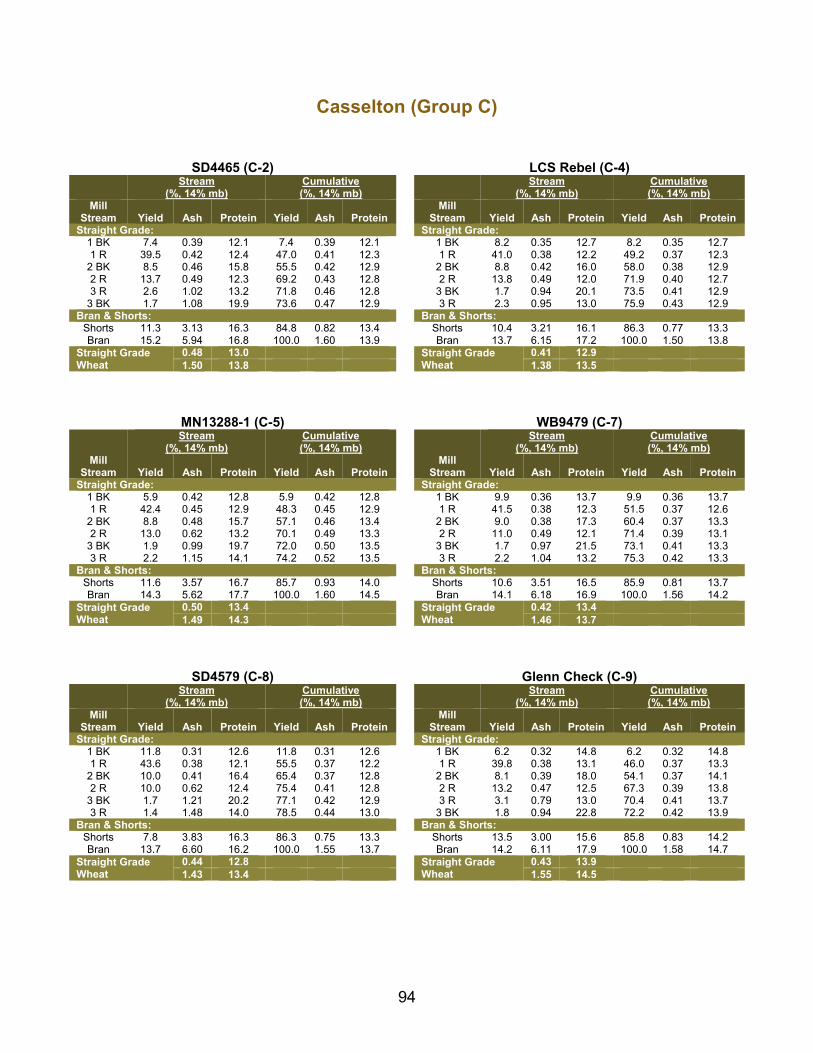
94
Casselton (Group C)
SD4465 (C-2) LCS Rebel (C-4)
Stream
(%, 14% mb) Cumulative (%, 14% mb)
Stream
(%, 14% mb) Cumulative (%, 14% mb)
Mill Stream Yield Ash Protein Yield Ash Protein
Mill Stream Yield Ash Protein Yield Ash Protein
Straight Grade: Straight Grade: 1 BK 7.4 0.39 12.1 7.4 0.39 12.1 1 BK 8.2 0.35 12.7 8.2 0.35 12.7 1 R 39.5 0.42 12.4 47.0 0.41 12.3 1 R 41.0 0.38 12.2 49.2 0.37 12.3
2 BK 8.5 0.46 15.8 55.5 0.42 12.9 2 BK 8.8 0.42 16.0 58.0 0.38 12.9 2 R 13.7 0.49 12.3 69.2 0.43 12.8 2 R 13.8 0.49 12.0 71.9 0.40 12.7 3 R 2.6 1.02 13.2 71.8 0.46 12.8 3 BK 1.7 0.94 20.1 73.5 0.41 12.9
3 BK 1.7 1.08 19.9 73.6 0.47 12.9 3 R 2.3 0.95 13.0 75.9 0.43 12.9 Bran & Shorts: Bran & Shorts:
Shorts 11.3 3.13 16.3 84.8 0.82 13.4 Shorts 10.4 3.21 16.1 86.3 0.77 13.3 Bran 15.2 5.94 16.8 100.0 1.60 13.9 Bran 13.7 6.15 17.2 100.0 1.50 13.8
Straight Grade Wheat
0.48 13.0 Straight Grade Wheat
0.41 12.9 1.50 13.8 1.38 13.5
MN13288-1 (C-5) WB9479 (C-7)
Stream
(%, 14% mb) Cumulative (%, 14% mb)
Stream
(%, 14% mb) Cumulative (%, 14% mb)
Mill Stream Yield Ash Protein Yield Ash Protein
Mill Stream Yield Ash Protein Yield Ash Protein
Straight Grade: Straight Grade: 1 BK 5.9 0.42 12.8 5.9 0.42 12.8 1 BK 9.9 0.36 13.7 9.9 0.36 13.7 1 R 42.4 0.45 12.9 48.3 0.45 12.9 1 R 41.5 0.38 12.3 51.5 0.37 12.6
2 BK 8.8 0.48 15.7 57.1 0.46 13.4 2 BK 9.0 0.38 17.3 60.4 0.37 13.3 2 R 13.0 0.62 13.2 70.1 0.49 13.3 2 R 11.0 0.49 12.1 71.4 0.39 13.1
3 BK 1.9 0.99 19.7 72.0 0.50 13.5 3 BK 1.7 0.97 21.5 73.1 0.41 13.3 3 R 2.2 1.15 14.1 74.2 0.52 13.5 3 R 2.2 1.04 13.2 75.3 0.42 13.3
Bran & Shorts: Bran & Shorts: Shorts 11.6 3.57 16.7 85.7 0.93 14.0 Shorts 10.6 3.51 16.5 85.9 0.81 13.7 Bran 14.3 5.62 17.7 100.0 1.60 14.5 Bran 14.1 6.18 16.9 100.0 1.56 14.2
Straight Grade Wheat
0.50 13.4 Straight Grade Wheat
0.42 13.4 1.49 14.3 1.46 13.7
SD4579 (C-8) Glenn Check (C-9)
Stream
(%, 14% mb) Cumulative (%, 14% mb)
Stream
(%, 14% mb) Cumulative (%, 14% mb)
Mill Stream Yield Ash Protein Yield Ash Protein
Mill Stream Yield Ash Protein Yield Ash Protein
Straight Grade: Straight Grade: 1 BK 11.8 0.31 12.6 11.8 0.31 12.6 1 BK 6.2 0.32 14.8 6.2 0.32 14.8 1 R 43.6 0.38 12.1 55.5 0.37 12.2 1 R 39.8 0.38 13.1 46.0 0.37 13.3
2 BK 10.0 0.41 16.4 65.4 0.37 12.8 2 BK 8.1 0.39 18.0 54.1 0.37 14.1 2 R 10.0 0.62 12.4 75.4 0.41 12.8 2 R 13.2 0.47 12.5 67.3 0.39 13.8
3 BK 1.7 1.21 20.2 77.1 0.42 12.9 3 R 3.1 0.79 13.0 70.4 0.41 13.7 3 R 1.4 1.48 14.0 78.5 0.44 13.0 3 BK 1.8 0.94 22.8 72.2 0.42 13.9
Bran & Shorts: Bran & Shorts: Shorts 7.8 3.83 16.3 86.3 0.75 13.3 Shorts 13.5 3.00 15.6 85.8 0.83 14.2 Bran 13.7 6.60 16.2 100.0 1.55 13.7 Bran 14.2 6.11 17.9 100.0 1.58 14.7
Straight Grade Wheat
0.44 12.8 Straight Grade Wheat
0.43 13.9 1.43 13.4 1.55 14.5
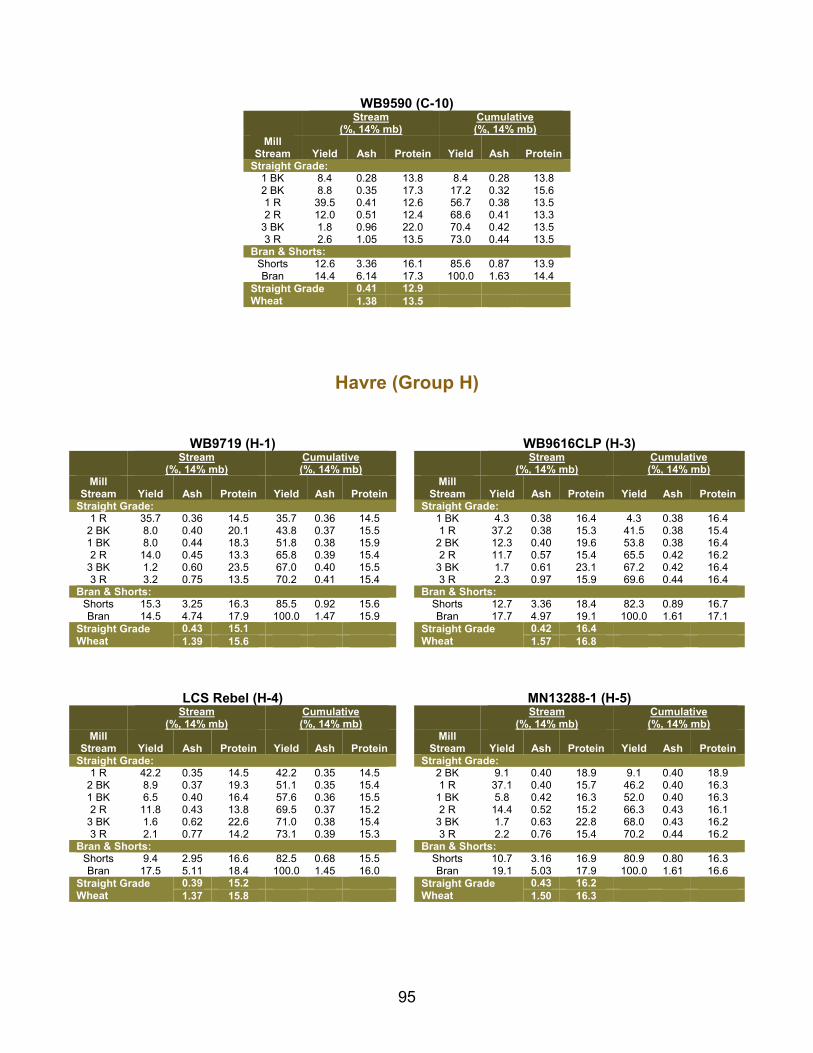
95
WB9590 (C-10)
Stream
(%, 14% mb) Cumulative (%, 14% mb)
Mill Stream Yield Ash Protein Yield Ash Protein
Straight Grade: 1 BK 8.4 0.28 13.8 8.4 0.28 13.8 2 BK 8.8 0.35 17.3 17.2 0.32 15.6 1 R 39.5 0.41 12.6 56.7 0.38 13.5 2 R 12.0 0.51 12.4 68.6 0.41 13.3
3 BK 1.8 0.96 22.0 70.4 0.42 13.5 3 R 2.6 1.05 13.5 73.0 0.44 13.5
Bran & Shorts: Shorts 12.6 3.36 16.1 85.6 0.87 13.9 Bran 14.4 6.14 17.3 100.0 1.63 14.4
Straight Grade Wheat
0.41 12.9 1.38 13.5
Havre (Group H)
WB9719 (H-1) WB9616CLP (H-3)
Stream
(%, 14% mb) Cumulative (%, 14% mb)
Stream
(%, 14% mb) Cumulative (%, 14% mb)
Mill Stream Yield Ash Protein Yield Ash Protein
Mill Stream Yield Ash Protein Yield Ash Protein
Straight Grade: Straight Grade: 1 R 35.7 0.36 14.5 35.7 0.36 14.5 1 BK 4.3 0.38 16.4 4.3 0.38 16.4
2 BK 8.0 0.40 20.1 43.8 0.37 15.5 1 R 37.2 0.38 15.3 41.5 0.38 15.4 1 BK 8.0 0.44 18.3 51.8 0.38 15.9 2 BK 12.3 0.40 19.6 53.8 0.38 16.4 2 R 14.0 0.45 13.3 65.8 0.39 15.4 2 R 11.7 0.57 15.4 65.5 0.42 16.2
3 BK 1.2 0.60 23.5 67.0 0.40 15.5 3 BK 1.7 0.61 23.1 67.2 0.42 16.4 3 R 3.2 0.75 13.5 70.2 0.41 15.4 3 R 2.3 0.97 15.9 69.6 0.44 16.4
Bran & Shorts: Bran & Shorts: Shorts 15.3 3.25 16.3 85.5 0.92 15.6 Shorts 12.7 3.36 18.4 82.3 0.89 16.7 Bran 14.5 4.74 17.9 100.0 1.47 15.9 Bran 17.7 4.97 19.1 100.0 1.61 17.1
Straight Grade Wheat
0.43 15.1 Straight Grade Wheat
0.42 16.4 1.39 15.6 1.57 16.8
LCS Rebel (H-4) MN13288-1 (H-5)
Stream
(%, 14% mb) Cumulative (%, 14% mb)
Stream
(%, 14% mb) Cumulative (%, 14% mb)
Mill Stream Yield Ash Protein Yield Ash Protein
Mill Stream Yield Ash Protein Yield Ash Protein
Straight Grade: Straight Grade: 1 R 42.2 0.35 14.5 42.2 0.35 14.5 2 BK 9.1 0.40 18.9 9.1 0.40 18.9
2 BK 8.9 0.37 19.3 51.1 0.35 15.4 1 R 37.1 0.40 15.7 46.2 0.40 16.3 1 BK 6.5 0.40 16.4 57.6 0.36 15.5 1 BK 5.8 0.42 16.3 52.0 0.40 16.3 2 R 11.8 0.43 13.8 69.5 0.37 15.2 2 R 14.4 0.52 15.2 66.3 0.43 16.1
3 BK 1.6 0.62 22.6 71.0 0.38 15.4 3 BK 1.7 0.63 22.8 68.0 0.43 16.2 3 R 2.1 0.77 14.2 73.1 0.39 15.3 3 R 2.2 0.76 15.4 70.2 0.44 16.2
Bran & Shorts: Bran & Shorts: Shorts 9.4 2.95 16.6 82.5 0.68 15.5 Shorts 10.7 3.16 16.9 80.9 0.80 16.3 Bran 17.5 5.11 18.4 100.0 1.45 16.0 Bran 19.1 5.03 17.9 100.0 1.61 16.6
Straight Grade Wheat
0.39 15.2 Straight Grade Wheat
0.43 16.2 1.37 15.8 1.50 16.3

96
SY Rockford (H-6) Glenn Check (H-9)
Stream
(%, 14% mb) Cumulative (%, 14% mb)
Stream
(%, 14% mb) Cumulative (%, 14% mb)
Mill Stream Yield Ash Protein Yield Ash Protein
Mill Stream Yield Ash Protein Yield Ash Protein
Straight Grade: Straight Grade: 1 R 35.6 0.36 13.7 35.6 0.36 13.7 1 R 37.5 0.38 14.8 37.5 0.38 14.8
2 BK 9.9 0.36 18.9 45.5 0.36 14.9 2 BK 8.4 0.45 19.3 45.9 0.39 15.6 1 BK 6.8 0.39 16.1 52.4 0.36 15.0 1 BK 6.5 0.46 16.6 52.4 0.40 15.7 2 R 13.5 0.46 13.1 65.9 0.38 14.6 2 R 14.5 0.47 13.9 66.9 0.42 15.3
3 BK 2.1 0.57 23.0 67.9 0.39 14.9 3 BK 1.5 0.69 23.4 68.5 0.42 15.5 3 R 2.4 0.76 13.8 70.3 0.40 14.8 3 R 2.6 0.75 14.0 71.0 0.43 15.5
Bran & Shorts: Bran & Shorts: Shorts 9.8 2.74 16.2 80.1 0.69 15.0 Shorts 10.7 2.91 16.0 81.7 0.76 15.5 Bran 19.9 4.77 17.8 100.0 1.50 15.6 Bran 18.3 5.13 17.4 100.0 1.56 15.9
Straight Grade Wheat
0.41 14.7 Straight Grade Wheat
0.45 15.5 1.38 15.3 1.47 15.8
WB9590 (H-10)
Stream
(%, 14% mb) Cumulative (%, 14% mb)
Mill Stream Yield Ash Protein Yield Ash Protein
Straight Grade: 1 BK 8.9 0.41 17.4 8.9 0.41 17.4 1 R 35.4 0.42 15.2 44.3 0.41 15.7
2 BK 9.6 0.43 20.8 53.9 0.42 16.6 2 R 11.8 0.51 14.6 65.8 0.43 16.2
3 BK 1.7 0.68 25.1 67.5 0.44 16.4 3 R 2.2 0.90 15.0 69.7 0.46 16.4
Bran & Shorts: Shorts 10.7 2.94 16.7 80.4 0.79 16.4 Bran 19.6 5.29 18.5 100.0 1.67 16.8
Straight Grade Wheat
0.44 16.3 1.61 16.6
Crookston (Group K)
SD4465 (K-2) LCS Rebel (K-4)
Stream
(%, 14% mb) Cumulative (%, 14% mb)
Stream
(%, 14% mb) Cumulative (%, 14% mb)
Mill Stream Yield Ash Protein Yield Ash Protein
Mill Stream Yield Ash Protein Yield Ash Protein
Straight Grade: Straight Grade: 1 R 41.5 0.36 11.3 41.5 0.36 11.3 1 R 41.7 0.33 10.7 41.7 0.33 10.7 2 R 15.6 0.41 11.0 57.1 0.37 11.2 1 BK 9.1 0.38 12.7 50.8 0.34 11.1
1 BK 6.8 0.42 11.4 63.9 0.38 11.2 2 R 16.5 0.38 10.6 67.3 0.35 11.0 2 BK 5.7 0.44 13.4 69.5 0.38 11.4 2 BK 4.9 0.38 14.4 72.2 0.35 11.2 3 BK 1.0 0.70 15.7 70.5 0.39 11.4 3 BK 0.9 0.56 16.3 73.0 0.35 11.3 3 R 2.6 0.76 11.3 73.1 0.40 11.4 3 R 3.3 0.64 10.9 76.4 0.37 11.2
Bran & Shorts: Bran & Shorts: Shorts 8.7 2.58 14.4 81.8 0.63 11.8 Shorts 9.3 3.11 14.2 85.7 0.67 11.6 Bran 18.2 5.00 14.7 100.0 1.43 12.3 Bran 14.3 5.14 15.1 100.0 1.31 12.1
Straight Grade Wheat
0.42 11.5 Straight Grade Wheat
0.39 11.3 1.41 12.3 1.27 12.1

97
MN13288-1 (K-5) WB9479 (K-7)
Stream
(%, 14% mb) Cumulative (%, 14% mb)
Stream
(%, 14% mb) Cumulative (%, 14% mb)
Mill Stream Yield Ash Protein Yield Ash Protein
Mill Stream Yield Ash Protein Yield Ash Protein
Straight Grade: Straight Grade: 1 BK 6.2 0.39 11.1 6.2 0.39 11.1 1 R 40.5 0.36 10.8 40.5 0.36 10.8 2 BK 5.6 0.42 12.5 11.8 0.41 11.7 1 BK 9.6 0.37 13.0 50.1 0.36 11.3 1 R 41.2 0.42 10.8 53.0 0.42 11.0 2 R 15.7 0.40 10.5 65.8 0.37 11.1 2 R 17.0 0.52 11.2 70.0 0.44 11.0 2 BK 5.4 0.40 15.0 71.2 0.37 11.4
3 BK 1.1 0.68 14.8 71.1 0.45 11.1 3 BK 1.0 0.66 17.4 72.2 0.38 11.5 3 R 3.3 0.94 11.6 74.5 0.47 11.1 3 R 3.5 0.78 11.0 75.7 0.40 11.4
Bran & Shorts: Bran & Shorts: Shorts 9.1 3.26 14.0 83.6 0.77 11.4 Shorts 8.6 3.29 14.5 84.3 0.69 11.8 Bran 16.4 5.09 14.5 100.0 1.48 11.9 Bran 15.7 5.41 14.5 100.0 1.43 12.2
Straight Grade Wheat
0.46 11.1 Straight Grade Wheat
0.40 11.5 1.42 11.7 1.39 12.0
SD4579 (K-8) Glenn Check (K-9)
Stream
(%, 14% mb) Cumulative (%, 14% mb)
Stream
(%, 14% mb) Cumulative (%, 14% mb)
Mill Stream Yield Ash Protein Yield Ash Protein
Mill Stream Yield Ash Protein Yield Ash Protein
Straight Grade: Straight Grade: 1 BK 11.1 0.37 11.0 11.1 0.37 11.0 1 R 35.1 0.35 12.0 35.1 0.35 12.0 1 R 46.6 0.38 10.1 57.6 0.38 10.3 2 R 19.5 0.40 11.3 54.7 0.37 11.8
2 BK 5.5 0.40 12.6 63.1 0.38 10.5 1 BK 6.9 0.40 14.1 61.5 0.37 12.0 2 R 11.4 0.58 10.6 74.5 0.41 10.5 2 BK 4.8 0.40 15.8 66.3 0.37 12.3
3 BK 1.2 0.65 14.7 75.7 0.42 10.6 3 R 4.5 0.62 11.0 70.7 0.39 12.2 3 R 2.0 1.07 10.9 77.7 0.43 10.6 3 BK 1.2 0.64 17.8 71.9 0.39 12.3
Bran & Shorts: Bran & Shorts: Shorts 10.0 4.22 13.7 87.7 0.86 11.0 Shorts 11.4 2.31 13.6 83.4 0.66 12.5 Bran 12.3 5.87 14.2 100.0 1.48 11.4 Bran 16.6 5.22 16.3 100.0 1.42 13.1
Straight Grade Wheat
0.44 10.7 Straight Grade Wheat
0.43 12.2 1.44 11.2 1.36 12.8
WB9590 (K-10)
Stream
(%, 14% mb) Cumulative (%, 14% mb)
Mill Stream Yield Ash Protein Yield Ash Protein
Straight Grade: 1 BK 10.0 0.35 13.4 10.0 0.35 13.4 2 BK 3.9 0.36 15.0 13.9 0.35 13.8 1 R 37.7 0.37 11.6 51.6 0.37 12.2 2 R 17.7 0.40 10.9 69.4 0.37 11.9
3 BK 1.0 0.59 17.1 70.3 0.38 11.9 3 R 3.7 0.61 11.1 74.1 0.39 11.9
Bran & Shorts: Shorts 13.8 3.07 14.3 87.8 0.81 12.3 Bran 12.2 4.67 15.6 100.0 1.28 12.7
Straight Grade Wheat
0.38 11.8 1.21 12.2

98
Minot (Group M)
WB9719 (M-1) LCS Rebel (M-4)
Stream
(%, 14% mb) Cumulative (%, 14% mb)
Stream
(%, 14% mb) Cumulative (%, 14% mb)
Mill Stream Yield Ash Protein Yield Ash Protein
Mill Stream Yield Ash Protein Yield Ash Protein
Straight Grade: Straight Grade: 1 BK 7.5 0.34 16.2 7.5 0.34 16.2 1 R 40.0 0.34 13.4 40.0 0.34 13.4 1 R 32.6 0.36 13.7 40.0 0.36 14.2 1 BK 7.6 0.35 14.5 47.6 0.35 13.6
2 BK 8.5 0.37 19.4 48.5 0.36 15.1 2 BK 8.0 0.37 17.8 55.6 0.35 14.2 2 R 14.4 0.42 13.1 62.9 0.37 14.6 2 R 14.3 0.43 13.0 69.9 0.37 13.9 3 R 3.0 0.69 13.8 66.0 0.39 14.6 3 BK 1.5 0.71 21.6 71.4 0.37 14.1
3 BK 2.0 0.69 23.6 68.0 0.40 14.9 3 R 2.7 0.77 13.7 74.1 0.39 14.1 Bran & Shorts: Bran & Shorts:
Shorts 12.8 2.45 16.2 80.8 0.72 15.1 Shorts 9.7 3.03 16.9 83.9 0.70 14.4 Bran 19.2 4.86 18.6 100.0 1.51 15.8 Bran 16.1 5.44 18.4 100.0 1.46 15.1
Straight Grade Wheat
0.38 15.0 Straight Grade Wheat
0.40 14.0 1.42 15.4 1.34 14.6
SY Rockford (M-6) WB9479 (M-7)
Stream
(%, 14% mb) Cumulative (%, 14% mb)
Stream
(%, 14% mb) Cumulative (%, 14% mb)
Mill Stream Yield Ash Protein Yield Ash Protein
Mill Stream Yield Ash Protein Yield Ash Protein
Straight Grade: Straight Grade: 1 BK 8.7 0.35 14.1 8.7 0.35 14.1 1 BK 11.1 0.35 16.1 11.1 0.35 16.1 1 R 39.8 0.37 12.5 48.5 0.36 12.8 1 R 37.1 0.37 13.6 48.3 0.36 14.2
2 BK 9.3 0.39 17.9 57.8 0.37 13.6 2 BK 9.2 0.38 20.0 57.5 0.37 15.1 2 R 11.6 0.46 12.3 69.4 0.38 13.4 2 R 12.8 0.48 13.2 70.3 0.39 14.8
3 BK 1.9 0.72 21.5 71.3 0.39 13.6 3 BK 1.7 0.93 24.2 72.0 0.40 15.0 3 R 2.2 0.82 13.2 73.5 0.40 13.6 3 R 2.2 0.99 14.2 74.2 0.42 15.0
Bran & Shorts: Bran & Shorts: Shorts 8.1 3.03 16.7 81.6 0.67 13.9 Shorts 11.4 3.49 17.0 85.6 0.83 15.2 Bran 18.4 5.25 17.2 100.0 1.51 14.5 Bran 14.4 5.78 17.5 100.0 1.54 15.6
Straight Grade Wheat
0.40 13.5 Straight Grade Wheat
0.42 15.0 1.45 14.5 1.40 15.8
Glenn Check (M-9) WB9590 (M-10)
Stream
(%, 14% mb) Cumulative (%, 14% mb)
Stream
(%, 14% mb) Cumulative (%, 14% mb)
Mill Stream Yield Ash Protein Yield Ash Protein
Mill Stream Yield Ash Protein Yield Ash Protein
Straight Grade: Straight Grade: 1 R 36.0 0.40 14.5 36.0 0.40 14.5 1 BK 9.3 0.38 16.1 9.3 0.38 16.1
1 BK 6.0 0.43 16.2 42.1 0.41 14.8 1 R 37.7 0.39 14.2 46.9 0.38 14.5 2 R 16.6 0.47 13.7 58.7 0.42 14.5 2 BK 8.8 0.41 19.6 55.7 0.39 15.3
2 BK 8.0 0.47 19.2 66.7 0.43 15.0 2 R 13.6 0.52 13.8 69.3 0.42 15.0 3 R 2.8 0.80 14.2 69.4 0.45 15.0 3 BK 1.9 0.88 23.8 71.2 0.43 15.3
3 BK 1.7 0.92 23.7 71.2 0.46 15.2 3 R 2.2 0.97 14.7 73.4 0.44 15.3 Bran & Shorts: Bran & Shorts:
Shorts 14.3 2.75 15.9 85.5 0.84 15.3 Shorts 11.9 3.41 17.1 85.4 0.86 15.5 Bran 14.5 5.44 17.6 100.0 1.51 15.7 Bran 14.6 5.58 17.4 100.0 1.55 15.8
Straight Grade Wheat
0.47 15.2 Straight Grade Wheat
0.46 15.5 1.48 15.9 1.38 15.7
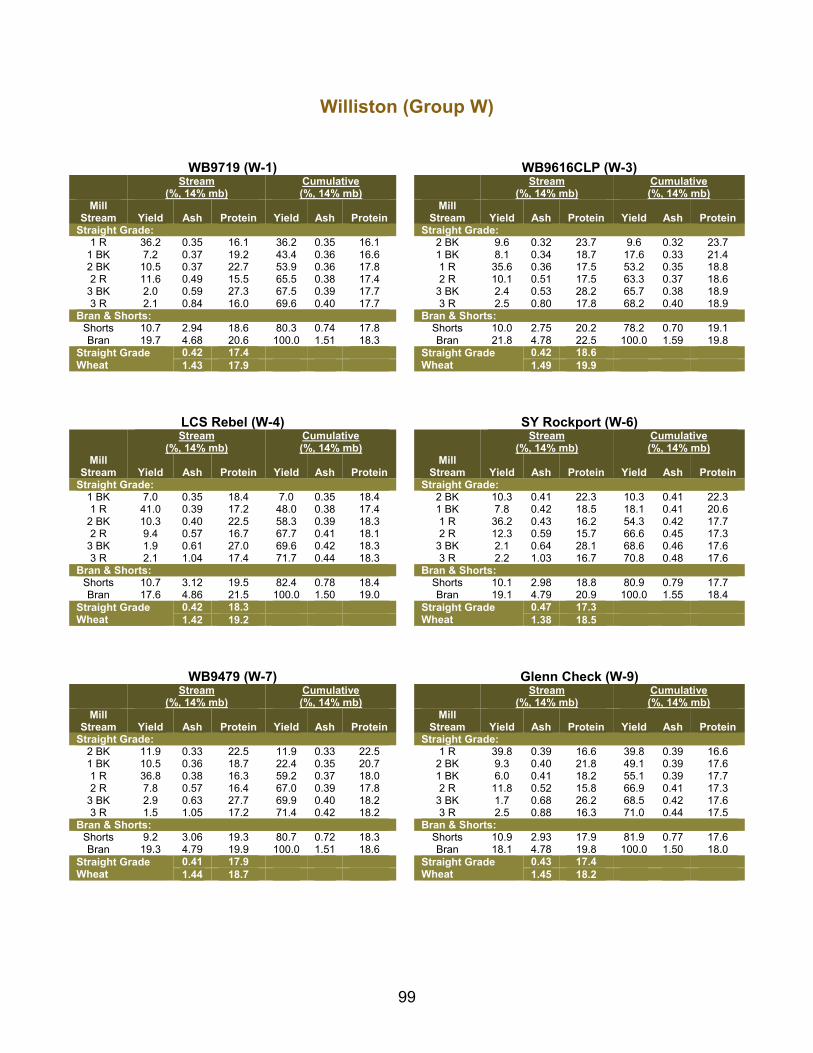
99
Williston (Group W)
WB9719 (W-1) WB9616CLP (W-3)
Stream
(%, 14% mb) Cumulative (%, 14% mb)
Stream
(%, 14% mb) Cumulative (%, 14% mb)
Mill Stream Yield Ash Protein Yield Ash Protein
Mill Stream Yield Ash Protein Yield Ash Protein
Straight Grade: Straight Grade: 1 R 36.2 0.35 16.1 36.2 0.35 16.1 2 BK 9.6 0.32 23.7 9.6 0.32 23.7
1 BK 7.2 0.37 19.2 43.4 0.36 16.6 1 BK 8.1 0.34 18.7 17.6 0.33 21.4 2 BK 10.5 0.37 22.7 53.9 0.36 17.8 1 R 35.6 0.36 17.5 53.2 0.35 18.8 2 R 11.6 0.49 15.5 65.5 0.38 17.4 2 R 10.1 0.51 17.5 63.3 0.37 18.6
3 BK 2.0 0.59 27.3 67.5 0.39 17.7 3 BK 2.4 0.53 28.2 65.7 0.38 18.9 3 R 2.1 0.84 16.0 69.6 0.40 17.7 3 R 2.5 0.80 17.8 68.2 0.40 18.9
Bran & Shorts: Bran & Shorts: Shorts 10.7 2.94 18.6 80.3 0.74 17.8 Shorts 10.0 2.75 20.2 78.2 0.70 19.1 Bran 19.7 4.68 20.6 100.0 1.51 18.3 Bran 21.8 4.78 22.5 100.0 1.59 19.8
Straight Grade Wheat
0.42 17.4 Straight Grade Wheat
0.42 18.6 1.43 17.9 1.49 19.9
LCS Rebel (W-4) SY Rockport (W-6)
Stream
(%, 14% mb) Cumulative (%, 14% mb)
Stream
(%, 14% mb) Cumulative (%, 14% mb)
Mill Stream Yield Ash Protein Yield Ash Protein
Mill Stream Yield Ash Protein Yield Ash Protein
Straight Grade: Straight Grade: 1 BK 7.0 0.35 18.4 7.0 0.35 18.4 2 BK 10.3 0.41 22.3 10.3 0.41 22.3 1 R 41.0 0.39 17.2 48.0 0.38 17.4 1 BK 7.8 0.42 18.5 18.1 0.41 20.6
2 BK 10.3 0.40 22.5 58.3 0.39 18.3 1 R 36.2 0.43 16.2 54.3 0.42 17.7 2 R 9.4 0.57 16.7 67.7 0.41 18.1 2 R 12.3 0.59 15.7 66.6 0.45 17.3
3 BK 1.9 0.61 27.0 69.6 0.42 18.3 3 BK 2.1 0.64 28.1 68.6 0.46 17.6 3 R 2.1 1.04 17.4 71.7 0.44 18.3 3 R 2.2 1.03 16.7 70.8 0.48 17.6
Bran & Shorts: Bran & Shorts: Shorts 10.7 3.12 19.5 82.4 0.78 18.4 Shorts 10.1 2.98 18.8 80.9 0.79 17.7 Bran 17.6 4.86 21.5 100.0 1.50 19.0 Bran 19.1 4.79 20.9 100.0 1.55 18.4
Straight Grade Wheat
0.42 18.3 Straight Grade Wheat
0.47 17.3 1.42 19.2 1.38 18.5
WB9479 (W-7) Glenn Check (W-9)
Stream
(%, 14% mb) Cumulative (%, 14% mb)
Stream
(%, 14% mb) Cumulative (%, 14% mb)
Mill Stream Yield Ash Protein Yield Ash Protein
Mill Stream Yield Ash Protein Yield Ash Protein
Straight Grade: Straight Grade: 2 BK 11.9 0.33 22.5 11.9 0.33 22.5 1 R 39.8 0.39 16.6 39.8 0.39 16.6 1 BK 10.5 0.36 18.7 22.4 0.35 20.7 2 BK 9.3 0.40 21.8 49.1 0.39 17.6 1 R 36.8 0.38 16.3 59.2 0.37 18.0 1 BK 6.0 0.41 18.2 55.1 0.39 17.7 2 R 7.8 0.57 16.4 67.0 0.39 17.8 2 R 11.8 0.52 15.8 66.9 0.41 17.3
3 BK 2.9 0.63 27.7 69.9 0.40 18.2 3 BK 1.7 0.68 26.2 68.5 0.42 17.6 3 R 1.5 1.05 17.2 71.4 0.42 18.2 3 R 2.5 0.88 16.3 71.0 0.44 17.5
Bran & Shorts: Bran & Shorts: Shorts 9.2 3.06 19.3 80.7 0.72 18.3 Shorts 10.9 2.93 17.9 81.9 0.77 17.6 Bran 19.3 4.79 19.9 100.0 1.51 18.6 Bran 18.1 4.78 19.8 100.0 1.50 18.0
Straight Grade Wheat
0.41 17.9 Straight Grade Wheat
0.43 17.4 1.44 18.7 1.45 18.2

100
WB9590 (W-10)
Stream
(%, 14% mb) Cumulative (%, 14% mb)
Mill Stream Yield Ash Protein Yield Ash Protein
Straight Grade: 1 BK 8.8 0.39 18.8 8.8 0.39 18.8 2 BK 10.8 0.40 22.6 19.6 0.40 20.9 1 R 36.8 0.41 16.9 56.4 0.40 18.3 2 R 10.4 0.54 16.5 66.8 0.42 18.0
3 BK 2.0 0.68 27.8 68.8 0.43 18.3 3 R 1.9 1.02 17.3 70.7 0.45 18.3
Bran & Shorts: Shorts 10.1 3.08 19.1 80.8 0.78 18.4 Bran 19.2 4.74 20.2 100.0 1.54 18.7
Straight Grade Wheat
0.42 18.1 1.41 18.3

101
Cooperators’ Bake Data
Glenn Checks
WATERTOWN (B-9)
Cooperator Bake
Absorption (%)
Loaf Volume
(cc) Mixing
Requirement Dough
Characteristics A 68.0 1170 7 9 B 68.7 933 8 8 C 65.9 1055 5 6 D 59.0 2925 9 9 E 66.5 2125 5 5 F 68.0 1055 7 5 G 62.0 2750 5 5 H 70.2 945 7 7 I 63.0 2956 9 8 J 68.8 892 7 7 K 65.7 2775 9 7 L 64.9 1035 6 8 M 64.3 2948 5 8
Avg. 65.8 6.8 7.1 S.D. 3.1 1.6 1.4
CASSSELTON (C-9)
Cooperator Bake
Absorption (%)
Loaf Volume
(cc) Mixing
Requirement Dough
Characteristics A 70.0 1070 5 7 B 71.4 920 6 7 C 67.7 1038 4 6 D 60.0 2800 4 4 E 69.0 2350 5 5 F 68.0 940 5 5 G 64.0 2700 5 5 H 71.9 970 7 3 I 64.0 2839 9 8 J 71.1 901 4 6 K 67.9 3000 7 7 L 67.6 1040 6 6 M 66.8 2835 5 7
Avg. 67.6 5.5 5.8 S.D. 3.4 1.5 1.4

102
HAVRE (H-9)
Cooperator Bake
Absorption (%)
Loaf Volume
(cc) Mixing
Requirement Dough
Characteristics A 71.0 1025 5 7 B 73.0 1040 6 8 C 65.3 986 4 6 D 61.0 2925 9 9 E 66.5 2525 7 5 F 71.0 1120 5 5 G 62.0 2950 5 5 H 70.5 1080 7 7 I 63.0 2927 9 9 J 69.2 908 3 5 K 66.3 2775 9 9 L 69.0 1100 5 6 M 64.5 3093 5 5
Avg. 67.1 6.1 6.6 S.D. 3.8 2.0 1.7
CROOKSTON (K-9)
Cooperator Bake
Absorption (%)
Loaf Volume
(cc) Mixing
Requirement Dough
Characteristics A 67.0 1040 5 9 B 70.4 908 7 8 C 66.7 1008 5 6 D 58.0 2925 9 9 E 66.5 2075 5 4 F 66.0 910 7 5 G 63.0 2600 5 5 H 68.9 825 7 7 I 63.0 2956 9 8 J 68.5 823 7 6 K 65.7 2600 9 9 L 65.4 1030 6 6 M 64.6 2990 5 6
Avg. 65.7 6.6 6.8 S.D. 3.1 1.6 1.7
MINOT (M-9)
Cooperator Bake
Absorption (%)
Loaf Volume
(cc) Mixing
Requirement Dough
Characteristics A 72.0 1240 7 7 B 63.0 1063 6 9 C 67.3 1069 4 6 D 61.0 3000 9 9 E 68.5 1975 6 5 F 71.0 1115 5 5 G 65.0 2450 5 5 H 72.2 1070 7 9 I 63.0 2956 9 9 J 69.8 1020 3 8 K 67.0 2875 9 7 L 71.4 1140 6 6 M 66.3 2916 5 6
Avg. 67.5 6.2 7.0 S.D. 3.7 1.9 1.6

103
WILLISTON (W-9)
Cooperator Bake
Absorption (%)
Loaf Volume
(cc) Mixing
Requirement Dough
Characteristics A 74.0 1210 7 7 B 74.5 1125 9 8 C 67.1 1040 5 6 D 64.0 2825 9 9 E 68.0 2450 8 8 F 75.0 1215 9 5 G 65.0 3050 5 5 H 73.6 1190 9 9 I 64.0 2809 9 9 J 71.0 1002 7 7 K 68.2 2900 9 9 L 69.9 1260 6 8 M 66.1 3078 5 6
Avg. 69.3 7.5 7.4 S.D. 4.0 1.7 1.5

104
WB9719
HAVRE (H-1)
Loaf Volume Quality Score Compared to Check (Glenn)
Cooperator
Bake Absorption
(%) (cc) (% of Check) Mixing
Requirement Dough
Characteristics Mixing
Tolerance
Internal Crumb Color
Internal Grain & Texture Protein Milling Baking Overall
A 70.0 890 86.8 1 5 3 3 5 5 5 3 3 B 69.5 970 93.3 4 8 4 5 4 4 5 4 4 C 67.9 833 84.5 3 6 6 3 4 5 5 3 4 D 61.0 2925 100.0 9 9 5 5 5 5 5 5 5 E 69.0 2425 96.0 7 5 5 7 5 6 5 7 7 F 71.0 945 84.4 5 3 3 5 5 5 5 3 3 G 65.0 2800 94.9 3 3 3 5 5 4 5 5 5 H 70.3 990 91.7 7 5 3 5 7 5 5 7 5 I 64.0 2986 102.0 9 9 6 5 5 4 5 6 6 J 71.2 844 93.0 1 6 3 5 5 5 6 3 5 K 68.1 2825 101.8 9 9 5 3 5 5 7 5 5 L 71.5 1070 97.3 4 5 3 5 5 5 5 4 4 M 67.0 3118 100.8 5 5 5 5 7 5 5 6 5
Avg. 68.1 94.3 5.2 6.0 4.2 4.7 5.2 4.8 5.2 4.7 4.7 S.D. 3.1 6.2 2.9 2.1 1.2 1.1 0.9 0.6 0.6 1.5 1.1
MINOT (M-1) Loaf Volume Quality Score Compared to Check (Glenn)
Cooperator
Bake Absorption
(%) (cc) (% of Check) Mixing
Requirement Dough
Characteristics Mixing
Tolerance
Internal Crumb Color
Internal Grain & Texture Protein Milling Baking Overall
A 70.0 1165 94.0 3 7 1 5 5 5 3 5 3 B 72.9 1035 97.4 4 7 4 5 5 4 5 5 5 C 68.2 1020 95.4 3 6 3 5 3 4 5 4 4 D 61.0 2825 94.2 9 9 5 5 5 5 5 5 5 E 69.5 2350 119.0 6 5 5 6 6 5 5 8 7 F 70.0 1045 93.7 3 3 1 5 5 3 3 3 1 G 65.0 2500 102.0 2 3 3 6 6 5 3 6 5 H 69.0 985 92.1 5 5 3 5 7 5 3 7 5 I 64.0 2809 95.0 9 8 5 4 4 5 3 4 4 J 71.8 919 90.1 3 3 4 5 5 5 5 2 4 K 68.5 2875 100.0 7 5 5 5 3 5 3 5 5 L 71.8 1050 92.1 4 6 2 5 5 4 4 4 4 M 67.3 2828 97.0 5 5 5 5 5 5 5 5 5
Avg. 68.4 97.1 4.8 5.5 3.5 5.1 4.9 4.6 4.0 4.8 4.4 S.D. 3.4 7.4 2.3 1.9 1.5 0.5 1.1 0.7 1.0 1.6 1.4

105
WILLISTON (W-1) Loaf Volume Quality Score Compared to Check (Glenn)
Cooperator
Bake Absorption
(%) (cc) (% of Check) Mixing
Requirement Dough
Characteristics Mixing
Tolerance
Internal Crumb Color
Internal Grain & Texture Protein Milling Baking Overall
A 74.0 1130 93.4 7 7 3 5 7 5 3 5 5 B 74.9 1098 97.6 9 9 5 5 6 5 5 6 5 C 68.5 943 90.7 5 6 5 5 5 5 4 5 5 D 63.0 2725 96.5 9 9 5 5 5 5 5 5 5 E 69.5 2350 95.9 8 8 5 5 7 5 5 6 6 F 75.0 1060 87.2 9 3 1 5 5 5 3 3 3 G 66.0 2500 82.0 5 5 5 4 4 5 4 4 4 H 72.5 1120 94.1 9 9 7 5 5 5 5 5 5 I 64.0 2927 104.2 9 9 5 5 5 5 3 6 4 J 72.8 952 95.0 8 5 5 5 5 5 6 4 5 K 69.9 2725 94.0 9 9 5 5 5 5 5 3 3 L 72.3 1185 94.0 6 7 4 5 5 5 4 5 5 M 67.7 3191 103.7 5 4 5 6 4 5 4 6 5
Avg. 70.0 94.5 7.5 6.9 4.6 5.0 5.2 5.0 4.3 4.8 4.6 S.D. 4.0 5.9 1.7 2.1 1.4 0.4 0.9 0.0 0.9 1.1 0.9

106
SD4465
WATERTOWN (B-2)
Loaf Volume Quality Score Compared to Check (Glenn)
Cooperator
Bake Absorption
(%) (cc) (% of Check) Mixing
Requirement Dough
Characteristics Mixing
Tolerance
Internal Crumb Color
Internal Grain & Texture Protein Milling Baking Overall
A 67.0 1030 88.0 5 9 3 5 9 3 7 7 7 B 70.2 965 103.4 7 8 5 5 6 5 6 5 5 C 65.0 878 83.2 5 6 4 7 7 4 4 4 5 D 59.0 2900 99.1 9 9 5 5 5 5 5 5 5 E 65.5 2000 94.1 5 4 5 6 6 6 4 4 4 F 67.0 910 86.3 5 7 7 5 3 3 7 3 3 G 61.0 2600 94.5 4 4 4 5 5 4 7 5 5 H 67.6 930 98.4 7 7 7 5 7 5 7 7 7 I 62.0 2986 101.0 9 9 6 5 5 3 7 5 6 J 67.2 896 100.4 8 6 4 5 5 4 5 5 5 K 64.1 2925 105.4 7 5 3 5 5 3 7 5 5 L 64.3 1030 99.5 5 6 4 5 5 4 7 5 4 M 63.3 2794 94.8 7 7 8 4 5 4 7 7 6
Avg. 64.9 96.0 6.4 6.7 5.0 5.2 5.6 4.1 6.2 5.2 5.2 S.D. 3.1 6.7 1.7 1.8 1.6 0.7 1.4 1.0 1.2 1.2 1.1
CASSELTON (C-2) Loaf Volume Quality Score Compared to Check (Glenn)
Cooperator
Bake Absorption
(%) (cc) (% of Check) Mixing
Requirement Dough
Characteristics Mixing
Tolerance
Internal Crumb Color
Internal Grain & Texture Protein Milling Baking Overall
A 66.5 915 85.5 3 5 3 5 5 3 5 5 5 B 68.0 985 107.1 4 7 4 5 5 4 5 5 5 C 65.4 860 82.9 3 5 4 5 6 4 4 5 4 D 59.0 3000 107.1 4 4 5 5 5 5 5 5 5 E 66.5 2350 100.0 5 4 4 7 6 7 4 4 4 F 67.0 920 97.9 5 5 3 3 5 3 7 5 5 G 62.0 2600 96.3 4 4 4 4 4 3 5 4 4 H 67.6 915 94.3 5 5 3 5 9 3 7 9 7 I 62.0 2897 102.0 9 7 5 5 4 3 4 4 4 J 68.3 849 94.2 3 5 4 6 6 4 2 4 3 K 65.1 2900 96.7 7 5 3 5 3 1 7 5 7 L 65.6 965 92.8 4 4 3 3 5 3 5 3 2 M 64.5 2780 98.1 5 6 4 5 5 4 5 5 4
Avg. 65.2 96.5 4.7 5.1 3.8 4.8 5.2 3.6 5.0 4.8 4.5 S.D. 2.7 7.1 1.7 1.0 0.7 1.1 1.4 1.4 1.4 1.4 1.4

107
CROOKSTON (K-2) Loaf Volume Quality Score Compared to Check (Glenn)
Cooperator
Bake Absorption
(%) (cc) (% of Check) Mixing
Requirement Dough
Characteristics Mixing
Tolerance
Internal Crumb Color
Internal Grain & Texture Protein Milling Baking Overall
A 63.5 970 93.3 5 3 5 3 5 3 5 5 5 B 67.0 880 96.9 4 7 5 5 6 5 6 5 5 C 63.9 840 83.3 4 6 3 5 6 4 4 4 4 D 57.0 2825 96.6 5 5 3 5 6 5 5 4 4 E 64.0 2300 110.8 5 3 5 5 6 5 4 4 4 F 64.0 845 92.9 3 7 3 5 3 3 5 5 3 G 60.0 2450 94.2 2 2 2 3 3 4 6 3 3 H 66.9 870 105.5 5 5 3 5 7 3 7 9 7 I 61.0 2897 98.0 8 5 3 5 5 4 6 4 5 J 66.7 816 99.1 3 5 4 5 7 4 1 4 3 K 63.6 2750 105.8 7 7 5 5 7 3 7 7 7 L 62.6 935 90.8 4 4 3 3 5 4 5 3 3 M 62.2 2786 93.2 5 6 5 6 4 4 7 4 4
Avg. 63.3 97.0 4.6 5.0 3.8 4.6 5.4 3.9 5.2 4.7 4.4 S.D. 2.8 7.2 1.6 1.6 1.1 1.0 1.4 0.8 1.6 1.7 1.4

108
WB9616CLP
HAVRE (H-3)
Loaf Volume Quality Score Compared to Check (Glenn)
Cooperator
Bake Absorption
(%) (cc) (% of Check) Mixing
Requirement Dough
Characteristics Mixing
Tolerance
Internal Crumb Color
Internal Grain & Texture Protein Milling Baking Overall
A 70.0 970 94.6 5 7 9 5 3 7 3 5 5 B 71.8 1135 109.1 6 9 5 6 3 5 5 5 5 C 64.6 888 90.1 4 6 5 5 3 7 5 4 5 D 62.0 3000 102.6 9 9 5 5 5 6 5 5 5 E 66.0 2925 115.8 8 7 7 5 5 3 3 3 3 F 73.0 1035 92.4 9 3 1 5 7 7 5 5 5 G 62.0 2700 91.5 9 6 7 5 5 7 4 5 5 H 71.0 1120 103.7 7 9 5 5 5 7 3 5 5 I 62.0 3045 104.0 9 9 5 5 5 7 5 6 5 J 68.1 958 105.5 5 6 5 5 3 6 1 6 4 K 65.1 2900 104.5 9 9 5 5 5 9 5 5 3 L 68.8 1190 108.2 4 6 7 6 6 7 4 7 7 M 63.9 3467 112.1 9 7 9 6 5 7 4 7 6
Avg. 66.8 102.6 7.2 7.2 5.8 5.2 4.6 6.5 4.0 5.2 4.8 S.D. 3.9 8.2 2.1 1.8 2.1 0.4 1.3 1.4 1.2 1.1 1.1
WILLISTON (W-3) Loaf Volume Quality Score Compared to Check (Glenn)
Cooperator
Bake Absorption
(%) (cc) (% of Check) Mixing
Requirement Dough
Characteristics Mixing
Tolerance
Internal Crumb Color
Internal Grain & Texture Protein Milling Baking Overall
A 75.5 950 78.5 7 7 1 5 1 7 1 1 1 B 78.7 1173 104.3 9 9 5 6 6 5 4 6 5 C 66.6 863 83.0 4 6 4 5 2 3 5 3 3 D 65.0 2725 96.5 9 9 5 5 5 5 5 5 5 E 68.0 2500 102.0 9 9 6 7 7 3 4 4 3 F 77.0 970 79.8 9 5 5 5 5 7 3 1 3 G 65.0 2500 82.0 5 5 5 3 3 5 4 3 4 H 73.5 1165 97.9 7 9 5 5 7 7 3 5 5 I 63.0 2809 100.0 9 9 5 5 5 8 2 5 3 J 70.3 1035 103.3 6 5 5 6 5 6 6 5 6 K 67.3 2575 88.8 9 7 5 7 7 9 3 3 3 L 71.7 1260 100.0 5 6 4 8 6 7 3 6 6 M 66.1 3078 100.0 5 5 5 6 5 6 4 5 6
Avg. 69.8 93.5 7.2 7.0 4.6 5.6 4.9 6.0 3.6 4.0 4.1 S.D. 5.1 9.6 2.0 1.8 1.2 1.3 1.9 1.8 1.3 1.7 1.6
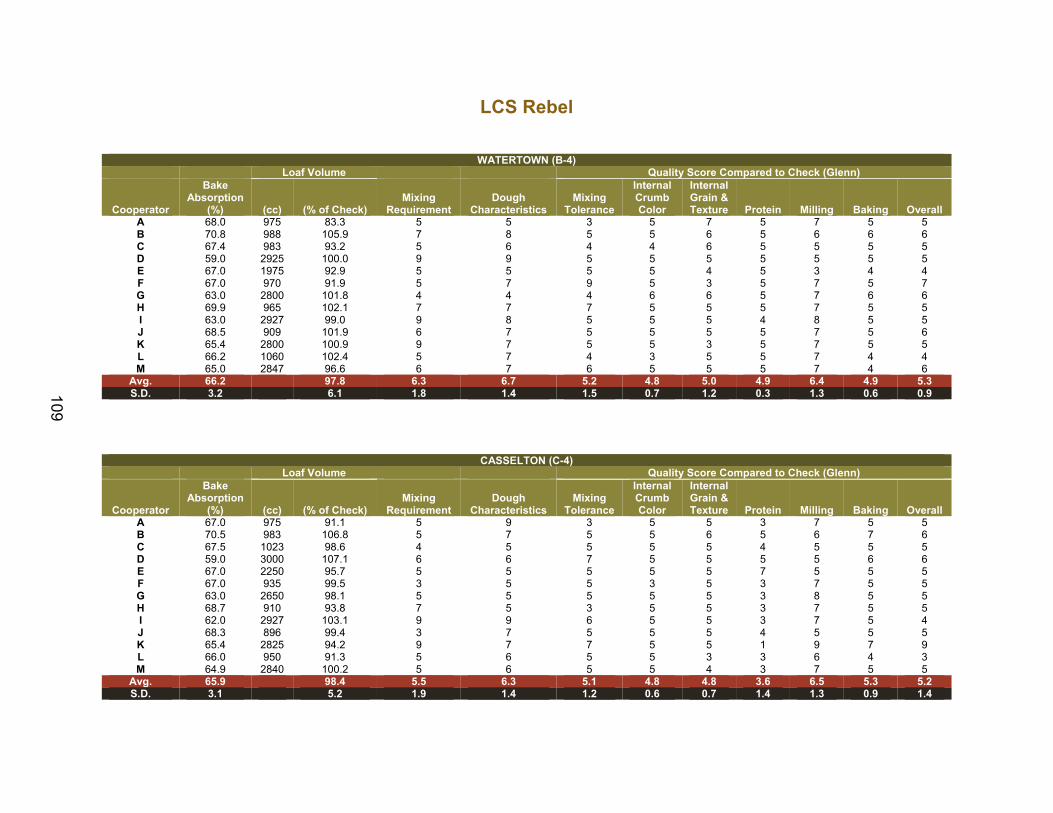
109
LCS Rebel
WATERTOWN (B-4)
Loaf Volume Quality Score Compared to Check (Glenn)
Cooperator
Bake Absorption
(%) (cc) (% of Check) Mixing
Requirement Dough
Characteristics Mixing
Tolerance
Internal Crumb Color
Internal Grain & Texture Protein Milling Baking Overall
A 68.0 975 83.3 5 5 3 5 7 5 7 5 5 B 70.8 988 105.9 7 8 5 5 6 5 6 6 6 C 67.4 983 93.2 5 6 4 4 6 5 5 5 5 D 59.0 2925 100.0 9 9 5 5 5 5 5 5 5 E 67.0 1975 92.9 5 5 5 5 4 5 3 4 4 F 67.0 970 91.9 5 7 9 5 3 5 7 5 7 G 63.0 2800 101.8 4 4 4 6 6 5 7 6 6 H 69.9 965 102.1 7 7 7 5 5 5 7 5 5 I 63.0 2927 99.0 9 8 5 5 5 4 8 5 5 J 68.5 909 101.9 6 7 5 5 5 5 7 5 6 K 65.4 2800 100.9 9 7 5 5 3 5 7 5 5 L 66.2 1060 102.4 5 7 4 3 5 5 7 4 4 M 65.0 2847 96.6 6 7 6 5 5 5 7 4 6
Avg. 66.2 97.8 6.3 6.7 5.2 4.8 5.0 4.9 6.4 4.9 5.3 S.D. 3.2 6.1 1.8 1.4 1.5 0.7 1.2 0.3 1.3 0.6 0.9
CASSELTON (C-4) Loaf Volume Quality Score Compared to Check (Glenn)
Cooperator
Bake Absorption
(%) (cc) (% of Check) Mixing
Requirement Dough
Characteristics Mixing
Tolerance
Internal Crumb Color
Internal Grain & Texture Protein Milling Baking Overall
A 67.0 975 91.1 5 9 3 5 5 3 7 5 5 B 70.5 983 106.8 5 7 5 5 6 5 6 7 6 C 67.5 1023 98.6 4 5 5 5 5 4 5 5 5 D 59.0 3000 107.1 6 6 7 5 5 5 5 6 6 E 67.0 2250 95.7 5 5 5 5 5 7 5 5 5 F 67.0 935 99.5 3 5 5 3 5 3 7 5 5 G 63.0 2650 98.1 5 5 5 5 5 3 8 5 5 H 68.7 910 93.8 7 5 3 5 5 3 7 5 5 I 62.0 2927 103.1 9 9 6 5 5 3 7 5 4 J 68.3 896 99.4 3 7 5 5 5 4 5 5 5 K 65.4 2825 94.2 9 7 7 5 5 1 9 7 9 L 66.0 950 91.3 5 6 5 5 3 3 6 4 3 M 64.9 2840 100.2 5 6 5 5 4 3 7 5 5
Avg. 65.9 98.4 5.5 6.3 5.1 4.8 4.8 3.6 6.5 5.3 5.2 S.D. 3.1 5.2 1.9 1.4 1.2 0.6 0.7 1.4 1.3 0.9 1.4

110
HAVRE (H-4) Loaf Volume Quality Score Compared to Check (Glenn)
Cooperator
Bake Absorption
(%) (cc) (% of Check) Mixing
Requirement Dough
Characteristics Mixing
Tolerance
Internal Crumb Color
Internal Grain & Texture Protein Milling Baking Overall
A 71.0 1190 116.1 5 7 9 7 5 5 7 7 7 B 73.5 980 94.2 7 8 4 5 5 5 6 5 5 C 67.1 978 99.2 4 6 7 5 4 5 5 5 5 D 61.0 3050 104.3 9 9 5 5 5 5 5 5 5 E 67.5 2300 91.1 7 5 5 5 5 5 5 6 6 F 70.0 1050 93.8 7 5 9 5 7 3 7 5 5 G 63.0 2500 84.7 3 3 3 4 4 5 7 4 4 H 71.3 1040 96.3 7 7 3 5 5 5 7 5 5 I 63.0 3045 104.0 9 9 5 5 5 4 7 6 7 J 70.0 908 100.0 4 6 3 5 3 5 8 4 6 K 67.0 2725 98.2 9 9 5 7 9 5 7 9 9 L 69.4 1065 96.8 5 8 4 5 5 5 6 4 4 M 65.6 3116 100.7 5 6 5 6 6 5 6 7 6
Avg. 67.6 98.4 6.2 6.8 5.2 5.3 5.2 4.8 6.4 5.5 5.7 S.D. 3.7 7.5 2.0 1.8 2.0 0.9 1.5 0.6 1.0 1.5 1.4
CROOKSTON (K-4) Loaf Volume Quality Score Compared to Check (Glenn)
Cooperator
Bake Absorption
(%) (cc) (% of Check) Mixing
Requirement Dough
Characteristics Mixing
Tolerance
Internal Crumb Color
Internal Grain & Texture Protein Milling Baking Overall
A 64.0 1000 96.2 5 3 5 3 5 3 9 5 5 B 69.0 885 97.5 5 8 5 5 6 4 8 5 6 C 65.5 968 96.0 5 6 5 4 4 4 6 5 5 D 57.0 2925 100.0 9 9 5 5 4 5 5 5 5 E 65.5 2075 100.0 5 5 5 5 5 5 5 5 5 F 64.0 920 101.1 3 7 7 5 5 3 9 5 7 G 61.0 2750 105.8 4 4 4 6 7 4 9 7 7 H 68.2 830 100.6 7 5 3 5 9 3 7 3 5 I 62.0 2956 100.0 9 8 5 5 4 3 9 5 4 J 67.5 829 100.7 3 7 5 5 7 4 9 5 6 K 64.7 2700 103.8 7 7 5 5 7 1 9 5 7 L 64.1 995 96.6 4 6 4 5 5 4 7 4 4 M 63.4 2750 92.0 5 6 5 5 5 4 9 5 5
Avg. 64.3 99.3 5.5 6.2 4.8 4.8 5.6 3.6 7.8 4.9 5.5 S.D. 3.2 3.6 2.0 1.7 0.9 0.7 1.5 1.0 1.6 0.9 1.1

111
MINOT (M-4) Loaf Volume Quality Score Compared to Check (Glenn)
Cooperator
Bake Absorption
(%) (cc) (% of Check) Mixing
Requirement Dough
Characteristics Mixing
Tolerance
Internal Crumb Color
Internal Grain & Texture Protein Milling Baking Overall
A 70.0 1255 101.2 5 7 3 5 5 3 7 5 5 B 72.6 1018 95.8 7 7 4 5 5 5 7 5 6 C 66.3 1128 105.5 5 6 4 5 6 3 5 6 5 D 60.0 2975 99.2 9 9 5 5 5 5 5 5 5 E 66.5 2275 115.2 7 6 6 6 6 6 6 7 6 F 69.0 1060 95.1 5 7 5 5 5 3 7 3 3 G 63.0 2550 104.1 4 4 4 6 6 3 7 6 6 H 70.0 1000 93.5 7 9 5 5 7 3 7 7 7 I 62.0 2956 100.0 9 9 5 5 5 3 7 5 6 J 68.9 953 93.4 4 7 4 6 6 4 3 5 4 K 65.8 2750 95.7 9 7 5 7 5 1 7 5 7 L 70.4 1050 92.1 7 6 3 4 4 3 6 3 3 M 64.7 3065 105.1 5 6 6 7 7 4 7 4 6
Avg. 66.9 99.7 6.4 6.9 4.5 5.5 5.5 3.5 6.2 5.1 5.3 S.D. 3.7 6.5 1.9 1.4 1.0 0.9 0.9 1.3 1.2 1.3 1.3
WILLISTON (W-4) Loaf Volume Quality Score Compared to Check (Glenn)
Cooperator
Bake Absorption
(%) (cc) (% of Check) Mixing
Requirement Dough
Characteristics Mixing
Tolerance
Internal Crumb Color
Internal Grain & Texture Protein Milling Baking Overall
A 76.5 1245 102.9 9 9 5 7 5 7 5 5 5 B 76.7 1018 90.5 9 9 5 4 4 5 5 4 5 C 68.8 1103 106.1 6 6 6 5 3 4 5 5 5 D 65.0 2925 103.5 9 9 5 5 5 5 5 5 5 E 69.5 2175 88.8 9 9 7 5 6 4 4 5 4 F 76.0 1160 95.5 9 3 3 5 5 7 5 5 5 G 65.0 2200 72.1 6 6 5 3 3 5 5 3 4 H 75.8 1010 84.9 9 9 7 5 5 7 5 5 7 I 64.0 2986 106.3 9 9 5 5 5 7 5 6 5 J 71.3 1078 107.6 9 6 5 5 5 6 4 6 5 K 68.5 2650 91.4 9 9 5 5 5 9 7 3 3 L 72.0 1265 100.4 7 8 7 5 3 7 5 5 6 M 67.4 3103 100.8 5 6 5 6 5 6 5 6 5
Avg. 70.5 96.2 8.1 7.5 5.4 5.0 4.5 6.1 5.0 4.8 4.9 S.D. 4.6 10.3 1.5 1.9 1.1 0.9 1.0 1.4 0.7 1.0 1.0

112
MN13288-1
CASSELTON (C-5) Loaf Volume Quality Score Compared to Check (Glenn)
Cooperator
Bake Absorption
(%) (cc) (% of Check) Mixing
Requirement Dough
Characteristics Mixing
Tolerance
Internal Crumb Color
Internal Grain & Texture Protein Milling Baking Overall
A 67.0 1075 100.5 5 7 7 5 7 5 5 7 7 B 71.4 965 104.9 6 8 5 5 5 5 5 6 5 C 63.4 918 88.4 5 6 6 5 7 5 3 5 4 D 59.0 3000 107.1 9 9 9 5 5 5 5 7 7 E 63.5 2350 100.0 5 7 6 6 6 5 3 3 3 F 68.0 940 100.0 7 3 1 3 5 5 7 5 5 G 60.0 2700 100.0 6 6 6 6 6 4 5 6 6 H 69.3 935 96.4 7 9 3 5 7 5 7 7 7 I 60.0 3015 106.2 9 9 6 5 5 4 4 4 4 J 65.5 899 99.8 5 6 5 5 3 5 1 5 4 K 62.6 2850 95.0 9 7 5 9 7 3 7 7 7 L 62.4 995 95.7 5 6 6 5 5 5 5 5 5 M 61.6 2962 104.5 7 7 7 6 6 5 6 4 6
Avg. 64.1 99.9 6.5 6.9 5.5 5.4 5.7 4.7 4.8 5.5 5.4 S.D. 3.8 5.2 1.6 1.7 1.9 1.3 1.2 0.6 1.8 1.3 1.4
HAVRE (H-5) Loaf Volume Quality Score Compared to Check (Glenn)
Cooperator
Bake Absorption
(%) (cc) (% of Check) Mixing
Requirement Dough
Characteristics Mixing
Tolerance
Internal Crumb Color
Internal Grain & Texture Protein Milling Baking Overall
A 69.0 1150 112.2 5 9 7 9 5 7 5 7 7 B 73.2 978 94.0 6 9 5 5 5 5 5 5 5 C 63.4 983 99.7 4 6 4 5 5 6 4 5 5 D 62.0 3000 102.6 9 9 5 5 5 6 5 5 5 E 64.0 2500 99.0 7 6 6 7 5 3 4 3 3 F 72.0 1100 98.2 9 3 3 5 7 5 5 5 5 G 60.0 2950 100.0 9 7 8 5 5 6 4 5 5 H 70.7 1030 95.4 7 7 5 5 5 7 5 5 5 I 62.0 3015 103.0 9 9 5 5 5 7 5 4 6 J 67.5 949 104.5 3 6 6 6 4 5 5 6 5 K 64.3 3000 108.1 9 9 5 5 9 7 3 7 7 L 67.4 1045 95.0 5 7 8 3 3 6 4 3 4 M 62.1 3193 103.2 5 6 6 5 5 6 4 6 5
Avg. 66.0 101.2 6.7 7.2 5.6 5.4 5.2 5.8 4.5 5.1 5.2 S.D. 4.3 5.2 2.2 1.8 1.4 1.4 1.4 1.1 0.7 1.3 1.1

113
CROOKSTON (K-5) Loaf Volume Quality Score Compared to Check (Glenn)
Cooperator
Bake Absorption
(%) (cc) (% of Check) Mixing
Requirement Dough
Characteristics Mixing
Tolerance
Internal Crumb Color
Internal Grain & Texture Protein Milling Baking Overall
A 62.0 950 91.3 5 9 9 5 7 3 7 7 7 B 65.5 818 90.1 6 8 5 5 6 5 6 5 5 C 61.9 870 86.3 6 6 4 5 4 3 4 4 4 D 57.0 3000 102.6 9 9 5 5 4 5 5 5 5 E 61.5 2200 106.0 4 5 4 6 5 5 4 4 4 F 64.0 895 98.4 7 1 3 5 3 3 7 5 5 G 58.0 2450 94.2 3 3 3 3 4 3 8 4 4 H 64.8 795 96.4 7 5 3 5 5 3 7 3 5 I 58.0 2986 101.0 9 8 5 5 4 3 8 3 4 J 63.9 820 99.6 4 7 5 5 6 3 4 5 4 K 60.9 2500 96.2 9 9 5 7 7 1 7 5 7 L 60.4 980 95.1 5 6 4 5 5 2 6 5 3 M 59.7 2826 94.5 5 7 6 5 4 3 8 3 4
Avg. 61.4 96.3 6.1 6.4 4.7 5.1 4.9 3.2 6.2 4.5 4.7 S.D. 2.7 5.3 2.0 2.4 1.6 0.9 1.3 1.2 1.5 1.1 1.2
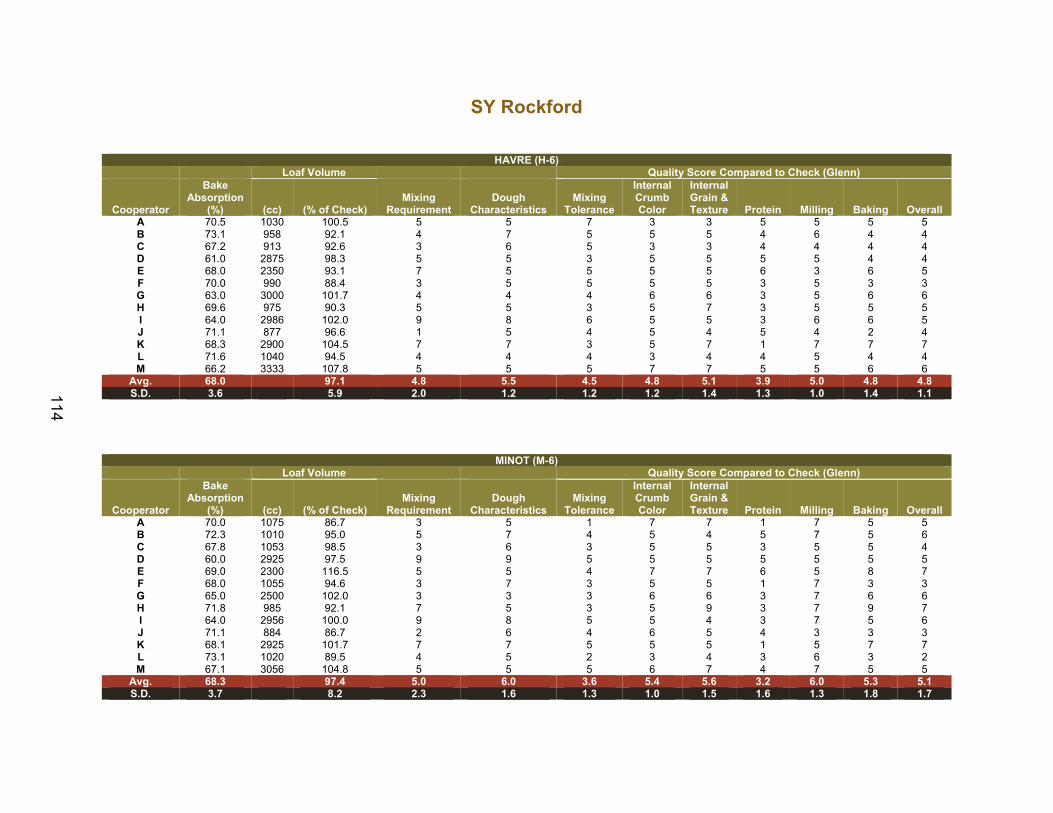
114
SY Rockford
HAVRE (H-6) Loaf Volume Quality Score Compared to Check (Glenn)
Cooperator
Bake Absorption
(%) (cc) (% of Check) Mixing
Requirement Dough
Characteristics Mixing
Tolerance
Internal Crumb Color
Internal Grain & Texture Protein Milling Baking Overall
A 70.5 1030 100.5 5 5 7 3 3 5 5 5 5 B 73.1 958 92.1 4 7 5 5 5 4 6 4 4 C 67.2 913 92.6 3 6 5 3 3 4 4 4 4 D 61.0 2875 98.3 5 5 3 5 5 5 5 4 4 E 68.0 2350 93.1 7 5 5 5 5 6 3 6 5 F 70.0 990 88.4 3 5 5 5 5 3 5 3 3 G 63.0 3000 101.7 4 4 4 6 6 3 5 6 6 H 69.6 975 90.3 5 5 3 5 7 3 5 5 5 I 64.0 2986 102.0 9 8 6 5 5 3 6 6 5 J 71.1 877 96.6 1 5 4 5 4 5 4 2 4 K 68.3 2900 104.5 7 7 3 5 7 1 7 7 7 L 71.6 1040 94.5 4 4 4 3 4 4 5 4 4 M 66.2 3333 107.8 5 5 5 7 7 5 5 6 6
Avg. 68.0 97.1 4.8 5.5 4.5 4.8 5.1 3.9 5.0 4.8 4.8 S.D. 3.6 5.9 2.0 1.2 1.2 1.2 1.4 1.3 1.0 1.4 1.1
MINOT (M-6) Loaf Volume Quality Score Compared to Check (Glenn)
Cooperator
Bake Absorption
(%) (cc) (% of Check) Mixing
Requirement Dough
Characteristics Mixing
Tolerance
Internal Crumb Color
Internal Grain & Texture Protein Milling Baking Overall
A 70.0 1075 86.7 3 5 1 7 7 1 7 5 5 B 72.3 1010 95.0 5 7 4 5 4 5 7 5 6 C 67.8 1053 98.5 3 6 3 5 5 3 5 5 4 D 60.0 2925 97.5 9 9 5 5 5 5 5 5 5 E 69.0 2300 116.5 5 5 4 7 7 6 5 8 7 F 68.0 1055 94.6 3 7 3 5 5 1 7 3 3 G 65.0 2500 102.0 3 3 3 6 6 3 7 6 6 H 71.8 985 92.1 7 5 3 5 9 3 7 9 7 I 64.0 2956 100.0 9 8 5 5 4 3 7 5 6 J 71.1 884 86.7 2 6 4 6 5 4 3 3 3 K 68.1 2925 101.7 7 7 5 5 5 1 5 7 7 L 73.1 1020 89.5 4 5 2 3 4 3 6 3 2 M 67.1 3056 104.8 5 5 5 6 7 4 7 5 5
Avg. 68.3 97.4 5.0 6.0 3.6 5.4 5.6 3.2 6.0 5.3 5.1 S.D. 3.7 8.2 2.3 1.6 1.3 1.0 1.5 1.6 1.3 1.8 1.7

115
WILLISTON (W-6) Loaf Volume Quality Score Compared to Check (Glenn)
Cooperator
Bake Absorption
(%) (cc) (% of Check) Mixing
Requirement Dough
Characteristics Mixing
Tolerance
Internal Crumb Color
Internal Grain & Texture Protein Milling Baking Overall
A 74.5 1140 94.2 7 7 3 5 1 5 5 3 5 B 75.1 1088 96.7 6 8 5 5 6 5 5 6 5 C 68.9 1020 98.1 4 6 4 3 3 4 5 3 3 D 64.0 2975 105.3 9 9 5 5 5 5 5 5 5 E 70.0 2300 93.9 8 7 4 7 6 4 5 6 5 F 74.0 1120 92.2 7 5 5 5 5 5 5 5 5 G 66.0 3000 98.4 4 4 5 6 6 5 5 6 6 H 71.7 1180 99.2 7 9 3 5 7 5 5 5 5 I 65.0 2956 105.2 9 9 5 5 5 6 5 7 6 J 73.1 1031 102.9 3 6 4 5 5 5 7 3 5 K 70.2 2850 98.3 9 7 3 5 5 5 5 5 5 L 73.6 1245 98.8 5 6 3 6 4 6 5 4 5 M 68.2 3021 98.1 5 5 5 5 6 6 5 5 6
Avg. 70.3 98.6 6.4 6.8 4.2 5.2 4.9 5.1 5.2 4.8 5.1 S.D. 3.7 4.0 2.1 1.6 0.9 0.9 1.6 0.6 0.6 1.3 0.8

116
WB9479
WATERTOWN (B-7) Loaf Volume Quality Score Compared to Check (Glenn)
Cooperator
Bake Absorption
(%) (cc) (% of Check) Mixing
Requirement Dough
Characteristics Mixing
Tolerance
Internal Crumb Color
Internal Grain & Texture Protein Milling Baking Overall
A 68.5 1125 96.2 7 7 5 7 7 7 7 7 7 B 72.3 958 102.7 7 8 5 5 5 5 5 5 5 C 64.2 1025 97.2 5 6 4 4 5 6 5 5 5 D 60.0 2925 100.0 9 9 5 5 5 5 5 5 5 E 65.0 2250 105.9 5 5 5 8 5 4 3 4 4 F 69.0 995 94.3 9 5 5 5 3 7 7 5 7 G 61.0 2800 101.8 3 3 3 6 6 6 7 6 6 H 69.9 965 102.1 9 7 7 5 7 7 7 7 7 I 61.0 2839 96.0 9 9 6 5 5 7 7 4 3 J 67.1 925 103.7 5 7 4 5 5 6 4 5 5 K 63.9 2775 100.0 9 7 5 7 5 7 7 5 5 L 63.8 1040 100.5 5 6 3 5 6 6 6 6 6 M 62.9 2927 99.3 5 8 8 5 5 6 6 5 7
Avg. 65.3 100.0 6.7 6.7 5.0 5.5 5.3 6.1 5.8 5.3 5.5 S.D. 3.8 3.4 2.1 1.7 1.4 1.1 1.0 1.0 1.3 0.9 1.3
CASSELTON (C-7) Loaf Volume Quality Score Compared to Check (Glenn)
Cooperator
Bake Absorption
(%) (cc) (% of Check) Mixing
Requirement Dough
Characteristics Mixing
Tolerance
Internal Crumb Color
Internal Grain & Texture Protein Milling Baking Overall
A 67.0 1045 97.7 5 7 7 5 9 3 7 7 7 B 70.6 893 97.1 7 8 5 5 6 5 6 5 5 C 63.8 938 90.4 4 6 7 5 4 4 4 5 4 D 59.0 3000 107.1 9 9 9 5 5 5 5 7 7 E 64.5 2400 102.1 5 4 7 7 6 7 5 3 4 F 67.0 965 102.7 7 3 3 5 5 5 7 5 7 G 60.0 2700 100.0 7 7 7 5 5 4 7 5 5 H 68.5 905 93.3 7 7 5 5 9 3 7 7 7 I 61.0 3015 106.2 9 9 6 5 5 4 7 4 4 J 66.4 868 96.3 3 6 5 5 3 4 3 3 3 K 63.6 3000 100.0 7 7 5 7 5 3 9 5 5 L 63.1 1015 97.6 5 6 7 5 5 3 6 6 4 M 62.4 2736 96.5 5 7 7 5 5 5 7 4 5
Avg. 64.4 99.0 6.2 6.6 6.2 5.3 5.5 4.2 6.2 5.1 5.2 S.D. 3.4 4.8 1.8 1.7 1.5 0.8 1.7 1.2 1.6 1.4 1.4

117
CROOKSTON (K-7) Loaf Volume Quality Score Compared to Check (Glenn)
Cooperator
Bake Absorption
(%) (cc) (% of Check) Mixing
Requirement Dough
Characteristics Mixing
Tolerance
Internal Crumb Color
Internal Grain & Texture Protein Milling Baking Overall
A 64.0 960 92.3 7 9 9 5 7 3 7 7 7 B 66.1 798 87.9 8 8 5 5 5 5 7 4 5 C 62.4 925 91.8 5 6 5 4 5 4 4 5 4 D 57.0 2875 98.3 8 8 5 5 4 5 5 5 5 E 62.5 2150 103.6 5 5 5 5 4 5 5 6 6 F 64.0 880 96.7 9 3 5 5 5 3 9 5 7 G 60.0 2450 94.2 5 5 5 3 4 4 9 4 4 H 66.1 790 95.8 7 7 3 5 7 3 7 7 7 I 60.0 2927 99.0 9 9 6 5 5 3 8 4 3 J 65.4 812 98.7 6 7 5 5 6 4 8 5 6 K 62.2 2825 108.7 9 9 5 7 5 3 7 7 7 L 61.4 985 95.6 6 6 5 6 5 3 6 5 4 M 60.7 2845 95.2 5 7 6 5 5 4 8 3 5
Avg. 62.4 96.7 6.8 6.8 5.3 5.0 5.2 3.8 6.9 5.2 5.4 S.D. 2.7 5.3 1.6 1.8 1.3 0.9 1.0 0.8 1.6 1.3 1.4
MINOT (M-7) Loaf Volume Quality Score Compared to Check (Glenn)
Cooperator
Bake Absorption
(%) (cc) (% of Check) Mixing
Requirement Dough
Characteristics Mixing
Tolerance
Internal Crumb Color
Internal Grain & Texture Protein Milling Baking Overall
A 71.0 1195 96.4 7 7 3 7 7 5 7 7 7 B 71.4 983 92.5 8 8 5 5 4 5 6 4 5 C 64.6 1008 94.3 5 6 5 5 4 5 6 5 5 D 61.0 2800 93.3 9 9 5 5 5 5 5 5 5 E 65.5 2325 117.7 7 5 5 5 5 5 5 4 5 F 70.0 1055 94.6 9 3 5 5 5 3 7 3 3 G 62.0 2100 85.7 5 5 5 6 6 5 8 6 7 H 71.1 915 85.5 7 7 5 5 5 5 7 5 7 I 62.0 2986 101.0 9 9 5 5 5 5 8 5 6 J 67.5 932 91.4 5 7 5 6 5 5 2 5 4 K 64.6 2625 91.3 9 9 7 5 3 5 9 3 3 L 69.4 1020 89.5 5 6 4 5 3 5 6 3 4 M 63.5 3112 106.7 5 5 5 5 6 5 8 5 6
Avg. 66.4 95.4 6.9 6.6 4.9 5.3 4.8 4.8 6.5 4.6 5.2 S.D. 3.8 8.8 1.8 1.9 0.9 0.6 1.1 0.6 1.8 1.2 1.4

118
WILLISTON (W-7) Loaf Volume Quality Score Compared to Check (Glenn)
Cooperator
Bake Absorption
(%) (cc) (% of Check) Mixing
Requirement Dough
Characteristics Mixing
Tolerance
Internal Crumb Color
Internal Grain & Texture Protein Milling Baking Overall
A 75.5 1190 98.3 9 7 5 5 5 5 5 5 5 B 75.9 1050 93.3 9 8 5 5 5 5 5 4 5 C 67.5 980 94.2 5 6 5 5 4 4 5 5 5 D 65.0 3000 106.2 9 9 5 5 5 5 5 5 5 E 68.5 2400 98.0 9 8 5 6 7 4 5 6 5 F 76.0 1055 86.8 9 3 1 5 5 5 5 3 3 G 65.0 2900 95.1 5 5 5 6 6 5 6 6 6 H 72.6 1145 96.2 9 9 5 5 7 7 5 7 7 I 64.0 2986 106.3 9 9 5 5 5 6 6 6 6 J 71.2 972 97.0 9 7 5 5 5 5 6 5 5 K 68.4 2850 98.3 9 9 5 5 5 7 5 5 5 L 70.1 1220 96.8 5 7 4 6 6 6 5 6 6 M 66.6 3017 98.0 5 5 5 5 7 6 5 5 5
Avg. 69.7 97.3 7.8 7.1 4.6 5.2 5.5 5.4 5.2 5.2 5.2 S.D. 4.3 5.0 1.9 1.9 1.1 0.4 1.0 1.0 0.4 1.0 0.9

119
SD4579
WATERTOWN (B-8) Loaf Volume Quality Score Compared to Check (Glenn)
Cooperator
Bake Absorption
(%) (cc) (% of Check) Mixing
Requirement Dough
Characteristics Mixing
Tolerance
Internal Crumb Color
Internal Grain & Texture Protein Milling Baking Overall
A 66.5 950 81.2 3 5 1 5 5 5 9 3 3 B 68.4 1000 107.2 5 7 4 6 5 4 7 5 5 C 62.6 835 79.1 3 5 3 5 3 5 6 3 3 D 60.0 2625 89.7 3 3 2 3 4 5 3 3 3 E 63.5 2400 112.9 5 4 5 5 7 5 4 4 4 F 68.0 880 83.4 3 1 1 5 3 5 9 3 5 G 60.0 2550 92.7 3 3 3 4 4 5 8 4 4 H 66.9 940 99.5 5 7 3 5 7 7 7 7 7 I 60.0 2809 95.0 7 4 2 5 3 5 9 3 3 J 65.5 905 101.5 2 4 3 6 6 5 4 3 4 K 62.7 2750 99.1 5 5 3 3 3 5 9 3 3 L 62.4 1000 96.6 4 4 3 6 5 5 7 5 6 M 61.6 2863 97.1 5 4 4 5 6 5 8 5 7
Avg. 63.7 95.0 4.1 4.3 2.8 4.8 4.7 5.1 6.9 3.9 4.4 S.D. 3.0 9.9 1.4 1.6 1.1 1.0 1.5 0.6 2.1 1.3 1.5
CASSELTON (C-8) Loaf Volume Quality Score Compared to Check (Glenn)
Cooperator
Bake Absorption
(%) (cc) (% of Check) Mixing
Requirement Dough
Characteristics Mixing
Tolerance
Internal Crumb Color
Internal Grain & Texture Protein Milling Baking Overall
A 65.5 875 81.8 3 1 3 3 3 3 9 3 3 B 67.4 953 103.6 3 7 4 5 6 4 8 6 6 C 62.8 788 75.9 3 5 4 3 2 4 6 3 3 D 59.0 2600 92.9 2 2 2 5 5 3 3 2 2 E 63.5 2500 106.4 5 4 5 8 9 7 3 2 3 F 66.0 840 89.4 3 1 1 5 3 3 9 1 3 G 60.0 2700 100.0 4 4 5 4 4 3 9 4 4 H 68.4 910 93.8 5 3 3 5 5 3 7 7 7 I 60.0 2750 96.9 2 3 2 4 3 3 8 1 1 J 65.5 829 92.0 2 3 5 6 5 3 1 2 2 K 62.3 2800 93.3 5 3 3 3 3 1 9 3 3 L 62.1 1050 101.0 3 4 3 6 8 3 7 7 6 M 61.3 2632 92.8 5 4 5 5 4 4 8 4 5
Avg. 63.4 93.8 3.5 3.4 3.5 4.8 4.6 3.4 6.7 3.5 3.7 S.D. 3.0 8.4 1.2 1.6 1.3 1.4 2.1 1.3 2.7 2.1 1.8
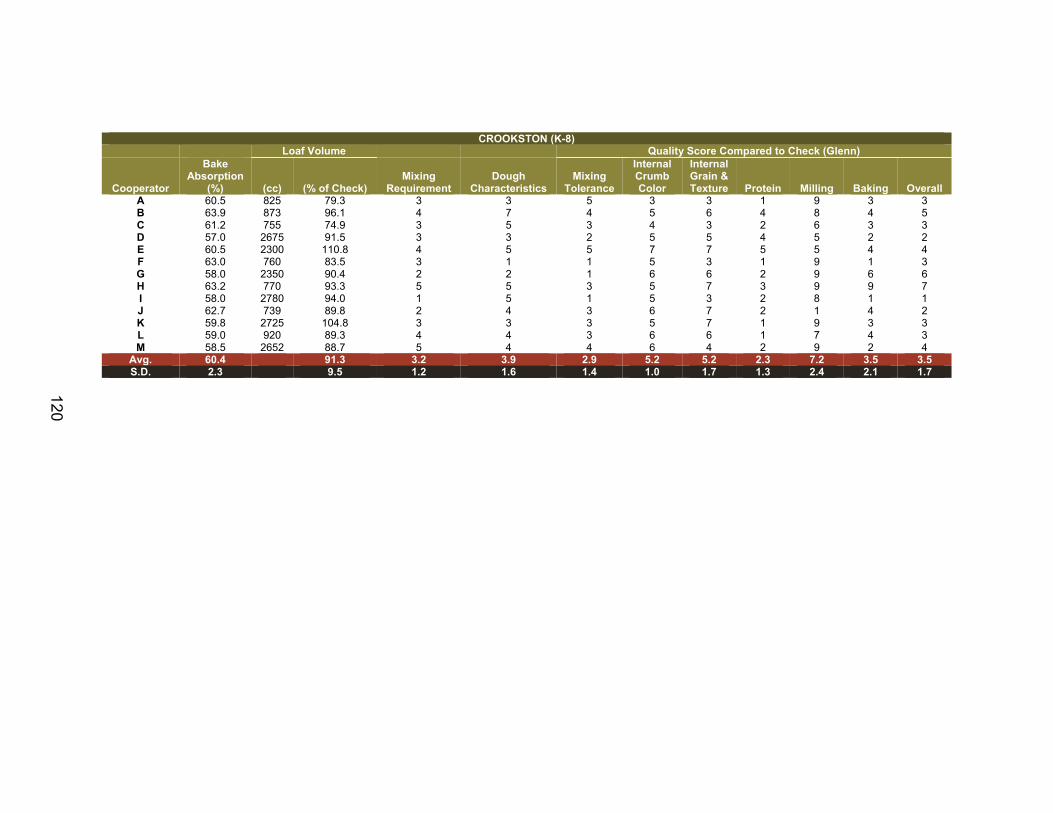
120
CROOKSTON (K-8) Loaf Volume Quality Score Compared to Check (Glenn)
Cooperator
Bake Absorption
(%) (cc) (% of Check) Mixing
Requirement Dough
Characteristics Mixing
Tolerance
Internal Crumb Color
Internal Grain & Texture Protein Milling Baking Overall
A 60.5 825 79.3 3 3 5 3 3 1 9 3 3 B 63.9 873 96.1 4 7 4 5 6 4 8 4 5 C 61.2 755 74.9 3 5 3 4 3 2 6 3 3 D 57.0 2675 91.5 3 3 2 5 5 4 5 2 2 E 60.5 2300 110.8 4 5 5 7 7 5 5 4 4 F 63.0 760 83.5 3 1 1 5 3 1 9 1 3 G 58.0 2350 90.4 2 2 1 6 6 2 9 6 6 H 63.2 770 93.3 5 5 3 5 7 3 9 9 7 I 58.0 2780 94.0 1 5 1 5 3 2 8 1 1 J 62.7 739 89.8 2 4 3 6 7 2 1 4 2 K 59.8 2725 104.8 3 3 3 5 7 1 9 3 3 L 59.0 920 89.3 4 4 3 6 6 1 7 4 3 M 58.5 2652 88.7 5 4 4 6 4 2 9 2 4
Avg. 60.4 91.3 3.2 3.9 2.9 5.2 5.2 2.3 7.2 3.5 3.5 S.D. 2.3 9.5 1.2 1.6 1.4 1.0 1.7 1.3 2.4 2.1 1.7
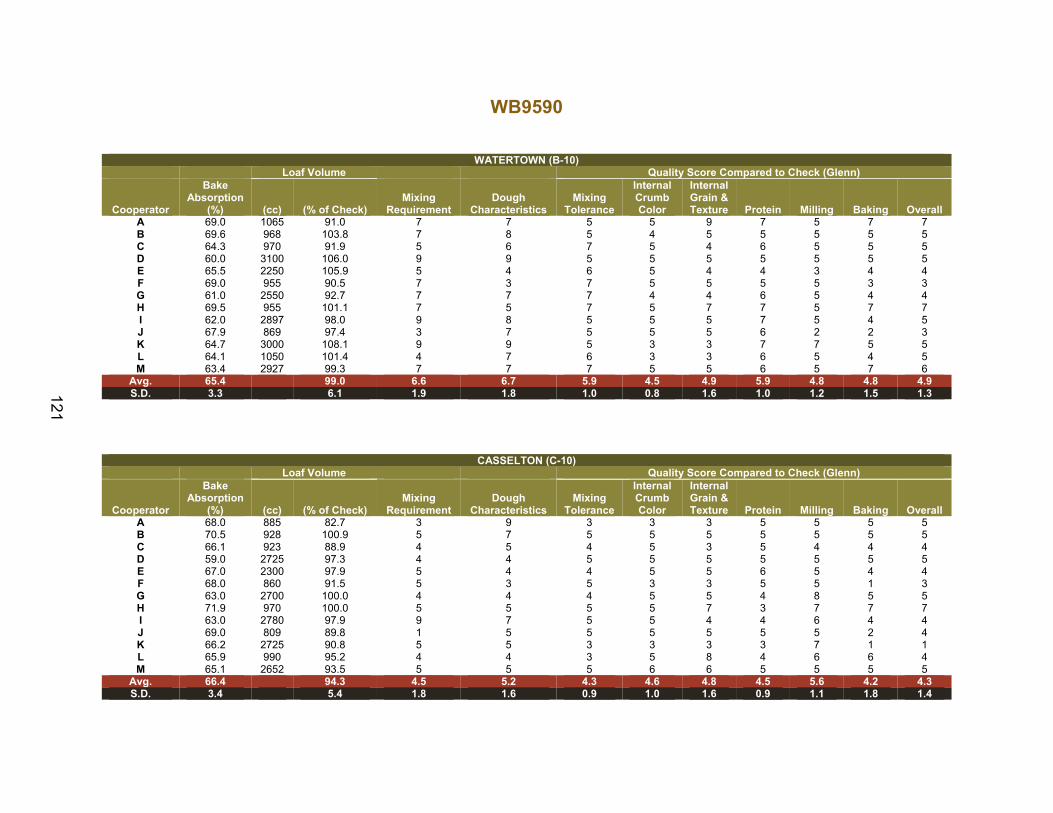
121
WB9590
WATERTOWN (B-10)
Loaf Volume Quality Score Compared to Check (Glenn)
Cooperator
Bake Absorption
(%) (cc) (% of Check) Mixing
Requirement Dough
Characteristics Mixing
Tolerance
Internal Crumb Color
Internal Grain & Texture Protein Milling Baking Overall
A 69.0 1065 91.0 7 7 5 5 9 7 5 7 7 B 69.6 968 103.8 7 8 5 4 5 5 5 5 5 C 64.3 970 91.9 5 6 7 5 4 6 5 5 5 D 60.0 3100 106.0 9 9 5 5 5 5 5 5 5 E 65.5 2250 105.9 5 4 6 5 4 4 3 4 4 F 69.0 955 90.5 7 3 7 5 5 5 5 3 3 G 61.0 2550 92.7 7 7 7 4 4 6 5 4 4 H 69.5 955 101.1 7 5 7 5 7 7 5 7 7 I 62.0 2897 98.0 9 8 5 5 5 7 5 4 5 J 67.9 869 97.4 3 7 5 5 5 6 2 2 3 K 64.7 3000 108.1 9 9 5 3 3 7 7 5 5 L 64.1 1050 101.4 4 7 6 3 3 6 5 4 5 M 63.4 2927 99.3 7 7 7 5 5 6 5 7 6
Avg. 65.4 99.0 6.6 6.7 5.9 4.5 4.9 5.9 4.8 4.8 4.9 S.D. 3.3 6.1 1.9 1.8 1.0 0.8 1.6 1.0 1.2 1.5 1.3
CASSELTON (C-10) Loaf Volume Quality Score Compared to Check (Glenn)
Cooperator
Bake Absorption
(%) (cc) (% of Check) Mixing
Requirement Dough
Characteristics Mixing
Tolerance
Internal Crumb Color
Internal Grain & Texture Protein Milling Baking Overall
A 68.0 885 82.7 3 9 3 3 3 5 5 5 5 B 70.5 928 100.9 5 7 5 5 5 5 5 5 5 C 66.1 923 88.9 4 5 4 5 3 5 4 4 4 D 59.0 2725 97.3 4 4 5 5 5 5 5 5 5 E 67.0 2300 97.9 5 4 4 5 5 6 5 4 4 F 68.0 860 91.5 5 3 5 3 3 5 5 1 3 G 63.0 2700 100.0 4 4 4 5 5 4 8 5 5 H 71.9 970 100.0 5 5 5 5 7 3 7 7 7 I 63.0 2780 97.9 9 7 5 5 4 4 6 4 4 J 69.0 809 89.8 1 5 5 5 5 5 5 2 4 K 66.2 2725 90.8 5 5 3 3 3 3 7 1 1 L 65.9 990 95.2 4 4 3 5 8 4 6 6 4 M 65.1 2652 93.5 5 5 5 6 6 5 5 5 5
Avg. 66.4 94.3 4.5 5.2 4.3 4.6 4.8 4.5 5.6 4.2 4.3 S.D. 3.4 5.4 1.8 1.6 0.9 1.0 1.6 0.9 1.1 1.8 1.4
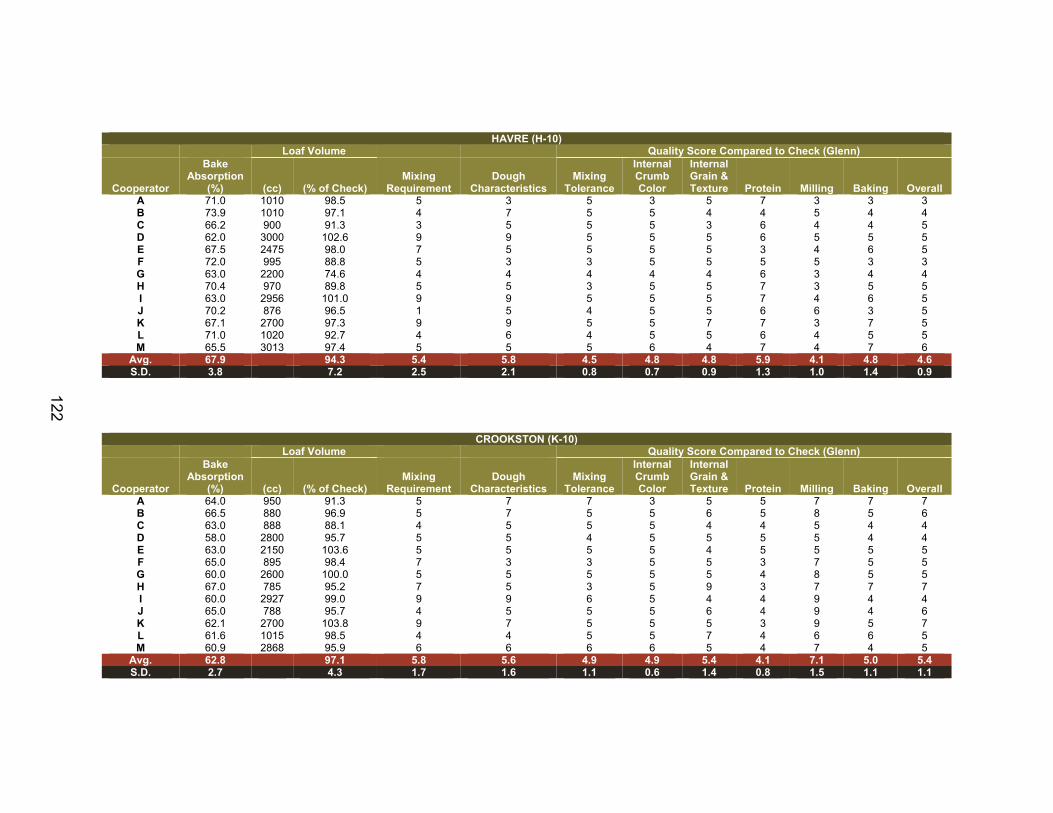
122
HAVRE (H-10) Loaf Volume Quality Score Compared to Check (Glenn)
Cooperator
Bake Absorption
(%) (cc) (% of Check) Mixing
Requirement Dough
Characteristics Mixing
Tolerance
Internal Crumb Color
Internal Grain & Texture Protein Milling Baking Overall
A 71.0 1010 98.5 5 3 5 3 5 7 3 3 3 B 73.9 1010 97.1 4 7 5 5 4 4 5 4 4 C 66.2 900 91.3 3 5 5 5 3 6 4 4 5 D 62.0 3000 102.6 9 9 5 5 5 6 5 5 5 E 67.5 2475 98.0 7 5 5 5 5 3 4 6 5 F 72.0 995 88.8 5 3 3 5 5 5 5 3 3 G 63.0 2200 74.6 4 4 4 4 4 6 3 4 4 H 70.4 970 89.8 5 5 3 5 5 7 3 5 5 I 63.0 2956 101.0 9 9 5 5 5 7 4 6 5 J 70.2 876 96.5 1 5 4 5 5 6 6 3 5 K 67.1 2700 97.3 9 9 5 5 7 7 3 7 5 L 71.0 1020 92.7 4 6 4 5 5 6 4 5 5 M 65.5 3013 97.4 5 5 5 6 4 7 4 7 6
Avg. 67.9 94.3 5.4 5.8 4.5 4.8 4.8 5.9 4.1 4.8 4.6 S.D. 3.8 7.2 2.5 2.1 0.8 0.7 0.9 1.3 1.0 1.4 0.9
CROOKSTON (K-10) Loaf Volume Quality Score Compared to Check (Glenn)
Cooperator
Bake Absorption
(%) (cc) (% of Check) Mixing
Requirement Dough
Characteristics Mixing
Tolerance
Internal Crumb Color
Internal Grain & Texture Protein Milling Baking Overall
A 64.0 950 91.3 5 7 7 3 5 5 7 7 7 B 66.5 880 96.9 5 7 5 5 6 5 8 5 6 C 63.0 888 88.1 4 5 5 5 4 4 5 4 4 D 58.0 2800 95.7 5 5 4 5 5 5 5 4 4 E 63.0 2150 103.6 5 5 5 5 4 5 5 5 5 F 65.0 895 98.4 7 3 3 5 5 3 7 5 5 G 60.0 2600 100.0 5 5 5 5 5 4 8 5 5 H 67.0 785 95.2 7 5 3 5 9 3 7 7 7 I 60.0 2927 99.0 9 9 6 5 4 4 9 4 4 J 65.0 788 95.7 4 5 5 5 6 4 9 4 6 K 62.1 2700 103.8 9 7 5 5 5 3 9 5 7 L 61.6 1015 98.5 4 4 5 5 7 4 6 6 5 M 60.9 2868 95.9 6 6 6 6 5 4 7 4 5
Avg. 62.8 97.1 5.8 5.6 4.9 4.9 5.4 4.1 7.1 5.0 5.4 S.D. 2.7 4.3 1.7 1.6 1.1 0.6 1.4 0.8 1.5 1.1 1.1

123
MINOT (M-10) Loaf Volume Quality Score Compared to Check (Glenn)
Cooperator
Bake Absorption
(%) (cc) (% of Check) Mixing
Requirement Dough
Characteristics Mixing
Tolerance
Internal Crumb Color
Internal Grain & Texture Protein Milling Baking Overall
A 71.5 1090 87.9 5 5 3 5 3 5 7 3 5 B 72.2 1000 94.1 7 7 4 6 6 5 5 4 5 C 66.1 993 92.9 4 6 4 5 5 5 5 4 5 D 61.0 2725 90.8 9 9 5 5 5 5 5 5 5 E 67.0 2375 120.3 6 5 5 5 8 5 5 7 7 F 71.0 1040 93.3 5 3 1 5 3 5 7 3 5 G 63.0 2450 100.0 4 4 4 4 4 5 6 4 4 H 69.9 995 93.0 7 9 5 5 5 5 7 5 7 I 62.0 2986 101.0 9 9 5 5 5 5 6 5 5 J 69.2 888 87.1 7 5 4 6 6 5 3 4 4 K 66.1 2775 96.5 9 7 3 7 5 5 9 5 5 L 72.1 1040 91.2 5 6 3 4 3 5 6 4 4 M 65.1 3252 111.5 5 6 6 6 6 5 7 4 7
Avg. 67.4 96.9 6.3 6.2 4.0 5.2 4.9 5.0 6.0 4.4 5.2 S.D. 3.9 9.5 1.8 1.9 1.3 0.8 1.4 0.0 1.5 1.0 1.1
WILLISTON (W-10) Loaf Volume Quality Score Compared to Check (Glenn)
Cooperator
Bake Absorption
(%) (cc) (% of Check) Mixing
Requirement Dough
Characteristics Mixing
Tolerance
Internal Crumb Color
Internal Grain & Texture Protein Milling Baking Overall
A 75.0 1000 82.6 7 5 3 3 1 7 5 3 3 B 75.7 1028 91.4 8 8 5 5 5 5 5 4 5 C 67.1 925 88.9 4 6 5 4 4 4 5 4 4 D 65.0 3000 106.2 9 9 5 5 5 5 5 5 5 E 68.5 2450 100.0 9 8 5 4 6 5 4 5 5 F 76.0 1075 88.5 9 3 3 3 5 5 5 3 3 G 65.0 3050 100.0 5 5 5 5 5 5 4 5 6 H 72.4 1095 92.0 7 9 5 5 3 7 5 3 5 I 64.0 2897 103.1 9 9 5 5 5 5 4 6 5 J 71.3 946 94.4 5 7 5 5 5 5 6 4 5 K 68.5 2675 92.2 9 9 5 7 5 7 5 3 3 L 72.2 1200 95.2 5 6 4 5 5 5 4 5 5 M 66.6 2971 96.5 5 6 5 5 6 5 5 5 6
Avg. 69.8 94.7 7.0 6.9 4.6 4.7 4.6 5.4 4.8 4.2 4.6 S.D. 4.2 6.5 2.0 1.9 0.8 1.0 1.3 1.0 0.6 1.0 1.0
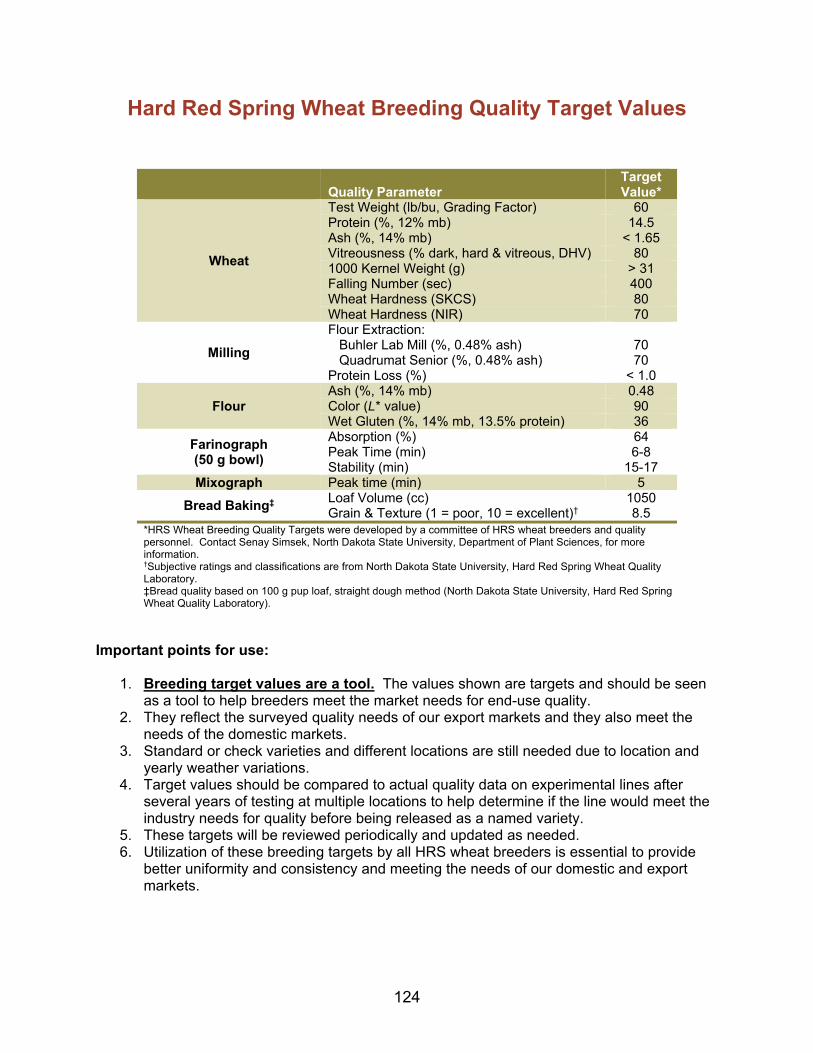
124
Hard Red Spring Wheat Breeding Quality Target Values
Quality Parameter Target Value*
Wheat
Test Weight (lb/bu, Grading Factor) 60 Protein (%, 12% mb) 14.5 Ash (%, 14% mb) < 1.65 Vitreousness (% dark, hard & vitreous, DHV) 80 1000 Kernel Weight (g) > 31 Falling Number (sec) 400 Wheat Hardness (SKCS) 80 Wheat Hardness (NIR) 70
Milling
Flour Extraction: Buhler Lab Mill (%, 0.48% ash) 70 Quadrumat Senior (%, 0.48% ash) 70 Protein Loss (%) < 1.0
Flour Ash (%, 14% mb) 0.48 Color (L* value) 90 Wet Gluten (%, 14% mb, 13.5% protein) 36
Farinograph (50 g bowl)
Absorption (%) 64 Peak Time (min) 6-8 Stability (min) 15-17
Mixograph Peak time (min) 5
Bread Baking‡ Loaf Volume (cc) 1050 Grain & Texture (1 = poor, 10 = excellent)† 8.5
*HRS Wheat Breeding Quality Targets were developed by a committee of HRS wheat breeders and quality personnel. Contact Senay Simsek, North Dakota State University, Department of Plant Sciences, for more information. †Subjective ratings and classifications are from North Dakota State University, Hard Red Spring Wheat Quality Laboratory. ‡Bread quality based on 100 g pup loaf, straight dough method (North Dakota State University, Hard Red Spring Wheat Quality Laboratory).
Important points for use:
1. Breeding target values are a tool. The values shown are targets and should be seen as a tool to help breeders meet the market needs for end-use quality.
2. They reflect the surveyed quality needs of our export markets and they also meet the needs of the domestic markets.
3. Standard or check varieties and different locations are still needed due to location and yearly weather variations.
4. Target values should be compared to actual quality data on experimental lines after several years of testing at multiple locations to help determine if the line would meet the industry needs for quality before being released as a named variety.
5. These targets will be reviewed periodically and updated as needed. 6. Utilization of these breeding targets by all HRS wheat breeders is essential to provide
better uniformity and consistency and meeting the needs of our domestic and export markets.