Embed Size (px)
Citation preview

What�s in a name? Typicality and relatednesseffects in children
Susan Jerger a,*, Markus F. Damian b
a School of Behavioral and Brain Sciences, University of Texas at Dallas, P.O. Box 830688,
GR4.1, Richardson, TX 75083, USAb Department of Experimental Psychology, University of Bristol, 8 Woodland Road, Bristol BS8 1TN, UK
Received 3 August 2004; revised 25 March 2005Available online 17 May 2005
Abstract
We studied how category typicality and out-of-category relatedness affect speeded categoryverification (vote ‘‘yes’’ if pictured object is clothing) in typically developing 4- to 14-year-oldsand adults. Stimuli were typical and atypical category objects (e.g., pants, glove) and relatedand unrelated out-of-category objects (e.g., necklace, soup). Typical and unrelated out-of-cat-egory objects exhibited preferential processing (faster reaction times and fewer errors). Vari-ations in typicality and relatedness disproportionately influenced children�s performance,with developmental improvement associated with both verbal and nonverbal factors. Under-extension versus overextension errors seemed to be associated with independent factors,namely multifaceted maturational factors versus receptive vocabulary skill, respectively.Errors were infrequent, suggesting spontaneous taxonomic classification by all participants.An experiment with printed words in adults replicated results, indicating that typicality andrelatedness effects reflected organizational principles of the semantic system, not picture-re-lated processes. This research establishes the viability of an online approach to assessing auto-matic components of semantic organization in children.� 2005 Elsevier Inc. All rights reserved.
Keywords: Child development; Typicality effect; Relatedness effect; Categorization; Semantic memory;Category verification task; Underextension; Overextension; Cognitive development
0022-0965/$ - see front matter � 2005 Elsevier Inc. All rights reserved.
doi:10.1016/j.jecp.2005.04.001
* Corresponding author. Fax: +1 972 883 2491.E-mail address: [email protected] (S. Jerger).
J. Experimental Child Psychology 92 (2005) 46–75
www.elsevier.com/locate/jecp

Introduction
Successful communication is based on a critical cognitive skill, namely categoriza-tion. To use language, children must learn that words label groups or categories ofobjects with common properties. One theory proposing a close interrelation, at leastin toddlers, between early naming abilities and categorization, but not other areas ofcognition, is the specificity hypothesis (e.g., Gopnik & Meltzoff, 1986). Gopnik andMeltzoff (1992) suggested a reciprocal relation in which categorization abilities pro-vide support for learning words and word-learning skills provide support for catego-rizing objects. Some factors underlying development of categorization are increasing(a) refinement of systematically organized world knowledge and belief systems and(b) appreciation of different types of structural and functional properties and resem-blances, their regularities, and their interdependencies (Barrett, Abdi, Murphy, &Gallagher, 1993; Neisser, 1989).
Structure of semantic memory
Knowledge of object categories in semantic memory, our accumulated knowledgeof basic meanings and facts, is assumed to have a hierarchical taxonomic structure inadults (Medin, Ross, & Markman, 2005). For example, in a fully developed systemof knowledge, the words shirt and clothing are represented at different taxonomic lev-els of categorization labeled basic and superordinate, respectively. Members of basic-level categories are structurally more similar than members of superordinate-levelcategories, perhaps explaining the long-held view that children appreciate basic-levelgroupings developmentally earlier than they do superordinate-level groupings(Rosch, Mervis, Gray, Johnson, & Boyes-Braem, 1976; but see also Mandler, Bauer,& McDonough, 1991).
Development of children�s appreciation of taxonomic structure is not unequiv-ocally established. One school of investigators (e.g., Nelson, 1996) proposes thatclassifications on the basis of functional or thematic script-based relations (e.g.,dress–girl) precede classifications on the basis of taxonomic relations (e.g., dress–pants). Nelson (1996) reported that hierarchical category organization is not wellestablished until the early school years. A developmental shift from thematic totaxonomic modes of response has been observed on a variety of tasks (Fivush,1989; Lucariello, Kyratzis, & Nelson, 1992; Nelson, 1996). In contrast to thisviewpoint, another school of investigators (e.g., Waxman & Namy, 1997) pro-poses that thematic and taxonomic modes of classification develop more concur-rently. Neither classification mode is considered to be preferred by children;instead, children are assumed to adjust their mode of classification dependingon the task, stimuli, context, instructions, and perhaps even the category itself(Blewitt & Toppino, 1991; Pena, Bedore, & Zlatic-Giunta, 2002; Waxman &Namy, 1997). Despite differing theoretical stances, it is nonetheless the case thatclassifying on the basis of taxonomic relations becomes increasingly sophisticatedand prevalent across tasks as age increases up to the preteen years (for a discus-sion, see Bjorklund, 2005).
S. Jerger, M.F. Damian / Journal of Experimental Child Psychology 92 (2005) 46–75 47

Typicality effect
The internal structure of category knowledge in semantic memory is also as-sumed to have an organizing principle in adults (Rosch, 1973). One prevalent the-ory, termed probabilistic or prototype theory (Medin et al., 2005), proposes thatorganization is based on the properties characterizing many, but not all, members(e.g., ‘‘wings’’ and ‘‘flies’’ for birds). The distribution of a category�s characteristicproperties varies among members, and members with a higher frequency of charac-teristic properties are viewed as more typical. Typical members form the basis forabstracting the category�s prototype. Differences in typicality influence both adults�and children�s performance on a range of tasks, termed the typicality effect (Medinet al., 2005). In adults, for example, typical examples of a category exhibit prefer-ential processing (faster reaction times and fewer errors) compared with atypicalexamples. In children, typical items are classified as members of a category devel-opmentally earlier than are atypical items (Mervis, 1989; Whitney & Kunen,1983). Developmental changes in category membership may again be observedup to the preadolescent years and may reflect children�s increasing (a) specificationof the properties characterizing a category; (b) appreciation of the statistical regu-larities of, and intercorrelations among, properties; and (c) realization that someproperties are more important to membership than are others (Duncan & Kellas,1978; Keller, 1982; Schwanenflugel, Guth, & Bjorklund, 1986; Younger & Mekos,1992).
Relatedness effect
In addition to assuming that a category�s characteristic properties are distributedunevenly among members, it is assumed that a category�s properties are not exclu-sive; that is, they may be found in other categories as well (e.g., ‘‘wings’’ and ‘‘flying’’are properties of both birds and bats). When different categories share properties, theboundaries between them can become fuzzy. Fuzzy category boundaries influenceperformance on a variety of tasks. For example, on a yes/no category verificationtask in adults (vote ‘‘yes’’ if object is a bird), performance is more difficult (slowerreaction times and increased errors) for out-of-category objects that share someproperties with category objects (e.g., bat), termed the relatedness effect (Medin etal., 2005). On category generation tasks in children, a greater diversity of member-ship may be observed, with related out-of-category objects included as categorymembers (Rosner & Hayes, 1977). Overall, the patterns of results in young childrenseem to reflect both ‘‘underextension’’ (including only typical objects) and ‘‘overex-tension’’ (including related out-of-category objects), leading to the seemingly disso-nant outcome of more limited, yet broader, category membership (Nelson, 1974). Itdoes not seem to be sufficiently clear in the literature whether underextension andoverextension phenomena in category development occur in sequential, simulta-neous–independent (some 6-year-olds show underextension, whereas others showoverextension), or simultaneous–conjugate (one 6-year-old shows both types of er-rors) manners.
48 S. Jerger, M.F. Damian / Journal of Experimental Child Psychology 92 (2005) 46–75

Category verification task and predicted patterns of results
The purpose of this research was to investigate development of children�s under-standing of a manmade, structurally dissimilar category, ‘‘clothing,’’ and the rolesthat category typicality and out-of-category relatedness play in this development.The approach was a category verification task (push ‘‘yes’’ button if pictured ob-ject is clothing and ‘‘no’’ button if it is not clothing) assessing two well-studiedphenomena that affect the speed and accuracy of lexical–semantic processing inadults: typicality and relatedness effects. Stimuli were typical and atypical categoryobjects (e.g., pants, glove) and related and unrelated out-of-category objects (e.g.,necklace, soup). We selected speeded category verification because results may beless influenced, at least to some extent, by developmental differences in higher levelprocesses such as reasoning (McRae, de Sa, & Seidenberg, 1997). Some previousinvestigators (e.g., Nation & Snowling, 1999) have stressed that tasks with lessdependence on higher level conscious processes may offer stronger evidence ofthe true status of semantic knowledge. We view speeded verification as ‘‘interme-diate’’ between ‘‘online’’ and ‘‘offline’’ procedures in that it requires meta-knowl-edge (offline) but at the same time assesses automatic components of semanticorganization (online).
We addressed four primary questions. One was whether variations in typicalityand relatedness influence children�s correct classifications. The proposal that chil-dren�s categories are initially composed of typical objects and only later broadento incorporate atypical objects predicts that error rates should be less, and reactiontimes should be faster, for typical category objects than for atypical ones. Further-more, error rates and reaction times should improve more with age for atypicalitems as category membership develops more fully. The relatedness effect, in con-trast, suggests more diverse category membership due to fuzzy category boundaries.This phenomenon seems akin to young children�s tendency to overextend words be-yond their correct meanings (e.g., calling all four-legged pets ‘‘dogs’’) (Kuczaj,1982). To the extent that the concept of overextension generalizes to categoryknowledge, as suggested by some previous studies (Anglin, 1977; Nelson, 1974; Ros-ner & Hayes, 1977), we predict that category boundaries will be overextended inyounger children, particularly for related out-of-category objects that share proper-ties with category objects. In other words, clothing might be overextended to includeall objects worn on the body (e.g., eyeglasses). From this viewpoint, (a) error ratesshould be less, and reaction times should be faster, for unrelated out-of-category ob-jects than for related ones; and (b) error rates and reaction times should improvemore with age for related out-of-category items as category membership becomesspecified more fully.
Another question concerned whether underextension and overextension behav-iors on a classification task reflect a sequential or simultaneous manner of develop-ment. If the manner is sequential (underextension followed by overextension), errorsfor related out-of-category objects should be less common in younger children thanin older children. If the manner is simultaneous–independent, errors for both atyp-ical category objects and related out-of-category objects should be higher in child
S. Jerger, M.F. Damian / Journal of Experimental Child Psychology 92 (2005) 46–75 49
groups, but individual children will show only one type of error. Finally, if the man-ner is simultaneous–conjugate, errors for both atypical category objects and relatedout-of-category objects should be higher in children and observed in the same chil-dren. These children would be showing undersized, yet more diverse, categorymemberships.
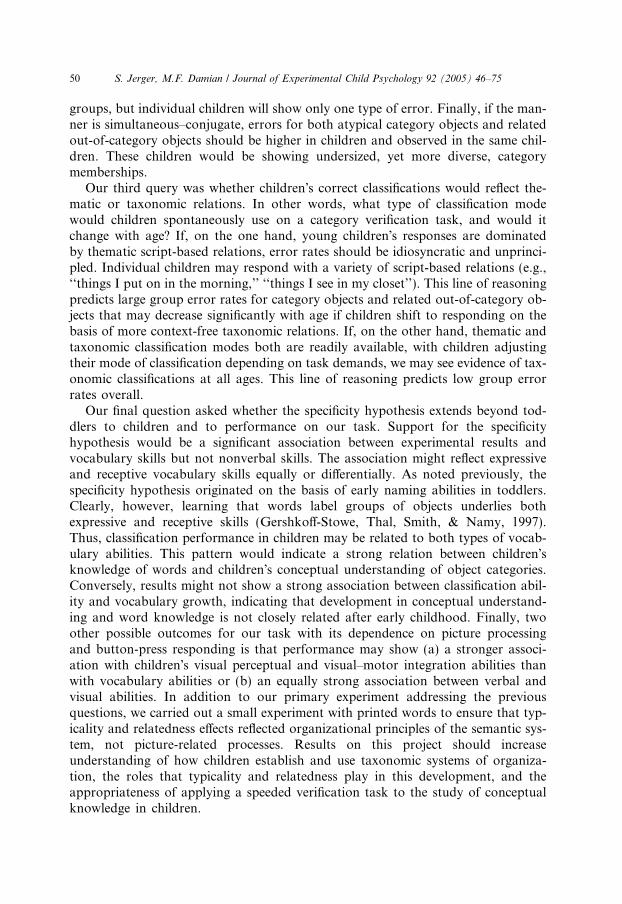
Our third query was whether children�s correct classifications would reflect the-matic or taxonomic relations. In other words, what type of classification modewould children spontaneously use on a category verification task, and would itchange with age? If, on the one hand, young children�s responses are dominatedby thematic script-based relations, error rates should be idiosyncratic and unprinci-pled. Individual children may respond with a variety of script-based relations (e.g.,‘‘things I put on in the morning,’’ ‘‘things I see in my closet’’). This line of reasoningpredicts large group error rates for category objects and related out-of-category ob-jects that may decrease significantly with age if children shift to responding on thebasis of more context-free taxonomic relations. If, on the other hand, thematic andtaxonomic classification modes both are readily available, with children adjustingtheir mode of classification depending on task demands, we may see evidence of tax-onomic classifications at all ages. This line of reasoning predicts low group errorrates overall.
Our final question asked whether the specificity hypothesis extends beyond tod-dlers to children and to performance on our task. Support for the specificityhypothesis would be a significant association between experimental results andvocabulary skills but not nonverbal skills. The association might reflect expressiveand receptive vocabulary skills equally or differentially. As noted previously, thespecificity hypothesis originated on the basis of early naming abilities in toddlers.Clearly, however, learning that words label groups of objects underlies bothexpressive and receptive skills (Gershkoff-Stowe, Thal, Smith, & Namy, 1997).Thus, classification performance in children may be related to both types of vocab-ulary abilities. This pattern would indicate a strong relation between children�sknowledge of words and children�s conceptual understanding of object categories.Conversely, results might not show a strong association between classification abil-ity and vocabulary growth, indicating that development in conceptual understand-ing and word knowledge is not closely related after early childhood. Finally, twoother possible outcomes for our task with its dependence on picture processingand button-press responding is that performance may show (a) a stronger associ-ation with children�s visual perceptual and visual–motor integration abilities thanwith vocabulary abilities or (b) an equally strong association between verbal andvisual abilities. In addition to our primary experiment addressing the previousquestions, we carried out a small experiment with printed words to ensure that typ-icality and relatedness effects reflected organizational principles of the semantic sys-tem, not picture-related processes. Results on this project should increaseunderstanding of how children establish and use taxonomic systems of organiza-tion, the roles that typicality and relatedness play in this development, and theappropriateness of applying a speeded verification task to the study of conceptualknowledge in children.
50 S. Jerger, M.F. Damian / Journal of Experimental Child Psychology 92 (2005) 46–75
Experiment 1
Method
Participants
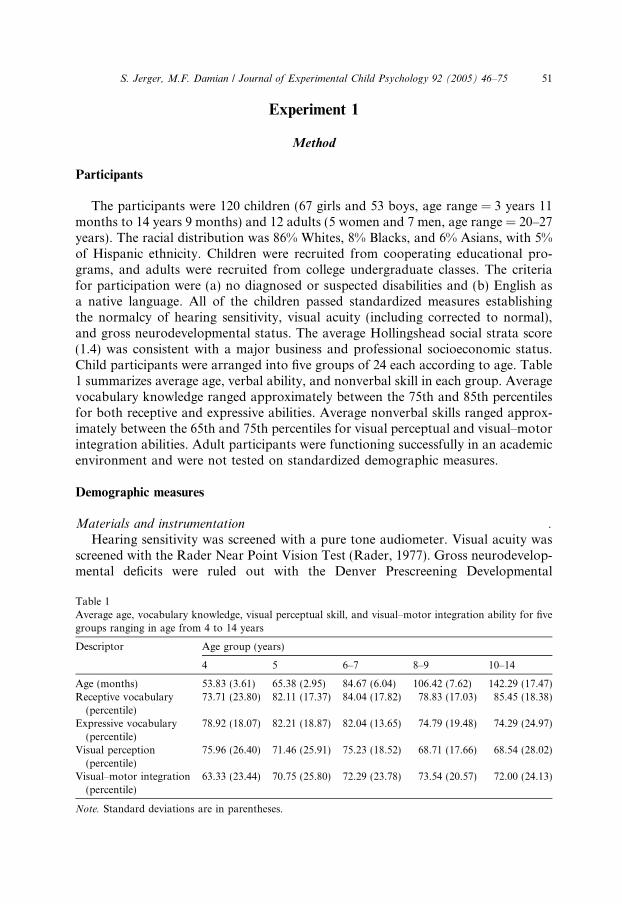
The participants were 120 children (67 girls and 53 boys, age range = 3 years 11months to 14 years 9 months) and 12 adults (5 women and 7 men, age range = 20–27years). The racial distribution was 86% Whites, 8% Blacks, and 6% Asians, with 5%of Hispanic ethnicity. Children were recruited from cooperating educational pro-grams, and adults were recruited from college undergraduate classes. The criteriafor participation were (a) no diagnosed or suspected disabilities and (b) English asa native language. All of the children passed standardized measures establishingthe normalcy of hearing sensitivity, visual acuity (including corrected to normal),and gross neurodevelopmental status. The average Hollingshead social strata score(1.4) was consistent with a major business and professional socioeconomic status.Child participants were arranged into five groups of 24 each according to age. Table1 summarizes average age, verbal ability, and nonverbal skill in each group. Averagevocabulary knowledge ranged approximately between the 75th and 85th percentilesfor both receptive and expressive abilities. Average nonverbal skills ranged approx-imately between the 65th and 75th percentiles for visual perceptual and visual–motorintegration abilities. Adult participants were functioning successfully in an academicenvironment and were not tested on standardized demographic measures.
Demographic measures
Materials and instrumentation .
Hearing sensitivity was screened with a pure tone audiometer. Visual acuity wasscreened with the Rader Near Point Vision Test (Rader, 1977). Gross neurodevelop-mental deficits were ruled out with the Denver Prescreening Developmental
Table 1Average age, vocabulary knowledge, visual perceptual skill, and visual–motor integration ability for fivegroups ranging in age from 4 to 14 years
Descriptor Age group (years)
4 5 6–7 8–9 10–14
Age (months) 53.83 (3.61) 65.38 (2.95) 84.67 (6.04) 106.42 (7.62) 142.29 (17.47)Receptive vocabulary(percentile)
73.71 (23.80) 82.11 (17.37) 84.04 (17.82) 78.83 (17.03) 85.45 (18.38)
Expressive vocabulary(percentile)
78.92 (18.07) 82.21 (18.87) 82.04 (13.65) 74.79 (19.48) 74.29 (24.97)
Visual perception(percentile)
75.96 (26.40) 71.46 (25.91) 75.23 (18.52) 68.71 (17.66) 68.54 (28.02)
Visual–motor integration(percentile)
63.33 (23.44) 70.75 (25.80) 72.29 (23.78) 73.54 (20.57) 72.00 (24.13)
Note. Standard deviations are in parentheses.
S. Jerger, M.F. Damian / Journal of Experimental Child Psychology 92 (2005) 46–75 51

Questionnaire (DPDQ) (Frankenburg, Doorninck, Liddell, & Dick, 1976) and/oreducational histories. Socioeconomic status was estimated with the Hollingsheadfour-factor index (Hollingshead, 1975). Vocabulary skills were estimated with thePeabody Picture Vocabulary Test–III (Dunn & Dunn, 1997) and the ExpressiveVocabulary Test (Williams, 1997). Visual perception was assessed with the SouthernCalifornia Figure–Ground Visual Perception Test (Ayres, 1978) in children 8 yearsof age or under and with the Block Design subtest of the Wechsler Intelligence Scalefor Children–Revised (Wechsler, 1974) in children 9 to 14 years of age. Visual–motorskills were estimated with the Developmental Test of Visual Motor Integration(VMI) (Beery, 1989).
Procedure .
The battery of tests was administered in a random order with two exceptions. Theexpressive vocabulary test always preceded the receptive vocabulary test. The VMIwas always the first test because it seemed to be a helpful tool for establishing rap-port. The standardized measures were administered and scored according to recom-mended techniques. Operational definitions for normalcy were as follows:
• Hearing sensitivity—bilaterally symmetrical thresholds of less than or equal to20 dB hearing level at test frequencies between 500 and 4000 Hz on both ears(American National Standards Institute, 1989)
• Visual acuity—seven of eight targets correct on the Near Point Vision Test at 20/25 Snellen acuity (including participants with corrected vision)
• Gross neurodevelopmental status—within the pass criteria for the child�s age on theDPDQ or the educational histories
Materials and instrumentation
Development of items .Colored pictures of 32 concrete nouns from young children�s vocabularies, repre-
senting clothing and ‘‘not clothing’’ items, were gathered from a variety of resources(Berman, Friedman, Hamberger, & Snodgrass, 1989; Cycowicz, Friedman, Roth-stein, & Snodgrass, 1997; Thomsen, 1982; York, 1995). Clothing items were chosenfrom category norms (Posnansky, 1978; Shapiro & Palermo, 1970; van Overschelde,Rawson, & Dunlosky, 2004) and were selected to represent a range of goodness-of-example ratings (Rosch, 1975). Not clothing items were chosen from not clothingcategory norms and were selected to represent related and unrelated objects relativeto clothing. Unrelated objects represented categories such as food and animals, andrelated objects represented categories such as accessories and fastening or assistivedevices. In a pilot study, we ensured that children could ‘‘read’’ the pictures (i.e., theyconsistently elicited correct naming responses).
The names of the pictures, randomly formed into four different lists, were shownto 50 college undergraduates. The participants were instructed as follows (after Arm-strong, Gleitman, & Gleitman, 1999; Rosch, 1975):
52 S. Jerger, M.F. Damian / Journal of Experimental Child Psychology 92 (2005) 46–75
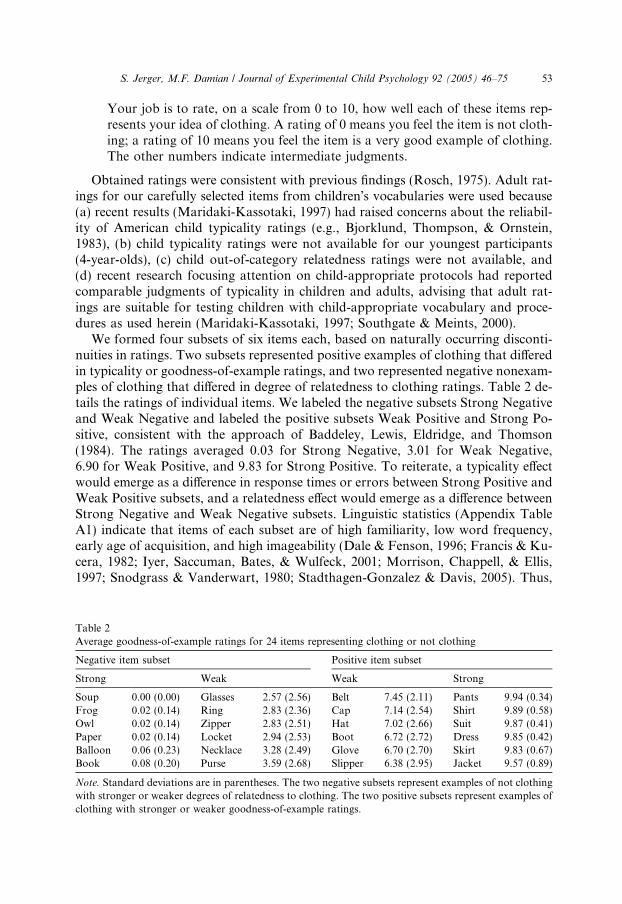
Your job is to rate, on a scale from 0 to 10, how well each of these items rep-resents your idea of clothing. A rating of 0 means you feel the item is not cloth-ing; a rating of 10 means you feel the item is a very good example of clothing.The other numbers indicate intermediate judgments.
Obtained ratings were consistent with previous findings (Rosch, 1975). Adult rat-ings for our carefully selected items from children�s vocabularies were used because(a) recent results (Maridaki-Kassotaki, 1997) had raised concerns about the reliabil-ity of American child typicality ratings (e.g., Bjorklund, Thompson, & Ornstein,1983), (b) child typicality ratings were not available for our youngest participants(4-year-olds), (c) child out-of-category relatedness ratings were not available, and(d) recent research focusing attention on child-appropriate protocols had reportedcomparable judgments of typicality in children and adults, advising that adult rat-ings are suitable for testing children with child-appropriate vocabulary and proce-dures as used herein (Maridaki-Kassotaki, 1997; Southgate & Meints, 2000).
We formed four subsets of six items each, based on naturally occurring disconti-nuities in ratings. Two subsets represented positive examples of clothing that differedin typicality or goodness-of-example ratings, and two represented negative nonexam-ples of clothing that differed in degree of relatedness to clothing ratings. Table 2 de-tails the ratings of individual items. We labeled the negative subsets Strong Negativeand Weak Negative and labeled the positive subsets Weak Positive and Strong Po-sitive, consistent with the approach of Baddeley, Lewis, Eldridge, and Thomson(1984). The ratings averaged 0.03 for Strong Negative, 3.01 for Weak Negative,6.90 for Weak Positive, and 9.83 for Strong Positive. To reiterate, a typicality effectwould emerge as a difference in response times or errors between Strong Positive andWeak Positive subsets, and a relatedness effect would emerge as a difference betweenStrong Negative and Weak Negative subsets. Linguistic statistics (Appendix TableA1) indicate that items of each subset are of high familiarity, low word frequency,early age of acquisition, and high imageability (Dale & Fenson, 1996; Francis & Ku-cera, 1982; Iyer, Saccuman, Bates, & Wulfeck, 2001; Morrison, Chappell, & Ellis,1997; Snodgrass & Vanderwart, 1980; Stadthagen-Gonzalez & Davis, 2005). Thus,
Table 2Average goodness-of-example ratings for 24 items representing clothing or not clothing
Negative item subset Positive item subset
Strong Weak Weak Strong
Soup 0.00 (0.00) Glasses 2.57 (2.56) Belt 7.45 (2.11) Pants 9.94 (0.34)Frog 0.02 (0.14) Ring 2.83 (2.36) Cap 7.14 (2.54) Shirt 9.89 (0.58)Owl 0.02 (0.14) Zipper 2.83 (2.51) Hat 7.02 (2.66) Suit 9.87 (0.41)Paper 0.02 (0.14) Locket 2.94 (2.53) Boot 6.72 (2.72) Dress 9.85 (0.42)Balloon 0.06 (0.23) Necklace 3.28 (2.49) Glove 6.70 (2.70) Skirt 9.83 (0.67)Book 0.08 (0.20) Purse 3.59 (2.68) Slipper 6.38 (2.95) Jacket 9.57 (0.89)
Note. Standard deviations are in parentheses. The two negative subsets represent examples of not clothingwith stronger or weaker degrees of relatedness to clothing. The two positive subsets represent examples ofclothing with stronger or weaker goodness-of-example ratings.
S. Jerger, M.F. Damian / Journal of Experimental Child Psychology 92 (2005) 46–75 53

any performance differences between subsets should not be reflecting differences inlinguistic variables. None of the 50 college students who rated the items participatedin the experiment.
Instrumentation .The colored pictures were scanned into a computer and edited to achieve objects
of a similar size and complexity on a white background. We carefully edited the pic-tures to minimize within-category visual similarity, attempting to eliminate, or atleast reduce, any influence of shared visual features among category items on judg-ments (Snodgrass & McCullough, 1986). Pictures were presented via a computermonitor, mounted on an adjustable-height table directly in front of the participant,at a distance of approximately 90 cm. The primary dependent measure, reactiontime, was defined by the time between the onset of the picture and the executionof a motor response. The computer triggered a counter/timer with 1-ms resolutionat the initiation of a picture. Pressure on either one of two response (telegraph) keys(J4-820, GC Electronics) stopped the counter/timer. The response keys weremounted on a board and were separated by a distance of 12 cm. A picture, definingthe correct response, was mounted above each response button. A ‘‘happy’’ face de-fined the button to be pushed if the picture was clothing, and a ‘‘sad’’ face defined thebutton to be pushed if the picture was not clothing. Blue circles, 21
2cm to the outside
and 212cm below each response button, designated the ‘‘start’’ positions that each
hand assumed before a trial.
Procedure
Testing was carried out within a dimly lit, 12 · 14-ft, double-walled, sound-trea-ted booth. The participant was seated at a child- or adult-sized table, and the com-puter monitor was adjusted to eye level. One tester sat at the computer console toadminister the experiment. Another tester sat alongside each child participant, keep-ing him or her focused on the task and ensuring that the child�s hand was on the startposition prior to each trial.
Individual pictures were presented randomly within one unblocked condition,with the constraint that sequences of pictures representing a specific subset were lim-ited to no more than two items in succession before rotating. Participants were in-structed to push the ‘‘happy face’’ button if the picture was clothing, or to pushthe ‘‘sad face’’ button if the picture was not clothing, as quickly and accurately aspossible using a whole-hand response. The assignment (right side vs. left side) of hap-py and sad faces was counterbalanced across participants. The right- and left-sideresponse buttons were pushed by the right and left hands, respectively. The pictureremained in view until the participant responded. When the participant was judgedto be ready, the tester initiated a trial by pushing the space bar out of sight of theparticipant.
Prior to the experimental category verification procedure, we administered a sim-ple visual reaction time test and practice trials. The purpose of the simple reactiontime task was to quantify the participant�s ability to detect and respond to visual
54 S. Jerger, M.F. Damian / Journal of Experimental Child Psychology 92 (2005) 46–75

input. The target was always the picture ‘‘ball.’’ Only one response button, counter-balanced across participants, was labeled as the predetermined correct response. Theparticipant placed the hand corresponding to the response button on the start posi-tion prior to each trial. The target picture was presented on the computer screen,again by the tester�s pushing the space bar. The participant was instructed to pushthe response key as quickly as possible, again using a whole-hand response, whenhe or she detected the picture. Performance was defined by the average of 12 trialsafter excluding outlier trials.
Practice trials required participants to classify pictures presented on the computerscreen as pets or ‘‘not pets.’’ The positive targets were cat–dog (Strong Positive) andparrot–fish (Weak Positive), and the negative targets were lion–squirrel (Weak Neg-ative) and lipstick–peanuts (Strong Negative). All participants performed this taskwithout difficulty.
Data analysis
The total number of missing reaction times due to flawed trials (e.g., hand not onstart position prior to response) represented 3% of overall trials, ranging from 5% inthe 4-year-old group to 1% in the 10- to 14-year-old and 20-year-old groups. Flawedtrials characterized all of the item subsets to approximately the same degree. The to-tal number of missing reaction times due to errors of classification represented 11%of all observations, ranging from 17% in the 4-year-old group to 1% in the 20-year-old group. Error rates varied across item subsets. They were typically observed forWeak Negative and Weak Positive subsets. Overall, 14% of reaction times were miss-ing due to flawed trials or errors. Average reaction times for each item subset could,nonetheless, be obtained for all participants except six children who misclassified allWeak Positive or Weak Negative items (two 4-year-olds, two 8- or 9-year-olds, one6- or 7-year-old, and one 10- to 14-year-old). Primary dependent measures for indi-viduals were mean adjusted reaction times for correct trials and number of errors asa function of item subset. Reaction times and error rates were analyzed by multipleregression techniques, including analysis of variance (ANOVA) by regression(Pedhazur, 1982). Missing data in the six children (approximately 1% of Weak Po-sitive and 3% of Weak Negative observations) were replaced by predicted valuesfrom the regression equation for the age group. Error rates were also analyzed bydistribution-free techniques, specifically the Kruskal–Wallis ANOVA techniqueacross age groups and the Friedman test across item subsets (Siegel & Castellan,1988). Outcomes for parametric and distribution-free analyses were comparable (lat-ter results not reported). The appropriateness of the ANOVA technique for dichot-omous variables (correct vs. incorrect) has been established previously for samples ofour size (Edwards, 1985). The family-wise alpha level was controlled by the Bonfer-roni–Holm step-down procedure (Holm, 1979).
Finally, canonical correlation analysis (Pedhazur, 1982) was carried out to exam-ine the relation between the set of category verification reaction times/errors and theset of demographic measures (e.g., age, verbal skills, nonverbal abilities). The basicidea of canonical analysis is to weight differentially the variables of two composite
S. Jerger, M.F. Damian / Journal of Experimental Child Psychology 92 (2005) 46–75 55

sets to optimize the correlation (termed canonical correlation, Rc). The analysisyields a set of factor loadings, called structure coefficients, whose magnitudes maybe used to interpret the contributions of individual variables, as in factor analysis.More than one canonical correlation may be obtained, with each one representingan orthogonally separate pattern of relation between the two sets of variables. Thefirst Rc always accounts for the largest source of variation in the data, the secondRc accounts for the second largest source of variance, and so forth. Wilks� lambdais used to test the significance of each Rc.
Results
Reaction times
Simple visual reaction time .Simple visual reaction time decreased significantly with increasing age,
F (1,130) = 56.38, p < .0001. Relative to results in the 20-year-olds (368 ms), simplereaction times were slowed by approximately 420 ms in the 4-year-olds, 225 ms in the5-year-olds, 155 ms in the 6- and 7-year-olds, 80 ms in the 8- and 9-year-olds, and30 ms in the 10- to 14-year-olds. Similar age-linked changes in reaction time havebeen reported for decades (Goodenough, 1935; Jerger, Martin, & Pirozzolo, 1988).The decrease in the current participants was approximately �1.4 ms/month, withage predicting approximately 30% of the variability in reaction times. To controlfor developmental differences in detecting and responding to stimuli, and to rendereffects due to information processing clearer, we subtracted each participant�s simplereaction time from all of his or her experimental choice reaction time measures (Don-ders, 1869/1969; Jerger, Pearson, & Spence, 1999).
Categorical verification adjusted reaction times .
Fig. 1 shows adjusted reaction times for the age groups as a function of item sub-set. Statistical analysis of the data included one between factor (age group) and twowithin factors (type of response [negative or positive] and type of item [strong orweak]). Results indicate that overall classification times showed significant age-re-lated decline, F (5,126) = 24.04, p < .0001. Performance as a whole averagedapproximately 1165 ms in 4-year-olds, 995 ms in 5- to 9-year-olds, 645 ms in10- to 14-year-olds, and 425 ms in 20-year-olds. Classification times in all groupswere significantly slower for negative responses than for positive responses,F (1,126) = 98.22, p < .0001. Overall adjusted reaction times were, on average,approximately 1000 and 745 ms for negative and positive responses, respectively.
Performance was also significantly slower for weak item subsets than for strongitem subsets, F (1,126) = 228.78, p < .0001. Table 3 summarizes the correspondingslope coefficients linking weak and strong negative and positive item subsets andstandard errors of estimate. Coefficients index the change in reaction time for eachunit change in the goodness-of-example rating. Unit change in ordinal ratings mightnot be exactly the same; however, it seems equally unlikely that they are very differ-ent. Although an ordinal scale renders slope coefficients for negative versus positive
56 S. Jerger, M.F. Damian / Journal of Experimental Child Psychology 92 (2005) 46–75
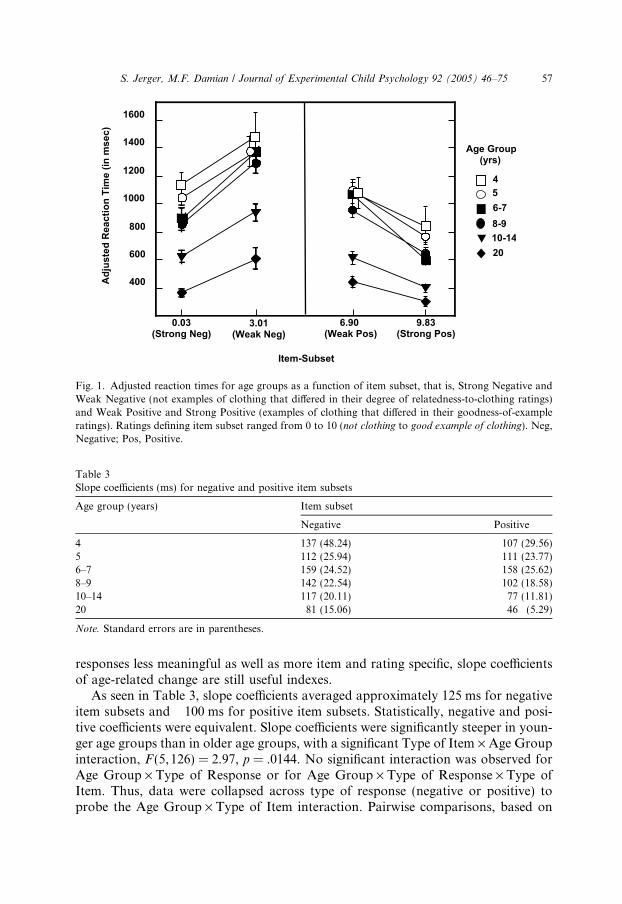
responses less meaningful as well as more item and rating specific, slope coefficientsof age-related change are still useful indexes.
As seen in Table 3, slope coefficients averaged approximately 125 ms for negativeitem subsets and �100 ms for positive item subsets. Statistically, negative and posi-tive coefficients were equivalent. Slope coefficients were significantly steeper in youn-ger age groups than in older age groups, with a significant Type of Item · Age Groupinteraction, F (5,126) = 2.97, p = .0144. No significant interaction was observed forAge Group · Type of Response or for Age Group · Type of Response · Type ofItem. Thus, data were collapsed across type of response (negative or positive) toprobe the Age Group · Type of Item interaction. Pairwise comparisons, based on
Fig. 1. Adjusted reaction times for age groups as a function of item subset, that is, Strong Negative andWeak Negative (not examples of clothing that differed in their degree of relatedness-to-clothing ratings)and Weak Positive and Strong Positive (examples of clothing that differed in their goodness-of-exampleratings). Ratings defining item subset ranged from 0 to 10 (not clothing to good example of clothing). Neg,Negative; Pos, Positive.
Table 3Slope coefficients (ms) for negative and positive item subsets
Age group (years) Item subset
Negative Positive
4 137 (48.24) �107 (29.56)5 112 (25.94) �111 (23.77)6–7 159 (24.52) �158 (25.62)8–9 142 (22.54) �102 (18.58)10–14 117 (20.11) �77 (11.81)20 81 (15.06) �46 (5.29)
Note. Standard errors are in parentheses.
S. Jerger, M.F. Damian / Journal of Experimental Child Psychology 92 (2005) 46–75 57

Bonferroni–Holm step-down adjusted p values (hereafter termed adjusted p values),indicate that average slopes were significantly steeper in all child groups relative to20-year-olds. Slopes were significantly steeper in 6- and 7-year-olds and 8- and 9-year-olds relative to 10- to 14-year-olds as well as in 6- and 7-year-olds relative to8- and 9-year-olds. Although each pairwise contrast did not achieve significance, asystematic trend was for slopes to become less steep with increasing age.
Relation between adjusted reaction times and demographic measures .
A canonical correlation analysis was carried out to examine the relation betweenthe set of adjusted reaction times for item subsets (Fig. 1) and the set of demographicvariables (Table 1). Results, summarized in Table 4, indicate that (a) the first canonicalcorrelation was significant, Rc1 = .637, Wilks� lambda = .497, F (20) = 3.936,p < .001, and (b) the second canonical correlation approached significance,Rc2 = .333, Wilks� lambda = .837, F (12) = 1.564, p = .102. Results suggest that twoindependent factors significantly affected the relation between the two sets of variables.
The columns in Table 4 present structure coefficients, or canonical factor load-ings, for the sets of indexes. Again, structure coefficients provide an estimate ofthe relative importance of each variable associated with the canonical correlation.Examination of the structure coefficients for the first Rc1 (first column) indicates thatclassification times for all of the item subsets were significantly associated with ageand general age-dependent factors. As seen in Fig. 1 and Tables 1 and 3, both abso-lute and relative classification times decreased significantly as age and age-dependentverbal and nonverbal skills increased.
Examination of the structure coefficients for the second Rc2 (second column) sug-gests that visual perceptual skill was a significant independent contributor to classi-fication times for Strong Positive items. Unexpectedly, both structure coefficientswere positive, suggesting that Strong Positive classification times were slower in somechildren with advanced visual perceptual ability. To examine this association, we
Table 4Canonical correlation analysis between set of adjusted reaction times for item subsets and set ofdemographic measures
Index Canonical correlation
Rc = .637 = .333Structure coefficients
Strong Negative RT �.870* .195Weak Negative RT �.634* .372Weak Positive RT �.861* �.376Strong Positive RT �.714* .592*
Receptive vocabulary .928* �.153Expressive vocabulary .817* �.065Visual–motor integration .865* �.144Visual perception .797* .328*
Age .981* .070
Note. RT, reaction time.* Indicates relatively high within-set canonical factor loading.
58 S. Jerger, M.F. Damian / Journal of Experimental Child Psychology 92 (2005) 46–75

grouped children according to visual perceptual ability and adjusted reaction time.Results for the latter grouping are reported because the association was more readilytransparent. The adjusted reaction time grouping, based on scatterplots of the data,segregated children whose average times for Strong Positive items were either fasterthan or slower than 1000 ms.
Results in the ‘‘faster’’ subgroup (n = 112) showed (a) average age of 92 months(range = 47–177), (b) average visual perceptual skill at the 70th percentile (ran-ge = 10th–99th), and (c) average Strong Positive adjusted reaction times of 596 ms(range = 183–976). Results in the ‘‘slower’’ subgroup (n = 8, 75% boys) showed (a)younger average age of 68 months (range = 56–110), (b) stronger average visual per-ceptual skill at the 94th percentile (range = 84th–99th), and (c) slower Strong Positiveadjusted reaction times of 1185 ms (range = 1015–1420). Average error rates werelow (<1.0) in both subgroups. Vocabulary skills in the faster and slower subgroupswere similar, averaging approximately the 80th and 85th percentiles, respectively.Simple reaction times were also reasonably similar in the subgroups, averaging ap-proximately 545 ms (faster) and 600 ms (slower), suggesting that classification timesin the slower subgroup were not reflecting slowed motor function in general.
To probe the specificity of the association between Strong Positive adjusted reac-tion times and visual perceptual ability, we quantified the magnitude of the typicalityeffect (Weak Positive items minus Strong Positive items) in the faster and slower sub-groups. The typicality effect averaged 377 ms in the faster subgroup but an unusual�101 ms in the slower subgroup. Children in the slower subgroup, on average, clas-sified Weak Positive items faster than they did the Strong Positive items. In contrast,the magnitude of the average relatedness effect (Weak Negative items minus StrongNegative items) was comparable in the subgroups, 381 ms in the faster subgroup and431 ms in the slower subgroup.
In short, some children with unusually advanced visual perceptual abilitiesshowed disproportionately slowed classification times for Strong Positive items,yielding an inverse typicality effect. We should emphasize that not all children withadvanced visual perceptual skills displayed this result. Nonetheless, a few youngerchildren with advanced visual perceptual ability seemed to be using a classificationscheme that penalized classification times for Strong Positive items.
Error rates
Categorical verification errors .
Table 5 summarizes mean error in each age group for item subsets along withpercentage of total error over all trials in the groups. Statistical analysis includedone between factor (age group) and two within factors (type of response [negativeor positive] and type of item [strong or weak]). Results indicate a significant age-related decline in overall error rates, F (5,126) = 7.68, p < .0001. Percentage errorover all trials decreased from 17% in 4-year-olds to 1% in 20-year-olds. Errorsin all groups were significantly greater for negative responses than for positive re-sponses, F (1,126) = 8.52, p = .0041. Of 6 possible errors per item subset, errorswere, on average, approximately 0.84 and 0.46 for negative and positive responses,
S. Jerger, M.F. Damian / Journal of Experimental Child Psychology 92 (2005) 46–75 59

respectively. Errors were also significantly greater for weak item subsets than forstrong item subsets, F (1,126) = 218.53, p < .0001. The difference between weakand strong error rates, however, varied depending on type of response and age.First, the difference between weak and strong error rates in all groups was greaterfor negative responses than for positive responses, with a significant Type ofItem · Type of Response interaction, F (1,126) = 8.20, p = .0049. As seen in Table5, the difference between weak and strong errors was approximately 1.51 for neg-ative responses (1.60 and 0.09 for Weak Negative and Strong Negative, respec-tively) and 0.79 for positive responses (0.85 and 0.06 for Weak Positive andStrong Positive, respectively).
Second, the difference between weak and strong error rates varied significantly asa function of age, with a significant Type of Item · Age Group interaction,F (5,126) = 5.20, p = .0002. The differences between weak and strong errors wereapproximately 1.42 in 4- to 9-year-olds, 1.06 in 10- to 14-year-olds, and 0.12 in20-year-olds. Although the greatest error rate was typically observed in 4-year-olds,all child groups showed higher error rates for the Weak Negative item subset. Weshould caution once again that ordinal ratings probably make error rates more itemand rating specific and, thus, may lessen the generalizability of relative errors fornegative versus positive responses.
Overextension and underextension error patterns .
To investigate children with principled patterns of error representing overexten-sion or underextension, we operationally formed two subgroups. The overextensionsubgroup consisted of children who misclassified Weak Negative objects as clothingmore than 50% of the time, and the underextension subgroup consisted of childrenwho misclassified Weak Positive objects as not clothing more than 50% of the time.Of the children, 35 (29%) met one of the criteria, with more children demonstratingoverextension (n = 23, 19%) than underextension (n = 12, 10%). Each subgroup con-tained roughly one half girls and one half boys. The incidences of overextension wereapproximately 13% of 4-year-olds, 25% of 5- to 7-year-olds, and 17% of 8- to 14-year-olds, whereas the incidences of underextension were approximately 8% of4- and 5-year-olds, 15% of 6- to 9-year-olds, and 4% of 10- to 14-year-olds. Individ-
Table 5Mean numbers of errors/participant and percentages of total errors over all trials for each age group
Age group(years)
Item Subset Percentage totalerror over all trialsStrong Negative Weak Negative Weak Positive Strong Positive
4 0.37 (9) 1.83 (44) 1.50 (36) 0.33 (8) 175 0.17 (4) 1.96 (47) 1.17 (28) 0.00 (0) 146–7 0.00 (0) 1.96 (47) 1.04 (25) 0.04 (1) 138–9 0.00 (0) 1.87 (45) 0.96 (23) 0.00 (0) 1210–14 0.00 (0) 1.71 (41) 0.42 (10) 0.00 (0) 920 0.00 (0) 0.25 (3) 0.00 (0) 0.00 (0) 1
Note. Total numbers of errors/group are in parentheses. Number of participants = 24 in child groups and12 in 20-year-old group.
60 S. Jerger, M.F. Damian / Journal of Experimental Child Psychology 92 (2005) 46–75
ually, children showed only one type of error. No child was classified in both the un-der extension and overextension categories. Performance for the complementary‘‘weak’’ item subset in overextenders and underextenders was, on average, perfect(no errors). The overall pattern of errors was consistent with a simultaneous–inde-pendent manner of development for overextension and underextension, continuingwell into the preteen years.
Relation between error patterns and demographic measures .
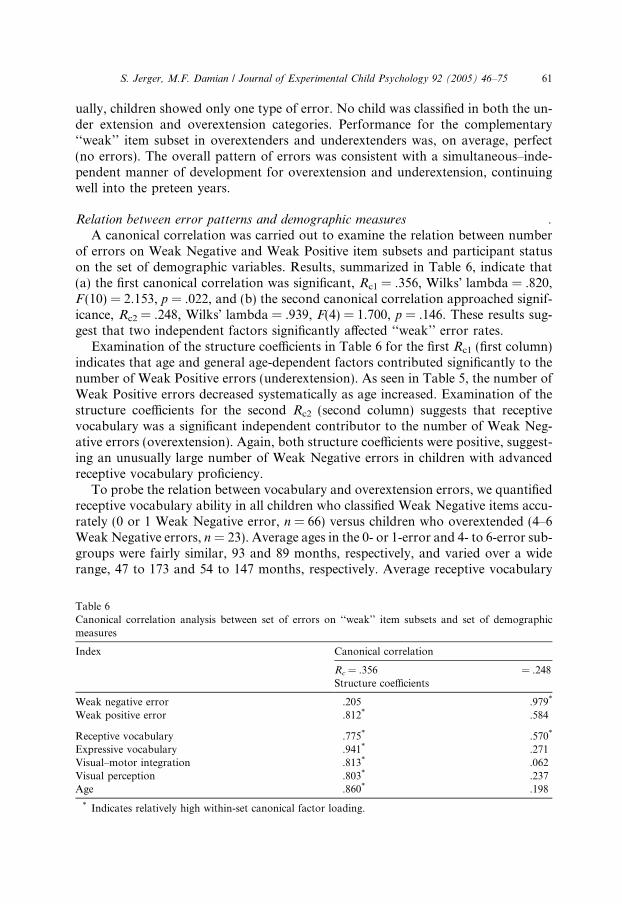
A canonical correlation was carried out to examine the relation between numberof errors on Weak Negative and Weak Positive item subsets and participant statuson the set of demographic variables. Results, summarized in Table 6, indicate that(a) the first canonical correlation was significant, Rc1 = .356, Wilks� lambda = .820,F (10) = 2.153, p = .022, and (b) the second canonical correlation approached signif-icance, Rc2 = .248, Wilks� lambda = .939, F(4) = 1.700, p = .146. These results sug-gest that two independent factors significantly affected ‘‘weak’’ error rates.
Examination of the structure coefficients in Table 6 for the first Rc1 (first column)indicates that age and general age-dependent factors contributed significantly to thenumber of Weak Positive errors (underextension). As seen in Table 5, the number ofWeak Positive errors decreased systematically as age increased. Examination of thestructure coefficients for the second Rc2 (second column) suggests that receptivevocabulary was a significant independent contributor to the number of Weak Neg-ative errors (overextension). Again, both structure coefficients were positive, suggest-ing an unusually large number of Weak Negative errors in children with advancedreceptive vocabulary proficiency.
To probe the relation between vocabulary and overextension errors, we quantifiedreceptive vocabulary ability in all children who classified Weak Negative items accu-rately (0 or 1 Weak Negative error, n = 66) versus children who overextended (4–6Weak Negative errors, n = 23). Average ages in the 0- or 1-error and 4- to 6-error sub-groups were fairly similar, 93 and 89 months, respectively, and varied over a widerange, 47 to 173 and 54 to 147 months, respectively. Average receptive vocabulary
Table 6Canonical correlation analysis between set of errors on ‘‘weak’’ item subsets and set of demographicmeasures
Index Canonical correlation
Rc = .356 = .248Structure coefficients
Weak negative error .205 .979*
Weak positive error .812* �.584
Receptive vocabulary �.775* .570*
Expressive vocabulary �.941* .271Visual–motor integration �.813* .062Visual perception �.803* .237Age �.860* .198
* Indicates relatively high within-set canonical factor loading.
S. Jerger, M.F. Damian / Journal of Experimental Child Psychology 92 (2005) 46–75 61

abilities in the 0- or 1-error and 4- to 6-error subgroups were also similar, 82nd and85th percentiles, respectively; however, the range of abilities was notably wider in the0- or 1-error subgroup than in the 4- to 6-error subgroup, 27th to 99th and 50th to99th, respectively. The range of vocabulary ability in the 4- to 6-error subgroup de-creased conspicuously as the number of Weak Negative errors increased. When re-sults were limited to children with maximum Weak Negative errors (6 errors,n = 5), for example, the average receptive vocabulary skill increased to the 96th per-centile and the range narrowed to 88th to 99th. As a comparison with the subgroup ofchildren who underextended the category (4–6 Weak Positive errors, n = 12), theirreceptive vocabulary skills averaged the 78th percentile and ranged widely, 31st to99th. We should emphasize that not all children with advanced receptive vocabularyabilities overextended the category. Nonetheless, children with pronounced overex-tension had unusually advanced receptive vocabulary abilities for their age.
Discussion
To recapitulate basic findings, performance in children on a speeded category ver-ification task showed within-category typicality effects and between-category related-ness effects. Differences between children and adults were more pronounced duringpreschool and early school years, although differences continued through early teen-age years. The relation between categorization performance and demographic vari-ables indicates that speed of classification over all item subsets and Weak Positiveerrors (underextension) were significantly associated with multifaceted age factors.Classification times for Strong Positive items and Weak Negative errors (overexten-sion), in contrast, seem to reflect independent influences of visual perceptual abilityand receptive vocabulary ability, respectively, in some children. Mean errors for itemsubsets were few.
Next, we turn to a study that addressed a possible influence on findings. Clothingobjects are considered to be a structurally dissimilar category whose members haverelatively more perceptual distinctiveness (Vitkovitch, Humphreys, & Lloyd-Jones,1993). We also edited the pictures of Experiment 1 to minimize shared visual fea-tures. It remains the case, however, that even carefully edited pictured objects ofclothing may share functional visual features, primarily reflecting body shape (e.g.,pant legs, neck openings). Thus, it seemed prudent to question whether the currentpatterns of typicality and relatedness would be observed without any pictorial visualfeatures (Damian, Vigliocco, & Levelt, 2001; Snodgrass & McCullough, 1986; Vit-kovitch et al., 1993). In Experiment 2, we eliminated, or at least minimized, the pos-sibility of participants� adopting visual matching strategies in the verification task byreplacing object stimuli with printed words. We predicted that if the typicality andrelatedness effects found in adults truly reflect organizational principles of thesemantic system, they should be found to be independent of whether items were pre-sented pictorially or in printed format. We tested adults because printed format ap-proaches to testing automatic semantic processes may be confounded in childrenwithout at least second-grade reading skills, as previously noted in studies withStroop stimuli (Fournier, Mazzarella, Ricciardi, & Fingeret, 1975).
62 S. Jerger, M.F. Damian / Journal of Experimental Child Psychology 92 (2005) 46–75

Experiment 2
Method
Participants
The participants were 12 adults (9 women and 3 men, mean age = 23 years,range = 18–39). The racial distribution was 67% Whites, 8% Blacks, and 25%Asians, with 17% of Hispanic ethnicity. A 13th participant who misclassified allWeak Negative items, and whose data were more than 2 standard deviations fromaverage performance, was eliminated from consideration. Participants were recruitedfrom college undergraduate classes. The criteria for participation were (a) no diag-nosed or suspected disabilities and (b) English as a native language. All individualspassed standardized measures establishing normal hearing sensitivity and normal orcorrected-to-normal visual acuity. Receptive vocabulary abilities ranged from the34th to 96th percentiles (M = 70th). All participants reported passing grades in allcourses.
Instrumentation and procedure
The instrumentation and procedure remained the same as in Experiment 1. Indi-vidual stimuli, however, were printed words rather than pictures.
Data analysis
The number of missing reaction times represented 9% of all trials, with 1% due toflawed trials and 8% due to errors of misclassification. Average reaction times could,nonetheless, be obtained for each item subset in all participants. Primary dependentmeasures were again mean-adjusted reaction times for correct trials and number oferrors as a function of item subset. Reaction times were analyzed by ANOVA byregression (Pedhazur, 1982). Because of the small sample size and characteristicsof the data, errors were analyzed by distribution-free techniques, specifically theFriedman test across item subsets with post hoc pairwise comparisons carried outby the Wilcoxon paired–signed rank test (Siegel & Castellan, 1988). The family-wisealpha level was again controlled by the Bonferroni–Holm step-down procedure(Holm, 1979).
Results and discussion
Reaction times
Categorical verification adjusted reaction times .
Table 7 shows average adjusted reaction times as a function of item subset. Weagain subtracted each participant�s simple reaction time (M = 446 ms) from all of
S. Jerger, M.F. Damian / Journal of Experimental Child Psychology 92 (2005) 46–75 63

his or her experimental measures. Statistical analysis of adjusted reaction times in-cluded two within factors (type of response [negative or positive] and type of item[strong or weak]). Results indicated that categorization times were significantlyslower for negative responses than for positive responses, F (1,11) = 5.32,p = .0416. Average times were 775 and 639 ms for negative and positive responses,respectively. Performance was also significantly slower for weak item subsets thanfor strong item subsets, F (1,11) = 31.51, p = .0002. Slope coefficients linking weakand strong item subsets for negative and positive responses, however, did not differsignificantly. Coefficients (with standard errors in parentheses) were 160 ms (22.08)for negative item subsets and �107 ms (19.14) for positive item subsets. In compar-ison with adult results of Experiment 1 (Fig. 1), reaction times in Experiment 2 wereslower. This finding is consistent with previous results (e.g., Rosch, 1975) reportingslower response times to words than to pictures.
Error rates
Categorical verification errors .
Errors in Experiment 2 were few. Table 7 presents the mean numbers of errors tofacilitate comparison with results in Experiment 1. The median numbers of errorswere 1 for Weak Negative subset and 0 for all other subsets. To assess differencesin errors due to typicality and relatedness, statistical analyses were conducted withone within factor (item subset), and obtained Friedman chi-square values were cor-rected for tied observations. Results indicate that error rates differed significantlyacross item subsets, corrected v2(3, N = 12) = 15.34, p = .0015. Pairwise compari-sons, based on adjusted p values, indicate that the number of errors was significantlygreater for Weak Negative subset than for Strong Negative and Strong Positive sub-sets. The number of errors did not differ significantly between Weak Negative andWeak Positive subsets. There were no errors for Strong Negative and Strong Positivesubsets.
Overall findings of Experiment 2 agree with results of Experiment 1. Clearly, onemust be cautious in predicting results in children from performance in adults. Find-ings suggest, nevertheless, that categorical effects on performance are observed evenwhen visual similarity effects among within-category pictorial stimuli are reduced,agreeing with previous observations (Damian et al., 2001).
Table 7Average adjusted reaction times (ms) and mean numbers of errors/participant as a function of item subsetfor printed word stimuli
Metric Item Subset
Strong Negative Weak Negative Weak Positive Strong Positive
Reaction time 537 (48.14) 1014 (109.92) 797 (110.82) 482 (49.72)Errors 0.00 (0) 1.25 (15) 0.67 (8) 0.00 (0)
Note. In the reaction times line, standard errors are in parentheses. In the errors line, total numbers oferrors/group are in parentheses.
64 S. Jerger, M.F. Damian / Journal of Experimental Child Psychology 92 (2005) 46–75

General discussion
Typicality effect
Children�s performance on a category verification task was significantly influ-enced by within-category typicality. Compared with atypical objects, typical ob-jects of the category exhibited preferential processing (faster reaction times andfewer errors), even by children as young as 4 years of age. Results agree with pre-vious findings in elementary school children and adults (Baddeley et al., 1984;Duncan & Kellas, 1978; Ellis & Nelson, 1999; Schaeffer & Wallace, 1969). Withregard to age-related change, the slopes relating Weak Positive and Strong Posi-tive items became significantly less steep with increasing age. Reaction times im-proved more with age for atypical items as category membership developed morefully. The pattern of results is consistent with observations in children age 9 yearsor over (Ford & Keating, 1981) and suggests that typical objects are more easilyaccessed and/or retrieved than are atypical objects (Kail & Nippold, 1984; Rosch,1973).
With regard to errors, variations in typicality seemed to be more important tothe correct classifications of children than to those of adults. Whereas adults wereequally accurate in classifying typical and atypical items, children were more accu-rate at classifying typical items. This finding agrees with Bauer, Dow, and Hertsg-aard�s (1995) observation of better categorization of typical objects by toddlers ona manipulation task. Greater developmental change in classifying atypical objectsaccurately may reflect improved specification of the properties characterizing acategory, greater appreciation of the interdependencies and regularities amongproperties, and increased realization that some properties are more importantto membership than are others. This pattern may also be related to younger chil-dren�s immaturities in selective attention and inhibition (Bjorklund, 2005). Rela-tive to typical members of a category, atypical members have a lowerfrequency of characteristic properties. Younger children may have more difficultyin selecting and attending to these relevant properties and in inhibiting otherproperties.
Overall data support the theory that children�s categories are initially more nar-rowly defined in terms of typical objects and only later broaden to incorporateatypical objects. To the extent that slope coefficients are indexes of the efficiencyof access to and retrieval from lexical–semantic memory along with postretrievaldecision processes (Baddeley et al., 1984; Ford & Keating, 1981), our data indi-cate significant age-related improvements in efficiency of lexical–semanticprocessing.
A new finding of this research was the presence of an unusual inverse typicalityeffect in some children. Although results did not achieve statistical significance, thetrend and actual data were sufficient to raise doubts about ignoring the finding. Afew children with unusually advanced visual perceptual abilities showed dispropor-tionately slowed classification times for Strong Positive items relative to Weak
S. Jerger, M.F. Damian / Journal of Experimental Child Psychology 92 (2005) 46–75 65
Positive items. Although not all children with advanced visual perceptual skills dis-played this result, a few of these children seemed to be using a classification schemethat overturned the normal speed-of-processing advantage for Strong Positiveitems.
An inverse typicality effect was reported previously for a patient with aphasiaon a category-naming task (Marshall, Pring, Chiat, & Robson, 2001). Marshalland colleagues (2001) proposed several hypotheses based on language disorderto explain why their patient accessed atypical and low-frequency objects morereadily than the patient accessed typical and high-frequency objects. One of theirpossible explanations revolved around (a) excessive spreading activation and (b)more distinctive and fewer shared properties among atypical objects. In a spread-ing activation model, the processing system consists of a network of entries thatpossess differing amounts of activation depending on resting levels and input.Activation spreads from one entry to others, depending on the amount of inputactivation amassed by an entry and the weighting of connections to other entries.The entry with the greatest resulting activation is the one that is accessed andretrieved.
To adapt and extend Marshall and colleagues� (2001) hypothesis to our re-sults, we tentatively propose that young children with an inverse typicality effectwere encoding clothing objects with a disproportionate emphasis on visual prop-erties based on body shape. In this circumstance, typical objects would sharemany more properties among themselves. For example, shirt, jacket, and dressmight share (a) worn on body core, (b) made of material, and (c) worn for pro-tection in terms of conceptual properties and also share (a) has armholes orsleeves, (b) has neck opening, and (c) has waist in terms of emphasized visualproperties. Atypical objects would have fewer shared properties. In terms ofemphasized visual properties only, belt would be worn on the body core, bootand slipper would be worn on the foot, glove would be worn on the hand,and so forth.
In our experimental context, presentation of a typical object would activate a setof meaning-related objects (Levelt et al., 1991), with a high level of activation spread-ing to other typical objects due to the high number of shared properties. This exces-sive spreading activation would result in a pool of highly activated lexical items.Lexical access for the target would be slowed due to competition from the highlycoactivated lexical representations for other typical objects (for a discussion, see Da-mian et al., 2001). Slowed target retrieval might also reflect children�s greater diffi-culty in inhibiting highly coactivated competitors.
In contrast to typical objects, presentation of atypical pictured objects would acti-vate a set of meaning-related objects, but with less spreading activation due to great-er distinctiveness and fewer shared properties among atypical objects. Lexical accessfor atypical targets would be faster because targets would achieve a higher level ofactivation relative to other items more quickly. In short, we propose that (a) the in-verse typicality effect is due to excessive spread of activation among typical objectswith multiple shared properties and to less spread of activation among atypical ob-jects with fewer shared properties and that (b) a key factor driving lesser and greater
66 S. Jerger, M.F. Damian / Journal of Experimental Child Psychology 92 (2005) 46–75

distinctiveness among typical and atypical objects is undue emphasis on visual prop-erties based on body shape. This proposal is currently speculative and will be ex-plored in future research.
Relatedness effect
In concert with the strong typicality effect seen in most participants, strong out-of-category objects also consistently exhibited preferential processing (faster reactiontimes and fewer errors) compared with related out-of-category objects, even by chil-dren as young as 4 years of age. Faster reaction times suggest that strong negativeobjects are recognized as not clothing more rapidly than are out-of-category objectsthat share some properties with category members. The slopes relating Weak Nega-tive and Strong Negative items became significantly less steep with increasing age.Reaction times improved more with age for related out-of-category items. These re-sults agree with previous findings in adults (Baddeley et al., 1984; Schaeffer & Wal-lace, 1969; Wilkins, 1971).
Error patterns indicate that variations in relatedness influenced the correct clas-sifications of children more than those of adults, with children being significantlyless accurate than adults in classifying out-of-category related items. This findingseems to be more difficult to relate directly to the literature. In a category gener-ation task, Nelson (1974) found that 8-year-olds responded with a higher propor-tion of ‘‘marginal’’ objects (our atypical and related out-of-category objects) thandid 5-year-olds for the category ‘‘clothing.’’ Interestingly, however, Nelson ob-served the reverse pattern of results for the category ‘‘furniture.’’ Results withour category verification procedure are more consistent with Nelson�s latter result.More pronounced age-related improvement in accuracy for related out-of-cate-gory objects than for unrelated out-of-category objects may again reflect children�sincreasing specification of the properties characterizing a category and increasingrealization that some properties are more important to membership than are oth-ers. Relative to unrelated objects, related out-of-category objects share a fewproperties with category members, and children may also have more difficultyin attending to all properties and in avoiding undue emphasis on the relatedproperties.
Underextension and overextension errors
Development of category knowledge was characterized by both underextensionerrors (misclassified Weak Positive objects as not clothing > 50% of time) and over-extension errors (misclassified Weak Negative objects as clothing > 50% of time).This finding agrees with previous observations (e.g., Rosner & Hayes, 1977).Underextension and overextension phenomena were present in 29% of the children,with more children showing overextension (19%) errors. Individual children dem-onstrated only one type of error, indicating a simultaneous–independent mannerof development. Children showed either smaller or more diverse categorymemberships.
S. Jerger, M.F. Damian / Journal of Experimental Child Psychology 92 (2005) 46–75 67

A new finding of this research is that underextension and overextension er-rors seem to be associated with independent demographic factors. Underexten-sion errors were significantly related to multifaceted age factors, both verbaland nonverbal. As seen in Table 5, underextension errors decreased systemati-cally with maturation. Overextension errors, in contrast, seemed to be uniquelyrelated to receptive vocabulary skills. Although the association between recep-tive vocabulary skills and overextension errors did not achieve statistical signif-icance, the trend and the weak structure coefficient for Weak Negative errors inthe first Rc1 were sufficient to raise concern about accepting the null hypothesis.An association between overextension errors and strong vocabulary knowledgediffered from findings for underextension errors, which occurred in childrenwith a wide range of vocabulary ability. Although not all children with ad-vanced receptive vocabulary abilities overextended the category, all childrenwith pronounced overextension had unusually advanced receptive vocabularyabilities.
Previous investigators have sought to define determinants of underextensionand overextension errors. Underextension errors have been attributed to the typ-icality of objects, parental word referent modeling, and familiarity (Anglin, 1977;White, 1982). The idea is that parents tend to use superordinate-level labels fortypical objects and basic-level labels for atypical objects; for example, they maysay ‘‘Put on your clothes’’ when referring to pants and shirt, but ‘‘Put on yourhat and gloves’’ when referring to the latter items. Such parental speech practicesare thought to induce underextension errors, which occur largely for objects withfamiliar basic-level names (e.g., hat). Our data add to understanding determinantsof underextension errors, suggesting that reduction in these errors is due to mat-uration of not only verbal knowledge but also nonverbal knowledge. It is possiblethat our task�s dependence on picture processing and button-press respondingpromoted the strong association between both verbal and nonverbal abilities.Other investigators, however, are finding similar evidence; for example, Gershk-off-Stowe and colleagues have observed that young children�s categorical knowl-edge seems to be influenced not only by word knowledge but also by specificplay experiences (Gershkoff-Stowe et al., 1997; Namy, Smith, & Gershkoff-Stowe,1997).
In contrast to underextension errors, overextension errors have been attributedto perceptual/functional similarity and association through contiguity (Anglin,1977, 1995). Although clothing is thought to be a more perceptually dissimilar cat-egory, we have already noted some similarities in properties reflecting body shape.With regard to association through contiguity, it is highly probable that childrenfrequently see others putting on jewelry and/or eyeglasses along with their clothes.These attributes seem to be reasonable bases for overextension in the currentparticipants.
A remaining issue, however, is why overextension errors occurred in children withstronger receptive vocabulary skills. One possibility again involves parental speechpractices. Previous research indicates that overall amount of parental speech inputmay affect vocabulary size (Huttenlocher, Haight, Bryk, Seltzer, & Lyons, 1991).
68 S. Jerger, M.F. Damian / Journal of Experimental Child Psychology 92 (2005) 46–75

Children with a greater number of word-learning trials acquire greater vocabularies.We propose that parents of current overextenders talked more frequently and elab-orately with their children, thereby promoting vocabulary growth and focusingattention on (a) perceptual/functional similarities between category and relatedout-of-category objects (e.g., ‘‘Look, the doll�s hat and backpack are both madeout of the material with our school�s emblem’’) and (b) association through contigu-ity among clothing, accessories, and assistive devices (e.g., ‘‘Please wait until I finishdressing; I just need to fasten my necklace and put on my blazer’’). We are proposingthat in this situation, young children are expanding their word knowledge while atthe same time drawing some inappropriately broad inferences about category mem-bership. Association though contiguity bears at least some resemblance to Nelson�s(1996) idea of thematic relations.
In short, we are suggesting, as others have suggested previously, that underexten-sion and overextension errors in children reflect, at least to some extent, differenttypes of input and learning opportunities. Although further research is needed to ex-plore these hypotheses, our results overall are consistent with other investigators�emphasis on the critical role of input and its salience in terms of children�s relativestrengths in cognitive development (Newcombe, 2002).
Thematic versus taxonomic modes of classification
Errors in all age groups were uncommon. The largest error rate overall was17% (4-year-olds). Stated in positive terms, children got, on average, 5.63 of 6items correct for the worst ‘‘strong’’ subset (0.37 errors, 4-year-olds) and 4.04 of6 items correct for the worst ‘‘weak’’ subset (1.96 errors, 5- to 7-year-olds) (Ta-ble 5). Previously, we reasoned that responding on the basis of idiosyncraticscript-based relations would yield large group error rates. Clearly, it seems tobe the case that even our youngest participants performed with impressive accu-racy. Low error rates are more consistent with a taxonomic mode of classifica-tion on this task, even in preschool children. Young children�s appreciation oftaxonomic relations agrees with our previous results on a cross-modal pic-ture–word task (Jerger, Martin, & Damian, 2002). We observed significantsemantic interference even in preschoolers for speeded picture naming in thepresence of categorically related distractors without thematic or associative rela-tions (e.g., dog–bear).
The current pattern of results may also reflect our procedure�s emphasis on theword clothing. Markman (1990) proposed that children assume that words refer togroups of objects with common properties, so that using word labels may promotea taxonomic mode of classification. Other studies investigating variables that influ-ence children�s mode of classification have also emphasized that labels, as well assome other task and participant characteristics, may be critical determinants ofperformance (Deak & Bauer, 1995, 1996). From these viewpoints, our procedurewith its word label (vote ‘‘yes’’ if object is clothing) may have encouraged taxo-nomic classification in children. A point, nonetheless, is that the children per-
S. Jerger, M.F. Damian / Journal of Experimental Child Psychology 92 (2005) 46–75 69

formed with reasonable success. Overall findings seem to be consistent with theidea that children readily employ a taxonomic mode of classification on sometasks.
Specificity hypothesis
Results do not support any unique relation between vocabulary knowledge andcategorization performance in 4- to 14-year-olds. Instead, the speed and accuracyof categorization performance were significantly determined by multifaceted age fac-tors. Gershkoff-Stowe and colleagues (1997) also failed to find support for the spec-ificity hypothesis in older toddlers. Apparently, conceptual understanding reflectsmultiple components in children of preschool to young adolescent years. Resultsdid, however, suggest one strong dependency between word knowledge and concep-tual knowledge, namely a relation between strong receptive vocabulary skills andincorrect classification of out-of-category related objects (overextension). As notedpreviously, we proposed that the association between vocabulary knowledge and cat-egory boundary reflected, to a large extent, parental speech practices and associationthrough contiguity.
Conclusions
This research has established the appropriateness of applying a speeded verifica-tion task to study conceptual knowledge in children. The task offers a viable onlineprocedure for assessing automatic components of semantic organization in chil-dren. As noted by other investigators (e.g., Moss & Tyler, 1995), online tasks havethe potential to offer fresh insights that cannot be gained from traditional offlinetasks requiring voluntary explicit retrieval of semantic information by children. Re-sults document the importance of typicality and relatedness in categorization at allages.
Acknowledgments
This work was supported by the National Institute on Deafness and Other Com-munication Disorders (Grant DC-00421 to the University of Texas at Dallas). Weare grateful for consultative advice from Herve Abdi (statistics) and for thoughtfulcomments on an earlier version of the article from Abdi, Melanie Spence, and Vir-ginia Marchman. We thank H. Stadthagen-Gonzalez and C. Davis for sharing theirBristol norms, the children and parents who participated, and the students who as-sisted, namely Kari Baldridge, Angela Beard, Heather Bentley, Janette Cross, Mea-ghan Dougherty, Cynthia Hildinger, Lydia Lai, Kristen Searcy, and Julie Pressley(data collection, analysis, and presentation) as well as Justin Rachels and HariKrishna Gadiraju (computer programming). We also appreciated the constructivecomments of two anonymous reviewers.
70 S. Jerger, M.F. Damian / Journal of Experimental Child Psychology 92 (2005) 46–75

Appendix A. Average linguistic statistics for item subsets (n = 6 items each)
Source Scale Negative Positive
Strong Weak Weak Strong
Word familiarity Morrison et al. (1997) 5-point (5 = very familiar) 3.03 (4) 3.64 (4) 3.29 (5) 3.73 (4)Snodgrass andVanderwart (1980)
5-point (5 = seen/heard daily) 3.01 (4) 3.39 (3) 3.44 (5) 4.07 (5)
Stadthagen-Gonzalez andDavis (2005)
7-point (7 = seen daily) 5.53 (6) 5.70 (4) 5.60 (5) 5.86 (6)
Overall average 5-point or adjusted 5-point 3.59 (6) 3.80 (5) 3.55 (6) 4.03 (6)Word frequency Dale and Fenson (1996) Proportion of children
understanding/producing word
0.92 (6) 0.84 (4) 0.81 (5) 0.92 (4)
Kucera and Francis (1967) Corpus of written words/occurrences per million
44.40 (5) 23.00 (4) 26.80 (5) 31.40 (5)
Age of acquisition Iyer et al. (2001) 9-point (1 = 2 years,9 = 13 + years)
4.00 (5) 4.99 (5) 4.55 (6) 4.18 (5)
Morrison et al. (1997) 7-point (1 = 2 years,7 = 13 + years)
2.03 (4) 2.53 (4) 2.24 (5) 2.18 (4)
Stadthagen-Gonzalez andDavis (2005)
7-point (1 = 0–2 years,7 = 13 + years)
2.46 (5) 2.28 (2) 2.52 (4) 2.50 (4)
Overall average 7-point or adjusted 7-point 2.57 (6) 3.17 (5) 2.83 (6) 2.70 (5)Imageability Morrison et al. (1997) 7-point (7 = high imageability) 6.26 (4) 6.03 (4) 6.06 (5) 6.10 (4)
Stadthagen-Gonzalez andDavis (2005)
7-point (7 = high imageability) 5.97 (6) 6.20 (4) 5.88 (5) 6.07 (6)
Overall average 7-point 6.07 (6) 6.15 (5) 5.96 (6) 6.18 (6)
Note. Each of the overall averages was obtained by averaging data across resources for each item and then averaging across mean item values for each subset.Numbers of items contributing to averages across resources are presented in parentheses.
S.Jerg
er,M.F.Damian/JournalofExperim
entalChild
Psychology92(2005)46–75
71

References
American National Standards Institute. (1989). American Standard Specifications for Audiometers (ANSIS3.6-1989). New York: Author.
Anglin, J. (1977). Word, object, and conceptual development. New York: Norton.Anglin, J. (1995). Classifying the world through language: Functional relevance, cultural significance, and
category name learning. International Journal of Intercultural Relations, 19, 161–181.Armstrong, S., Gleitman, L., &Gleitman, H. (1999). What some concepts might not be. In E.Margolis & S.
Laurence (Eds.), Concepts: Core readings (pp. 225–259). Cambridge, MA: Bradford Book/MIT Press.Ayres, J. (1978). Southern California Figure–Ground Visual Perception Test. (6th ed.) Los Angeles: Western
Psychological Services.Baddeley, A., Lewis, V., Eldridge, M., & Thomson, N. (1984). Attention and retrieval from long-term
memory. Journal of Experimental Psychology: General, 113, 518–540.Barrett, S., Abdi, H., Murphy, G., & Gallagher, J. (1993). Theory-based correlations and their role in
children�s concepts. Child Development, 64, 1595–1616.Bauer, P., Dow, G., & Hertsgaard, L. (1995). Effects of prototypicality on categorization in 1- to 2-year-
olds: Getting down to basics. Cognitive Development, 10, 43–68.Beery, K. (1989). The developmental test of visual–motor integration (3rd rev.). Cleveland, OH: Modern
Curriculum.Berman, S., Friedman, D., Hamberger, M., & Snodgrass, J. (1989). Developmental picture norms:
Relationships between name agreement, familiarity, and visual complexity for child and adult ratingsof two sets of line drawings. Behavior Research Methods, Instruments, & Computers, 21, 371–382.
Bjorklund, D. (2005). Children�s thinking: Cognitive development and individual differences (4th ed.).Belmont, CA: Wadsworth/Thomson Learning.
Bjorklund, D., Thompson, B., & Ornstein, P. (1983). Developmental trends in children�s typicalityjudgments. Behavior Research Methods, Instruments, & Computers, 15, 350–356.
Blewitt, P., & Toppino, T. (1991). The development of taxonomic structure in lexical memory. Journal ofExperimental Child Psychology, 51, 296–319.
Cycowicz, Y., Friedman, D., Rothstein, M., & Snodgrass, J. (1997). Picture naming by young children:Norms for name agreement, familiarity, and visual complexity. Journal of Experimental Child
Psychology, 65, 171–237.Dale, P. S., & Fenson, L. (1996). Lexical development norms for young children. Behavior Research
Methods, Instruments, & Computers, 28, 125–127.Damian, M., Vigliocco, G., & Levelt, W. (2001). Effects of semantic context in the naming of pictures and
words. Cognition, 81, B77–B86.Deak, G., & Bauer, P. (1995). The effects of task comprehension on preschoolers� and adults�
categorization choices. Journal of Experimental Child Psychology, 60, 393–427.Deak, G., & Bauer, P. (1996). The dynamics of preschoolers� categorization choices. Child Development,
67, 740–767.Donders, F. (1969). On the speed of mental processes (W. Koster, Trans.). In W. Koster (Ed.), Attention
and performance II (pp. 412–431). Amsterdam: North-Holland. (Original work published 1869).Duncan, E., & Kellas, G. (1978). Developmental changes in the internal structure of semantic categories.
Journal of Experimental Child Psychology, 26, 328–340.Dunn, L., & Dunn, L. (1997). Peabody Picture Vocabulary Test (3rd ed.). Circle Pines, MN: American
Guidance Service.Edwards, A. (1985). Experimental design in psychological research (5th ed.). New York: Harper & Row.Ellis, A., & Nelson, C. (1999). Category prototypicality judgments in adults and children: Behavioral and
electrophysiological correlates. Developmental Neuropsychology, 15, 193–211.Fivush, R. (1989). Scripts and categories: Interrelationships in development. In U. Neisser (Ed.), Concepts
and conceptual development: Ecological and intellectual factors in categorization (pp. 234–254).Cambridge, UK: Cambridge University Press.
Ford, M., & Keating, D. (1981). Developmental and individual differences in long-term memory retrieval:Process and organization. Child Development, 52, 234–241.
72 S. Jerger, M.F. Damian / Journal of Experimental Child Psychology 92 (2005) 46–75

Fournier, P., Mazzarella, M., Ricciardi, M., & Fingeret, A. (1975). Reading level and locus of interferencein the Stroop color word task. Perceptual and Motor Skills, 41, 239–242.
Francis, W., & Kucera, H. (1982). Frequency analysis of English usage: Lexicon and grammar. Boston:Houghton Mifflin.
Frankenburg, W., Doorninck, W. V., Liddell, T., & Dick, N. (1976). The Denver Prescreening
Developmental Questionnaire. Denver, CO: Ladoca Publishing Foundation.Gershkoff-Stowe, L., Thal, D., Smith, L., & Namy, L. (1997). Categorization and its developmental
relation to early language. Child Development, 68, 843–859.Goodenough, F. (1935). The development of the reactive process from early childhood to maturity.
Journal of Experimental Psychology, 18, 431–450.Gopnik, A., & Meltzoff, A. (1986). Relations between semantic and cognitive development in the one-
word stage: The specificity hypothesis. Child Development, 57, 1040–1053.Gopnik, A., & Meltzoff, A. (1992). Categorization and naming: Basic-level sorting in eighteen-month-olds
and its relation to language. Child Development, 63, 1091–1103.Hollingshead, A. (1975). Four factor index of social status. New Haven, CT: Yale University, Department
of Sociology.Holm, S. (1979). A simple sequentially rejective multiple test procedure. Scandinavian Journal of Statistics,
6, 65–70.Huttenlocher, J., Haight, W., Bryk, A., Seltzer, M., & Lyons, T. (1991). Early vocabulary growth:
Relation to language input and gender. Developmental Psychology, 27, 236–248.Iyer, G. K., Saccuman, C. M., Bates, E. A., & Wulfeck, B. B. (2001). A study of age-of-acquisition (AoA)
ratings in adults. Newsletter of the Center for Research in Language, 13, 3–32.Jerger, S., Martin, R., & Damian, M. (2002). Semantic and phonological influences on picture naming by
children and teenagers. Journal of Memory and Language, 47, 229–249.Jerger, S., Martin, R., & Pirozzolo, F. (1988). A developmental study of the auditory Stroop effect. Brain &
Language, 35, 86–104.Jerger, S., Pearson, D., & Spence, M. (1999). Developmental course of auditory processing interactions:
Garner interference and Simon interference. Journal of Experimental Child Psychology, 74, 44–67.Kail, R., & Nippold, M. A. (1984). Unconstrained retrieval from semantic memory. Child Development,
55, 944–951.Keller, D. (1982). Developmental effects of typicality and superordinate property dominance on sentence
verification. Journal of Experimental Child Psychology, 33, 288–297.Kucera, H., & Francis, W. (1967). Computational analysis of present-day American English. Providence,
RI: Brown University Press.Kuczaj, S. (1982). Young children�s overextensions of object words in comprehension and/or production:
Support for a prototype theory of early object word meaning. First Language, 3, 93–105.Levelt, W., Schriefers, H., Vorberg, D., Meyer, A., Pechmann, T., & Havinga, J. (1991). The time course
of lexical access in speech production: A study of picture naming. Psychological Review, 98, 122–142.Lucariello, J., Kyratzis, A., & Nelson, K. (1992). Taxonomic knowledge: What kind and when? Child
Development, 63, 978–998.Mandler, J., Bauer, P., & McDonough, L. (1991). Separating the sheep from the goats: Differentiating
global categories. Cognitive Psychology, 23, 263–298.Maridaki-Kassotaki, K. (1997). Are rating-based procedures reliable for derivation of typicality judgments
from children? Behavior Research Methods, Instruments, & Computers, 29, 376–385.Markman, E. M. (1990). Constraints children place on word meanings. Cognitive Science, 14, 57–77.Marshall, J., Pring, T., Chiat, S., & Robson, J. (2001). When Ottoman is easier than chair: An inverse
frequency effect in jargon aphasia. Cortex, 37, 33–53.McRae, K., de Sa, V., & Seidenberg, M. (1997). On the nature and scope of featural representations of
word meaning. Journal of Experimental Psychology: General, 126, 99–130.Medin, D., Ross, B., & Markman, A. (2005). Cognitive psychology (4th ed.). Hoboken, NJ: John Wiley.Mervis, C. (1989). Child-basic object categories and early lexical development. In U. Neisser (Ed.),
Concepts and conceptual development: Ecological and intellectual factors in categorization (pp. 201–233).Cambridge, UK: Cambridge University Press.
S. Jerger, M.F. Damian / Journal of Experimental Child Psychology 92 (2005) 46–75 73

Morrison, C. M., Chappell, T. D., & Ellis, A. W. (1997). Age of acquisition norms for a large set of objectnames and their relation to adult estimates and other variables. Quarterly Journal of Experimental
Psychology A, 50, 528–559.Moss, H., & Tyler, L. (1995). Investigating semantic memory impairments: The contribution of semantic
priming. Memory, 3, 359–395.Namy, L., Smith, L., & Gershkoff-Stowe, L. (1997). Young children�s discovery of classification during
play. Cognitive Development, 12, 163–184.Nation, K., & Snowling, M. (1999). Developmental differences in sensitivity to semantic relations among
good and poor comprehenders: Evidence from semantic priming. Cognition, 70, B1–B13.Neisser, U. (Ed.). (1989). Concepts and conceptual development: Ecological and intellectual factors in
categorization. Cambridge, UK: Cambridge University Press.Nelson, K. (1974). Variations in children�s concepts by age and category. Child Development, 45, 577–584.Nelson, K. (1996). Language in cognitive development: Emergence of the mediated mind. New York:
Cambridge University Press.Newcombe, N. (2002). The nativist–empiricist controversy in the context of recent research on spatial and
quantitative development. Psychological Science, 13, 395–401.Pedhazur, E. (1982). Multiple regression in behavioral research: Explanation and prediction (2nd ed.). New
York: Holt Rinehart & Winston.Pena, E., Bedore, L., & Zlatic-Giunta, R. (2002). Category-generation performance of bilingual children:
The influence of condition, category, and language. Journal of Speech, Language, and Hearing
Research, 45, 938–947.Posnansky, C. J. (1978). Category norms for verbal items in 25 categories for children in Grades 2–6.
Behavior Research Methods & Instrumentation, 10, 819–832.Rader, K. (1977). Rader Near Point Vision Test. Tulsa, OK: Modern Education.Rosch, E. (1973). On the internal structure of perceptual and semantic categories. In T. Moore (Ed.),
Cognitive development and the acquisition of language (pp. 111–144). New York: Academic Press.Rosch, E. (1975). Cognitive representations of semantic categories. Journal of Experimental Psychology:
General, 104, 192–233.Rosch, E., Mervis, C., Gray, W., Johnson, D., & Boyes-Braem, P. (1976). Basic objects in natural
categories. Cognitive Psychology, 8, 382–439.Rosner, S., & Hayes, D. (1977). A developmental study of category item production. Child Development,
48, 1062–1065.Schaeffer, B., & Wallace, R. (1969). Semantic similarity and the comparison of word meanings. Journal of
Experimental Psychology, 82, 343–346.Schwanenflugel, P., Guth, M., & Bjorklund, D. (1986). A developmental trend in the understanding of
concept attribute importance. Child Development, 57, 421–430.Shapiro, S., & Palermo, D. (1970). Conceptual organization and class membership: Normative data for
representatives of 100 categories. Psychonomic Monograph Supplements, 3, 107–127.Siegel, S., & Castellan, N. (1988). Nonparametric statistics for the behavioral sciences (2nd ed.). New York:
McGraw–Hill.Snodgrass, J., & McCullough, B. (1986). The role of visual similarity in picture categorization. Journal of
Experimental Psychology: Learning, Memory, and Cognition, 12, 147–154.Snodgrass, J., & Vanderwart, M. (1980). A standardized set of 260 pictures: Norms for name agreement,
image agreement, familiarity, and visual complexity. Journal of Experimental Psychology: Human
Learning and Memory, 8, 174–215.Southgate, V., & Meints, K. (2000). Typicality, naming, and category membership in young children.
Cognitive Linguistics, 11, 5–16.Stadthagen-Gonzalez, H., & Davis, C. J. (2005). The Bristol norms for age of acquisition, imageability, and
familiarity. Unpublished manuscript.Thomsen, S. (1982). Stimulus pictures for assessment, remediation, and carryover. East Moline, IL:
LinguiSystems.van Overschelde, J., Rawson, K., & Dunlosky, J. (2004). Category norms: An updated and expanded
version of the Battig and Montague (1969) norms. Journal of Memory and Language, 50, 289–335.
74 S. Jerger, M.F. Damian / Journal of Experimental Child Psychology 92 (2005) 46–75

Vitkovitch, M., Humphreys, G., & Lloyd-Jones, T. (1993). On naming a giraffe a zebra: Picture namingerrors across different object categories. Journal of Experimental Psychology: Learning, Memory, and
Cognition, 19, 243–259.Waxman, S., & Namy, L. (1997). Challenging the notion of a thematic preference in young children.
Developmental Psychology, 33, 555–567.Wechsler, D. (1974). Wechsler Intelligence Scale for Children–revised. New York: Psychological
Corporation.White, T. (1982). Naming practices, typicality, and underextension in child language. Journal of
Experimental Child Psychology, 33, 324–346.Whitney, P., & Kunen, S. (1983). Development of hierarchical conceptual relationships in children�s
semantic memories. Journal of Experimental Child Psychology, 35, 278–293.Wilkins, A. (1971). Conjoint frequency, category size, and categorization time. Journal of Verbal Learning
and Verbal Behavior, 10, 382–385.Williams, K. (1997). Expressive Vocabulary Test. Circle Pines, MN: American Guidance Service.York, B. (1995). Phonics: Book A. Austin, TX: Steck–Vaughn.Younger, B., & Mekos, D. (1992). Category construction in preschool-aged children: The use of correlated
attributes. Cognitive Development, 7, 445–466.
S. Jerger, M.F. Damian / Journal of Experimental Child Psychology 92 (2005) 46–75 75