Embed Size (px)
Citation preview

WHAT IS THE EVIDENCE ON TOP-DOWN AND BOTTOM-UP APPROACHES IN IMPROVING ACCESS TO WATER,
SANITATION AND ELECTRICITY SERVICES IN LOW-INCOME OR INFORMAL SETTLEMENTS?
SYSTEMATIC REVIEW [NOVEMBER 2016]

2
The authors of this report are
Thillai Rajan Annamalai (Indian Institute of Technology Madras, India)
Ganesh Devkar (CEPT University, Ahmedabad, India)
Ashwin Mahalingam (Indian Institute of Technology Madras, India)
Solomon Benjamin (Indian Institute of Technology Madras, India)
Sudhir Chella Rajan (Indian Institute of Technology Madras, India)
Akash Deep (Harvard Kennedy School, Harvard University, US)
Funding
This is an independent report commissioned and funded by the Research and Evidence Division in the
Department for International Development. This material has been funded by UK aid from the UK
Government, however, the views expressed do not necessarily reflect the UK Government’s official
policies
Acknowledgments
We thank our host institutions; the EPPI-Centre; our funder, the South Asia Research Hub, Government
of UK; our peer reviewers, Dr Mukdarut Bangpan, Ms Kelly Dickson and Mr Jeff Brunton for regular
discussions; and our project associate, Mr M.S. Elayaraja.
Conflicts of interests
None of the authors has any financial interest in this review topic, nor have they been involved in the development of relevant interventions, primary research, or prior published reviews on the topic.
Contributions
The opinions expressed in this publication are not necessarily those of the EPPI-Centre or the funders.
Responsibility for the views expressed remains solely with the authors.
Citation
Annamalai TR, Devkar G, Mahalingam A, Benjamin S, Rajan SC, Deep A (2016) What is the evidence on
top-down and bottom-up approaches in improving access to water, sanitation and electricity services
in low-income or informal settlements? London: EPPI-Centre, Social Science Research Unit, UCL
Institute of Education, University College London.
Picture
Photos by World Bank Photo Collection and SuSanA Secretarlat; permitted with licence
https://creativecommons.org/licenses/by/2.0/legalcode
© Copyright
Authors of the systematic reviews on the EPPI-Centre website (http://eppi.ioe.ac.uk/) hold the
copyright for the text of their reviews. The EPPI-Centre owns the copyright for all material on the
website it has developed, including the contents of the databases, manuals, and key wording and data-
extraction systems. The centre and authors give permission for users of the site to display and print the
contents of the site for their own non-commercial use, provided that the materials are not modified,
copyright and other proprietary notices contained in the materials are retained, and the source of the
material is cited clearly, following the citation details provided. Otherwise, users are not permitted to
duplicate, reproduce, republish, distribute, or store material from this website without written
permission.

3
SUMMARY
This systematic review of urban planning studies in developing countries found that top-down efforts
are ineffective for connecting populations to centralised water, sanitation or electricity services.
Bottom up, participatory approaches are effective for local sanitation solutions, but not for water
supply or connectivity to other services.
Services provided by public or private agencies through centralised planning and implementation (top-
down) appeared effective in individual studies for connecting populations to water, sanitation and
electricity. However, where studies were sufficiently similar to justify pooling findings in a statistical
meta-analysis, this conclusion was not confirmed. Qualitative synthesis of contextual factors suggest a
need for the customisation of solutions to meet local needs, and better delivery of services by
alternative/non-government service providers.
Participatory (bottom-up) approaches adopted by NGOs and CBOs suit the construction and
maintenance of toilets, which can be standalone, and statistical meta-analysis confirms their
effectiveness for individual but not community toilets. Although studies of bottom-up approaches to
improving water access appeared positive more often than studies of top down approaches, this
difference was not statistically significant in a meta-analysis. Moreover, bottom-up approaches suffer
from problems of scaling-up. Replication of successful models may not always be possible, since the
same conditions may not be present in different locations.
Neighbourhoods without security of tenure are rarely served well top-down. Bottom-up approaches
are also limited in this context, and also in Africa where efforts may be hampered by particularly
modest levels of economic development. Public-private partnerships show promise for top-down
approaches to improving water supply. Bottom-up, NGO led initiatives for improving water supply
need the cooperation and support of the public sector.
INTRODUCTION
This systematic review examines the evidence on the effectiveness of different urban-planning
approaches in providing access to water, sanitation and electricity services in low-income or informal
settlements in Low- and Middle-Income Countries (LMICs). The study was funded by the Department
for International Development (DFID) of the UK government and conducted by the Indian Institute of
Technology Madras. The review addresses the following question: What is the evidence on what makes
an effective urban-planning framework for improved access to water, sanitation and electricity services
in low-income or informal settlements? More specifically, the review seeks answers to the following
questions:
1. How effective are the top-down and bottom-up approaches in improving access to water supply, sanitation and electricity services in low-income or informal settlements in LMICs?
2. Under what circumstances do these approaches deliver better results? Why?
3. What are the strengths and limitations of these two approaches in respect of providing access to basic services in low-income areas and informal settlements?
This brief is designed to provide an overview of the key evidence identified in the systematic review
and to assist policymakers and researchers in assessing the strengths and limitations of the different

4
service-delivery approaches in slums. For the purpose of this review, service-delivery approaches were
classified into two categories: top-down and bottom up. Services provided by the government or
government agencies, which are usually characterised by centralised planning and implementation,
were classified as top-down. Services provided by Non-Governmental Organizations (NGOs) and
Community-Based Organizations (CBOs), or other small-scale service providers, which are characterised
by a higher degree of decentralised planning and implementation, were classified as bottom-up. In
reality, there may be very few purely top-down or bottom-up approaches, since the majority of the
programmes fall in between these two polar-opposite approaches, with varying degrees of
decentralisation. However, classifying in a review the service provision as either top-down or bottom-
up clusters the evidence in terms of which service provider has played a dominant role.
SUMMARY CONCLUSIONS
The explorative and statistical analysis of quantitative evidence suggest a bottom-up approach can be
more effective in increasing access to water and sanitation, particularly in the provision of toilets
compared to a top-down approach. Although explorative analysis initially suggested that taking a top-
down approach can be more effective in increasing the supply of electricity, the finding was not
confirmed when statistically pooling the evidence. Qualitative synthesis of contextual factors
influencing improvement in the supply of water, sanitation and electricity, suggest a need for the
customisation of solutions to meet local needs, and better delivery of services by alternative/non-
government service providers. Evidence of approaches taking a bottom-up approach has shown some
improvement in outcomes across multiple dimensions of access, such as connectivity, adequacy and
affordability, whereas top-down approach has predominantly focused on connectivity. The impact of a
bottom-up approach has been least evident in Africa. This suggests that the success of planning
approaches can depend upon different social and political context. Such that, in relatively difficult socio-
economic environments, across different LMIC countries (often characterised by different levels of
poverty, inadequate infrastructure, weak economy and governance, poor institutional capacity, and
absence of civil-society participation) bottom-up approaches requires continued support from other
actors, such as the government, to ensure the delivery of more positive results.
Community participation and tenure security emerged as two important moderators affecting
outcomes. A bottom-up approach was more amenable in facilitating community participation and in
engaging with the poor settlements. They were even more effective when there was security of tenure.
Political commitment also played an important role in affecting outcomes. Strong commitment from
the government in the form of universal access, pro-poor policy reform, or specific schemes to improve
access to the poor, also played an important role in improving access to slums and low-income
settlements.
SYSTEMATIC REVIEW APPROACH
This review synthesises the evidence on access, since it forms an important element in achieving the
Millennium Development Goals (MDGs). While, traditionally, access has been synonymously used to
mean connectivity, we have adopted a more holistic definition of access that considers the following
dimensions: connectivity, affordability, adequacy, effort and time, and durability.
The steps followed for the review were:
Formulating exclusion and inclusion criteria to determine the studies to be included in the
review.

5
Deciding on the sources and the search methods (search phrases) to be used to identify the
studies.
Managing the shortlisted and identified studies using EPPI-Reviewer.
Quality appraisal of the studies identified for inclusion in the review.
Synthesising the evidence in the included studies. Given the heterogeneity of the studies,
multiple methods were used in the synthesis: numerical summary, meta-analysis and textual
narration.
SUMMARY MAP OF EVIDENCE
A total of 104 studies met the exclusion, inclusion, and quality-appraisal criteria and were included in
the analysis. These studies covered six geographical regions, 34 countries, and 103 cities. Studies from
Asia were the most numerous, followed by those from Africa and South America. Dhaka occupied the
top slot in the list of cities, followed by Mumbai, Ahmedabad, Jakarta, and New Delhi. A total of 66% of
the studies were from journals, whereas 34% of the studies were from grey literature. The highest
number of studies was for water (77), followed by sanitation (64) and electricity (31).
OUTLINE OF THE EVIDENCE
Exploratory analysis
Findings from an exploratory analysis, suggest that overall, access to water can be improved when a
bottom-up approach is adopted, compared to a top-down approach. Prior to conducting a meta-
analysis, exploration of the data indicated that there was improvement in access in 40% of cases using
a top-down approach, whereas, in the bottom-up approach, it was 55%. Connectivity has been used as
the primary measure of access, as seen by the number of outcome data in both top-down and bottom-
up approaches. The number of outcome measures on other dimensions of access, such as adequacy,
affordability, effort and time, and durability, have been considerably lower. A bottom-up approach
indicated improvements across multiple dimensions of access, whereas the improvement in the top-
down approach was seen primarily on connectivity (see Figure 1, below). We tested these findings on
improvements to connectivity using statistical meta-analysis (see below) and made additional insights.

6
Fig 1: Proportion of findings that show improvement in different dimensions of access
Meta-analysis
Meta-analysis results provided an aggregate quantitative measure, based on the findings from the
individual studies. This aggregate measure, if it had a value greater than 1 and was statistically
significant, indicated an improvement in connectivity, comparing between bottom-up and topdown
approaches. However, if the aggregate measure was less than 1 and statistically significant, it indicated
a decline in connectivity. If it was not statistically significant, then there was no change to the status
quo in connectivity as a result of using a bottom-up approach.
Figure 2, below, shows the effectiveness of a bottom-up approach on connectivity across regions and
facilities. Among all the facilities, it can be seen that a bottom-up approach has also been effective only
in the provision of individual toilets. Except in the case of Africa, a bottom-up approach has led to an
improvement in access to individual toilets in all regions. A possible reason for this trend is the modest
level of economic development characteristics of some African countries as compared to other
geographical regions. Construction of individual toilets also requires substantial investment from
households, which is a deterrent in poor slum communities. However, the evidence in Asia, South
America and Central and North America suggests that a bottom-up approach help to create conditions
that result in a greater number of households constructing toilets. Analysis of the evidence by region
shows that a bottom-up approach has led to a decline in connectivity in Central and North America,
except in the case of individual toilets. However, the finding is limited by the low number of studies in
the region.
Overall, our findings help us to conclude that a bottom-up approach has been able to achieve
improvements in only a few instances, indicating the limitations of their effectiveness as an intervention
measure to improve connectivity.
53%
23% 25% 24%20%
57%52%
36%
72%
58%
0%
10%
20%
30%
40%
50%
60%
70%
80%
Connectivity Adequacy Affordability Effort and time Durability
Evid
ence
s in
dic
atin
g im
pro
vem
ent
Top-down approaches Bottom-up approaches

7
Legend
The numerical values show the aggregate quantitative measure obtained from meta-analysis. Blank
values indicate the absence of evidence in the respective regions and facilities
Fig 2: Connectivity and bottom-up approach: by type of facility and region
SUMMARY OF KEY FINDINGS
A narrative summary of the key findings by individual sector is provided in more detail below. This
summary draws on both quantitative evidence of impact from the exploratory numerical analysis and
statistical meta-analysis. Further analysis of qualitative evidence to provide an account of moderating
factors influencing implementation of top-down and bottom-up approaches is also presented.
WATER SECTOR
Multiple approaches prevail in water supply for urban slums — from public provision of supply, to
private and NGO-driven delivery of services. Water supply is characterised by the presence of both
individual and community connections. While there may be a preference for individual connections on
the part of policymakers and community members, spatial, legal and financial constraints limit the
extent of coverage.
The exploratory analysis revealed that there was a higher proportion of outcome measures indicating
an improvement in access to water using a bottom-up approach (53%) as compared to under a top-
down approach (42%). The finding from the meta-analysis also indicates a non-statistically significant,
but positive trend towards using a bottom-up approach in improving access to water.
Indicates improvement Indicates decline No change to status quo

8
Qualitative textual-narrative analysis shows that the key reasons behind the poor performance of the
top-down approach were government mismanagement, unclear responsibility among government
agencies, lack of a pro-poor policy, poor finances and weak legal mandate for network expansion in
slums, and inappropriate pricing policies, which affect the affordability of slum-dwellings The bottom-
up approach, however, was able to mobilise community members to participate, physically and
financially, in the service-delivery process. This afforded a sense of ownership over the infrastructure
by community members, which resulted in positive outcomes. For instance, NGO involvement with
slum communities in Zambia led to the creation of a Water Trust, which helped communities address
their water shortages. Similarly, studies have shown the intermediary role played by NGOs in
Bangladesh and Nepal in facilitating water connections in slums. However, scaling-up of successful
interventions and replication of them in other locations may not be possible, with bottom-up approach
which seek to address context-specific issues, which may not be present in different locations, limiting
their transferability.
SANITATION SECTOR
Access level to sanitation is the poorest among the three sectors. Sanitation services include sewerage
systems and access to toilets, neither of which is readily available in slums. Open defecation (such as
disposal of feces in means other than a toilet) are few of the common practices in slums that have a
detrimental impact on health and hygiene.
The effectiveness of the top-down approach has been the poorest in sanitation, with only 28% of the
evidence showing an improvement. However, in the bottom-up approach, 55% of the outcome
evidence have reported an improvement. Meta-analysis results confirmed this finding, showing that
the bottom-up approach has statistically significant improvement in access to sanitation.
Qualitative analysis reveals, that apart from the lack of government willingness to extend network
coverage in slums, there are three main factors which emerge as constraints on the provision of
sanitation in slums: 1) The issue of tenure security; 2) lack of maintenance of community infrastructure;
and 3) poor participation of stakeholders in the planning and design of facility. NGOs and CBOs have
been able to address the last two concerns by adopting a decentralised approach and engaging
community members in the planning, design and maintenance of community toilets. The Orangi case
study from Pakistan is an example of the benefits of community participation, which have resulted in
substantial improvements in water and sanitation infrastructure in slums. Residents of Orangi, with the
help of a local NGO, took the financial responsibility for the construction of smaller feeder pipes for
water and sewerage within the community, while the government agreed on connecting the slum to
the city-wide water and sewerage network. As a result of this partnership, residents could get
household-level connections, as well as connections to the city-wide network, which proved to be
beneficial to all stakeholders. Community-sanitation initiatives in the cities of Mumbai, and Trichy,
India, also highlight the efforts of NGOs and CBOs in the construction of community toilets in urban
slums.

9
ELECTRICITY SECTOR
Access levels to electricity have been the highest of the three basic services studied in this review.
However, most of the slum-dwellers access electricity through illegal connections, either because of
high up-front costs or the high cost of power.
The exploratory analysis, suggested that the incidence of using a bottom-up approach has been the
lowest in respect of the electricity supply: less than 10% of the outcome evidence in the bottom-up
approach were in electricity. When conducting meta-analysis, the results showed that involvement of
non-state service providers has not had the desired effect in terms of improving access to electricity;
despite the narrative analysis indicating that access to electricity can improve with tenure security and
strong political backing. Interventions that have a pro-poor approach and those that involve community
participation in the service-delivery process have shown an increase in connectivity. Case studies such
as the Depressed Area Electrification Program in Philippines, the accelerated electrification program in
Thailand, and the Slum Electrification Program in Ahmedabad, India, all point to the pro-poor approach
of the Government as improving access to electricity in slums. With the support of the Government and
by adopting innovative management practices and pricing methods, and by enlisting the support of
CBOs, utilities have addressed the problem of illegal connections, non-payment and theft.
MODERATING FACTORS
PARTICIPATION
Participation of the local community is an important moderator in influencing outcomes. The bottom-
up approach, however, does not automatically result in community participation. Project planning
should specifically include components that involve the local community in different stages of the
project life-cycle. Studies more often indicated an improvement in access when there was active
participation from the community. Meta-analysis results showed that the bottom-up approach, when
accompanied by active community participation, led to a significant improvement in access. In the
absence of community participation, a bottom-up approach was not effective. Community participation
helps service providers to understand the needs of the slum-dwellers and, subsequently, to tailor the
services to their requirements. This was clearly evident in the sanitation sector in several Asian
countries, such as Nepal, Bangladesh, India and Pakistan. Community participation, for example, helped
the service providers to factor in the needs of women and children during the construction of toilets
and subsequent maintenance, thereby leading to improved patronage of the facilities created.
TENURE SECURITY
Tenure security emerged as yet another moderator in impacting access to basic services. The legal
status of the slum determines the type of service provider and the service-delivery approach. Formal
slums, which are legally recognised and have security of tenure, enjoy a higher degree of connectivity
(56%), whereas informal slums, which lack legal recognition, have comparatively low levels of
connectivity (40%).
Figure 3, below, shows the meta-analysis results for the effectiveness of a bottom-up approach on
connectivity by type of settlement and extent of community participation. Improvement in connectivity
levels was seen neither in formal slums, nor in informal slums, when a bottom-up approaches was
deployed. However, in low-income non-slum settlements, use of a bottom-up approach led to a

10
significant decline in connectivity levels. A bottom-up approach becomes more effective only when
accompanied by community participation. Use of a bottom-up approach, along with community
participation, has led to a significant improvement in connectivity in informal slums, where there is no
security of tenure for the residents. This suggests that, when there are difficulties in creating tenure
security, a bottom-up approach, accompanied with community participation, are an appropriate
strategy to improve connectivity.
Narrative analysis shows that tenure security provides slum-dwellers the safety net to invest in
connectivity. Since informal slums are under the threat of eviction or demolition, slum-dwellers are
reluctant to invest in infrastructure improvements. Evidence from Jakarta, Indonesia, shows that
granting of tenure security to urban slums prompted slum-dwellers to invest in other housing
improvements, such as toilets, legal electricity connections, permanent roofs, and so on. Similar case
studies in slum improvement and slum up-grading in the cities of Dhaka, Mumbai, Ahmedabad (all
India), and Promeba and Rosario Habitat (Argentina), have included the importance of tenure security
in the programme implementation, along with access to new and improved facilities.
Legend
The numerical values show the aggregate quantitative measure obtained from meta-analysis.
Fig 3: Connectivity and bottom-up approach: by type of settlement and extent of
community participation
POLITICAL COMMITMENT
Political commitment, or a change in the government’s policy to adopt a pro-poor approach in delivery
of basic services to the urban poor, has had a positive impact on access in the top-down and a bottom-
up approach. This is mainly due to the removal of legal hurdles such as tenure security, which obviates
the need for slum-dwellers to provide proof of residence to seek new connections. A commitment from
Indicates improvement Indicates decline No change to status quo

11
the government in the form of universal access, pro-poor policy reform or a specific scheme to improve
access, provides a clear legal mandate to the public utility to extend coverage to poor consumers. It
may also include financial packages such as lower connection fees, which assist the poor in seeking legal
connections. The Depressed Area Electrification Program in Philippines, the accelerated electrification
program in Thailand and the Slum Electrification Program in Ahmedabad, are all examples of
government-led interventions that have improved access to electricity by bringing down connection
costs and granting tenure security.
The setting up of specialised agencies or cells that exclusively deal with the provision of basic services
in slums emerged as an enabling factor in improving access. Slums constitute a unique habitat that
comes with its own set of problems, which require inter-agency co-ordination and innovation in
operation, both of which may be stymied within existing institutional frameworks. In Brazil, two
electricity utilities, Rio LIGHT and Coelba, have set up community-based offices in their respective slum
areas in order to improve their outreach, payment collections and provide better customer service.
Similarly, the Bangalore Water Supply and Sanitation Board have created a social-development cell
within their office to focus exclusively on improving water connectivity to urban slums. Specialised
agencies or offices located within the slums facilitate closer interaction between the community and
the service provider, which, in turn, has a positive impact on access.
POLICY IMPLICATIONS
Political commitment should be backed by appropriate institutional arrangements for a top-
down approach to work.
Political commitment, combined with a networked approach and deeper understanding of
prevailing conditions (which include the setting up of specialised agencies created exclusively to
work with slums) have shown improvements in access. Overseas development assistance (ODA)
and other funding agencies that seek to generate political commitment should recommend the
setting-up of such dedicated organisations or specialised cells within existing organisations in order
to obtain better results in delivery of basic services.
A bottom-up approach is more effective in achieving an all-round improvement in access.
Access to basic services should not be seen as merely providing connectivity to taps, toilets or
electricity. A holistic approach to access helps to realise the benefits of improvements in access in
its entirety. A bottom-up approach lends itself very well to this scenario, as they have the necessary
elements to achieve improvements across multiple dimensions of access, due to beneficiary
participation, proximity of the service provider to slum-dwellers, sensitivity to community needs,
flexible payment options, consumer education, and community empowerment through training.
As policy shifts from community to personal household facilities, a bottom-up approach will have
a greater relevance.
The desire among policymakers is to provide individual connections to slum residents, rather than
public connectivity. However, individual connections need more involvement from the household,
both in terms of effort and investment. Enlisting the support of alternative service providers or
adopting a bottom-up approach can foster a sense of commitment through community interaction
and behavioural change. NGOs and CBOs can also provide the necessary technical and financial
support in the form of loans to obtain individual, household-level connections.
Addressing tenure-security issues plays an important role in effecting access.
Tenure security is critical to the provision of basic services in slum settlements. In order to
overcome the problems of tenure security, governments must accept their duty to provide access

12
to basic services in slums by: (i) removing land tenure as a prerequisite to seeking new connections;
(ii) amending the legal framework of government agencies to include informal settlements or
provide universal access; and (iii) use NGOs and CBOs as a medium to service informal slums by
engaging them in decentralised service delivery.
Programmes that aim to improve basic services should incorporate components of inclusivity
right from the project-conception stage.
Inclusivity and community participation are practices that need to be built into the project right
from the conception stage, in order to identify: (i) community needs and priorities; (ii) existing
resources and constraints; (iii) ways to mobilise community support; and (iv) prolonged
maintenance, as well as upkeep of the infrastructure, all of which are important for successful
service delivery in slums. The strengths and limitations of each of the stakeholders involved must
be studied and understood at the stage of drafting the project document, and avenues for
community members to participate/contribute their ideas at various stages of the project must be
institutionalised.
RESEARCH GAPS
The strength of the review depends on the evidence base. The evidence base for this review lacks
studies using experimental designs, in controlled environments. Primary studies deploying such
research-design methodologies would help in furthering our understanding of the causal pathway
between intervention and outcomes. For example, it could provide a clearer view of how involvement
of alternative service providers helps to improve community participation, and how community
participation leads to better outcomes. Overall, there is a need for studies with a higher degree of rigour
in research design than found at present, to better inform policymaking.
Future work could involve in-depth, region-specific studies, to get a clear understanding of contextual
factors that prevail in different regions. A specific region of interest would be Africa, where neither of
the two approaches has made a significant impact.

13
CONTENTS
SUMMARY
1: BACKGROUND
2: METHODS USED IN THE REVIEW
3: IDENTIFYING AND DESCRIBING STUDIES: RESULTS
4: IN-DEPTH REVIEW: RESULTS
5: SUMMARY AND IMPLICATIONS
6. REFERENCES
APPENDIX 1: REPORT AUTHORSHIP
APPENDIX 2: METHODS USED IN THE REVIEW
APPENDIX 3: IDENTIFYING AND DESCRIBING STUDIES
APPENDIX 4: META-ANALYSIS RESULTS
LIST OF ABBREVIATIONS
14
1: BACKGROUND
1.1 BACKGROUND AND AIM OF THE REVIEW
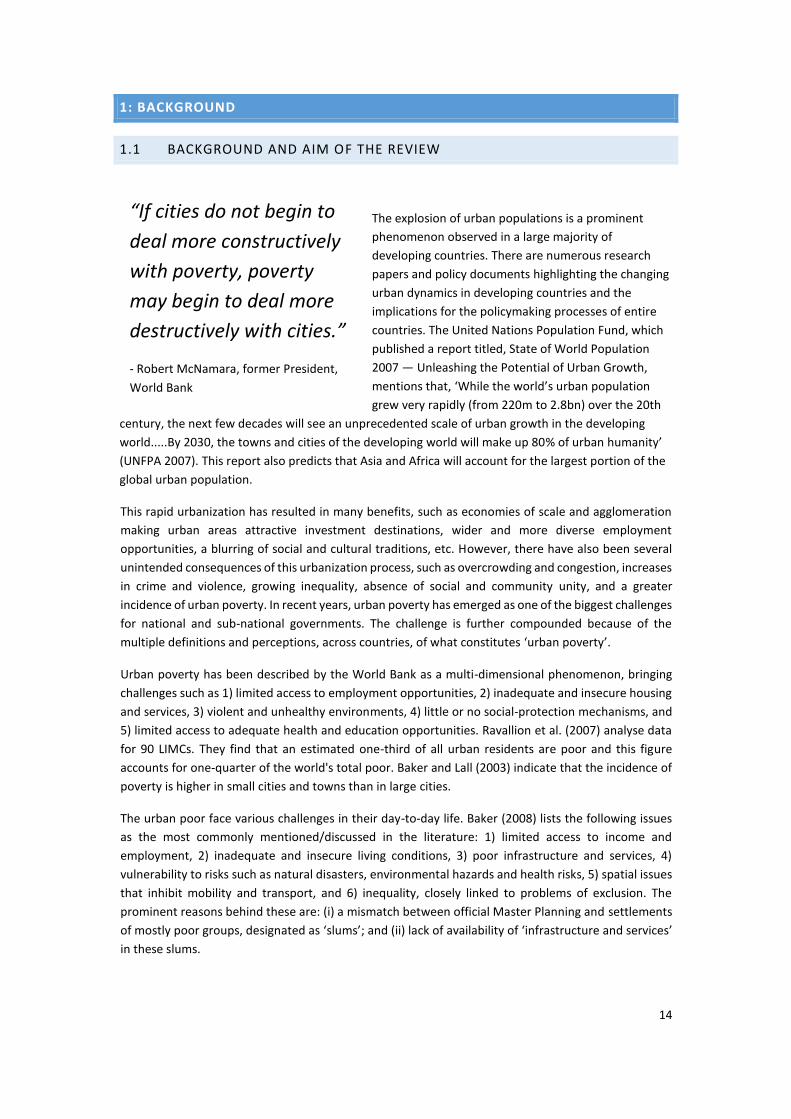
The explosion of urban populations is a prominent
phenomenon observed in a large majority of
developing countries. There are numerous research
papers and policy documents highlighting the changing
urban dynamics in developing countries and the
implications for the policymaking processes of entire
countries. The United Nations Population Fund, which
published a report titled, State of World Population
2007 — Unleashing the Potential of Urban Growth,
mentions that, ‘While the world’s urban population
grew very rapidly (from 220m to 2.8bn) over the 20th
century, the next few decades will see an unprecedented scale of urban growth in the developing
world.....By 2030, the towns and cities of the developing world will make up 80% of urban humanity’
(UNFPA 2007). This report also predicts that Asia and Africa will account for the largest portion of the
global urban population.
This rapid urbanization has resulted in many benefits, such as economies of scale and agglomeration
making urban areas attractive investment destinations, wider and more diverse employment
opportunities, a blurring of social and cultural traditions, etc. However, there have also been several
unintended consequences of this urbanization process, such as overcrowding and congestion, increases
in crime and violence, growing inequality, absence of social and community unity, and a greater
incidence of urban poverty. In recent years, urban poverty has emerged as one of the biggest challenges
for national and sub-national governments. The challenge is further compounded because of the
multiple definitions and perceptions, across countries, of what constitutes ‘urban poverty’.
Urban poverty has been described by the World Bank as a multi-dimensional phenomenon, bringing
challenges such as 1) limited access to employment opportunities, 2) inadequate and insecure housing
and services, 3) violent and unhealthy environments, 4) little or no social-protection mechanisms, and
5) limited access to adequate health and education opportunities. Ravallion et al. (2007) analyse data
for 90 LIMCs. They find that an estimated one-third of all urban residents are poor and this figure
accounts for one-quarter of the world's total poor. Baker and Lall (2003) indicate that the incidence of
poverty is higher in small cities and towns than in large cities.
The urban poor face various challenges in their day-to-day life. Baker (2008) lists the following issues
as the most commonly mentioned/discussed in the literature: 1) limited access to income and
employment, 2) inadequate and insecure living conditions, 3) poor infrastructure and services, 4)
vulnerability to risks such as natural disasters, environmental hazards and health risks, 5) spatial issues
that inhibit mobility and transport, and 6) inequality, closely linked to problems of exclusion. The
prominent reasons behind these are: (i) a mismatch between official Master Planning and settlements
of mostly poor groups, designated as ‘slums’; and (ii) lack of availability of ‘infrastructure and services’
in these slums.
“If cities do not begin to
deal more constructively
with poverty, poverty
may begin to deal more
destructively with cities.”
- Robert McNamara, former President,
World Bank

15
The UN-HABITAT has analysed the urbanization phenomenon across the world and the report on the
state of the world's cities 2009/10 has presented the global assessment of slums. The report states that
828m, or 33% of the urban population of developing countries, resides in slums. This large proportion
of slum-dwellers has brought an intense focus on the ‘eradication of slums’ among leaders of both
developed and developing countries. The criticality of eradication of slums is recognised by the United
Nations under MDG 7, Target 11. The target is: ‘By 2020, to have achieved a significant improvement
in the lives of at least 100m slum-dwellers’ (MacPherson 2013).
As with the terms ‘urban’ and ‘poor’, ‘slum’ is defined and discussed from various perspectives. The
definition of ‘slum household’ by the UN-HABITAT broadly captures the concept discussed in the
literature, which is, ‘A slum household is a household that lacks any one of the following five elements:
1) access to improved water (access to a sufficient amount of water for family use, at an affordable
price, available to household members without being subject to extreme effort) 2) access to improved
sanitation (access to an excreta-disposal system, either in the form of a private toilet or a public toilet
shared with a reasonable number of people), 3) security of tenure (evidence of documentation to prove
secure tenure status or de facto or perceived protection from evictions), 4) durability of housing
(permanent and adequate structure in a non-hazardous location), and 5) sufficient living area (not more
than two people sharing the same room).’ There is also literature that links ‘slums’ to the legal status
of land — the non-recognition of tenure security to the dwellers.
The lack of physical infrastructure such as water supply, sanitation, waste collection, electricity, and
street lighting severely affects the health, quality of life and social well-being of slum-dwellers. The
impact of poor supporting infrastructure on the health of the urban poor has been investigated by
different agencies. The diseases common or prevalent in urban areas due to poor infrastructure are
diarrhoea, malaria, cholera and respiratory diseases.
Various policy interventions, such as slum up-grading, slum rehabilitation and resettlement, and so on,
are being adopted in various countries to improve housing conditions and delivery of urban services in
slums. The results of these interventions have been varied and there is a need to investigate the
evidence in order to understand the efficacy of various interventions and, based on these observations,
to design appropriate interventions for a particular situation.
1.2 DEFINITIONAL AND CONCEPTUAL ISSUES
SECTORS
This systematic review examines the evidence on the access to basic services in low-income or informal
settlements, under top-down and bottom-up approaches. Basic services generally include access to
water, sanitation, and energy. Energy comprises different sources, such as cooking fuel (kerosene,
cooking gas, etc.); electricity for heating, lighting, and operating lifestyle equipment; fuel for
transportation, etc. In the interest of keeping the systematic review focused, we considered only
electricity, and excluded all other forms of energy. In addition, the decision to focus on electricity was
also driven by the literature. Studies that have analysed energy services for the poor have invariably
focused on electrification (for example, Baruah 2010). Moreover, access to electricity provides a wide
range of economic, social and health benefits (Price 2000; World Energy Assessment 2000). The
benefits from access to electricity have been well identified with the achievement of the MDGs (Flavin
and Aeck 2006, Ha and Porcaro 2005).

16
COUNTRIES
This review will focus on evidence from LMICs, together referred to as ‘developing countries’ by the
World Bank1. The study was restricted to developing countries because of the substantial heterogeneity
in context between developed and developing countries, which can limit the validity of the synthesis.
While it is recognised that there is considerable heterogeneity even among developing countries, we
chose not to limit the countries to be included in the review because of the widespread problems of
slums and low-income informal settlements seen in these countries. For example the percentage of
urban populations living in slums in 2001 in developing countries was 43%, whereas the corresponding
percentage for developed countries was only 6% (UN-HABITAT 2003). Therefore, the topic of this
review is very relevant for a majority of the developing countries, and our strategy is to capture the
diversity by contextualising the analysis or incorporating the same as appropriate moderator variables
in statistical synthesis.
INTERVENTIONS
The interventions for this review can be broadly classified into two categories: the traditional top-down
approach (by centralised planning and implementation by the government – and sometimes private –
provision of services) and the bottom-up approach (by alternative service providers, such as NGOs and
CBOs). Categorising in this way also gives an indication of the degree of inclusivity, the bottom-up
approach being more inclusive than the top-down approach. Inclusive urban planning, for example,
takes into account the needs of the poor and formulates specific strategies to improve or redevelop
slums in ways that make the poor better off. In general, a top-down approach is less inclusive than a
bottom-up approach. If the framework is formal city-level planning, driven by the government, then it
constitutes a top-down approach. In contrast, if the approach is for micro-planning for individual slum
improvements, then it would be classified as a bottom-up approach. In between these two extremes,
there is a spectrum of approaches that involve varying levels of inclusivity. For example, the
involvement of NGOs, CBOs, and resident associations increases the element of inclusiveness in the
planning and implementation process.
In general, in the absence of clear information, we take government to be the default service provider.
Service providers that involve other providers are classified as alternative service providers. For
example, if there is no information on involvement of any alternative service provider, it is assumed
that the service provider in the slum was the government. If the services in the slum are provided by
non-government or private service providers, the slums are categorised as being serviced by alternative
service providers.
We considered the level of participation from the community as accounting for the degree of inclusivity.
Participation refers to the involvement of different stakeholders, such as community residents, officials
from government, and other institutions, such as NGOs and CBOs, in the delivery of basic services.
Possible forms of community participation are as follows (adapted from UN-HABITAT 2003, Kingston
1998):
1Source: http://data.worldbank.org/about/country-and-lending-groups accessed on 24 June, 2014;
http://data.worldbank.org/about/country-classifications

17
Passive participation: Poor communities participate by being told about initiatives that are being
planned or have already been decided upon, without any attempt to elicit local opinion or knowledge.
Participation through giving information: Poor communities are asked about their needs through
surveys or similar instruments. The information is used anonymously in the decision-making process,
without feedback.
Participation through consultation: Poor communities are consulted as to what should be done to
improve the situation, but there is no obligation to take the residents’ views into account.
Participation through contribution: Poor communities are asked to provide labour or financial
contributions towards the provision of services and the residents agree to take primary responsibility
for the well-defined components of the project.
Participation through partnership: Poor communities and other key actors share resources, knowledge,
and risks in pursuit of commonly agreed-upon improvements. Partnership implies a long-term,
equitable relationship.
Participation through self-mobilisation: Poor communities work together to demand and/or implement
improvements in basic services. They develop contacts with experts, who will contribute with
managerial and technical skills, but community groups retain control over how the resources are used.
Since many studies do not give details of the level of participation, we broadly classified participation
into two levels: with and without participation. Passive participation was classified as ‘without
participation’ and the remaining five levels of participation were classified as ‘with participation’.
However, when summarising the studies numerically for the bottom-up approach, ‘with participation’
was further classified into two sub-categories to denote the extent of participation. Participating by
giving information, consultation and contribution were grouped into one sub-category, whereas
participating through partnership and self-mobilisation were grouped into a second sub-category.
We differentiate between inclusivity and participation because an inclusive urban-planning approach
may or may not be participatory. (Examples include the Basic Services for Urban Poor (BSUP)
programme implemented by the government of India). Similarly, high levels of participation do not
guarantee a higher degree of inclusivity. For this reason, these two dimensions were captured
separately when characterising the nature of the planning framework.
MODERATORS
The outcomes are dependent not only on the interventions, but on a lot of other variables. Together,
we refer to them as moderator variables. To facilitate analysis of these moderators, they were broadly
classified into one of three categories: context, content, and process (adapted from Pettigrew 1987,
Dawson 1994, and Nelson and Dowling 1998). Context refers to the wider social environment and the
individual setting of the slums. Content refers to the elements of the intervention. Process refers to the
actions, reactions and interactions of the various interested parties in the implementation of the
programmes/planning framework.
Based on the literature reviewed and the inputs from the advisory board, we classified the moderators
into the following categories:

18
Context: Type of slum (declared or undeclared slum); security of land tenure; and institutional form and
structure; spatial location of the slum, etc.
Content: Type of facility (for example, in the case of water supply, is it a household connection to piped
water, a connection to a public water outlet, or access to non-piped water, such as open or bore wells);
source and quantum of funding for the project.
Process: This includes implementation, maintenance and operations of the facility.
OUTCOMES
This review synthesises the evidence on top-down and bottom-up approaches in improving access to
basic services for the urban poor. Access is an important element in achieving the MDGs (Global Urban
Observatory 2003) and is the outcome under consideration in this review. In this review, we consider
access to have the following dimensions or outcomes: connectivity, affordability, adequacy, effort and
time, durability and sustainability. Assessments of effect (positive, negative, etc.) on the above
outcomes arising from the different delivery approaches have been synthesised in this review. While
the traditional definitions of access would mean connectivity to the service, it has been indicated that,
in the context of improvement of slums, the indicators of access would be more broad-based. The
different access indicators for the three sectors (UN-HABITAT 2002) are:
Water supply: Proportion (or number) of households with access to water supply, availability at an
affordable cost; at a sufficient quantity; and without excessive effort and time.
Sanitation: Proportion (or number) of households with access to adequate sanitation facilities.
Electricity: Proportion (or number) of households with electricity connections; availability of electricity
at an affordable cost; at specified voltages; and without excessive disruptions.
Based on the above, we define the different dimensions of access as follows:
Connectivity: This dimension seeks to study the proportion (or mean number) of households with
access to services such as water supply (public tap or individual in-house tap), sanitation facilities
(individual toilet or community toilet) or legal electricity connections at household level, provided
either by government or alternate channels.
Affordability: The proportion of households who found the services affordable (or) the mean cost
involved in accessing the services for the dwellers.
Adequacy: This dimension seeks to measure the proportion of households who found the services
adequate (or) the mean level of consumption of services.
Effort and time: Proportion of households who were able to access the services without excessive effort
and time (or) the distance from the households for accessing the services (mainly relevant for water
and sanitation) will be studied under this dimension.
Durability: This seeks to explore whether the improvements in access is temporary or of a more
permanent nature. While the definition of what is temporary or permanent is subjective and can differ
between contexts, our objective is to check whether the improvements are short-term or likely to be
long-term.

19
Sustainability: This dimension would analyse the environmental impact of the facilities created to
provide access.
In sum, our outcome indicators consist of the following components of access: connectivity,
affordability, adequacy, effort and time, durability and sustainability. Figure 1.1, below, gives the
conceptual overview of the review.
Figure 1.1: Conceptual overview of the review
? ?? + ?? ? ??
Top-down
approach -
City-level plan
Government
Grant agencies
NGOs
CBO s
User involvement
Bottom - up
approach
Micro-slum
development
program s
Access to s ervices
Sectors
Water supply
Sanitation
Electricity
Components of access
Connectivity
Affordability
Adequacy
Effort and time
Durability
Sustainability
Context
Content Process
Type of settlement
Notified
Informal
Institutional form and structure
Slum features (land tenure, location, etc.)
Type of facility
Type and q uantum of funding
Implementati on, maintenance and operations
State
Community
Private
Dwellers
Interventions
Moderator s
Outcomes
Passive
Participation
Information
Consultation
Contribution
Partnership
Self -
mobilization
Planning
Implementation
D elivery
Access to basic s ervice s in slums and low
- income
informal settlements in urban areas
High Participative spectrum Low
Hi gh
Granular ity of Planning
Low

20
1.3 POLICY AND RESEARCH BACKGROUND
The global urban population is growing, with 54% living in urban areas in 2011, and this is expected to
increase to 66% by 2050 (Heilig 2012). According to a 2008 study by UN-HABITAT, one-third of the urban
population in developing countries at this time lived in slums, the conditions being noticeably worse in
some regions than others. For instance, in Sub-Saharan Africa, 62% of the urban population resided in
slum areas (UN-HABITAT, 2013). These are low-income or informal settlements where housing and
living conditions are very poor. They are often characterised by lack of access to basic services and
infrastructure, such as roads, street-lighting, drinking water and sanitation, due to a lack of legal
recognition. Households in these areas end up paying many times more than the public-network fee
charged for poor-quality water and sanitation services, since they are not served by the formal services.
Inadequate access to safe water and sanitation are responsible for a high burden of communicable
disease in developing countries, especially diarrhoeal diseases (Prüss et Al. 2002). Children under the
age of five bear the highest burden in this regard, with diarrhoea being one of the leading causes of
child mortality (contributing to 11% of all child deaths in 2010) (UNICEF 2012). Treating these diseases
also incurs high economic costs: that is, direct costs, including expenditure on healthcare for treating
illnesses, and indirect costs, such as loss of productive labour time due to sickness and caregiving. Other
costs include effort and time spent on fetching water, indignities faced due to open defecation, lack of
safety, and so on — factors especially affecting girls and women. The total economic costs of lack of
access to water and sanitation has been estimated at US$260bn per year (Hutton and Haller, 2004).
Investment of US$1 in this sector is estimated to have a global economic return of US$5 (on average)
through time saved, reductions in morbidity and mortality rates and improvements in productivity. For
instance, Ghana’s Trachoma Control Programme reduced the prevalence of active trachoma from 9.7‒
16.1%, to less than 3% in endemic districts between 2000 and 2010 through interventions such as water
and school-latrine provision, sanitation promotion using the community-led Total Sanitation approach,
and hygiene promotion (WaterAid 2014). Globally, time savings associated with improved sanitation
were estimated to be 30 minutes per individual per day, and 30 minutes per household per day for
improved water supply.
With growing urban populations and the increasing urbanisation of poverty, provision of water and
sanitation services to low-income and informal settlements in urban areas is a serious challenge faced
by the governments of developing countries.
MDGS AND ACCESS TO WATER AND SANITATION
The MDG for sustainable development adopted international targets for provision of water and
sanitation services and improvement of slum conditions. The incorporation of these targets into MDGs
underscores the policy relevance accorded to this sector. The goals, targets, indicators and progress
achieved to date are explained below (United Nations 2013):
MDG 7: Ensure sustainable development
Under this goal, the relevant targets are listed below:
MDG Target 7.C: By 2015, reduce by 50% the proportion of the population without sustainable access
to safe drinking water and basic sanitation.

21
Indicators:
1) Proportion of population using an improved drinking-water source.
2) Proportion of population using an improved sanitation facility.
Progress: In 2012, the proportion of the world’s population with access to an improved drinking-water
source was 89%, up from 76% in 1990. Although the target of halving the proportion of people without
access to an improved source had already been achieved in 2010, there were 748m people still lacking
access to safe drinking-water sources in 2012. Also, between 1990 and 2012, almost 2bn people gained
access to an improved sanitation facility (one that separates people from faeces hygienically). Despite
the large increases in sanitation coverage, however, 2.5bn people still did not have access to an
improved sanitation facility in 2012, out of which 1bn people resorted to open defecation.
MDG TARGET 7.D: By 2020, to have achieved a significant improvement in the lives of at least 100m
slum-dwellers
Indicator: Proportion of urban population living in slum-like conditions.
Progress: Although this target was achieved long before its deadline, the number of slum-dwellers
continues to grow. The number of urban residents living in slum conditions (lack of access to water, lack
of access to sanitation, overcrowding, dwellings made of non-durable material) was estimated at 863m
in 2012, up from 760m in 2000, and 650m in 1990.
PROVISION OF WATER AND SANITATION
NATIONAL AND REGIONAL GOVERNMENTS
National and regional governments, historically, through taxes redistributed through the public-sector
budget budgeting, have accounted for the majority of the spending in the water and sanitation sector.
Following the adoption of MDGs across the world, governments have increased commitments to the
water and sanitation sector in order to achieve the MDG targets. In 2008, African Union Governments
signed the Sharm el-Sheikh declaration, committing to prioritise water and sanitation and improve
transparency and accountability. In the eThekwini declaration, African ministers committed to
allocate at least 0.5% of gross domestic product (GDP) to fund sanitation and create separate public
budget lines for sanitation and hygiene in their countries (WaterAid 2011). Similarly, in the third High
Level Meeting of Water and Sanitation for All, convened by UNICEF, ministers from 43 developing
countries made commitments relating to steps that will be taken to remove constraints on the
expansion of water and sanitation services (SWA 2014). In recent times, governments have also tried
innovative approaches to increase access to the poor, instead of the traditional one-size-fits-all
model, as seen in, for example, the provision of conventional pipe networks.
Often in the past, national governments planned investments in water and sanitation through
local/regional governments and public-private partnerships, which, in turn, did not adequately address
the needs of the poor (Belsky et al. 2013). However, in recent times, slum upgrading (provision of
housing and basic services) has been increasingly recognised as a strategy for improving the conditions
of the urban poor and catalysing private investments by residents (Cities Alliance 2006). Country and
city development strategies are becoming more inclusive (inclusive urban-planning approaches), by

22
taking into account, within their frameworks, the provision of basic services for the urban poor. For
instance, the government of India’s Jawaharlal Nehru National Urban Renewal Mission (JNNURM),
targeting 63 key cities and urban areas, focuses on services to the poor as one of its explicit missions.
Under JNNURM, it is mandatory for all local bodies to implement the following poverty reforms in order
to receive funding: local urban bodies should allocate funds to provide basic services to poor
households within local budgets; provision of these services to be implemented within a specific time
period, earmarking at least 20‒25% of developed land to low-income categories; and so on. When the
cities implement these reforms, it is expected that slum-dwellers will gain access to basic municipal
services, such as water supply, toilets, waste-water drainage, solid-waste management, power, roads,
and transport (CGG 2010).
OVERSEAS AID
Multilateral agencies such as the World Bank, the WHO and UNICEF, bilateral donors such as USAID,
DFID and the Swedish Development Cooperation Agency (SIDA), national and regional governments,
international and local NGOs have been engaged in improving access to water and sanitation services,
particularly to poor people across the world. The World Bank group is the largest source of external
financing for water-related interventions. During 2009‒13, financing to the tune of US$16.9bn was
approved for water- and sanitation-related projects supported by the bank. It is estimated that bank-
supported projects have provided 123m and 5.8m people with improved access to, respectively, water
and sanitation between 2002 and 2012 (World Bank 2014).
Following the adoption of water and sanitation targets in the MDGs, ODA commitments to this sector
have also increased. ODA to developing countries for the water and sanitation sector increased to over
five times 1990 levels (see Figure 1.2). ODA to the water-supply and sanitation sector amounted to
more than US$7.6bn in 2010‒11 (total annual aid commitments), representing 6% of total sector
allocable aid. This is targeted to regions that have poor coverage of water and sanitation services: Sub-
Saharan Africa received 25% of total aid and South and Central Asia 23% in 2010‒11. The poorest
countries received 33% of total aid to the sector (OECD 2013). Of total aid, 19% was contributed to
water-supply activities, 18% to sanitation and 42% to combined water-supply and sanitation activities.
Figure 1.2: Official Development Assistance to Water Supply and Sanitation
0
2000
4000
6000
8000
10000
12000
19
71
19
73
19
75
19
77
19
79
19
81
19
83
19
85
19
87
19
89
19
91
19
93
19
95
19
97
19
99
20
01
20
03
20
05
20
07
20
09
20
11
USD
(m
illio
ns)
cu
rre
nt
pri
ces

23
Source: Organization for Economic Cooperation and Development Creditor Reporting System
database.2
ODA is primarily directed to bilateral and multilateral organisations. For instance, DFID expenditure on
water, sanitation and the hygiene sector amounted to €245m in 2010‒11, and was concentrated on
Asian and Sub-Saharan regions (DFID 2012). Similarly, AusAid supports water and sanitation projects in
the Indo-Pacific region through partnerships with governments, NGOs, civil societies and multilateral
partners such as the World Bank, with an estimated expenditure of US$163.5m (DFAT 2014).
INNOVATIVE PARTICIPATION BASED APPROACHES TO DELIVER BASIC SERVICES
In recent times, effective community participation to design and implement water and sanitation
projects for the urban poor has been attributed importance by the governments and overseas donors.
This is essential for making these projects more demand-driven and for ownership, use and
sustainability of these assets (OECD 2013). Also, traditionally, infrastructure projects rely more on tariffs
for cost recovery. As an alternative, Winpenny and Camadeus’ (2003) recommend finding an
appropriate combination of tariffs, taxes and transfers (the 3Ts; primarily through ODA) for each
country, in order to finance water and sanitation projects sustainably. The report also recommends
sustainable cost recovery, rather than full-cost recovery, and recommends setting tariffs policies that
are affordable to all sections of society, including the poorest.
Table 1.1, below, provides some examples of different successful approaches that have been
implemented in various regions of the world, to provide access to water and sanitation to the urban
poor; the text following it gives a short description of these approaches.
Table 1.1: Illustrative approaches for giving water and sanitation access to urban
poor
Type Policy/Project
Name
Country Sector Approach Description
NGO-
Communities
Orangi Pilot
Project (OPP)
(WSP 2009).
Pakistan Sanitation Bottom-up, with
community
participation
through
contribution.
Micro-slum sanitation
project, completely
financed and built by the
community, while an NGO
provided technical
assistance.
2 http://stats.oecd.org/qwids/ accessed on 15 July 2014.

24
Type Policy/Project
Name
Country Sector Approach Description
National and
regional
governments,
CBOs,
communities
Water and
Sanitation
Program for
Low-Income
Urban
Population
(PROSANEAR I)
(Katakuraand
Bakalian 1998).
Brazil Water and
sanitation
Top-down
approach, with
participation
through
consultation.
PROSANEAR teams went
into communities to ask
which kind of project the
community preferred, and
if they were willing to
contribute effort, time and
money to the project.
City
development
plan/strategy
Ger-area
(Informal
settlements)
Upgrading
Strategy (GUS)
(Cities Alliance
2010).
Mongol-
ia
Water and
sanitation
Top-down
approach, with
community
participation
through
consultation/
giving.
Municipality of
Ulaanbaatar city, capital of
Mongolia, developed city-
wide pro-poor Ger-area
(informal settlements)
upgrading strategy, in
consultation with various
stakeholders.
ODA, NGOs,
CBOs, local
governments
Community-led
Infrastructure
Facility (CLIFF)
(Jack and Morris
2005).
India,
Kenya
Housing,
sanitation
Grant-based
approach.
CLIFF helps in leveraging
the financial resources of
slum-dwellers, so that they
can access capital from the
public and private sectors.
Orangi is Karachi’s largest informal settlement, with a population of more than 1m, and has faced a
huge sanitation and sewerage crisis. In this scenario, OPP (set up by the Bank of Commerce and Credit
International Foundation, with the social scientist, Dr Akhtar Khan) developed a low-cost sanitation
technology and convinced the residents of lack of funds with the local bodies to construct sewer system
for the community. They provided technical guidance to enable poor households to construct and
maintain their own sanitation systems. The residents were, in turn, responsible for the finances and
management of the construction work. In this way, improved sanitation was provided for
approximately 900,000 people and 94,122 houses, at the cost of only US$13 per household. This is an
example of a micro-slum project planned and implemented by an NGO and the local community.
PROSANEAR I is not a single project, but a group of different projects implemented in various
communities across different districts of Brazil. The project was jointly financed by the World Bank
(50%), the local water companies, state or municipal government (25%), and the Caixa Econômica

25
Federal (CEF, the Brazilian Government development bank (25%).3 PROSANEAR I mandated low-cost
technology (investment ceilings were fixed at US$98 and US$140 for water and sewerage, respectively)
and community participation, through which it brought water and sewerage connections to 1m people
in low-income settlements across 17 cities. This is an example of a top-down approach with community
participation through consultation.
GUS is a citywide development strategy involving participation through consultation/giving for
upgrading the Ger areas4 of Ulaanbaatar city. The city was supported with services like water supply
and electricity network, but Ger areas enjoyed limited access to these services due to a lack of legal
recognition and planning for upgrading, among other factors. GUS was then developed through
consultation with multiple stakeholders, including government agencies, the private sector, civil
societies, NGOs, Ger communities and international aid agencies. Accordingly, Ger areas were classified
into three types (Central, Middle and peri-urban areas), and specific strategies for upgrading were
developed. Since the adoption of these strategies in 2007, the design and implementation of national
and international programmes and projects for the upgrading and development of Ger areas are guided
by these strategies.
CLIFF in India was established by Homeless International, with funding from DFID and SIDA. CLIFF
provides loans and technical-assistance and knowledge grants, and guarantees to the community-led
slum-upgrading schemes that are taken up in partnership with city authorities. CLIFF kick-starts
community projects, initially with loans, while negotiations for funding from other sources, such as
banks, takes place. These resources are used for sustainable housing and basic services’ projects for
slum-dwellers (including sanitation), with potential for scaling-up. During Phase I (2002‒10), 29 projects
were taken up, of which sanitation was a component of four. This programme has now been expanded
to Kenya and Philippines (EUWI and SHARE 2012).
There are other examples of water and sanitation projects implemented for improving access to urban
poor through different partnerships. Although there have been various kinds of interventions to
improve access, there is little evidence as to which approaches are most effective and efficient in
delivering basic services to the urban poor. In a report on the bilateral aid review of the Water,
Sanitation and Hygiene (WASH) portfolio, DFID notes that ‘There is limited rigorous evidence regarding
the best choice of context-specific delivery models for programming.‘ (DFID 2012). The report attributes
two reasons for this: a lack of systematic data for evaluating the effectiveness of specific interventions,
and huge variations between approaches implemented across different settings. While lack of data and
variations in the context cannot be easily overcome, this review is an attempt to synthesise the
evidence through a systematic search of the literature.
SUMMARY
For project planners, policymakers and service providers, there is a pressing need to understand the
context-specific factors responsible for success or failure of different approaches to delivering basic
services to the urban poor, experimented with across different regions of the world. This will help to
3 The World Bank provided the loan to the CEF, which, in turn, loaned it, along with its contribution, to
the Municipality or other government agencies responsible for project implementation.
4 Ger areas are traditional low-density settlements that are not recognised as formal parts of the city.

26
identify barriers and propose practical solutions to improving access to basic services among the urban
poor. However, systematic reviews on water and sanitation interventions extensively focus on their
health-related effects, such as a reduction in diarrhoeal diseases (Fewtrell et al. 2005) in developing
countries and the nutritional status of children (Dangour 2013), while there is no such review on the
effectiveness of different approaches and their determinants. Consequently, a systematic review of
evidence on best urban planning practices to provide improved water and sanitation services to the
poor will help inform public policy and achieve further progress towards achieving MDGs.
1.4 AUTHORS, FUNDERS AND OTHER USERS OF THE REVIEW
The authors, funders and members of the study advisory board are given in Appendix 1. The study was
funded by DFID. The EPPI-Centre, Social Science Research Unit, Institute of Education, University of
London, provided the technology and advisory support for the review.
The results of this review will be particularly useful to multilateral and bilateral funding agencies, urban-
planning agencies, and governments and civil-society organizations.
1.5 REVIEW QUESTIONS
The review was initially conceptualised to synthesise the evidence on the effectiveness of different
urban-planning frameworks for improved access to water, sanitation and electricity services in low-
income or informal settlements. However, a review of the available evidence indicated that outcomes
cannot be attributed only to planning. The results are also dependent on the mode of implementation
and delivery of services. In addition, studies did not specifically analyse planning in isolation, but very
often treated planning-implementation-delivery as one continuous spectrum. Therefore, the review
synthesised the evidence on the entire delivery approach to provide basic services, and not just on
planning. This approach was supported by the study-policy advisory board as well, since efforts to
provide basic services were often not a part of city-level plans, but were bespoke, micro-level
implementations.
Secondly, studies indicated the prevalence of two polar-opposite approaches in the delivery of basic
services to slums — the first in which the effort was led by the government and the second in which
the effort was led by alternative service providers such as NGOs, CBOs, and the private sector. The
former was called the top-down approach and the latter was called the bottom-up approach. While it
may not be possible, in practice, to have a purely government-led implementation without any
involvement from the community, NGOs, CBOs, etc., or vice versa, the classification of a top-down or
bottom-up approach was based on who played the dominant role in the delivery of basic services. The
programme descriptions given in the studies was carefully reviewed when classifying as top-down or
bottom-up.
Given this context, the question that was taken up for this systematic review was:
‘What is the evidence on top-down and bottom-up approaches in improving access to water, sanitation,
and electricity services in low-income or informal settlements?’
More specifically, the objective of the review was to seek answers to the following:
1. How effective are the top-down and bottom-up approaches in improving access to water
supply, sanitation and electricity services in low-income or informal settlements in LMICs?

27
2. Under what circumstances do these approaches deliver better results? Why?
3. What are the strengths and limitations of these two approaches in respect of providing access
to basic services in low-income areas and informal settlements?
1.6 OUTLINE OF THE REPORT
The report is organised into five chapters. The current chapter introduces the report. Chapter 2
describes, in detail, the methodology adopted. Chapter 3 provides a description of the identified studies
using the methodology described in Chapter 2. Chapter 4 provides the results of the in-depth review of
the studies identified in Chapter 3. Chapter 5 highlights the key findings, implications and certain
limitations of the review.

28
2: METHODS USED IN THE REVIEW
2.1 OVERVIEW
This chapter provides the details of the search strategy, the methods used to identify the studies to be
included in the review, and the methods used to synthesise the results in the included studies. The
process comprises the following steps:
Formulating exclusion and inclusion criteria to be used to determine the studies to be included
in the review
Deciding on the sources and the search methods (search phrases) to be used to identify the
studies.
Managing the shortlisted and identified studies using a review-management software.
Synthesising the evidence in the included studies using the following methods: numerical
summary, meta-analysis and textual narration.
The entire search process was carefully documented and the number of studies identified was recorded
at each stage, so that the entire process can be replicated, if need be, by other research groups. In
addition, documenting the search process will also help in updating the review in the future to include
additional studies that might have been carried out. Documenting the search process and the use of
well-defined exclusion and inclusion criteria also helps to reduce the study selection bias that might
occur in non-systematic reviews.
2.2 USER INVOLVEMENT
APPROACH AND RATIONALE
Evidence-based policy making is emerging as a major imperative. In recent times, international funding
and development agencies have been increasingly using past evidence as one of the important
parameters in their funding and developmental-assistance decisions. The authors of this review clearly
understand this imperative and would, therefore, direct this review towards policymakers and
practitioners.
METHODS USED
The main users of this review will be policymakers, as well as funding and development agencies such
as DFID. To understand the imperative of policymakers and increase the relevance of this review, we
incorporated user involvement at four levels:
First would be discussions with the funding agency. We had discussions with the policy team
of DFID during the protocol development and conceptualization stages of the review.
Second, a policy-advisory board was constituted, with members drawn from the government
involved in policymaking, a civil-society organisation, and the private sector. The inputs from
the advisory board have been taken into account in developing the conceptual framework and
objectives for the study. The policy-advisory team also reviewed the study protocol and the
draft report of the study.
Third, an academic advisory board was constituted to complement the inputs received from
the policy-advisory board. The academic advisory board provided inputs on the study design,
and also reviewed the draft report.

29
Fourth, the study review co-ordinating agency, EPPI, also helped in arranging the review of the
protocol and the draft of the report.
User involvement at multiple levels and stages helped to provide a review that is more appropriate to
the end-users. Details of the advisory board are given in Appendix 1, on the authorship of the report.
USERS OF THE REVIEW
The study is relevant to organisations (research, consulting, training, etc.) that work in policy,
governance and related areas. It is also relevant for policymakers in government, international agencies
such as DFID, and civil-society organisations.
2.3 IDENTIFYING STUDIES
DEFINING RELEVANT STUDIES: INCLUSION AND EXCLUSION CRITERIA
Since this is a systematic review, the first step involved was the formulation of appropriate inclusion
and exclusion criteria to be used to identify the studies for inclusion in the review. Studies were
searched for and shortlisted, first by applying the exclusion criteria; those that were excluded were not
evaluated further. The studies that remained were then evaluated on the basis of the inclusion criteria.
Only those studies that met all the inclusion criteria were considered for further evaluation. Table 2.1,
below, gives the exclusion and inclusion criteria used for identifying the studies.
Table 2.1: Inclusion and Exclusion criteria
Inclusion criteria Exclusion criteria Description/Rationale
Studies published in
English
Studies not published
in English
Given the time limitations and the language
constraints on the research team, only those
studies that were published or translated into
English were included in the review. Since English
is one of the most common languages in which
research findings are globally disseminated, we
believe that our search is representative.
Studies published
after 1999
Studies published
before 1999
It was felt that more recent evidence would be
more compelling for policymakers. Therefore, we
used a cut-off date to exclude studies that were
published before that date. We have used a 15-
year timeframe to identify the studies, that is,
studies published during 1999‒2013.
Reporting outcomes
on access
Studies that did not
analyse access
outcomes
Studies that analyse the effects of different urban-
planning approaches on access to basic services
were included, whereas studies that do not
measure the impact on various dimensions of
access were not included in the review.

30
Inclusion criteria Exclusion criteria Description/Rationale
Studies on developing
countries
Studies on developed
countries
Studies that are only based on data from
developed countries or those that do not
distinguish between developed and developing
countries in the analysis were excluded from the
review.
Therefore:
• Only studies pertaining to developing countries
and the ‘transition’ or ‘emerging’ economies as
classified by the World Bank were considered.
Broadly, the review covers studies concerning:
African countries; countries belonging to parts
of South and Central America (Latin America);
Asian countries, excluding Japan and the four
‘Asian Tigers’ (Hong Kong, Singapore, South
Korea and Taiwan); and the transition and
emerging economies in Eastern Europe and
Central and East Asia.
Studies that indicate
the effect of forms of
planning on access to
basic services
Type of planning and
effect on access not
considered
Those studies that have specifically considered
the different attributes of planning in the
provision of basic services have been included in
the review.
Studies that have analysed the effect of various
mediating factors on access to the identified
services, but have not specifically considered the
different attributes of planning in the provision of
these services, were not included in the review.
Coverage of the study
should extend to
electricity, water, and
sanitation
Studies that did not
cover any of these
three sectors
Infrastructure segments comprising delivery of
water, sanitation and electricity services. Studies
that dealt with supply or distribution of these
services to the consumers would dictate the scope
of this review.
Studies that were outside the domain of the
review, such as demand for housing, access to
roads, telecommunication, solid waste
management in slums, etc., were excluded from
the review. Other forms of energy, such as gas,
kerosene, bio-mass, etc., were not included in the
review.

31
Inclusion criteria Exclusion criteria Description/Rationale
Original research
studies
Review studies Studies that were reviews of existing studies were
not included in the review. However, these
reviews formed rich sources of studies for
inclusion in this review.
Minimum length of
the publication
should be four pages
Publications less than
four pages
Articles that were less than or equal to four pages
were not considered for the review, since we felt
that such short articles would not provide the
necessary information needed for quality
appraisal.
We decided not to specify in the inclusion/exclusion criteria whether the study was quantitative or
qualitative. Our initial database searches yielded a large number of hits. The quantitative studies
provide a stronger link between outcome and intervention; however, they do not necessarily highlight
the causal chain. In addition, these studies do not capture the richness of the context adequately.
Therefore, to complement the robustness of quantitative studies, we have included qualitative studies
as well since they capture the contextual differences and causal chain for evidence in a superior way.
IDENTIFICATION OF POTENTIAL STUDIES: SEARCH STRATEGY
HAND SEARCH
Firstly, the journals that extensively publish research on urban planning were identified and shortlisted
from the earliest issue in 1999 to the latest issue in 2013. The studies published in these journals were
manually examined. The citations of original research articles from these journals were exported into
EPPI-Reviewer and were subjected to further screening. The list of journals that were hand searched is
given in Appendix 2.1. Hand searching ensured that no relevant study from these journals was missed.
We started the study-identification process with a hand search, since it would give a good overview of
the different types of studies that were done in this area, the prominent authors and researchers who
published on this topic, and different keywords that could be used for subsequent automated searches.
WEBSITE SEARCH
After the hand search of journals, specific websites were searched that would potentially have various
unpublished studies and evaluation reports. The list of websites that were searched and the details of
the search process are given in Appendix 2.1. The website search further enhanced our understanding
of the literature in this area, which helped in sharpening the automated search process of the electronic
bibliographic databases.
ELECTRONIC DATABASES
The third step in the search process was to search for studies in the electronic bibliographic databases.
The different databases that were searched, and the search phrases that were used in the search, are
given in Appendix 2.1. Wild characters were used to capture possible variations in the search terms.
The hits were subsequently imported into EPPI-Reviewer, which was used to manage the search results.

32
REFERENCE SEARCH
As a next step in the search process, the references of all the studies that were included from hand
search and electronic databases for the review were checked for additional studies that might not have
been captured in the previous searches.
DIRECT CORRESPONDENCE
Finally, authors of papers obtained through electronic databases were contacted to obtain their inputs
on recent studies and working papers that they might have authored, but not yet published. Many of
them provided additional studies that they had authored, which were assessed against the exclusion
and inclusion criteria. In some instances, where access to the studies that were shortlisted from
electronic databases was not available, we corresponded directly with the authors requesting a copy of
their study.
The EPPI-Reviewer software was used to manage the entire search process. The citations, including the
abstracts and the document in PDF format, were imported into the Reviewer for screening. In some
cases, where the study details could not be directly imported to the Reviewer, it was entered manually
so that the entire repository of studies could be managed in the EPPI-Reviewer software.
IDENTIFYING ELIGIBLE STUDIES
After identifying and importing the eligible studies from the different sources to the Reviewer, each
study went through the inclusion and exclusion criteria at successive stages before its inclusion in the
review. The steps for screening of the studies included the following.
TITLE SCREENING
The first step involved a quick screening of the title of the article in order to establish its relevance for
review. Studies not found suitable at this stage were excluded from further evaluation. Those studies
for which a decision could not be made based on a review of the title were passed on for abstract
screening.
ABSTRACT SCREENING
Abstracts of the studies that were shortlisted from title screening were then reviewed to determine
their suitability for this study. If the abstract was found to be unsuitable, the article was not considered
any further. The studies were passed on for full-text review when a decision could not be made based
on the review of the abstract.
FULL-TEXT SCREENING
Full papers or reports were screened for those studies that were shortlisted after title and abstract
screening. Before full-text screening, duplicates were identified and deleted using the review-
management software. The inclusion and exclusion criteria were again applied to the full reports and
those that did not meet these criteria were excluded. Studies that qualified for inclusion based on the
review of the complete studies were appraised for quality (see below) to decide on their inclusion into
the review.

33
At each stage of the screening process, the decision to exclude the study or take it to the next stage
was taken by two reviewers, working independently. When there was a difference in the assessment
between the two reviewers, a third reviewer assessed the suitability of the study. The decision was then
based on the majority decision of the reviewers.
QUALITY-ASSURANCE PROCESS
Many of the studies included in the review were published in reputable peer-reviewed journals and/or
the studies were conducted by reputed organizations. In the next stage, the studies (both published
papers and unpublished reports) that conformed to the criteria indicated earlier were evaluated using
a critical-appraisal tool. Appendix 2.2 gives the appraisal tool used in this review.
Two members of the review team, working independently, appraised the studies for quality. Each paper
was assessed by two independent reviewers. Wherever the scores given by the two reviewers differed
significantly (that is, when there was a difference of two levels in the rating for each question), a third
reviewer assessed the paper. An average of all three scores was calculated to arrive at the overall study
rating. To ensure consistency, the team initially went through an internal-moderation phase, where
both members screened the same citations and compared the differences in judgements to arrive at a
common understanding on the assurance process.
CHARACTERISING INCLUDED STUDIES
The studies that remained after the application of the exclusion and inclusion criteria and the quality-
assurance process were included for the review (In fact, no study was excluded on the basis of quality
scores). Such studies were characterised on the basis of broad features, such as country of study;
sectors analysed; type of planning adopted; type of study; aims of study; data sources and data-
collection instruments; access outcomes and indicators analysed; methods used to analyse data,
including details of checks on reliability and validity; summary of results; conclusion; and the overall
assessment of the study findings relevant to the review, based on the critical-appraisal questions. This
helped to achieve a broad characterisation and overview of the included studies. Characterisation of
the studies included in the review is given in Appendix 2.3.
2.4 IN-DEPTH REVIEW: SYNTHESIS PROCESS
OVERALL APPROACH TO AND PROCESS OF SYNTHESIS
The studies that were identified for inclusion were characterised by substantial heterogeneity in terms
of the type of data, methodologies used, outcomes analysed, etc. It was felt that using a single synthesis
method would not adequately capture and explain the evidence in these studies. We have, therefore,
used three approaches to synthesise the results, and the inferences have been derived from a
combination of these procedures.
First, we used a count-of-evidence approach to provide a numerical summary of the evidence obtained
from all the studies included in the review. Second, we used meta-analysis techniques to synthesise the
evidence from those studies that could be synthesised using statistical techniques. Obviously, the
studies used for meta-analysis were only a subset of the total studies that were included in this review,
since not all the studies had information suitable for synthesis using this approach.

34
Third, a narrative approach was used to synthesise the evidence in all the studies included in this review,
since it is better suited for reviews that aim to describe the existing body of literature; identifying the
scope of what has been studied, and the strength of evidence available. In addition, this approach is
useful in synthesising evidence of different types, such as qualitative, quantitative, economic, etc.
(Lucas et al. 2007). Textual narrative also makes the context of the study clearer and is more likely to
make the heterogeneity between studies transparent (Barnett-Page and Thomas 2009). Since textual
narration helps to bring out the heterogeneity between studies, this method is also suitable for
synthesising evidence from the qualitative studies.
All studies selected for inclusion in the review were coded, and this was used to prepare the narrative
synthesis. The coding of the studies facilitated a common understanding among all the members, as
well as the knowledge that could be gleaned from them for inclusion in the textual narrative.
NUMERICAL SUMMARY OF THE EVIDENCE
Light and Smith (1971) described summarising studies numerically to gather the body of evidence
related to a theoretical relationship, by counting the percentage of tests that support the relationship,
and using that percentage as the basis for drawing conclusions about the state of the literature. While
there are some limitations to synthesising evidence by ‘vote counting’ (Combs et al. 2011), this
approach can complement the findings of other synthesis methods. While vote counting is generally
used to synthesise evidence from the statistical results of quantitative studies, in this review, we have
adopted this approach to synthesise results from both quantitative and qualitative evidence. The
objective of this exercise is to understand the state of the literature and provide a foundation for the
textual-narrative synthesis and, where studies can be combined statistically, compare the findings with
pooled measures of effect.
SYNTHESIS PROCESS
The procedure used for the numerical summary is as follows. For all the studies that qualified for
inclusion in the review, the relationships or associations between access outcomes, service provider,
and forms of urban planning were captured. The evidence on access was categorised as one of the
following: positive, negative, no impact, unclear, and inconclusive. In the synthesis process, the findings
of each study were extracted in a template covering: study sector (electricity, sanitation, water supply);
type of access within the sector if any (for example, individual private access or public, community-level
access); components of access for which the evidence was available (that is, connectivity, affordability,
adequacy, durability, effort and time, and sustainability); the type of slum (formal, informal, or low-
income); geographical region of the sample, study design and method, and so on. The numerical
summary synthesis done in this review differs from the traditional vote-counting method, which is used
for combining results only from statistical studies. The synthesis used in this review is based on all the
included studies, both quantitative and qualitative.
INDEPENDENCE OF STUDY OBSERVATIONS
While conducting the numerical summary (as in other forms of meta-analysis), it is important that the
observations from the different studies are independent, as non-independent findings from primary
studies can lead to bias in synthesis results. Non-independency or co-relations between findings of
various studies can occur from (Ringquist, 2013):

35
studies analysing multiple interventions, but using the same control sample for all the
interventions;
one or more studies using a common dataset;
one or more studies having common research teams; and
having multiple assessments of effect per study.
We used the following approach to minimise the occurrence of non-independence in the count-of-
evidence approach.
We considered the most robust evidence available when there was more than one evidence
for the same outcome and study sample.
We ensured that similar findings in different studies using a common dataset were not
considered.
META-ANALYSIS
Meta-analysis, a technique to synthesise effect sizes from multiple studies, is a systematic approach
to synthesise quantitative evidence from results of previously published studies in order to arrive at
conclusions on a body of research (Haidich 2010; Donna et al. 2000). Meta-analysis combines a
collection of evidence from independent studies on a particular topic to evaluate its magnitude and
the statistical significance of the summary effect. In this way, it plays a major role in effectiveness
research by providing coherent and statistically significant results to identify the strongest evidence,
based on the study's objective.
Over the four decades, the use of meta-analysis has grown extensively, not only in medical and social
sciences, but also in economic and public-policy research. Typically, clinical randomised controlled
trials (RCTs) are used in meta-analysis, but recent statistical approaches and tools have made meta-
analysis possible for observational studies, as well. The advantage of meta-analysis is that it provides
a more organised and quantifiable review of the literature and it also provides a defined precision
and objectivity to the summary estimate (Rosenthal 1991). However, there are possibilities that the
conclusion is less vibrant when the included studies have differing results. In order to overcome this
pertinent obstacle, a statistical test for heterogeneity is used to assess the variation across studies
(Higgins et al. 2003).
In our review, we have used meta-analysis to examine the effect of involving government and
alternative channels as service providers in improving the level of access to basic services in slums
and low-income or informal settlements in developing countries.
In performing meta-analysis, quantitative evidence was obtained from variables that provided evidence
on the level of access. The evidence from the treatment group was compared to the evidence from the
control group. The rationale for the choice of treatment and control group is as follows. The focus of
this review is to analyse the level of access in slum areas. Therefore, the natural tendency is to consider
the slum population as the treatment group. The comparable population is the control group. In the
top-down approach/government provisioning of services, access levels in slums were compared to the
levels in non-slum areas. Therefore, the non-slum population formed the control group. In contrast, in
the bottom-up approach, access levels are compared with the levels in the top-down approach. Since
the purpose of the review is to analyse the access levels from bottom-up implementation, the
population of slums serviced by alternate service providers is taken as the treatment group, whereas

36
the population of slums in government provisioning is taken as the control group. Table 2.3, below,
presents the predefined variables that were used to synthesise the evidence from the included studies.
Table 2.2: Variables used to synthesise the evidence
Component of access Predefined variables of interest
Connectivity Proportion (or mean number) of households with access to improved
connectivity services such as water supply (public tap or individual in-house
tap), sanitation facilities (individual toilet or community toilet) or legal
electricity connections at household level, provided either by government
or alternate channels.
Affordability Proportion of households who found the services affordable (or) the mean
cost involved in accessing the services for the dwellers.
Adequacy Proportion of households who found the services (or) the mean level of
consumption of services adequate.
Effort and time Proportion of households who were able to access the services without
excessive effort and time (or) the distance from the households for
accessing the services (mainly relevant for water and sanitation).
These measures formed the dataset which was created in Microsoft Excel. The dataset also included
various characteristics such as sample size, sector (water, sanitation or electricity), type of access
(individual or community), level of participation (some level of participation or passive participation),
intervention provider (government or alternative channels), type of evidence (before-after intervention
or cross-sectional survey), regions (Asia, Africa, South America or Central and North America), method
of data collection (primary survey or secondary data) and type of slum (informal, formal or low-income).
The study characteristics were used to analyse the data under appropriate groupings or as covariates
for running a meta-regression.
The Excel database was then analysed using STATA. Since most of the data were reported in
proportions, calculating odds-ratio would be the most appropriate measure to synthesise the results.
Hence, we extracted or calculated odds ratios for each outcome reported in the studies when available.
Odds ratio is the ratio of odds of success in the treatment group, relative to the odds of success in the
comparison or control group. The odds ratio is calculated as follows: Assume there are ‘a’ successes
and ‘b’ failures in the treatment group, and ‘c’ successes and ‘d’ failures in the comparison group. The
odds ratio is calculated as given in Equation (1).
𝑂𝑑𝑑𝑠 𝑟𝑎𝑡𝑖𝑜 = 𝑎 ∗ 𝑑
𝑏 ∗ 𝑐
(1)

37
We also illustrate the calculation using the data from one of the included studies. For example, in Zaki
and Amin (2009), measures were obtained from the primary survey conducted to assess the number of
slum households with access to a water connection. In the intervention group, 24 respondents reported
having a water connection, whereas 62 reported not having a water connection. In the comparison
group, 72 respondents reported having a water connection, whereas 14 reported not having a water
connection. The odds-ratio calculation for this evidence is given in Equation (2):
𝑂𝑑𝑑𝑠 𝑜𝑓 𝑠𝑙𝑢𝑚 ℎ𝑜𝑢𝑠𝑒ℎ𝑜𝑙𝑑𝑠 ℎ𝑎𝑣𝑖𝑛𝑔 𝑎 𝑤𝑎𝑡𝑒𝑟 𝑐𝑜𝑛𝑛𝑒𝑐𝑡𝑖𝑜𝑛 = 24 ∗ 14
72 ∗ 62= 0.0753
(2)
For the meta-analysis, the odds ratio was converted to the log odds ratio by taking the natural
logarithm of the odds ratio; that is, ln(0.0753) = −2.5863.
The Standard Error (SE) of the log odds ratio was calculated as given in Equation (3):
𝑆𝐸{ln(𝑜𝑑𝑑𝑠 𝑟𝑎𝑡𝑖𝑜)} = √(1
𝑎+
1
𝑏+
1
𝑐+
1
𝑑)
(3)
Applying (3) to our example, gives the SE of the log odds ratio. Equation (4) gives the calculation:
𝑆𝐸{ln(𝑜𝑑𝑑𝑠 𝑟𝑎𝑡𝑖𝑜)} = √(1
24+
1
72+
1
62+
1
14) = 0.3783
(4)
The effect size was subsequently calculated in STATA using the log odds ratio and SE{ln(odds ratio)}.
When the studies reported effect sizes in mean and standard deviation (for example, the distance
travelled to a community water outlet), the odds ratio would not be a relevant measure. In such cases,
the effect sizes were converted to Standardised Mean Difference (SMD) by calculating the mean
difference between the slum and control group. The SMD was calculated based on the method
suggested by Julian et al. in the Cochrane Handbook for Systematic Reviews of Interventions, version
5.1.0 (updated March 2011). Equations 5‒6 give the expression for calculating the SMD.
𝑆𝑀𝐷 = 𝐷𝑖𝑓𝑓𝑒𝑟𝑒𝑛𝑐𝑒 𝑖𝑛 𝑚𝑒𝑎𝑛 𝑜𝑢𝑡𝑐𝑜𝑚𝑒 𝑏𝑒𝑡𝑤𝑒𝑒𝑛 𝑔𝑟𝑜𝑢𝑝𝑠
𝑃𝑜𝑜𝑙𝑒𝑑 𝑆𝑡𝑎𝑛𝑑𝑎𝑟𝑑 𝐷𝑒𝑣𝑖𝑎𝑡𝑖𝑜𝑛 𝑜𝑓 𝑡ℎ𝑒 𝑝𝑎𝑟𝑡𝑖𝑐𝑖𝑝𝑎𝑛𝑡𝑠
(5)

38
𝑃𝑜𝑜𝑙𝑒𝑑 𝑆𝑡𝑎𝑛𝑑𝑎𝑟𝑑 𝐷𝑒𝑣𝑖𝑎𝑡𝑖𝑜𝑛 = √((𝑛𝑡 − 1) ∗ 𝑆𝐷𝑡𝑟𝑒𝑎𝑡𝑚𝑒𝑛𝑡
2 + (𝑛𝑐 − 1) ∗ 𝑆𝐷𝑐𝑜𝑛𝑡𝑟𝑜𝑙2
𝑛𝑡 + 𝑛𝑐 − 2)
(6)
The Standard Error for SMD was calculated using Equation (7):
𝑆𝐸 (𝑆𝑀𝐷) = √𝑛𝑡 + 𝑛𝑐
𝑛𝑡 ∗ 𝑛𝑐
+𝑆𝑀𝐷2
2 ∗ (𝑛𝑡 + 𝑛𝑐)
(7)
We illustrate the calculation of SMD for one of the included studies. In Tukahirwa and Oosterveer
(2011), primary survey data on mean cost for accessing community toilet was taken as the evidence for
assessing the outcome on ‘affordability’ between the informal slums where service was provided by
the private sector (treatment group) and the control group, which did not receive any benefit. The study
details are summarised in Table 2.4, below. The calculations are given in Equations 8‒10.
Table 2.4: Study details from Tukahirwa and Oosterveer (2011) for calculation of
SMD
No. of
participants in the
survey in
intervention
(treatment) group
Mean cost
(shilling) to
access toilets in
the
intervention
group
SDtreatment No. of
participants in the
survey in control
group
Mean cost
(shilling) to access
toilet in the
control group
SDcontrol
15 100.0 6.4 117 99.5 17.9
𝑃𝑜𝑜𝑙𝑒𝑑 𝑆𝑡𝑎𝑛𝑑𝑎𝑟𝑑 𝐷𝑒𝑣𝑖𝑎𝑡𝑖𝑜𝑛 = √((15 − 1) ∗ 6.42 + (117 − 1) ∗ 17.92
15 + 117 − 2) = 17.039
(8)
𝑆𝑀𝐷 = 100 − 99.5
17.039= 0.0293
(9)

39
𝑆𝐸 (𝑆𝑀𝐷) = √15 + 117
15 ∗ 117+
0.02932
2 ∗ (15 + 117)= 0.2742
(10)
Subsequently, SMD was converted into the log odds ratio using the formula dictated by Equations 11‒
12. This ensured that all the effect sizes were analysed using a common metric: that is, the log odds
ratio.
ln(𝑜𝑑𝑑𝑠 𝑟𝑎𝑡𝑖𝑜) = 𝜋
√3∗ 𝑆𝑀𝐷
(11)
𝑆𝐸{ln(𝑜𝑑𝑑𝑠 𝑟𝑎𝑡𝑖𝑜)} = 𝜋
√3∗ 𝑆𝐸(𝑆𝑀𝐷)
(12)
The log odds ratio for the above example was, therefore, calculated as 0.053 and SE{ln(OR)} was
calculated as 0.4973. The effect sizes were later analysed in STATA.
Using relevant commands in STATA to conduct meta-analysis, we calculated the pooled effect sizes (ES)
as a measure of the odds ratio by analysing the log odds ratio and its standard error. To ensure that the
pooled ES were appropriate, we did separate sub-analyses for effect sizes that can be appropriately
grouped together. We hypothesised that, if the effect size was significantly greater than 1, then the
intervention (type of delivery) had a significant effect on provision of connectivity to slum residents, as
compared to the control group. We used the random effects model in our analysis because of the
heterogeneity across the included studies, and the true effect size also varied from study to study. We
summarised pooled ES based on the sub-analysis using random effect models with the DerSimonian
and Laird Method to identify the between-study variance. Heterogeneity was analysed from I2 as it
presents observed dispersion in proportions. However, heterogeneity was inevitable included in our
review due to the inclusion of studies with a sampling variation of small and larger studies, diverse study
populations, different study methodologies and different methods used for collecting primary data.
Publication bias occurs when the published studies are not systematically representative of the
population they assess and, in meta-analysis, if the sample of studies retrieved for review is biased,
then the validity of the results is in question (Rothstein et al. 2006, Egger et al. 2000). Visual examination
of asymmetry in the funnel plot revealed elements of publication bias in the evidence taken for meta-
analysis. However, in our review, the study estimates showed a small-study effect, so a funnel-plot
asymmetry test was used to examine whether the association between intervention ES (log odds ratio)
and study size (se) measure is greater than might be expected to occur by chance (Sterne, Gavaghan
and Egger 2000). We have used Egger’s test (Egger et al. 1997) and Begg’s test (Begg and Mazumdar
1994) to assess publication bias. While the former uses linear regression, but is based on the efficient
score and its variance, the later uses rank correlation test. These tests were performed in STATA and a
significance of p<0.05 in any one of the tests indicates publication bias in the sub-analysis of meta-
analysis.
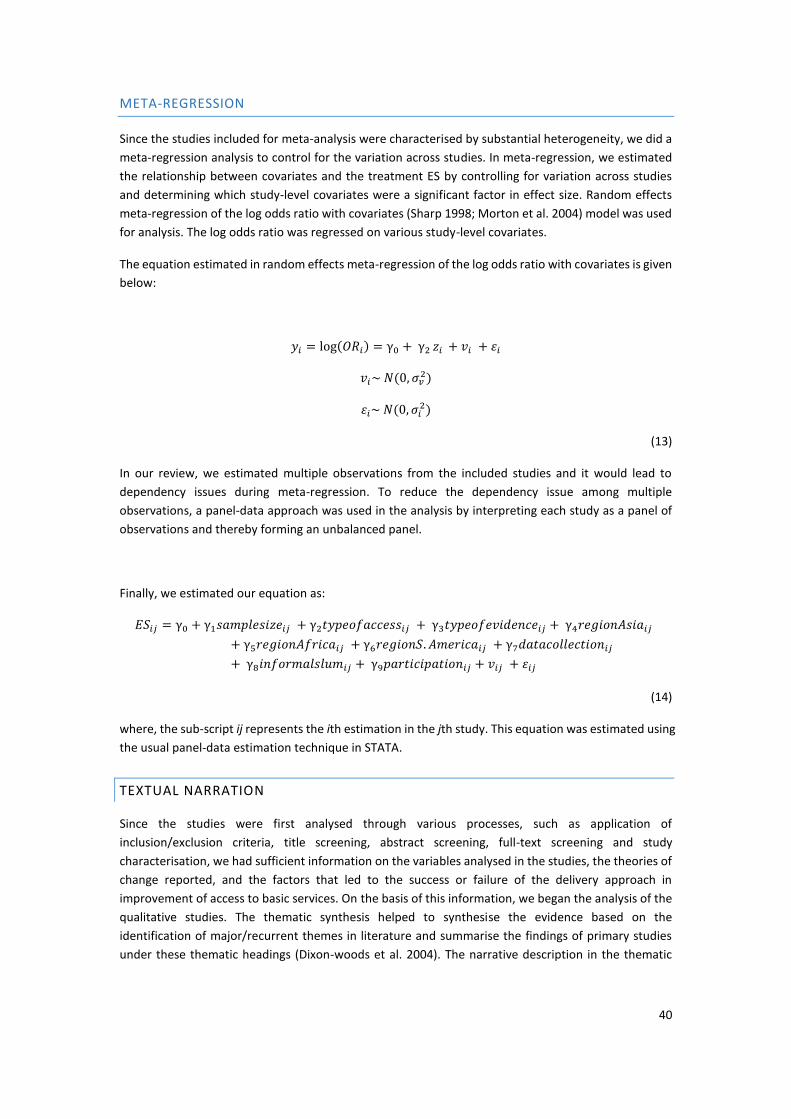
40
META-REGRESSION
Since the studies included for meta-analysis were characterised by substantial heterogeneity, we did a
meta-regression analysis to control for the variation across studies. In meta-regression, we estimated
the relationship between covariates and the treatment ES by controlling for variation across studies
and determining which study-level covariates were a significant factor in effect size. Random effects
meta-regression of the log odds ratio with covariates (Sharp 1998; Morton et al. 2004) model was used
for analysis. The log odds ratio was regressed on various study-level covariates.
The equation estimated in random effects meta-regression of the log odds ratio with covariates is given
below:
𝑦𝑖 = log(𝑂𝑅𝑖) = γ0 + γ2 𝑧𝑖 + 𝑣𝑖 + 𝜀𝑖
𝑣𝑖~ 𝑁(0, 𝜎𝑣2)
𝜀𝑖~ 𝑁(0, 𝜎𝑖2)
(13)
In our review, we estimated multiple observations from the included studies and it would lead to
dependency issues during meta-regression. To reduce the dependency issue among multiple
observations, a panel-data approach was used in the analysis by interpreting each study as a panel of
observations and thereby forming an unbalanced panel.
Finally, we estimated our equation as:
𝐸𝑆𝑖𝑗 = γ0 + γ1𝑠𝑎𝑚𝑝𝑙𝑒𝑠𝑖𝑧𝑒𝑖𝑗 + γ2𝑡𝑦𝑝𝑒𝑜𝑓𝑎𝑐𝑐𝑒𝑠𝑠𝑖𝑗 + γ3𝑡𝑦𝑝𝑒𝑜𝑓𝑒𝑣𝑖𝑑𝑒𝑛𝑐𝑒𝑖𝑗 + γ4𝑟𝑒𝑔𝑖𝑜𝑛𝐴𝑠𝑖𝑎𝑖𝑗
+ γ5𝑟𝑒𝑔𝑖𝑜𝑛𝐴𝑓𝑟𝑖𝑐𝑎𝑖𝑗 + γ6𝑟𝑒𝑔𝑖𝑜𝑛𝑆. 𝐴𝑚𝑒𝑟𝑖𝑐𝑎𝑖𝑗 + γ7𝑑𝑎𝑡𝑎𝑐𝑜𝑙𝑙𝑒𝑐𝑡𝑖𝑜𝑛𝑖𝑗
+ γ8𝑖𝑛𝑓𝑜𝑟𝑚𝑎𝑙𝑠𝑙𝑢𝑚𝑖𝑗 + γ9𝑝𝑎𝑟𝑡𝑖𝑐𝑖𝑝𝑎𝑡𝑖𝑜𝑛𝑖𝑗 + 𝑣𝑖𝑗 + 𝜀𝑖𝑗
(14)
where, the sub-script ij represents the ith estimation in the jth study. This equation was estimated using
the usual panel-data estimation technique in STATA.
TEXTUAL NARRATION
Since the studies were first analysed through various processes, such as application of
inclusion/exclusion criteria, title screening, abstract screening, full-text screening and study
characterisation, we had sufficient information on the variables analysed in the studies, the theories of
change reported, and the factors that led to the success or failure of the delivery approach in
improvement of access to basic services. On the basis of this information, we began the analysis of the
qualitative studies. The thematic synthesis helped to synthesise the evidence based on the
identification of major/recurrent themes in literature and summarise the findings of primary studies
under these thematic headings (Dixon-woods et al. 2004). The narrative description in the thematic

41
synthesis makes the context of the study clearer, highlights the heterogeneity between studies, and
helps to capture the strength of the evidence available (Barnett-Page and Thomas, 2009).
Three stages would be followed for conducting thematic synthesis of qualitative studies, as described
by Thomas and Harden (2008): 1) Coding of text ‘line by line’, 2) development of descriptive themes
and 3) generation of ‘analytical themes’.
The first two stages involve examining the studies, and coding each line of relevant text from qualitative
studies according to its meaning and content. The constructs or themes observed in a study were
identified and represented in the form of short textual descriptions, called ‘nodes’. The coding can be
carried out in two ways: i) if a researcher has knowledge about the themes to be looked into in an
article, then the node structure can be created before the start of the coding process; or ii) a researcher
can create nodes during the process of coding.
We prepared a node framework for coding relevant information in a study. During the process of
coding, we took care not to confine the emerging concepts from a study to our node framework.
Whenever a new construct emerged in a study, which was not covered in the existing node framework,
we added a new node to cover this. In that way, our node framework was dynamic, and evolved during
the process of coding. While preparing a node, we ensured that it was neither too specific, based on a
one-off phenomenon observed in a study, nor so generic as to restrict enrichment of the description of
a concept observed in a study.
The software tool NVivo was used in this process. The coding process resulted in the generation of new
codes across different qualitative studies and/or renaming of existing codes. It was an iterative process
of ‘axial coding’, as termed in the grounded theory (Barnett-Page and Thomas 2009). Before
completion of these two stages, the codes and related text were examined to ensure consistency of
interpretation. We then created visual representation of the constructs discussed in the study. We also
created models to visualise, explore and present the connections between themes.
The third step focused on ‘third-order interpretations’; this involved development of analytical themes
based on judgement and insights of the reviewers. The systematic review question provides guidance
for development of analytical themes, which was developed first by each reviewer and then reviewed
by the team. Each visual model was studied in detail for variables and the linkages discussed in the
study. Often, studies had more than one linkage. This was followed by the identification of
commonalities between models from different studies. We primarily looked into causal links repeating
across different models.
Finally, consolidated models were prepared by aggregating different causal links observed in a single
model. These consolidated models comprised different, nodes which highlighted a
concept/phenomenon of interest and the studies wherein the phenomenon was observed. These
different nodes were connected by the directional arrows representing relationships between nodes.
The analysis helped to identify appropriate factors that could improve outcomes from different
planning approaches.
2.5 SUMMARY
This chapter describes the methods used in the review. Methods can be broadly divided into two
categories: (i) the methods used to identify the studies for the review; that is, the searching, screening,
and selection process; and (ii) the methods used to synthesise the evidence from the studies identified
for inclusion in the review. We followed an exhaustive process to identify the studies for inclusion in

42
the review. We used multiple approaches to synthesise the evidence in the included studies. The
numerical summary of the evidence, although we arrived at it through what is considered a
conservative approach, gave a holistic view of the evidence. Meta-analysis involves a more rigorous
synthesis of evidence using quantitative tools and techniques. Textual narration helped to bring out the
causality between interventions and outcomes in greater detail.

43
3: IDENTIFYING AND DESCRIBING STUDIES: RESULTS
3.1 OVERVIEW
In total, 104 studies qualified for inclusion after applying the inclusion and exclusion criteria. We did
not eliminate studies based on quality appraisal, but chose to highlight the synthesis results of high
and medium-quality studies separately, wherever appropriate. Although the number of studies that
qualified for inclusion was higher than that usually seen in conventional systematic review, we chose
to include all the studies in the synthesis because of the strong heterogeneity across the studies. Since
sampling might not be representative, evidence from all the studies were included in the synthesis.
This chapter provides description of the studies that have been included in this review, and the
quality-appraisal results.
3.2 STUDY IDENTIFICATION AND SYNTHESIS PROCESS
A holistic approach to the study-identification process was adopted to identify relevant studies for the
review. A schematic overview of the study-identification and synthesis process is given in Figures 3.1
(a) and 3.1 (b). The database for identification of studies was divided into two groups: 1) Hand search
and electronic-database search and 2) website search of leading think-tanks and policy groups
relevant to the study, cross-references from identified studies, author correspondence and
Google/Google Scholar searches. The hand search and electronic database search yielded 22,010
studies, which were put through the process of title screening, abstract screening and full text
screening. A total of 56 studies that met the inclusion criteria were identified and appraised for
quality. The website database yielded 48 studies, which were also checked for quality. In total, there
were 104 studies shortlisted from both the databases. Since the electronic database was large, an
elaborate process was followed. However, a few steps were bypassed for the website searches, since
we obtained the documents directly from the authors or used the references from shortlisted studies.
Figure 3.1 (a): Study identification and inclusion for hand search and electronic-
database search.
Search methods for identification of studies other than electronicdatabses and hand searches
Sources
Hits obtained
Included studies
3,566 potential studies identified by the 19 website searches
68
studies identified
246 studies identified
Website search
(IADB, City Alliance, UN-Hábitat -
, World Bank, UNDP, 3ie ADB, Aus AID, DFID, EPPI, R4D
Cochrane, Campbell, Water
Aid, ESMAP, GNSED, Practical Action, CLIFF and SUF)
Author correspondence
Cross references
Cross references
Google & Google scholar
1,246 studies identified
21 studies included for
systematic review
5 studies included
8 studies included
14 studies included
48 studies to meet the inclusion criteria for systematic review

44
Figure 3.1 (b): Search methods for identification of studies other than electronic-
database and hand searches.
21,106 studies excluded
after title screening
683 studies excluded
after abstract screening
165 studies excluded
after full-text screening
Search and review process
Hand s earch
18,782 potentially relevant
studies identified
Electronic s earch
3228 potentially relevant studies
identified
Title s creening
Total 22,010 potentially relevant studies identified for title screening
Abstract screening
904 studies included for abstract screening
Full-text screening
221 studies were included for full-text screening
56 studies meet the inclusion criteria for systematic
review

45
3.3 QUALITY APPRAISAL OF SELECTED STUDIES
All the studies that were selected based on the inclusion criteria were checked against a quality-
appraisal checklist. Two members of the review team, working independently, appraised all the papers
to determine the overall quality (refer to section 2.3.4 for a detailed description of the process). There
were a total of 24 parameters that were rated on a Likert-type scale with scores ranging between 3
(high) and 0 (low). Those papers that scored highly on more than 13 out of 24 parameters were
considered to be high-quality studies (scoring 61 out of 72); papers that scored between 35 and 60 were
of medium quality; and those papers that scored less than 35 were low-quality studies. As can be seen
from Table 3.1, below, 101 of the 104 studies were rated as either high- or medium-quality. This
indicates the soundness of the evidence base.
Table 3.1: Summary of quality-appraisal scores of included studies
Quality of Study Number of Studies Percentage
High 16 15%
Medium 85 82%
Low 3 3%
Total 104 100%
3.4 DESCRIPTION OF THE INCLUDED STUDIES
Table 3.2, below, provides the number of studies, when classified by the source from which they were
obtained. The largest proportion of the studies was obtained from the electronic-database search.
Figures 3.1(a) and 3.1(b) also indicate that the evidence was not restricted to journal publications, but
also covers grey sources, such as organisational websites and google scholar etc. Together, studies from
these grey sources accounted for 34% of total studies. References from included studies obtained
through the electronic-database search and personal requests to authors provided 13% of the total
studies. In sum, Table 3.2, below, reflects the extensive search process in identifying the included
studies.

46
Table 3.2: Studies classified by source
Study source No. of studies Percentage
Electronic database 56 54%
Website search 21 20%
Cross Reference 6 6%
Author Correspondence 7 7%
Google Scholar 12 12%
Google 2 2%
Total studies 104 100%
Table 3.3: Studies classified by type
Type of Publication No. of studies Percentage
Journal publication 69 66%
Report 31 30%
Working paper 3 3%
Book chapter 1 1%
Total studies 104 100%
Table 3.3 classifies the included studies by type of publication. Publication type was classified into four
categories: (i) journal publication, if the study was published in an academic journal; (ii) reports, if these
were documents published by agencies such as the World Bank, Asian Development Bank (ADB), and
so on; (iii) working paper, if the study was a work-in-progress document, as cited by the authors; and
(iv) book chapter, if it was a chapter of an edited book. The table shows that close to two-thirds of the
study was journal publications. Since journal publications undergo a peer-review process before they
are published, we assume that the quality of the study would be of a reasonable standard. Reports are
normally prepared for a policy audience, and, therefore, we expect to have evidence that would be of
interest to policymakers. Since the reports were obtained only from those organizations that are known
for their robust evaluations, we expect the evidence from the reports to be of a reasonably high
standard. Reports formed 30% of the total studies. Journal publications and reports together
constituted 96% of the total.
Table 3.4, below, gives the proportion of studies when classified by year of publication. Since
policymakers are the target segment for this review, it helpful would be helpful for the review to
synthesises more recent evidence. It can be seen that more than two-thirds of the studies included in

47
this review were published in 2006 or later. The review, therefore, includes a high proportion of studies
that have been published recently.
Table 3.4: Studies classified by year of publication
Year of publication No. of studies Percentage
2000 & earlier 8 8%
2001‒05 26 25%
2006‒10 44 42%
After 2010 26 25%
Total studies 104 100%
Table 3.5: Studies classified by sector
Sector No. of studies Percentage
Water 77 74%
Electricity 31 30%
Sanitation 64 64%
Total studies 104 100%
The scope of the review covers these broad sectors: water supply, sanitation and electricity supply.
Table 3.5, above, gives the number of studies in each of the sectors. Since many studies cover more
than one sector, they have been included in each of the sectors; therefore, the summation of the
studies in all the sectors is more than the total number of studies. It can be seen that studies on water
supply account for the highest proportion of the studies, followed by the studies on sanitation. This, in
a way, also reflects the situation on the ground: while electricity connections are widely available to
slum-dwellers and low-income groups, it is not the case as far as water supply and sanitation are
concerned. Therefore, literature has a higher number of studies that focus on access to water supply
and sanitation, which is also reflected in our evidence base.
Table 3.6 shows the classification based on the data used in the studies. Seventy four percent of the
studies have used primary data, which can be surveys, interviews, focus-group discussion, and so on.
Secondary sources include use of existing data sources, such as various national surveys, household and
demographic surveys, and so on. We felt that having a large number of primary studies would help us
to put the findings into context, in the narrative synthesis.
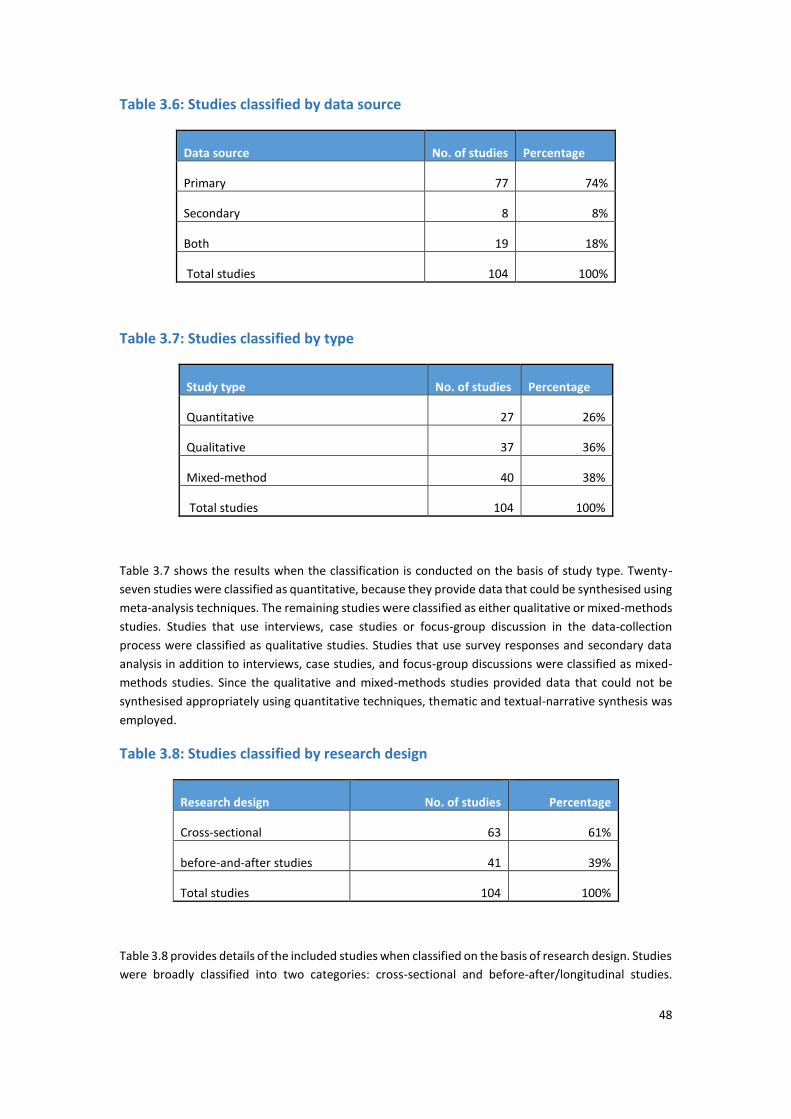
48
Table 3.6: Studies classified by data source
Data source No. of studies Percentage
Primary 77 74%
Secondary 8 8%
Both 19 18%
Total studies 104 100%
Table 3.7: Studies classified by type
Study type No. of studies Percentage
Quantitative 27 26%
Qualitative 37 36%
Mixed-method 40 38%
Total studies 104 100%
Table 3.7 shows the results when the classification is conducted on the basis of study type. Twenty-
seven studies were classified as quantitative, because they provide data that could be synthesised using
meta-analysis techniques. The remaining studies were classified as either qualitative or mixed-methods
studies. Studies that use interviews, case studies or focus-group discussion in the data-collection
process were classified as qualitative studies. Studies that use survey responses and secondary data
analysis in addition to interviews, case studies, and focus-group discussions were classified as mixed-
methods studies. Since the qualitative and mixed-methods studies provided data that could not be
synthesised appropriately using quantitative techniques, thematic and textual-narrative synthesis was
employed.
Table 3.8: Studies classified by research design
Research design No. of studies Percentage
Cross-sectional 63 61%
before-and-after studies 41 39%
Total studies 104 100%
Table 3.8 provides details of the included studies when classified on the basis of research design. Studies
were broadly classified into two categories: cross-sectional and before-after/longitudinal studies.

49
Although a greater number of before-and-after studies would have been desirable for this particular
systematic review, we found a greater number of cross-sectional studies in our list. However, the
appropriateness of the control or comparison sample in the cross-sectional studies has been assessed
in the quality criteria.
Table 3.9, below, lists the studies on the basis of geographical location of the slum or low-income group.
Locations were classified into six geographical regions. Studies were classified as belonging to one or
more of the regions, depending on the location of the slum or low-income locality. When a study was
based on data from slums in different regions, it was counted in each of the regions. However, if a study
used data from more than one slum, and if the slums are in the same region, the study was counted
only once for the respective region. A majority of the studies were based on slums in Asia. Studies that
were based on slums in Africa accounted for the second-highest proportion, followed by studies that
focused on South America.
Table 3.9: Studies classified by regional focus
Table 3.10: List of top 5 countries in the selected studies
Country rank Top 5 countries Study count Percentage
1 India 36 35%
2 Bangladesh 13 13%
3 Indonesia 7 7%
4 South Africa 6 6%
5= Bolivia 5 5%
5= Ghana 5 5%
5= Philippines 5 5%
Total studies 104
Region No. of studies Percentage
Asia 63 61%
Africa 28 27%
South America 20 19%
Central and North America 4 4%
Oceania 2 2%
Eastern Europe 1 1%
Total studies 104

50
In terms of number of countries, the included studies were based on data from 34 countries. Table 3.10,
above, lists the top 5 countries and the study count for each of them. India occupies the top slot, as 36
of the 104 studies were based on data from Indian cities. This was followed by Bangladesh, with 13
studies. The other countries in the top 5 are: Indonesia, South Africa, Bolivia, Ghana, and the
Philippines. Table A3.1 in Appendix 3 provides the complete list of 34 countries and the number of
studies on each country.
Table 3.11: List of top 5 cities in the selected studies
City rank Top 5 cities Study count Percentage
1 Dhaka 13 13%
2 Mumbai 9 9%
3 Ahmedabad 7 7%
4 Jakarta 5 5%
5 New Delhi 4 4%
5 Kolkata 4 4%
Total studies 104
In terms of number of cities, a total of 103 cities were covered in the list of included studies. Table 3.11
lists the top 5 cities and the count of studies for each of the cities. Dhaka occupies, the top slot, with 13
studies in the list covering the city. The other cities in the top 5 lists are Mumbai, Ahmedabad, Jakarta,
New Delhi and Kolkata. Table A3.2 in Appendix 3 provides the complete list of 103 cities and the number
of studies on each city. Given the large number of countries and cities covered by the studies included
for this review, it is felt that the synthesis would be fairly extensive.
3.3 SUMMARY
This chapter provides an identification and description of the studies that have been included in this
review. The results of the in-depth review and synthesis of the evidence obtained from these studies is
given in Chapter 4.

51
4: IN-DEPTH REVIEW: RESULTS
4.1 OVERVIEW
This chapter provides the results of the review. As indicated in Chapter 2, a multi-pronged approach to
synthesis has been used in this review. This chapter presents the results of synthesis from the three
approaches used in the review: numerical summary using a count of evidence approach, meta-analysis
and textual narration.
4.2 NUMERICAL SUMMARY OF EVIDENCE
This section gives the numerical summary of the evidence on access from the 104 studies included in
this review. A total of 568 eassessments of were obtained from all the studies, whether quantitative,
qualitative or mixed methods. Interventions leading to these effects were classified into two groups,
based on the service provider: a top-down approach when government was the primary service
provider, and a bottom-up approach when alternative service providers, such as NGOs, CBOs and the
private sector, delivered the service. There were a total of 270 assessments of effect for the top-down
approach and 298 assessments of effect for the bottom-up approach.
The outcome of the interventions was classified into five categories, as defined below.
1) Positive: Outcomes that resulted in an improvement (from the status quo) in access to basic
services (in either top-down or bottom-up approaches). For example, the following evidence was
classified as positive outcomes:
When there has been an improvement in connectivity as compared to the status quo. For example,
the connectivity coverage increased from x % to y % after a bottom-up intervention.
The effort and time needed to access the service has been reduced. For example, if the effort and
time has been reduced in slum A (the intervention site) as compared to slum B (the control site).
2) Negative: Outcomes that indicate a decline in access. For example, the following evidence would
be classified as a negative outcome:
a) When there has been an increase in the cost of services as a result of a bottom-up approach.
For example, the affordability or cost of service increased from x % to y % after a bottom-up
intervention.
b) The effort and time needed to access the service has increased. For example, if the effort and
time increases in slum A (the intervention site) as compared to slum B (the control site).
3) No impact: When the intervention led to no positive or negative change and the status quo is
maintained, the intervention was considered to have had ‘no impact’. For example, the following
evidence would be classified as having no-impact:
a) When there has been no change in levels in connectivity under either forms of service delivery.
For example, the connectivity coverage remained at the same level of x %, under both top-
down or bottom-up delivery approaches.
b) The effort and time required to access the service remains the same after the intervention as
compared to the control site. For example, if the effort and time in slum A (the intervention
site) remains the same as in slum B (the control site).
4) Inconclusive: When the study did not indicate a clear positive, negative, or no impact, and if the
researcher was unable to draw a clear conclusion from the result, the outcome was classified as
‘inconclusive’.

52
5) Unclear: In a few studies, the outcomes may be unclear due to inadequate analysis or imprecise
articulation of results. In such situations, the outcome is classified as ‘unclear’.
It has to be understood that an intervention may have a varying impact on the different dimensions of
access. For instance, a positive improvement in connectivity may result in a negative outcome in
affordability, indicating that the new (or improved) connection comes at a higher cost. Similarly, while
connectivity may have improved, the effort and time taken to access the service may have increased.
Therefore, the outcomes or impact were captured separately for each dimension of access for which
the evidence was available.
Section 4.2.1 provides a summary of evidence from top-down approaches and section 4.2.2 summarises
the evidence from bottom-up approaches.
SUMMARY OF EVIDENCE UNDER TOP-DOWN APPROACH
EVIDENCE BY SECTOR
On a very broad level, it was seen (Table 4.2.1) that the proportion of positive effects on outcomes of
access across the three sectors are lower than that of the negative effects in the top-down approach.
This result substantiates the existing claims of inadequate provision of basic services in urban-poor
settlements by governments of LMICs (Water Aid 2008, UN-HABITAT 2003, UN 2013).
Table 4.2.1: Summary of evidence by sector in the top-down approach
Sector Positive Negative No impact Unclear Inconclusive Total
Water 42%, 24 51%, 29 - 3%, 2 4%, 3 133, 39
Sanitation 28%, 15 61%, 20 - 9%, 2 1%, 1 67, 32
Electricity 49%, 16 43%, 12 - - 9%, 4 70, 24
Total 40%, 36 51%, 43 - 4%, 2 4%, 8 270, 59
(Legend: Effects are described as Positive, Negative, No impact, Unclear or Inconclusive. The results are given as
X%, Y, where X% indicates the percentage assessments of effects in that category, and Y indicates the number of
studies that contributed those assessments. Total results are given as P, Q, where P indicates the number of
assessments of effect and Q indicates the number of studies from which those assessmentswere obtained. Since
a single study may contain both positive and negative effects on access, the number of studies for different
effects may not add up to the figure in the Total column.)
Table 4.2.1, above, shows that there are differences in the effectiveness of the top-down approach
between the three sectors. If we go by the proportion of positive effects, government has been
relatively more effective in delivery of electricity, as compared to that of water supply and sanitation.
This could be because, traditionally, the electricity sector is more tightly regulated. It has to be a part
of a network, unlike water and sanitation, which can be standalone facilities. The evidence on sanitation
is the poorest, indicating that the traditional top-down approach has not been very effective in
addressing the sanitation needs of urban-poor communities, due to several factors, such as tenure
security (Winyanti and Lang 2004), lack of connectivity to sewerage mains (Hasan 2006), ownership and
maintenance of infrastructure (Burra et al. 2003), etc., which are discussed further in this section.

53
We infer from the trend seen in Table 4.2.1 that the scope of developing decentralised facilities is
inversely correlated with the effectiveness of the top-down approach. Among the three sectors, the
sanitation sector has the highest scope for localised facilities (such as standalone household toilets or
community toilets not connected to any sewerage network) and electricity supply has the least scope
for decentralisation because of the need for grid connectivity. However, the proportion of positive
effects is the highest for electricity and the least for sanitation.
EVIDENCE BY DIFFERENT COMPONENTS OF ACCESS
Table 4.2.2 provides the summary of evidence for different components of access under the top-down
approach. It can be seen that the largest number of assessments of effect are on connectivity.
Nevertheless, there are also a reasonable number of assessments for adequacy, affordability, and effort
and time. An interesting pattern could be seen in Table 4.2.2. While there has been a high proportion
of positive effects on the connectivity dimension, it has not been the case on others dimensions of
access. This shows that, while government accords a high priority to connectivity, the track record is
often poor on other dimensions of access (Burra et al. 2003). This can be seen as one of the failures in
governmental mode of delivery — access is largely considered as provision of connectivity, with less
importance accorded to other components of access. Poor access may also be the result of ad hoc
provisioning of basic services by the government, with little or no planning as regards the location,
number of units, cost of service, and so on, which are crucial for the longevity of the infrastructure and
its use (Kifanyi et al. 2013, Devas and Korbe 2000, McFarlane 2009, Chauhan and Lal 1999, Joshi 2005).
While the numbers of negative assessments of effect are quite high in all other components of access,
they are noticeably higher for adequacy and effort and time. These two components of access are more
relevant in the water and sanitation sectors. The urban poor are forced to travel long distances to
collect water or use a toilet and, often, these access points are so few and overcrowded that it further
affects the availability and quality of service. In the case of toilets, overcrowding results in open
defecation (Kifanyi et al. 2013, Burra et al. 2003). Unlike electricity, where the slum dweller is able to
use alternative forms of energy, such as kerosene, firewood, coal, etc., for cooking and lighting
purposes, alternatives to water and sanitation facilities are not available to the slum dweller.
The results from Table 4.2.2 lead us to infer that, in a top-down approach, connectivity occupies a
priority role as compared to other outcomes of access. The numbers of assesments of effect on
durability and sustainability are very low, indicating that effects on these dimensions are studied less
frequently than those of connectivity.

54
Table 4.2.2: Summary of evidence under top-down approach for different
components of access
Dimension of Access Positive Negative No impact Unclear Inconclusive Total
Connectivity 53%, 32 46%, 30 - - 1%, 2 158, 54
Adequacy 23%, 8 66%, 18 - 2%, 1 9%, 3 44, 22
Affordability 25%, 7 55%, 9 - 8%, 2 13%, 4 40, 19
Effort and time 24%, 3 71%, 9 - - 6%, 1 17, 12
Durability 20%, 2 20%, 2 - 60%, 1 - 10, 5
Sustainability - 100%, 1 - - - 1, 1
Total 40%, 36 51%, 43 - 4%, 2 4%, 8 270, 59
(Legend: Effects are described as Positive, Negative, No impact, Unclear or Inconclusive. The results are given as
X%, Y, where X% indicates the percentage assessments of effects in that category, and Y indicates the number of
studies that contributed those assessments. Total results are given as P, Q, where P indicates the number of
assessments of effect and Q indicates the number of studies from which those assessmentswere obtained. Since a
single study may contain both positive and negative effects on access, the number of studies for different effects
may not add up to the figure in the Total column.)
EVIDENCE BY TYPE OF SLUM
Table 4.2.3, below, presents the evidence by type of slum under the top-down approach. It can be seen
that the highest number of assessments of effect is for the informal slums. This indicates that the theme
of informal slums has attracted strong research interest. While formal slums may have recourse to
various channels to seek access to services, informal and illegal slums may not have such opportunities.
Table 4.2.3: Summary of evidence for different slum types under a top-down
approach
Type of slum Positive Negative No impact Unclear Inconclusive Total
Slum - formal 56%, 12 37%, 12 - 7%, 1 - 75, 17
Slum - informal 40%, 21 55%, 30 - 4%, 2 2%, 3 139, 39
Low-income households 21%, 8 63%, 7 - - 16%, 5 56, 14
Total 40%, 36 51%, 43 - 4%, 2 4%, 8 270, 59
(Legend: Effects are described as Positive, Negative, No impact, Unclear or Inconclusive. The results are given as
X%, Y, where X% indicates the percentage assessments of effects in that category, and Y indicates the number of
studies that contributed those assessments. Total results are given as P, Q, where P indicates the number of
assessments of effect and Q indicates the number of studies from which those assessmentswere obtained. Since a

55
single study may contain both positive and negative effects on access, the number of studies for different effects
may not add up to the figure in the Total column.)
Table 4.2.3, above, also shows that the proportions of positive effects are the highest for formal slums
and the lowest for low-income households. A possible reason for the low percentage of positive
evidence in the informal slums could be the reluctance by the government agencies that provisioning
of basic services could lead to claims on legal status and tenure security of the slums (Winyanti and
Lang 2004, Burra et al. 2003, Baruah 2010). Alternative service providers and slum-dwellers themselves
are also hesitant to invest in infrastructure in informal/unrecognised slums, for fear of eviction or
demolition (Kranti and Rao 2009, Ghafur 2000). Studies show that occupants in informal slums refrain
from spending on home improvements due to eviction/demolition (Winayanti and Lang 2004). In the
case of the low-income group, the low proportion of positive evidence could be attributed to the
disaggregated and unorganised nature of the settlements, resulting in the absence of a strong
representation to demand access to basic services.
EVIDENCE BY REGION
Table 4.2.4, below, provides the evidence for top-down approaches for different regions. The highest
number of effects has been for Asia, followed by Africa and South America, in that order. The
prevalence of slums is the highest in these regions and our evidence is, therefore, representative of
that prevailing situation.
Table 4.2.4: Summary of evidence by region under top-down approach
Region Positive Negative No impact Unclear Inconclusive Total
Africa 19%, 7 73%, 11 - - 8%, 4 59, 16
Asia 49%, 25 43%, 30 - 5%, 2 2%, 3 186, 38
Central and North America - 100%, 1 - - - 6, 1
Eastern Europe - 100%, 1 - - - 3, 1
Middle East - - - - - -
Oceania - 100%, 1 - - - 2, 1
South America 43%, 4 36%, 3 - - 21%, 1 14, 6
Total 40%, 36 51%, 43 - 4%, 2 4%, 8 270, 59
(Legend: Effects are described as Positive, Negative, No impact, Unclear or Inconclusive. The results are given as
X%, Y, where X% indicates the percentage assessments of effects in that category, and Y indicates the number of
studies that contributed those assessments. Total results are given as P, Q, where P indicates the number of
assessments of effect and Q indicates the number of studies from which those assessmentswere obtained. Since a
single study may contain both positive and negative effects on access, the number of studies for different effects
may not add up to the figure in the Total column.)

56
The results in Table 4.2.4, above, show strong variation across regions. The proportion of positive
evidence is markedly low for the African region as compared to that of Asia and South America. This
indicates that the track record of the governments in Africa in providing basic services to slums and
low-income groups has been poor. However, studies show this shortcoming in government provisioning
has been addressed to some extent with the involvement of external actors, such as ODA, NGOs and
the private sector in provisioning basic services, especially in the water sector in Africa (Kagaya and
Franceys 2008). However, governments in Asia and South America have been more successful in
adopting innovative models to provide access to the poor (Connors 2005, Ahmed and Sohail 2003,
Hardoy and Schusterman 2000).
EVIDENCE BY TYPE OF FACILITY
Access to basic services was also analysed by type of facility: (i) private, household facility, or (ii) public,
community facility. Table 4.2.5, below, provides the evidence summary by type of facility under a top-
down approach. The highest number of assessment of effects is for household facilities, indicating that
study of the provision of private access has been the focus for a large number of studies in the evidence
base. It can also be seen that the proportion of positive evidence is higher for access to community
facilities as compared to access to household facilities. There may be several reasons for a higher
prevalence of community-level connections. Low-income and slum settlements are often not
connected to the main water supply and sewerage network due to legal and land-titling problems. As
a result, extending household-level connections in these areas requires large investments in the
creation of new networks in already congested locations. Large investments lead to high connections
costs, which prohibit users from taking individual connections and seeking group connections (Hardoy
and Schusterman 2000, Weitz and Franceys 2002). In the case of sanitation, due to space constraints,
construction of individual toilets in slums may not be possible. Therefore, it is common practice to share
toilets among a few neighbours and/or use community toilets constructed by CBOs or the government
(Burra et al. 2003).
Table 4.2.5: Summary of evidence by type of facility under a top-down approach
Type of facility Positive Negative No impact Unclear Inconclusive Total
Household 39%, 29 54%, 35 - 2%, 1 5%, 7 209, 49
Community 46%, 10 43%, 10 - 10%, 2 2%, 1 61, 16
Total 40%, 36 51%, 43 - 4%, 2 4%, 8 270, 59
(Legend: Effects are described as Positive, Negative, No impact, Unclear or Inconclusive. The results are given as
X%, Y, where X% indicates the percentage assessments of effects in that category, and Y indicates the number of
studies that contributed those assessments. Total results are given as P, Q, where P indicates the number of
assessments of effect and Q indicates the number of studies from which those assessmentswere obtained. Since a
single study may contain both positive and negative effects on access, the number of studies for different effects
may not add up to the figure in the Total column.)
EVIDENCE BY LEVEL OF PARTICIPATION
Table 4.2.6, below, provides the evidence by level of participation of the slum-dwellers in the planning
and implementation of the projects. It can be seen that the numbers of assessments of effect are

57
substantially higher for those instances where there has been no or very limited involvement of the
slum-dwellers. This indicates that the top-down approach has not been very conducive to community
participation, despite the theoretical benefits associated with such participation. However, where there
has been some level of involvement, the results have been encouraging. Sites that have some level of
involvement on the part of dwellers have a higher percentage of positive evidence as compared to sites
where there has been no participation from the dwellers (38%). This shows that even government
provisioning of services can be more successful if the planning and implementation of projects is
undertaken in consultation with the beneficiaries or involves beneficiary participation (Connors 2005,
McFarlane 2009).
Table 4.2.6: Summary of evidence by level of participation under top-down
approach
Level of participation Positive Negative No impact Unclear Inconclusive Total
Limited or no participation 38%, 32 57%, 41 - - 5%, 8 227, 54
Active community participation 53%, 5 23%, 7 - 23%, 2 - 43, 10
Total 40%, 36 51%, 43 - 4%, 2 4%, 8 270, 59
(Legend: Effects are described as Positive, Negative, No impact, Unclear or Inconclusive. The results are given as
X%, Y, where X% indicates the percentage assessments of effects in that category, and Y indicates the number of
studies that contributed those assessments. Total results are given as P, Q, where P indicates the number of
assessments of effect and Q indicates the number of studies from which those assessmentswere obtained. Since a
single study may contain both positive and negative effects on access, the number of studies for different effects
may not add up to the figure in the Total column.)
EVIDENCE BY STUDY DESIGN
Research design of the studies included in the review can be broadly classified into two categories: (i)
longitudinal studies and (ii) cross-sectional studies. While cross-sectional studies compare the evidence
with respect to non-slums, before-and-after (or longitudinal) studies compare the evidence on access
over time, or after the intervention. Table 4.2.7, below, provides evidence by research design for
provisioning of services under a top-down approach. The proportion of negative effects in cross-
sectional studies is higher than those reporting positive effects, with the overal level of access to basic
services lower in slum and poor areas than in non-slum and better-off neighbourhoods. However, the
proportion of positive effects is relatively higher in longitudinal studies. It may be that, over time, access
has improved in slums, even under government provision of services. However further exploration via
sub-group analysis would be required to confirm this.
Table 4.2.7: Summary of evidence by study design for top-down approach
Type of study Positive Negative No impact Unclear Inconclusive Total
Longitudinal 55%, 11 30%, 6 - 14%, 2 3%, 1 69, 13

58
Cross-sectional 35%, 25 59%, 37 - - 6%, 8 201, 46
Total 40%, 36 51%, 43 - 4%, 2 4%, 8 270, 59
(Legend: Effects are described as Positive, Negative, No impact, Unclear or Inconclusive. The results are given as
X%, Y, where X% indicates the percentage assessments of effects in that category, and Y indicates the number of
studies that contributed those assessments. Total results are given as P, Q, where P indicates the number of
assessments of effect and Q indicates the number of studies from which those assessmentswere obtained. Since
a single study may contain both positive and negative effects on access, the number of studies for different
effects may not add up to the figure in the Total column.)
EVIDENCE BY STUDY TYPE
We also present the evidence by study type. Table 4.2.8, below, provides the evidence by study type
for the top-down approach. The percentage of positive effects is lower for quantitative studies. The
number of positive assessments of effect is likely to be lower. A significant proportion of the evidence
base (22%) is from quantitative studies..
Table 4.2.8: Summary of evidence by study type for top-down approach
Study type Positive Negative No impact Unclear Inconclusive Total
Quantitative 40%, 8 52%, 12 - - 8%, 3 60, 15
Qualitative 53%, 14 36%, 12 - 11%, 2 - 89, 19
Mixed-methods 31%, 14 63%, 19 - - 6%, 5 121, 25
Total 40%, 36 51%, 43 - 4%, 2 4%, 8 270, 59
(Legend: Effects are described as Positive, Negative, No impact, Unclear or Inconclusive. The results are given as
X%, Y, where X% indicates the percentage assessments of effects in that category, and Y indicates the number of
studies that contributed those assessments. Total results are given as P, Q, where P indicates the number of
assessments of effect and Q indicates the number of studies from which those assessmentswere obtained. Since
a single study may contain both positive and negative effects on access, the number of studies for different
effects may not add up to the figure in the Total column.)
SUMMARY OF EVIDENCE FOR BOTTOM-UP APPROACH
EVIDENCE BY SECTOR
In comparison to the evidence for the top-down approach, the proportion of positive effects is higher
across all the three sectors in the bottom-up approach. This result shows that poor communities, which
are often neglected by the government, can be better served by alternative service providers such as
NGOs, CBOs, the private sector, and so on. Where governments have failed to intervene due to lack of
political commitment, legal hurdles, or lack of finance, the alternative service providers have stepped
in to provide services (Hasan 2006, Burra et al. 2003, Chauhan and Lal 1999, Hobson 2000).

59
Table 4.2.9: Summary of evidence under bottom-up approach
Sector Positive Negative No impact Unclear Inconclusive Total
Water 53%, 37 43%, 28 1%, 1 - 3%, 5 145, 44
Sanitation 55%, 41 43%, 32 1%, 1 1%, 1 1%, 1 131, 44
Electricity 64%, 6 36%, 3 - - - 22, 7
Total 55%, 56 42%, 47 1%, 2 0%, 1 2%, 5 298, 66
(Legend: Effects are described as Positive, Negative, No impact, Unclear or Inconclusive. The results are given as
X%, Y, where X% indicates the percentage assessments of effects in that category, and Y indicates the number of
studies that contributed those assessments. Total results are given as P, Q, where P indicates the number of
assessments of effect and Q indicates the number of studies from which those assessmentswere obtained. Since a
single study may contain both positive and negative effects on access, the number of studies for different effects
may not add up to the figure in the Total column.)
Table 4.2.9, above, shows a significant increase in the proportion of positive effects in sanitation (from
28% in the top-down approach to 55% in bottom-up approach), indicating that the bottom-up approach
that involves the private sector and other organizations may play an effective role in improving access
to sanitation. The proportion of positive effects has also increased for water supply and electricity, but
not in the same way as seen in the case of sanitation. Since provision of sanitation facilities have been
grossly neglected in several LMICs, there has been greater thrust in involving alternative service
providers to address this problem using innovative and low-cost technology, as well as community
participation (Weitz and Franceys 2002, Khandekar and Badrunnessa 2006). The results also show that,
as the scope for decentralised facilities increases, the effectiveness of the bottom-up approach also
increases.
EVIDENCE ON DIFFERENT DIMENSIONS OF ACCESS
Table 4.2.10, below, gives the evidence on different dimensions of access. The proportion of positive
effects is higher for all dimensions of access, except affordability, indicating initial effectiveness of the
bottom-up approach in improving access. It can be seen that alternative service providers, or use of a
bottom-up approach, resulted in an improvement, not only in connectivity, but also in other dimensions
of access. The proportion of the positive evidence for adequacy, which was 23% under a top-down
approach, increased to 52% under a bottom-up approach. The proportion of positive evidence for
affordability increased from 25% to 36%. In the case of effort and time, the increase was from 24% to
72%. On the dimension of durability, the proportion of positive evidence increased from 20% to 58%.
However, the proportion of effects on durability is considerably less. Our results show that involvement
of NGOs, CBOs, and other forms of private-sector participation lead to a more holistic improvement in
access to basic services. Studies show that alternative service providers aim to understand the problems
faced by poor communities before offering the solution. Hence, the involvement of the community in
planning, design and implementation phases of the infrastructure aids in improving not only
connectivity, but also other dimensions of access (Burra et al. 2003; Water Aid India 2008, Hobson,
2008).

60
Table 4.2.10: Summary of evidence for bottom-up approach for different
components of access
Dimension of Access Positive Negative No impact Unclear Inconclusive Total
Connectivity 57%, 57 41%, 27 - - 2%, 4 193, 62
Adequacy 52%, 16 48%, 11 - - - 31, 21
Affordability 36%, 9 55%, 20 5%, 2 2%, 1 2%, 5 42, 27
Effort and time 72%, 9 22%, 3 - - 6%, 1 18, 11
Durability 58%, 6 42%, 3 - - - 12, 9
Sustainability 100%, 1 - - - - 2, 1
Total 55%, 56 42%, 47 1%, 2 0%, 1 2%, 5 298, 66
(Legend: Effects are described as Positive, Negative, No impact, Unclear or Inconclusive. The results
are given as X%, Y, where X% indicates the percentage assessments of effects in that category, and Y
indicates the number of studies that contributed those assessments. Total results are given as P, Q,
where P indicates the number of assessments of effect and Q indicates the number of studies from
which those assessmentswere obtained. Since a single study may contain both positive and negative
effects on access, the number of studies for different effects may not add up to the figure in the Total
column.)
EVIDENCE BY TYPE OF SLUM
Table 4.2.11, below, gives the findings by type of slum. The proportion of positive effects is higher than
that of the negative effects for all slum types, indicating the higher impact of a bottom-up approach in
general. The number of effects pertaining to formal slums is, however, considerably lower, indicating
that most of the bottom-up initiatives have focused on informal slums and low-income households.
Table 4.2.11: Summary of evidence for different slum types under bottom-up
approach
Type of slum Positive Negative No impact Unclear Inconclusive Total
Slum - formal 62%, 7 31%, 4 4%, 1 - 4%, 1 26, 9
Slum - informal 51%, 34 47%, 31 - 1%, 1 2%, 3 187, 43
Low-income households 61%, 19 36%, 14 1%, 1 - 1%, 1 85, 19
Total 55%, 56 42%, 47 1%, 2 0%, 1 2%, 5 298, 66
(Legend: Effects are described as Positive, Negative, No impact, Unclear or Inconclusive. The results are given as
X%, Y, where X% indicates the percentage assessments of effects in that category, and Y indicates the number of
studies that contributed those assessments. Total results are given as P, Q, where P indicates the number of
assessments of effect and Q indicates the number of studies from which those assessmentswere obtained. Since a

61
single study may contain both positive and negative effects on access, the number of studies for different effects
may not add up to the figure in the Total column.) The magnitude of the increase in the proportion of positive
effects (when compared to a top-down approach) differs between three segments. The highest increase
was observed for low-income households (about 40%), followed by informal slums (about 11%). For
formal slums, the increase in the proportion of positive evidence has been only about 6%. This shows
that alternative approaches to delivery of services have been more effective in informal slums and low-
income groups. Since formal slums can seek legal access to basic services based on tenure security, the
need for intervention by alternative service providers is lower. Whereas informal and low-income
groups are unable to seek legal connections from the government and, therefore, access services
provided by NGOs, CBOs and other local service providers play an important role.
EVIDENCE BY REGION
Table 4.2.12, below, shows the results in different regions for a bottom-up approach. Although there
has been a strong increase in the percentage of positive effects in Africa when compared to a top-down
approach, the percentage of negative effects is still higher. This highlights the difficulties involved in the
provision of basic services in the African region. Between Asia and South America, a bottom-up
approach has yielded better results in the latter then in the former. The proportion of positive effects
increased to 67% in South America under the bottom-up approach, as compared to 43% under a top-
down approach. This could be a result of increasing privatisation of water services in South America
(Almansi 2009, Foster and Araujo 2004, Hardoy and Schusterman 2000). The corresponding
percentages for Asia are 56% and 49%, respectively. Our results highlight that the impact of using a
bottom-up approach has not been uniform across regions.
Table 4.2.12: Summary of evidence by region in bottom-up approach
Region Positive Negative No impact Unclear Inconclusive Total
Africa 43%, 16 56%, 16 - - 2%, 1 61, 18
Asia 56%, 40 41%, 29 1%, 2 1%, 1 2%, 2 178, 40
Central and North America 44%, 1 56%, 1 - - - 9, 1
Eastern Europe - - - - - -
Middle East 100%, 1 - - - - 1, 1
Oceania - - - - - -
South America 67%, 10 29%, 7 - - 4%, 1 49, 12
Total 55%, 56 42%, 47 1%, 2 0%, 1 2%, 5 298, 66
(Legend: Effects are described as Positive, Negative, No impact, Unclear or Inconclusive. The results are given as
X%, Y, where X% indicates the percentage assessments of effects in that category, and Y indicates the number of
studies that contributed those assessments. Total results are given as P, Q, where P indicates the number of
assessments of effect and Q indicates the number of studies from which those assessmentswere obtained. Since a
single study may contain both positive and negative effects on access, the number of studies for different effects
may not add up to the figure in the Total column.)
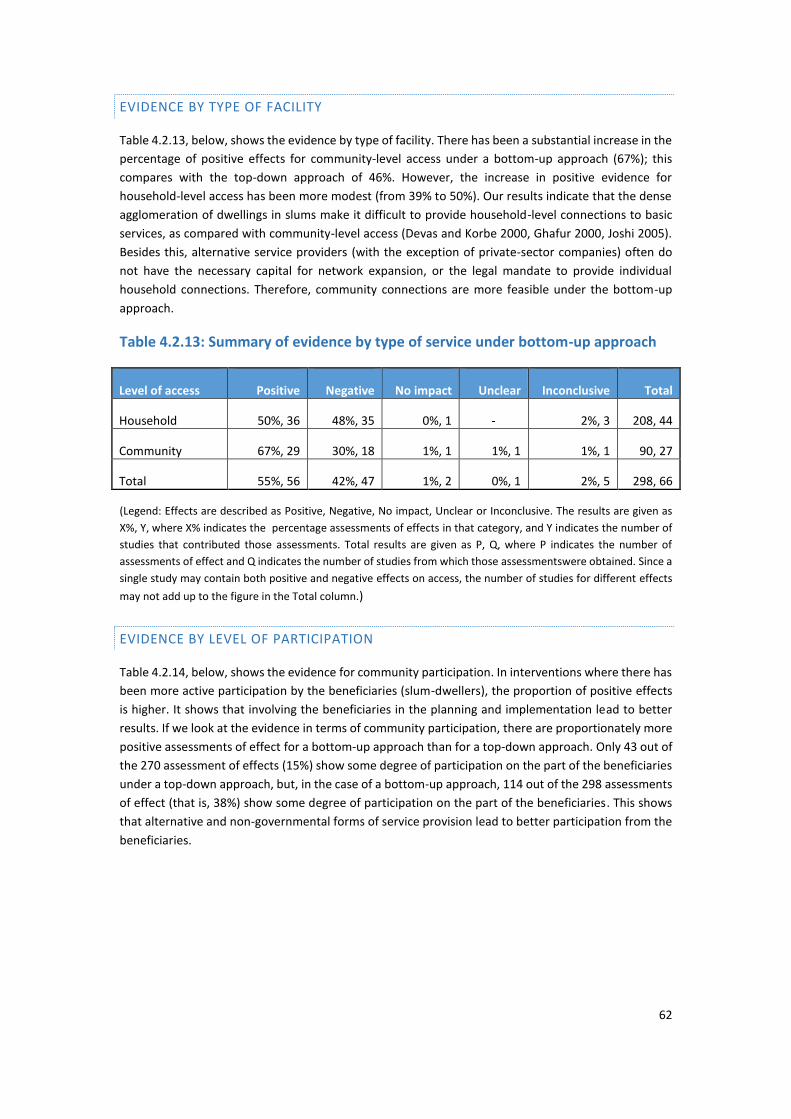
62
EVIDENCE BY TYPE OF FACILITY
Table 4.2.13, below, shows the evidence by type of facility. There has been a substantial increase in the
percentage of positive effects for community-level access under a bottom-up approach (67%); this
compares with the top-down approach of 46%. However, the increase in positive evidence for
household-level access has been more modest (from 39% to 50%). Our results indicate that the dense
agglomeration of dwellings in slums make it difficult to provide household-level connections to basic
services, as compared with community-level access (Devas and Korbe 2000, Ghafur 2000, Joshi 2005).
Besides this, alternative service providers (with the exception of private-sector companies) often do
not have the necessary capital for network expansion, or the legal mandate to provide individual
household connections. Therefore, community connections are more feasible under the bottom-up
approach.
Table 4.2.13: Summary of evidence by type of service under bottom-up approach
Level of access Positive Negative No impact Unclear Inconclusive Total
Household 50%, 36 48%, 35 0%, 1 - 2%, 3 208, 44
Community 67%, 29 30%, 18 1%, 1 1%, 1 1%, 1 90, 27
Total 55%, 56 42%, 47 1%, 2 0%, 1 2%, 5 298, 66
(Legend: Effects are described as Positive, Negative, No impact, Unclear or Inconclusive. The results are given as
X%, Y, where X% indicates the percentage assessments of effects in that category, and Y indicates the number of
studies that contributed those assessments. Total results are given as P, Q, where P indicates the number of
assessments of effect and Q indicates the number of studies from which those assessmentswere obtained. Since a
single study may contain both positive and negative effects on access, the number of studies for different effects
may not add up to the figure in the Total column.)
EVIDENCE BY LEVEL OF PARTICIPATION
Table 4.2.14, below, shows the evidence for community participation. In interventions where there has
been more active participation by the beneficiaries (slum-dwellers), the proportion of positive effects
is higher. It shows that involving the beneficiaries in the planning and implementation lead to better
results. If we look at the evidence in terms of community participation, there are proportionately more
positive assessments of effect for a bottom-up approach than for a top-down approach. Only 43 out of
the 270 assessment of effects (15%) show some degree of participation on the part of the beneficiaries
under a top-down approach, but, in the case of a bottom-up approach, 114 out of the 298 assessments
of effect (that is, 38%) show some degree of participation on the part of the beneficiaries. This shows
that alternative and non-governmental forms of service provision lead to better participation from the
beneficiaries.
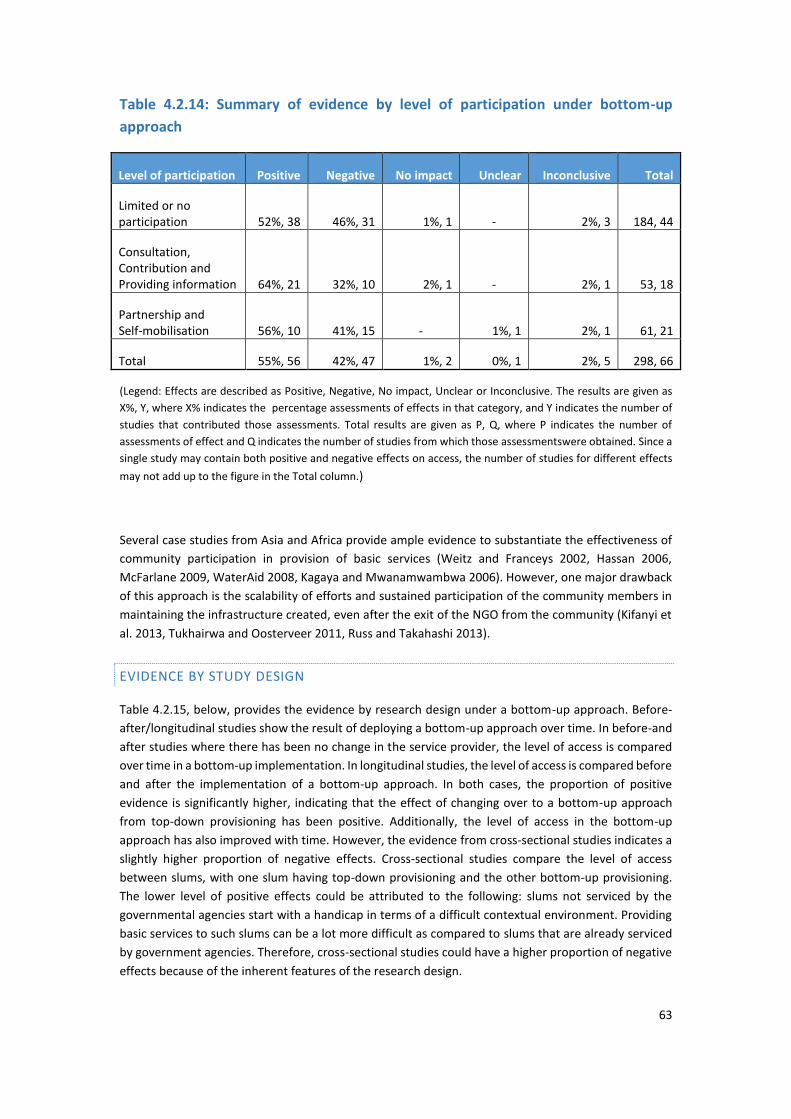
63
Table 4.2.14: Summary of evidence by level of participation under bottom-up
approach
Level of participation Positive Negative No impact Unclear Inconclusive Total
Limited or no participation 52%, 38 46%, 31 1%, 1 - 2%, 3 184, 44
Consultation, Contribution and Providing information 64%, 21 32%, 10 2%, 1 - 2%, 1 53, 18
Partnership and Self-mobilisation 56%, 10 41%, 15 - 1%, 1 2%, 1 61, 21
Total 55%, 56 42%, 47 1%, 2 0%, 1 2%, 5 298, 66
(Legend: Effects are described as Positive, Negative, No impact, Unclear or Inconclusive. The results are given as
X%, Y, where X% indicates the percentage assessments of effects in that category, and Y indicates the number of
studies that contributed those assessments. Total results are given as P, Q, where P indicates the number of
assessments of effect and Q indicates the number of studies from which those assessmentswere obtained. Since a
single study may contain both positive and negative effects on access, the number of studies for different effects
may not add up to the figure in the Total column.)
Several case studies from Asia and Africa provide ample evidence to substantiate the effectiveness of
community participation in provision of basic services (Weitz and Franceys 2002, Hassan 2006,
McFarlane 2009, WaterAid 2008, Kagaya and Mwanamwambwa 2006). However, one major drawback
of this approach is the scalability of efforts and sustained participation of the community members in
maintaining the infrastructure created, even after the exit of the NGO from the community (Kifanyi et
al. 2013, Tukhairwa and Oosterveer 2011, Russ and Takahashi 2013).
EVIDENCE BY STUDY DESIGN
Table 4.2.15, below, provides the evidence by research design under a bottom-up approach. Before-
after/longitudinal studies show the result of deploying a bottom-up approach over time. In before-and
after studies where there has been no change in the service provider, the level of access is compared
over time in a bottom-up implementation. In longitudinal studies, the level of access is compared before
and after the implementation of a bottom-up approach. In both cases, the proportion of positive
evidence is significantly higher, indicating that the effect of changing over to a bottom-up approach
from top-down provisioning has been positive. Additionally, the level of access in the bottom-up
approach has also improved with time. However, the evidence from cross-sectional studies indicates a
slightly higher proportion of negative effects. Cross-sectional studies compare the level of access
between slums, with one slum having top-down provisioning and the other bottom-up provisioning.
The lower level of positive effects could be attributed to the following: slums not serviced by the
governmental agencies start with a handicap in terms of a difficult contextual environment. Providing
basic services to such slums can be a lot more difficult as compared to slums that are already serviced
by government agencies. Therefore, cross-sectional studies could have a higher proportion of negative
effects because of the inherent features of the research design.

64
Table 4.2.15: Summary of evidence by study design for bottom-up approach
Type of study Positive Negative No impact Unclear Inconclusive Total
Before-after/ Longitudinal 68%, 23 29%, 19 2%, 2 1%, 1 1%, 1 115, 28
Cross-sectional 46%, 33 51%, 28 - - 3%, 4 183, 38
Total 55%, 56 42%, 47 1%, 2 0%, 1 2%, 5 298, 66
(Legend: Effects are described as Positive, Negative, No impact, Unclear or Inconclusive. The results are given as
X%, Y, where X% indicates the percentage assessments of effects in that category, and Y indicates the number of
studies that contributed those assessments. Total results are given as P, Q, where P indicates the number of
assessments of effect and Q indicates the number of studies from which those assessmentswere obtained. Since a
single study may contain both positive and negative effects on access, the number of studies for different effects
may not add up to the figure in the Total column.) However, the higher proportion of positive evidence
under non-government provision in the table above shows that improvement in access can be much
faster with the involvement of NGOs, CBOs and the private sector.
SUMMARY OF EVIDENCE BY STUDY TYPE
Table 4.2.16, below, provides the evidence by study type for a bottom-up approach. As expected, the
percentage of positive evidence is lower for quantitative studies. However, when compared to the
evidence for the top-down approach (Table 4.2.8), it can be seen that bottom-up provisioning of
services has led to an increase in the percentage of positive effects for all study types. More than one-
third of the assessments of effect (34%) are from quantitative studies, which indicates the strength of
the evidence base.
Table 4.2.16: Summary of evidence by study type for bottom-up approach
Study type Positive Negative No impact Unclear Inconclusive Total
Quantitative 45%, 16 52%, 15 - - 3%, 2 100, 18
Qualitative 64%, 22 34%, 16 1%, 1 1%, 1 - 107, 24
Mixed-methods 54%, 18 42%, 16 1%, 1 - 3%, 3 91, 24
Total 55%, 56 42%, 47 1%, 2 0%, 1 2%, 5 298, 66
(Legend: Effects are described as Positive, Negative, No impact, Unclear or Inconclusive. The results are given as
X%, Y, where X% indicates the percentage assessments of effects in that category, and Y indicates the number of
studies that contributed those assessments. Total results are given as P, Q, where P indicates the number of
assessments of effect and Q indicates the number of studies from which those assessmentswere obtained. Since a
single study may contain both positive and negative effects on access, the number of studies for different effects
may not add up to the figure in the Total column.)

65
SUMMARY OF EVIDENCE BASED ON QUALITY APPRAISAL
As mentioned in Chapter 2, all the studies selected for the review were appraised for quality. Table
4.2.17, below, provides the quality-appraisal ratings of the evidence base. It can be noted that the bulk
of the evidence was from studies that were rated as medium in the quality appraisal. The number of
reported effects from studies that were rated low is much less (less than 5% of the total assessments
of effects). An interesting trend that could be seen is that the proportion of positive effects is more or
less the same for high, medium and low ratings.
Table 4.2.17: Summary by strength of evidence: Overall evidence base
Strength of evidence Positive Negative No impact Unclear Inconclusive Total
High 47%,14 47%,15 - - 7% ,3 86,16
Medium 48%,65 47%,62 0% ,2 2% ,2 3% ,8 457,85
Low 48%, 1 40%,2 - 8% ,1 4% ,1 25,3
Total 48% ,80 47% ,79 0% ,2 2% ,3 3% ,12 568 ,104
(Legend: Effects are described as Positive, Negative, No impact, Unclear or Inconclusive. The results are given as
X%, Y, where X% indicates the percentage assessments of effects in that category, and Y indicates the number of
studies that contributed those assessments. Total results are given as P, Q, where P indicates the number of
assessments of effect and Q indicates the number of studies from which those assessmentswere obtained. Since a
single study may contain both positive and negative effects on access, the number of studies for different effects
may not add up to the figure in the Total column.)
Table 4.2.18 summarises the strength of evidence separately for a top-down approach. On the whole,
it can be seen that the proportion of the positive effects from studies rated high is more or less equal
to that of studies rated medium. More robust studies, in general, are expected to show a more
conservative estimate of positive impact and our strength-of-evidence results are consistent with this
expectation. Since there are very few studies with a low rating, we do not comment on the trends seen
for assessments of effect with a low rating.
Table 4.2.18: Summary by strength of evidence: top-down approach
Strength of Evidence
Positive Negative No impact Unclear Inconclusive Total
High 41% ,4 41%,5 - - 17% ,2 29, 6
Medium 40%,31 54%,36 - 4% ,1 3% ,6 224,51
Low 47%,1 41%, 2 - 12% ,1 - 17,2
Total 40%, 36 51%, 43 - 4%, 2 4%, 8 270, 59
(Legend: Effects are described as Positive, Negative, No impact, Unclear or Inconclusive. The results are given as
X%, Y, where X% indicates the percentage assessments of effects in that category, and Y indicates the number of
studies that contributed those assessments. Total results are given as P, Q, where P indicates the number of

66
assessments of effect and Q indicates the number of studies from which those assessmentswere obtained. Since a
single study may contain both positive and negative effects on access, the number of studies for different effects
may not add up to the figure in the Total column.)
Table 4.2.19, below, summarises the strength of evidence separately for a bottom-up approach. The
pattern seen for evidence from a bottom-up approach is very similar to that of a top-down approach.
In summary, the standard of the quality of the evidence is good and the findings for high and
medium-quality studies are as expected.
Table 4.2.19: Summary by strength of evidence: bottom-up approach
Strength of Evidence
Positive Negative No impact Unclear Inconclusive Total
High 49% ,11 49%, 11 - - 2%,1 57,11
Medium 56% ,44 41%, 35 1%,2 0% ,1 42%,3 233, 53
Low 50%, 1 38%, 1 - - 13%,1 8, 2
Total 55%, 56 42%, 47 1%, 2 0%, 1 2%, 5 298, 66
(Legend: Effects are described as Positive, Negative, No impact, Unclear or Inconclusive. The results are given as
X%, Y, where X% indicates the percentage assessments of effects in that category, and Y indicates the number of
studies that contributed those assessments. Total results are given as P, Q, where P indicates the number of
assessments of effect and Q indicates the number of studies from which those assessmentswere obtained. Since a
single study may contain both positive and negative effects on access, the number of studies for different effects
may not add up to the figure in the Total column.)
SUMMARY OF THE NUMERICAL DESCRIPTION
The numerical summary of the 568 assessments of effect obtained from the 104 studies included in this
review shows interesting trends. The findings from the studies investigating the impact of using bottom-
up or alternative approaches for delivery of basic services to urban slums has suggested a positive
impact, as seen in the higher proportions of positive impact for the bottom-up approach (55%), as
compared to a top-down approach (40%). While connectivity is accorded priority under a top-down
approach, involvement of alternative channels in the bottom-up approach results in improvement
across other dimensions of access, such as adequacy, affordability, effort and time and durability. The
positive impact of adopting a bottom-up approach is also higher in informal slums and unorganised
low-income neighbourhoods. In terms of region, the maximum impact of a bottom-up approach was
seen in South America and Africa, whereas, in the case of Asia, the impact has been marginal. In terms
of access, involvement of NGOs and CBOs has been more effective when the access was for public and
community facilities, rather than private and household facilities. The proportion of positive evidence
increases when there is some form of participation from the beneficiaries. Based on the number of
assessments of effect present, it suggests that use of a bottom-up approach facilitates community
participation more than does the use of top-down government provision of services. While access to
basic services has improved in slums, even under top-down provision of services, over time, a bottom-
up approach can accelerate improvement.

67
4.3 META-ANALYSIS RESULTS
Among the 104 studies included in the review, data that could be synthesised using meta-analysis
techniques was obtained from 27 studies. These 27 studies yielded 100 assessments of effect.
Depending on the data available, they were synthesised either as odds ratio (when the effect was
measured in proportion) or SMD (when the data was available as mean with standard deviation). Table
4.3.1 gives the number of measures for proportion and mean and standard deviation.
Table 4.3.1: Listing of evidence used for meta-analysis by type of measurement
S. No. Type of measurement No. of evidence
1 Proportions 88
2 Mean and Standard deviation 12
Total 100
Multiple measures were obtained from each study, depending on the type or number of services,
segments, component of access being measured, and so on. Table 4.3.2, below, provides the number
of measures obtained from each of the 27 studies. In five studies, we had more than seven measures
each; six studies provided between four and six measures; and the remaining 16 studies provided fewer
than three measures each. If there was more than one evidence on an outcome using the dataset, only
the most robust evidence was taken for analysis. Avoiding multiple measures for the same outcome
using the same dataset ensured independence of observations. This section presents the results of
meta-analysis.
Table 4.3.2: Number of measures from each study
S. No. Studies included for meta-analysis No. of evidence
1 Ahmad, Choi and Ko (2013) 7
2 Daniere and Takahashi (1999) 1
3 Das, A (2012) 9
4 Das, M (2011) 5
5 Field (2005) 1
6 Foster and Araujo (2004) 5
7 Galiani et al. (2013) 9
8 Gulyani, Talukdar and Mukami (2005) 2

68
S. No. Studies included for meta-analysis No. of evidence
9 Hailu, Osorio, and Tsukada (2012) 8
10 Hanchett (2003) 3
11 Islam and Khan (2013) 6
12 Israel (2007) 2
13 Issaka (2007) 3
14 Kayaga and Kadimba-Mwanamwambwa (2006) 4
15 Kifanyi et al. (2013) 1
16 Kranthi and Rao (2009) 4
17 MdAdbul et al. (2013) 3
18 Mimmi and Ecer (2010) 1
19 Mustafa and Reeder (2009) 2
20 Sankar (2005) 3
21 Shrestha et al. (2008) 1
22 Smith and Hanson (2003) 1
23 Stanwix (2009) 2
24 Subbaraman et al. (2012) 2
25 Snyder et al. (2013) 3
26 Tukahirwa et al.(2011) 4
27 Zaki and Nurul (2009) 8
Total 100
Description of studies used in meta-analysis is given in Table 4.3.3, below. Panel A in Table 4.3.3 shows
the evidence by sector. More studies are for water supply, followed by sanitation and electricity. The
pattern of evidence for meta-analysis more or less follows the trend seen in the overall numerical
summary of the evidence of the review. Panel B gives the number of measures of effect for different
components of access. Seventy five percent of the measures are for connectivity, indicating that
connections to basic services is the most frequently measured outcome in various studies. Panel C gives
the evidence by region, where it can be seen that Asia contributes to more than half the number of
measures. Separating the evidence by service-delivery approach, 70 of the measures pertained to
bottom-up approach using alternate service providers and the remaining 30 were for a top-down
approach delivered by government service providers.

69
Table 4.3.3: Description of the evidence used for meta-analysis
Service approach Total
Top-down Bottom-up
Panel A: Evidence by sector
1 Water 18 40 58
2 Sanitation 6 25 31
3 Electricity 6 5 11
Total 30 70 100
Panel B: Components of access
1 Connectivity 26 49 75
2 Affordability 1 14 15
3 Adequacy 3 3 6
4 Effort and time 0 4 4
Total 30 70 100
Panel C: Evidence by region
1 Asia 20 35 55
2 Africa 5 10 15
3 South America 5 21 26
4 Central and North America 0 4 4
Total 30 70 100
Given the heterogeneity in the studies, it would not be appropriate to pool it for analysis. We therefore
conducted several subgroup analyses after grouping the evidence under the relevant parameters. The
results are as follows.
EVIDENCE FOR TOP-DOWN APPROACH
In this section, we present the meta-analysis results for the evidence on the top-down approach/service
from public agencies. A top-down or government-led approach is considered as the default approach
for delivery of basic services and the findings of this section help us to conclude whether there are
significant differences in the levels of access between slum and non-slum areas. Meta-analysis has been
carried out only for connectivity and adequacy, as there was just one evidence for affordability and no
evidence for effort and time.

70
CONNECTIVITY
Figure 4.3.1, below provides the summary forest plot of the meta-analysis for connectivity. Subgroup
analyses for different sectors and by type of facility are also provided in the same graph. The synthesis
compares the evidence on connectivity in slums vis-à-vis non-slums. If the effect size is 1, or not
statistically different from 1, then we interpret that there is no difference in connectivity levels between
slums and non-slums. Our results show that the overall pooled effect size is only 0.63, indicating that
connectivity to basic services in slums is lower than that of non-slum areas. This is as expected, since
the general level of connectivity to basic services in slums would be expected to be poorer than those
of non-poor and non-slum areas. Since the confidence interval of the overall ES does not include 1, it
can be said that the connectivity in slums is significantly lower than for non-slums.
However, the pooled ES from the sub-analysis indicates the variation across different sectors and
facilities. In the case of electricity, the pooled ES indicates that electricity connectivity (legal
connections) in slums is significantly lower than that of non-slums. A possible reason for this could be
the low load demands, low incomes and high connection costs for slum-dwellers (Baruah 2010, Scott
et al. 2013). Electricity utilities are hesitant to supply electricity to slums due to high risks and low
profitability (USAID 2004). The presence of illegal suppliers and illegal connections and the use of
alternative fuels, such as kerosene and liquefied petroleum gas (LPG), to meet energy needs could also
explain the low level of legal electricity connections in slums (Baruah 2010, Shresta et al. 2008).
In the case of water supply and sanitation, the effect size is less than 1 for individual and household
level connectivity, whereas the ES is more than 1 for community connectivity. This shows the greater
prevalence of community-level access to basic services in slums. The topography of slums, often
characterised by narrow streets and alleys, which pose a problem for individual connections, could be
a reason for poor connectivity to individual households (Baruah 2010). It is possible that slum-dwellers
favour group or community connections to individual connections, as the cost of individual connections
are much higher than for community connections, which are often shared among various households
(Weitz and Franceys 2002). However, the confidence intervals for both water supply and sanitation
connectivity indicate that connectivity levels are not significantly different from that of non-slums.
On the whole, therefore, it can be said that, except for electricity connectivity, connectivity to basic
services in slums is not significantly different from that of non-slums under a top-down approach. As
expected, the I-square values indicate that studies are characterised by considerable heterogeneity,
except in the case of community toilets.

71
Figure 4.3.1: Summary results for connectivity under top-down approach
To find out whether there are differences between regions, we analysed the ES after separating the
evidence by regions. Figure 4.3.2 presents summary forest plots by region. As can be seen, evidence
was not available for all the facilities for each region. Only the evidence that was available for each
region has been summarised. The absence of I-square and p-values for some of the regions indicated
that there was only evidence in that category.
The results indicated that there is significant variation in connectivity levels across regions. For example,
connectivity to individual water pipelines was lower in Africa than in South America and Asia. Further,
in the case of Africa and South America, there was significant difference in the connectivity levels
between slums and non-slums. The evidence for community water connections was available only for
the Asian region. The summary ES for the same was 1.13, which indicated that a higher proportion of
those living in Asian slums have community-level connections, as compared to those of non-slums.
However, the confidence interval indicated that the difference was not statistically significant.
Comparing the ES for sewerage connections shows that connectivity levels in South America are
significantly lower in slums, whereas, for Asia, the ES is closer to 1, indicating that connectivity to
sewerage in slums is no different from that of non-slums. ES on community toilets again show that
access is better in Asia (effect size of 1.74) as compared to that of Africa (effect size of 0.36). In general,
connectivity to basic services is higher in Asia (except in the case of electricity) as compared to other
regions across different types of facility. Therefore, a top-down approach has been more effective in
NOTE: Weights are from random effects analysis
.
.
.
.
.
Overall (I-squared = 97.1%, p = 0.000)
Subtotal (I-squared = 94.9%, p = 0.000)
Water - Community Tap
Subtotal (I-squared = 92.4%, p = 0.000)
Sanitation - Sewerage
Electricity
Subtotal (I-squared = 54.9%, p = 0.137)
Subtotal (I-squared = 92.2%, p = 0.000)
Subtotal (I-squared = 87.5%, p = 0.000)
Sanitation - Community Toilet
Water - Individual Tap
Evidences
0.63 (0.58, 0.69)
0.71 (0.39, 1.31)
0.71 (0.40, 1.29)
1.12 (0.28, 4.43)
1.13 (0.61, 2.11)
0.42 (0.26, 0.67)
ES (95% CI)
0.63 (0.58, 0.69)
0.71 (0.39, 1.31)
0.71 (0.40, 1.29)
1.12 (0.28, 4.43)
1.13 (0.61, 2.11)
0.42 (0.26, 0.67)
ES (95% CI)
1.226 1 4.43
Ratio favours intervention

72
some regions (particularly Asia). A possible reason for this could be the overall social and economic
environment in Asian cities that have enabled governments to be more effective in service delivery
when compared to their counterparts in other LMICs. Another factor could be the political significance
of the urban poor, which results in the governing political parties in these regions being keener to
provide them with better facilities. I-square values, however, indicate the heterogeneity of the
evidence, except in the case of evidence pertaining to individual water connections in Africa.
We have also analysed connectivity levels by type of slum under a top-down approach. There were nine
evidence for formal slums, 16 for informal slums, and one for low-income households. Figure 4.3.3,
below, shows the results, which indicate that, in informal slums, the top-down approach has not been
very effective. The connectivity levels are significantly lower in slums than in non-slums. This is as
expected, since tenure insecurity is known to have a direct impact on access to basic services (Almansi
2009). Lack of tenure security is often used by the government as a reason to restrict services
(government programmes and donor-assisted programmes) to the poor, which results in an absence of
investment in poor communities (Winayanti and Lang 2004). Our results are consistent with previous
studies, which show that informal slums that do not have de-facto tenure security have lesser access
to basic services when compared to formal slums that are recognised and enjoy de jure tenure security
(see, for example, Chandrasekar 2005). The government rationale to restrict basic services to informal
slums could, however, be attributed to the need to curb such illegal settlements.
The ES (0.94), as well as the associated confidence interval for formal slums, shows that the process of
recognising the slums as legal settlements leads to better connectivity — a possible reason for this could
be that the process of recognition results in the slums’ being included in the urban-planning process,
which, in turn, leads to better connectivity to basic services. Low-income households show a higher
connectivity compared to informal slums, but a lower connectivity compared to formal slums. While
low-income households are not illegal, as is the case with informal slums, they are dispersed and are
not located in a defined boundary, as are formal slums. Therefore, they might not benefit from the
collective organisation that can exist in slums, which results in lower connectivity. However, our search
has provided only one evidence for low-income households.
We could not analyse the effectiveness of a top-down approach when categorised by level of
community participation, since there was no participation from the slum-dwellers and the community
for any of the evidence.

73
Fig 4.3.2: Summary results for connectivity in different regions under top-down
approach
NOTE: Weights are from random effects analysis
.
.
.
.
.
.
.
.
.
.
Overall (I-squared = 97.1%, p = 0.000)
Water - Individual Tap - Africa
Subtotal (I-squared = 74.0%, p = 0.050)
Subtotal (I-squared = .%, p = .)
Sanitation - Sewerage - Asia
Sanitation - Community Toilet - Africa
Evidences
Subtotal (I-squared = .%, p = .)
Electricity - Asia
Subtotal (I-squared = 83.0%, p = 0.003)
Water - Community Tap - Asia
Subtotal (I-squared = 92.2%, p = 0.000)
Electricity - South America
Water - Individual Tap - Asia
Subtotal (I-squared = .%, p = .)
Sanitation - Sewerage - South America
Sanitation - Community Toilet - Asia
Water - Individual Tap - South America
Subtotal (I-squared = .%, p = .)
Subtotal (I-squared = 96.2%, p = 0.000)
Subtotal (I-squared = 94.8%, p = 0.000)
Subtotal (I-squared = 0.0%, p = 0.805)
0.63 (0.58, 0.69)
0.57 (0.36, 0.90)
0.36 (0.05, 2.81)
ES (95% CI)
0.54 (0.54, 0.55)
0.28 (0.12, 0.69)
1.13 (0.61, 2.11)
1.74 (1.36, 2.21)
0.54 (0.53, 0.55)
1.13 (0.38, 3.29)
1.01 (0.24, 4.34)
0.15 (0.08, 0.32)
0.63 (0.58, 0.69)
0.57 (0.36, 0.90)
0.36 (0.05, 2.81)
ES (95% CI)
0.54 (0.54, 0.55)
0.28 (0.12, 0.69)
1.13 (0.61, 2.11)
1.74 (1.36, 2.21)
0.54 (0.53, 0.55)
1.13 (0.38, 3.29)
1.01 (0.24, 4.34)
0.15 (0.08, 0.32)
1.0473 1 21.1
Ratio favours intervention
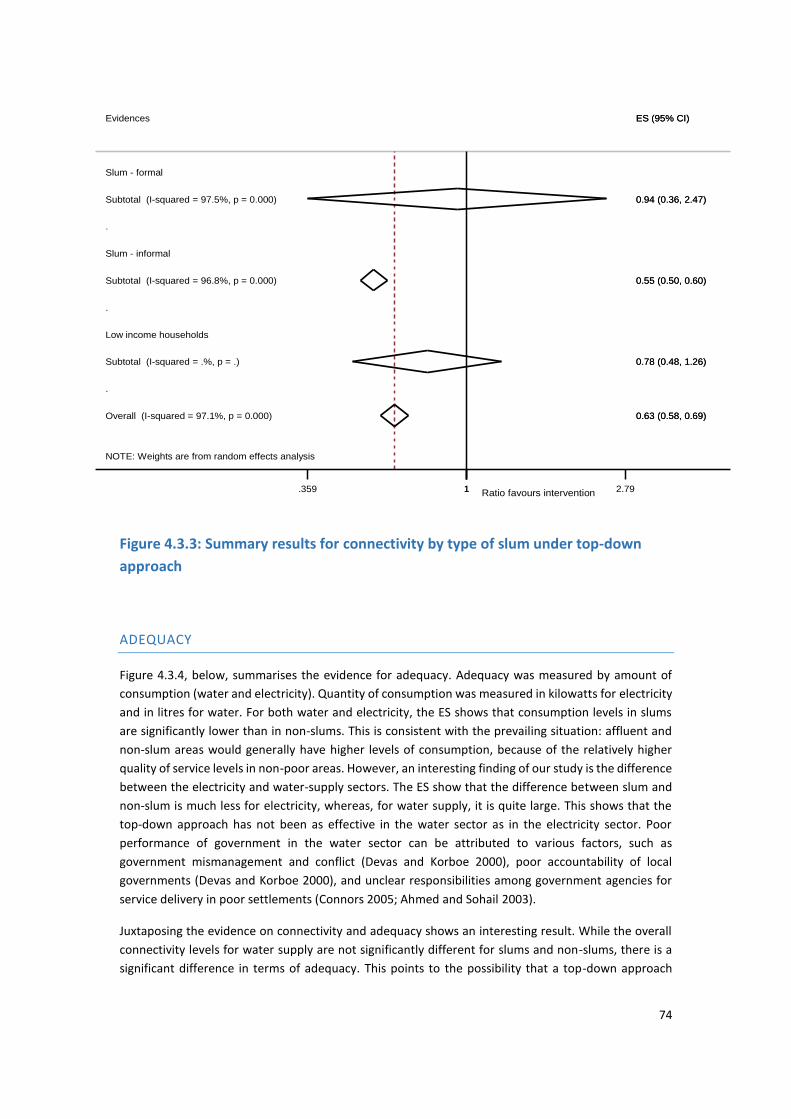
74
Figure 4.3.3: Summary results for connectivity by type of slum under top-down
approach
ADEQUACY
Figure 4.3.4, below, summarises the evidence for adequacy. Adequacy was measured by amount of
consumption (water and electricity). Quantity of consumption was measured in kilowatts for electricity
and in litres for water. For both water and electricity, the ES shows that consumption levels in slums
are significantly lower than in non-slums. This is consistent with the prevailing situation: affluent and
non-slum areas would generally have higher levels of consumption, because of the relatively higher
quality of service levels in non-poor areas. However, an interesting finding of our study is the difference
between the electricity and water-supply sectors. The ES show that the difference between slum and
non-slum is much less for electricity, whereas, for water supply, it is quite large. This shows that the
top-down approach has not been as effective in the water sector as in the electricity sector. Poor
performance of government in the water sector can be attributed to various factors, such as
government mismanagement and conflict (Devas and Korboe 2000), poor accountability of local
governments (Devas and Korboe 2000), and unclear responsibilities among government agencies for
service delivery in poor settlements (Connors 2005; Ahmed and Sohail 2003).
Juxtaposing the evidence on connectivity and adequacy shows an interesting result. While the overall
connectivity levels for water supply are not significantly different for slums and non-slums, there is a
significant difference in terms of adequacy. This points to the possibility that a top-down approach
NOTE: Weights are from random effects analysis
.
.
.
Overall (I-squared = 97.1%, p = 0.000)
Slum - informal
Low income households
Subtotal (I-squared = 97.5%, p = 0.000)
Subtotal (I-squared = 96.8%, p = 0.000)
Slum - formal
Subtotal (I-squared = .%, p = .)
Evidences
0.63 (0.58, 0.69)
0.94 (0.36, 2.47)
0.55 (0.50, 0.60)
0.78 (0.48, 1.26)
ES (95% CI)
0.63 (0.58, 0.69)
0.94 (0.36, 2.47)
0.55 (0.50, 0.60)
0.78 (0.48, 1.26)
ES (95% CI)
1.359 1 2.79Ratio favours intervention

75
emphasises providing connectivity, with limited attention paid to subsequent downstream activities
(that is, ensuring adequate and regular supply of water for the connections provided). However, the
small number of studieswe have obtained for adequacy limits the strength of the results.
Figure 4.3.4: Summary results for adequacy under top-down approach
EVIDENCE FOR BOTTOM-UP APPROACH
In this section, we present the meta-analysis results for the evidence on the bottom-up approach. The
studies here compare the impact on access after the implementation of a bottom-up approach from
the default top-down approach. The results of this analysis, therefore, help to estimate the efficacy of
using a bottom-up approach in improving access. Given the number of the studies, we have been able
to conduct meta-analysis for all dimensions of access: connectivity, affordability, adequacy, and effort
and time. However, since connectivity has the largest number of studies, we could conduct a meta-
analysis for different parameters of the operating context, such as the type of slum and level of
participation.
CONNECTIVITY
Figure 4.3.5, below, provides a summary of forest plots for different sectors. The overall ES (1.05)
indicates that use of a bottom-up approach has not resulted in a significant increase in connectivity as
compared to the top-down approach. However, since the ES is greater than 1, there has been some
level of improvement, but, given the range of the confidence interval, the improvement has not been
statistically significant.
NOTE: Weights are from random effects analysis
.
.
Water - Individual Tap - Adequacy
Subtotal (I-squared = .%, p = .)
Electricity - Adequacy
Subtotal (I-squared = .%, p = .)
Evidences
0.01 (0.00, 0.03)
0.84 (0.78, 0.90)
ES (95% CI)
0.01 (0.00, 0.03)
0.84 (0.78, 0.90)
ES (95% CI)
1.00257 1 389Ratio favours Intervention

76
However, a subgroup analysis by type of facility shows that the impact varies by sector and type of
facility. For example, in the case of sanitation (individual sewerage connections and toilets), there has
been a statistically significant improvement after a bottom-up approach. In the case of community
sanitation facilities, there has been no significant impact, with the ES close to 1 (0.96). In water supply
(community taps), there has been an increase in connectivity following bottom-up implementations.
However, in the case of individual water connections, there has been a reduction in connectivity. In
both the cases, the ES is not statistically significant from 1. Among all the sectors, the impact has been
the least in electricity. A possible reason for the low impact could be due to the centralised nature of
electricity supply, which is more suitable for a top-down approach. Government involvement in policy
formulation, financing and monitoring of electrification programmes is needed in order to play a
significant role in improving access (Baruah 2010, Manzetti and Rufin 2006, Scott et al. 2005, Shrestha
et al. 2008).
Figure 4.3.5: Summary results for connectivity under bottom-up approach
To identify if there are any differences between regions, we conducted a meta-analysis after grouping
the evidence by region. The results are given in Figure 4.3.6, below. In the electricity sector, the ES
indicates that the introduction of a bottom-up approach has not yielded results. Connectivity levels are
lower under the bottom-up approach in all the regions. In water supply (individual connections), the ES
is the highest for the Africa region (1.5), indicating that a bottom-up approaches has been beneficial. A
possible reason for this could be the very low level of connectivity in the control group and, in Africa,
the urban government is largely absent from provision of water and sanitation services and poor
households are serviced by small-scale independent providers or take care of their own needs (Scott
2013). In South America and Asia, the ES was closer to 1, indicating that there has been no appreciable
difference from implementing a bottom-up approach. This could be due to the reasonably high level of
existing connectivity in these regions as compared to that of Africa, and the fact that making any further
improvements is not easy. In Central and North America, the connectivity is significantly lower for a
NOTE: Weights are from random effects analysis
.
.
.
.
.
.
Overall (I-squared = 100.0%, p = 0.000)
Subtotal (I-squared = 98.8%, p = 0.000)
Subtotal (I-squared = 97.0%, p = 0.000)
Subtotal (I-squared = 54.8%, p = 0.065)
Sanitation - Community Toilet
Water - Community Tap
Sanitation - Sewerage
Electricity
Subtotal (I-squared = 98.4%, p = 0.000)
Subtotal (I-squared = .%, p = .)
Subtotal (I-squared = 99.7%, p = 0.000)
Sanitation - Individual Toilet
Water - Individual Tap
Evidences
1.05 (0.73, 1.52)
0.96 (0.53, 1.75)
0.89 (0.61, 1.30)
1.18 (0.96, 1.45)
2.53 (2.22, 2.87)
1.15 (1.00, 1.34)
0.30 (0.05, 1.71)
ES (95% CI)
1.05 (0.73, 1.52)
0.96 (0.53, 1.75)
0.89 (0.61, 1.30)
1.18 (0.96, 1.45)
2.53 (2.22, 2.87)
1.15 (1.00, 1.34)
0.30 (0.05, 1.71)
ES (95% CI)
1.0514 1 19.5
Ratio favours intervention

77
bottom-up approach. However, there was only one evidence for the Central and North America region.
For community water-supply connections, the evidence was available only for the Asian region. The ES
of 1.18 shows that a bottom-up approach has led to improved connectivity. However, the range of the
confidence interval showed that the improvement is not statistically significant.
A bottom-up approach has shown a significant improvement in individual toilets in all the four regions:
Asia, South America, Africa, and Central and North America. However, in the case of Africa, the increase
was not statistically significant. A possible reason for this trend could be the modest level of economic
development in Africa as compared to other regions. Construction of individual toilets requires
investment from the households as well, and, if the poor economic condition of households makes it
difficult for them to make that investment, the impact of using a bottom-up approach is going to be
limited. However, the evidence in Asia, South America, and Central and North America suggests that a
bottom-up approach helps to create conditions that result in a greater number of households
constructing toilets.
In the case of community toilets, the effect of a bottom-up approach has been ambiguous. While the
ES is 1.05 in Asia (although not statistically significant), for the Central and North American region, it is
only 0.31, and it is also significantly lower as compared to connectivity levels seen in a top-down
approach. Incorporating the regions into the meta-analysis has shown that a bottom-up approach has
led to an increase in connectivity to sanitation, especially individual toilets in all regions. On the
contrary, a bottom-up approach has not worked well for electricity, as indicated by ES of less than 1.
For other sectors and facilities, there have been both positive and negative impacts, indicating that
contextual factors could play a role in influencing the effectiveness of a bottom-up approach.

78
Figure 4.3.6: Summary results for connectivity for different regions under bottom-
up approach
Figure 4.3.7, below, shows the results for connectivity by type of slums. Among the 49 measures for
connectivity, six measures were from formal slums, 38 from informal slums, and five from low-income
groups. It can be seen that a bottom-up approaches has been the most effective in formal slums. The
main reason for this is the reluctance of NGOs and CBOs to invest in a slum that may be evicted or
demolished. Improvements to notified slums were implemented much faster than those to non-
notified slums and NGOs were more active in notified slums (Chandrasekhar 2005, Kranti and Rao
NOTE: Weights are from random effects analysis
.
.
.
.
.
.
.
.
.
.
.
.
.
.
.
Overall (I-squared = 100.0%, p = 0.000)
Electricity - Asia
Sanitation - Individual Toilet - South America
Electricity - Central and North America
Water - Individual Tap - Africa
Subtotal (I-squared = .%, p = .)
Water - Individual Tap - Central and North America
Subtotal (I-squared = 68.9%, p = 0.073)
Subtotal (I-squared = 99.8%, p = 0.000)
Subtotal (I-squared = .%, p = .)
Sanitation - Community Toilet - Central and North America
Electricity - South America
Subtotal (I-squared = 78.3%, p = 0.000)
Sanitation - Individual Toilet - Central and North America
Subtotal (I-squared = .%, p = .)
Sanitation - Community Toilet - Asia
Sanitation - Individual Toilet - Asia
Water - Individual Tap - Asia
Sanitation - Sewerage - Asia
Subtotal (I-squared = .%, p = .)
Sanitation - Individual Toilet - Africa
Subtotal (I-squared = 3.7%, p = 0.402)
Subtotal (I-squared = .%, p = .)
Water - Community Tap - Asia
Subtotal (I-squared = 54.8%, p = 0.065)
Subtotal (I-squared = 98.5%, p = 0.000)
Subtotal (I-squared = .%, p = .)
Subtotal (I-squared = .%, p = .)
Subtotal (I-squared = 86.0%, p = 0.000)
Water - Individual Tap - South America
Subtotal (I-squared = 52.7%, p = 0.120)
Evidences
1.05 (0.73, 1.52)
0.34 (0.34, 0.34)
1.50 (0.55, 4.08)
0.22 (0.00, 19.48)
0.31 (0.30, 0.31)
1.05 (0.83, 1.32)
0.23 (0.22, 0.23)
2.12 (2.12, 2.13)
0.87 (0.67, 1.12)
1.15 (1.00, 1.34)
1.18 (0.96, 1.45)
2.61 (1.91, 3.57)
0.88 (0.69, 1.12)
1.11 (0.41, 3.04)
0.88 (0.60, 1.31)
2.47 (2.37, 2.57)
ES (95% CI)
1.00259 1 386Ratio favours intervention

79
2009). This shows that de facto or de jure tenure security is an important factor in determining access
to basic services. However, in the case of informal slums, the ES is closer to 1, and the confidence
interval range shows that there has been no significant differences in connectivity in either of the
approaches. The effect on low-income households has been the least, indicating that, when households
are not concentrated in a defined location like a slum, the involvement of NGOs and CBOs have not
been effective. Nevertheless, the results show that legal recognition of slums facilitates access to basic
services, either with government provision or with alternative service providers. The I-square values
indicate that the evidence for both formal and informal slums is characterised by considerable
heterogeneity.
Figure 4.3.7: Summary results for connectivity by type of slum in bottom-up
approach
We also conducted a meta-analysis by level of participation from the community. The top-down
approach is characterised by poor participation from the community due to various factors, such as
governments’ lack of understanding of communities’ needs, inadequate consultation with
beneficiaries, and so on (Ghafur 2000, McFarlane 2009, Burra et al. 2003, Kifanyi et al. 2013). However,
a bottom-up approach can attract greater participation from the community, since the NGOs and the
CBOs tend to work much more closely with the community. This is also seen in the evidence. While
none of the 26 evidence for connectivity under top-down approach had a significant level of
participation, 16 of the 49 evidence in the bottom-up approach had a significant level of participation.
It can also be noted that not every instance of a bottom-up approach involves significant participation
from the community.
Figure 4.3.8, below, gives the summary results on connectivity with and without community
participation. The results show that, when there has been some level of community participation, the
impact on access has been significant. The ES when there has been community participation was 1.92,
NOTE: Weights are from random effects analysis
.
.
.
Overall (I-squared = 100.0%, p = 0.000)
Slum - informal
Subtotal (I-squared = 100.0%, p = 0.000)
Subtotal (I-squared = 98.8%, p = 0.000)
Low income household
Evidences
Subtotal (I-squared = 0.0%, p = 0.494)
Slum - formal
1.05 (0.73, 1.52)
0.96 (0.63, 1.46)
2.11 (0.98, 4.54)
ES (95% CI)
0.65 (0.45, 0.95)
1.05 (0.73, 1.52)
0.96 (0.63, 1.46)
2.11 (0.98, 4.54)
ES (95% CI)
0.65 (0.45, 0.95)
1.22 1 4.54Ratio favours Intervention

80
and the difference is statistically significant. When there has been no community involvement, the
results are less impressive. The ES was only 0.79.
One of the main reasons for NGOs and CBOs to intervene in the provision of basic services to slums
stems from their understanding that slum-dwellers’ needs have been unmet by the government, which
has resulted in the proliferation of unsanitary practices and health problems, and hinders economic
activity (Burra et al. 2003, Bapat et al. 2003, McFarlane 2009). Therefore, alternative service providers
encourage community participation in planning, design and maintenance of infrastructure, which yields
better results. The answer to why community management of infrastructure is better than other forms
of management, lies in recognising the value in the process that goes beyond financial management to
hygiene education, imbues a sense of ownership of community assets, and provides a much-needed
social space for community members to come together and discuss various issues (Water Aid India
2008).
Figure 4.3.8: Summary results for connectivity analysed by level of participation in
a bottom-up approach
To identify the impact of participation across different type of slums, we conducted a meta-analysis by
type of slum, after classifying the evidence by level of participation. The results are shown in Figure
4.3.9, below. While there were no evidence with participation in low-income groups, for both formal
and informal slums, the results are impressive when there is community participation. Particularly in
the case of informal slums, the impact of participation on connectivity has been statistically significant.
The result of participation on formal slums was also positive, with an ES of 4.06. However, the wide
confidence interval puts a limitation on the statistical significance. It can also be said that the tenure
NOTE: Weights are from random effects analysis
.
.
Overall (I-squared = 100.0%, p = 0.000)
Subtotal (I-squared = 98.0%, p = 0.000)
Active community participation
Limited or no participation
Evidences
Subtotal (I-squared = 100.0%, p = 0.000)
1.05 (0.73, 1.52)
1.92 (1.62, 2.27)
ES (95% CI)
0.79 (0.48, 1.29)
1.05 (0.73, 1.52)
1.92 (1.62, 2.27)
ES (95% CI)
0.79 (0.48, 1.29)
1.44 1 2.27
Ratio favours intervention
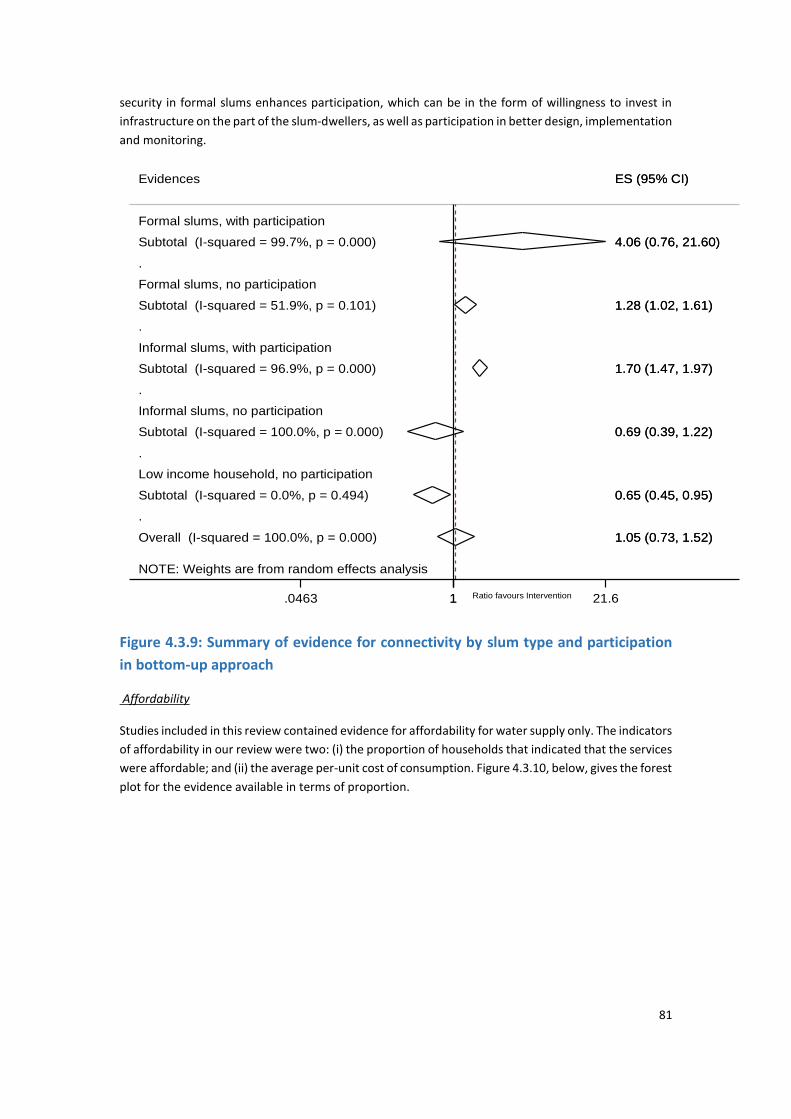
81
security in formal slums enhances participation, which can be in the form of willingness to invest in
infrastructure on the part of the slum-dwellers, as well as participation in better design, implementation
and monitoring.
Figure 4.3.9: Summary of evidence for connectivity by slum type and participation
in bottom-up approach
Affordability
Studies included in this review contained evidence for affordability for water supply only. The indicators
of affordability in our review were two: (i) the proportion of households that indicated that the services
were affordable; and (ii) the average per-unit cost of consumption. Figure 4.3.10, below, gives the forest
plot for the evidence available in terms of proportion.
NOTE: Weights are from random effects analysis
.
.
.
.
.
Overall (I-squared = 100.0%, p = 0.000)
Informal slums, with participation
Formal slums, no participation
Subtotal (I-squared = 99.7%, p = 0.000)
Subtotal (I-squared = 51.9%, p = 0.101)
Evidences
Informal slums, no participation
Subtotal (I-squared = 0.0%, p = 0.494)
Low income household, no participation
Subtotal (I-squared = 96.9%, p = 0.000)
Formal slums, with participation
Subtotal (I-squared = 100.0%, p = 0.000)
1.05 (0.73, 1.52)
4.06 (0.76, 21.60)
1.28 (1.02, 1.61)
ES (95% CI)
0.65 (0.45, 0.95)
1.70 (1.47, 1.97)
0.69 (0.39, 1.22)
1.05 (0.73, 1.52)
4.06 (0.76, 21.60)
1.28 (1.02, 1.61)
ES (95% CI)
0.65 (0.45, 0.95)
1.70 (1.47, 1.97)
0.69 (0.39, 1.22)
1.0463 1 21.6Ratio favours Intervention

82
The pooled ES (1.11) shows that there is a slight increase in the proportion of households who found
the services affordable under a bottom-up approach. However, the increase was not statistically
significant. Within the water sector, data were analysed separately for individual and community taps.
The evidence was more impressive in the case of community taps as compared to individual, household
taps. There are three reasons to which the preference for community taps can be attributed. Firstly,
individual connection costs are prohibitively high for slum-dwellers. Therefore, it is economical for a
group of households to secure a common connection, rather than a single family’s bearing the high
one-time expenditure (Hardoy and Schusterman 2000; Weitz and Franceys 2002; Sohail 2003).
Secondly, the laying of pipeline networks in low-income settlements poses engineering and
construction bottlenecks due to narrow roads and congested layouts. Community or public standpipes
provide a solution to these engineering challenges. Thirdly, NGOs and CBOs prefer to provide
community or public facilities, as they caters to a larger number of residents, and also address the
engineering challenges discussed above (Bapat and Agarwal 2003, Burra et al. 2003). Our results
indicate that a bottom-up approach has been able to leverage the expertise of NGOs and CBOs in
making community water supplies more affordable. TheI-square values also indicate low heterogeneity,
further enhancing the validity of the results.
Figure 4.3.10: Summary results for affordability under bottom-up approach
We also analysed the evidence on affordability by type of slum. Figure 4.3.11, below, shows the results.
The ES shows that a bottom-up approach has the maximum benefit on informal slums in terms of
affordability. This could possibly be explained by the unavailability of basic services (poor/low
connectivity) in informal slums, which forces residents to purchase these services at a much higher price
from private or illegal monopolies. Private vendors and illegal vendors make the most of this scarcity of
resources by charging exorbitant prices, which are brought down after the intervention of NGOs and
NOTE: Weights are from random effects analysis
.
.
Overall (I-squared = 73.1%, p = 0.000)
Evidences
Water - Individual Tap - Affordability
Subtotal (I-squared = 81.1%, p = 0.000)
Water - Community Tap - Affordability
Subtotal (I-squared = 0.0%, p = 0.668)
1.11 (0.67, 1.83)
ES (95% CI)
0.82 (0.33, 2.06)
1.42 (1.02, 1.97)
1.11 (0.67, 1.83)
ES (95% CI)
0.82 (0.33, 2.06)
1.42 (1.02, 1.97)
1.33 1 3.03
Ratio favours intervention
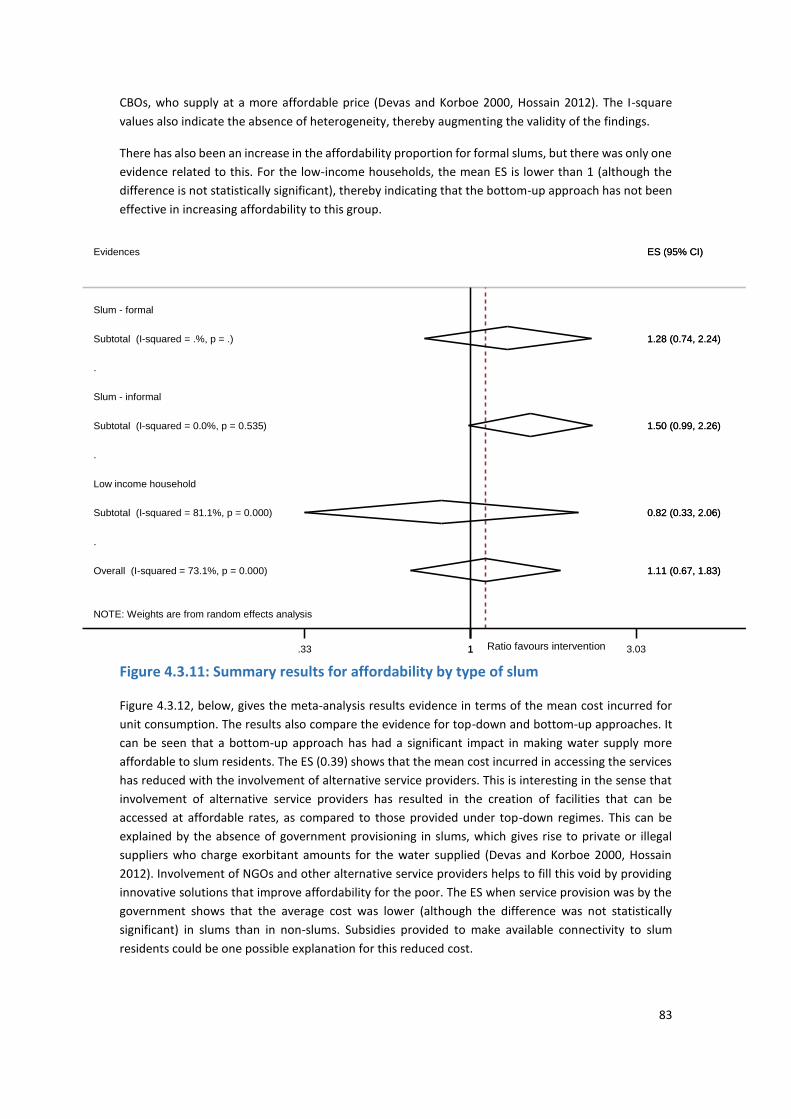
83
CBOs, who supply at a more affordable price (Devas and Korboe 2000, Hossain 2012). The I-square
values also indicate the absence of heterogeneity, thereby augmenting the validity of the findings.
There has also been an increase in the affordability proportion for formal slums, but there was only one
evidence related to this. For the low-income households, the mean ES is lower than 1 (although the
difference is not statistically significant), thereby indicating that the bottom-up approach has not been
effective in increasing affordability to this group.
Figure 4.3.11: Summary results for affordability by type of slum
Figure 4.3.12, below, gives the meta-analysis results evidence in terms of the mean cost incurred for
unit consumption. The results also compare the evidence for top-down and bottom-up approaches. It
can be seen that a bottom-up approach has had a significant impact in making water supply more
affordable to slum residents. The ES (0.39) shows that the mean cost incurred in accessing the services
has reduced with the involvement of alternative service providers. This is interesting in the sense that
involvement of alternative service providers has resulted in the creation of facilities that can be
accessed at affordable rates, as compared to those provided under top-down regimes. This can be
explained by the absence of government provisioning in slums, which gives rise to private or illegal
suppliers who charge exorbitant amounts for the water supplied (Devas and Korboe 2000, Hossain
2012). Involvement of NGOs and other alternative service providers helps to fill this void by providing
innovative solutions that improve affordability for the poor. The ES when service provision was by the
government shows that the average cost was lower (although the difference was not statistically
significant) in slums than in non-slums. Subsidies provided to make available connectivity to slum
residents could be one possible explanation for this reduced cost.
NOTE: Weights are from random effects analysis
.
.
.
Overall (I-squared = 73.1%, p = 0.000)
Subtotal (I-squared = .%, p = .)
Slum - informal
Slum - formal
Low income household
Subtotal (I-squared = 81.1%, p = 0.000)
Subtotal (I-squared = 0.0%, p = 0.535)
Evidences
1.11 (0.67, 1.83)
1.28 (0.74, 2.24)
0.82 (0.33, 2.06)
1.50 (0.99, 2.26)
ES (95% CI)
1.11 (0.67, 1.83)
1.28 (0.74, 2.24)
0.82 (0.33, 2.06)
1.50 (0.99, 2.26)
ES (95% CI)
1.33 1 3.03Ratio favours intervention

84
Figure 4.3.12: Summary results for mean cost for per unit consumption for top-
down and bottom-up approaches
ADEQUACY
The adequacy dimension can be measured either in terms of mean consumption level or the availability
of the services without any interruptions or failures. In our evidence, adequacy had been measured as
follows: (i) proportion of households that indicated that the availability of services was adequate; and
(ii) the mean level of consumption of the services. The evidence for the top-down approach was
available only for the latter (Figure 4.3.13). Here, we analyse the evidence that was available as a
proportion for the bottom-up approach. In the same meta-analysis, we have also included one evidence
from the top-down approach, where the evidence was available as a proportion. Figure 4.3.13, below,
shows the results. The results indicate that, in the bottom-up approach, the average proportion of
households who found the services adequate was lower than that in the top-down approach. However,
the difference was not statistically significant and the ES was also closer to 1. This indicates that
involvement of alternative service providers has not substantially increased the adequacy levels of the
service. Additional studies may be needed to understand the reasons for the indifferent results on
adequacy outcomes. However, the ES for government provision is 2.09, and has statistical significance.
This shows that a higher proportion of households in slums have reported adequate levels of traditional
government provision of service, as compared to those in non-slum areas. Although we had only one
evidence under this category, this was contrary to expectations. A possible explanation for this is that
slum residents had lower expectations as regards what was an appropriate level of adequacy compared
to non-slum residents. Therefore, a higher proportion of slum residents would have reported an
adequate level of service, whereas many non-slum residents would have reported an inadequate level
of service for the same level of availability.
NOTE: Weights are from random effects analysis
.
.
Bottom-up / Service by alternate agencies
Subtotal (I-squared = 83.4%, p = 0.000)
Top-down / Service by public agencies
Subtotal (I-squared = .%, p = .)
Evidences
0.39 (0.14, 1.08)
0.83 (0.53, 1.29)
ES (95% CI)
0.39 (0.14, 1.08)
0.83 (0.53, 1.29)
ES (95% CI)
1.144 1 6.94Ratio favours Intervention

85
Figure 4.3.13: Summary results for adequacy
EFFORT AND TIME
The dimension of effort and time is applicable to community water supply and sanitation facilities,
where the dwellers have to go to a common point to access the service. Effort and time in the literature
has been measured either as the distance to be travelled or the time spent to access the facility. The
four evidence that we had for this dimension were grouped into two categories, based on the
measurement used: (i) As a proportion of households who indicated that the level of effort was reduced
in the bottom-up approach; and (ii) the distance travelled to access the services. The summary results
are given in Figure 4.3.14 and Figure 4.3.15, below.
NOTE: Weights are from random effects analysis
.
.
Bottom-up / Service by alternate agencies
Subtotal (I-squared = 0.0%, p = 0.416)
Top-down / Service by public agencies
Subtotal (I-squared = .%, p = .)
Evidences
0.92 (0.71, 1.19)
2.09 (1.66, 2.61)
ES (95% CI)
0.92 (0.71, 1.19)
2.09 (1.66, 2.61)
ES (95% CI)
1.382 1 2.61
Ratio favours Intervention

86
Figure 4.3.14: Summary results for proportion of households who have indicated less
effort in bottom-up approach
The mean ES in Figure 4.3.14, above, shows that a higher proportion of households have indicated that
they required less effort to access the services in the bottom-up approach (the difference was, however,
not statistically significant). This shows that the involvement of alternative service providers has had a
beneficial effect in terms of making access easier for slum-dwellers. This could be because of the
alternative service providers’ greater understanding of community needs and the problems faced by
them (such as distance to facility) in accessing services (Weitz and Franceys 2002, WaterAid India 2008,
Burra et al. 2003). The ES in figure 4.3.15, below, shows that there has been a reduction in distance
travelled to access services when they are provided by alternative service providers. However, given
the range of the confidence interval, the null hypothesis that there is no difference in the distance
travelled in the instances of a bottom-up approach cannot be rejected. The low I-square values indicate
that the results are not affected by heterogeneity, possibly because of the lower number of evidence
on this dimension.
NOTE: Weights are from random effects analysis
.
Bottom-up / Service by alternate agencies
Subtotal (I-squared = 0.0%, p = 0.617)
Evidences
1.06 (0.77, 1.47)
ES (95% CI)
1.06 (0.77, 1.47)
ES (95% CI)
1.682 1 1.47Ratio favours Intervention

87
Figure 4.3.15: Summary results for distance to be travelled for accessing the services
SUMMARY OF RESULT BASED ON QUALITY OF EVIDENCE
Meta-analysis based on quality-appraisal ratings has been presented for connectivity only, because the
largest number of studies was for connectivity. On other dimensions of access, there were no
differences in quality-appraisal ratings for the studies. Figures 4.3.16 and 4.3.17, below, show the
summary ES for connectivity based on the quality-appraisal criteria for top-down and bottom-up
approaches. It can be seen that the effect size is lesser for high-quality studies than for medium-quality
studies. The trend is consistent for both top-down and bottom-up approaches. Since high-quality
studies in general would provide a more conservative estimate of the intervention, our results are as
expected.
NOTE: Weights are from random effects analysis
.
Bottom-up / Service by alternate agencies
Subtotal (I-squared = 0.0%, p = 0.402)
Evidences
0.70 (0.43, 1.13)
ES (95% CI)
0.70 (0.43, 1.13)
ES (95% CI)
1.428 1 2.34
Ratio favours Intervention

88
Figure 4.3.16: Summary results for connectivity by strength of evidence for top-
down approach
Figure 4.3.17: Summary results for connectivity by strength of evidence for bottom-
up approach
NOTE: Weights are from random effects analysis
.
.
Quality of evidence - High
Subtotal (I-squared = 99.1%, p = 0.000)
Quality of evidence - Medium
Subtotal (I-squared = 90.9%, p = 0.000)
Evidences
0.61 (0.55, 0.68)
0.82 (0.52, 1.27)
ES (95% CI)
0.61 (0.55, 0.68)
0.82 (0.52, 1.27)
ES (95% CI)
1.525 1 1.91Ratio favours Intervention
NOTE: Weights are from random effects analysis
.
.
Quality of evidence - High
Subtotal (I-squared = 100.0%, p = 0.000)
Quality of evidence - Medium
Subtotal (I-squared = 97.9%, p = 0.000)
Evidences
0.79 (0.42, 1.50)
1.25 (0.99, 1.57)
ES (95% CI)
0.79 (0.42, 1.50)
1.25 (0.99, 1.57)
ES (95% CI)
1.42 1 2.38
Ratio favours Intervention

89
Figure 4.3.18, below, shows the evidence by type of slum for high- and medium-quality studies for the
bottom-up approach. Except for the low-income group, the results are consistent with expectations for
formal and informal slums. High-quality studies show a lower ES as compared to medium-quality
studies. For the low-income group, high-quality studies show a higher ES than for medium-quality
evidence. However, the results suffer from a lower number of studies for the low-income group (six for
high and two for medium).
Figure 4.3.18: Summary results for connectivity based on strength of evidence and
analysed by type of slum for bottom-up approach
NOTE: Weights are from random effects analysis
.
.
.
.
.
.
Slum - formal - High
Subtotal (I-squared = .%, p = .)
Slum - formal - Medium
Subtotal (I-squared = 98.9%, p = 0.000)
Slum - informal - High
Subtotal (I-squared = 100.0%, p = 0.000)
Slum - informal - Medium
Subtotal (I-squared = 97.6%, p = 0.000)
Low income household - High
Subtotal (I-squared = 0.0%, p = 0.522)
Low income household - Medium
Subtotal (I-squared = .%, p = .)
Evidences
1.73 (1.57, 1.91)
2.21 (0.75, 6.55)
0.70 (0.34, 1.47)
1.15 (0.92, 1.45)
0.87 (0.45, 1.66)
0.56 (0.35, 0.90)
ES (95% CI)
1.73 (1.57, 1.91)
2.21 (0.75, 6.55)
0.70 (0.34, 1.47)
1.15 (0.92, 1.45)
0.87 (0.45, 1.66)
0.56 (0.35, 0.90)
ES (95% CI)
1.153 1 6.55Ratio favours Intervention

90
Figure 4.3.19, below, shows the evidence by type of participation for high- and medium-quality studies
for alternative service providers. When there has been no active participation from the beneficiaries
(that is, passive participation), the results are consistent with the earlier trends: that is, high-quality
studies show a lower ES than medium-quality studies. However, when there is some level of active
participation, high-quality studies show a larger ES than do medium-quality studies. A possible reason
for this could be the low number (four) of high-quality studies when there has been some active
participation.
Figure 4.3.19: Summary results for connectivity based on strength of evidence and
analysed by level of community participation for bottom-up approach
NOTE: Weights are from random effects analysis
.
.
.
.
Limited or no participation - High
Subtotal (I-squared = 100.0%, p = 0.000)
Limited or no participation - Medium
Subtotal (I-squared = 77.2%, p = 0.000)
Active community participation - High
Subtotal (I-squared = 94.0%, p = 0.000)
Active community participation - Medium
Subtotal (I-squared = 98.4%, p = 0.000)
Evidences
0.58 (0.27, 1.24)
1.02 (0.88, 1.19)
2.28 (2.03, 2.55)
1.77 (1.29, 2.43)
ES (95% CI)
0.58 (0.27, 1.24)
1.02 (0.88, 1.19)
2.28 (2.03, 2.55)
1.77 (1.29, 2.43)
ES (95% CI)
1.269 1 3.72Ratio favours Intervention

91
TESTS FOR PUBLICATION BIAS
Publication bias can affect the validity of results in meta-analysis and systematic reviews. We have
assessed for publication bias using a funnel asymmetry test for small-study effects. The two tests used
to assess publication bias were Egger’s test (Egger et al. 1997) and Begg’s test (Begg and Mazumdar
1994) in STATA. The results of these tests are given in Table 4.3.4. The relevant forest plots are provided
in Appendix 4. The p-values of the test results were not statistically significant, indicating that the results
of the review do not suffer from publication bias.
Table 4.3.4: Publication-bias test results
Evidence Egger’s Test Results (p-value)
Begg-Mazumdar Test Results (p-value)
Top-down, connectivity 0.163 0.643
Bottom-up, connectivity 0.097 0.109
Bottom-up, affordability (proportion)
0.320 0.152
Bottom-up, affordability (mean unit consumption costs)
0.796 0.806
Bottom-up, adequacy (proportion)
0.332 1.000
Bottom-up, adequacy
(mean consumption)
- 1.000
Bottom-up, effort and time (proportion)
- 1.000
Bottom-up, effort and time (mean distance travelled)
- 1.000

92
META-REGRESSION ANALYSIS
The i-square values in the summary meta-analysis results indicate substantial heterogeneity. This is
expected, because the studies were from different countries, different contexts and different
methodologies. Therefore, to control for the various study-level characteristics, we conducted a meta-
regression to examine the effect of covariates on the ES. The estimated meta-regression equation to
assess the impact of different study characteristics on the reported treatment ES is as follows:
𝐸𝑆𝑖𝑗 = γ0 + γ1𝑠𝑎𝑚𝑝𝑙𝑒𝑠𝑖𝑧𝑒𝑖𝑗 + γ2𝑡𝑦𝑝𝑒𝑜𝑓𝑎𝑐𝑐𝑒𝑠𝑠𝑖𝑗 + γ3𝑡𝑦𝑝𝑒𝑜𝑓𝑒𝑣𝑖𝑑𝑒𝑛𝑐𝑒𝑖𝑗 + γ4𝑟𝑒𝑔𝑖𝑜𝑛𝐴𝑠𝑖𝑎𝑖𝑗 +
γ5𝑟𝑒𝑔𝑖𝑜𝑛𝐴𝑓𝑟𝑖𝑐𝑎𝑖𝑗 + γ6𝑟𝑒𝑔𝑖𝑜𝑛𝑆. 𝐴𝑚𝑒𝑟𝑖𝑐𝑎𝑖𝑗 + γ7𝑑𝑎𝑡𝑎𝑐𝑜𝑙𝑙𝑒𝑐𝑡𝑖𝑜𝑛𝑖𝑗 + γ8𝑖𝑛𝑓𝑜𝑟𝑚𝑎𝑙𝑠𝑙𝑢𝑚𝑖𝑗 +
γ9𝑝𝑎𝑟𝑡𝑖𝑐𝑖𝑝𝑎𝑡𝑖𝑜𝑛𝑖𝑗 + 𝑣𝑖𝑗 + 𝜀𝑖𝑗
The dependent variable (ES) is the ES on the level of access to basic services. The explanatory variables
of the meta-regression equation, also called the covariates, are particular characteristics of the included
studies in the meta-analysis. These covariates represent the observed source of heterogeneity among
the included studies for analysis. The statistical significance and positive sign of the coefficient of the
covariates indicates that the studies that possess that particular characteristic are more likely to
demonstrate positive impacts on the ES. Similarly, a statistically significant and negative coefficient
indicates that studies that possess this characteristic are more likely to demonstrate negative impact
on the effect size.
In our review, sample size was a common meta-regression covariate. Findings from large samples are
considered to be more robust as compared to studies with smaller sample sizes. Statistical significance
of the coefficient of sample size can indicate the presence of a systematic empirical effect. Given the
wide variation in sample sizes across studies, we used log (sample size) in the regression estimations.
Dummy variables were used to capture the differences in study characteristics. Since each study yielded
more than one measure, to avoid the possibility of bias, the estimations were made using a panel
method, rather than a simple meta-regression. We used an unbalanced panel, random-effects GLS
regression, using STATA to analyse the impact of study-level covariates on the ES and in the presence
of heterogeneous groups across studies.
The estimations were made only for connectivity and affordability outcomes, since the number of
measures for other elements of access were very low. For connectivity outcome, the estimations were
made separately for top-down (service provision by government/public agencies) and bottom-up
approaches (alternate service providers), since the control group was different in each case. In the case
of affordability, we have used only the evidence for the bottom-up approach in making the estimation,
since there was only one evidence for government. Out of the 14 measures on affordability for the
bottom-up approach, only 10 that measured the outcomes as proportions were used in the estimation.
Table 4.3.5, below, gives the descriptive statistics of the covariates. Results of the random-effects (GLS)
regression using the unbalanced panel data are given in Table 4.3.6 (for connectivity) and Table 4.3.7
(for affordability).

93
Table 4.3.5: Descriptive statistics of the covariates used in meta-regression
Regression estimation
Variables Connectivity (Bottom-up approach or alternative
service providers)
Connectivity (Top-down approach —Public/government agencies)
Affordability (Bottom-up or alternative service providers)
Continuous variables
Sample size
Mean 726,13.33 248,300.5 2,51.8
Standard deviation 241,674.6 698135.2 307.44
Minimum value 51 88 51
Maximum value 874,892 214,3810 1,101
Dummy variables 1 0 1 0 1 0
Sector: Water
(water = 1, others = 0) 23 26 15 11 10 0
Sector: Sanitation
(sanitation = 1, others = 0) 21 28 6 20 0 10
Sector: Electricity
(electricity = 1, others = 0) 5 44 5 21 0 10
Type of Access
(household = 1, community = 0) 36 13 19 7 9 1
Type of Evidence
(longitudinal = 1,
cross-sectional = 0)
9 40 1 25 9 1
Region: Asia
(Asia = 1, others = 0) 28 21 19 7 4 6
Region: Africa
(Africa = 1, others = 0) 3 46 3 23 1 9
Region: South America
(South America= 1, others = 0) 14 35 4 22 5 5

94
Region: Central and North America
(C & N America = 1, others = 0) 4 45 0 26 0 10
Method of data collection
(Primary =1, Secondary = 0) 41 8 14 12 10 0
Type of Slum – Informal
(informal = 1, others = 0) 38 11 16 10 4 6
Type of Slum: Formal
(formal= 1, others = 0) 6 43 9 17 1 9
Type of Slum – Low-income household
(low-income= 1, others = 0) 5 44 1 25 5 5
Participation
(Yes = 1, No = 0) 16 33 0 26 0 10
Table 4.3.6: Random effect estimations for connectivity
Covariates Dependent Variable: Connectivity (ES)
Bottom-up approach (alternate service
providers)
Top-down approach (Government/public agencies)
Sample Size (Logged) 0.023 (0.203) 0.119 (0.486)
Sector: Water 1.143 (0.700) 1.889 (1.085)*
Sector: Sanitation 1.517 (0.765)** 2.093 (1.161)*
Type of Access
(household = 1, community = 0)
0.553 (0. 512) - 0.192 (0.741)
Type of Evidence
(longitudinal = 1,
cross-sectional = 0)
-0.595 (0.725) 1.277 (2.054)
Region: Asia 0.866 (1.545) 0.519 (3.798)
Region: Africa 0.902 (1.629) -1.416 (4.390)
Region: South America 0.723 (1.613) -
Method of data collection -0.062 (0.714) 0.574 (0.809)

95
(Primary = 1, Secondary = 0)
Type of Slum: Informal -0.566 (1.036) -2.019 (3.995)
Type of Slum: Formal 0.038 (1.248) -1.496 (3.970)
Participation (Yes = 1, No = 0) 0.273 (0.532) -
Intercept -1.957 (2.978) -1.512 (4.238)
Wald chi2 13.05 7.71
N 49 26
Note: Standard errors in parentheses; *** implies significance at 1%; ** significance at 5%; and * significance at 10%. Reference variables: Sector: Electricity; Region: Central & North America; Type of Slum: Low-income.
The statistical significance of the coefficient of sample size indicates an underlying systematic empirical
effect between ES and intervention. The rationale is that the results of the studies with larger sample
sizes tend to be closer to the true effect. However, in both the estimations in Table 4.3.6, above, the
coefficient of sample size was not statistically significant. In the estimation of alternative service
providers, the coefficient of sanitation was significant at the 5% level. This showed that alternative
service providers had a higher effect in the sanitation sector in terms of improving connectivity than in
the electricity sector. The same effect was not seen for the water sector. None of the other variables
was significant. In the estimation on government service providers, it was seen that the coefficient of
water and sanitation sector dummy variables was significant at the 10% level. This showed that these
sectors had a positive effect on the ES — indicating that connectivity to water and sanitation services
was higher than connectivity to electricity in the slums. These results are consistent with the summary
results given in Figure 4.3.1 and Figure 4.3.2, above. None of the other variables was significant. The
Wald chi2 statistic indicates the joint significance of the variables used in the model, and the higher
probability value for the same showed that the regression was a poor fit. The poor fit could be
attributed to the heterogeneous nature of the evidence. Consequently, while the meta-regression
results were in line with the summary results of the meta-analysis, it did not yield any new insights.
Table 4.3.7, below, provides the meta-regression results for the affordability component. Since there
were only 10 observations, the fit of the regression estimation was poor. Only the coefficient for Asia
was significant at the 5% level. This showed that evidence from Asia had a positive impact on ES as
compared to the base region. This indicated that alternative service providers in Asia were more
effective in addressing the affordability of the services as compared to those in other regions. None of
the other variables was significant. On the whole, the meta-regression did not result in estimations with
a good fit because of the lower number of observations and the heterogeneity of the data. The results
of the meta-regression were, however, consistent with the results of the meta-analysis.

96
Table 4.3.7: Random effect estimations for affordability
Covariates Dependent Variable: Affordability (ES)
Alternative service providers
Sample Size (Logged) -0.801 (0.448)
Type of Access
(household = 1, community = 0)
-2.166 (1.216)
Type of Evidence
(longitudinal = 1, cross-sectional = 0)
0
Region: Asia 0.922 (0.456)**
Region: Africa 0
Region: South America 0
Method of data collection
(Primary = 1, Secondary = 0)
0
Type of Slum: Informal 0
Type of Slum: Formal 0
Participation (Yes = 1, No = 0) 0
Intercept 5.864 (3.204)*
Wald chi2 5.39
N 10
Note: Standard errors in parentheses; *** implies significance at 1%, ** significance at 5 %; and * significance at 10%. Reference variables: Sector: Electricity; Region: Central & North America; Type of Slum: Low-income.
SUMMARY OF META-ANALYSIS RESULTS
One hundred measures of effect from 27 studies formed the evidence base for the meta-analysis. The
data were analysed under various subgroups. The overall pooled effect indicates that, under a top-
down approach, connectivity to basic services in slums is lower than that in non-slum areas. However,
there was substantial variation across different sectors and facilities. For some of the sector-region-
facility combinations, connectivity to the services was significantly lower in slums. Such combinations
are individual water connections in Africa and South America, individual sewerage connections in South
America, electricity connections in South America and Asia. The overall ES indicates that involvement
of alternative service providers in the bottom-up approach has led to some improvements in mean
increase in connectivity, as compared to government provisioning. The increase is not statistically
significant; however, the impact of using a bottom-up approach varies by sector and type of facility. In
97
the case of individual toilets, sewerage connections, and community water taps, there has been a
significant improvement in connectivity with the involvement of alternative service providers.
However, for individual water taps and community toilets, there has not been any improvement in
connectivity as compared to the control group. Among all the sectors, the impact has been the least in
the electricity sector.
In terms of affordability, there has been a slight increase in the proportion of households who found
the services affordable after the involvement of alternative service providers in the bottom-up
approach. The ES on adequacy showed that there has not been an improvement in the bottom-up
approach when service is delivered by alternative service providers. On effort and time, the results are
positive in respect of the bottom-up approach, although not statistically significant. Our analysis also
shows the positive effect of community participation on access to basic services. Analysing the data by
type of slum has shown that giving legal status to the existence of slums results in increased access to
basic services to residents living in these slums. This shows that addressing tenure-claim issues can be
an important step in providing basic services to slums.
Since the studies are characterised by considerable heterogeneity, we also conducted a meta-
regression analysis to establish the impact of study-level covariates on ES. However, because of the
small number of measures of effect in each category, we were not able to establish significant
regression estimates. However, wherever the coefficient of regression variables was significant, the
results were consistent with those obtained from meta-analysis.
4.4 TEXTUAL NARRATION
OVERVIEW
In a textual narration, it is very difficult to generalise the findings from a variety of studies, because the
factors that are present in one are not necessarily found in the others. From 104 studies selected in this
review, various combinations of outcomes emerge. While restricting the scope of this review to
developing countries has reduced the heterogeneity of context, there is, nevertheless, some level of
diversity. We have, therefore, attempted to identify the recurrent themes seen across multiple contexts
in this textual narration. A description of these themes by sector is given below.
ELECTRICITY SECTOR
A large proportion of the urban poor in low- and middle-income countries access electricity through
illegal means. Residents of slums and low-income areas value access to electricity highly and often risk
prosecution while securing electricity connections to their homes. Although quality and reliability are
not homogeneous (with those offered by legal connections), illegal connections prevail (Baruah 2010).
Despite frequent disconnections and the high cost of illegal connections, electricity is a necessity for
slum-dwellers to provide lighting, cooling and cooking facilities (Scott et al. 2005, Moulik 1999).
Although electricity seems to be available in most urban slums, there are several factors that affect
provision of legal connections. As Scott et al. (2005) point out, ‘Governments are reluctant to provide
electricity to unauthorised/illegal/informal slums, as it may confer a certain legitimacy on the

98
settlement.’ From the supply side, the utility providers5 shy away from slums, because it is not profitable
to extend coverage to them. Since slum households consume less electricity, transaction costs
(including cost of monitoring and collection of payments) for electricity companies are high (USAID
2004). However, poor households also face several hurdles in securing legal, metered electricity
connections. High up-front deposits and connections costs to be paid to the utility (Scott et al. 2013), a
lack of legal documents proving security of tenure in non-notified slums, and the fear of eviction from
these informal slums force slum-dwellers to resort to illegal connections. Although electricity supplied
through illegal connections costs more for every unit consumed (Shrestha et al. 2008), in the absence
of access to legal electricity, illegal connections are preferred mainly for the flexible payment options
that allow poor households to (i) pay only for what they consume or (ii) based on the number of
household appliances used (Baruah 2010).
Synthesising the evidence from the studies in the review, four broad themes emerge. First, we discuss
the change that can be brought about when there is a political commitment to address the needs of
the poor. The traditional top-down approach can be implemented better when the government of the
day shows strong commitment, either by way of pro-poor policy change or by the creation of specialised
agencies that implement pro-poor projects. Secondly, innovative approaches in service delivery, that
are attuned to the socio-economic problems of the poor and accompanied by a change in attitude on
the part of the utility towards the poor, can improve access. The third theme discusses the advantages
of a multi-stakeholder approach, where there is involvement of NGOs and community participation,
support from the government, and utilities that deliver the services. The fourth and last theme
emphasises the importance of inclusive planning and tenure security in improving access to slums.
Top-down approach when backed by political commitment to the poor, combined with the creation
of specialised implementation agencies for pro-poor projects, can help in improving access.
Governments play a significant role in the policy formulation, financing and monitoring of electrification
programmes (Baruah 2010, Manzetti and Rufin 2006, Scott et al. 2005, Shrestha et al. 2008). Alleviating
urban poverty through electrification of low-income and slum communities has been the primary
objective for several governments, and facilitating the creation of new agencies or partnerships with
the private sector for providing electricity access to the urban poor has been instrumental in achieving
this objective (USAID 2004, Baruah 2010). Evidence from six case studies has been summarised below
to describe the various political changes that have catalysed an improvement in access to slums.
In Manila, Philippines (USAID 2004), it was the Presidents Commission on Urban Poor (PCUP) that
assisted in securing funding for the Depressed Area Electrification Program (DAEP) from the Japanese
Bank for International Co-operation (JBIC). The primary aim of the PCUP was to upgrade and regularise
slums by resolving land tenure and by providing electricity in slums that had no access to electricity or
were serviced by illegal operators. It was under the leadership of PCUP that collaboration between
Manila Electric Company (MERALCO) and the National Electrification Agency (NEA) was set up. PCUP
also asked other agencies, such as the National Housing Authority and the Housing and Urban
Development Co-ordinating Council, to contribute to the programme design and implementation.
5 Governments and Utility providers are used interchangeably in this narrative since in some countries
where the electricity sector has not been unbundled, government is still the service provider.
However, there are different reasons for why the governments and private utilities have not extended
access to poor communities and these distinctions have been maintained.

99
Similarly in Cape Town, South Africa, a change in government was an important factor that spurred the
electrification programme. PN Energy, which was set up as a community-based distribution company,
not only reflected the government’s focus on safety and provision of electricity to neglected
communities, but also met the objective of universal access to electricity (USAID 2004). The
Government of National Unity endorsed the targets set by the previous government, which remained
unattained. Support from the Department of Mineral and Energy and the Energy White Paper that
recommended ‘energy for all’, provided much-needed impetus to set up PN Energy as a community-
based distributor.
In Brazil, two electricity utilities, Rio LIGHT and Coelba were permitted to access an efficiency
investment fund set up by the government to improve the demand-side efficiency of the utilities. Rio
LIGHT set up the Program for Normalisation of Informal Areas (PRONAI) whereas COELBA, using the
PRONAI approach, set up a community-agent model to extend coverage to informal areas (USAID 2004).
Initially, the private utilities were allowed the use of this fund to undertake slum-electrification projects.
With a change in presidency, greater emphasis was placed on a good-quality electricity supply for all,
and inclusion of all marginal economic groups through subsidy.
In Thailand (Shrestha et al 2008), electrification and extending electrification to all parts of the country
received high priority in the government’s development strategy in the 1970s. As a result of the
accelerated electrification programme, household access to electricity supply had increased to 97% by
2000. Subsidies for small residential consumers have also made electricity more affordable to poor
households. The Thai government’s commitment to improving the quality of infrastructure for the poor
was mainstreamed into the slum-upgrading programmes implemented by the National Housing
Authority, which provided low-cost housing in slums with access to electricity connections. This enabled
people to buy houses with electricity connections instead of applying for new connections separately.
Co-operation of the government could also be in the form of supporting an NGO or CBO initiative in the
urban slums. For instance, in the Slum-Electrification Program in Ahmedabad, India, the co-operation
of Ahmedabad Municipal Corporation (AMC) in issuing a no-objection certificate for a 10-year period,
providing immunity to the slum residents against eviction, was an important assurance that prompted
several slum residents to take up new connections (Baruah 2010).
Another instance of a public-private partnership in Ahmedabad was the Slum Networking Project (SNP),
which was undertaken jointly by an NGO and the corporate sector (Chauhan and Lal, 1999). The
initiative to improve the infrastructure conditions of the urban slums in Ahmedabad came from one of
the leading corporate companies in the city, which brought in an NGO highly familiar with working in
slum communities to lead the project and carry out community-development activities. In order to
include more slums and make the project city-wide, the NGO-private sector partnership approached
the AMC for their support. The commissioner immediately agreed and a formal approval for the project
was granted. The AMC not only provided the actual supply of service through its feeder infrastructure,
but also contributed to the cost of the project and agreed to build certain amenities free of cost.
Although the AMC was to take a back-seat role and has also been reported as an impediment to the
successful implementation of the project, AMC’s involvement was critical to the city-wide scaling-up of
the SNP. Slums and slum households that took part in the SNP were able to secure legal electricity
connections with help from the NGO, as the latter took responsibility for underwriting residents’
contribution for individual connections.
Political commitment and a policy framework that is pro-poor are of the utmost importance for
electricity utilities (public or private) to engage in slum-electrification programmes. The evidence

100
presented above suggest that governments in developing countries must provide an enabling
environment for utilities to extend access to the urban poor. Financial assistance in the form of
subsidies and legal support in terms of tenure security are the safety net that private utilities seek from
the government. Pro-poor policies, such as universal service obligation, forces private/government-
owned utilities to recognise the urban poor as customers entitled to service. Without the support of
pro-poor government policies, slum-dwellers of ambiguous legal status will be denied the chance to
access electricity legally. However, political commitment alone will not be sufficient to catalyse change.
Innovative approaches to tackle the specific problems that hinder access are also important. The
following section discusses these innovations.
In addition to public-sector and government commitment, regulatory oversight can also lead to a
positive impact on improving access. While the studies in this review did not explicitly discuss the role
of regulation, it is widely argued that regulators need to be aware and show understanding of the
various challenges faced by the urban poor in accessing electricity, and play a pro-active role in
ensuring that utilities provide better services to the poor and government policies are pro-poor
(Gessler et al. 2008).
TOP-DOWN APPROACHES THAT ARE SENSITIVE TO THE NEEDS OF THE URBAN POOR
CAN HELP IN IMPROVING ACCESS.
Electricity providers have two main reasons to get involved in slum electrification. One is to set right
the financial losses that they have been experiencing due to electricity theft and non-payment of bills.
The second is the conditionality imposed on them during the course of privatisation: to universalise
access or, specifically, to target the poor.
In order to address both of the reasons mentioned above, electricity companies have had to adopt
innovative techniques in management, pricing, community engagement and customer satisfaction. Due
to the lack of trust between utilities and the urban poor, utilities have had to revamp their attitude
towards slums and gain the confidence of slum-dwellers in order to overcome non-payment and theft.
Private operators need to convince users that a charged-for service programme improves the quality
of the service provided (Manzetti and Rufin 2006).
Since service delivery in slum areas is largely unexplored terrain for private providers, utility companies
have had to seek the help of local associations, community-based organisations and NGOs to make in-
roads into the community, as well as to understand the consumption patterns of slum-dwellers (USAID
2004). Encouraging pro-poor management practices, such as dealing reasonably with customers,
implementing a transparent and easy-to-use billing system, door-step collection of payments, firing of
corrupt employees, etc., are a few management changes that have improved the performance of
utilities in slum areas. Consumer-education programmes that help end-users understand their
consumption patterns and improve energy efficiency have yielded results in all the case studies
discussed in the USAID report. PN Energy in Cape Town, South Africa, had appointed staff from the local
community and set up community-level collection centres, a customer hotline, and easily accessible
prepayment-card vendors to make customer service more accessible.
Using an innovative pricing policy is another step towards improving access to electricity.
Understanding the consumption patterns of slum-dwellers and their ability to pay, utilities have
designed easier payment options, such as pre-payment meters, monthly bills, subsidised connection
costs, loans for internal wiring from meter walls, etc. (USAID 2004, Baruah 2010).

101
Achieving greater customer satisfaction was also a major driver for the electricity utilities. As mentioned
earlier, due to a poor service track record, slum-dwellers resisted from applying for legal connections
and instead relied on illegal connections at higher cost (Scott et al. 2008, Baruah 2010, Shreshtha et al.
2008). As a remedy, several utility companies have made customer satisfaction a priority area. Coelba
conducted a customer-satisfaction survey in targeted neighbourhoods that indicated a high degree of
satisfaction (mostly over 90%) as a result of improved technical support, quicker response times to
complaints and less frequent outages. The main suggestions for improvements were in respect of
lowering tariffs and taxes (USAID 2004).
Due to several legal, economic and social constraints in providing access to electricity for slum-dwellers,
what works in high-income areas may not work with low-income communities. Therefore, an
understanding of consumption patterns, a willingness and ability to pay, household-income levels, and
the mindset of the urban poor, are essential to tailor-make effective packages/deals for the urban poor.
Convincing the poor that a charged-for-service programme will deliver a quality service and supporting
it with customer service is also important to gaining the confidence and participation of the poor. The
case studies described above have shown that NGOs and CBOs can play as mediators between the
community and the utility. Both the government and the private utility provider must be aware of the
dynamics that exist in urban slums and need to innovate in the areas of management, pricing and
implementation, in order to sustain slum-electrification efforts in the long run.
TOP-DOWN APPROACH WHEN SUPPORTED BY NGO INTERVENTION AND
COMMUNITY INVOLVEMENT YIELDS BETTER CONNECTIVITY AND COVERAGE.
Data gathered from six case studies of Slum Electrification Programmes (SEP) presents electrification
programmes, led by the electricity companies and supported by the government, that have enlisted the
participation of various community groups and NGOs to increase access to electricity for slums dwellers.
Traditionally, the poor have been underserved due to three main reasons: (a) informal/illegal status of
the settlement (Scott et al. 2005); (b) high cost of service provision and low returns due to low
consumption (USAID 2004); and (c) physical constraints presented in the form of narrow lanes, poor
housing materials and unsafe wiring, which make installations challenging (USAID 2004).
In all six case studies discussed below, the utility companies have adopted a participatory approach to
service provision. Engaging all the stakeholders (that is, government, electricity companies,
communities, service recipients, and intermediaries in the programme) allowed the concerns of all
stakeholders to be addressed. Communities benefited from the improvement in social and economic
conditions, electricity companies were able to reduce non-technical losses and increase revenue,
consumers were able to obtain legal connections and NGOs/CBOs believed they could disseminate their
learning in other areas.
Baruah (2010), in a detailed account of the SEP in Ahmedabad, underscores the importance of NGOs in
motivating and mobilising the slum communities to participate in the SEP. NGO’s facilitated the
formation of CBOs to represent the residents’ interests. NGOs also played a pivotal role in negotiating
a pricing policy with the Ahmedabad Electricity Company (AEC), by undertaking a willingness-to-pay
survey among slum-dwellers. Based on this survey, the AEC worked out a variable-price scheme, which
substantially brought down the connection fee per household (during the pilot phase), which was
further shared between the household, AEC and USAID. Due to the positive response from households
in the form of an increase in the number of connections, the reduced connection fee was offered to
households even after the pilot phase had ended. Billing was also made monthly instead of bi-monthly,
which enabled slum residents to pay bills in smaller amounts. At the request of the CBO, AEC also set

102
up a special Slum Electrification Cell on its premises, to serve the economically weaker sections.
Electrification loans were also arranged with the SEWA Bank, in order to facilitate access to
electrification. NGOs played a strategic role in sensitising other stakeholders to the realities of the urban
poor, by convincing the AEC not to cut off access to the illegal power lines until the legal lines are
installed. As a result, the maximum number of electricity connection was provided in the slums of
Ahmedabad.
In Cape Town, South Africa, PN Energy — a joint-venture pilot project between ESKOM (South African
Utility), Électricité de France (EDF) and East Midlands (UK), was established as a community-based
distribution company to provide electricity to the Khayelitsha slum on the outskirts of Cape Town
(USAID 2004). Khayelitsha had a track record of non-payment and electricity theft, which was also, in
part, a result of the poor service provided by the existing provider. The formation of a community-based
distribution company as the interface between the community and ESKOM bridged the existing gap in
service by taking the service provider closer to the customer. A major shift in approach towards
electrification of slums was PN Energy and the City of Cape Town’s involvement of the community from
the beginning of the project. At all stages of implementation, the utility liaised with civic and political
organisations, including women’s and religious organisations, in order to understand their needs and
difficulties, which has led to increased buy-in of the local residents into the project. PN Energy also
innovated by installing a pre-payment meter and selling pre-paid cards, which gave the poor consumer
control over their electricity consumption, based on their ability to pay, rather than allowing them to
get into debt in the form of mounting electricity bills. All these efforts helped to increase the number
of connections to 60,000 (1994‒2003) from 6,000 in 1994, and reduce non-payment from 70% to 5% in
1998.
The Depressed Area Electrification Program (DAEP) in Manila, Philippines (USAID 2004), which was a
result of the PCUP, was exclusively designed to provide electricity to inhabitants in 229 depressed areas
(slums) in metro Manila. As a result of the political changes that took place at that time, leading to the
formation of the PCUP, which synchronised with the transformation of the State Utility into a market-
based utility, the DAEP received the fillip it needed. The Manila Electric Company’s (MERALCO) main
objective was to improve fiscal discipline, reduce theft and improve payments. PCUP collaborated with
MERALCO to provide a direct electricity service to areas that did not have electricity at all. DAEP was
able to undercut the prices charged by illegal providers by waiving much of the cost of connection by
extending the distribution lines up to the meter walls. The ‘meter-wall’ option was a salient feature of
the DAEP, where all the meters were placed on a wall at the edge of the slum. Meeting the cost of
extending distribution lines from the house to the DAEP meter walls at the edge of the slum was the
responsibility of the customer. Loans were provided for internal wiring, which were repayable to
MERALCO over 60 months. DAEP’s success was dependent on each household’s actively participating
in the programme by making the initial payment for the connection, timely payment of bills and
repayment of loans given by MERALCO. Community associations were also formed to monitor
distribution lines and manage payment, and were responsible for the functioning of the system within
the slums.
Rio LIGHT’s PRONAI is another successful case study that has enabled the regularisation and connection
of 250,000 slum households in Rio de Janeiro (USAID 2004). Rio LIGHT, the utility company that
launched PRONAI, adopted a strategy that involved changing the attitude of slums dwellers towards
paying for electricity, as opposed to stealing electricity. Intense interaction with the community through
‘LIGHT Agents’, economic incentives for participation that included subsidised connection fees, easy
payment and amnesty from previous debts, all led to an increase in connections within the slum. Free
energy-efficient light bulbs, tamper-proof meters, replacement of inefficient and unsafe electrical

103
wiring, and education on energy conservation, also led to an improvement in energy efficiency and
greater buy-in from community members. In order to overcome the difficulties in working with slum
communities, 200 local students were trained to be LIGHT Agents and the help of local NGOs was sought
to help community members access credit and participate in social programmes, training, etc.
Coelba, the electricity utility operating in Salvador, Brazil (USAID 2004), launched SEP (along similar
lines to LIGHT’s PRONAI) with the primary aim of reducing its losses from illegal connections and non-
paying legal connections, and to normalise illegally connected customers. Coelba’s SEP also involved
the use of NGOs to set up and operate intermediary operations, including recruitment and selection of
community agents, who collect payments and dues from customers. Installation of energy-efficient
light bulbs, upgrading of internal wiring, subsidised connection fees, and improving response time and
outages, are also some of the features common to COELBA and LIGHT’s PRONAI. The success of Coelba’s
intervention can be gauged by the customer-satisfaction survey, which indicated that more than 90%
of the customers were satisfied with the service.
In Colombia, Union Fenosa was also faced with problems similar to those suffered by the utilities
mentioned above. Legal, political, social and regulatory problems, combined with electricity theft and
poor profitability, led the utility to adopt a different approach to each group of consumers. For the poor
consumers, Union Fenosa created local micro-enterprises for metering and collection, community
responsibility for payment, and the creation of a separate legal entity (Energía Social) to manage the
different organisational needs of the community-led approach (Manzetti and Rufin 2006).
Although there seems to be a handful of innovative approaches, a significant observation common to
all of the cases described above is that the planning aspect of slum electrification continues to remain
top-down. Perhaps owing to the high infrastructure costs involved, only the implementation of the
programme has been made participative, involving NGOs, CBOs and the community. The demand for
slum electrification is also not bottom-up, as is evident from the popularity of illegal connections in
slums. That utilities need to improve fiscal discipline, by curtailing losses due to power theft, seems to
be the main evidence provided in the case studies detailed above (USAID 2004). Universal-access
obligation as a result of the privatisation of electricity or the government’s commitment to the poor,
has also been a driving force for slum electrification in some countries (Baruah 2010, Manzetti and Rufin
2006, Scott et al. 2005). For such a top-down approach to be successful, the commitment of the
government/private utility to extend coverage to the slums is of as much importance as the
involvement and participation of the community (Scott et al. 2005). Despite the best efforts of the
service providers (government or private utility) and NGOs, if the community continues to default on
the payment of bills and repayment of loans, or prefers illegal connections to legal connections, slum-
electrification programmes will neither be successful, nor will they be beneficial to the poor.
INTEGRATING ELEMENTS OF INCLUSIVE PLANNING HELPS TO IMPROVE ACCESS
RATES IN SLUMS. TENURE SECURITY IS CRITICAL FOR HOUSEHOLDS TO SEEK LEGAL
CONNECTIONS.
Tenure insecurity is known to have a direct impact on access to basic services. ‘Informal settlements
and insecure land tenure are the result of an exclusionary planning and urban-management system,
which fails to provide legal and practical conditions for lower-income groups to access basic services’
(Almansi, 2009). Tenure security is often used by the government to deny services (government and
donor-assisted programmes) to the poor, which result in an absence of investment in poor communities
(Winayanti and Lang, 2004). Lack of legal recognition, on the one hand, prevents service providers from

104
venturing into slum communities for service provision (Scott et al. 2005) and, on the other hand,
prevents the urban poor from investing in housing improvements (Scott et al. 2013). The fear of eviction
is very real for both the slum dweller and the private utility provider who stands to lose their investment
in the community. Informal slums that do not have de facto tenure security have lesser access to basic
services than formal slums that are recognised and enjoy de jure tenure security (Chandrasekar 2005).
Evidence from six case studies is used to stress the importance of tenure security in provision of basic
services to slums.
In Jakarta, Indonesia, the government’s granting security of tenure has prompted slum-dwellers to
execute several housing improvements, which included investing in electricity lines (Winayanti and
Lang 2004). Similarly, granting of land title to programme beneficiaries as part of the settlement-
upgrading programme in Promeba and Rosario habitat in Argentina resulted in thousands of poor
families gaining access to electricity connections (Almansi 2009).
In Ahmedabad, the NGOs and CBOs facilitated negotiations between the Municipal Corporation and
the AEC to find a solution to the illegality of land occupied by the slum-dwellers (Baurah 2010). It was
agreed that the Municipal Corporation would issue a ‘no objection’ certificate that provided immunity
from eviction to the SEP beneficiaries for a period of 10 years. The AMC introduced an indemnity bond
in other non-networked slums that protected it from legal action if slum-dwellers were evicted or
relocated by the Municipal Corporation any time after the electricity connections were provided
(Baruah 2010).
In the case of the Rio LIGHT PRONAI project, access to electricity provided the slum residents with proof
of residence, which was a highly valued necessity for obtaining phone connections, establish credit, etc.
(USAID 2004). Local government was encouraged to extend land tenures, which legitimised occupancy
and was also an incentive to pay bills regularly. Recognising the ‘citizenship right’ of the slum dweller
to an address and proof of residence was among the most invaluable benefits in participating in the
PRONAI project.
In Thailand, household registration was made compulsory for obtaining electricity connections
(Shrestha et al. 2008). Since this meant that non-registered households could not produce the ID
required for electricity connections, the government issued a quasi-household ID, which enabled the
household to apply for a connection, but at a higher cost than fully registered households. It has been
found that the quasi-household ID cards have substantially reduced the number of illegal electricity
connections in Thailand. The authorities in Philippines and New Delhi have taken a liberal stand:
although residences are not officially recognised and the dwellings are illegal, the government extends
basic services, simply because these communities are well established and tolerated (Scott et al. 2005).
The availability and supply of electricity to slum settlements is closely linked to the urban-planning
process, which often excludes informal slum communities in the cities. ‘Allocation of land for the urban
poor has not received appropriate attention from governments’ (Winayanti and Lang 2004). Evicting
slums-dwellers or relocating slums merely moves the problem from one location to another, instead of
arriving at a sustainable solution. By denying land tenure, poor communities are not only excluded from
the planning process, but are also denied their right to citizenship. Tenure insecurity also has several
economic disadvantages to both the government/service provider and the poor, as it gives rise to illegal
service providers, who gain from the loopholes in the planning and legal framework. The onus,
therefore, is on national and local governments to provide an enabling environment by granting land
tenure that not only strengthens beneficiaries’ feeling of inclusion, but also stimulates private
investment in urban poor settlements (Almansi 2009, USAID 2004).

105
SUMMARY
Provision of electricity has, by and large, followed a top-down approach, often provided either by
government-owned or privately owned utilities. Although alternatives such as kerosene, firewood and
LPG, are used for cooking needs, demand for electricity for lighting, heating and entertainment
purposes in slums is high (Moulick et al. 1999). High connection cost; lack of security of tenure; poor
service and frequent disconnections; a lack of trust between the service provider and the slum-
dwellers; reluctance among private players to enter into slums; non-payment and theft; high
prevalence of illegal connections; and poor-quality wiring and infrastructure, are a few of the reasons
attributed to poor access in slums.
However, there is recognition among governments that slums and squatter settlements can no longer
be ignored and their citizenship rights to basic services must be addressed in order to reduce their
vulnerability to poverty. There is also the recognition that a new and bold approach is needed, one
where the needs and means of the poor are understood and services tailored to suit their needs, instead
of a one-size-fits-all approach. NGOs and CBOs have been used as an effective mechanism to enter into
slums, to listen to the voices of slum-dwellers, and in the roll-out of services. NGOs have also played
the role of mediator in negotiations between the government/utility and the community members.
Private utilities that have been successful in providing access to slums have used innovative approaches
in management and pricing, often combining this with consumer education to have a longer-lasting
impact on the urban poor. Slum communities have also shown their interest in accessing legal electricity
by participating in SEPs, often investing/contributing their funds towards wiring, installing meters and
monitoring the community for theft and non-payment.
Notwithstanding, the success of these efforts can be replicated and sustained only if all stakeholders
are involved in a partnership approach (USAID 2004). Although the planning and finance for SEPs may
be top-down, the implementation must be bottom-up. A clear commitment from all stakeholders and
a partnership based on trust are essential to success.

106
Figure 4.1 Top-down approach, backed by political commitment to the poor and the creation of specialised implementation agencies for pro-
poor projects, can help in improving access.
Change in political and
economic context of a country
(Baruah 2010, Manzetti and
Rufin 2006, Scott.N et.al 2005,
Shrestha et.al. 2008, USAID
2004)
Priority of
government towards
the urban poor
(Shrestha et al. 2008,
USAID 2004)
Creation of
specialized agencies
for coverage/access
to the poor (Shrestha
et.al 2008, USAID
2004)
Focus on access
for all/ Universal
Service obligation
(Shrestha et al
2008)
Partnership with
government owned
utility or private utility
for slum
electrification
(Baruah 2010,
USAID 2004)
Facilitates better co-
ordination between
different agencies
Electrification integrated
with other programs
such as housing or slum
re-development
Simplified
procedures- avoids
additional paper
work and
bureaucracy
Minimizes risk of
eviction
Granting of de-
facto tenure
security (Baruah
2010)
Incentive for
households to
invest in legal
connections
(Baruah 2010)
Priority given to
poor connections
Connections to the
poor a source of
revenue rather
than loss
Incentives for poor
connections
Improvement in
Access
Better
understanding of
the context and
requirements
Private sector
investment
Private sector
efficiency
Customization to
meet the needs of
the poor
Increased
willingness to
apply for
connections
Fiscal discipline
minimise losses
Reduce costs
Ability to provide
more connections
Improves
adequacy
Improves
affordability and
connectivity
Improves
affordability

107
Inclusive and sensitive
approach
(USAID 2004, Baruah 2010,
Manzetti and Rufin 2006)
Utility
Traditional approach
(Parikh et al 2012, Scott et al
2003)
Community engagement
(USAID 2004, Baruah 2010)
Commercial practices
(Manzetti and Rufin 2006,
Baruah 2010, USAID 2004)
Management Practices
(Scott et al 2003, USAID
2004)
Limited customisation
Technical areas
Business areas
Reduced
connection costs
More frequent
billing cycles
Expenditure
control schemes
Consumer
education
Creates trust
High upfront costs
Lack of controls
on electricity
spends
Illegal
connections
End of month bill
doesn’t allow to
track usage
high bills leading
to default/non-
payment
Inadequate and
poor supply
Disconnections
Reduces access
Improved internal
wiring
Remove corrupt
employees
Prioritize customer
care
Prioritize customer
care
Setting up office
within community
Improves access
Improves
affordability and
reduces illegal
connections
Improves
customer
satisfaction
Reduces
consumption and
Improves
affordability
Easier payment
options and
improved
collection
Increased
participation by
households
Figure 4.2: Top-down approach that is sensitive to the needs of the urban poor can help in improving access.

108
Figure 4.3 Top-down approach, supported by NGO intervention and community involvement, yields better connectivity and coverage.
Legal, political, regulatory and
social problems faced by
government/private utility in
service provision to the urban
poor
Poor service to
slums
High transaction costs
(Baruah 2010)
Lack of security of tenure
(Scott N et.al 2005)
Theft and non payment of
electricity bills
Physical constraints such as
poor housing material,
unplanned layout, dense
grouping of houses, narrow
lanes and unsafe wiring
(USAID 2004)
Slum electrification
program/ slum up
gradation program
Involvement of
NGOs and CBOs
(Baruah 2010,
USAID 2004)
Act as intermediaries between
slums and government for land
tenure (Baruah 2010, USAID
2004)
Conduct willingness to pay
study (Baruah 2010)
Consumer education programs
Staff recruited from local
community
Community agents motivate
residents to seek legal
electrification
Community agents/local micro
enterprise for collection of
payments
De facto tenure security as a
result of legal electricity
connections
Improved affordability
Improved wiring and efficient
energy consumption
Improved access
Innovative pricing
methods (Scott
et.al 2003)
Innovative
community
engagement
methods (Baruah
2010, USAID
2004)
Monthly bills instead of bi-
monthly bills. Based on
affordability criteria
Setting up of meter walls
instead of in-house connections
Reduced transaction costs
Trust building with the slum
dwellers and better response to
complaints
Regular payment of bill/
repayment of loans
Loans for internal wiring and
payment of connection costs,
and reduced connection cost
Prepayment meters and pre-
paid cards
Involve CBOs, local
associations and religious
groups

109
Legal Status of Slums/
Tenure security
(Scott et.al.2005, Manzetti
and Rufin 2006)
Formal or recognised
slums (Chandrasekar
2005)
De-jure land tenure Proof of residenceGovernment or private
utility willing to provide
electricity connections
Poor households
willing to invest
capital and pay for
new connection
(Winyanti &Lang
2004
Improvement in Access
Informal or unrecognised
slums
(Parikh et al 2012)
Government engages in informal
slum due to slum upgradation/
new scheme to reduce urban
poverty/ Universal service
obligation/ political pressure
(Baruah 2010)
Government willing to
overlook legal status or
provide conditional access
(Shresta et al 2008, Scott et
al 2005)
No Objection Certificate for a
fixed period (Baruah 2010)
Quasi household IDs
(Shresta et.al., 2008)
Illegal or squatter
settlementNo proof of residence
Government/private utility
unwilling to provide
connections due to
absence of legal
mandate
Poor households
unwilling to invest
due to risk of
demolition or eviction
Poor AccessIllegal and unreliable
connections
Improves connectivity
Improves
connectivity
Figure 4.4: Integrating elements of inclusive planning helps to improve access rates in slums. Tenure security helps households seek
legal connections.

110
WATER SUPPLY
Water supply infrastructure typically comprises components such as water-treatment plants, trunk
networks and distribution networks. These components are often conceptualised in the form of
network and centralised infrastructure, created for delivering water-supply services to the consumer
or users. However, there also exist decentralised forms of water-supply infrastructure, which are
substantially different from network infrastructure. The decentralised form consists of water-supply
service at either household or community level, through bore wells, open wells, water tanks, hand
pumps and alternative water-service providers. A large number of studies reviewed indicate that the
network view of water-supply infrastructure is usually promoted and used for expanding water-supply
services to low-income settlements. However, some studies indicate that the public water supply and
sanitation (WSS) utilities are increasingly realising the importance of decentralised WSS infrastructure
in low-income settlements. Following analysis, we observe that there is a rich diversity in models/forms
adopted for service delivery in low-income settlements. This diversity was reflected in the different
approaches seen in the sector (top-down approach vs. bottom up approach) and participation (passive
vs. active participation). Further investigation revealed that these diverse studies can be categorised
based on the type of actor driving the process of service delivery. These categories represent three
different modes of service delivery: 1) public-sector driven, 2) private-sector driven, and 3) NGO-driven.
We observed that the initial two modes reflect the top-down approach, while the last one reflects the
bottom-up approach. Three themes related to these categories are discussed below:
PUBLIC WSS UTILITIES HAVE TO REFORM THE TOP-DOWN APPROACH, WITH ADDED
FOCUS ON INCLUSIVITY, PARTICIPATION AND INSTITUTIONAL NORMS IN SERVICE
DELIVERY TO THE URBAN POOR.
Studies have discussed various reasons behind the poor state of water-supply services in low-income
settlements: These can be categorised as:
1) Government stability and accountability: government mismanagement and conflict (Devas and
Korboe 2000), poor accountability of local governments (Devas and Korboe 2000), and unclear
responsibilities among government agencies for service delivery in poor settlements (Connors
2005; Ahmed and Sohail 2003);
2) Legislative shortcomings: absence of a legal mandate for network expansion in unplanned
areas (Devas and Korboe 2000; Ahmed and Sohail 2003), and exclusion of slums outside the
ambit of formal legal mandate (Hossain 2012);
3) Public-sector shortcomings: neglect of service delivery to the urban poor by powerful and
statutory authorities (Hossain 2012), financial crunch faced by water utilities and lower
financial allocation for service delivery to the urban poor (Ghafur 2000), and lack of knowledge
on the part of public water utilities about community resources and service delivery to the
urban poor (Connors 2005; Ahmed and Sohail 2003);
4) Community awareness: Absence of knowledge among slum residents about their rights, water-
supply system and avenues available for service improvement (Ghafur 2000).

111
The studies have indicated that the public WSS utilities require either external or internal stimuli for
reforming the top-down approach, with the aim of addressing the above-stated bottlenecks in the
service delivery to the urban poor. Water utilities lacking these stimuli do not make any progress on
addressing the reasons behind poor service delivery, resulting in the maintenance of the status quo.
The situation of disinterest in the public sector towards service delivery to the urban poor is the result
of the combination of reasons listed above. For example, two studies have indicated that the WSS utility
failed rectify the absence of a legal mandate for network expansion in informal settlements (Devas and
Korboe 2000; Hossain 2012). The results showcase the fact that the lack of water supply from the public
WSS utility forced the slum households to rely on alternative water sources, such as ground water and
alternative water-service providers. The use of ground water jeopardises sustainability, as it results in
stress on ground-water sources, lowering of the ground-water level and salinity ingress. The water
sourced from the alternative water-service providers is costly and of questionable quality, affecting
both affordability and adequacy of water services.
Devas and Korboe (2000) discuss how the distance between the decision making of the public WSS
utility and on-the-ground realities in low-income settlements adversely affects the water-supply
infrastructure (). Some of the negative effects are: 1) discontinuation of public standpipes affecting the
access to water supply for vulnerable sections of slum communities, which cannot afford individual or
group connections; 2) arriving at connection charges without analysing the ability of the urban poor to
pay, resulting in a lesser number of individual connections; and 3) using a graduated block-tariff
structure for individual, as well as group ,connections, resulting in higher water charges for group
connections. Hossain (2012) describes a community that had to resort to illegal water services provided
by local men. This community has come together to form an organization to facilitate access to legally
supplied water. Although the community organization was recognised by the government to avoid the
possibility of eviction due to the insecure tenure of their settlement, they could not get access to a legal
water supply. Finally, the community was forced to tap water from an existing household, and run an
illegal water-supply network. The water services charges were also exorbitantly high in comparison with
water charges levied by the public WSS utility. Also, the durability of the water supply was questionable,
as the illegal water sourcing led to undue influence from politicians and corrupt public WSS utility staff.
We have come across different external stimuli, such as ODA with a focus on service delivery to the
urban poor, unrest and dissatisfaction among the urban poor over the state of WSS services, and
societal pressure to include slum-dwellers in participatory governance (Ahmed and Sohail 2003;
Connors 2005).
The studies have indicated that the funding programmes by sources of ODA have substantially
influenced the WSS service delivery in poor settlements. The access to these funds was contingent upon
addressing the reasons behind the poor state of service delivery. As a result, the WSS utilities were
forced to find solutions to the legislative, institutional and technical issues mentioned above. The
culmination of these efforts has resulted in the extension of water-supply networks in low-income
settlements in certain cases (Connors 2005; Almansi 2005). However, these programmes may be
confined to a pilot level and there is a need to sustain efforts in the direction of water supply to the
urban poor.
The public WSS utilities typically have a legal mandate to deliver water supply to notified or legally
recognised low-income settlements. Land tenure is one of the fundamental parameters that decide the
legal recognition of low-income settlements. Therefore, the low-income settlements that do not meet
the requirements of land tenure fall outside the purview of the public WSS utility. In some cases, donor
agencies have made funding contingent on utilities looking for alternative mechanisms for addressing

112
the constraint of land tenure (Connors 2005). The removal of this constraint has led to improved
connectivity in informal settlements. However, the sustainability of these improvements is very
important. Connors (2005) indicates that the public WSS utility was impressed with these
improvements and there was societal pressure to include the slum community in participatory
governance. The result was that the WSS utility continued efforts in this direction through mechanisms
such as 1) rephrasing the connections to slum households as an additional source of revenue, 2)
appointment of NGOs as entry points in slums, and 3) encouraging community participation in the
decision-making process. These all-round efforts not only led to sustained gain in the direction of
connectivity, but also ensured affordability of services.
The dissatisfaction over the state of water-supply services in low-income settlements may lead to social
unrest, and force the government to intervene and reform its top-down service-delivery approach with
utmost priority. Ahmed and Sohail (2003) discuss the programme for provision of water supply in low-
income settlements in Karachi, Pakistan. This programme was formulated by government agencies in
response to community unrest and dissatisfaction over the state of the water supply. The government
has explored a wider participative spectrum, involving consultation and partnership with the
community. In the first stage, a survey was carried out among households in low-income settlements
in an effort to understand their service requirements, and, subsequently, a decision was made to set
up water tanks at different places in low-income settlements. The water tanks were owned either by
the government or the community. The government provided water to these tanks, which was further
distributed with the help of community. This programme has brought positive improvements in access
and affordability of water supply.
The top-down approach does not always require external impetus to bring the public sector’s attention
towards water supply to the urban poor. For instance, in the case of the water supply and sanitation
services in Lusaka city (Kayaga and Franceys 2008), the sector had undergone reforms that involved a
slew of important pro-poor measures, such as 1) the creation of a water-supply and sanitation
regulator; 2) a legal mandate for the WSS regulator to ensure service provision for the urban poor; 3)
creation of a Devolution Trust Fund (DTF) for providing financial support to service providers for
network expansion in low-income settlements; 4) advisory support by the WSS regulator to the DTF;
and 5) preparation of guidelines on performance-assessment criteria, cost recovery and community
participation. This all-round effort bore fruit with the usage of a water-kiosk model. This model has
enabled improved access to water supply in low-income settlements with the help of financial support
from DTF and community mobilisation. The improvement in water-supply services brought by the
influence and involvement of external organisations such as ODAs, NGOs and communities indicates
the necessity of partnership for effective delivery of services in slums. This partnership can be with the
private sector, under PPP arrangements, or by collaborating with NGOs. The partnership between the
public and private sector is the focus of the next theme.
PUBLIC-PRIVATE PARTNERSHIP MODEL, WITH BUILT IN PRO-POOR CONTRACTUAL
FEATURES AND INSTITUTIONAL FLEXIBILITY, CAN SERVE AS AN EFFECTIVE
MECHANISM FOR IMPROVED WATER-SUPPLY SERVICES IN LOW-INCOME
SETTLEMENTS.
The partnership between the public sector and private sector (corporate for-profit entities) has been
gaining prominence in developing countries as a mechanism to improve and upgrade infrastructure.
The interests in PPP arrangements stem from their potential to address financial, policy and technical-
capacity challenges faced by public-water utilities. We have positioned the PPP arrangements as a part

113
of the top-down approach to the parameter of degree of inclusivity. This is based on the practice of
minimal involvement of community or NGOs in crafting PPP arrangements, and the subsequent phases
of infrastructure creation and service delivery. There are various factors that create pitfalls in the use
of the PPP model: location and layout of slums, and alternative water-service providers.
Low-income settlements are often located far away from the existing water-supply network in peri-
urban areas or beyond service-area boundaries. Similarly, low-income settlements within the municipal
boundaries are served by illegal water connections or alternative water-service providers. The water
service provided by these two means fares very poorly on the criteria of affordability, effort and time
required to access the service, and sustainability. Therefore, it necessitates the laying of new
distribution networks. This results in high investments in the creation of water-distribution networks
and, consequently, higher connection charges to the user. Considering the inability of the poor to pay
high connection charges, the private sector, driven by the profit motive, finds the network expansion
in low-income settlements to be a financially unviable proposition. The high connection charges can
deter the poor from connecting to the water-supply network. In addition, the low level of consumption
by users in low-income settlements further reduces its financial attractiveness. Under this scenario, it
becomes necessary to include in the concession agreements the specific mandate of extension of
services to poor areas. The inclusion of extension targets in the concession agreement forces the private
sector to search for innovative ways of meeting these targets. This innovativeness, which is also backed
by the incentive to generate more revenues from service delivery, is often lacking in public WSS utilities.
The laying of pipeline networks in the low-income settlements can cause engineering and construction
bottlenecks due to narrow roads and congested layouts. Also, the requirements of the urban poor on
the parameters of adequacy, effort and time, and connectivity are different. Therefore, a one-size-fits-
all standard cannot be enforced on all water-supply users; customisation is required, especially for the
urban poor.
The low-income settlements lacking a public water-supply network and slum households that remain
unconnected to the public water-supply network, owing to higher connection charges and water tariffs,
rely on ground-water sources or alternative water-service providers. The operations of these
alternative water-service providers are beyond the ambit of the water-supply regulator or
governmental legislations. The urban poor are forced to buy the water, which is of questionable quality,
from these alternative water-service providers at exorbitant rates (Ioris 2012, Sohail 2003, Gerlach and
Franceys 2010). The alternative water-service providers often have political clout and linkages with the
staff of the public water utility. Apart from this, alternative water-service providers have invested
substantial resources in water-supply vehicles and supporting infrastructure over a period of time.
Therefore, the appropriate mechanisms for involvement of these alternative water-service providers
have become an important aspect of service delivery to the urban poor.
The public water utilities face not only technical and financial, but also legal, obstacles to the delivery
of water supply to low-income settlements. In most cases, the public water utility has a monopoly
mandate to provide services in the formal or legally recognised slums. Often, the land title for a slum
household is stressed as a legal requirement for provision of water supply; as a result, informal slums
remain outside the policy ambit of the water utility. The public sector has to provide flexibility in the
PPP concession agreements to address pitfalls in the areas of engineering and construction of network,
legal hurdles and involvement of alternative water service providers.
We have observed two categories of studies that discuss experiences with PPP arrangements: 1) studies
in which the PPP model has in-built pro-poor contractual features and/or the public sector provides

114
flexibility to the private sector to customise service delivery in low-income settlements, to address
pitfalls associated with the use of the PPP model (Weitz and Franceys 2002, Gerlach and Franceys 2010,
Hardoy and Schusterman 2000, Chauhan and Lal 1999, Laurie and Crespo 2007, Sohail 2003), and 2)
studies in which the public sector failed to recognise pitfalls associated with the use of the PPP model,
resulting in a lack of pro-poor contractual features and/or the public sector showing a rigidity or
unwillingness to deviate from set/traditional practices in service delivery (Gerlach and Franceys 2010;
Laurie and Crespo 2007; Ioris 2012). These two sets of studies allowed us to compare and contrast the
working of PPP arrangements for water-supply services in low-income settlements.
The elements observed in the first category of studies that have implications for service delivery to the
urban poor are: 1) flexibility in the payment of connection charges, 2) a contractual requirement to
extend services to poor areas, 3) engineering and design standards, 4) alternatives to fulfilling legal
norms for service delivery in informal/low-income settlements, 5) involvement of non-governmental
and community organizations and 6) recognition of alternate water-service providers.
We have observed that the private sector has taken systematic measures to ease the burden on the
urban poor, due to the connection charges (Hardoy and Schusterman 2000, Weitz and Franceys 2002,
Sohail 2003). This involves understanding the ability of users to pay connection charges and allowing
the urban poor to pay the connection charges in instalments. The private sector, in many instances, has
played an instrumental role in convincing the public sector to provide financial resources in the form of
grants and subsidies to bear cost, in whole or part, for network expansion (Weitz and Franceys 2002,
Laurie and Crespo 2007). The studies have indicated that the lowering of connection charges and the
possibility of payment in instalments have a positive effect on connectivity of water-supply services.
We came across few studies indicating that the prevalent technical standards are ‘high’ on the
parameters of individual water connection, water pressure and network layout, considering the slum-
dwellers’ capacity to pay and service expectations (Weitz and Franceys 2002). The studies show that, if
the government agency is flexible and appreciates the economics of the poor, this allows the private
sector to ensure connectivity with mechanisms such as water supply through water tankers, water
tanks, water hand pumps, reselling of water by alternative water-service providers, and so on (Weitz
and Franceys 2002, Sohail 2003, Gerlach and Franceys 2010). These mechanisms were effective in
improvement of ‘connectivity’ of water supply in congested and unreachable low-income areas, which
would have remained ‘unconnected’ owing to the perceived inability to adopt engineering standards.
The studies have not reported any specific reasons that deter the public WSS utilities from using similar
flexibility in the purely ‘public-sector driven’ approach to service delivery. Although, the close readings
of these studies indicate that the probable missing element in the public WSS utility could be the ability
to create and manage these decentralised and innovative service-delivery mechanisms.
The private sector can be allowed to provide either group connections or individual connections. The
urban poor who have the capacity to bear connection charges singlehandedly can opt for individual
connections, while others can opt for group connections. The group connections formed with an
organic process of ‘self-mobilisation’, which involves communication and consultation among
households, and then approaching the concessionaire for the required number of group connections,
fares well on the parameter of ‘adequacy’ (Weitz and Franceys 2002). This necessitates the
concessionaire’s willingness to reach the ‘consultation’ level of the participative spectrum (Gerlach and
Franceys 2010). However, if the group connection is used as a normative performance measure in the
concession agreement for fulfilment of the ‘connectivity’ objective, it leads to negative effect on
‘adequacy’. A study has indicated that the private sector overestimates the number of users served per
connection, resulting in lesser water availability per household (Gerlach and Franceys 2010).

115
We have observed in a study that the private sector has convinced the government to use other
documents, of which slum householders will be in, or will be able to gain, possession, as proof of identity
and residence (Weitz and Franceys 2002), thereby allowing the private sector to provide water
connections in the informal slum.
Studies indicate that, in certain cases, the concessionaire has involved the alternative water-service
providers in water supply by allowing the reselling of water. The experiences of their involvement are
mixed. Gerlach and Franceys (2010) discuss the ‘commercial kiosk-management model’, which provides
an appropriate margin for the bulk water supplier, and water-kiosk operator, and regulates the water
tariff. This results in improved connectivity in low-income settlements that are not served by a piped
water-supply network and ensures affordability of water supply. However, there are studies that
indicate the outcome of unregulated water tariffs and reselling of water by alternative water-service
providers. It is observed in these studies that the alternative water-service providers sell the water at
their discretion, and this results in an adverse effect on affordability (Gerlach and Franceys 2010, Weitz
and Franceys 2002).
The adoption of the PPP model as a top-down approach by the public water utility does not necessarily
inhibit the participation of community and NGOs in service delivery. We have come across studies that
show the involvement of NGOs in areas such as conducting information, education and communication
(IEC) campaigns, provision of microfinance, community mobilisation and serving as an intermediary
between the private service provider and the community (Weitz and Franceys 2002; Hardoy and
Schusterman 2000; Chauhan and Lal 1999). This involvement of NGOs is normally not a part of the
concession agreement, but, rather, results from the willingness of the private service provider to tap
the social and community skills of NGOs for service delivery to low-income settlements. The systematic
involvement of NGOs has brought positive improvements in project outcomes.
Effective involvement of NGOs can result in the right balance being found between technical, social
and financial resources required for service delivery.
Two themes discussed earlier focus on top-down approaches, with service delivery by public WSS utility
and usage of PPP arrangements, respectively. In the studies associated with these two themes, we have
observed that the government and/or the private sector was in the driving seat to decide the planning
and execution of pro-poor urban service-delivery programmes. Even though the involvement of NGOs
is reported in few studies related to these two themes, the NGOs primarily facilitated the agenda
decided by the government and/or the private sector.
There are another set of studies that indicate the central role played by the NGOs in the delivery of
water-supply services to low-income settlements (Bapat and Agarwal 2003, Rena 2011, Gessler et al.
2008, Kayaga and Kanimbla-Mwanamwambwa 2006, Weitz and Franceys 2002). In these studies, NGOs
played varied roles based on the local settings of a project. Kayaga and Kanimbla-Mwanamwambwa
(2006) discuss the experiences of the Water Trust system established by an NGO in the low-income
settlement in Lusaka, Zambia (). The NGO involved in this system had a longstanding association with
the low-income settlements in Lusaka and it helped to identify water supply as a t critical issue faced
by the community. This NGO then developed the Water Trust model with funding from an ODA, and
this model has the following distinct features: 1) mobilisation of community members to participate
physically and appreciate the importance of cost recovery; 2) promotion of participation at grassroots
level by formation of residents and zonal-development committees; 3) phased approach to community
involvement with elements such as provision of necessary construction materials, conducting artisan
training for community members; 4) fulfilment of legal requirements associated with the water-supply

116
sector by representation to government entities in the decision-making process; and 5) formation of a
management team for service delivery with provision of technical staff, formation of service contract
with vendor and tap attendant, collection of user charges and creation of a service-monitoring
mechanism.
These well-rounded and distinct features captured different dimensions of water supply to the urban
poor and brought about a positive effect on service delivery. An increased population was served
through the standpipe and yard-tap connections; there was a reduction in distance travelled and time
to collect water, an increase in number of hours of operation, and reduction in drawing of ground-water
from shallow wells.
Along similar lines, there are two more studies indicating leadership of NGOs. One study relates to the
improvement of water supply in slums in Kathmandu, Nepal, with the involvement of an NGO (Weitz
and Franceys 2002). The public WSS utility in Kathmandu refused to provide water connections in
informal slums, citing the fact that the households did not have house-ownership certificates. After the
intervention of the NGO, the municipal ward committee agreed to remain as a guarantor for the two
unmetered public taps in the informal slums. This made the public water supply accessible to the
informal slums. The water-supply network was extended further with the community’s contributing to
laying and connecting pipes, collection of connection charges from the community, and the formation
of a water-user group for monitoring and funding by ODA for the laying of main water lines. The
extension of the network, apart from increased connectivity, ensured adequacy of water supply by
providing a sufficient number of community taps.
Weitz and Franceys (2002) share the experiences of a water-supply project in Dhaka, Bangladesh (). In
this project, the NGO served as an intermediary between the slum communities and public WSS utility.
The NGO involvement positively addressed different dimensions of service delivery: 1) affordability: the
water tariff was decided by the community to cover the public WSS utility’s bills after taking into
consideration prices charged by private water vendors; 2) effort and time: water points were installed
within the slum settlements; and 3) durability: creation of institutional mechanisms, such as the
formation of a water management committee (WMC), bringing financial management of the water-
supply initiative under the purview of the WMC, including collection of water charges from users, and
construction of water points on municipal land. Another study highlights the need for cooperation
between NGOs and the public WSS utility (Bapat and Agarwal 2003). In this study, a group of slum-
dwellers came together under the championship of an NGO and installed household water connections
at their own cost. However, the public WSS utility did not connect these households to the water-supply
network, forcing these households to buy water from alternative water-service providers at a high
price.
SUMMARY
The analysis of studies pertaining to water supply indicated three modes of service delivery, namely: 1)
public-sector-driven, 2) private-sector-driven and 3) NGO-driven. The initial two modes reflect a top-
down approach, while the last one reflects a bottom-up approach. We observed that the low degree of
inclusivity and participation in the top-down approach resulted in ineffective service delivery to the
urban poor. However, whenever there existed external or internal stimulus for the reforms in the top-
down approach and a willingness on the part of the public sector, it resulted in a higher degree of
inclusivity and participation. This consequently translates into effective service delivery to the urban
poor. The path towards the higher degree of inclusivity and participation requires partnership with able
actors, such as private-sector entities and NGOs. The PPP model is a mechanism that brings together

117
public and private actors for service delivery. We have observed that the PPP model holds the potential
to address the bottlenecks faced in the ‘purely public’ service-delivery model. The ‘private-sector-
driven’ mode of service delivery is motivated by the financial incentives to the private sector and, as a
result, the private sector takes the leadership role in reforming the top-down approach in order to
create better revenue streams. Therefore, the pro-poor concession agreement and willingness of the
public sector to provide flexibility to the private sector to meet the service-delivery needs of the urban
poor are essential elements. The ‘NGO-driven’ mode of service delivery represents a high degree of
inclusivity and participation. It results in an effective service delivery; however, the cooperation and
support of the public sector is essential to the success of this mode.

118
Public sector driven “Top Down
Approach” to service delivery
Poor state of water supply
services in low income
settlements
Government instability and
unaccountability
(Devas and Korboe 2000; Connors
2005; Ahmed and Sohail 2003)
Legislative hurdles in supplying
water to urban poor
(Devas and Korboe 2000; Ahmed
and Sohail 2003; Hossain 2012)
Policy vacuum about how to solve
challenges faced by urban poor
(Hossain 2012)
Financial crunch faced by WSS
utilities and lower financial
allocation for service delivery to
urban poor
(Hossain 2012)
Lack of community knowledge in
WSS utilities
(Ghafur 2000)
Poor community awareness about
urban governance and service
delivery
(Connors 2005; Ahmed and Sohail
2003)
Funding programs by ODAs
Pro-poor aid conditionalities
WSS utilities decided to find
solutions to reasons behind
poor WSS services
Land tenure - deciding legal
recognition of slums and
service delivery
Low income settlements
falling outside the purview
of WSS utility
(Connors 2005)
Use of alternate mechanisms to
meet the purpose served by land
tenure
Improved connectivity
in informal
settlements
Lack of impetus to reform
the “Top Down Approach”
Absence of legal mandate
for network expansion in
informal settlements
Failure of WSS utility to
come out of legal quagmire
(Devas and Korboe 2000;
Hossain 2012)
Slum households forced to
rely on alternate water
sources
Lowering of ground water
and salinity ingress
Compromise the
sustainability in WSS
service delivery
Costly and poor quality
water supply
Adverse effect on
affordability and adequacy
of water services
Disconnect between between
decision making of WSS utility
and ground realities in low income
settlements
(Devas and Korboe 2000)
Lack of willingness to
reform the “Top Down
Approach”
Discontinuation of public
standpipes
Higher connection charges for
individual connections
Higher water charges for group
connections
Adverse effect on
connectivity and
affordability of WSS
services
Community came together
to facilitate access to legal
water supply
Community resorted to illegal
water services provided by
local musclemen
(Hossain 2012)
Community successfully
convinced the government to
avoid eviction, but, failed to
secure legal WSS service
Community created illegal
water supply network from
nearby legal water source
Higher water charges
Undue influence from
politicians and corrupt WSS
utility staff
Adverse effect
on affordability
of water supply
Adverse effect
on durability of
water supply
Community unrest and
dissatisfaction over state of
water supply
(Ahmed and Sohail 2003)
Forced the government
to intervene and reform
“Top Down Service
Delivery” approach
Consultation and
partnership with the
community
Creation of government /
community owned water
tanks
Operation and maintenance
of water tanks by
community
Improvements in access
and affordability of water
supply
Willingness of government to
improve “Top Down
Approach” to service delivery,
with focus on pro-urban poor
measures
(Kayaga and Franceys 2008)
improved access to water
supply in low income
settlements
Creation of WSS regulator
Entrusted responsibility of
ensuring service provision
in slums to WSS regulator
Financial support for
network expansion in low
income settlements
Encouragement to
community participation
WSS impressed with
the improvements
Societal pressure to
include slum
community in
participatory
governance
WSS impressed with
the improvements
Fig 4.5: Public WSS utilities have to reform the top-down approach, with an added focus on inclusivity, participation and institutional
norms in service delivery to the urban poor

119
Disinterest of WSS utility
towards network expansion
in LIS
Inability of urban poor to
pay higher connection
charges
Low-income settlement
(LIS) located far away
from existing WS network
LIS located within service
areas boundaries lack
WS network
Higher investments in
laying new distribution
network
Higher connection charges
Lower level of consumption
in LIS
Weak revenue potential for
WSS utility
Poor state of WSS services
in urban areas
Decision of the government
to adopt PPP model for
service improvement
PPP model with in-built pro
poor contractual features
Inclusion of extension
targets in the concession
agreement
(Hardoy and Schusterman
2000; Weitz and Franceys
2002; Sohail 2003)
Measures taken by the
private sector to meet
extension targets
Reduction in financial
burden on the urban
poor
Improvement in
connectivity and
affordability of
WS services
Engineering and
construction challenges
posed in network expansion
in LIS
Proposal by the private
sector to adopt innovative
service delivery
mechanisms and ease
technical parameters, to
connect urban poor
Public sector provided
flexibility to the private
sector to customize service
delivery in LIS
Water supply by water
tankers, water tanks and
water hand pumps
(Weitz and Franceys 2002;
Sohail 2003; Gerlach and
Franceys 2010)
Improvement of
“connectivity” of
water supply in
congested and
unreachable low
income areas
Allowing private sector to
provide group connections
Communication and
consultation among
households in LIS for
arriving at number of
group connections
Adequacy of water
supply services
Private sector interprets the
number of users served per
connection more
generously
Group connection used as
a normative performance
measure for fulfillment of
connectivity objective
(Gerlach and Franceys
2010)
Lesser water availability per
household
Inadequate water
supply
Reselling of water by
alternate water service
providers
Appropriate margin for the
bulk water supplier, and water
kiosk operator, and regulated
the water tariff
(Gerlach and Franceys 2010)
Improved connectivity
and ensured
affordability of water
supply
Unregulated water tariff
(Gerlach and Franceys
2010; Weitz and Franceys
2002)
Adverse effect on
affordability of water
users
Involvement of NGOs for
tapping social and
community knowledge
(Weitz and Franceys 2002)
PPP model lacking pro poor
contractual features
Discrepancy between municipal and service area
boundaries in concession agreement
(Gerlach and Franceys 2010)
Lesser number of new
connections in LIS
Lacunae in PPP model with
lack of clarity on concession
area
(Laurie and Crespo 2007)
Lesser number of
connections in LIS
Private sector convinced
the public sector to waive
requirement of land title
as a proof of identity and
residence
(Weitz and Franceys
2002)
Private sector provided
connections in informal
slums
Understanding the ability of urban poor to
pay connection charges
Allowing the payment of connection
charges in installments
Convincing the public sector to provide
grants and subsidies to bear costs of
network expansion
(Weitz and Franceys 2002; Laurie and Crespo
2007)
Fig 4.6: PPP model, with built-in pro-poor contractual features and institutional flexibility, can serve as an effective mechanism for improved WS
services in LIS

120
Poor state of
WSS services in
low income
settlements
(LIS)
Leadership position
taken by NGOs for
service
improvement, with
adoption of “Bottom
Up Approach”
Community mobilization for constructing service infrastructure
Improvement of community awareness about cost recovery in service delivery
Representation to government entities in the decision making process
Community capacity building for creation and maintenance of infrastructure
Creation of community teams for collection of user charges and service
monitoring
(Kayaga and Kadimba-Mwanamwambwa 2006)
Improved connectivity: Increased population
served by stand pipe and yard tap connections.
Reduction in distance travelled and time to collect
water
Improved adequacy: increase in number of hours
of operation
Improved sustainability: Reduction in drawing of
ground water from shallow wells
Initiation of dialogue with
public WSS utility that was
refusing water connections
in informal slums
(Weitz and Franceys 2002)
NGO convinced municipal management committee to remain guarantor for
two unmetered public tapsWater supply accessible in
informal slums
Facilitation of funding by ODA for network expansion in informal
slums
Community contribution in burying and connecting pipes
Collection of connection charges from the community
Formal of water user group
Increased connectivity
Ensured adequacy of water
supply by providing
sufficient number of
community taps
NGO served as an
intermediary between the
slum communities and
public WSS utilities
(Weitz and Franceys
2002)
Water tariff was decided by community,
considering payment of public WSS utility's
bills and prices charged by private water
vendors
Installation of water points
within slum settlements
Formation of water
management committee
(WMC)
Entrusted financial
management of WS
initiative to WMC
Collection of user charges
Construction of water points
on municipal land
Ensured affordability in WS sevices
Ensured durability in WS services
Reduction in effort and time
Formation of community
groups
Installation of household water
connections
(Bapat and Agarwal 2003)
Public WSS utility did not
connect households to the
WS network
Householders had to buy
water from vendors at
higher costs
Lack of co-operation
between NGO and public
WS utility
Fig 4.7: Effective involvement of NGOs can result in achievement of the right balance between technical, social and financial resources
required for service delivery

121
SANITATION SECTOR
‘Lack of basic sanitation and adequate water for bathing and washing clothes is an acute problem and
an infringement of human dignity and rights. Governments lack sensitivity to these issues and, as towns
and cities grow, they do not seem to be prepared to tackle this looming crisis’ (Water Aid India 2008).
Since sanitation is closely linked to health and productivity, there is a heavy price to pay for ignoring
the sanitation needs of the urban poor. While high-income households have the capacity to construct
their own toilets and link them to the existing sewerage system, in contrast, most urban-poor
communities practise open defecation or use unhealthy and unsanitary make-shift toilets that are
perilous to both their community and the environment. Waterlogging and stagnation stemming from
poor sanitation are also problems that exacerbate the health risk.
Provision of sanitation in cities has predominantly been a government service — that is, provided by
the municipal or local government. Sanitation can be bifurcated into two types of infrastructure: (a) a
sewerage and/or drainage system including sewerage mains and feeder systems; and (b) toilet facilities.
While planning, design and construction of sewerage systems has predominantly been the
responsibility of local or municipal governments, toilets, which are at built at household level, are often
constructed by individuals using their own capital. However, poor communities do not have access to
either city-level sewerage systems or individual toilets (Bapat and Agarwal 2003, Hasan 2006). Since
many slum communities are unplanned/illegal settlements to start with, they are often excluded from
city planning. Hence, slum settlements are provided with connections to either public/community
toilets or sewerage mains on an ad hoc basis — without much planning or understanding of community
needs (Kifanyi et al. 2013, Burra et al. 2003, McFarlane 2009, Chauhan and Lal 1999, Joshi 2005).
Spatial constraint also poses a major problem in provision of sanitation in slums. Availability of sufficient
land within the slum to construct community toilets is a challenge, and space within the individual
house to construct a toilet is a luxury (Bapat and Agarwal 2003, Burra et al. 2003, Hobson 2000). As a
result, slum residents are forced to share their toilets with neighbours, use public or community toilets
that are badly maintained, travel long distances and wait in serpentine queues to use those toilets or
defecate in open/plastic bags, buckets, etc. Overall, very little attention has been paid to three key
aspects: planning, construction and maintenance of sanitation infrastructure for the urban poor.
As mentioned earlier, since the responsibility for sanitation has primarily rested with governments,
provision of services to slums has been top-down, characterised by lack of sufficient planning,
innovations in design/construction and poor maintenance, which have exacerbated the problems of
the poor (Bapat and Agarwal 2003, Burra et al. 2003, Hobson 2000).
Private-sector efforts have also failed, as private providers are interested in the middle-class, rather
than the poor, who do not have the means to pay the high user charges (Kifanyi et al. 2013). NGOs and
CBOs, however, have experienced some success in sanitation efforts, as they have focused on
community involvement in planning, design, implementation and maintenance (Burra et al. 2003,
McFarlane 2009, Chauhan and Lal 1999). Interestingly, there has been a recent paradigm shift, where
we see the coming together of all stakeholders — that is, government, NGOs and the community, in a
joint public-private and community partnership that has important lessons for widening the sanitation
coverage in slums (Burra et al. 2003, McFarlane 2009, Chauhan and Lal 1999, Weitz and Franceys 2002,
Kifanyi et al. 2013, Khandaker and Badrunnessa 2006, Gold 2013). The following sections discuss these
themes in greater detail.

122
Governments’ top-down approach lacks planning, focuses attention only on ad hoc creation of
infrastructure (capital costs) and pays little attention to design and maintenance (D&M costs).
International perspectives on sanitation show that provision of sanitation services to the poor have
suffered due to the (a) lack of consultation/participation of users in identifying, planning and
implementing their sanitation needs and (b) government’s lack of financial resources, sensitivity in
understanding the sanitation needs of the urban poor and a commitment to address their basic
entitlement (Ghafur 2000, McFarlane 2009, Burra et al. 2003, Kifanyi et al. 2013). Overall, sanitation
lags behind water provision because open defecation, and flying or platform toilets are options unlike
water and electricity, for which a service provider is needed (Joshi 2005).
In the traditional top-down approach of service provision, slum-dwellers and low-income households
have been provided with some, albeit rarely adequate, connectivity by the government. Due to the
limitations of this approach, such as lack of consultation, poor design and, more importantly, little
attention to maintenance of infrastructure, the longevity of the result of these efforts has been affected
(Burra et al. 2003). Data on sanitation often understate the problems. Since access to sanitation is
measured mostly in terms of connectivity, an explicit distinction between households with toilets and
households that use community/public toilets is absent (Adubofour et al. 2012, Osumanu 2007).
As can be seen from the evidence presented earlier in this chapter, connectivity accounts for the highest
number of assessments, and shared or community connections are more numerous. Due to lack of
participation in planning and implementation of sanitation efforts, community connections provided
by the government using the top-down approach have not shown results, as there is no ownership of
the infrastructure within the community (Ghafur 2000). When combined with insufficient resources
(after donor assistance has ended), the community eventually stops using the infrastructure altogether
(Roma and Jeffrey 2011).
Burra et al. (2003) also point out that, until recently, even international funding agencies (who fund
state and central government’s poverty-alleviation programmes, which include sanitation measures)
were reluctant to accept public or community toilets as a solution to sanitation deficiencies in slums.
However, the attitude of ODA providers has changed in the recent past, resulting in a slew of slum-
sanitation projects that have been undertaken by various governments. For example, UNICEF in
Bangladesh (Ghafur 2000), the Canadian International Development Agency (CIDA), UNDP, DFID and
the World Bank in Kumasi, Ghana (Devas and Korboe 2000) and in Mumbai, India (McFarlane 2009).
The Slum Improvement Project (SIP) in Bangladesh is an interesting case study that highlights a top-
down model that provided connectivity, but failed in addressing the needs of the community. The SIP
was a state sponsored, donor-assisted government intervention, begun as a pilot in 1985 and covering
36,000 households in 200 project sites in 25 municipal towns and city corporations. The government of
Bangladesh was persuaded to pursue and implement the UNICEF-Bangladesh-funded SIP (whose main
role was to encourage governments to address the problems of the poor), as it did not have the
necessary financial means to implement the project, and UNICEF was willing to offer financial support.
The SIP targeted women by providing income-generating loans, supporting day-care centres,
healthcare, tube wells and sanitary latrines (Ghafur 2000).The SIP followed a four-tier implementation
structure (with inputs from UNICEF) that included all stakeholders, including ministers, funding-agency
representatives, NGOs and, the Local Government Engineering Bureau (LGEB) ,which was given the task
of nationwide co-ordination.

123
Primarily a top-down approach, although the SIP was claimed to be a success in improving the living
conditions in the project areas, it reached less than 4% of the poorest families and less than 2% of urban
poor households (Ghafur 2000). With the funding from UNICEF coming to an end, implementation of
the SIP was also discontinued, since the Bangladesh government could not find the resources to
continue the project. The problems in this model included a hierarchy-patronage relationship, where
the authorities were making all the decisions, instead of encouraging local communities to claim their
entitlements. The ‘felt-needs’ of the community were spelt out by the providers, rather than the
recipients, thereby denying communities a chance to articulate their collective needs. Since the SIP was
implemented entirely by the government, there was no ownership of the infrastructure created.
Community members became passive-recipients. who were not allowed to air their views or participate
in decision-making. Despite these shortcomings, the Bangladesh SIP is considered best practice in the
top-down approach, as it demonstrated the ability and willingness of the government to get involved
in providing sanitation to the poor, under challenging circumstances (Ghafur 2000).
Apart from maintenance, location of toilets and the time/distance travelled to access toilets are also an
important factor that determines use of the facility, especially by women and children, who are often
ignored in the top-down approach (Joshi 2005, Bapat and Agarwal 2003, Sohail 2009, Gessler et al.
2008). Allocation of toilet seats in community toilets is tilted in favour of men, leaving few seats for
women and almost none for children. As a result, women use toilets early in the mornings or defecate
in the open, late at night, which poses not only a risk to their personal safety, but also causes gastro-
intestinal disorders (Joshi 2005, Bapat and Agarwal 2003). Due to the distance to toilets, mothers are
unable to spend time taking children to toilets that are not child-safe and, consequently, also encourage
children to defecate in the open (Joshi 2005, Bapat and Agarwal 2003, Burra et al. 2003).
The concept of public toilets built by the Indian Government is an example of a failed top-down
approach (Burra et al. 2003). Several municipalities in India have provided ‘public’ toilets, some of which
are located within slums or near slums, which slum-dwellers also use. However, many of these public
toilets have failed to achieve their purpose, due to insufficient numbers of toilet seats, the long distance
travelled to access the toilets, poor maintenance by municipal (appointed) staff/contractors,
affordability (that is, the high user charges), and exclusion of children (Burra 2001, Joshi 2005,
McFarlane 2008).
In Africa, the situation is slightly different. Urban government is largely absent in the provision of
sanitation services, and households are serviced by small-scale independent providers, or take care of
their own needs (Scott 2013). Private-sector involvement has also not succeeded; its problems include
the absence of a regulatory framework in implementing countries, lack of transparency in awarding
contracts, the weak link between service charges for contractors and cost of service, and high interest
rates (Weitz and Franceys 2002). Exploring the public-private arrangement in Queenstown and Dolphin
Coast in South Africa, Sohail and Cavill (2009) claim that sanitation is a ‘particularly difficult service to
provide under a PPP. While costs/user charges are high, poor users are not involved in the initial
decision to engage in a PPP.’ The private sector has been disappointing in the provision of sanitation,
as it could not succeed in bringing new sources of investment and was interested in targeting middle-
class neighbourhoods that could pay than the poorer settlements, who lived without adequate means
(Kifanyi et al. 2013). In Ghana, post-decentralisation, sanitation services were privatised, but quality of
service remained unimproved in Accra, Sekondi-Takoradi and Kumasi, as private contractors were not
held accountable for the poor quality of their work (Owusu and Kotey 2010, Devas and Korboe 2001).
As a result of the inadequate number of toilets, distance travelled, high user fees, heavy usage and poor
maintenance, people reverted to open defecation or flying toilets (Osumanu 2007).

124
Similar experiences have been reported in La Paz and El Alto, Bolivia (Laurie and Crespo 2007), where
privatisation of water and sanitation was hampered by lack of participation by the community, no
transparency in private concessionaire agreements, and higher costs to the community. In summary,
given that the ‘right to sanitation is fundamental, leaving the government agencies responsible for
supplying it might not necessarily have the envisaged results’ (Gold et al. 2013).
NGO/CBOs (bottom–up approach) adopt a participatory approach, which results in better planned,
constructed and maintained infrastructure. However, government support is needed for scaling-up.
The bottom-up approach (that is, partnerships with local CBOs and NGOs to improve sanitation) has
provided some important lessons and insights into provision of sanitation. One of the main reasons for
NGOs and CBOs to intervene in the provision of sanitation to slums stems from the understanding that
slum-dwellers’ sanitation needs have been unmet by government, which has resulted in a proliferation
of unsanitary practices and health problems, and hinders economic activity (Burra et al. 2003, Bapat et
al. 2003, McFarlane 2009). NGOs’/CBOs’ methodology or approach is bottom-up, whereby the
community and its members are partners in the creation and maintenance of the infrastructure.
An Indian NGO that has been working with slum- and pavement-dwellers since 1984, identified lack of
access to water and toilets as major concerns of slum-dwellers, which posed serious health risks.
Government-provided public toilets were overused and badly maintained, and the contractors/staff
responsible for maintenance were not held to account (Burra et al. 2003). Using the information on
community needs, the NGO constructed integrated community pour-flush baths and toilets in slums in
various Indian cities. Slum-dwellers contributed their time and effort, and women’s self-help groups
(SHGs), formed with the help of the NGO, were eventually entrusted with the management and
maintenance of the toilets. The user fee charged was nominal (Rs.10/month or 0.16 US cents/month),
and covered the entire family, as compared with the government public toilets, which charged one
rupee (0.02 US cents) per person, per use. The caretaker employed by the SHG for cleaning and
maintenance was provided with accommodation above the toilet block itself, as an added incentive to
perform his/her job, as finding accommodation in the city was difficult and expensive. Since the SHG
members were also users of the toilet block, they ensured maintenance by close monitoring.
By breaking the conventional cycle of contractor’s monopoly in construction, and by using low-cost
technology and community labour, the NGO proved that community toilets were not necessarily an
expensive proposition to implement (Burra et al. 2003). They also paid special attention to the
sanitation needs of children (building smaller toilets) and women by increasing the number of toilet
seats available to them. Certain design changes that were child-friendly, including locating the
children’s toilets within or next to the women’s section, encouraged mothers to bring their children to
the community toilets, where they could monitor them and not fear the children’s falling into the
toilets. In addition, the NGO also empowered the SHGs by providing them with the know-how in terms
of community-toilet construction, thereby facilitating transfer of knowledge between and among SHGs
in slums across the city. The success of the NGO’s community-designed, built and managed toilet blocks
led to the Mumbai Municipal Corporation’s (BMC) extending an invitation to the NGO to become of the
partners in the Slum Sanitation Program (SSP) (McFarlane 2009).
Another successful NGO intervention in sanitation is the Orangi Pilot Project-Research and Training
Institute (OPP-RTI) in Orangi and other informal settlements in Pakistan. OPP-RTI’s low-cost sanitation
programme supports communities in developing their own ‘internal’ sewerage development, which can
then be linked to ‘external’ development, ideally built by local government (Hasan 2006). After mapping
and survey of informal settlements, OPP-RTI uses the information gathered to finance, manage and

125
build internal sewerage development by organising the community and providing the necessary
training and support. OPP-RTI has demonstrated that, with technical and managerial support,
communities can build and finance the construction of sewers and drains within the community. OPP-
RTI’s success in mobilising the community to take care of its own sanitation needs has even prompted
local governments to support these efforts by building external sanitation and by in adopting the OPP-
RTI concept and methodology in their sanitation efforts (Hasan 2006).
Lumanti in Nepal is yet another NGO that started a toilet programme and sewerage project, in Lonhla
in 1986, and successfully replicated their model in 70 communities of the Kathmandu Valley (Weitz and
Franceys 2002). Although the NGO’s main focus was credit programmes for the poor, it partnered with
local communities and municipalities to lay communal sewer lines, drainage facilities, and connection
of private latrines to main sewers. Lumanti also promoted the use of public, communal and private-
toilet facilities through subsidy, and negotiated with municipal authorities to provide guarantees,
facilitated the provision of alternate sources for services, and raised community awareness regarding
effective use of resources. In addition, Lumanti provided the communities with the necessary
management skills and technical support (Weitz and Franceys 2002).
The success of NGO/CBO-driven community-sanitation programmes depends mainly on the ability and
willingness of the community to participate in and, in the long run, take charge of the maintenance of
the infrastructure created. The efficiency of the community-based approach depends on the efficiency
of the management team within the slum, since communities must be willing to take up responsibility
to operate and maintain the sanitation system; participatory planning and training of community
members are important facets of a bottom-up approach (Kifanyi et al. 2013). Maintenance of
infrastructure by the community is the most important aspect of community-led sanitation efforts,
which sets it apart from public toilets provided by government (McFarlane 2009, Khandaker and
Badrunnessa 2006, Weitz and Franceys 2002, Burra et al. 2003).
However, few studies point out the difficulties in the bottom-up approach. When NGOs are involved in
large, time-bound projects, participation by the community may be neglected. ‘The loudest voice will
be heard’ (McFarlane 2009). Tukhairwa and Oosterveer (2011) claim that the ‘spatial proximity’ of the
service provider to the residents determine whether the poor access these services or not. Larger
distances between the NGO offices and poor households discourage access of these households and,
since NGOs operate on a local and small scale, households far from the NGO’s offices may lack
information about the organisation’s services. In addition, ‘social proximity’ — bonding through social
networks and the implication of social relationships as a factor in the provision of and access to services
— also plays a crucial role in access. A high level of trust is needed to access the services of NGOs/CBOs,
and NGOs were perceived to have better technical skills and capacity than CBOs. Even those who didn’t
access sanitation services at all indicated that they believed NGOs offered better services. The higher
the level of co-operation with an NGO, the more an individual household is likely to access services by
the NGO (Tukhairwa and Oosterveer 2011, Chauhan and Lal 1999).
Replication or scaling-up of successful models is not always possible, as the same conditions may be
prevalent, as demonstrated in the OPP-RTI project (Hasan 2006). Although, the Indian NGO had
successfully implemented several community sanitation projects, it was unable to perform as
effectively as the two engineering firms who were co-contractors in the SSP in Mumbai. One of the
reasons provided by the author is that the NGO may have been stretched beyond its operating capacity
(McFarlane 2009).

126
Resident participation in slum-improvement projects is also linked to project satisfaction. In
participatory service provision, continued loyalty and participation are needed to maintain community
support to sustain quality over time (Russ and Takahashi 2013). In addition to community participation,
the support from the government is also critical to the success of NGO/CBO-driven-initiatives. Due to
the illegality of land tenure, in several cases, the sanitation infrastructure is demolished or the slum-
dwellers are evicted by the municipal or local government (Burra et al. 2003, Bapat and Agarwal 2003,
Winayanti and Lang 2004, McFarlane 2009). With adequate support or legal sanction from the
government, NGO/CBO efforts may have a better chance at success.
Public-private-community partnership has a higher chance of success, as it involves all key
stakeholders
As mentioned earlier in this section, there has been a recent paradigm shift towards public-private-
community partnerships in sanitation provision for the poor. This is a result of the realisation by the
government in a few cities of the importance of improved infrastructure for supporting diverse informal
economies that provide livelihoods to the poor (Weitz and Franceys 2002). There are an increasing
number of case studies (described below) that show the benefits of a tripartite partnership between
the government, the private or NGO provider and the community.
In Bangladesh, the Population Services and Training Center (PSTC), with funding from WaterAid,
initiated a water and sanitation (WatSan) programme in Aynal’s Bastee — a slum with 20‒25 hanging
toilets that were poorly maintained and posed serious risks to the users (Khandaker and Badrunnessa
2006). PSTC raised the community’s awareness on sanitation, trained resources persons and formed a
Community Management Committee (CMC) to lead the overall development and maintenance of the
neighbourhood. Two Sanitation Block Management Committees (SBMCs) were formed to manage day-
to-day operations of the two sanitation blocks that were constructed. The PSTC provided the technical
and managerial guidance to the committees, financed the construction with a three-year interest-free
loan and also negotiated with the Dhaka Water and Sanitation Authority (DWASA) to obtain land for
construction and water connection to the toilet block (Khandaker and Badrunnessa 2006).
The impact of this effort by PSTC was not only in improving the sanitation access of the community, but
also in empowering/mobilising them to voice their needs and place them before the authorities by
building a working relationship with the officials. Important lessons from this case study are: (i) ‘Low-
income residents are willing and able to pay for sanitation; (ii) Mediation by NGOs is an effective
strategy; (iii) Co-operation of government functionaries and elected representatives is vital; and (iv)
community ownership and management of infrastructure leads to sustainability’ (Khandaker and
Badrunnessa 2006).
Tiruchirappalli in Tamil Nadu, India, shows the way by demonstrating how effectively basic community
infrastructure and pro-poor solutions can work at city level when supported by city authorities and
NGOs, instead of leaving it to contractors to manage these complexes. The answer to why community
management of infrastructure is better than other forms of management, lies in recognising the value
in the process that goes beyond financial management to hygiene education, imbues a sense of
ownership of community assets, and provides a much-needed social space for community members to
come together and discuss various issues (Water Aid India 2008). This project shows that achieving
clean and healthy slums does not require huge financial investment; it requires a city authority sensitive
to the problems faced by slum communities and supportive of community and NGO action (Water Aid
India, 2008).

127
Sulabh International, a successful Indian NGO, has been providing nationwide sanitation services since
1970. Sulabh’s twin-pit-pour flush toilets are an example of innovative construction management that
reduces long-term maintenance costs and increases building quality. Built and maintained by Sulabh,
these toilets provide access to water, soap powder, bathing and locker facilities, for low-income and
poor communities. Caretakers are appointed by Sulabh for round-the-clock maintenance and a user fee
is charged. The poor, the homeless, disabled, the elderly and street children are allowed free use of the
toilet facilities. Sulabh’s success has been recognised by governments around the country, who have
come forward to collaborate by providing land, utilities, and capital for community toilets (Weitz and
Franceys 2002).
Shelter Associates, an NGO based in Pune, India, was engaged in a partnership with the municipal
corporation to construct community toilets in 13 informal slums in Pune. The project was initiated by
the then Municipal Commissioner, who had been a key official in an earlier sanitation drive, where he
was involved in the construction of around 100 toilets blocks by NGOs. After taking up office in Pune,
with his prior experience, the Commissioner prioritised sanitation and construction of toilets by calling
for proposals from local NGOs. The municipal corporation was responsible for providing the funds, land,
electricity, water supply and connection to municipal sewers, in addition to co-ordinating the overall
project. The NGO was responsible for the demolition of old toilets, and construction and maintenance
of the new toilet block for a period of 30 years. The NGO was ultimately responsible to the Corporation
for the implementation of the project. There were several firsts in this project. ‘Sanitation and other
issues related to the environment in low-income settlements had not previously been taken up by the
municipality on this scale … and the Corporation’s decision to work in partnership with NGOs on a
project of this scale was a new approach to urban development’ (Hobson, 2000). ‘This partnership also
stems from the Corporation’s recognition that the contractor built and Corporation maintained toilets
have failed (Hobson, 2000). By working with the NGOs, the Corporation was able to realise a lower cost
of construction than the contractors, and transfer responsibility for maintenance to the NGO or the
community/resident. This partnership augured well for the Corporation, as it was able to overcome its
incapacity in construction and maintenance of community toilet blocks. For the NGO, this partnership
presented an opportunity to improve the much-ignored area of sanitation for the slum-dwellers, as well
as involve members of the community in improving their own living conditions.
However, these partnerships have both pros and cons. Due to the pace at which the Corporation
wanted the construction to proceed, Shelter Associates was not able to engage the community in
extensive participation in design and implementation of the toilet blocks. Working with the government
was also a time-consuming endeavour, due to the bureaucratic delays in securing water and electricity
connections (Hobson 2000). Similar experiences were encountered in the SIP in Ahmedabad and
Bangladesh and the SSP in Mumbai (Lal and Chauhan 1999, McFarlane 2009).
Public-private-community partnerships will not be successful unless all the stakeholders involved fulfil
their roles. The government must provide an adequate legal framework, define a pro-poor policy that
aims to achieve universal coverage that includes serving the poor. It is increasingly accepted that,
beyond the physical infrastructure, social infrastructure is needed to sustain service system (Weitz and
Franceys 2002). Government involvement in sanitation projects in illegal or informal slums plays a
pivotal role, because it symbolises de facto security of tenure. In sanitation, unlike water and electricity,
tenure status is associated with a greater disparity in the level of service accessible to the poor (Scott
et al. 2013).

128
Communities are unwilling to invest in sanitation infrastructure without secure tenure, as they fear
demolition or eviction. However, they end up paying a substantial fee to service providers for removal
and disposal of sludge from septic tanks (Scott et al. 2013). Improvements in notified slums were
implemented much faster than in non-notified slums, and NGOs were more active in notified slums
(Chandrasekhar 2005, Kranti and Rao 2009), pointing to the fact that de facto or de jure tenure security
is an important factor in determining access to sanitation services. It is also true that those communities
that do not have tenure security have also managed to acquire basic services, but by bribing officials or
using political support. Nevertheless, the fear of eviction or demolition is a constant threat (Burra et al.
2003, Kranti and Rao 2009, Ghafur 2000). Therefore, greater involvement of the government in public-
private-community partnerships or PPPs offers some form of tenure security, which is sufficient for
NGOs, CBOs and households to invest in sanitation (Sohail and Cavill 2009). Government involvement
also reflects a change in the attitude of government agencies that could have a long-term impact on
successful provision of sanitation in informal and squatter settlements (Khandaker and Badrunnessa
2006; TARU-WEDC 2005; Kifanyi et al. 2013). Where community toilets are constructed and managed
by the community, governments could show their support by providing the toilet blocks with
free/subsidised water, and links to sewerage mains and electricity connections, which directly impacts
use and long-term sustainability of the toilet blocks (WaterAid 2008).
NGOs/CBOs play multiple roles in community-led sanitation programmes. A primary function
performed by the NGOs is in mobilising the community and understanding their needs. Poor
communities tend to trust NGOs over the government, as they believe NGOs provide the same service
to everyone in the community (Tukhairwa and Oosterveer2011). NGOs use a multi-pronged approach
that includes lending their expertise in technology, raising or arranging for capital by way of soft loans,
group loans or bank credit, building the capacity and management skills of community members to take
on the future needs of the community, and also imparting hygiene education targeting changes in
defecation habits (Hanchett et al. 2003, Chauhan and Lal 1999, Hasan 2006). In some cases, NGOs also
act as mediators between the community and the government, often using their public image to gain
audiences with senior bureaucrats in order to present the needs of the community, an important role
that has been recognised by both the government and local communities (Khandaker and Badrunnessa
2006, Burra et al. 2003, Weitz and Franceys 2002, Winyanti and Lang 2004).
The role played by community members as key participants in seeking basic services is unquestionable.
Without a pro-active community, one where the poor are able to organise themselves in order to
articulate to the government their demands, either directly or indirectly, through NGOs, sanitation
provisions will be inadequate (Khandaker and Badrunnessa 2006). The bottom-up approach followed
by NGOs and CBOs has been able to achieve a certain level of success in improving access only because
of encouragement from NGOs for poor households to participate in the creation and maintenance of
sanitation infrastructure (Burra et al. 2003). Examples of slum sanitation and SIPs, quoted earlier in this
section, from India, Bangladesh, Pakistan, Indonesia, Senegal, Zambia and Ghana (to name just a few)
have shown that poor communities are willing to pay (in cash or through contribution of labour) for
improvements in sanitation infrastructure. With adequate training and capacity building, slum-dwellers
are able to engage both in the actual construction of the toilets and their maintenance (either through
a CBO or by the formation of a sanitation committee) (Burra et al. 2003, WaterAid 2008). Disaggregation
of capital and operational costs helps slum-dwellers take care of smaller internal piping costs, but they
expect the government to provide the larger external connection to main sewers (Hasan 2006, Roma
and Jeffery, 2011). Notwithstanding, ‘Community efforts can be scaled up nationally only if there is a
clear progressive partnership approach, which involves households as co-actors and not as
beneficiaries’ (Gold 2013). Where the bottom-up approach has the support of the government, the

129
results have been encouraging (WaterAid 2008, Khandaker and Badrunnessa 2006, Kifanyi et al. 2013,
Ghafur 2000).
Integrate sanitation in the larger urban-planning framework: Sanitation is narrowly interpreted as
toilets. Access to drainage and sewers must be included.
‘Differences between the poorest and the richest residential areas clearly exist in any city, but upper-
class inner-city areas, industrial zones, slums and low-income housing estates often border one another
and are interconnected in many ways. What people do in one residential area may affect those in an
adjacent area and infrastructure like streets…water lines and sewerage channels visibly link different
parts of the city’ (Obrist et al. 2006).
The sanitation needs of a slum community must be placed within the larger urban-planning framework,
as slums are very much a part of the city and do not exist in isolation. The interconnectedness between
communities in cities leads to a spill-over of the ill effects of poor sanitation on the entire
neighbourhood (Obrist et al. 2006). The existing gaps in urban-planning approaches, as outlined in the
themes above, need to be bridged in order to alleviate the inhumane sanitation conditions in several
slums, and governments must find ways to leverage the strengths of community-led sanitation projects
by integrating them into the large city master-plans. In Orangi, Pakistan, the success of the community-
financed sanitation system was undermined when the government diverted households’ sewer
connections to a communal septic tank, instead of the natural watercourse. This prompted several
neighbourhoods to disconnect themselves and revert to the earlier practice of discharging sewerage
into the natural storm-water drain, since the septic tanks were not regularly de-sludged. As a solution
to this problem, the government proposed to superimpose the Greater Karachi Sewerage Plan on the
existing plan, by-passing the numerous community-led sewage systems installed in various parts of the
city (Weitz and Franceys 2002).
‘Sanitation provision happens under the radar of formal city planning and urban management, via
multiple formal or informal service providers. Policy and strategic planning for sanitation need to be…
integrated into wider city-development strategies’ (Scott et al. 2013). Instead of tackling the sanitation
problem in slums as a standalone problem, integrating the needs of the poor into the larger urban-
planning framework of a city will contribute towards achieving universal access to sanitation.
The integration of slum sanitation into city planning can take place only if there is an acknowledgement
of the right to sanitation of slum-dwellers by city authorities (Bapat and Agarwal 2003). In addition, a
pro-poor sanitation policy that explores low-cost sanitation options, de-links tenure security to provide
conditional access to sanitation, and invites community participation and an overarching political will,
are other steps towards fulfilling sanitation goals.

130
SUMMARY
The analysis of studies pertaining to sanitation revealed the low involvement of government in
sanitation provision in LMI countries. The top-down approach has failed, primarily due to the lack of
recognition of the right to sanitation of the urban poor who live in settlements that may not have
security of tenure. In addition, governments’ lack of financial resources, sensitivity in understanding the
sanitation needs of the poor, lack of community participation and ad hoc service provision are few other
contributing factors. Poor planning also increases the effort and time in using government-provided
sanitation services. As a result, infrastructure provided in the top-down approach falls into disuse due
to lack of maintenance.
Since NGOs and CBOs have now adopted a participatory approach, this might have resulted in the
better-planned, construction and maintenance of toilets. However, the bottom-up approach suffers
from problems of scaling-up. Replication of successful models may not always be possible, since the
same conditions may not be present in different locations. The bottom-up approach is also limited in
scope when there is no security of tenure.
The tripartite arrangement of public-private-community partnerships shows that, when community-
level, pro-poor solutions are supported by city authorities and local NGOs/CBOs, there is greater
ownership of the infrastructure, and legal hurdles can be addressed at a reasonable financial cost.
However, public-private-community partnerships will not be successful unless all the stakeholders
involved fulfil their roles. Governments must provide an adequate legal and policy framework to
achieve universal coverage; communities must be willing to participate and take ownership of the
improvements in sanitation infrastructure; and NGOs and CBOs must facilitate the transfer of
knowledge and technology, as well as broker a partnership between the community and the
government for the fulfilment of the sanitation needs of the urban poor.

131
Inadequate Sanitation
Ad-hoc provision by government.
Slum sanitation is a demand
driven approach. Only when there
is demand from slums,
government provides the
infrastructure (Burra et al., 2003,
Mc Farlane 2009,Joshi 2005,
Water Aid India 2008 )
Poor planning, design/
construction and implementation
of sanitation projects (Burra et al.,
2003, Mc Farlane 2009)
Government lacks finance to
undertake slum sanitation (Ghafur
2000, Kifanyi et. al., 2013, Burra
et al.2003)
Government unwilling to provide
access to slums as they are
considered illegal and/or
temporary (Scott.P et.al., 2013,
Chandrasekhar 2005, Kranti and
Rao 2009)
Private sector not successful as
they target middle income
households who can pay. and not
poor household (Weitz and
Franceys 2002, Sohail and Cavill
2009, Kifanyi et. Al., 2013, Owusu
and Kotey 2010, Devas and
Korboe 2001))
Poor understanding of
community needs. Lack of
community participation
Demand for government provided
sanitation is hindered by low education
levels, lack of awareness about rights.
Only those with political connections
make demands (Ghafur 2000, Mc
Farlane 2009)
Piece-meal approach. Poor
quality and inadequate
number of toilets per slum
population
Forced eviction a possibility.
Distance to toilets –
increases time and
effort
Lack of maintenance by
government. Poor
accountability from contractors.
(Burra e al. 2003)
Lack of ownership from the
community – no
maintenance (Burra et.al.,
2003, Joshi 2005,
Mc.Farlane 2009)
Poor access
Women and children affected
most (Joshi 2005, Bapat and
Agarwal 2003, Sohail.M. 2009,
Gessler et.al., 2008)
Safety, Privacy,
health and unhygenic
practices
Fig 4.8: Governments’ top-down approach lacks planning, focuses attention only on ad hoc creation of infrastructure (capital
costs) and pays little attention to design and maintenance (O&M cost).
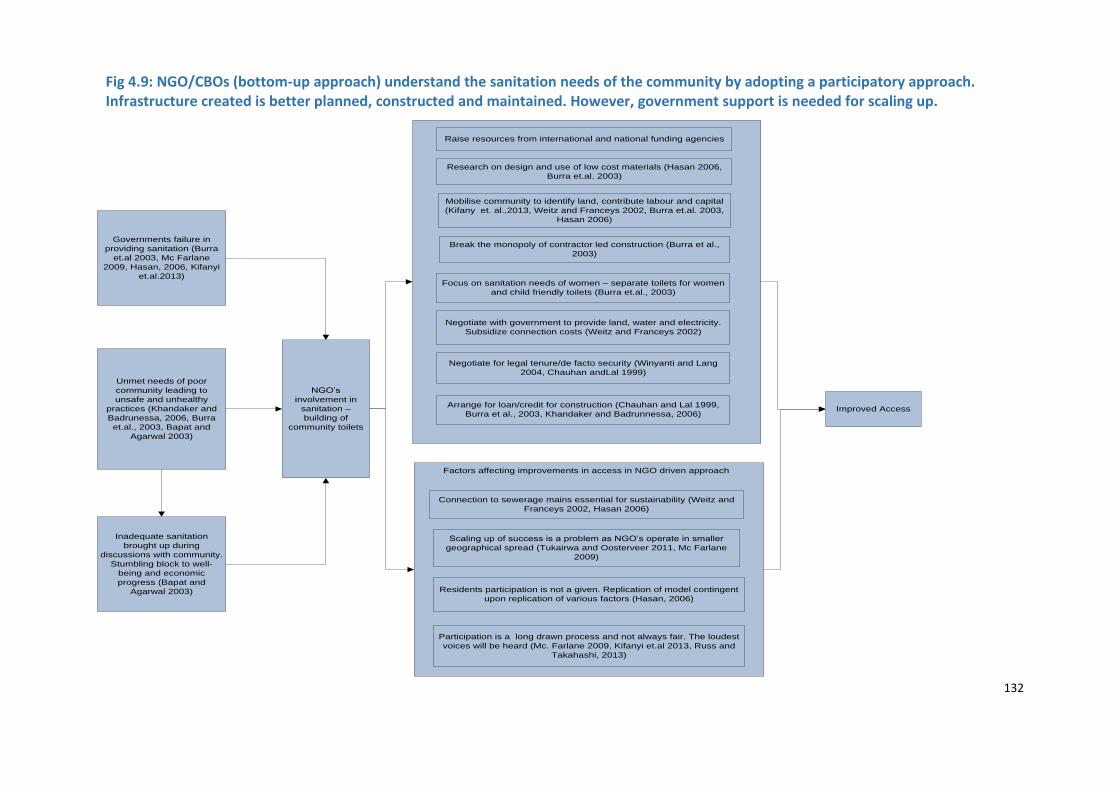
132
Governments failure in
providing sanitation (Burra
et.al 2003, Mc Farlane
2009, Hasan, 2006, Kifanyi
et.al.2013)
Unmet needs of poor
community leading to
unsafe and unhealthy
practices (Khandaker and
Badrunessa, 2006, Burra
et.al., 2003, Bapat and
Agarwal 2003)
Inadequate sanitation
brought up during
discussions with community.
Stumbling block to well-
being and economic
progress (Bapat and
Agarwal 2003)
NGO’s
involvement in
sanitation –
building of
community toilets
Raise resources from international and national funding agencies
Research on design and use of low cost materials (Hasan 2006,
Burra et.al. 2003)
Mobilise community to identify land, contribute labour and capital
(Kifany et. al.,2013, Weitz and Franceys 2002, Burra et.al. 2003,
Hasan 2006)
Break the monopoly of contractor led construction (Burra et al.,
2003)
Focus on sanitation needs of women – separate toilets for women
and child friendly toilets (Burra et.al., 2003)
Negotiate with government to provide land, water and electricity.
Subsidize connection costs (Weitz and Franceys 2002)
Negotiate for legal tenure/de facto security (Winyanti and Lang
2004, Chauhan andLal 1999)
Arrange for loan/credit for construction (Chauhan and Lal 1999,
Burra et al., 2003, Khandaker and Badrunnessa, 2006)Improved Access
Connection to sewerage mains essential for sustainability (Weitz and
Franceys 2002, Hasan 2006)
Scaling up of success is a problem as NGO’s operate in smaller
geographical spread (Tukairwa and Oosterveer 2011, Mc Farlane
2009)
Residents participation is not a given. Replication of model contingent
upon replication of various factors (Hasan, 2006)
Participation is a long drawn process and not always fair. The loudest
voices will be heard (Mc. Farlane 2009, Kifanyi et.al 2013, Russ and
Takahashi, 2013)
Factors affecting improvements in access in NGO driven approach
Fig 4.9: NGO/CBOs (bottom-up approach) understand the sanitation needs of the community by adopting a participatory approach. Infrastructure created is better planned, constructed and maintained. However, government support is needed for scaling up.

133
Governments realize their
failure in providing
sanitation, importance of
sanitation and need to
involve community/NGO
(Weitz and Franceys
2002, Hobson 2000, Mc
Farlane 2009)
ODA pressure on
government to adopt
participatory approach
(Ghafur 2000)
Public private
community
partnership
Community
(Khandaker and Badrunnessa 2006, Burra et al.,
2003, WaterAid 2008, Hasan 2006, Roma and
Jeffery 2011, Gold 2013, Ghafur 2000)
Ownership and maintenance of infrastructure
Willingness to pay for quality service and
readiness to invest in capital cost
Empowered to meet authorities and articulate
their demands
Build their own capabilities
Government
( Scott. P et.al., 2013, Sohail and Cavill 2009, Water
Aid 2008, Kranti and Rao 2009, Chandrasekar
2005, Hobson 2000, TARU-WEDC 2005)
Facilitate co-ordination between various
agencies for water, land, electricity
Government support builds confidence within
the community
Connection to city level sanitation networks
Calls for bids/proposal
Broad guidelines for construction and
execution of project
NGO
(Weitz and Franceys 2002, Khandakar and
Badrunnessa 2006, Water Aid 2008, Hobson 2000,
Lal and Chauhan 1999, Tukhairwa and Oosterveer
2011, Hatchett et al 2003 )
Works closely with community to understand
and identify needs
Form sanitation committee or CBOs
Provide management training and assistance
Seek community contribution i.e labour or
capital to increase involvement and ownership
Improved Access
NGO’s realizing
the need to work in
partnership with
the government to
overcome legal
and regulatory
barriers (Burra et
al., 2003, Hobson
2000)
Paradigm shift
Fig 4.10: Public-private-community partnership has higher chance of success, as it involves all key stakeholders.

134
Unmet sanitation needs of
the urban poor
Governments un-involved
due to lack of finance to
expand network coverage
in slums
Providing access linked to
tenure security –
governments constrained
to provide access
Unchecked growth of
slums
Interconnected between
slums and the rest of the
city. Interlinked
ecosystems.
Environmental damage
and pollution
Poltitical or citizen led
pressure – Ad-hoc
provision by government.
Lack of ownership, poor
maintenance and neglect.
Poor households, with the
help of NGOs and CBO’s
invest in community toilets
and other smaller pipeline
costs.
Towards improved slum
sanitation
Integrate slum sanitation in urban planning
Acknowledge right to sanitation of
slum dwellers
Conditional access – delink
sanitation from tenure security.
Integrate the efforts taken by slum
dwellers into the large sanitation
network
Use low cost technology options
Invite community participation
including financial contribution
Political will and pro-poor policy in
sanitation
Fig 4.11: Integrate slum sanitation in urban planning.

135
SUMMARY OF TEXTUAL NARRATION
The narrative synthesis of studies revealed several interlinkages between sector-specific issues and
urban-planning approaches. There are a few common barriers that need to be overcome, irrespective
of the type of approach adopted (top-down or bottom-up). One of these barriers was tenure security.
We observed that the slum households were deprived of access to water supply, sanitation and
electricity services wherever there had been lack of clarity on tenure security. Legally, this aspect comes
under the ambit of the government, and studies indicated that the government took steps to address
issues related to unclear land tenure, either on its own account or with driven and supported by ODA,
NGOs and CBOs. The political and administrative commitment to the cause of the urban poor has
emerged as a key element for improvement of access, be it in the form of 1) creating alternatives for
addressing the issue of tenure security; 2) connecting the sewerage network constructed by NGOs or
CBOs to the citywide sewerage network; 3) providing water connections to toilet blocks constructed by
NGOs or CBOs; 4) provision of financial resources for construction, and operation and maintenance of
infrastructure; or 5) involving NGOs or CBOs in the process of service delivery, and so on.
We observed few sector-specific issues that influence the roles of various actors in service delivery and
the potential for service improvements. The technological complexity associated with the electricity
sector results in a rather smaller role for NGOs and CBOs in the creation and maintenance of
infrastructure. Their role is focused more on the ‘soft’ side of infrastructure, such as educating the
customers about legal connections, improving understanding of customers’ requirements, and so on.
However, the water supply and sanitation sector has seen the involvement of NGOs and CBOs in the
‘hard’ side of infrastructure, such as installation of water tanks, construction of water and sewerage
networks, toilet blocks and septic tanks, and maintenance of infrastructure. This indicates the central
role to be played by the government in the improvement of electricity services and greater potential of
cooperation and involvement of NGOs and CBOs in the water supply and sanitation sector.
Finally, we observed that there is a need to draw on the strengths of both bottom-up and top-down
approaches for improving access to water supply, sanitation and electricity services. These strengths
can be drawn upon by exploring and focusing on cooperation and partnerships between slum-dwellers,
NGOs, CBOs and government. We observed that access to services had improved considerably
wherever these actors cooperated and partnered, as the top-down approach opens the door for
governmental legitimacy, resources and probity, while the non-governmental actors garner grassroots
involvement, community knowledge, education and awareness, and sustenance.

136
5: SUMMARY AND IMPLICATIONS
5.1 REVIEW QUESTION AND CONTEXT
The overall question guiding this review was:
‘What is the evidence on top-down and bottom-up approaches in improving access to water, sanitation,
and electricity services in low-income or informal settlements?’
The above question was further divided into three sub-questions:
1. How effective are the top-down and bottom-up approaches in improving access to water supply,
sanitation and electricity services in low-income or informal settlements in LMICs?
2. Under what circumstances do these approaches deliver better results? Why?
3. What are the strengths and limitations of these two approaches in respect of providing access to
basic services in low-income areas and informal settlements?
Several approaches have been used to deliver basic services to the urban poor. Broadly, these
approaches can be classified as top-down and bottom-up. This review synthesises the evidence on the
effectiveness of these two approaches to improve access to basic services. This review analysed access,
not just as connectivity to the services, but also in terms of its other dimensions, such as affordability,
effort and time, adequacy, durability and sustainability. However, connectivity was the most common
outcome analysed in most studies. Since the contexts of the studies were heterogeneous, we used
factors such as the type of slum, the details of the service provider, type of facility, and level of
community participation as moderators and context-specific factors in our analysis.
5.2 METHOD
‘Systematic reviews are a rigorous and transparent form of literature review. They involve identifying,
synthesising and assessing all available evidence, quantitative and/or qualitative, in order to generate
a robust empirically derived answer to a focused research question’ (ODI 2012). Details pertaining to
the methods used in the review are given below:
Study sources: Eight electronic databases, hand search of 13 journals for a 15-year period, 19 website
searches, Google and Google Scholar searches, personal communication with authors and cross-
references of identified studies
In-depth review: 104 studies that met the exclusion and inclusion criteria were included in the analysis.
All the studies included in the review were appraised for quality.
Synthesis method: Given the heterogeneity of the studies, multiple methods were used in the
synthesis: numerical summary, meta-analysis and textual narration.
Numerical summary: The type of delivery approach and the evidence on the impact of access
were detailed from all the studies included in the review. The pattern of assessments on
various outcomes (positive, negative, and so on) was used as the basis for drawing conclusions.

137
The evidence from all the 104 studies were used for the numerical summary. A total of 568
assessments from the 104 studies were used in the analysis.
Meta -analysis: Out of the 104 studies, 27 provided evidence that could be synthesised using
meta-analysis. These 27 studies yielded 100 observations in total. Depending on the
observations, they were synthesised either as odds-ratio (when the evidence was measured in
proportion) or standardised mean differences (when the evidence was available as mean with
standard deviation).
Textual narration: Useful in the identification of recurrent themes in the included studies,
narrative analysis helped us to understand the theory of change and the causal pathway.
Given the multiple modes used to synthesise the evidence, the review not only gives the results on
what approaches have worked, but, importantly, it also highlights why it has worked (the causal
pathway). The studies were not conducted in a controlled environment, but the evidence is however,
characterised by considerable heterogeneity.
5.3 RESULTS
Using the findings from the meta-analysis, numerical summary and the textual narration, the results
of the review are organised to address the three specific objectives set out for this review.
(i) How effective are the top-down and bottom-up approaches in improving access to water
supply, sanitation and electricity services in low-income or informal settlements in LMICs?
We answer this question from the findings of the numerical summary and meta-analysis. The
differences in the effectiveness of the two approaches have been analysed by sector, region and the
dimensions of access.
The top-down approach
Overall results indicate that the government-driven top-down approach has not been very effective in
the delivery of basic services to the urban poor. Both the explorative numerical summary and the meta-
analysis show consistent results in that aspect. The numerical summary had a higher proportion of
negative effects for the top-down approach, and the meta-analysis also indicated an overall effect size
of 0.63 (for connectivity), indicating the poor levels of access. However, it was seen that the
effectiveness of the top-down approach has been comparatively better in sectors that favoured a more
centralised or network approach. For example, the proportion of positive evidence was noticeably
higher in the electricity and water-supply sectors, as compared to the sanitation sector. The sanitation
sector, which largely involves construction of toilets with standalone septic tanks, had the highest scope
for developing decentralised facilities. It also had the highest proportion of negative evidence. The two
main reasons that stand out for this poor performance are: (a) governments have not been
acknowledging the right to sanitation of the poor and, consequently, the sector was not accorded
priority; and (b) the interventions demanded a more participatory approach, which could not be
accommodated in a traditional top-down framework.
The effectiveness of the top-down approach also varied considerably across regions. Among the three
major developing regions, Africa, Asia, and South America, the performance of the top-down approach

138
has been better in Asia and South America. Africa had the highest proportion of negative evidence
under the top-down approach. Meta-analysis results also confirm this trend. The effect sizes for Africa
are smaller than for the other two regions. These results indicate the weak capacity (possibly both
institutional and financial) of the governments in Africa to deliver basic services to the poor.
The bottom-up approach
Explorative numerical summary evidence shows that the proportion of positive evidence is higher than
the negative evidence when a bottom-up approach was used. Meta-analysis results also indicate an
overall effect size of 1.05 (for connectivity alone), indicating that deploying a bottom-up approach has
resulted in an improvement in access levels. However, the range of the confidence interval shows that
the improvement cannot be considered as statistically significant. Between the three sectors, the
proportion of evidence for electricity is the lowest for the bottom-up approach. This shows that the
deployment of a bottom-up approach has been predominant in the water-supply and sanitation
sectors. Between water supply and sanitation, the bottom-up approach has been more effective in
sanitation. We attribute this to the improvement in sanitation access involving a lot more than just
creating a physical facility; it involves behavioural and attitudinal changes among the slum-dwellers.
The bottom-up approach is able to include components that enable more involvement and ownership
in the project on the part of residents, which could explain the positive impact. Analysing the evidence
by region shows that the impact of the bottom-up approach has been the poorest in Africa, while the
impact was positive in Asia and South America. This suggests that the success of the bottom-up
approach also depends upon the social context. In the relatively difficult socio-economic environments
seen in several African urban areas, the bottom-up approach requires a lot of support from other actors,
such as the government, to deliver more positive results.
Dimensions of access: Top-down vs. bottom-up approaches
Traditionally, access is largely measured in terms of connectivity to facilities. However, the MDGs
demand a broader perspective on access. Therefore, we have expanded the traditional ‘connectivity
only’ notion of access and have considered the following dimensions of access: connectivity,
affordability, adequacy, effort and time, durability and sustainability. The number of assessments on
durability and sustainability are lower, indicating that the focus on these aspects has been very limited
in the various studies so far. Numerical summary of the evidence in the top-down approach shows that,
among the different dimensions of access, the proportion of positive assessments are higher only for
connectivity. However, for the bottom-up approach, the proportion of positive assessments is higher
for all dimensions, except for affordability. This shows that deployment of a bottom-up approach has
resulted in an all-round improvement of access, whereas the top-down approach has taken a more
narrow view of access. A possible reason for this is the way in which the achievements are measured.
In general, there is limited follow-up on project performance in the operational phase in top-down
approaches. The focus, therefore, tends to be limited to connectivity. However, in bottom-up
approaches, NGOs and CBOs are extensively involved, even during the operational phase of the project.
Therefore, the improvements could be seen across a broader set of parameters than just connectivity.
(ii) Under what circumstances do these approaches deliver better results? Why?
We specifically studied three major factors and their role in improving access to basic services in slums.
They are: (i) participation, (ii) tenure security and (iii) political commitment. The findings pertaining to
the interplay of these factors in both the top-down and bottom-up approaches are presented here:

139
Participation: Participation of community members in some form or other in the service-delivery
process resulted in a positive effect, as compared to instances where there has been no participation.
The number of assessments for participation in the numerical summary as well as meta-analysis
indicates that a bottom-up approach is more amenable in facilitating participation. Essentially,
community participation helps to incorporate the needs of the residents in the features of the project
by interacting closely with the slum residents. The NGOs and CBOs are able to understand the needs
and problems of the urban poor better and, consequently, tailor the services to suit their needs and
situational constraints. In the water and sanitation sectors, involvement of community members has
resulted in the use of appropriate design, construction, technology, and maintenance of the facility that
has significantly improved not only connectivity, but also other dimensions of access, such as adequacy
and effort and time. Specifically in the case of sanitation, involvement of the beneficiaries has led to
better maintenance of the toilets. A numerical summary of evidence shows that even the top-down
approach has produced a higher proportion of positive outcomes when there has been community
participation. For instance, we have examples in the electricity sector where the electricity utility has
adopted several innovative steps to reach out to community members, seek their feedback, and also
using community members as local agents to improve service delivery. These steps not only resulted in
an increase in the number of new connections in slums, but also reduced electricity theft and non-
payment of electricity bills. Therefore, in interventions where there has been participation, the impact
on access has been positive.
Tenure security: Tenure security emerges as yet another key factor in ensuring access to basic services.
Our results show that the proportion of positive evidence has been the highest for formal slums in both
top-down and bottom-up approaches, indicating that security of tenure plays an important role in
access to basic services in slums. The legal status of the slum determines the type of service provider
and the service-delivery approach. Formal slums, which are legally recognised and have security of
tenure, enjoy a higher degree of connectivity, whereas informal slums, which lack legal recognition,
have comparatively low levels of connectivity. This is because government agencies are often restricted
in extending coverage to informal slums, as these are considered to be illegal settlements with no
security of tenure. Even alternative service providers hesitate before investing in informal slums due to
the threat of possible demolition/eviction of slums, which, in turn, affects the willingness of service
providers and slum-dwellers to invest in infrastructure improvements. The meta-analysis shows that
there has been no significant difference in connectivity in informal slums in both top-down or bottom-
up approaches. However, the highest number of assessments for informal slums indicates a strong
research interest in informal slums.
In order to overcome the problems of tenure security, governments must accept their duty to provide
access to basic services in slums. There are several options to achieve this outcome, such as, (i)
removing land tenure as a prerequisite to seeking new connections; (ii) amending the legal framework
of government agencies to include informal settlements as target populations, or provide universal
access; and (iii) use NGOs and CBOs as a via media to service informal slums by engaging them in
decentralised service delivery. NGOs and CBOs can also play an important role in mobilising
communities and strengthening the demand side for basic services, thereby reiterating the
government’s duty in providing basic services to the poor.
Tenure security and participation, together, have a multiplier effect on connectivity in slums. The meta-
analysis results show that formal slums, where the residents have actively participated in the service-
delivery process, show significant improvement in access (effect size of 4.06). However, formal slums
without community participation also enjoy improved access, albeit not at the same level as formal
slums with participation.

140
Political commitment
The contextual factors such as the political context, government policy on slums, legal status of the
slum, and extent of community participation, play a crucial role in delivery of basic services to the urban
poor. Our results show that, when there is political commitment or a change in the government’s policy
to adopt a pro-poor approach in delivery of basic services to the urban poor, there has been a positive
impact on access in both the top-down and bottom-up approaches. This is mainly due to the removal
of legal hurdles such as tenure security, which obviates the need for slum-dwellers to provide proof of
residence to seek new connections. A commitment from the government in the form of universal
access, pro-poor policy reform or a specific scheme to improve access also provides a clear legal
mandate to the government service provider to extend coverage to poor consumers. It may also include
financial packages such as lowered connection fees that facilitate the poor’s seeking legal connections.
The change in political commitment may be a result of a combination of socio-political factors or, in
some cases, aid conditionality. Results have shown a pro-poor transformation in the government
service provider due to the following reasons (i) ODA conditionality, (ii) change in political leadership,
(iii) internal reform within the service-provisioning agency and/or (iv) pressure from civil society/urban-
poor communities for better access. One or a combination of these factors has a positive influence on
access in slums.
The setting-up of specialised agencies or cells that deal exclusively with the provision of basic services
in slums emerges as an enabling factor in improving access. Slums are a unique habitat that comes with
its own set of problems, resolution of which requires inter-agency co-ordination and innovation in
operations, which may not be possible within existing institutional frameworks. Specialised agencies or
offices located within the slums facilitate closer interaction between the community and the service
provider, which, in turn, has a positive impact on access.
(iii) What are the strengths and limitations of these two approaches in respect of providing
access to basic services in low-income areas and informal settlements?
The evidence from both the top-down and bottom-up approaches have been synthesised in this review.
The effectiveness of each of these approaches depends on the context. It is not the purpose of this
review to claim that one is better than the other, but to identify the strengths and limitations of both
these approaches and to understand the context within which these approaches deliver the best
results.
Top-down approach: strengths: Evidence suggest that the top-down approach works best when the
service-delivery process is characterised by a high degree of centralisation, such as in the electricity
sector. With the right policy and implementation agency in place, a top-down approach may lead to
quicker implementation of services. Initiatives implemented under the top-down approach also has the
possibilities of scaling up faster as inter-agency co-ordination, as well as requisite finances may be more
easily available to government agencies when compared to a decentralised bottom-up approach.
Bottom-up approach: strengths: Some elements in the bottom-up approach that contribute to
increased effectiveness in service delivery are: proximity of the alternative service provider to slum-
dwellers, sensitivity to community needs, flexible payment options, setting up of office within the
community, and consumer education and community empowerment through training. For instance, a
bottom-up approach in sanitation pays specific attention to the needs of women and children by
providing them with separate facilities that offer privacy and safety. As a result of community

141
participation, there is greater ownership of the facility by the community, which results in better
maintenance and durability of the infrastructure itself.
Top-down approach: limitations: One of the main criticisms of the top-down approach in terms of
service provision in slums is the lack of community involvement in planning and sensitivity towards the
specific needs of the community. In the top-down approach, there is very little room for customisation
to meet community needs. Evidence points to the fact that, although connectivity has been given
importance, other dimensions of access are grossly ignored. Government provisioning has also been ad
hoc, with programmes also implemented with a political agenda in mind. The primary reason for this
could be that slums and their legal status constitute a point of contention with several LMIC
governments. Service provision in slums are entangled in several legal problems that restrict
governments to provide them with basic services. While these constraints need to be overlooked in
light of the socio-economic and health costs of not having these services at all, government-led top-
down approaches are constrained by administrative constraints. Traditional top-down approaches also
suffer from the lack of beneficiary participation, which results in weak ownership and maintenance of
the infrastructure created. However, with increased commitment in the form of pro-poor policies and
some level of community involvement, government-driven top-down approaches can yield positive
results.
Bottom-up approach: limitations: A major limitation of the bottom-up approach is the restricted scope
for scaling up of operation. For example, the familiarity of most alternative service providers may be
restricted to the few slums in which they are active. While they may be effective in those specific slums,
they might not be able to achieve the same level of effectiveness in a different locality. Therefore,
scaling up of the programme in different geographical regions would be difficult. Apart from the above,
alternative service providers have the arduous task of interfacing with government authorities to seek
clearances and permission, which may lead to unwanted tension and delays. This, in turn, could delay
the provision of infrastructure and cause financial losses as well. One of the main elements of the
bottom-up approach is community participation. Mobilising the community to come forth with their
contribution or share ideas in a consultation can be a long, drawn-out process and can run into
community-level politics, which has the potential to derail the initiative. Projects that mandate
community participation are more likely to face delays in the initial stages than a top-down approach.
The limitations of both these approaches can be overcome when there is a synergy by adopting a
partnership approach where the government, community and the alternative service providers work
together to improve access in slums.
5.4 IMPLICATIONS
POLICY
Political commitment should be backed by appropriate institutional arrangements for top-down
approaches to work.
In the government-led top-down approach, improving access in slums requires strong political
commitment towards fulfilling the basic rights of slum-dwellers. However, our review shows that
political commitment alone will not be sufficient to improve access. Delivering services in slums
requires a networked approach and a deeper understanding of prevailing conditions, which may not be
satisfied by the existing institutional arrangements. Instances where specialised agencies have been
created exclusively to work with slums have shown improvements in access, because these agencies

142
act as the interface between the slums and the existing government machinery entrusted with the task
of supplying water, sanitation and electricity. ODA and other funding agencies that seek to generate
political commitment should also recommend the setting up of such dedicated organisations or
specialised cells with existing organisations for better implementation.
The bottom-up approach is more effective to achieve an all-round improvement in access.
Access to basic services should not be seen as merely providing connectivity to taps or toilets or
electricity. There are several instances where connectivity has been provided, but the facility falls into
disrepair or disuse in a short span of time, simply due to lack of attention to the other dimensions of
access. A holistic approach to access helps to realise the benefits of improvements in access in its
entirety. A bottom-up approach lends itself very well to this scenario. This is mainly because a bottom-
up approach has the necessary elements to achieve improvements in the overall levels of access due
to beneficiary participation, proximity of the service provider to the slum-dwellers, sensitivity to
community needs, flexible payment options, consumer education and community empowerment
through training. However, engagement of NGOs and CBOs in the service-delivery process should be
accompanied by clear goals on various dimensions of access.
As policy shifts from community to personal household facilities, the bottom-up approach will have
a greater relevance.
Community facilities have served to provide access to basic services in several slum and low-income
settlements across LMICs. But, increasingly the shortcomings of community connections — namely,
lack of ownership and poor maintenance — have led policymakers to prefer individual connections as
an option and individual connections need more involvement from the household, both in terms of
effort and investment. Enlisting the support of alternative service providers or adopting a bottom-up
approach can foster a sense of commitment through community interaction and behavioural change.
NGOs and CBOs can also provide the necessary technical and financial support in the form of loans to
obtain individual household-level connections.
Addressing tenure-security issues enables access in a big way.
It is evident from some of the studies in this review that tenure security need not always be de jure. De
facto tenure security is sometimes more than efficient to improve access in slums. De facto tenure
encourages alternative service providers and the community to undertake infrastructure
improvements without the fear of demolition. While eviction may still be a possibility, the chances of
demolition under the pretext of illegality are reduced. In some instances, conditional tenure security
has also been given to certain communities to facilitate access to basic services, which reflects the
political commitment towards fulfilling the basic needs of the urban poor. In the absence of tenure
security, illegal services thrive, especially in the electricity and water sectors. However, sanitation
remains neglected as construction of a toilet requires a large capital investment, which slum-dwellers
are not willing to undertake at the risk of demolition or eviction.
Programmes that aim to improve basic services should incorporate components of inclusivity right
from the project-conception stage.
Inclusivity and community participation are practices that need to be built into the project right from
the conception stage, in order to: (i) identify community needs and priorities; (ii) understand existing
resources and constraints; (iii) mobilise community support; and (iv) enhance project life by
maintenance, as well as upkeep of the infrastructure, all of which are important for successful service

143
delivery in slums. The strengths and limitations of each of the stakeholders involved must be studied
and understood at the stage of drafting the project document, so that there is clarity of responsibility
for each of the actors. Avenues for community members to participate and contribute their ideas at
various stages of the project must be institutionalised. Similarly, a grievance-redressal system would
also be beneficial to solicit feedback for mid-course corrections.
PRACTICE
Focusing on maintenance is the key to sustainability of the infrastructure created: Adequate attention
must be paid to the maintenance of infrastructure. Although this is applicable more for sanitation than
for water and electricity, leaking pipes and faulty meters also lead to disuse over a period of time. Just
as planning for a project is important, maintenance is critical for the durability of the facilities created,
which prolong the access to these services for the community.
Creation of special units for implementation within the slum can help build trust within the
community and provide better customer service: Creation of special units for implementation within
the slum, or setting up a local office within the slum, can help build trust within the community and
provide better customer service. Availability of officials or agents within the slum not only encourages
community members to demand better responses, but also helps the service provider monitor the
community’s usage.
Consumer-education programmes targeting behavioural change can benefit both the community and
the service provider: Several studies in the electricity and sanitation sectors indicate the effectiveness
of consumer-education programmes in reducing consumption, electricity theft, more efficient usage,
adoption of healthy practices and reduced dependency on informal/illegal service providers. Although
more evidence relates to the electricity than to the sanitation sector, there is overall merit in enhancing
the community’s knowledge through outreach.
RESEARCH AND SCOPE FOR FUTURE WORK
Region-specific studies to reduce heterogeneity would be desirable for understanding country-specific
factors that influence or hinder access. There may be differences in the capacity of all stakeholders
involved, which would be brought out by such studies and would affect the way the service is delivered
and accessed. One such region is Africa, where the capacity of the government and the socio-economic
context of several African countries varies widely from that of other LMICs. In addition, enlarging the
scope of the study by including (non-English) studies in other languages may offer insights into specific
socio-cultural factors, as well as providing evidence from researchers who are comfortable writing in
their regional languages.
Studies included in this review are primarily observational in nature. Use of experimental approaches
in controlled environments would help in furthering our understanding of the causal pathway between
intervention and outcomes. For example, we can understand how involvement of alternative service
providers helps to improve community participation and how community participation leads to better
outcomes.
The results of systematic reviews reflect the quality of studies available in a particular domain, as they
provide the evidence base for synthesising the results. Therefore, the research design of selected
studies must be of rigorous and of good quality. For example, systematic reviews in the health sector
are rigorous only because of the quality of studies selected for review. Similarly, there is a need for

144
rigorous research design in the infrastructure sector, which can provide more accurate and convincing
results.
The type of community participation in service delivery in urban slums needs further investigation.
While we have identified different forms of community participation, we could not study the
differences in detail in this review, because of a lack of clear categorisation of the type of community
participation in the studies. Future studies could distinguish between the different forms of community
participation.
The grouping of alternative service providers includes different actors, with different motives and
capabilities. In this review, we have grouped together all providers other than government as
alternative providers. However, there is a need to differentiate between NGOs, CBOs and local private
operators, as the motivations of each of these providers to improve access vary. For example, NGOs
may adopt a philanthropic approach in service delivery, whereas the private sector may be motivated
by profits. Therefore, there is a need to undertake research on the differences between the different
agents who constitute ‘alternative service providers’, so that policymakers can draw on the strengths
of each of them while designing a bottom-up service delivery mechanism.
5.5 STRENGTHS AND LIMITATIONS OF THIS SYSTEMATIC REVIEW
STRENGTHS OF THE REVIEW
This is one of the first systematic reviews to synthesise evidence on access to basic services to the urban
poor in low-income countries. While there are other studies that have looked at access in low-income
communities, this is perhaps the first systematic review to look at which of the urban-planning
approaches is best suited to delivering basic services to the urban poor. This study also looks at
participation of the community in the urban-planning approach and its impact on access.
This synthesis captures multiple dimensions of access and not just connectivity. As the findings from
the analysis point out, providing the infrastructure is only one aspect of improving access. Service
providers must ensure that the service delivered satisfies other dimensions of access, such as adequacy,
affordability, effort and time, durability and sustainability, in order to have a meaningful impact on the
lives of the urban poor.
A rigorous methodology was used to select the studies that would be included in the review. Since this
review was based on only the evidence that met the inclusion criteria, it is felt that the validity of the
findings is also strong. More importantly, multiple modes of synthesis have been used. Not only were
the findings from these different modes consistent, but they also complemented each other, thereby
increasing the robustness of the results, while providing a more holistic perspective on the evidence.

145
LIMITATIONS OF THE REVIEW
Heterogeneity is one of the main limitations of this review. Studies included in the review have used
diverse methods and differ in their contexts. Studies have used different methods, such as case studies,
statistical and qualitative analysis, and have varied sample sizes. Synthesising results from several
studies across different sectors and regions, using different methodologies, gives rise to an array of
results. To be able to address the heterogeneity, we have conducted various sub-analysis in meta-
analysis, where only appropriate variables that can be grouped together were grouped for the analysis.
To be able to address heterogeneity, we have also included a fairly large number of studies as the
evidence base.
Only English-language studies were included in the review. There is a possibility that appropriate studies
could exist in languages other than English, which we have not been able to include in the evidence
base.
The greatest evidence was found in Asia as the majority of the studies focused on slums in Asian cities.
Therefore, evidence from other low-income countries have not been amply represented, which further
limits the findings of this systematic review.

146
6. REFERENCES
6.1 STUDIES INCLUDED IN THE REVIEW
1. Adubofour, K., Obiri-Danso, K., Quansah, C. (2013). Sanitation survey of two urban slum Muslim communities in the Kumasi metropolis, Ghana. Environment and Urbanization 25 (1): 189‒207.
2. Adam, A. (2013). Perceptions of slum-dwellers and municipal officials on factors impacting the
provision of basic slum services in Accra, Ghana. International Institute of Policy Studies, Netherlands: 1-81.
3. Ahmad, S., Choi, M., Ko, J. (2013). Quantitative and qualitative demand for slum and non-slum
housing in Delhi: Empirical evidence from household data. Habitat International 38: 90‒99.
4. Ahmed, N. & Sohail, M. (2003). ‘Alternate water supply arrangements in peri-urban localities: Awami (people’s) tanks in Orangi township, Karachi.’ Environment and Urbanization 15 (2): 33‒42.
5. Almansi, F. (2009). Regularizing land tenure within upgrading programmes in Argentina: The cases of Promeba and Rosario Hábitat. Environment and Urbanization 21 (2): 389‒413.
6. Aguilar, M. & De Fuentes, A. (2007). Barriers to achieving the water and sanitation-related Millennium Development Goals in Cancún, Mexico, at the beginning of the twenty-first century. Environment and Urbanization 19 (1): 243‒260.
7. Amis, P. & Kumar, S. (2000). Urban economic growth, infrastructure and poverty in India: Lessons from Visakhapatnam. Environment and Urbanization 12 (1): 185‒196.
8. Asian Development Bank (ADB) (2007). Delivering piped water on a small scale: Results of ADB’s water-supply service market survey in Manila.
9. Bakker, K., Kooy, M., Shofiani, N., Martijn, E. (2008). Governance failure: Rethinking the institutional dimensions of urban water supply to poor households. World Development 36 (10): 1,891.
10. Bakker, K. (2007). Trickle Down? Private sector participation and the pro-poor water supply debate in Jakarta, Indonesia. Geoforum 38 (5): 855‒868.
11. Bapat, M. & Agarwal, I. (2003). Our needs, our priorities: Women and men from the slums in Mumbai and Pune talk about their needs for water and sanitation. Environment and Urbanization 15 (2): 71‒86.
12. Baruah, B. (2010). Energy services for the urban poor: NGO participation in slum electrification in India, Environment and Planning C. Government and Policy (28): 1,011‒1,027.
13. Barja, G. & Urquiola, M. (2001). Capitalization, regulation, and the poor: Access to basic services in Bolivia. Discussion Paper 2001/34. United Nations University, World Institute for Development Economics Research, Helsink
14. Birkenholtz, T. (2010). Full-cost recovery: producing differentiated water collection practices and responses to centralized water networks in Jaipur, India. Environment & Planning A 42 (9): 2,238‒2,253.

147
15. Bravo, G., Kozulj, R., Landaveri, R. (2008). Energy access in urban and peri-urban Buenos Aires. Energy for Sustainable Development 12 (4): 56‒72.
16. Burra, S., Patel, S., Kerr, T. (2003). Community-designed, built and managed toilet blocks in Indian cities. Environment and Urbanization 15 (2): 11‒32.
17. Burra, S. (2001). Slum sanitation in Pune: A case study. Society for Promotion of Area Resource Centers (SPARC), UCL London: 1‒14.
18. Cavill, S. & Sohail, M. (2004). Strengthening accountability for urban services. Environment and Urbanization 16 (1): 155‒170.
19. Clarke, G. & Wallsten, S. (2002). Universal(ly Bad) service: Providing infrastructure services to rural and poor urban consumers’ World Bank Policy Research Working Paper, No.2868, World Bank Washington, D.C.
20. Chowdhury, J. & Nurul Amin, A. (2006). Environmental assessment in slum improvement programs: Some evidence from a study on infrastructure projects in two Dhaka slums. Environmental Impact Assessment Review (26): 530–552.
21. Chandrasekhar, S. (2005). Growth of slums, availability of infrastructure and demographic outcomes in slums: Evidence from India. Paper to be presented during the session on urbanization in developing countries at the population association of America, 2005, Annual Meeting, Philadelphia, US.
22. Chauhan, U. & Lal, N. (1999). Public-private partnerships for urban poor in Ahmedabad: A slum project. Economic and Political Weekly 34 (10/11): 636‒642.
23. Chung, M. & Hill, D. (2002). Urban informal settlements in Vanuatu: Challenge for equitable development. Pacific Islands Forum Secretariat and UN Economic and Social Commission for Asia and the Pacific, Pacific Operation Centre
24. Connors, G. (2005). When utilities muddle through: Pro-poor governance in Bangalore’s public water sector. Environment and Urbanization 17 (1): 201‒218.
25. Das, A. (2012). End of project evaluation of Madhya Pradesh urban services for the poor programme (MPUSP). End of Project Evaluation Report, Contract Number: 5977, Department for International Development, Government of UK: 1‒81.
26. Das, K. (2009). Agency and access under decentralized governance: Water supply and sanitation in Kolkata city. Gujarat Institute of Development Research (GIDR). Working Paper No. 191, Ahmadabad, India
27. Das, M. (2011). End-term impact assessment of the Kolkata urban services for the poor programme. Department for International Development (DFID), India: 1‒75.
28. Daniere, A. & Takahashi, L. (1999). Poverty and access: Differences and commonalties across slum communities in Bangkok. Habitat International. 23 (2): 271‒288.
29. Devas, N. & Korboe, D. (2000). ‘City governance and poverty: The case of Kumasi.’ Environment and Urbanization. 12 (1): 123‒136.
30. Dube, I. (2003). Impact of energy subsidies on energy consumption and supply in Zimbabwe. Do the urban poor really benefit? Energy Policy 31 (15): 1,635‒1,645.

148
31. Edelman, B. & Mitra, A. (2006). Slum dwellers’ access to basic amenities: The role of political contact, its determinants and adverse effects. Review of Urban & Regional Development Studies.18 (1): 25‒40.
32. Field, E. (2004). Property rights, community public goods, and household time allocation in urban
squatter communities: Evidence from Peru. William & Mary Law Review 837, 45 (3): 1‒52.
33. Field, E. (2005). Property rights and investment in urban slums. Journal of the European Economic Association April–May, 3 (2–3): 279–290.
34. Foster, V. & Araujo, C. (2004). ‘Does infrastructure reform work for the poor? A case study from Guatemala. World Bank Policy Research Working Paper, No. 3185, World Bank
35. Galiani, S., Gertler, P., Cooper, R., Martinez, S., Ross, A., Undurraga, R. (2013). Shelter from the storm: Upgrading housing infrastructure in Latin American slums 3ie, Grantee Final Report
36. Gadir, A., Njiru, C., Smith, M. (2006). Small water enterprises in Africa, Sudan: A study of small water enterprises in Khartoum. Water, Engineering development centre, Loughborough University
37. Gerlach, E. & Franceys, R. (2010). Regulating water services for all in developing economies. World Development. 38 (9): 1,229.
38. Gerlach, E. & Franceys, R. (2009). Regulating water services for the poor: The case of Amman. Geoforum. 40 (3): 431-441.
39. Gessler, M., Brighu, U., Franceys, R. (2008). The challenge of economic regulation of water and sanitation in urban India. Habitat International 32 (1): 49‒57.
40. Ghafur, S. (2000). Entitlement to patronage: Social construction of household claims on slum Improvement project, Bangladesh. Habitat International 24 (3): 261‒278.
41. Gold, J. & Namupolo, M. (2013). Sanitation issues in Namibia. Namibia housing action group CLIP, Team Research Report
42. Goli, S., Arokiasamy, P., Chattopadhayay, A. (2011). Living and health conditions of selected cities in India: Setting priorities for the National Urban Health Mission. Cities. 28 (5): 461‒469.
43. Global Network on Energy for Sustainable Development (GNESD) (2008). Energy access in urban slums: A case of KhonKaen Asian Institute of Technology, Thailand: 1‒37.
44. Gulyani, S., Talukdar, D., Mukami, K. (2005). Universal (Non)service? Water markets, household demand and the poor in urban Kenya. Urban Studies 42 (8): 1,247‒1,274.
45. Hailu, D., Osorio, R., Tsukada, R. (2012). Privatization and renationalization: What went wrong in Bolivia's water sector? World Development. 40 (12): 2,564.
46. Hanchett, S., Akhter, S., Khan, M., Mezulianik, S., Blagbrough, V. (2003). Water, sanitation and hygiene in Bangladeshi slums: An evaluation of the WaterAid - Bangladesh urban programme. Environment and Urbanization 15 (2): 43‒56.
47. Hasan, A. (2006). Orangi Pilot Project: The expansion of work beyond Orangi and the mapping of informal settlements and infrastructure. Environment and Urbanization 18 (2): 451‒480.

149
48. Hardoy, A. & Schusterman, R. (2000). New models for the privatization of water and sanitation for the urban poor. Environment and Urbanization 12 (2): 63‒76.
49. Hossain, S. (2012). The production of space in the negotiation of water and electricity supply in a bosti of Dhaka. Habitat International 36 (1): 68‒77.
50. Hobson, J. (2000). Sustainable sanitation: experiences in Pune with a municipal-NGO-community partnership. Environment and Urbanization 12 (2): 53‒62.
51. Ioris, A. (2012). ‘The geography of multiple scarcities: Urban development and water problems in Lima, Peru. Geoforum 43 (3): 612‒622.
52. Islam, S. & Khan, U. (2013). Access to urban basic services and determinants of satisfaction: A comparison by non-slum and slum dwellers in Dhaka City. Institute of Governance Studies, BRAC University, IGS Working Paper Series No.10/2013
53. Issaka, K. (2007). Environmental concerns of poor households in low-income cities: The case of the Tamale Metropolis, Ghana. GeoJournal 68 (4): 343‒355.
54. Israel, D. (2007). Impact of increased access and price on household water use in urban Bolivia. The Journal of Environment Development 16 (58): 58‒83.
55. Joshi, D., Morgan, J., Fawcett, B. (2005). Sanitation for the urban poor: Whose choice, theirs or ours?: 1‒202.
56. Kayaga, S. & Franceys, R. (2008). Water service regulation for the urban poor: Zambia. Water Management, WM2 (161): 65‒71.
57. Kayaga, S. & Franceys, R. (2007). Costs of urban utility water connections: Excessive burden to the poor. Utilities Policy 15 (4): 270‒277.
58. Kayaga, S. & Kadimba-Mwanamwambwa, C. (2006). Bridging Zambia’s water service gap: NGO/Community partnerships. Proceedings of the ICE - Water Management 159 (3): 155–160.
59. Kebede, B., Bekele, A., Kedir, E. (2002). Can the urban poor afford modern energy? The case of Ethiopia. Energy Policy 30 (11–12): 1,029‒1,045.
60. Khandaker, H. & Badrunnessa, G. (2006). The Value of Environmental Sanitation – Case studies Bangladesh in CBO management of slum neighbourhood sanitation services: the Aynal’s Bastee case, Dhaka, Bangladesh. IRC International Water and Sanitation Centre: pages 79‒87.
61. Kifanyi, G., Shayo, B., Ndambuki, J. (2013). Performance of community-based organizations in managing sustainable urban water supply and sanitation projects. International Journal of Physical Science 8 (30): 1,558‒1,569.
62. Kolkata Metropolitan Development Authority (2012). Basic service for the urban poor: An impact evaluation study of BSUP program intervention in Kolkata Metropolitan Area (KMA). Socio-Economic Planning Unit, KMDA
63. Kranthi, N. & Rao, D. (2009). Security of tenure and its link to the urban basic services in slums: A case of Hyderabad. The IUP Journal of Infrastructure VII (3 & 4): 103‒113.
64. Laurie, N. & Crespo, C. (2007). Deconstructing the best case scenario: Lessons from water politics in La Paz–El Alto, Bolivia. Geoforum 38 (5): 841‒854.

150
65. Massoud, M., Maroun, R., Abdelnabi, H., Jamali, I. & El-Fadel, M. (2013). Public perception and economic implications of bottled-water consumption in underprivileged urban areas. Environmental Monitoring and Assessment 185 (4): 3,093‒3,102.
66. Manzetti, l. & Rufin, C. (2006). Private utility supply in a hostile environment: The experience of water, sanitation and electricity distribution utilities in Northern Colombia, the Dominican Republic and Ecuador. Sustainable Development Department Best Practices Series, Inter-American Development Bank Washington, D.C.
67. Mahadevia, D. (2010). Shelter security and urban social protection — findings and policy implications in India. Accessed in October 2015 http://www.chronicpoverty.org/uploads/publication_files/mahadevia_social_protection_india.pdf
68. McFarlane, C. (2008). Sanitation in Mumbai's informal settlements: State, slum and infrastructure. Environment & Planning A 40 (1): 88‒107.
69. MdAdbul, B., MdMustak, A., Tofail Md Alamgir, A. (2012). Health status and its implications for the livelihoods of slum dwellers in Dhaka city. Shiree working paper, No. 11: 1‒40.
70. Mimmi, L. & Ecer, S. (2010). An econometric study of illegal electricity connections in the urban favelas of Belo Horizonte, Brazil. Energy Policy 38 (9): 5,081‒5,097.
71. Moulik, T., Singh, N., Mallick, M., Datta, S. (1999). Energy provision for the urban poor. Environmental resources management India, New Delhi. Department for International Development (DFID), London, UK.
72. Mustafa, D. & Reeder, P. (2009). People is all that is left to privatize: Water-supply privatization, globalization and social justice in Belize City, Belize. International Journal of Urban and Regional Research 33 (3): 789‒808.
73. Obrist, B., Cisse, G., Koné, B., Dongo, K., Granado, S., Tanner, M. (2006). Interconnected slums: Water, sanitation and sealth in Abidjan, Côte d'Ivoire. European Journal of Development Research 18 (2): 319‒336.
74. Omole, K. (2010). An assessment of housing conditions and socio-economic lifestyles of slum dwellers in Akure, Nigeria. Contemporary Management Research 6 (4): 273‒290.
75. Owusu, G. & Afutu-Kotey, L. (2010). Poor urban communities and municipal interface in Ghana: A case study of Accra and Sekondi-Takoradi Metropolis. African Studies Quarterly 12 (1): 1‒16.
76. Parikh, P., Chaturvedi, S., George, G. (2012). Empowering change: The effects of energy provision on individual aspirations in slum communities. Energy Policy 50: 477‒485.
77. Rana Md, M. (2011). Urbanization and sustainability: Challenges and strategies for sustainable urban development in Bangladesh. Environment, Development and Sustainability 13 (1): 237‒256.
78. Reddy, B., Balachandra, P., Nathan, H. (2009). Universalization of access to modern energy services in Indian households — economic and policy analysis. Energy Policy 37 (11): 4,645‒4,657.
79. Roma, E. & Jeffrey, P. (2011). ‘Using a diagnostic tool to evaluate the longevity of urban community sanitation systems: A case study from Indonesia.’ Environment, Development and Sustainability. 13 (4): 807‒820.

151
80. Russ, L. & Takahashi, L. (2013). Exploring the influence of participation on programme satisfaction: Lessons from the Ahmedabad slum networking project. Urban Studies. 50 (4): 691‒708.
81. Sankar, S. (2005). Study of the world bank-financed slum sanitation projects in Mumbai. Volume I: SSP I Review, Water and Sanitation Programme (WSP) and The World Bank: 1‒293.
82. Sekhar, S., Nair, M., Reddy, V. (2005). Are they being served? Citizen report card on public services for the poor in peri-urban areas of Bangalore. Published by the Association for Promoting Social Action (APSA) and Public Affairs Centre (PAC): 1‒71.
83. Scott, P., Cotton, A., Sohail, K (2013). Tenure security and household investment decisions for urban sanitation: The case of Dakar, Senegal. Habitat International 40: 58‒64.
84. Scott, N., McKemey, K., Batchelor, S. (2005). Energy in low-income urban communities, barriers to access to modern energy in slums. Final technical report, Contract Number R8146: 1‒161.
85. Shrestha, R., Kumar, S., Martin, S., Dhakal, A. (2008). Modern energy use by the urban poor in Thailand: A study of slum households in two cities. Energy for Sustainable Development XII (4): 5‒13.
86. Smith, L. & Hanson, S. (2003). Access to water for the urban poor in Cape Town: Where equity meets cost recovery. Urban Studies 40 (8): 1,517‒1,548.
87. Snyder, R., Jaimes, G., Riley, L., Faerstein, E., Corburn, J. (2013). A comparison of social and spatial determinants of health between formal and informal settlements in a large metropolitan setting in Brazil. Journal of Urban Health 91 (3): 1‒14.
88. Subbaraman, R., Shitole, S., Shitole, T., Sawant, K., Brien, O., Bloom, E., Patil-Deshmukh, A. (2013). The social ecology of water in a Mumbai slum: Failures in water quality, quantity, and reliability. BMC Public Health 13 (173): 1‒14.
89. Subbaraman, R., Brien, O., Shitole, T., Shitole, S., Sawant, K., Bloom, D., Patil-Deshmukh, A. (2012). Off the map: the health and social implications of being a non-notified slum in India. Environment and Urbanization 24 (2): 643‒663.
90. Sohail, M. & Cavill, S. (2009). Public-private partnerships in the water and sanitation sector. Water Management: Proceedings of the Institution of Civil Engineers. 163 (WM4): 261‒267.
91. Sohail, M. (2007). Accountability arrangements to combat corruption in the delivery of infrastructure service in Bangladesh. Institute of Development Policy Analysis and Advocacy (IDPAA). Water, Engineering development centre, Loughborough University, UK
92. Sohail, M. & Surjadi, C. (2003). Public-private partnership and the poor, drinking water concessions: A study for better understanding of public-private partnership and water provision in low-income settlements. WEDC, Loughborough University, UK
93. Stanwix, B. (2009). Urban slums in Gujarat and Rajasthan: A Study of Basic Infrastructure in Seven Cities. Mahila Housing SEWA Trust, Ahmedabad, India
94. Takeuchi, A., Cropper, M., Bento, A. (2006). The welfare effects of slum improvement programs: The case of Mumbai. World Bank Policy Research Working Paper 3852: 1‒39.
95. Tukahirwa, J., Mol, A., Oosterveer, P. (2011). Access of urban poor to NGO/CBO-supplied sanitation and solid-waste services in Uganda: The role of social proximity. Habitat International 35 (4): 582‒591.

152
96. USAID (2004) Innovative approaches to slum electrification. Bureau for Economic Growth.
Agriculture and Trade U.S Agency for International Development, Washington, D.C. 20523:
97. UN-HABITAT (2006) UN-HABITAT report on poverty mapping: A Situation analysis of poverty zones in Jabalpur. HS/855/06E: 1‒35.
98. Wagah, G., Onyango, M., Kibwage, K. (2010). Accessibility of water services in Kisumu municipality, Kenya. Journal of Geography and Regional Planning 3 (4): 114‒125.
99. WaterAid India (2008) Tiruchirappalli shows the way: Community-Municipal Corporation-NGO Partnership for City-wide Pro-poor Slums Infrastructure Improvement: 1‒38.
100. Weitz, A. & Franceys, R. (2002). Beyond boundaries: Extending services to the urban poor. Asian Development Bank
101. Winayanti, L. & Lang, H. (2004). Provision of urban services in an informal settlement: A case study of Kampung Penas Tanggul, Jakarta. Habitat International 28 (1): 41‒65.
102. Xabendlini, M. (2010). An examination of policy implementation of water and sanitation services in the city of Cape Town: A case study of the Informal settlements in the Khayelitsha area. Economic and Management Sciences University of the Western Cape School of Government
103. Zaki, S. & Nurul, A. (2009). Does basic services privatisation benefit the urban poor? Some evidence from water-supply privatisation in Thailand. Urban Studies 46 (11): 2,301‒2,327.
104. Zanuzdana, A., Khan, M., Kraemer, A. (2013). Housing satisfaction related to health and importance of services in urban slums: Evidence from Dhaka, Bangladesh. Social Indicators Research 112 (1): 163‒185.

153
6.2 REFERENCES FOR WORKS CITED IN THE REVIEW (OTHER THAN THE
INCLUDED STUDIES)
Baker, J. (2008). Urban poverty: A global view. Urban Papers. Washington, D.C.: World Bank.
Baker, J. & Lall, S. (2003). A profile of urban poverty in Latin America. Unpublished Paper. Washington, D.C.: World Bank.
Barnett-Page, E. & Thomas, J. (2009). Methods for the synthesis of qualitative research: A critical review. BMC Medical Research Methodology 9 (59): 1‒11.
Begg, C. & Mazumdar, M. (1994). Operating characteristics of a rank correlation test for publication bias. Biometrics 50: 1,088‒1,101.
Belsky, E., DuBroff, N., McCue, D., Harris, C., McCartney, S., Molinsky, J. (2013). Advancing inclusive and sustainable urban development: Correcting planning failures and connecting communities to capital. Joint Center for Housing Studies of Harvard University.
Borenstein, M., Hedges, L., Higgins, J., Rothstein, H. (2011). Introduction to meta-analysis. London: John Wiley & Sons.
CGG (2010). Development of Basic Services for Urban Poor (BSUP) fund in urban local bodies. Hyderabad: Center for Good Governance.
Cities Alliance (2006). Cities alliance for cities without slums: Action plan for moving slum upgrading to scale. Washington D.C.: World Bank.
Combs, J., Ketchen, J., Crook, T., Roth, P. (2011). Assessing cumulative evidence within macro research: Why meta-analysis should be preferred over vote counting. Journal of Management Studies 48 (1): 178-197.
Dangour, A., Watson, L., Cumming, O., Boisson, S., Che, Y., Velleman, Y., Cavill, S., Allen, E., Uauy, R. (2013). Interventions to improve water quality and supply, sanitation and hygiene practices, and their effects on the nutritional status of children. Cochrane Database Systematic Review, 8.
UNFPA (2007). State of world population 2007: Unleashing the potential of urban growth. New York: United Nations Population Fund Agency.
Dawson, P. (1994). Organisational change: A processual approach. London: Paul Chapman Publishing
DFID. (2012). Water, Sanitation and Hygiene Portfolio Review. UKAid Department for International Development. Downloaded from: https://www.gov.uk/government/uploads/system/uploads/attachment_data/file/214187/DFID_20WASH_20Portfolio_20Review.pdf
DFAT (2014). Water, sanitation and hygiene. Department of Foreign Affairs and Trade, Australia. Downloaded from http://aid.dfat.gov.au/aidissues/watersanitation/Pages/default.aspx on 30 July 2014.
Dixon-Woods, M., Agarwal, S., Young, B., Jones, D., Sutton, A. (2004). Integrative approaches to qualitative and quantitative evidence. NHS Health Development Agency. Paper available at www.hda.nhs.uk.
Donna, F., Berlin, J., Morton, S., Olkin, I., Williamson, G., Rennie, D. (2000). Meta-analysis of observational studies in epidemiology. JAMA 283 (15): 2,009‒2,012.
154
Egger, M., Davey-Smith, G., Altman, D. (2000). Systematic reviews in health care: Meta-analysis in context. London: John Wiley & Sons
Egger, M., Davey-Smith, G., Schneider, M., Minder, C. (1997). Bias in meta-analysis detected by a simple graphical test. British Medical Journal 315: 629–634.
Euwi and Share (2012). S-scale finance for water and sanitation. EU Water Initiative Finance Working Group and Sanitation and Hygiene Applied Research for Equity. Discussion Paper. http://www.gwp.org/Global/About%20GWP/Publications/EUWI/EUWI%20FWG%20Small%20Scale%20Financing%20Final.pdf
Fewtrell, L., Kaufmann, R., Kay, D., Enanoria, W., Haller, L. Colford, J. (2005). Water, sanitation, and hygiene interventions to reduce diarrhoea in less-developed countries: A systematic review and meta-analysis. The Lancet Infectious Diseases 5 (1): 42‒52.
Flavin, C. & Aeck, H. (2006). Energy for Development: The potential role for renewable energy in meeting Millennium Development Goals. Washington, D.C.: Worldwatch Institute.
Global Urban Observatory (2003). Guide to Monitoring Target 11: Improving the lives of 100 million slum dwellers. UN-HABITAT. Nairobi, Kenya: United Nations Human Settlements Programme
Habitat, U. N. (2013). State of the World's Cities 2012/2013: Prosperity of Cities. London: Routledge.
Ha, P. & Porcaro, J. (2005). Energy and the Millennium Development Goals: The impact of rural energy services on development. Journal of International Affairs 58: 193‒209.
Heilig, G. (2012). World urbanization prospects (2011 revision). United Nations, Department of Economic and Social Affairs (DESA). Population Division, Population Estimates and Projections Section. New York.
Hutton, G. & Haller, L. (2004). Evaluation of the costs and benefits of water and sanitation improvements at the global level. Water, Sanitation, and Health, Protection of the Human Environment. Geneva: World Health Organization.
Haidich, A. (2010). Meta-analysis in medical research. Hippokratia 14, (Suppl. 1): 29–37.
Higgins, J., Thompson, S., Deeks, J., Altman, D. (2003). Measuring inconsistency in meta-analyses. British Medical Journal 327 (7,414): 557‒560.
Katakura, Y. & Bakalian, A. (1998). PROSANEAR: People, Poverty and Pipes: A program of community participation and low-cost technology bringing water and sanitation to Brazil's urban poor. Water and Sanitation Program, World Bank. Washington D.C.
Light, R. & Smith, P. (1971). Accumulating evidence: Procedures for resolving contradictions among different research studies. Harvard Educational Review 41 (4): 429‒471.
Lucas, P., Arai, L., Baird, C., Roberts, H. (2007). Worked examples of alternative methods for the synthesis of qualitative and quantitative research in systematic reviews. BMC Medical Research Methodology 7 (4): 1‒7.
Morton, S., Adams, J., Suttorp, M. (2004). Meta-regression Approaches: What, Why, When, and How? Rockville MD: Agency for Healthcare Research and Quality (US). Technical Reviews No. 8.
Nelson, L. & Dowling, P. (1998). Electricity industry reform: A case analysis in Australia. Journal of Organisational Change Management 1 1(6): 481‒495.
155
OECD (2013). Financing water and sanitation in developing countries: The contribution of external aid. Downloaded from http://www.oecd.org/dac/stats/Brochure_water_2013.pdf
http://stats.oecd.org/qwids/ accessed on 15th July, 2014
OECD (2013). Financing water and sanitation in developing countries: The contribution of external aid. Downloaded from http://www.oecd.org/dac/stats/Brochure_water_2013.pdf
Pettigrew, A. (1987). Context and action in the transformation of the firm. Journal of Management Studies 24 (6): 649‒670.
Prüss, A., Kay, D., Fewtrell, L., Bartram, J. (2002). Estimating the burden of disease from water, sanitation, and hygiene at a global level. Environmental health perspectives 110 (5): 537‒542. Downloaded from http://www.who.int/quantifying_ehimpacts/global/en/ArticleEHP052002.pdf on 23rd July, 2014.
Ringquist, E. (2013). Meta-analysis for public management and policy. Chichester: John Wiley & Son
Ravallion, M., Shaohua, C., Sangraula, P. (2007). New Evidence on the Urbanization of Global Poverty. Policy Research Paper No. 4199. Washington D.C.: World Bank.
Rosenthal, R. (1991). Meta-analytic procedures for social research (3rd ed.): Newbury Park, CA.
Rothstein, H., Sutton, A., Borenstein, M. (Eds.) (2006). Publication bias in meta-analysis: Prevention, assessment and adjustments. London: John Wiley & Sons.
Sterne, J., Gavaghan, D., Egger, M. (2000). Publication and related bias in meta-analysis: Power of statistical tests and prevalence in the literature. Journal of Clinical Epidemiology 53: 1,119–1,129.
Sharp, S. (1998). Meta-analysis regression. Stata Technical Bulletin 42: 16–22. Reprinted in Stata Technical Bulletin Reprints vol. 7: 148–155. College Station, TX: Stata Press.
SWA (2014). Developing Countries: 2014 Progress Updates, Sanitation and Water for All.
Downloaded from:
http://sanitationandwaterforall.org/commitments/country-commitments?year_update=2014&creation_year=2012&lang=en (accessed 23 July 2014).
Thomas, J and Harden, A (2008). Methods for the systematic synthesis of qualitative research in systematic reviews. BMC Medical Research Methodology 8 (45): 1‒10.
United Nations (2013) The Millennium Development Goals Report. New York: UN.
UN-Habitat (2002) Expert Group Meeting on Urban indicators held in Nairobi, November 2002. Report available at: http://www.unhabitat.org/programmes/guo/documents/EGM_final report 4 Dec 02.pdf)
UN-Habitat (2003) Water and sanitation in the world’s cities: Local action for global goals. London: UN.
UNICEF (2012) Pneumonia and diarrhoea: Tackling the deadliest diseases for the world's poorest children. New York: UNICEF.
Downloaded from: http://www.childinfo.org/files/Pneumonia_Diarrhoea_2012.pdf.
WaterAid (2014) Making health a right for all: Universal health coverage and water, sanitation and hygiene. Downloaded from http://www.wateraid.org/~/media/Publications/AfGH-WaterAid_UHC-WASH-Paper_june14.pdf

156
WaterAid (2011) Off-track, off-target: Why investment in water, sanitation and hygiene is not reaching those who need it most. http://www.wateraid.org/~/media/Publications/off-track-off-target-report-wateraid-america.ashx
Winpenny, J and Camdessus, M (2003) Financing water for all: report of the World Panel on Financing Water Infrastructure. Global Water Partnership, World Water Council, World Water Forum.
Downloaded from:
http://www.worldwatercouncil.org/fileadmin/world_water_council/documents_old/Library/Publications_and_reports/CamdessusReport.pdf on 30th July 2014.
World Bank (2014) Water supply and sanitation: Sector results profile. Downloaded from http://www.worldbank.org/en/results/2013/04/12/water-sanitation-results-profile (Accessed 23 July 2014).
WSP (2009) Global experiences on expanding services to the poor. Accompanying Volume to the Guidance Notes on Improving Water Supply and Sanitation Services for the Urban Poor in India Water and Sanitation Program. March. Washington D.C.: World Bank.
157
APPENDIX 1: REPORT AUTHORSHIP
Authorship of this report
Thillai Rajan Annamalai (Indian Institute of Technology Madras, India)
Ganesh Devkar (CEPT University, Ahmedabad, India)
Ashwin Mahalingam (Indian Institute of Technology Madras, India)
Solomon Benjamin (Indian Institute of Technology Madras, India)
Sudhir Chella Rajan (Indian Institute of Technology Madras, India)
Akash Deep (Harvard Kennedy School, Harvard University, US)
Research Team
Elayaraja M.S.
Keerthana Sundar
Sriharini Narayanan
Paul Jebaraj
Venkata Santosh Kumar
Policy Advisory Board
Shri. Vikram Kapur, Commissioner, Corporation of Chennai
Shri. Raj Cherubal, CEO, CitiConnect
Shri. S. Prakash, COO, IL&FS Water
Academic Advisory Board
Prof. Dinesh Mehta, CEPT University, Ahmedabad
Prof. Meera Mehta, CEPT University, Ahmedabad
Prof. Manvita Baradi, CEPT University, Ahmedabad
Funding-agency policy experts
Abhijit Ray and Francis Rathinam, DFID
Corresponding author:
Thillai Rajan Annamalai Associate Professor Department of Management Studies Indian Institute of Technology Madras Chennai 600 036. India Email: [email protected] Telephone: +91 94449 26442 Fax: +91 44 2257 4552

158
APPENDIX 2: METHODS USED IN THE REVIEW
APPENDIX 2.1: STUDY IDENTIFICATION
Table A2.1: List of journals taken for hand search
S. No Hand-searched journals Publisher Hits
1 Geoforum Elsevier 1,413
2 Environment & Planning (A, B, D) Pion 2,826
3 Urban Studies Sage publication 2,144
4 World Development Elsevier 2,024
5 Environmental &Urbanization (inc. their Asia edition) Sage publication 515
6 International Journal of Urban and Regional Research (IJURR) Wiley-Blackwell 1,226
7 Review of Urban & Regional Development Wiley-Blackwell 201
8 Cities Elsevier 886
9 Progress in Planning Elsevier 138
10 Energy Policy Elsevier 6,143
11 Habitat International Elsevier 779
12 Utility Policy Elsevier 322
13 Water Policy Elsevier 165
Total 18,782

159
Table A2.2 Details of electronic-database search
S.NO Database Search phrase Subjects Fields search Hits
1 Wiley Online Library (slum*) AND (water OR sanitation OR electricity) • Business, Economics, Finance & Accounting • Social & Behavioural Science
Abstract 91
2 ProQuest (slum*) AND (water OR sanitation OR electricity) • All covered in the database All fields 1,974
3 Science Direct (slum*) AND (water OR sanitation OR electricity) • Arts and Humanities • Economics, Econometrics and Finance • Social Sciences
Abstract 31
4 Emerald (slum*) AND (water OR sanitation OR electricity) • All covered in the database All fields 370
5 EBSCO (slum*) AND (water OR sanitation OR electricity) EBSCO host Research Database
All covered in the database
Business source complete
Abstract 33
6 Springer Link (slum*) AND (water OR sanitation OR electricity) • Social Sciences • Economics • Energy • Business & Management
All fields 361
7 SSRN (slums) AND (water OR sanitation OR electricity) • All covered in the database All fields 5
8 JStor (slums) AND (water OR sanitation OR electricity) • Economics • Urban Studies
Full-text 363

160
Table A2.3: Details of websites searched
S. No. Website Search phrase used Subjects/Research publications Relevant studies
Hits obtained
Results
1 Inter-American Development Bank (IADB)
(www.iadb.org)
(slums) AND (water OR sanitation OR electricity)
• Subjects
• Water & Sanitation
• Urban Development
• Private Sector & Partnership
• Energy
2 71
2 City Alliance
(www.citiesalliance.org)
(slums) AND (water OR sanitation OR electricity)
• All covered in the database Nil 357 None of the studies relevant for our inclusion criteria
3 UN-Habitat
(www.unhabitat.org)
(slums) AND (water OR sanitation OR electricity)
• Subjects
• Urban Development and Management
• Water Sanitation and Infrastructure
• Urban Economy and Financing Shelter
• Social Inclusion
1 143
4 World Bank
(www.worldbank.org)
(slums) AND (water OR sanitation OR electricity)
• All covered in the database 1 14
5 United Nations Development Programme (UNDP)
(www.in.undp.org)
(slums) AND (water OR sanitation OR electricity)
• All covered in the database Nil 189 No relevant studies are identified

161
S. No. Website Search phrase used Subjects/Research publications Relevant studies
Hits obtained
Results
6 Asian Development Bank (ADB)
(www.adb.org)
(slums) AND (water OR sanitation OR electricity)
• Subjects
• Water
• Urban Development
• ADB Funds and Products
• ADB Administrative & Governance
• Governance and Public Sector Management
• Data and Research
• ADB Economic working paper series
• ADB Regional economic integration
working papers
• Asian Development Review
• e-Quarterly Research Bulletin
1 45
7 AusAID
(www.aid.dfat.gov.au)
(slums) AND (water OR sanitation OR electricity)
• All covered in the database Nil 28 No relevant studies could be identified
8 Department of International Development (DFID)
(www.gov.uk)
(slums) AND (water OR sanitation OR electricity)
• All covered in the database 2 39 No relevant studies could be identified
9 EPPI
(www.eppi.ioe.ac.uk/cms/)
(slums) AND (water OR sanitation OR electricity)
• All covered in the database Nil 6 No relevant studies could be identified

162
S. No. Website Search phrase used Subjects/Research publications Relevant studies
Hits obtained
Results
10 International Initiative for Impact Evaluation (3ie)
(www.3ieimpact.org)
(slums) AND (water OR sanitation OR electricity)
• Publications
• 3ie Impact Evaluation Reports
• 3ie Systematic Review Series
• 3ie Replication Paper Series
• 3ie Working Paper Series
3 27
11 Cochrane Systematic Review
(www.cochrane.org)
(slums) AND (water OR sanitation OR electricity)
• All covered in the database Nil 6 No relevant studies could be identified
12 Campbell Systematic Review
(www.campbellcollaboration.org)
(slums) AND (water OR sanitation OR electricity)
• All covered in the database Nil Nil No relevant studies could be identified
13 Research for Development (R4D)
(http://r4d.dfid.gov.uk)
(slums) AND (water OR electricity OR sanitation)
• Advanced search
• Search for R4D site, and
• Search other sites
9 1,340
14 WaterAid
(http://www.wateraid.org)
(slums) AND (water OR electricity OR sanitation)
• All WaterAid publications
2 74 Search of the website generated 100 hits, but finally obtained 74 documents
15 Energy Sector Management Assistance Program (ESMAP)
(https://www.esmap.org)
(slums) AND (water OR electricity OR sanitation)
• All ESMAP publications
Nil 806 No relevant studies could be identified

163
S. No. Website Search phrase used Subjects/Research publications Relevant studies
Hits obtained
Results
16 Global Network on Energy for Sustainable Development (GNESD)
(http://www.gnesd.org)
(slums) AND (water OR electricity OR sanitation)
• Publications
• Urban peri-urban
• Energy security
• Energy Access
• Other GNESD Publication
• Advanced search
Nil 28 No relevant studies could be identified
17 Practical Action
(http://practicalaction.org)
(slums) AND (water OR electricity OR sanitation)
• Advance search
• Publications
• Energy access
• Water & Sanitation solution
Nil 393 No relevant studies could be identified
18 Community-Led Infrastructure Finance Facility (CLIFF)
(https://www.gov.uk/international-development-funding/community-led-infrastructure-finance-facility)
(slums) AND (water OR electricity OR sanitation)
Also searched with DFID main website Nil Nil No relevant studies could be identified
19 Slum Upgrading Facility (SUF)
(http://ww2.unhabitat.org/suf)
(slums) AND (water OR electricity OR sanitation)
Also searched on UN-HABITAT main website
Nil Nil No relevant studies could be identified

164
Table A2.4: Details of Google and Google Scholar search
Search Limits
Searches using Google and Google Scholar cover under all subjects and published and unpublished
materials using the search term of (slums) AND (water OR sanitation OR electricity). In Google and
Google Scholar, the search generated a large number of results. In Google, using the above search
phrases in the advanced search feature generated 4,160,000 results. When the search was limited
by the following: year (1999-2013), language (English) and file type (Adobe Acrobat PDF), it
generated 562,000 hits, but it finally displayed only 28 pages with 274 hits. In this same way, we also
searched in Google Scholar, whereby the search generated 81,300 hits, which, when limited by year,
language and file type, resulted in 27,600 hits, but it finally displayed 98 pages with 972 hits.
Data sources Search phrase used Relevant
studies
Hits obtained Search Limits
Google (slums) AND (water OR sanitation OR electricity)
2 274 English and 1999‒2013, PDF
Google Scholar
(slums) AND (water OR sanitation OR electricity)
12 972 1999‒2013, relevance only
Total 14 1,246

165
APPENDIX 2.2 QUALITY-APPRAISAL TOOL
Study code:
Authors:
Year of publication:
Journal:
Title of the Study:
Source:
Description Score Rating category Given
rating
Given
score
1 CONCEPTUAL FRAMING
a) Does the study acknowledge existing research and theory?
3 Elaborate (high)
2 Simple or partial (medium)
1 Author’s own idea and articulation of need.
(low)
0 Not clearly acknowledged (can’t tell)
b) Does the study construct a conceptual framework?
3 Strongly Agree (high)
2 Agree (Medium)
1 Disagree (Low)
0 Not clearly mentioned (can’t tell)
c) Does the study pose a research question or outline a hypothesis?
3 Clearly outlined (high)
2 Partially outlined (medium)
1 Unclear (low)
0 Not outlined (can’t tell)
2
TRANSPARENCY
a) Have the data sources been clearly mentioned?
3 Strongly Agree (high)
2 Agree (medium)
1 Disagree (low)
0 Not clearly mentioned (can’t tell)
3 Strongly agree (high)
2 Agree (medium)

166
Description Score Rating category Given
rating
Given
score
b) Does the study present or link to the raw data it analyses?
1 Disagree (low)
0 Could not be identified (can’t tell)
c) Does the study declare sources of support/funding? Is there a potential conflict of interests (funding bias)?
3 Clearly declared and no conflict of interests
(high)
2 Clearly declared; conflict of interests
(medium)
1 Not clearly declared (low)
0 No information provided (can’t tell)
3
APPROPRIATENESS
a) Does the study identify a research design?
3 Clearly outlined (high)
2 Partially outline (medium)
1 Unclear (low)
0 Not outlined (can’t tell)
b) Does the study identify a research method?
3 Clearly outlined (high)
2 Partially outline (medium)
1 Unclear (low)
0 Not outlined (can’t tell)
c) Does the study justify the chosen design and method as well suited to the research question?
3 Clearly outlined (high)
2 Partially outlined (medium)
1 Unclear (low)
0 Not outlined (can’t tell)
4
CULTURAL SENSITIVITY
a) Does the study explicitly consider any context-specific cultural factors that may bias/affect the analysis/findings?
3 Clearly mentioned (high)
2 Partially mentioned (medium)
1 Unclear (low)
0 Not mentioned (can’t tell)
5 VALIDITY
a) To what extent does the study demonstrate measurement validity?
3 Appropriate (high)
2 Partially appropriate (medium)
1 Unclear (low)
0 Not outlined (can’t tell)
b) To what extent is the causal conclusion arrived at in the study valid?
3 Strong evidence reported (high)
2 Partial evidence reported (medium)
1 Low evidence reported (low)
0 No evidence/conclusions by the author (can’t
tell)

167
Description Score Rating category Given
rating
Given
score
c) To what extent can the results of the study be generalised to cover other situations?
3 Yes, can be generalised (high)
2 Yes, to some extent (medium)
1 No, cannot be generalised (low)
0 Unclear (can’t tell)
d) To what extent are the findings of the study biased by the research activity?
3 No bias (high)
2 Partial bias (medium)
1 Strong bias (low)
0 Unclear (can’t tell)
6 SAMPLE
a) Has the sample design and target selection of cases been explained and justified clearly? (sampling bias)
3 Very clear and satisfactory (high)
2 Clear, but needs further explanation (medium)
1 Unclear (low)
0 Not mentioned (can’t tell)
7 RELIABILITY
a) To what extent are the measures used in the study stable?
3 Very stable (high)
2 Partially stable (medium)
1 Unstable (low)
0 Can’t judge (can’t tell)
b) To what extent are the measures used in the study internally reliable?
3 Very reliable (high)
2 Somewhat reliable (medium)
1 Unreliable (low)
0 Can’t judge (can’t tell)
c) To what extent are the findings likely to be sensitive/changeable, depending on the analytical technique used?
3 Not sensitive (high)
2 Sensitive (medium)
1 Very sensitive (low)
0 Can’t assess (can’t tell)
Description Score Rating category Given
rating
Given
score
8 ANALYSIS
a) Have the approach and formulation to analysis been clearly conveyed?
3 Very clear (high)
2 Clear, but require further explanation
(medium)
1 Unclear (low)

168
0 Not mentioned (can’t tell)
b) Have the depth and complexity of data been clearly captured?
3 Very clear (high)
2 Clear, but require further explanation(medium)
1 Unclear (low)
0 Not mentioned (can’t tell)
9 COGENCY
a) Does the author ‘signpost’ the reader throughout?
3 Very clear (high)
2 Clear, but inconsistent (medium)
1 Unclear (low)
0 Not mentioned (can’t tell)
b) To what extent does the author consider the study’s limitations and/or alternative interpretations of the analysis? (reporting bias)
3 Explicitly stated (high)
2 Implicit (medium)
1 Unclear (low)
0 Not mentioned (can’t tell)
c) Are the conclusions clearly based on the results of the study?
3 Explicitly stated (high)
2 Implicit (medium)
1 Unclear (low)
0 Not mentioned (can’t tell)
10 AUDITABILITY
a) Has the research process been clearly documented? (reporting bias)
3 Very clear (high)
2 Clear, but with omissions (medium)
1 Unclear (low)
0 Not mentioned (can’t tell)
Overall quality assessment of the study: HIGH/MEDIUM/LOW
The rating criteria are as follows: Total score >60 = high-quality; >35 = medium-quality and; ≤ 35= low
quality
Total
Score

169
APPENDIX 2.3: CHARACTERISATION OF STUDIES INCLUDED IN THE REVIEW
R 1 / A21
I. Study Details
Authors Adubofour, K, Obiri-Danso, K and Quansah, C
Year 2013
Title Sanitation survey of two urban Muslim slum communities in the Kumasi
metropolis, Ghana
Journal Environment and Urbanization
Source Electronic database
II. Study coverage
Basic service Water and sanitation
Country Ghana
Cities Asawase (Kumasi)
III. Context and intervention
Type of settlement/slum Informal settlement
Nature of agencies
involved in planning and
service provision
Water: others
Private provision of water supply
Sanitation: user involvement
Self-construction of shared, on-plot latrines
Self-construction of toilets
Sanitation: government
Public toilet for the community
Form of user
participation
Sanitation
User involvement: participation through self-mobilisation
Project /intervention
funding agency
Water: state government/central government
Sanitation: private sector/state government

170
IV. Research design
Aim of the study This paper presents the findings of a field study conducted to ascertain
the extent of improved water and sanitation coverage in two densely
populated urban slums, Aboabo and Asawase, in the Asawase
constituency of Kumasi, Ghana.
Type of study Quantitative
Research design Observational
Methodology used for
data analysis
Quantitative
V. Data and sample
Data sources Primary data
A field survey was conducted in two urban slums in the Asawase
constituency of Kumasi, Ghana
Data period 27 January to 17 April 2009
VI. Results and evidence
Evidence on outcomes Water
Connectivity: moderately negative
Proportion of households connected to private, in-house, piped water supply
Effort and time: moderately positive
Time spent at water source (waiting)
Sanitation
Connectivity: moderately positive
Proportion of households with shared on-plot latrines
Connectivity (user involvement/government): Moderately negative
Proportion of households with unshared on-plot latrines
Proportion of households having private toilet facility
Proportion of households accessing public toilet facility
Effort and time (government): Moderately negative
Estimated distance to public toilet (meters)
Summary of results The two communities of Aboabo and Asawase have been adequately catered for in the provision of improved water

171
coverage (pipe-borne water and protected wells), although not to a level that is convenient and easily affordable.
Although most households use pipe-borne water for drinking and other domestic chores, the number of private connections to the metropolitan water-supply network is very low.
As a result, most households purchase pipe-borne water from neighbouring homes at considerably higher unit prices.
Few of the households have private toilet facilities, and most of those are shared between two or more households. The only provision available to 58% of the population is the few heavily patronised public toilets, which are poorly maintained.
Brief theory of change Due to the extensive water-supply network, women and children in the two communities must only cover relatively short distances to access water sources. However, in order to provide adequate water provision to the study communities, the municipal authorities and the Ministry of Housing and Water Resources should continue with the provision of public standpipes, and at a lower cost than purchases made from neighbours.
Although the two communities have been relatively well catered for in the provision of improved water supply, there is an extremely low level of provision for improved sanitation.
R 2 / E 4
I. Study Details
Authors Adam, A
Year 2013
Title Perceptions of slum-dwellers and municipal officials on factors impacting the
provision of basic slum services in Accra, Ghana
Journal International Institute of Social Studies Research Report
Source Google scholar
II. Study coverage
Basic service Water and Sanitation
Country Ghana
Cities Accra

172
III. Context and intervention
Type of settlement/slum Slum — informal
Nature of agencies
involved in planning and
service provision
Government
Form of user
participation
-
Project/intervention
funding agency
Government
IV. Research design
Aim of the study The main aim of the research is to explore the key factors determining socio-economic, institutional and political factors that determine the delivery of basic services to slum communities under AMA.
This study understands the levels and challenges to basic service provision in slums, the views of both the demand (slum-dwellers) and supply (AMA) sides are considered to overcome the limited services provided.
Type of study Mix method
Research design Observational
Methodology used for
data analysis
V. Data and sample
Data sources Primary data
Household questionnaire/In-depth exploratory study/FDG/ transect walk observations
Data period Not mentioned
VI. Results and evidence
Evidence on outcomes Evidence
Connectivity
Outcome
Moderately negative

173
Access to water
Access to sanitation service
Summary of results The survey showed 36% and 35% of respondents had access to water and sanitation, respectively.
An overall average of 69.5% of the 50 respondents agreed that AMA (including CG, donors and decentralised agencies) play major role in the delivery of basic services such as potable water and sanitation. This was further buttressed by key informants and discussants during focus-group discussions (FGDs).
Brief theory of change Donors and decentralised agencies are able to enhance the water and
sanitation infrastructure to the slum-dwellers to some extent.
R 3 / A17
I. Study Details
Authors Ahmad, S, Choi, M and Ko, J
Year 2013
Title Quantitative and qualitative demand for slum and non-slum housing in Delhi:
Empirical evidence from household data
Journal Habitat International
Source Electronic database
II. Study coverage
Basic service Water and sanitation
Country India
Cities New Delhi
III. Context and intervention
Type of settlement/slum Informal settlement
Nature of agencies
involved in planning and
service provision
Government
User involvement

174
Form of user
participation
Participation through self-mobilisation
Project /intervention
funding agency
State government
Private (self-financed)
IV. Research design
Aim of the study This study aims to estimate housing demand based on empirical
evidence, using household-survey data in New Delhi. Housing demand
comprises both quantitative and qualitative components, where, for the
first time, the latter is estimated by demand for housing attributes for
the local housing market in New Delhi.
Type of study Quantitative
Research design Observational
Methodology used for
data analysis
Quantitative
V. Data and sample
Data sources Secondary data
This study employs the data extracted from the 58th round National Sample Survey (NSS) on the ‘housing condition of India’, conducted by NSSO
Data period 2002
VI. Results and evidence
Evidence on outcomes Connectivity: moderately negative
Proportion of households with tap-water facility
Proportion of households with in-house piped-water connection
Proportion of households with independent latrine
Summary of results The estimation results of housing demand show that housing demand is inelastic with price and income.
Overall, the degree of price elasticity is smaller than that of income in absolute term, which indicates that housing demand is less responsive to change in the prices of dwelling than household income, except in slums.

175
Taking into consideration that the current level of housing consumption in New Delhi is close to the minimum level of basic needs, this implies that there is little room to reduce housing consumption further, despite rises in rent levels.
However, this also implies that the increase in household income is relatively effective in improving housing consumption.
Therefore, economic growth of India in general, and particularly of New Delhi, or any specific income-improvement program, is expected to boost housing consumption.
Brief theory of change In sum, a policy combination is desirable for slum dwellings: provision of low-cost dwellings, primarily facilitated by use of low-cost land, as well as promotion of incremental dwelling. These two may also be combined in the context of traditional site and service, and a self-help housing approach.
In comparison, housing qualities are important determinants of dwelling value for non-slum households. Therefore, in sum, provision of adequate infrastructure is also necessary, in addition to an increase in income, in order to enhance housing consumption for non-slum households.
In this context, since it is generally expected that, by observing the current economic scenario in India, and particularly in New Delhi, income is bound to increase, there should be sufficient housing supply in New Delhi in order to cope with an increase in housing demand, coupled with income growth in non-slum households.
This, in turn, requires sufficient urban-land supply. Therefore, government policies need to be focused commonly and ultimately on enabling and encouraging strategies to increase urban land supply for both non-slum and slum households. It is necessary to increase dwelling stocks equipped with adequate infrastructures to cope with increasing housing demand, derived from income growth for non-slum households, on the one hand; it is also, on the other hand, necessary to provide low-cost serviceable land for slum households, coupled with an incremental dwelling strategy.
R4 / A38
I. Study Details
Authors Ahmed, N, Sohail, M
Year 2003
Title Alternate water-supply arrangements in peri-urban localities: Awami (people's)
tanks in Orangi township, Karachi
Journal Environment and Urbanization
Source Electronic database

176
II. Study coverage
Basic service Water
Country Pakistan
Cities Orangi (Karachi)
III. Context and intervention
Type of settlement/slum Formal
Nature of agencies
involved in planning and
service provision
Local government — Karachi Water and Sewerage Board (KWSB)
Pakistan Rangers (a paramilitary force usually deployed for border
security)
User involvement ‒ Community
Form of user
participation
Participation by partnership and contribution
Project /intervention
funding agency
Local government ‒ Karachi Water and Sewerage Board (KWSB)
Pakistan Rangers (a paramilitary force usually deployed for border
security)
IV. Research design
Aim of the study The aim of this paper is to show:
How community-managed public tanks (Awami tanks) have been used in Orangi, Karachi’s largest informal settlement, to cope with the situation.
The paper explores the partnerships between service providers, recipients of the service and other related stakeholders.
Type of study Qualitative
Research design Observational
Methodology used for
data analysis
Narrative analysis

177
V. Data and sample
Data sources Primary data — Information was collected from various stakeholders,
including tanker operators and owners, KWSB staff, staff from the
Pakistan Rangers and municipal representatives. In addition, focus-group
meetings were held with tanker operators and area residents, and
interviews held with KWSB staff, Rangers, elected councillors and political
activists.
Secondary data — KWSB (2001), Basic Facts, Departmental Report,
Karachi Water and Sewerage Board, Karachi.
Data period Not clearly mentioned
VI. Results and evidence
Evidence on outcomes Connectivity: moderately positive
Pakistan Rangers and KWSB come together to supply water for free through tankers, to community tanks in Orangi settlement. Community members access water from these tanks for drinking purposes.
Affordability: moderately positive
Water is supplied free of charge
Adequacy: moderately negative
Water is not available during the day as tankers supply water at night only
Sustainability: moderately negative
Quantity of water supplied is the bare minimum. These tanks are only a temporary solution. If Pakistan Rangers withdraw from the community, the supply of water will stop.
Effort and time: moderately negative
Water has to be manually lifted and carried to the houses from the community tanks.
Summary of results The study of Awami tanks shows that communities, with support from government agencies, can generate cooperative action to address their basic needs. It is significant that, in Orangi township, despite acute water shortages, the low economic status of its households and an overall feeling of desperation, there has been no communal conflict in the routine operation of Awami tanks. However, the relatively infrequent supply of water to the tanks has adversely affected their expansion, and communities are concerned about the lack of water from the source itself.

178
The design and construction of Awami tanks needs to be improved in order to prevent water loss due to seepage.
The reality of the situation concerning the lack of performance of the piped-water supply needs to be clearly communicated to the people of Orangi, so that they can consider other options. Unfortunately, the authorities and elected representatives have been unwilling to do this, as they are concerned with maintaining their political and administrative hold on the communities.
Brief theory of change The study of Awami tanks shows that communities, with support from government agencies, can generate cooperative action to address their basic needs. It is significant that, in Orangi township, despite acute water shortages, the low economic status of its households and an overall feeling of desperation, there has been no communal conflict in the routine operation of Awami tanks. However, the relatively infrequent supply of water to the tanks has adversely affected their expansion, and communities are concerned about the lack of water from the source itself.
R 5 / A37
I. Study Details
Authors Almansi, F
Year 2009
Title Regularizing land tenure within upgrading programmes in Argentina; the cases of
Promeba and Rosario Hábitat
Journal Environment and Urbanization
Source Electronic database
II. Study coverage
Basic service Water and sewage
Country Argentina
Cities Promeba and Rosario
III. Context and intervention
Type of settlement/slum Both formal and informal

179
Nature of agencies
involved in planning and
service provision
Government
Settlement Upgrading Programme is a countrywide programme now implemented in 21 provinces, with the involvement of national, provincial and local authorities.
Rosario Habitat is a local programme implemented by the government in the city of Rosario.
Form of user
participation
Participation through contribution
Project /intervention
funding agency
Official development assistance
Both programmes benefit from IDB co-funding schemes. Both focus on informal urban settlements and, in the case of Promeba, on peri-urban settlements.
IV. Research design
Aim of the study The aim of this paper is to describe two large-scale upgrading
programmes in Argentina that sought to transfer land tenure to the
inhabitants of informal settlements as part of a larger process that
provides good-quality infrastructure and services and other measures to
strengthen their social inclusion in the wider city. The paper discusses
the constraints on such programmes, including the long, complex
process of getting land titles.
Type of study Qualitative
Research design Observational
Methodology used for
data analysis
Narrative analysis
V. Data and sample
Data sources Secondary data
Data period Not clearly mentioned
VI. Results and evidence
Evidence on outcomes Water: connectivity: moderately positive
1,013 relocated families received houses with connections to drinking water and 2,138 families stayed in the original

180
settlements, which were provided with drinking-water connections.
Sanitation: connectivity: moderately positive
1,013 families received houses with connections to sewers and storm-water drains and 2,138 families stayed in the original settlements, which were provided with a sanitation network, storm drains and sewers.
Electricity: connectivity: moderately positive
1,013 families received houses with electricity and natural-gas networks and 2,138 families stayed in the original settlements, which were provided with electricity and gas services.
Summary of results The two programmes described in this paper have shown that upgrading
with land-tenure regularisation strengthens beneficiaries’ feelings of
inclusion and stimulates private investment. In addition, it has been
demonstrated that most beneficiaries go on living in the upgraded
settlements and have made numerous improvements to their houses
since the programme interventions.
Brief theory of change The transformation of irregular settlements into formal neighbourhoods
was achieved through the following actions:
New urban planning of the villas, the opening of roads and urban regularisation, ensuring the provision of basic infrastructure (water and electricity supply, sewers, storm drains, gas, paved roads) and community facilities.
Housing upgrading, ensuring satisfactory sanitary conditions through the construction of a sanitary unit.
Building of houses with infrastructure for families relocated as a consequence of the new urban planning (not to exceed % of the total number of houses).
Legal regularisation by delivering property titles to all beneficiaries.
Strengthening of social networks, including the beneficiaries’ direct participation in the decision-making process: planning, performance and consolidation of interventions.
Integrated assistance to children and adolescents and their families: stimulating learning and psychomotor skills in children aged two to five, nutrition, self-production of food, recreation, family counselling and social education for children aged 10 to 14.
R 6 / A 55
I. Study Details
Authors Amis, P and Kumar, S
Year 2000

181
Title Urban economic growth, infrastructure and poverty in India: lessons from
Visakhapatnam
Journal Environment and Urbanization
Source Electronic database
II. Study coverage
Basic service Water
Country India
Cities Visakhapatnam
III. Context and intervention
Type of settlement/slum Informal settlement
Nature of agencies
involved in planning and
service provision
Government
Municipal Corporation implements the project, which involves improvements in physical infrastructure: water supply, drains, communal latrines, paved roads and community halls in 170 slums, with an estimated population of 20,000.
Form of user
participation
-
Project /intervention
funding agency
Official development assistance
DFID provided capital of £9m = (Rs 29 Crore) for a slum-improvement project.
IV. Research design
Aim of the study This paper aimed to discuss the rapid economic growth in the city of Visakhapatnam. It highlights how the city’s further growth is constrained by inadequate investment in infrastructure and discusses the political and institutional reasons for this.
It then presents the findings of participatory research on poverty, and the many dimensions of poverty that are emphasised by urban-poor groups, including inadequate incomes, lack of assets (‘no shelter, no property, no gold’), lack of support (especially for widows, deserted women and the handicapped), illness and debt.

182
It discusses the direct and indirect impacts on poverty of a DFID SIP, showing which improvements low-income groups particularly appreciated.
Type of study Qualitative
Research design Observational
Methodology used for
data analysis
Narrative analysis
V Data and sample
Data sources Primary data
Focus group and in-depth interviews.
Research was carried out by Thinksoft Consultants, with a group of eight researchers in two teams, primarily split by gender.
Secondary data
Database developed by the World Bank: Database on poverty and growth in India.
Data period 1996
VI. Results and evidence
Evidence on outcomes Connectivity: moderately positive
48% of residents noted a reduction in flooding and 55% reported reduction in water stagnation.
Effort and time: Moderately positive
In respect of water, 62% of the households interviewed reported a reduction in the burden for women, and 68% reported savings in time.
Summary of results The DFID’s project involved,
Improvements in physical infrastructure (water, drains, communal latrines, paved roads and community halls in 170 slums (estimated population of around 200,000).
The infrastructure components of the project, which helped improve the overall environment were greatly appreciated by the inhabitants (by reducing flooding, making roads passable and reducing the burden of collecting water), in particular by women.
With regard to water, 62%of households reported a decline in the burden for women while 68% reported a time saving. Forty-eight percent noted a reduction in flooding and 55% a reduction in water stagnation.

183
Brief theory of change First, Visag’s success is already being constrained by the lack of investment in urban infrastructure.
This case study shows that, even in the boom towns, it remains a problem, and possibly one that is greater than currently estimated, as any growth rapidly pushes up against infrastructure constraints.
The second concern is workers’ physical inability to fully participate in the buoyant labour market, due to weakness and ill-health.
Because of the low levels of human capital, urban economic growth will not be sufficient, despite increasing wage levels. This again emphasises the importance of human capital in economic development in India.
On the positive side, the success of the DFID interventions, especially in improving the quality of life for low-income households, does show what can be done through capital spending on infrastructure.
R 7 / B 4
I. Study Details
Authors Asian Development Bank (ADB)
Year 2007
Title Delivering piped water on a small scale: Results of ADB’s water-supply-service
market survey in Manila
Journal Asian Development Bank (ADB) Report
Source Website search
II. Study coverage
Basic service Water
Country Philippines
Cities Manila
III. Context and intervention
Type of settlement/slum Low-income

184
Nature of agencies
involved in planning and
service provision
Private
Form of user
participation
-
Project /intervention
funding agency
ADB
Philippines involved collaboration with Metro Manila’s two concessionaires: Manila Water Company, Inc. and Maynilad Water Services, Inc.
IV. Research design
Aim of the study The study focused on how households access water, how much this
water costs, and if it is safe and reliable.
Type of study Mixed-methods
Research design Observational
Methodology used for
data analysis
Simple percentage analysis
V. Data and sample
Data sources Primary data
Data period March and April 2006
VI. Results and evidence
Evidence on outcomes Evidence
Connectivity, adequacy
Outcome Moderately positive and moderately negative
Private provision of piped-water supply
Water consumption from piped-water connection
Private provision of non-piped water supply
Hours of water supply in piped-water connection
Summary of results Only 28% of the households have piped-water connections from SSWPs, while a staggering 72% rely on non-piped water sources — the huge gap indicating just how much work is still needed to connect the poor.

185
People with piped connections consume 4–5 times more water than those who depend on non-piped water sources: about 13.5% of households depend on multiple water sources; 48% rely on only one source; and 38.5% depend mainly on one source, together with bottled water.
Interestingly enough, almost half of those with a piped water supply, mostly belonging to higher-income households, still buy bottled water for drinking purposes. In fact, 95% of households prefer bottled water for drinking and cooking. Affordability, however, is an issue, since bottled water costs the most, averaging (0.13 US cents) PhP6.42 per gallon.
Among SSWPs, water from PWPs is cheapest, at 7 centavos (US$0.0015) per gallon.
Regardless of the water source, however, 24-hour water supply remains a development goal. Piped-water availability averages only 15 hours daily, and can be as little as four hours.
Brief theory of change ADB believes that small piped-water networks (SPWN), a system used by
SSWPs, offer a temporary ‘building-block’ solution to the water problems
of slum communities. In 2005, ADB designed pilot projects to
demonstrate the use of SPWN for speedy piped-water delivery. These
pilot projects aim quickly to connect selected urban poor communities in
India, the Philippines, and Vietnam to piped-water supply on an interim
basis, until such time that the water utility is able to connect them
permanently. ADB’s pilot projects in the Philippines involved
collaboration with Metro Manila’s two concessionaires: Manila Water
Company, Inc. and Maynilad Water Services, Inc. To date, roughly 1,650
households in 10 urban-poor communities have been connected. While
this number is promising, a large segment of Manila’s urban poor remains
unconnected.
However, in the case of Metro Manila, Philippines, ADB and two
concessionaires have intervened to service the water supply to the slum
community. This study found that the only positive effect of the
intervention was due to the adequate amount of water supply provided.
R 8 / A16
I. Study Details
Authors Bakker, K, Kooy, M, Shofiani, N and Martijn, E
Year 2008
Title Governance failure: Rethinking the institutional dimensions of urban water supply
to poor households
Journal World Development
Source Electronic database

186
II. Study coverage
Basic service Water
Country Indonesia
Cities Jakarta
III. Context and intervention
Type of settlement/slum Informal settlement
Nature of agencies
involved in planning and
service provision
Other
Private-sector participation
Form of user
participation
-
Project /intervention
funding agency
National government
IV. Research design
Aim of the study This paper examines factors that explain the persistent failure of both
public and private water-supply-system operators to achieve high rates
of individual network connections to poor households in urban areas.
Type of study Quantitative
Research design Observational
Methodology used for
data analysis
Quantitative
V. Data and sample
Data sources Primary data
Secondary data

187
Data from a household survey, archives, GIS-based mapping, and interviews are used
Data period 2005
VI. Results and evidence
Evidence on outcomes Adequacy: moderately negative
Summary of results This paper has demonstrated that Jakarta’s water-supply system has been highly fragmented since its inception.
Access to a household network connection has been strongly differentiated economically (that is, poverty is correlated with lack of access to a household connection, with the use of alternative water sources, with low levels of water consumption, and with spending higher proportions of household income on water supplies) and spatially (that is, those lacking access are concentrated in specific districts of the city, and within lower in-come areas in neighbourhoods across the city).
This differentiation of access has deep historical roots. The current lack of access throughout large areas of Jakarta is due, in part, to the legacy of segregated colonial water-supply systems, and deliberate underinvestment in the post-colonial period, as policymakers sought to discourage rural–urban migration, and gave low priority to extending water-supply access to the urban poor, focusing instead on economic development of key sectors, or on an urban-redevelopment agenda focused on ‘‘monumental’’ infrastructure.
Brief theory of change In the case of Jakarta, the culture of urban governance, the conventional water-supply utility business model adopted in Indonesia, broader urban-planning constraints, cost-recovery requirements, and economic incentives linked to tariff structures were identified as some of the contributing factors to governance failure.
The factors preventing or precluding the capability of poor households to connect to the network include limited ability to pay transaction costs (rather than volumetric costs); insecure tenure; the inability of the water-supply utility to deal with poor households’ need for flexible payment options; and perceptions of the relative quality, availability, and reliability of different water sources.
R 9 / A15
I. Study Details
Authors Bakker, K
Year 2007
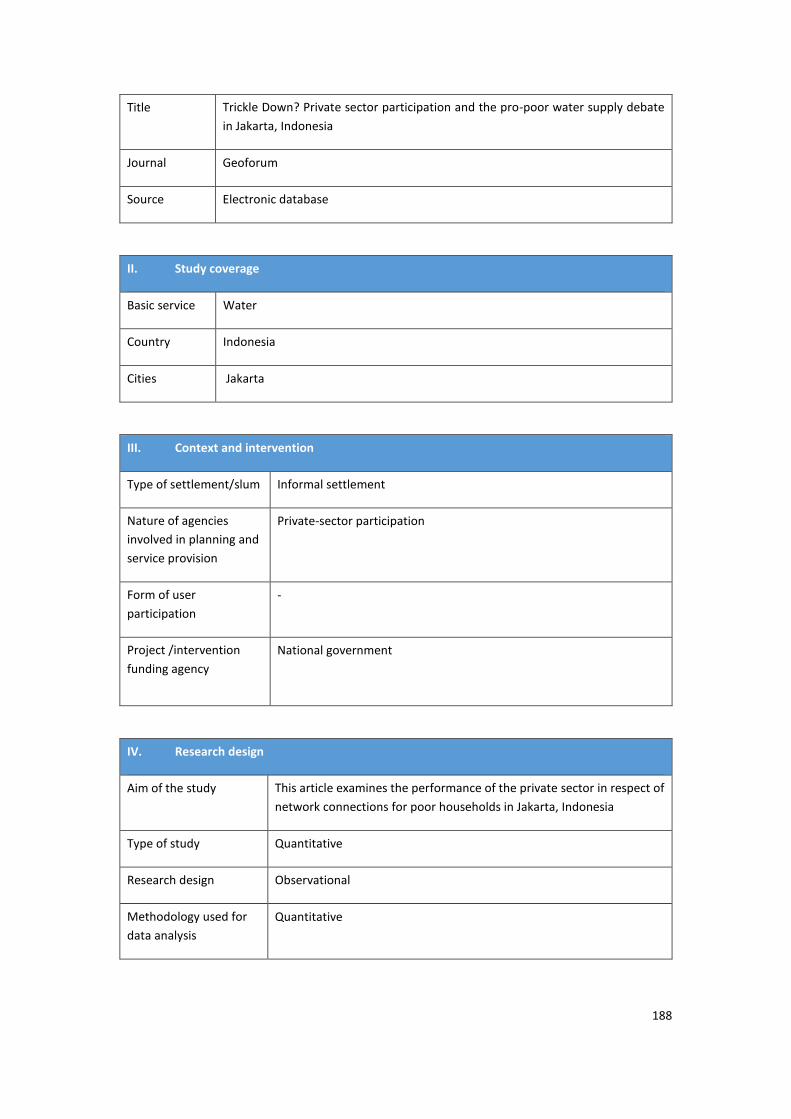
188
Title Trickle Down? Private sector participation and the pro-poor water supply debate
in Jakarta, Indonesia
Journal Geoforum
Source Electronic database
II. Study coverage
Basic service Water
Country Indonesia
Cities Jakarta
III. Context and intervention
Type of settlement/slum Informal settlement
Nature of agencies
involved in planning and
service provision
Private-sector participation
Form of user
participation
-
Project /intervention
funding agency
National government
IV. Research design
Aim of the study This article examines the performance of the private sector in respect of
network connections for poor households in Jakarta, Indonesia
Type of study Quantitative
Research design Observational
Methodology used for
data analysis
Quantitative
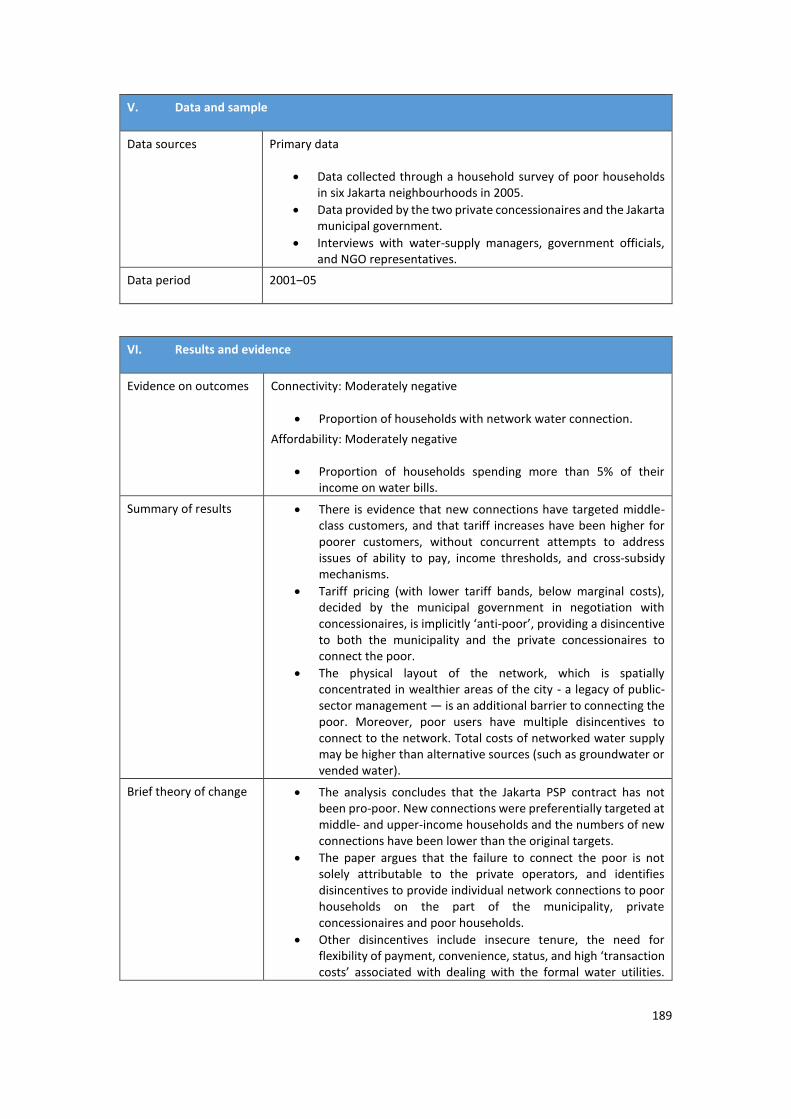
189
V. Data and sample
Data sources Primary data
Data collected through a household survey of poor households in six Jakarta neighbourhoods in 2005.
Data provided by the two private concessionaires and the Jakarta municipal government.
Interviews with water-supply managers, government officials, and NGO representatives.
Data period 2001‒05
VI. Results and evidence
Evidence on outcomes Connectivity: Moderately negative
Proportion of households with network water connection.
Affordability: Moderately negative
Proportion of households spending more than 5% of their income on water bills.
Summary of results There is evidence that new connections have targeted middle-class customers, and that tariff increases have been higher for poorer customers, without concurrent attempts to address issues of ability to pay, income thresholds, and cross-subsidy mechanisms.
Tariff pricing (with lower tariff bands, below marginal costs), decided by the municipal government in negotiation with concessionaires, is implicitly ‘anti-poor’, providing a disincentive to both the municipality and the private concessionaires to connect the poor.
The physical layout of the network, which is spatially concentrated in wealthier areas of the city - a legacy of public-sector management — is an additional barrier to connecting the poor. Moreover, poor users have multiple disincentives to connect to the network. Total costs of networked water supply may be higher than alternative sources (such as groundwater or vended water).
Brief theory of change The analysis concludes that the Jakarta PSP contract has not been pro-poor. New connections were preferentially targeted at middle- and upper-income households and the numbers of new connections have been lower than the original targets.
The paper argues that the failure to connect the poor is not solely attributable to the private operators, and identifies disincentives to provide individual network connections to poor households on the part of the municipality, private concessionaires and poor households.
Other disincentives include insecure tenure, the need for flexibility of payment, convenience, status, and high ‘transaction costs’ associated with dealing with the formal water utilities.

190
‘Transaction costs’ (infrastructure costs to build storage because networked water supply is only intermittent; line-ups and time required to pay bills (for those without bank accounts and regular income); fear of time required (to deal with meter misreading and bill over-charging) are other disincentives.
R 10 / A34
I. Study Details
Authors Bapat, M and Agarwal, I
Year 2003
Title Our needs, our priorities: Women and men from the slums in Mumbai and Pune
talk about their needs for water and sanitation
Journal Environment and Urbanization
Source Electronic database
II. Study coverage
Basic service Water and sanitation (Tap connection and toilets)
Country India
Cities Mumbai and Pune
III. Context and intervention
Type of settlement/slum Both formal and informal
Nature of agencies
involved in planning and
service provision
NGO
SPARC/MAHILA MILAN)
Form of user
participation
Participation through self-mobilisation
The nature of participation and intervention can be gleaned from a few
interviews.

191
Project /intervention
funding agency
Private-NGO
Local Government-Municipal Corporation
Central-Bombay Port Trust
State-Government mental hospital
IV. Research design
Aim of the study This paper presents extracts from interviews with slum-dwellers,
primarily women, in Mumbai and Pune, and discusses the conditions
they cope with every day with regard to water and sanitation, and the
ways these conditions have changed over time.
Type of study Qualitative
Research design Observational
Methodology used for
data analysis
Interview method
V. Data and sample
Data sources Primary data-Interviews with the slum-dwellers
Data period Not stated
VI. Results and evidence
Evidence on outcomes Mumbai
Connectivity: moderately positive
NGO constructed the toilets for the community
Municipal corporation provided stand pipes
Bombay port trust provided public toilets (as the land belongs to them)
Community members collected money and secured shared water connections, but there is no supply of water
Adequacy: moderately negative
Municipal Corporation provided in-house connections to those who could pay for them
Duration of the water availability during the day

192
Quantity of water available during the day
Affordability: moderately negative
User charges/pay per use
Effort and time: moderately negative
Time spent/distance travelled in accessing water
Due to unavailability of water in stand pipes, community members buy water from the nearby communities
Pune
Connectivity: moderately positive
Community members lobby the Municipal Corporation to provide water connection
Local councillor agrees to provide water connections after requests from the community
NGO and self-help group jointly build community toilets
Government mental hospital, which owns the land, has provided shared water connections to the community
Adequacy: moderately positive
Availability of toilets for use by community members (separate toilets for men, women and children)
Community members form self-help group and lobby the Municipal Corporation to provide water connection
Effort and time: moderately positive
NGO and self-help group jointly build community toilets in order to reduce time spent/distance travelled in accessing water.
Summary of results Results are not clearly stated. The interviews are reported verbatim and
there is no reporting of results, analysis, conclusions
Brief theory of change Not clearly mentioned
R 11 / E8
I. Study Details
Authors Baruah, B
Year 2010
Title Energy services for the urban poor: NGO participation in slum electrification in
India
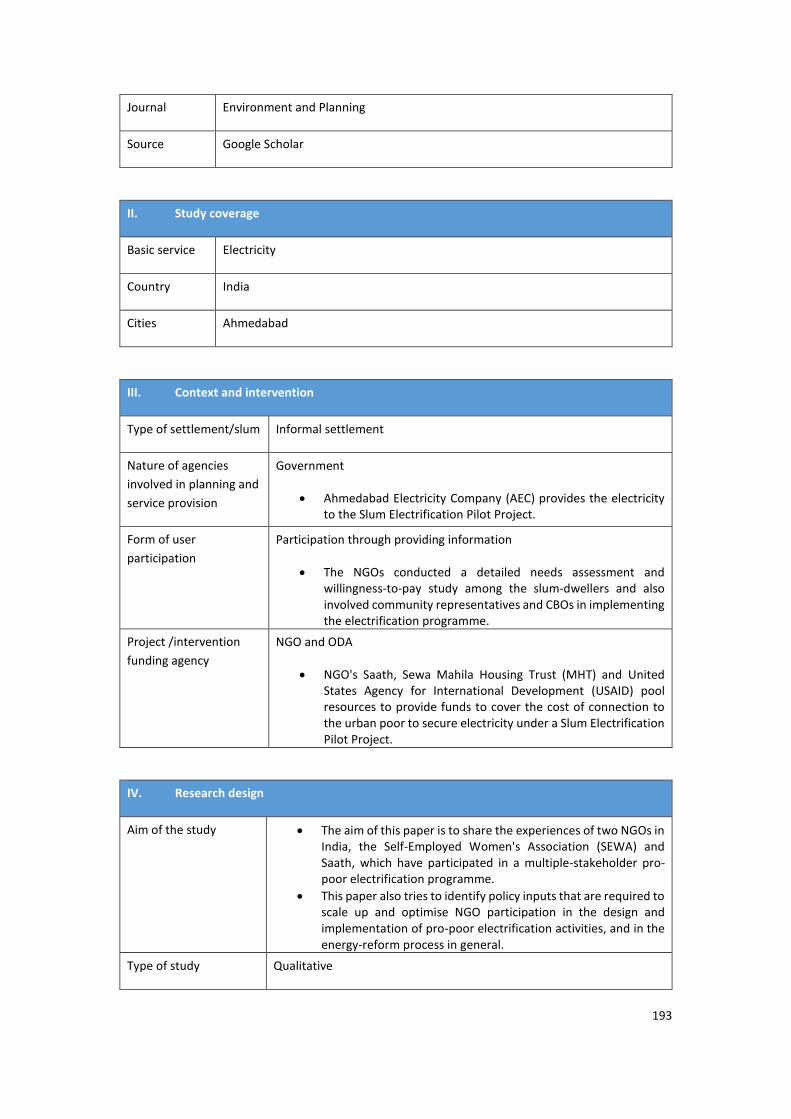
193
Journal Environment and Planning
Source Google Scholar
II. Study coverage
Basic service Electricity
Country India
Cities Ahmedabad
III. Context and intervention
Type of settlement/slum Informal settlement
Nature of agencies
involved in planning and
service provision
Government
Ahmedabad Electricity Company (AEC) provides the electricity to the Slum Electrification Pilot Project.
Form of user
participation
Participation through providing information
The NGOs conducted a detailed needs assessment and willingness-to-pay study among the slum-dwellers and also involved community representatives and CBOs in implementing the electrification programme.
Project /intervention
funding agency
NGO and ODA
NGO's Saath, Sewa Mahila Housing Trust (MHT) and United States Agency for International Development (USAID) pool resources to provide funds to cover the cost of connection to the urban poor to secure electricity under a Slum Electrification Pilot Project.
IV. Research design
Aim of the study The aim of this paper is to share the experiences of two NGOs in India, the Self-Employed Women's Association (SEWA) and Saath, which have participated in a multiple-stakeholder pro-poor electrification programme.
This paper also tries to identify policy inputs that are required to scale up and optimise NGO participation in the design and implementation of pro-poor electrification activities, and in the energy-reform process in general.
Type of study Qualitative

194
Research design Observational
Methodology used for
data analysis
Narrative analysis
V. Data and sample
Data sources Primary data
The author employs a pricing survey carried out by Saath, project reports prepared by NGOs and international aid agencies, internal and external evaluations of the project, and interviews with staff from the NGOs and the electricity utility, in order to analyse the project in terms of its impacts upon access, tariffs, quality of service, tenure security, and its role in empowering women through the formation and maintenance of CBOs.
Secondary data
The author use academic literature on urban infrastructure provision and politics, project reports and evaluations.
Data period Not clearly mentioned
VI. Results and evidence
Evidence on outcomes Connectivity: moderately positive
A total of 820 households in four slums were provided with electricity during the pilot project.
Affordability: moderately negative
Households had to contribute a reduced connection cost (capital cost) of Rs3,350 to obtain connections from the AEC. This was only a part of the total cost of Rs.,7,750. USAID and AEC contributed Rs2,200 each.
Durability: moderately positive
The NGOs facilitated negotiations between AEC and AMC to overcome the problem of tenure status and security. The AMC issued a No Objection Certificate (NOC), stating that the beneficiaries of the pilot project and the Slum Networking Project will not be evicted by the AMC for a period of ten years.
Summary of results The MHT and Saath have succeeded in making a contribution to pro-poor electrification to which few other NGOs in India can lay claim.
Their experience suggests that NGOs can play a very effective role in slum electrification, as intermediaries between CBOs, municipalities and utilities. They can assist in developing innovative ways of addressing land-tenure issues; devising

195
equitable ways of paying for electricity; improving business processes, including metering, billing, collections, and rate making; dealing with non-payment and theft; and developing information and reporting systems by providing feedback to utilities and municipalities.
However, it is important to understand that the NGO’s role in slum electrification is time-consuming, labour-intensive and expensive.
Scaling up and optimising NGO participation in pro-poor electrification activities requires strong state involvement in securing financial resources and developing a policy framework for NGOs to participate in the design and implementation of partnership projects and in the oversight of the electricity-reform process in general.
Brief theory of change MHT and Saath staff identified the absence of policy guidance and financial resources as the biggest impediment for NGO participation in pro-poor electrification projects.
The profitability of slum electrification motivated the AEC progressively to reduce connection fees for slum households after the completion of the pilot project.
However, the AEC completely ignored the pricing guidelines of the survey conducted by Saath in setting the unconscionably high connection fees in the pilot project.
The lack of a recognised role for NGOs made it easy for the utility to reject Saath's findings and recommendations. There were no administrative or capacity-building funds available to the NGOs to participate in this project.
The conflict between the different partners in the Ujala Yojana slum electrification project is also compounded by the absence of a project-specific memorandum of understanding (MOU) that defines the specific roles and responsibilities of each partner.
R 12 / D 4
I. Study Details
Authors Barja, G and Urquiola, M
Year 2001
Title Capitalization, regulation, and the poor: Access to basic services in Bolivia
Journal World Institute for Development Economics Research, Report
Source Cross reference

196
II. Study coverage
Basic service Water, sanitation and electricity
Country Bolivia
Cities Cochabamba, El Alto, La Paz, Oruru, Potosí, Santa Cruz, Tarija, Trinidad
III. Context and intervention
Type of settlement/slum Low-income
Nature of agencies involved in
planning and service provision
Private
Form of user participation -
Project /intervention funding agency Private
IV. Research design
Aim of the study To analyse the impact of reforms on poor or lower-income households
along two dimensions: (i) access, understood as connection, and (ii)
affordability, as determined by changes in consumption and pricing
patterns.
Type of study Mixed-methods
Research design Observational
Methodology used for
data analysis
Statistical method
V. Data and sample
Data sources Secondary data
Encuesta Integrada de Hogares, 1st round 1989
Encuesta Integrada de Hogares, 7th round 1994
Encuesta Continua de Hogares 1999
Data period 1989, 1994, 1999

197
VI. Results and evidence
Evidence on outcomes Evidence
Connectivity
Outcome
Strongly positive
Trend in percentage increase of households with access to water supply
Trend in percentage increase of households with access to sewerage system
Trend in percentage increase of households with access to electricity
Summary of results Water access rates are relatively stable in the control period, but increase between 1994 and 1999. The convergence in connection rates is more marked: by 1999, households in all quintiles have access rates above 90%, and the differences between them are often not statistically significant.
Electricity has been the sector with the smallest improvements in access, partially reflecting relatively favourable initial conditions. The quintiles with the lowest access levels in 1989 have been those with the greatest increases during 1989‒99, an observation which also holds for the 1994‒99 period. While, in 1989, households in the lowest quintile had an access rate of only 86%, by 1994 all five had rates exceeding 95%. It is surprising that, by 1999, the lowest-income group seems to have surpassed all but the richest. In part, this may reflect sampling issues, since, when all groups have high and similar access rates, these differences can cease to be statistically significant.
Surveys suggest that the sewerage situation of the lowest-income quintile is better than that displayed by quintile 2, or even 3. Household-survey data suggest that the capitalisation/regulation reforms, to the extent that they caused increases in connection rates, have not bypassed poor households, and have, in some cases, tended to benefit poor households disproportionately.
Brief theory of change Bolivian privatisation/capitalisation and regulation have made a positive
impact on the access in water, sanitation and electricity for the urban low-
income poor.
R 13 / A39
I. Study Details
Authors Birkenholtz, T
Year 2010

198
Title ‘Full-cost recovery’: Producing differentiated water collection practices and responses to centralized water networks in Jaipur, India
Journal Environment and Planning A
Source Electronic database
II. Study coverage
Basic service Water (access)
Country India
Cities Jaipur (Rajasthan)
III. Context and intervention
Type of settlement/slum Both formal and informal
Nature of agencies involved in planning and service provision
Government: Rajasthan Urban Infrastructure Development Project (RUIDP)
Form of user participation
-
Project/intervention funding agency
ODA: ADB, Japan Bank
IV. Research design
Aim of the study This paper examines the political and ecological effects of the expansion of an urban centralised water-supply network and its transformation into a full-cost-recovery system in Jaipur, Rajasthan, India.
Type of study Qualitative
Research design Observational
Methodology used for data analysis
Narrative case study
V. Data and sample
Data sources Primary data

199
Household survey of six Jaipur neighbourhoods stratified by class;
follow-up household interviews, interviews with public water-
supply managers and private water-tanker vendors.
Secondary data
Data period 2007‒09
V. Results and evidence
Evidence on outcomes Connectivity: moderately positive
Residents have household-level metered connections. Residents have access to water from public shared-stand posts.
Adequacy: moderately negative
Water supply is intermittent and inadequate. Residents have plastic tanks (of capacity 250‒1,000l) to capture the intermittent supply.
Affordability: moderately negative
Residents in this slum pay more for water than elsewhere. Even residents in affluent areas pay less than this community.
Effort and time: moderately negative
Unreliable water supply from the shared-stand post resulting in long queues and wait times of up to two hours daily.
Summary of results The highly uneven flow of water from the network is critical to highlighting the differential character of adaptive responses and effects of cost-recovery reforms.
First, inadequate service is leading to self-provision through the construction of private tube wells by the affluent. This occurs in the absence of construction regulations and is happening in the industrial sector as well. To date, the proposed policy changes in the PHED water supply do not address this issue, because regulating private tube-well construction and abstraction is a politically divisive issue the growth of private water markets is occurring as an outcome of the uneven expansion of public supply, yet with very divergent class and spatial practices.
Private water markets, in general, are subsidised by the formal sector through side-selling, which negatively impacts the underserved informal sector by driving up operation costs of the PHED network. The uneven service being provided through the water-supply network will continue to encourage private-water-tanker provision, rather than eliminating it.
The city continues to struggle, in socially fragmented ways, with access to water. By continuing to designate particular areas of the city as ‘informal’ and ‘non-regularised’, access to water is not only uneven, but the adaptations that people institutionalise and their political and ecological effects are socially differentiated, with the poor and disenfranchised being most negatively impacted.

200
Brief theory of change The investigation concludes that the spatially uneven integration of network expansion and the intermittent flow of water circulating through it, combined with historical axes of political economic difference produces uneven adaptive responses to maintain access to water, such as waiting on water, private tube-well construction, and private water-tanker operations, while transforming social-power relations.
First, that these uneven flows and cost-recovery initiatives are exacerbating current disparities in access to drinking water.
Second, that the current public water-supply system has only been partially reformed and that these policy changes have rendered the public supplier unable to recover costs. This makes the need for a private-sector rescue of an incapacitated and inefficient public institution seem obvious to planners, yet the public utility's inability to set costs or to set infrastructure priorities draws into question the need for the private sector and full-cost-recovery reforms.
R 14 / A 6
I. Study Details
Authors Bravo, G, Kozulj, R and Landaveri, R
Year 2008
Title Energy access in urban and peri-urban Buenos Aires
Journal Energy for Sustainable Development
Source Electronic database
II. Study coverage
Basic service Electricity
Country Argentina
Cities Buenos Aires
III. Context and intervention
Type of settlement/slum Slum and poor

201
Nature of agencies
involved in planning and
service provision
Government
Form of user
participation
-
Project/intervention
funding agency
Government
IV. Research design
Aim of the study The objective of the study is the identification of unsatisfied energy
needs, and then the assessment of the most appropriate sources that
should be encouraged in order to fulfil the basic needs.
Type of study Qualitative
Research design Observational method
Methodology used for
data analysis
Descriptive analysis
V. Data and sample
Data sources The case study surveyed 100 poor households in Villa Fiorito and Budge
Questionnaire method
In-depth interview method
Data period November 2007
VI. Results and evidence
Evidence on outcomes Adequacy: moderately negative
Connectivity: moderately negative
Summary of results Although modern energy sources (LPG and electricity) are broadly used by poor households in Greater Buenos Aires, LPG availability and affordability are found to be key issues. Compounding the fuel-availability issue, another barrier to access can be the high up-front cost of LPG cylinders.
Often it is replaced by charcoal and kerosene by poor slum families and these fuels are dirtier and less efficient, thereby

202
increasing energy consumption and possibly even fuel expenditure for cooking.
The study attempts to quantify unmet basic energy needs, finding that cooling, lighting, and space-heating have the smallest satisfaction levels. The study found that 54% of the total surveyed energy expenditure is on cooking fuels.
Brief theory of change The study found a notable absence of appropriate and comprehensive policies, both for providing access to clean energy and for securing its affordability. Specifically and going beyond energy aspects, the roots of poverty are related to two unaddressed structural issues: land tenure and the availability of regular employment.
R 15 / A 33
I. Study Details
Authors Burra, S, Patel, S and Kerr, T
Year 2003
Title Community-designed, built and managed toilet blocks in Indian cities
Journal Environment and Urbanization
Source Electronic database
II. Study coverage
Basic service Sanitation (Access to toilets)
Country India
Cities Mumbai, Kanpur, Bangalore, Pune
III. Context and intervention
Type of settlement/slum Slum-Informal
Nature of agencies
involved in planning and
service provision
NGO
SPARC, the National Slum Dwellers Federation and Mahila Milan.

203
Form of user
participation
Participation through partnership and contribution
Community involvement in designing, construction and maintenance of
toilet blocks.
Project/intervention
funding agency
ODA
The city of Mumbai sought funding from the World Bank to expand its
sewer system.
IV. Research design
Aim of the study The aim of this paper is to explain the following.
Why sanitation has been neglected, describing the inadequacies
in government-sanitation programmes, first experiments with
community sanitation and the difficult negotiations involving
many cities, including Mumbai, Kanpur and Bangalore.
The major community-toilet programmes that developed in
Pune and Mumbai.
The innovations that allow community toilets to work better than previously used public toilet blocks; the reasons why CBOs and NGOs took on these projects, the lessons learnt, and the ways in which community toilet blocks helped address problems faced by the urban poor, such as quality of toilet construction, inappropriate design, limited water supply, inadequate cleaning and maintenance, no access to drainage, etc.
Type of study Qualitative study
Research design Observational
Methodology used for
data analysis
Narrative analysis
V. Data and sample
Data sources Primary data
Secondary data, collected by NGOs
Data period 1988‒96

204
VI. Results and evidence
Evidence on outcomes Mumbai
Connectivity: moderately positive
Access to community toilets
Adequacy: moderately positive
Availability of toilets for use by community members throughout the day/night
Kanpur
Connectivity: moderately positive
Constructed community 10 toilets. Access to those community toilets
Adequacy: moderately positive
Availability of toilets for use by community members throughout the day/night
Affordability: unclear
Cost of access — user fee operation and maintenance Effort and time: Moderately positive
Location of toilets near the slum
Bangalore
Connectivity: moderately positive
Community-built toilets. Access to those toilets
Pune
Connectivity: moderately positive
114 blocks were constructed in Pune. Access to those toilets
Adequacy: moderately positive
Availability of toilets for use by community members throughout the day/night
Summary of results In Mumbai, the alliance suggested that the city should pay for the capital cost of toilet construction. However, the World Bank had ideas such as slums’ getting organised and bidding against each other to get the fund. So, the alliance did not agree to take part.
In Kanpur, many steps were taken by the public authorities, but the steps taken were not successful. Then, Mahila Milan constructed 10 toilets with seats. The pay-and-use system generated funds for maintenance. There is an improvement in access to toilets.
In Bangalore, with start-up money from the Society for Promotion of Area Resource Centres (SPARC), a group of

205
residents started building a communal toilet. The toilets were entirely community-built.
In Pune, the alliance (SPARC, NSDF, and MM) became one of the principal contractors and constructed 114 toilet blocks. The alliance designed and costed the project; the city provided the capital costs; and the communities developed the capacity for management and maintenance.
In Mumbai, SPARC targeted the completion of 320 toilet blocks by March 2003, but they could not meet the deadline. They argued with the World Bank for an extension. The WB extended to December 2003, but the alliance could only complete 180 blocks while a 110 toilet blocks were underway.
Brief theory of change The alliance promoted a system whereby each family buys a pass for 20 rupees a month — far less costly than the 1-rupee-per-use charge by other public toilets — thereby increasing usage and affordability.
The Indian government has introduced a new programme, the Nirmal Bharat Abhiyan, -whereby a 50% subsidy for the construction of community toilets is available to local bodies and public authorities.
The lacks of funds and political issues are the reason for lack of attention to sanitation in cities such as Pune, Mumbai, etc.
The community-toilet projects all represent, to varying degrees, partnerships that begin to break the conventional approach to service delivery.
Community-maintained toilets are more successful than public toilets, which are government-maintained.
A large community-toilet-block-building programme gives a big push to communities to undertake projects and to create an environment that makes room for experimentation. Externally supported intervention (SPARC, NSDF and MM) do not set new standards, but alter and influence the circumstances that allow communities to develop standards of their own.
R 16 / C 5
I. Study Details
Authors Burra, S
Year 2001
Title Slum sanitation in Pune: A case study
Journal SPARC Research Report
Source Author correspondence

206
II. Study coverage
Basic service Sanitation
Country India
Cities Pune
III. Context and intervention
Type of settlement/slum Slum-informal
Nature of agencies
involved in planning and
service provision
NGOs
Form of user
participation
-
Project/intervention
funding agency
NGO
IV. Research design
Aim of the study The case study seeks to describe the way in which the programme was
implemented and draw lessons for urban governance.
Type of study Qualitative study
Research design Observational
Methodology used for
data analysis
Narrative analysis
V. Data and sample
Data sources Primary data
Data period Not mentioned clearly
VI. Results and evidence
Evidence on outcomes Evidence
Connectivity, Affordability and Adequacy
Outcome

207
Moderately positive and moderately negative
Access to toilet facilities
Affordability of pay-to-use toilet
Construction of new toilet blocks
Summary of results High cost to slum-dwellers of using the toilet – usually Rs1 per use, per person. A family of five would have to spend Rs150 a month to access these toilet blocks and this is not affordable for the majority of the urban poor. This results in early deterioration and disuse, and the pay-and-use approach, which is not sustainable in slums on account of its high cost.
Since 1992, only 22 pay-and-use toilet blocks had been built in the city, annual expenditure never going beyond Rs20 or Rs25 lakhs. A decision was taken to construct 220 toilet blocks, with about 3,500 toilet seats through NGOs in 1999‒2000. This was to be the first phase of the programme. On completion of the second phase (planned for another 220 blocks between November 2000 and January 2001), more than 400 blocks or more than 10,000 toilet with seats would be constructed at a cost of more than Rs40 crores and benefiting more than 5 lakh slum-dwellers, if we assume that 50 persons can use a toilet seat on a given day. The expenditure incurred on the first phase was Rs22.5, crores or about 100 times what was spent in any preceding year.
Over two phases of the programme, the alliance has constructed 114 toilet blocks, with more than 2,000 toilet seats and more than 500 children’s seats. The programme envisaged the collection of Rs20 per family per month to fund the appointment of a caretaker and for cleaning materials.
Brief theory of change After the intervention of NGOs in the Pune slum, the newly adequate
amount of basic service provision is high-impact. but the affordability of
using toilets is slightly negative
R 17 / A 40
I. Study Details
Authors Cavill, S, Sohail, M
Year 2004
Title Strengthening accountability for urban services
Journal Environment and Urbanization
Source Electronic database

208
II. Study coverage
Basic service Basic services (household connections for water and sewerage, tarmac roads, pit
latrines and standpipes, etc.)
Country Bangladesh, South Africa
Cities Dhaka, Mdantsane
III. Context and intervention
Type of settlement/slum Informal and low-income settlement
Nature of agencies involved in planning and service provision
Government, NGO
Seoul’s metropolitan government, Bristol city council, SITA GB Ltd, Resource Saver (an NGO the operates the kerbside ‘black-box’ recycling collection service under sub-contract) and Community at Heart (a resident-led organisation established to deliver the New Deal for Communities anti-deprivation programme in the area). Local government and community organisation in Mdantsane. Government and NGO in Dhaka government. Dushta Sasthya Kendra, Water Aid, the World Bank, UNICEF and the government utility (DWASA)
Form of user participation
-
Project/intervention funding agency
Local Government
Municipality
ODA
Partnership between Dushta Sasthya Kendra, Water Aid, World Bank, UNICEF and government utility (DWASA)
IV. Research design
Aim of the study The objectives of this paper are to:
• consider contemporary innovations in the way urban services are delivered — the context of accountability;
• define accountability using the existing literature and present current models for accountability;
• discuss how the concept of participatory governance can be operationalised in the context of urban services;
• present initial findings from case studies undertaken in South Africa, Bangladesh, South Korea and the UK; these case studies are used to illustrate different functions of accountability; and
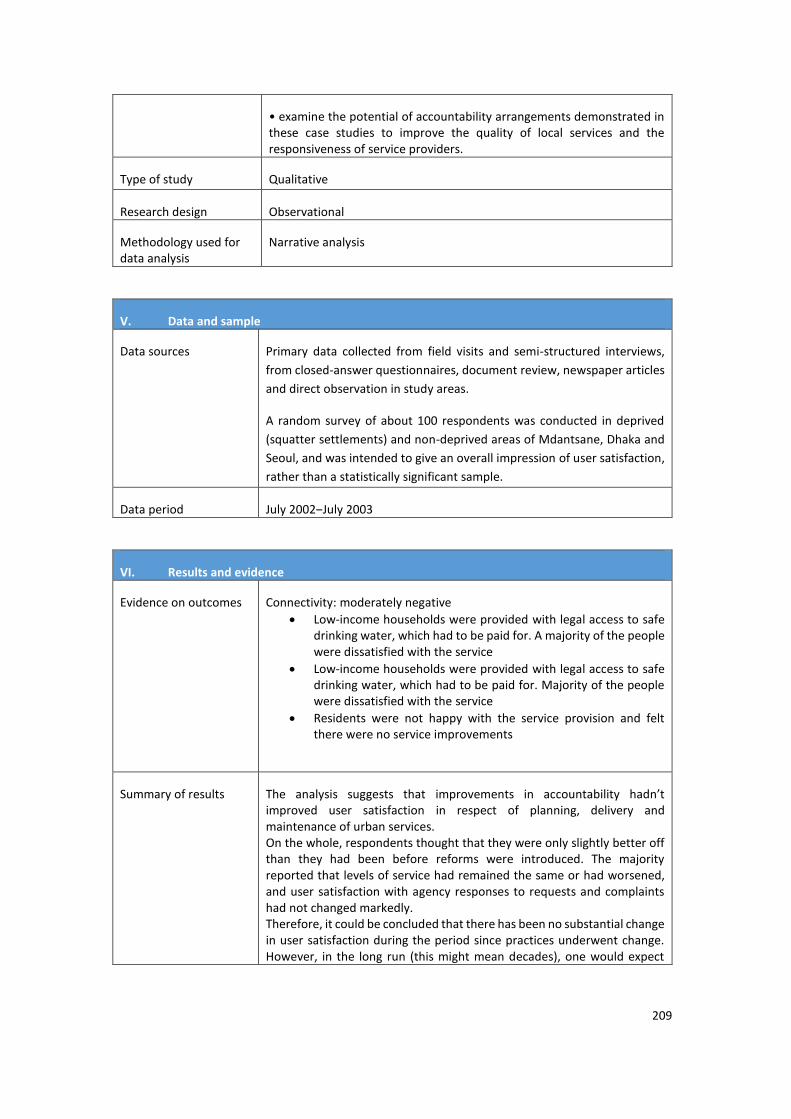
209
• examine the potential of accountability arrangements demonstrated in these case studies to improve the quality of local services and the responsiveness of service providers.
Type of study Qualitative
Research design Observational
Methodology used for data analysis
Narrative analysis
V. Data and sample
Data sources Primary data collected from field visits and semi-structured interviews,
from closed-answer questionnaires, document review, newspaper articles
and direct observation in study areas.
A random survey of about 100 respondents was conducted in deprived
(squatter settlements) and non-deprived areas of Mdantsane, Dhaka and
Seoul, and was intended to give an overall impression of user satisfaction,
rather than a statistically significant sample.
Data period July 2002‒July 2003
VI. Results and evidence
Evidence on outcomes Connectivity: moderately negative
Low-income households were provided with legal access to safe drinking water, which had to be paid for. A majority of the people were dissatisfied with the service
Low-income households were provided with legal access to safe drinking water, which had to be paid for. Majority of the people were dissatisfied with the service
Residents were not happy with the service provision and felt there were no service improvements
Summary of results The analysis suggests that improvements in accountability hadn’t improved user satisfaction in respect of planning, delivery and maintenance of urban services. On the whole, respondents thought that they were only slightly better off than they had been before reforms were introduced. The majority reported that levels of service had remained the same or had worsened, and user satisfaction with agency responses to requests and complaints had not changed markedly. Therefore, it could be concluded that there has been no substantial change in user satisfaction during the period since practices underwent change. However, in the long run (this might mean decades), one would expect

210
participatory accountability mechanisms to lead to improvements in service outcomes and user satisfaction.
Brief theory of change The research found that approaching councillors and voting for
politicians, holding public meetings, protests and organising petitions emerged as the most useful mechanisms for securing accountability.
In particular, users from deprived areas appeared to prefer more participatory mechanisms; that is, those with an indirect influence on service providers, as well as arrangements where residents could sort out problems directly with frontline service providers.
This research suggests that, particularly in deprived areas, service users seldom rely on a single mechanism to produce accountability. It was observed that participation in such attempts depends on a range of factors, including resources, incentives and motivation to improve urban services, the kind of benefits to be gained (personal or common), the nature and location of the services in question, the intensity of concern with services, and the sustainability of the accountability created.
R 18 / D 2
I. Study Details
Authors Clarke, G and Wallsten, S
Year 2002
Title Universal (ly Bad) Service: Providing infrastructure services to rural and poor
urban consumers
Journal World Bank policy research working paper
Source Cross-reference
II. Study coverage
Basic service Water, sanitation and electricity
Country Multiple
Cities Multiple

211
III. Context and intervention
Type of settlement/slum Low-income
Nature of agencies
involved in planning and
service provision
Government
Form of user
participation
-
Project / intervention
funding agency
Government
IV. Research design
Aim of the study Discuss the rationale for universal-access laws and review the different ways in which subsidies can be financed and allocated, along with the implications of those various methods.
To evaluate the historical effectiveness of monopoly enterprises in providing service to the poor and how privatisation has affected coverage.
Type of study Mixed-methods
Research design Observational
Methodology used for
data analysis
Simple percentage analysis
V. Data and sample
Data sources Primary
MEASURE DHS+ Demographic Health Survey
Data period MEASURE DHS+ Demographic Health Survey
VI. Results and evidence
Evidence on outcomes Evidence
Connectivity
Outcome
Moderately negative

212
Access to water
Access to flushable toilet
Access to electricity
Summary of results In low-income countries in Africa, about 80% of urban households headed by an individual with a secondary education had access to electricity; 63% had access to piped water, either in their house or yard; and 38% had a flushable toilet.
In comparison, only 32% of urban households headed by individuals with no education had electricity; 27% had piped water; and only 10% had a flushable toilet.
Although coverage was higher in low-income countries in Latin America, the basic pattern was similar. The differences in coverage were not due to differences in only a few countries. For electricity, piped-water coverage was lower — and, in most cases, much lower — for houses headed by individuals with no education than it was for households headed by individuals with a secondary education or higher, in all low-income countries in Africa and Latin America.
In middle-income countries in Latin America, similar patterns were observed for electricity and flushable toilets, although, on average, urban households headed by individuals with no education were slightly more likely to have access to piped water than urban households headed by individuals with a secondary education or higher. Europe and Central Asia appear to be different, with higher overall coverage in most sectors and less noticeable differences between households the heads of which have different education levels.
Brief theory of change The massive failure of state-monopoly enterprises in providing service to
the poor, except Eastern Europe. Cross-subsidies have often been poorly
directed and have typically failed to reach poor consumers.
R 19 / D 8
I. Study Details
Authors Chowdhury, F and Nurul Amin, A
Year 2006
Title Environmental assessment in slum-improvement programmes: Some evidence
from a study on infrastructure projects in two Dhaka slums
Journal Environmental Impact Assessment Review
Source Cross-reference

213
II. Study coverage
Basic service Sanitation
Country Bangladesh
Cities Dhaka (Bank-Maath and City-Polly)
III. Context and intervention
Type of settlement/slum Slum ‒ formal
Nature of agencies
involved in planning and
service provision
Government and NGO
Form of user
participation
-
Project/intervention
funding agency
Government and NGO
IV. Research design
Aim of the study To address the deteriorated socio-economic and physical environmental
conditions of the slums, the Government of Bangladesh, with the support
of different donor agencies, has initiated different SIPs.
Type of study Mixed-methods
Research design Experimental
Methodology used for
data analysis
Statistical method
V. Data and sample
Data sources Primary survey
on-site observations, questionnaire survey, in-depth discussions with the project stakeholders, conducting interviews with the experts and professionals

214
Data period April 2003
VI. Results and evidence
Evidence on outcomes Evidence
Connectivity
Outcome
Strongly positive, strongly negative
Households’ responses to non-existence of drainage problems
Households’ responses to non-existence of drainage problems
Summary of results Before the implementation of the Supporting Household Activities for Health, Assets and Revenue project (SHAHAR) and SIP, the drainage situation was very poor in both slums. After implementation, drainage has improved in both slums, but the situation seems to have improved greatly in the Bank-Maath slum. Responses of residents of this slum suggest near non-existence of the drainage problem after implementation of this project. The situation, however, did not improve as much in the City-Polly. Indeed, 74% of the respondents from this slum noted the persistence of this problem, even after the implementation of the project. In the Bank-Maath slum, this problem had been solved through a complete and well-designed drainage network. In Chi-2 test results (p value=0.000 and a=0.01) confirms that the number of experiencing this problem in the City-Polly are significantly higher than those in the Bank-Maath slum.
Survey results reveal that the drainage intervention did not improve the wastewater overflow problem in City-Polly. Most of the respondents (83.9%) noted the continuation of the problem after the implementation of the drainage system.
The provision of the drainage system in the Bank-Maath slum has largely solved the wastewater-overflow problem. About 90% of respondents confirm non-persistence of this problem. Consultation with the slum-dwellers in this slum facilitated proper identification of wastewater sources and its drainage. Chi-2 test result (p value=0.000 and a=0.01) on the wastewater-overflow-problem responses in two slums confirms that the problem in the City-Polly is significantly higher than that in the Bank-Maath.
Significant improvement took place in the Bank-Maath slum after the implementation. However, the situation did not improve in City-Polly. In the latter, 81% of respondents reported continuation of the problem. Unsanitary hanging latrines existed in this slum, even after the project’s implementation. It was observed that community latrine pits were located adjacent to the kitchen, some of which were broken, with the consequent possibility of transmission of germs to the food. It was evident from the survey that excreta were overflowing from the filled up pits. This problem has been exacerbated overflow of wastewater and lack of drainage. Chi-2 test result (p value=0.000 and a =0.01)

215
confirms this problem in City-Polly is significantly greater than that in the Bank-Maath slum.
Brief theory of change The Bangladesh slums (Bank-Maath and City-Polly) have seen enormous
changes in the sanitation sector after the intervention of different donors,
such as SHAHAR and USAID.
R 20 / E 7
I. Study Details
Authors Chandrasekhar, S
Year 2005
Title Growth of slums, availability of infrastructure and demographic outcomes in
slums: Evidence from India
Journal Urbanization in Developing Countries at The Population Association of America,
Conference Research Report
Source Google Scholar
II. Study coverage
Basic service Water, sanitation and electricity
Country India
Cities All major Indian cities
III. Context and intervention
Type of settlement/slum Slum — formal and informal
Nature of agencies involved in
planning and service provision
Government
Form of user participation -
Project/intervention funding agency Government

216
IV. Research design
Aim of the study This study aims to analyse the services available in the slums and to
examine the improvements in slum conditions over the last five years
using NSSO data 2002.
Type of study Mixed-methods
Research design Observational
Methodology used for
data analysis
Simple percentage analysis
V. Data and sample
Data sources NSSO Data 2002
Data period July‒December 2002
VI. Results and evidence
Evidence on outcomes Outcome
Connectivity
Evidence
Moderately positive, moderately negative
Provision of improved water supply
Provision of improved electricity service
Provision of improved latrine facilities
Provision of improved drainage facilities
Provision of improved sewerage facilities
Summary of results Nearly 50% of slums reported improvements in latrines, 47% in drainage facilities and 24% in sewerage.
In the context of improvements in respect of drainage and sewerage, the residents were responsible for improvements in nearly 21% and 27%, respectively, of the non-notified slums.
In 84% (71) of the notified (non-notified) slums, the main water source is the tap. However, these numbers mask differences across the states of India. In the state of Bihar, none of the slums gets water via the tap. In Chhattisgarh, Gujarat and Uttar Pradesh, less than 35% of slums receive tap water.
Brief theory of change This study does not propose a theory of change; rather, it discusses the
monopoly of the conventional service provider: that is, the government.
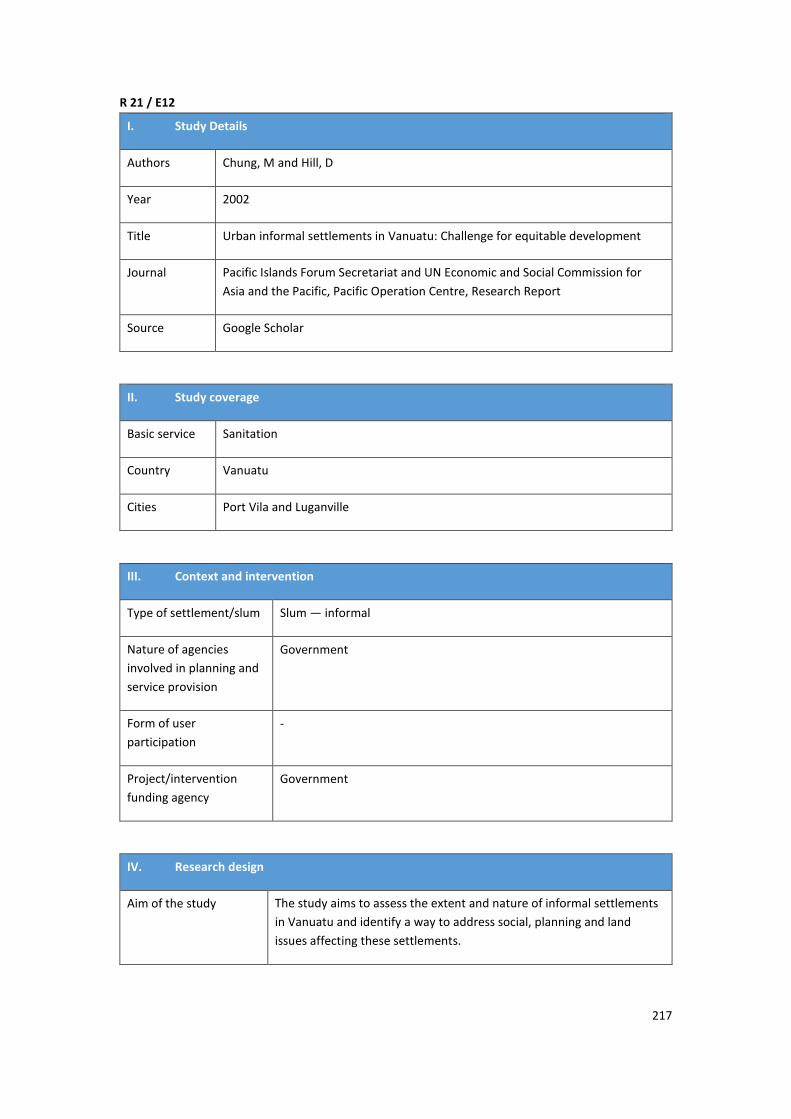
217
R 21 / E12
I. Study Details
Authors Chung, M and Hill, D
Year 2002
Title Urban informal settlements in Vanuatu: Challenge for equitable development
Journal Pacific Islands Forum Secretariat and UN Economic and Social Commission for
Asia and the Pacific, Pacific Operation Centre, Research Report
Source Google Scholar
II. Study coverage
Basic service Sanitation
Country Vanuatu
Cities Port Vila and Luganville
III. Context and intervention
Type of settlement/slum Slum — informal
Nature of agencies
involved in planning and
service provision
Government
Form of user
participation
-
Project/intervention
funding agency
Government
IV. Research design
Aim of the study The study aims to assess the extent and nature of informal settlements
in Vanuatu and identify a way to address social, planning and land
issues affecting these settlements.

218
Type of study Mixed-methods
Research design Observational method
Methodology used for
data analysis
Simple descriptive analysis
V. Data and sample
Data sources Household-questionnaire-survey method
Data period 1999
VI. Results and evidence
Evidence on outcomes Outcome
Connectivity
Evidence
Moderately negative
Improved sanitary and drainage access
Summary of results Informal settlements depend on pit toilets.
Responsibility for sanitation lies with individual property owners, and there is no urban service provider for sanitation, with the exception of septic tank pump-out services. Most of the urban area relies upon site-based disposal via septic tanks.
Brief theory of change There is no valid theory of change employed in this study.
R 22 / A41
I. Study Details
Authors Chauhan, U and Lal, N
Year 1999
Title Public-Private Partnerships for Urban Poor in Ahmedabad: A Slum Project
Journal Economic and Political Weekly

219
Source Electronic database
II. Study coverage
Basic service Water, sanitation and electricity
Country India
Cities Ahmadabad
III. Context and intervention
Type of settlement/slum Informal settlements
Nature of agencies
involved in planning and
service provision
Government-Ahmadabad Municipal Corporation (AMC)
NGO-SAATH
Corporate Sector-Arvind Mills
Form of user
participation
Participation through contribution
Project/intervention
funding agency
SEWA Bank (loan)
IV. Research design
Aim of the study There are three objectives of this paper.
To establish the factors that impeade PPPs.
To examine the reasons behind the tardy progress of the central and state governments in providing housing and employment to the urban poor.
To establish an argument for the corporate sector’s working with government organisations and NGOs to delelop services for the urban poor.
Type of study Qualitative
Research design Observational

220
Methodology used for
data analysis
Narrative analysis
V. Data and sample
Data sources Primary data-survey method
Data period Not clearly mentioned
VI. Results and evidence
Evidence on outcomes Connectivity: moderately positive
Individual water-supply lines as well as community-level water supply lines were provided to approximately 200 households
All the houses were provided with an in-house toilet
Sewerage and storm-water drains were provided to the community
Residents obtain individual power connections
Adequacy: moderately positive
70% of water needs are met between 6am and 8am; water pressure in the mains is well maintained and individual connections ensure the volume of water supplied is adequate. No complaints were received about the quantity of water supplied.
Previously, there were only three toilet blocks, which were shared by the entire community. After this project, every house had an individual toilet.
Durability: moderately positive
Choice of materials and engineering techniques considerably reduced the cost of the infrastructure. A local resident-welfare association was formed to look after the maintenance of the infrastructure created. Once the infrastructure was in operation, it withstood a monsoon, during which there was no waterlogging or blockage of sewerage mains within the community.
Effort and time: moderately positive
Household time spent on water collection is less than an hour, far less than prior to the slum-networking project, where there were only three public stand-posts for the entire community.
Previously, there were only three toilet blocks, which were shared by the entire community. After this project, every house had an individual toilet.
Summary of results Successes of the project

221
An adequate quantity of water was supplied to each household. Seventy percent of the water was supplied in the morning. Water pressure was equal in each household during the supply time.
With no compromise in terms of quality or performance, the choice of materials and engineering techniques employed in slum networking brings down the cost of infrastructure considerably, in comparison to conventional materials and techniques used by most government/quasi-government bodies.
The project stayed within the budget estimate for on-site infrastructure.
Failure of the project
Despite these efforts, there were three major failures of the project. The first was a delay in completing the pilot project.
The second is that very little was achieved in terms of community development.
The third failure is the organisations' inability to seek industry's participation in the citywide slum-networking project.
Brief theory of change The unique strength of the government is its mandate from civil society and the large infrastructure already in place. In such projects, the government should play the role of ‘facilitator’. This means, besides co-financing the project, giving all necessary approvals, information and other support to the lead agency.
The unique strength of NGOs is their ability to communicate effectively with the poor. Their role should be to work with the community to facilitate the physical-upgrading work, as well as manage the community-based health and education components.
An alliance is meaningless unless each functionary understands his/her respective role in the alliance. Frequently, the leadership conceives and negotiates alliances and delegates their day-to-day management to lower-level supervisors — ‘the troops in the trenches’. It is these troops in the trenches that are usually responsible for the failure of alliances.
Lack of shared values in the organisation is the root cause of the problems.
The NGO was, from the very beginning, wary of the alliance with the corporate partner, fearing ‘big-brother’ syndrome.
The slum-networking project at Sanjay Nagar is a small step towards mobilising this ‘pull factor’ among low-income communities in Ahmadabad.
222
R 23 / A 36
I. Study Details
Authors Connors, G
Year 2005
Title When utilities muddle through: Pro-poor governance in Bangalore's public water
sector
Journal Environment and Urbanization
Source Electronic database
II. Study coverage
Basic service Water and sanitation (water connection)
Country India
Cities Bangalore
III. Context and intervention
Type of settlement/slum Both formal and informal
Nature of agencies
involved in planning and
service provision
Government: Bangalore Water Supply and Sewerage Board (BWSSB)
AusAID: In 2000, the Australian aid agency began a large project to
provide the BWSSB with a comprehensive master-plan for the city’s
future water and sewerage network
Form of user
participation
-
Project/intervention
funding agency
Government: Bangalore Water Supply and Sewerage Board (BWSSB)
AusAID

223
IV. Research design
Aim of the study The aim of this paper is:
To show how messy and slow paths to reform can have useful lessons for public-sector water utilities in developing countries, most of which continue to operate by ‘muddling through’.
This paper also analyses the shifts in policy and operations behind the BWSSB’s innovative work to connect the city’s slum-dwellers to the piped-water supply, using the case of the BWSSB.
Rather than routinely criticise public utilities for their failure to reach the poor, this paper argues that local successes that start small and are slow to diffuse should be recognised and disseminated across organisations.
Type of study Qualitative
Research design Observational
Methodology used for
data analysis
Narrative-analysis case study
V. Data and sample
Data sources Secondary data: Census data (2001), AusAID survey (2000), Karnataka
slum-clearance board (1999), local NGO survey
Data period 1991,1999, 2000, 2001 (Data period is not in the order)
VI. Results and evidence
Evidence on outcomes Connectivity: moderately positive
Access to individual and shared meter connections
Access to communal toilets and drainage
Access to sewerage network and drains
Affordability: moderately positive
Connection fees were significantly reduced for slum connections with street-level infrastructure cost borne by AusAID. Community members had to bear only minor plumbing charges and cost for connecting to the street-level mains. Community members pay a monthly user-charge of Rs115 for individual connections and Rs. 20‒30 for shared connections.
Durability: Moderately positive

224
A local water and sanitation committee is established to oversee the
maintenance of the infrastructure created.
Summary of results Since 2000 there has been a change in the BWSSB’s approach to slums.
First, three excellent pilot projects, funded by a large donor programme, demonstrated that water could be piped to slums legally, that residents were willing to pay for household connections and water supply, that the traditional stumbling block of insecure tenure status could be managed, and that systems could be designed to meet the needs of specific typologies of tenure and density.
Second, a decision made by the BMP to end funding for public taps forced acceptance at the BWSSB that it would, over time, have to shut down all public taps, a politically impossible solution.
Third, the legislative and executive branches of the BMP agreed to pay, as a lump-sum contract, for the complete extension of the BWSSB’s piped network to the city’s new and partially added wards, in view of its responsibility to fund basic infrastructure within municipal boundaries. Slums previously on the periphery of municipal awareness would suddenly have the opportunity to connect to the network, and the BWSSB could expect either a surge in illegal connections or the possibility of more revenue.
Brief theory of change For the first time, slums are being serviced as a distinct category by the water utility, and new working relationships are being forged between the utility, NGOs and residents, as they learn to cooperate with each other.
Although Bangalore’s new water-governance patterns are not altogether ‘good’, in the sense of being inclusive, accountable, transparent and predictable, they are moving in the right direction.
R 24 / B 19
I. Study Details
Authors Das, A
Year 2012
Title End of project evaluation of Madhya Pradesh urban services for the poor
programme (MPUSP)
Journal DFID Report
Source Website search

225
II. Study coverage
Basic service Water, sanitation and electricity
Country India
Cities Bhopal, Indore, Jabalpur, Indore
III. Context and intervention
Type of settlement/slum Slum — informal
Nature of agencies
involved in planning and
service provision
Others
(DFID)
Form of user
participation
Contribution
Project/intervention
funding agency
DFID
IV. Research design
Aim of the study To evaluate the eventual programme goal for MPUSP of achieving
sustainable poverty reduction and economic growth in urban areas in
Madhya Pradesh.
Type of study Quantitative
Research design Quasi-experimental
Methodology used for
data analysis
V. Data and sample
Data sources Primary and secondary data
Household survey, FGDs
Municipalities’ annual review reports
Data period 2006
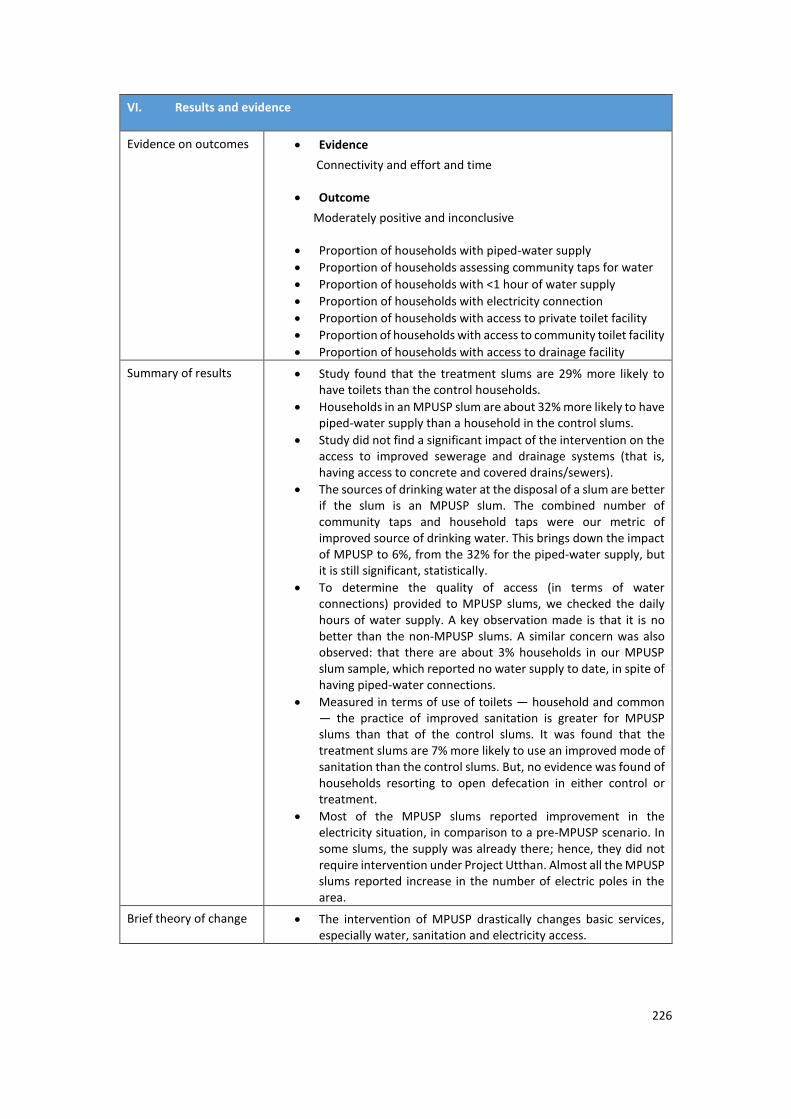
226
VI. Results and evidence
Evidence on outcomes Evidence
Connectivity and effort and time
Outcome
Moderately positive and inconclusive
Proportion of households with piped-water supply
Proportion of households assessing community taps for water
Proportion of households with <1 hour of water supply
Proportion of households with electricity connection
Proportion of households with access to private toilet facility
Proportion of households with access to community toilet facility
Proportion of households with access to drainage facility
Summary of results Study found that the treatment slums are 29% more likely to have toilets than the control households.
Households in an MPUSP slum are about 32% more likely to have piped-water supply than a household in the control slums.
Study did not find a significant impact of the intervention on the access to improved sewerage and drainage systems (that is, having access to concrete and covered drains/sewers).
The sources of drinking water at the disposal of a slum are better if the slum is an MPUSP slum. The combined number of community taps and household taps were our metric of improved source of drinking water. This brings down the impact of MPUSP to 6%, from the 32% for the piped-water supply, but it is still significant, statistically.
To determine the quality of access (in terms of water connections) provided to MPUSP slums, we checked the daily hours of water supply. A key observation made is that it is no better than the non-MPUSP slums. A similar concern was also observed: that there are about 3% households in our MPUSP slum sample, which reported no water supply to date, in spite of having piped-water connections.
Measured in terms of use of toilets — household and common — the practice of improved sanitation is greater for MPUSP slums than that of the control slums. It was found that the treatment slums are 7% more likely to use an improved mode of sanitation than the control slums. But, no evidence was found of households resorting to open defecation in either control or treatment.
Most of the MPUSP slums reported improvement in the electricity situation, in comparison to a pre-MPUSP scenario. In some slums, the supply was already there; hence, they did not require intervention under Project Utthan. Almost all the MPUSP slums reported increase in the number of electric poles in the area.
Brief theory of change The intervention of MPUSP drastically changes basic services, especially water, sanitation and electricity access.
227
R 25 / B 18
I. Study Details
Authors Das, M
Year 2011
Title End-term impact assessment of the Kolkata urban services for the poor
programme
Journal DFID Report
Source Website search
II. Study coverage
Basic service Water and sanitation
Country India
Cities Kolkata
III. Context and intervention
Type of settlement/slum Slum — informal
Nature of agencies
involved in planning and
service provision
NGO
Form of user
participation
Partnership
Project/intervention
funding agency
NGO
IV. Research design
Aim of the study Evaluate the intended and unintended impacts of key Kampala Urban Sanitation Project (KUSP) Programme components and assess whether they have reached targeted beneficiaries
Assess the sustainability of reforms initiated under the KUSP Programme

228
Determine cost effectiveness (and value for money, VfM) of the programmatic approach taken under the KUSP Programme
Provide lessons learned and recommendations for other ongoing or planned DFID urban programmes
Type of study Quantitative
Research design Observational
Methodology used for
data analysis
Simple percentage analysis
V. Data and sample
Data sources Primary and secondary data
Data period 2005
VI. Results and evidence
Evidence on outcomes Evidence
Connectivity
Outcome
Moderately positive and moderately negative
Proportion of households with individual piped-water connection
Proportion of households with access to public taps
Proportion of households with individual toilet facility
Proportion of households with access to community toilet facility
Summary of results Significant improvement has been reported in access to physical infrastructure from KUSP slums. The same slums suggest an improvement in water supply to the tune of 30%, in sanitation around 13%, in drainage around 72%, and in access to road around 57%. Also, these improvements have been 3‒6 percentage points greater than the non-KUSP-programme slums. Consequently, about 95% of the respondents from KUSP slums report access to water supply through individual pipe connections or street taps, compared to 86% in non-KUSP slums. Similarly, the case has been with sanitation (with increase in community toilets), drainage with more respondents having access to Pucca drains.
About 73% of the respondents from KUSP slums are satisfied with the current mechanism of meeting the D&M cost for basic services. When individual services, such as water supply, sanitation and drainage, are taken into account separately, the proportion of KUSP-slum respondents who perceive an

229
improvement in D&M and service quality ranges from 82% to 93%. However, the current D&M mechanism, as reported by the respondents in KUSP-programme slums for water supply, sanitation and drainage suggests a large proportion are dependent upon urban local bodies (ULB), with 67% in the case of water supply, 25% in the case of sanitation and 99%in the case of drainage. D&M mechanisms adopted in non-KUSP slums are very similar to that used in KUSP slums.
Brief theory of change After the KUSP-programme intervention, there is a high level of
improvement in community tap water and community toilet facilities.
Individual water-tap connections and individual toilet facilities are not
increasing at the same rate as the community facilities.
R 26 / E 13
I. Study Details
Authors Das, K
Year 2009
Title Agency and Access under Decentralized Governance: Water Supply and
Sanitation in Kolkata City
Journal Gujarat Institute of Development Research
Source Google Scholar
II. Study coverage
Basic service Water and sanitation
Country India
Cities Kolkata
III. Context and intervention
Type of settlement/slum Low-income
Nature of agencies
involved in planning and
service provision
Government
Kolkata Municipal Corporation

230
Form of user
participation
-
Project/intervention
funding agency
ODA
ADB assisted Kolkata Environment Improvement Programme (KIEP)
IV. Research design
Aim of the study This paper discusses the issues for agencies in providing access to basic
services, such as drinking water and sanitation in the bustling eastern
Indian city of Kolkata.
Type of study Qualitative
Research design Observational
Methodology used for
data analysis
Narrative analysis
V. Data and sample
Data sources Primary data
Secondary data
This paper discusses the issues for agencies in providing access of basic services in the Kolkata Municipal Corporation (KMC), drawing upon both secondary sources and a primary survey in four wards in the city.
Data period Not clearly mentioned
VI. Results and evidence
Evidence on outcomes Connectivity: moderately negative
15‒20% of residents in slum areas did not have tap connections in their homes, whereas almost all residents living in upper-middle-class households had in-house connections.
While most residents had some form of in-house toilet, about 10% of slum-residents resorted to open defecation. The situation of sewerage was also deplorable, with drain pipes overflowing, especially during monsoons. However, the high-income-area residents had in-house toilets. and the drains in these areas were covered and cleaned once every two months.

231
Adequacy: moderately negative
Water was available only twice a day, for about three hours in the morning and evening, whereas affluent areas received continuous supply for 8‒10 hours a day. Public stand pipes in low-income slum areas were not in good condition and water supply was very erratic.
Summary of results The residents, notwithstanding lapses in services and inadequate/ unsatisfactory responses from the elected representatives and KMC functionaries, did value the system of democratic decentralisation.
This, in any case, provided ample space for popular participation in the process of governance through expressing their opinions publicly regarding basic service provisioning/maintenance.
Brief theory of change Two specific observations are made :
First, while residents from poorer (or, relatively disadvantaged in terms of services) localities insisted on a more accountable/attentive/(even ‘punishable’!) agency, those from well-off areas looked forward to a ‘modernised’ and ‘friendly’ governance structure.
Second, there was only a fragile case for privatising services. In a substantive sense, these observations from the field defy the much-hyped neo-liberal prescription of ensuring good governance of cities through privatising basic services. In a substantive sense, these observations from the field indicate that there are deeper structural issues of legal status and opportunities to improve the livelihood of the urban poor.
Those are the persisting problems that require a different kind of intervention, preferably mediated through a democratically accepted governance system.
R 27 / A 7
I. Study Details
Authors Daniere, A and Takahashi, L
Year 1999
Title Poverty and access: Differences and commonalities across slum communities in
Bangkok
Journal Habitat International
Source Electronic database
II. Study coverage
Basic service Water

232
Country Thailand
Cities Bangkok
III. Context and intervention
Type of settlement/slum Slum
Nature of agencies
involved in planning and
service provision
Government
Form of user
participation
-
Project/intervention
funding agency
Government
IV. Research design
Aim of the study To work towards a classification of the notion of access, particularly as it relates to basic services among the urban poor.
To illustrate how this framework can be used to assess access in large cities in developing countries, such as Bangkok.
Type of study Quantitative
Research design Quasi-experimental
Methodology used for
data analysis
Statistical method
Chi-square test
V. Data and sample
Data sources Primary data
Surveyed 540 households in slum or squatter settlements located within Bangkok Metropolitan Region. In 25 slums/squatter settlements selected for survey in three municipal zones, inner (224), middle (246) and outer (50) sample data were collected.
Questionnaire survey method
Data period February and March 1994

233
VI. Results and evidence
Evidence on outcomes Connectivity: moderately positive
Summary of results 24.6% of inner-city household use bottled water for drinking, which is high, especially compared to residents in the outer areas. The outer zone’s recently settled area and this zone’s communities, which have much lower community access to piped municipal water, rely primarily on local wells for water and are much less likely to buy bottled drinking water (only 12.8%), and much more likely to drink untreated water.
Access to piped water is 66.7% in the lowest income grouping, which is a higher connection rate than in any other income group. The lowest reported access to piped-water connections is found in communities of middle-income groups, which are slum communities with much higher incomes, followed by the highest income-group community, with a piped-water connection rate of 48.7%.
High-income-group households spend less than 2% of their total household income on water, while the poorest group spends 4.33% of their income on water.
The study found that slums in the middle zone have better access to individual piped-water connections than do slums in the outer suburbs of the city. Access to piped water is limited in the outer zone, because the residents rely on water from privately developed wells, resulting in lower water prices.
Brief theory of change The somewhat unexpected policy implications gleaned from the analysis illustrate the importance of a comprehensive understanding of access issues prior to the development of policy.
This is important, not only because it allows one to distinguish between actual policy-choice instruments (such as increasing or lowering the price of services) and induced behaviour (such as buying of bottled water for drinking purposes), but also because it permits a better understanding of the relationship between different policies and how they might be used to reinforce or support one another.
From a larger planning perspective, the challenge of providing adequate and appropriate levels of basic services, from either private or public sources, revolves around fundamental issues of supply and demand, and their interaction. Demand among users and potential users, in particular, seems particularly poorly understood in terms of its importance to the actual design and implementation of basic services, suggesting that this is an area of research deserving of more extensive analysis.

234
R 28 / A56
I. Study Details
Authors Devas, N and Korboe, D
Year 2000
Title City governance and poverty: The case of Kumasi
Journal Environment and Urbanization
Source Electronic database
II. Study coverage
Basic service Water and sanitation
Country Ghana
Cities Kumasi
III. Context and intervention
Type of settlement/slum Informal settlement
Nature of agencies
involved in planning and
service provision
Government
Ghana Water and Sewerage Corporation provide the service. The Kumasi Metropolitan Assembly (KMA), the local government, provided counterpart contribution to the donor fund.
Form of user
participation
-
Project/intervention
funding agency
ODA
DFID-funded project to improve access to water for low-income settlements.
CIDA, UNDP and World Bank have funded improvements in urban sanitation.
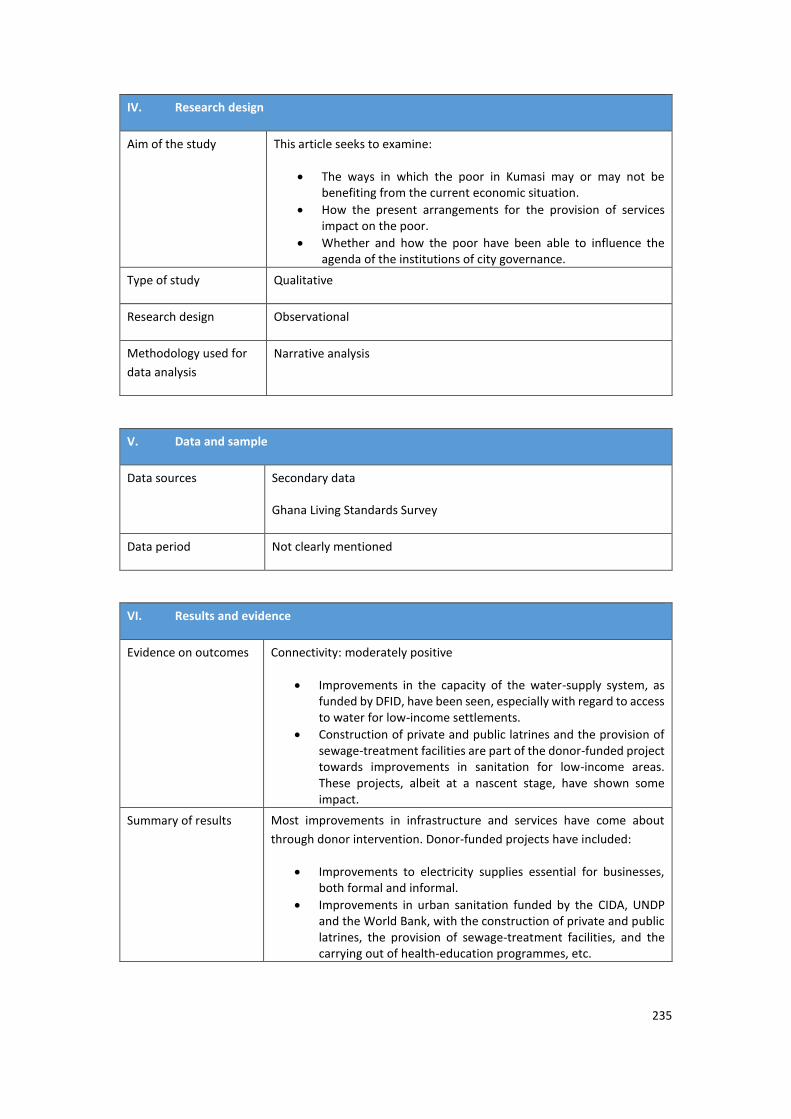
235
IV. Research design
Aim of the study This article seeks to examine:
The ways in which the poor in Kumasi may or may not be benefiting from the current economic situation.
How the present arrangements for the provision of services impact on the poor.
Whether and how the poor have been able to influence the agenda of the institutions of city governance.
Type of study Qualitative
Research design Observational
Methodology used for
data analysis
Narrative analysis
V. Data and sample
Data sources Secondary data
Ghana Living Standards Survey
Data period Not clearly mentioned
VI. Results and evidence
Evidence on outcomes Connectivity: moderately positive
Improvements in the capacity of the water-supply system, as funded by DFID, have been seen, especially with regard to access to water for low-income settlements.
Construction of private and public latrines and the provision of sewage-treatment facilities are part of the donor-funded project towards improvements in sanitation for low-income areas. These projects, albeit at a nascent stage, have shown some impact.
Summary of results Most improvements in infrastructure and services have come about
through donor intervention. Donor-funded projects have included:
Improvements to electricity supplies essential for businesses, both formal and informal.
Improvements in urban sanitation funded by the CIDA, UNDP and the World Bank, with the construction of private and public latrines, the provision of sewage-treatment facilities, and the carrying out of health-education programmes, etc.

236
Increases in the capacity of the water-supply system, funded by DFID.
The current programme to improve access to water for low-income settlements.
Brief theory of change Despite some improvement in the national economy, the position of the poor has not really been improved and may have worsened in recent years. In this, Kumasi’s city government, KMA, must share part of the blame.
The process of decentralisation in Ghana, begun a decade ago, remains incomplete. Central ministries have been reluctant to decentralise sectorial programmes and many of the services on which the poor depend are outside the control of local government. Cost-recovery policies for some of these services have made access for the poor more difficult.
Those essential services for which KMA is responsible — sanitation, waste disposal, drainage, environmental health — remain woefully inadequate. In terms of accountability to the consumers of the services, and particularly to the urban poor, who are often not served at all, the lines of political accountability are weak.
R 29 / A 20
I. Study Details
Authors Aguilar, M and De Fuentes, A
Year 2007
Title Barriers to achieving the water and sanitation-related Millennium Development
Goals in Cancún, Mexico, at the beginning of the twenty-first century
Journal Environment and Urbanization
Source Electronic database
II. Study coverage
Basic service Water and sanitation
Country Mexico
Cities Cancún

237
III. Context and intervention
Type of settlement/slum Informal settlement
Nature of agencies
involved in planning and
service provision
Water
Provision of access to piped water
Sanitation-Others/User involvement
Provision of sewerage connection
Construction of septic tank
Form of user
participation
Sanitation
User involvement: participation through self-mobilisation
Project/intervention
funding agency
Private sector
Private company
IV. Research design
Aim of the study This paper discusses some of the barriers faced by the city of Cancún, Mexico, to making progress towards MDG targets on extending safe water and basic sanitation.
It analyses the socio-economic, political, demographic, environmental and land-use dimensions of problems of access to safe drinking water and improved sanitation services in the city.
Type of study Mixed-methods
Research design Observational
Methodology used for
data analysis
Qualitative and quantitative
V. Data and sample
Data sources Primary data
Qualitative and quantitative data collected included both historical and recent information on urban development and the use and management of drinking-water supply.
Data period The dates of the recent data used vary between 2000 and 2003

238
VI. Results and evidence
Evidence on outcomes Water: connectivity: inconclusive
Access to piped-water connection
Sanitation: connectivity: moderately negative
Access to sewerage system
Access to self-constructed septic tank
Summary of results In 2003 Cancún had a public sewerage network that potentially could serve 77%of its population, yet only 44%of its inhabitants had effective connections to the system.
More importantly, only the residents of the hotel zone and the majority of those living in the city centre had access to the system, and only the hotel zone had what this paper defines as an ‘improved sanitation service’.
When comparing the level of access to sewerage in Cancún (44 %) with the average for urban areas in Mexico for 2000 (75%), the extent of provision in the city is clearly very poor.
However, if the coverage of infrastructure is considered instead (77%), then Cancún comes slightly above the national average. These potentially misleading statistics have impeded the municipal government’s recognition of the true extent of deficiencies in sewerage provision in the city.
The coverage of piped water in the city as a whole is good (97%) (29) and is above the average for urban areas in Mexico in 2000 (93%). However, the capacity of the water-supply infrastructure is inadequate and water services throughout the city are intermittent, with the exception of the hotel zone.
Brief theory of change The following barriers to sustainable development in Cancun that relate
to safe water and improved sanitation services continue to have a
negative impact on social and economic development in the city and its
region:
The socio-economic disparity and inequity produced by market forces, which is reinforced by government policies. In this way, the tourists and the richest areas of the city are provided with subsidised services and have free access to resources, while the poorest have either inadequate, improvised or disproportionately expensive basic services, or no access to services whatsoever.
The failure, for political and economic reasons, to enforce the State Drinking Water and Sanitation Law.
The lack of concern shown by social actors to aquifer contamination. However, there are some NGOs that strive for natural-resources conservation in the city, despite the low level of social organisation that is characteristic of most parts of Mexico.

239
R 30 / A30
I. Study Details
Authors Dube, I
Year 2003
Title Impact of energy subsidies on energy consumption and supply in
Zimbabwe. Do the urban poor really benefit?
Journal Energy Policy
Source Electronic database
II. Study coverage
Basic service Electricity
Country Zimbabwe
Cities Three cities
III. Context and intervention
Type of settlement/slum Low-income
Nature of agencies
involved in planning and
service provision
Government
Provision of electricity services
Form of user
participation
Project/intervention
funding agency
State government
IV. Research design
Aim of the study The objective of this paper is to ascertain the extent to which the poor urban households could afford the cost of electricity, with or without subsidies. This gives an indication of whether, contrary to current thinking, subsidies are decisive for the affordability of electricity by urban households.

240
The paper also examines the distribution of the subsidies across the different urban-household income categories and other economic sectors.
Type of study Quantitative
Research design Observational
Methodology used for
data analysis
Quantitative
V. Data and sample
Data sources Primary data
The survey sample was across all income groups and households deriving their incomes from different sources; for example, salary, informal sector, etc. The survey also took into consideration the gender aspect of energy use by targeting both male- and female-headed households. In total, 128 households were covered by the survey in the three cities.
Secondary data
Based on the poverty datum lines provided by the Central Statistics Office, the households were classified in different poverty categories, namely, non-poor and poor households. The urban-poor households were further divided into moderately poor and extremely poor households.
Data period Not clearly mentioned
VI. Results and evidence
Evidence on outcomes Connectivity: moderately positive
Proportion of households with access to electricity connection
Affordability: inconclusive
The amount of money paid for electricity cost without subsidy
Summary of results It can then be concluded that there is a differential ability to pay for electricity by different household-income categories.
Available evidence from the study indicates that a larger proportion of urban-poor income is devoted to energy expenditure than that of non-poor urban households.
In addition, the energy costs incurred by the poor on non-electrical energy sources could cover the current subsidised electricity costs.
Urban households are currently paying much more for kerosene than the stipulated subsidised price. This means that subsidies

241
are not decisive for the affordability of energy to kerosene users. The impact of the removal of subsidies on the current pricing could not be ascertained, since there is a possibility that the middleman benefiting from the subsidy could increase their prices to compensate for the reduction in profit margins due to subsidies.
The existence of electricity subsidies is also not decisive for the affordability of electricity to the urban household, but the removal of such subsidies will impact more negatively on the most vulnerable groups than the affluent groups.
Brief theory of change This finding shows that the poor spend more of their incomes on electricity than the non-poor. However, the energy cost of electricity, compared to the income of the moderately poor, is comparable to that of the non-poor. This means that, even among the poor urban households there is a differential ability to pay for energy.
Twenty percent of Zimbabwe’s urban poor households are still to be connected to the grid. The majority of these households are poor. There are several reasons why the Zimbabwe urban poor are still not connected to the grid, the most important being the low level of household incomes and the cost of different sources of energy. In order to facilitate wider usage of electricity by the poor, policymakers have introduced a subsidy policy.
R 31 / A18
I. Study Details
Authors Edelman, B and Mitra, A
Year 2006
Title Slum-dwellers’ access to basic amenities: The role of political contact, its
determinants and adverse effects
Journal RURDS
Source Electronic database
II. Study coverage
Basic service Water and sanitation
Country India
Cities New Delhi
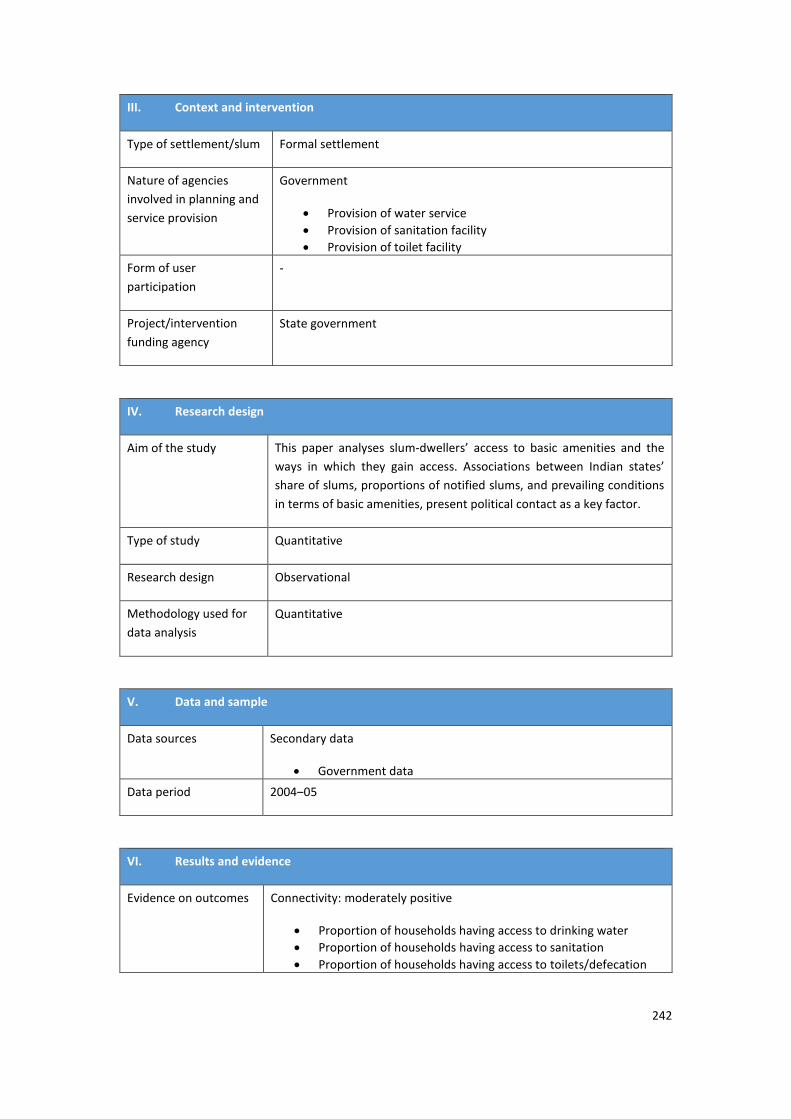
242
III. Context and intervention
Type of settlement/slum Formal settlement
Nature of agencies
involved in planning and
service provision
Government
Provision of water service
Provision of sanitation facility
Provision of toilet facility
Form of user
participation
-
Project/intervention
funding agency
State government
IV. Research design
Aim of the study This paper analyses slum-dwellers’ access to basic amenities and the
ways in which they gain access. Associations between Indian states’
share of slums, proportions of notified slums, and prevailing conditions
in terms of basic amenities, present political contact as a key factor.
Type of study Quantitative
Research design Observational
Methodology used for
data analysis
Quantitative
V. Data and sample
Data sources Secondary data
Government data
Data period 2004‒05
VI. Results and evidence
Evidence on outcomes Connectivity: moderately positive
Proportion of households having access to drinking water
Proportion of households having access to sanitation
Proportion of households having access to toilets/defecation

243
Summary of results Positive correlations between states’ shares in aggregate slums and slum conditions imply that states with more slums have better slum conditions, perhaps because larger slum populations draw the attention of more interested politicians.
Correlations between states’ proportions of notified slums to total slums, a proxy for slum-dwellers’ political contact, and the prevailing conditions in slums confirm a positive relationship between political contact and access to amenities.
Brief theory of change The survey data also position direct evidence in favour of this. However, other households, although limited in number, demonstrate a gain in access to these facilities, even without any political contact.
Relating to the question of what determines the slum-dwellers’ decision to participate in the political process, estimates of the binomial-logit model elicit some interesting results.
With a rise in the duration of migration, the degree of reliance on political support increases, the probability being the highest among the natives and political contact confers short-term benefits upon slum-dwellers in terms of access to basic amenities, although without genuine concern for their upward mobility. The other important determinants of increased political contact include level of education (higher), sex (male) of head of household and the lack of social contact with colleagues or employers and relatives.
R 32 / B1
I. Study Details
Authors Field, E
Year 2005
Title Property rights and investment in urban slums
Journal Journal of the European Economic Association
Source Website search
II. Study coverage
Basic service Electricity
Country Peru
Cities Not mentioned

244
III. Context and intervention
Type of settlement/slum Low-income
Nature of agencies
involved in planning and
service provision
Government
Form of user
participation
-
Project/intervention
funding agency
Government
IV. Research design
Aim of the study To examine the impact of a nation-wide titling program in Peru, in
which 1.2m property titles were distributed to urban squatters on
public land.
Type of study Quantitative method
Research design Experimental method
Methodology used for
data analysis
Simple percentage analysis and regression analysis
V. Data and sample
Data sources Primary data
Data period May 2000
VI. Results and evidence
Evidence on outcomes Evidence Connectivity
Outcome Moderately positive
Households receive electricity connection
Summary of results A comparison between households in early and late neighbourhoods reveals few differences in observable household characteristics unrelated to housing. Meanwhile, the

245
fraction of households undertaking home improvements over the past two years is 50% higher in titled neighbourhoods. The comparison between programme beneficiaries and non-beneficiaries suggests that the difference in investment does not reflect neighbourhood-level variation. While there are notable differences in household characteristics between comparisons between treatment households and both control groups indicate approximately the same difference in post-programme investment.
In the household characteristics, access to electricity beneficiaries in programme neighbourhoods rises from 93% to 96%.
Brief theory of change Intervention of nationwide titling programme in Peru, in which
1.2mproperty titles were distributed to urban squatters on public land;
household characteristics show access to electricity beneficiaries in
programme neighbourhoods receive a high level of positive impact.
R 33 / B 2
I. Study Details
Authors Field, E
Year 2004
Title Property rights, community public goods, and household time allocation
in urban squatter communities: Evidence from Peru
Journal William & Mary Law Review
Source Website search
II. Study coverage
Basic service Water and electricity
Country Peru
Cities Lima
III. Context and intervention
Type of settlement/slum Slum — informal

246
Nature of agencies
involved in planning and
service provision
Government and NGOs
Form of user
participation
-
Project/intervention
funding agency
Government and NGOs
IV. Research design
Aim of the study This study examines whether improvements in tenure security that result
from giving property titles to urban squatters in Peru influence on the
households access the valuable property of basic services, such as
electricity and water connection.
Type of study Mixed-methods
Research design Observation
Methodology used for
data analysis
V. Data and sample
Data sources Primary data
Data period March 2000
VI. Results and evidence
Evidence on outcomes Evidence Connectivity
Outcome Moderately positive
Average households with municipal water supply
Average households with electricity supply
Summary of results Study indicates that there is variation in some demographic characteristics across programme and non-programme regions. Sample households in programme areas, on average, have smaller dwellings (fewer rooms), are more likely to have electricity, and have higher nativity rates (percentage of

247
members born in the province). Although statistically significant differences exist across programme and non-programme areas, no statistically significant differences in difference (DID) is observed between squatters and non-squatters in programme and non-programme areas. This finding supports the use of non-squatters as a comparison group.
Land and property governance — including reallocation of land, neighbourhood security and (informal) titling — and projects related to public utilities and infrastructure provision. A dramatic difference in the presence of titling and land-allocation-related organisations, as well as significantly fewer infrastructure-related neighbourhood groups. These data provide evidence that land formalisation indeed shifts key institutional responsibilities away from local communities, as well as local households.
Household participation hours in neighbourhood groups. More striking is the fact that early- and late-programme neighbourhoods report approximately near- identical frequency of neighbourhood organisations before the programme is implemented, as evidenced by a comparison. This pattern strengthens support for a causal interpretation of land titling and neighbourhood public-goods provision.
Brief theory of change The Peruvian government and the NGO embarked on an innovative
property-titling project intervention that has a high impact on water
supply and electricity connection for the slum-dwellers.
R 34 / D 7
I. Study Details
Authors Foster, V and Araujo, M
Year 2004
Title Does infrastructure reform work for the poor? A case study from Guatemala
Journal Word Bank Policy Research working paper
Source Cross-reference
II. Study coverage
Basic service Water, sanitation and electricity
Country Guatemala
Cities Guatemala

248
III. Context and intervention
Type of settlement/slum Slum — informal
Nature of agencies
involved in planning and
service provision
Government
Form of user
participation
-
Project/intervention
funding agency
Government
IV. Research design
Aim of the study This paper explores how the important policy changes experienced in
the utilities sector in Guatemala since the Peace Accords have affected
the lives of poor households.
Type of study Quantitative
Research design Observational
Methodology used for
data analysis
Simple percentage analysis
V. Data and sample
Data sources Secondary data
Data period 2000
VI. Results and evidence
Evidence on outcomes Evidence
Connectivity, affordability, adequacy and effort and time
Outcome
Moderately positive, moderately negative
Proportion of households with access to electricity
Proportion of households with access to piped-water supply

249
Proportion of households with basic sanitation facility
Proportion of households with sewerage facility
Proportion of households that can afford to pay for piped-water supply
Proportion of households with adequate consumption of electricity
Average expenditure on piped-water consumption
Average time taken to collect water
Average distance taken to reach community tap
Summary of results An important benefit of the electricity-sector reform has been the rapid increase in coverage, from 53% in 1996 to 70% in 1999. As reported in the ENCOVI survey, while 73% of the households report to be connected to the electricity network (95% in the urban and 56% in the rural areas), only 62% have an electricity meter (78% in the urban and 50% in the rural areas). The lack of a meter suggests that these households are illegally connected, or at best, that the amounts they pay for the service are not proportional to their monthly consumption.
According to the ENCOVI survey, 69% of households have piped water and 87% of the households have some form of sanitation, although only 38% are connected to the sewerage network.
The results show that one in six Guatemalan households has no access to any modern network services electricity, piped water or sewerage.
The statistics show that, in about 60% of cases, the only service available in the household is electricity, and, in the other 40% of cases, water. The greater prevalence of electricity services holds good for almost every sub-category of the population, except for the poorest. Where only two services are available, they are invariably water and electricity, while households with only three services most typically have electricity, water and sewerage.
Historical trends show that the rate of increase of coverage accelerated after the major policy changes introduced in 1996. For all three services (electricity, water and sanitation), coverage improved by close to 15 percentage points over the subsequent four years (1997‒2000) compared with just over 10 percentage points over the previous four years (1993‒96). Clearly, it is difficult to attribute this acceleration to the Peace Accords and to the structural reforms introduced at that time.
The subsidy reaches 100% of poor households with electricity connections, but only 40% of poor households enjoy these connections and benefit from the subsidy as a consequence.
A recent survey of water tariffs found that, in the larger cities Guatemala City and Quetzaltenango, the flat rate charge of US$1 to US$2 per month entitled households to consume between 15 and 25 cubic meters per month, while further consumption was charged at a rising rate of between 10 and 30 US cents per cu metre.
In the ENCOVI survey, households who collect water on a regular basis report that, on average, they travel for around nine minutes to reach their nearest water source.

250
Brief theory of change The Guatemala urban infrastructure policy makes a wide range of
changes in provision of basic services. After the policy changes, the
water and sanitation sector has a positive impact, as opposed to
electricity, which has a negative impact.
R 35 / B 3
I. Study Details
Authors Galiani, S, Gertler P, Cooper, R, Martinez, S, Ross, A and Undurraga, R
Year 2013
Title Shelter from the storm: Upgrading housing infrastructure in Latin
American slums
Journal 3ie Grantee final report
Source Website search
II. Study coverage
Basic service Water, sanitation and electricity
Country El Salvador, Uruguay, Mexico
Cities Not mentioned
III. Context and intervention
Type of settlement/slum Slum — informal
Nature of agencies
involved in planning and
service provision
Private
Form of user
participation
Self-mobilisation
Project/intervention
funding agency
TECHHO — NGO

251
IV. Research design
Aim of the study This paper provides some of the first pieces of rigorous empirical evidence regarding the causal effects that upgrading dwellings can have on the living conditions of extremely poor persons in the slums of three Latin American countries: El Salvador, Mexico and Uruguay.
To examine the impact of the extremely inexpensive, but sturdy, houses constructed by TECHO, a youth-led NGO that provides basic, pre-fabricated houses to extremely poor population groups in Latin America
Type of study Quantitative method
Research design Experimental method
Methodology used for
data analysis
Simple percentage analysis
Regression analysis
V. Data and sample
Data sources Primary data
Data period The fieldwork program was rolled out in two phases. In El Salvador, Phase
I took place between August and December 2007, while Phase II was
carried out between March and August 2008. In Mexico, Phase I took
place between April and June 2010, while Phase II was conducted
between September and December 2010. In Uruguay, Phase I was held
between October and December 2007, while Phase II took place between
July and September 2008.
VI. Results and evidence
Evidence on outcomes Evidence Connectivity
Outcome
Households access onsite water connection
Households build own toilets
Households get electricity connection
Summary of results Study highlights a set of 11 baseline housing characteristics in all of the countries and tests the null hypothesis of no difference between the mean values of each variable by country. Baseline housing was, as is to be expected, substantially better in Mexico and Uruguay than in El Salvador. In Uruguay and Mexico, a large percentage of households had electricity (95.9% and 83.8%, respectively) and some form of water connection (91.3% and 51.0%), respectively, while, in El Salvador, only 39.1% of

252
households had electricity and 21.5% had some sort of water connection on the property. The service conditions tended to be much better in Uruguay than in Mexico, which is consistent with the fact that the settlements in Uruguay are located in the richest urban centres of the country.
The first salient aspect of the comparison is that it demonstrates that, in all three countries, slum-dwellers are, in general, even worse off in terms of assets than other poor populations. Rates for water connections, access to toilets and sewerage systems, are all significantly higher for the average poor household of El Salvador and Mexico than for slum-dwellers in the same country. In Uruguay, the differences are smaller in part because the average rates are much higher among this urban-focused population.
Study found that the TECHO programme has had the expected positive effect on the quality of housing and its assets of basic infrastructure facilities, but no more than that. No further housing improvements have been undertaken by the treated households. This may well be due to the transitional nature of the houses provided by the programme.
Brief theory of change TECHHO programme intervention has a positive impact on water and
sanitation improvement in treatment group of slum-dwellers, but not in
access to electricity.
R 36 / B 11
I. Study Details
Authors Gadir, A, Njiru, C and Smith, M
Year 2006
Title Small water enterprises in Africa, Sudan: A study of small water enterprises in
Khartoum
Journal Water, Engineering and Development Centre Report
Source Website search
II. Study coverage
Basic service Water
Country Sudan
Cities Dar AI Salam

253
III. Context and intervention
Type of settlement/slum Low-income
Nature of agencies
involved in planning and
service provision
Private
Form of user
participation
-
Project/intervention
funding agency
Private
IV. Research design
Aim of the study The goal of this research is to improve the well-being of the poor in informal urban settlements through cost-effective, improved water-supply service.
To identify and test constraints, opportunities and strategies for enabling small-scale independent providers to deliver acceptable water services to poor urban consumer.
Type of study Mixed-methods
Research design Observational
Methodology used for
data analysis
Simple percentage analysis
V. Data and sample
Data sources Primary data
Data period Not mentioned clearly
VI. Results and evidence
Evidence on outcomes Evidence
Connectivity, affordability and effort and time
Outcome
Moderately positive and moderately negative

254
Private provision of water supply
Cost of access in piped-water supply
Distance to access the water in water yard
Summary of results 95‒98% of the households in Dar Al Salam get their water from vendors.
Households pay a maximum of SD6,000, which is about six times the price paid by those with piped water in the third- or poor-class residential areas.
Poorer households that are a reasonable walking distance from a water-yard obtain water delivery from source.
Brief theory of change Dar AI Salam city aims to provide better access to water in informal
urban settlements, by supporting small water-providing enterprises,;
this programme was financed by the UK Department of International
Development (DFID) and Engineering Knowledge Research Programme
(EngKAR). The Small Water Enterprises (SWE), with the assistance of
NGOs, improve access for informal dwellers.
R 37 / A54
I. Study Details
Authors Gerlach, E and Franceys, R
Year 2010
Title Regulating Water Services for All in Developing Economies
Journal World Development
Source Electronic database
II. Study coverage
Basic service Water
Country Bolivia, Chile, Philippines, Indonesia, Ghana, Kenya, Zambia, Jordan, India and
Uganda
Cities La Paz-El Alto, Santiago de Chile, Manila, Jakarta, Accra, Nairobi, Lusaka, Amman,
Jaipur and Kampala
III. Context and intervention
Type of settlement/slum Low-income

255
Nature of agencies
involved in planning and
service provision
Public-sector and private-sector
Service providers included both private and public agencies.
Form of user
participation
-
Project/intervention
funding agency
Private-sector
At different points in time, water provision has been privatised in all of these countries, and a regulatory authority has been set up. Service providers are either private companies or public departments who continue to function as primary water providers.
IV. Research design
Aim of the study This paper aims to analyse the regulatory experience in 11 metropolitan
areas, with respect to the challenge of reaching all urban consumers,
particularly the poor.
Type of study Qualitative
Research design Observational
Methodology used for
data analysis
Narrative analysis
V. Data and sample
Data sources Primary data
Initial fieldwork, consisting of semi-structured interviews with representatives of regulatory agencies, national and local government, water-service providers, civil-society groups and development partners, substantiated by extensive document reviews, was undertaken by a team of local and international researchers.
Secondary data
World Bank, UNICEF, WHO, etc.
Data period 2004 and 2005
V. Results and evidence
Evidence on outcomes La Paz-El Alto, Santiago de Chile, Nairobi, Lusaka and Jaipur

256
Connectivity: moderately negative
In five countries —Bolivia, Chile, Kenya, Zambia and India — number of
urban water-supply (household) connections decreased between 2002
and 2006. (refer to comments for more details).
Manila, Jakarta, Accra, Amman, and Kampala
Connectivity: Moderately positive
In four countries — Philippines, Indonesia, Jordan and Uganda — the
number of connections has increased.
Summary of results The case-study research found that regulators are not legally required to facilitate and monitor the early achievement of universal service.
Neither are they enabled to do so, their allocated powers and responsibilities often falling short of the complementary, if not prerequisite, regulatory duty of ensuring that reasonably efficient providers may achieve an adequate return on capital employed to enable them to meet any such service obligation.
Despite these weaknesses in the formal regulatory framework, some of the regulators studies have been able to respond to the universal-service challenge.
Brief theory of change Lack of legal clarity in respect of mandates, which subsequently failed to specify regulatory powers and responsibilities in respect of economic and social matters.
An incomplete separation of operator (and/or asset-holding agency), regulator and policymaking functions was a common observation in the case studies.
The research found that, in most cases, regulators did not have sufficient information as to the location, extent and present service access of the poorest, most needy (in public-health terms) consumers.
The findings highlighted a lack of information as to the full cost of water services to the various user groups, which is a significant input variable for regulators’ price determinations.
No pro-poor strategy in place.
Oversight mechanisms for alternative providers’ (AP) operations were generally found to be limited in extent and enforcement was lacking, most notably in respect of resale-pricing regulations.
R 38 / A12
I. Study Details
Authors Garlic, E and Frances, R
Year 2009
Title Regulating water services for the poor: The case of Amman

257
Journal Geoforum
Source Electronic database
II. Study coverage
Basic service Water supply
Country Jordan
Cities Amman
III. Context and intervention
Type of settlement/slum Both formal and informal
Nature of agencies
involved in planning and
service provision
Government: Program Management Unit (PMU)
Private: Joint venture of Lyonnaise des Eaux (Suez Environment,
France), Montgomery Watson (US) and Arabtech Jardaneh (Jordan),
trading under the name LEMA, under a management contract.
Form of user
participation
-
Project/intervention
funding agency
ODA: A World Bank loan was secured to cover the fixed management
fee (JD1.6m/year, US$2.2m/year) and an incentive bonus equal to 5%
of incremental cash flow. Additional funding for capital investment was
provided by foreign donors through a mixture of soft loans and grants.
The Program Management Unit (PMU) is funded through a number of
grants and loans from American and European development partners,
and receives counterpart contributions from the Water Authority of
Jordan (WAJ).
IV. Research design
Aim of the study This paper investigates the status of the water-supply service and
regulatory arrangements in respect of poor and vulnerable consumers.
Type of study Qualitative
Research design Observational

258
Methodology used for
data analysis
Interview and case-study method
V. Data and sample
Data sources The analysis of fieldwork carried out in Amman. Semi-structured interviews with key stakeholders in the water sector, representing various levels of government, the then private operator LEMA, international development agencies and civil society, were complemented by a survey of households in selected poor neighbourhoods and small-scale surveying of private water-tanker operations.
The household survey was intended to capture a variety of low-income settings within the boundaries of the Greater Amman service area.
Data period Between summer 2004 and summer 2005.
VI. Results and evidence
Evidence on outcomes Connectivity: moderately positive
Of the respondent households, only 60% had access to their own water connection, with nearly one-fifth sharing a connection between three or more households.
In response to the persistent insufficiencies in water supplied via the municipal network, an increasing number of households turn to the open private market. Water is typically purchased from private tankers, but so called ‘water-stores’ selling treated drinking water have also become increasingly popular in recent years. According to WAJ figures, 1,267 private tankers were registered in the Amman Governorate.
The water-services policy and practice implicitly and explicitly impact on low-income customers, both positively and negatively, through the application of tariff structures, subsidies and supply hours.
Affordability: moderately positive
Affordability is a key consideration of Jordanian water-pricing policy. Despite high water-production costs and the WAJ’s approaching insolvency, tariffs have historically been kept very low, not even allowing the recovery of operating and maintenance costs.
Interviews confirmed unanimous agreement among government institutions that low-income households are being supported through the tariff structure, which includes a lifeline block of 20 cu metres per quarter, at a fixed price of JD3.472 (US$4.90).
But, the lifeline allowance covers the water requirements of only a minor proportion of respondents (3%), while the majority (46%) pay up to three times the minimum charge and 14% regularly pay more than ten times the cost of the lifeline (Fig. 6).
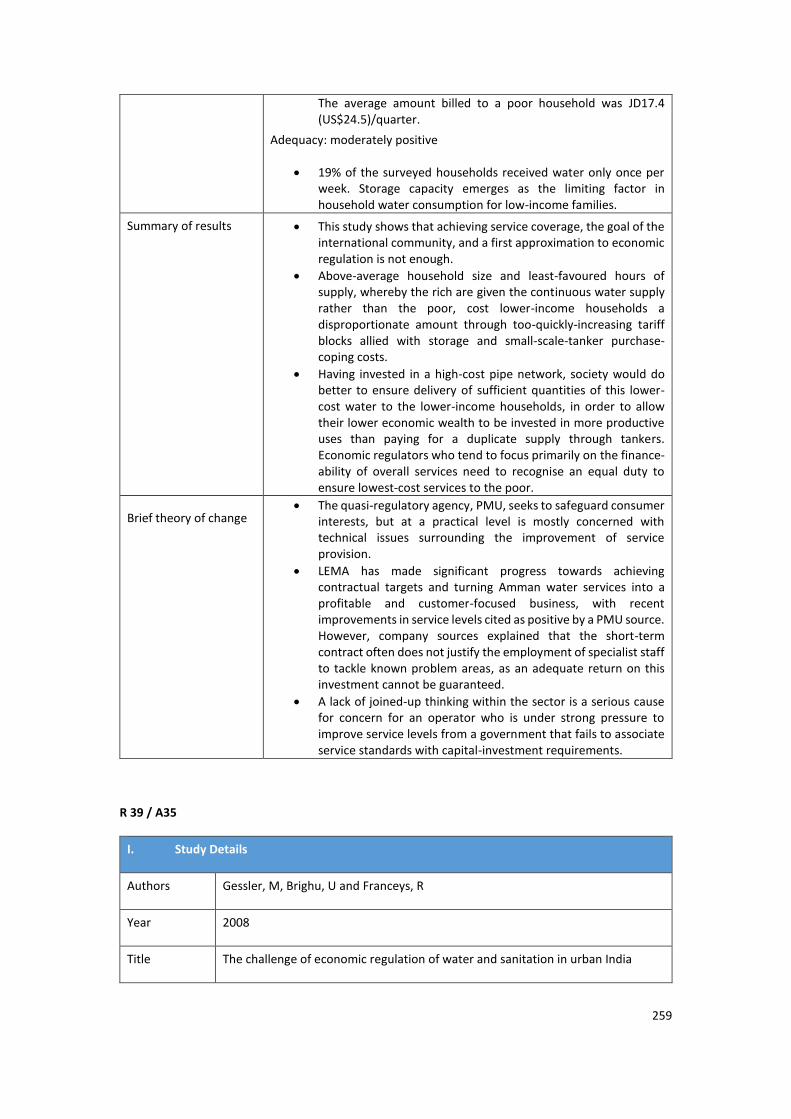
259
The average amount billed to a poor household was JD17.4 (US$24.5)/quarter.
Adequacy: moderately positive
19% of the surveyed households received water only once per week. Storage capacity emerges as the limiting factor in household water consumption for low-income families.
Summary of results This study shows that achieving service coverage, the goal of the international community, and a first approximation to economic regulation is not enough.
Above-average household size and least-favoured hours of supply, whereby the rich are given the continuous water supply rather than the poor, cost lower-income households a disproportionate amount through too-quickly-increasing tariff blocks allied with storage and small-scale-tanker purchase-coping costs.
Having invested in a high-cost pipe network, society would do better to ensure delivery of sufficient quantities of this lower-cost water to the lower-income households, in order to allow their lower economic wealth to be invested in more productive uses than paying for a duplicate supply through tankers. Economic regulators who tend to focus primarily on the finance-ability of overall services need to recognise an equal duty to ensure lowest-cost services to the poor.
Brief theory of change The quasi-regulatory agency, PMU, seeks to safeguard consumer
interests, but at a practical level is mostly concerned with technical issues surrounding the improvement of service provision.
LEMA has made significant progress towards achieving contractual targets and turning Amman water services into a profitable and customer-focused business, with recent improvements in service levels cited as positive by a PMU source. However, company sources explained that the short-term contract often does not justify the employment of specialist staff to tackle known problem areas, as an adequate return on this investment cannot be guaranteed.
A lack of joined-up thinking within the sector is a serious cause for concern for an operator who is under strong pressure to improve service levels from a government that fails to associate service standards with capital-investment requirements.
R 39 / A35
I. Study Details
Authors Gessler, M, Brighu, U and Franceys, R
Year 2008
Title The challenge of economic regulation of water and sanitation in urban India

260
Journal Habitat International
Source Electronic database
II. Study coverage
Basic service Water, sanitation, electricity (piped-water supply, drainage system, electricity —
illegal connection)
Country India
Cities Jaipur (Rajasthan)
III. Context and intervention
Type of settlement/slum Slums — formal and informal
Nature of agencies
involved in planning and
service provision
Government
The Public Health and Engineering Department (PHED), a department of
the state government, overseen by Rajasthan Water Supply and
Sewerage Management Board (RWSSMB)
Form of user
participation
-
Project/intervention
funding agency
State government
Public Health and Engineering Department (PHED) for water and
sewerage.
Rajasthan Electricity Regulatory Commission (RERC) for electricity
IV. Research design
Aim of the study This paper considers the present state of water supply in Jaipur,
Rajasthan, particularly the extent to which the poor are served and, in
readiness for the proposed water regulator, the authors contrast the

261
management of water with the state of the newly reorganised and
economically regulated electricity sector.
Type of study Qualitative
Research design Observational
Methodology used for
data analysis
Narrative analysis
V. Data and sample
Data sources Primary data: Survey in four slums and FGD
Secondary data: Government records
Data period Not mentioned
VI. Results and evidence
Evidence on outcomes Connectivity: moderately positive
Of the four different slums that were investigated, the regularised slum was in the best condition.
Standpost water supply (abstracting from a borehole to overhead distribution tank).
Proper roads and functioning drainage.
In the poorest slum the direct provider has provided a surface-level pipe network.
The electricity services were reported to be satisfactory in all survey areas.
Some slums, which are not regularised, as they are in the low-lying areas and so are planned to be rehabilitated, have no sanitary facilities.
Summary of results In the case of Jaipur water utility, there are inefficiencies, a lack of customer involvement and representation, a haphazard pro-poor water policy and, consequently, a strong need for reforms.
Although the water and sanitation service may not be considered ‘good’, it may well be considered ‘good enough’ under the circumstances, and be of a much higher standard than many other Indian cities.
In contrast to water, the electricity services were reported to be satisfactory in all survey areas, including the slums. Connection rates are high, billing procedures clear and efficient.
Brief theory of change Division of roles, recovery of production cost through proper tariff structure, better services to the poor, reduction in the number of illegal connections and theft of electricity, have all been achieved.

262
Jaipur water utility shows inefficiencies, lack of customer involvement and representation, a haphazard pro-poor water policy and, consequently, a strong need for reforms.
R 40 / A42
I. Study Details
Authors Ghafur, S
Year 2000
Title Entitlement to Patronage: Social construction of household claims on
Slum Improvement Project, Bangladesh
Journal Habitat International
Source Electronic database
II. Study coverage
Basic service Water and sanitation
Country Bangladesh
Cities Faridpur, Comilla, Mymensingh
III. Context and intervention
Type of settlement/slum Both legal and illegal settlements
Nature of agencies
involved in planning and
service provision
Government: SIP
NGOs
Community organisers (Cos)
Form of user
participation
-
Project/intervention
funding agency
ODA
UNICEF

263
IV. Research design
Aim of the study The objective of this paper is to explore the role of social factors in
establishing household claims on urban local intervention in Bangladesh.
This paper argues that, due to key institutional constraints in local
government, (that is, lack of finance and an unrealistic set of functions),
poor households maintain a dependent relationship with local
government in their claims on urban services.
Type of study Qualitative
Research design Observational
Methodology used for
data analysis
Narrative analysis
V. Data and sample
Data sources Primary data
Informal interviews conducted during the survey with people in the
community, ‘field workers’, and official and elected members.
Secondary data
UNICEF Bangladesh
Data period Not clearly mentioned
VI. Results and evidence
Evidence on outcomes Water connectivity: moderately positive - Improvement in living conditions in 200 project sites in
25 municipal towns.
Sanitation connectivity: moderately positive - Improvement in living conditions in 200 project sites in
25 municipal towns.
Summary of results The SIP, with donor assistance, has provided basic urban services and socio-economic facilities in low-income settlements in cities and towns of different sizes.
But, in investigating the factors that condition household ability to claim benefits of SIP, the relationship between the intervention and beneficiary households are seen as passive; that is, the latter simply takes what is given.

264
Urban-poor households' claims to SIP in three intermediate-sized cities in Bangladesh do not take place in a value-neutral setting.
SIP beneficiaries develop a dependent relationship with the local government. This relationship has been rooted in the social construction of de facto entitlements, which finds expression in, and is mediated by, the existing social situation in Bangladesh.
This finding has important implications for future urban local interventions in Bangladesh. It suggests a need to reorient our focus away from availability of services (by provision) and towards the household ability to claim them.
Brief theory of change Due to key institutional constraints in local government (that is, lack of finance and an unrealistic set of functions), poor households maintain a dependent relationship with local government in their claims on urban services.
R 41 / B 12
I. Study Details
Authors Gold, J and Namupolo, M
Year 2013
Title Sanitation issues in Namibia.
Journal Namibia housing action group CLIP. Team Research Report
Source Website search
II. Study coverage
Basic service Sanitation
Country Namibia
Cities Not mentioned
III. Context and intervention
Type of settlement/slum Slum — informal
Nature of agencies
involved in planning and
service provision
Government and self-mobilisation

265
Form of user
participation
-
Project/intervention
funding agency
Government and self-mobilisation
IV. Research design
Aim of the study To evaluate a consortium of research and knowledge agencies seeking to improve access to sanitation and hygiene.
This study seeks to direct attention to the inequality of access to improved and adequate sanitation for many Namibians, an issue that has garnered new interest at national level over the last few years.
Type of study Mixed-methods
Research design Observational
Methodology used for
data analysis
Simple percentage analysis
V. Data and sample
Data sources Primary and secondary data
Case-study method
CLIP Survey 2011
Data period April 2011
VI. Results and evidence
Evidence on outcomes Evidence
Connectivity
Outcome Moderately positive and moderately negative
Proportion of households accessing public toilet
Proportion of households having private toilet facility
Summary of results According to the findings, the majority of residents (57%) used public toilets, while 39% practised open defecation, which is slightly more than the one-third indicated in the CLIP profile document of 2009. Only 2% of the households actually have access to private toilets.
In 2008, some households qualified for low-income house and services loans from the government’s Build Together housing scheme, and brick houses with internal toilets were built. To

266
date, six female- and one male-headed household have a private toilet inside their house. Six households built toilets in their yards by using available pipes to extend the infrastructure. Any additional materials that were required, they bought themselves. Two families are still using the communal toilet.
Brief theory of change Joint interventions of the government and Namibia Housing Action Group
CLIP team provided sanitation services to the informal slums-dwellers;
this had a positive impact on sanitation access at community level and in
respect of individual toilets.
R 42 / A 26
I. Study Details
Authors Goli, S, Arokiasamy, P and Chattopadhayay, A
Year 2011
Title Living and health conditions of selected cities in India: Setting priorities
for the National Urban Health Mission
Journal Cities
Source Electronic database
II. Study coverage
Basic service Water, sanitation and electricity
Country India
Cities Delhi, Meerut, Kolkata, Indore, Mumbai, Nagpur, Hyderabad, Chennai
III. Context and intervention
Type of settlement/slum Formal settlement
Nature of agencies
involved in planning and
service provision
Water: government
Provision of water service
Sanitation: user involvement
Self-construction of toilets
Electricity: government

267
Provide electricity facility
Form of user
participation
Sanitation: participation through self-mobilisation
Construction of toilets at home
Project/intervention
funding agency
Water: state government
Sanitation: private (self-funding)
Electricity: state government
IV. Research design
Aim of the study This paper aims to assist policy-makers by providing critical insights into
the health and living conditions in selected major cities in India, with
special emphasis on slums.
Type of study Quantitative
Research design Observational
Methodology used for
data analysis
Quantitative
V. Data and sample
Data sources Secondary data
Census data
Data period 2001
VI. Results and evidence
Evidence on outcomes Water: connectivity: moderately positive
Sanitation: connectivity (Indore, Nagpur, Hyderabad): Moderately
positive
Sanitation: connectivity (Delhi, Meerut, Kolkata, Mumbai, Chennai):
Moderately negative
Electricity: connectivity: Moderately positive
Summary of results The analysis reveals that all eight cities are lagging in respect of India’s goal of full coverage of these basic services.

268
Within the slums of five out of the eight cities, less than 50% of those populations have access to improved sanitation facilities, and three out of the four mega-cities examined have less than 50% coverage of cooking-gas connections.
Mumbai, New Delhi, and Meerut are also facing the problem of extreme over-crowding. The lack of safe drinking water in Chennai and the scarcity of sanitation facilities in Mumbai require special attention.
Brief theory of change This study reveals the heterogeneity of socio-economic and health problems across Indian cities.
It is critical to note, that despite socio-economic progress, cities such as New Delhi and Nagpur are weak in respect of basic health indicators.
Based on this detailed analysis, the study suggests that Indian cities need to prioritise challenges and identify effective health interventions in the context of their respective socio-economic and health conditions.
The analysis also informs guidelines for the implementation of action necessary to achieve healthy cities through India’s National Urban Health Mission.
R 43 / E 10
I. Study Details
Authors Global Network on Energy for Sustainable Development (GNESD)
Year 2008
Title Energy access in urban slums: A case of Khon Kaen, Thailand
Journal Global Network on Energy for Sustainable Development (GNESD), Research
Report
Source Google Scholar
II. Study coverage
Basic service Electricity
Country Thailand
Cities Khon Kaen, Bangkok

269
III. Context and intervention
Type of settlement/slum Slum — informal
Nature of agencies
involved in planning and
service provision
Government
Form of user
participation
-
Project/intervention
funding agency
Government
IV. Research design
Aim of the study The aim of this study, focusing on urban and peri-urban areas of Thailand,
is primarily to assess the current levels of access to modern forms of
energy, energy-consumption patterns and total energy-related
expenditures in poor urban and peri-urban areas.
Type of study Mix method
Research design Observational
Methodology used for
data analysis
Simple percentage method
V. Data and sample
Data sources Primary Household survey
Secondary data National Statistical Office (NSO), National Economic and Social
Development Board (NESDB), Statistical Yearbook, Census,
Household Socio-Economic Survey, Household Energy
Consumption Survey, Metropolitan Electricity Authority (MEA),
Provincial Electricity Authority (PEA), Community Organizations
Development Institute (CODI)
Data period January‒February 2007 and October 2007

270
VI. Results and evidence
Evidence on outcomes Outcome
Connectivity, affordability and adequacy
Evidence
Moderately positive and moderately negative
Proportion of households with access to electricity
Average monthly electricity expenditure of households
Average reliable electricity supply
Summary of results 61% of the households feel that the electricity price is too high and 85% of them feel that the tariff is increasing. Ninety-six percent of the households say that the electricity supply is reliable in the Khon Kaen Slum area.
Households in Khon Kaen feel the electricity price to high compared with Bangkok. In Bangkok, 77% of the households have portrayed the electricity bill as expensive, compared to the 61% in Khon Kaen.
It is important to highlight the fact that several households in slums in Bangkok report difficulty in paying for their monthly electricity bill. In Khon Kaen, average monthly household electricity expenditure in slum areas is found to be Bt697, while the poor households below the poverty line spend Bt362 per month. These figures are lower than the average monthly electricity expenditure in slum areas in Bangkok, where the corresponding figure is Bt856 and Bt728 per household, respectively.
Brief theory of change Study has not mentioned the theory of change
R 44 / A10
I. Study Details
Authors Gulyani, S, Talukdar, D and Mukami, K
Year 2005
Title Universal (Non) service? Water markets, household demand and the poor in urban
Kenya
Journal Urban Studies
Source Electronic database

271
II. Study coverage
Basic service Water
Country Kenya
Cities Nairobi, Mombasa and Kakamega
III. Context and intervention
Type of settlement/slum Urban poor
Nature of agencies
involved in planning and
service provision
Government/self-mobilisation
Form of user
participation
Self-mobilisation: households mobilised their own community water
supply
Project/intervention
funding agency
Government/self-mobilisation
IV. Research design
Aim of the study This paper examines current water use and unit costs in three Kenyan towns and also tests the willingness of the unconnected to pay for piped water or improved kiosk service.
By examining the water-use behaviour of poor and non-poor households, this study brings into question a long-standing notion in the literature: namely, that only the poor are underserved, use little water and pay a lot for it. It also indicates that the standard prescription to ‘price water and create water markets’ is, in itself, insufficient to improve service delivery and that kiosks are not always a good solution for serving the poor.
Type of study Quantitative
Research design Quasi-experimental
Methodology used for
data analysis
Descriptive analysis

272
V. Data and sample
Data sources Surveyed 674 households randomly selected for Nairobi (300), Mombasa
(199) and Kakamega (175)
Questionnaire survey
Data period November 2000
VI. Results and evidence
Evidence on outcomes Connectivity: moderately negative
Number of poor households with access to in-house piped connection
Affordability: moderately positive
Unit price of water borne by households to private supply after using government ( US$ per cu meter)
Adequacy: moderately negative
Average water use per capita (lcd)
Effort and time: moderately negative
Average time spent in collecting water (minutes per day)
Summary of results This study finds that the current water-supply situation in Nairobi, Mombasa and Kakamega is dismal. Although about half of the sampled households have access to private piped-water connections, only 5% of those connected are poor.
The poor households are consequently overwhelmingly dependent on alternative water sources, and end up spending an average of 42 minutes per day in collecting water (compared with 15 minutes spent by non-poor households).
Stories of underserved poor households are legion in the literature, which shows that the urban poor are not likely to have a private water connection, are likely to be paying high unit prices for water, and are likely to spend a significant amount of time in collecting water.
In contrast to the supply-side penchant for pushing kiosks as affordable and desirable strategy for serving the poor, we find kiosks are the least-preferred ‘improvement’ option among unconnected urban households in Kenya.
Brief theory of change The study indicates that there is broad constituency for reform in the water sector in urban Kenya — a constituency that includes, perhaps unlike in many Asian and Latin American cities, both poor and non-poor consumers.
The low levels of water use have at least one positive implication: the size of the systems and investments required to meet demand and the MDGs is smaller.
Despite low water use, the existing water budget of the population is large, indicating that households’ willingness to pay

273
for improvements is backed by an ability to pay. In other words, this is a situation where user support for, and the financial and economic viability of, an improvement programme are high.
There are no major supply constraints either; water production and water-treatment capacity exist, but they need to be complemented by improvements and expansions in the transmission and distribution networks
R 45 / A 14
I. Study Details
Authors Hailu, D, Osorio, R and Tsukada, R
Year 2012
Title Privatization and renationalization: What went wrong in Bolivia’s water
sector?
Journal World Development
Source Electronic database
II. Study coverage
Basic service Water
Country Bolivia
Cities La Paz, El Alto, Cochabamaba, Santa Cruz
III. Context and intervention
Type of settlement/slum Low-income
Nature of agencies
involved in planning and
service provision
Others
Private provision of concession for water
Form of user
participation
-
Project/intervention
funding agency
Private-sector
Lyonnais Des Eaux

274
IV. Research design
Aim of the study This paper investigates the impact of water-service privatisation in
Bolivia. It compares the performance of cities in which the service was
privatised (La Paz and El Alto), with a city in which it is managed as a
cooperative (Santa Cruz de la Sierra), and one where the service is
publicly provided (Cochabamba).
Type of study Quantitative
Research design Observational
Methodology used for
data analysis
Quantitative
V. Data and sample
Data sources Primary data
Secondary data
Household survey
Data period 1992, 1996, 2001, 2005
VI. Results and evidence
Evidence on outcomes La Paz
Connectivity: moderately positive
Affordability: moderately positive
El Alto
Connectivity: moderately positive
Affordability: moderately positive
Cochabamba
Connectivity: moderately negative
Affordability: moderately positive
Santa Cruz
Connectivity: moderately positive
Affordability: moderately positive
Summary of results The analyses of water provision in Bolivia have shown that the post-privatisation period is associated with expanded access to water in the cities where privatisation took place, especially among low-income households.

275
The distribution analysis found that targeting the poor clearly helped create a more equitable society in terms of access to water. The results of the affordability analysis, however, were mixed.
Trends in spending during 2001–05 show both an increase and a decline in the number of people who could not afford water in the two groups (privatised and non-privatised cities).
No conclusive inference can be drawn about the effect of water prices on each city’s affordability, given the shortage of data. What is evident from the expenditure data is that non-affordability is also a common problem among households in cities where the utility was not privatised.
Brief theory of change In the cities where provision was privatised (La Paz and El Alto), there was expansion of access to piped water for all quintiles. The low-income households benefited more than the high-income households, especially the lowest quintiles of El Alto.
In the cities where water provision was not privatised, overall access to water remained constant. In Cochabamba, in fact, access to water deteriorated sharply.
The concentration indices declined in both La Paz and El Alto, moving toward equitable water access.
While the average share of income spent by the poor on water has declined for all, it did not for El Alto (where privatisation took place). This is to do with expansion in metered connections, improvements in bill collection and new charges for water, which was previously freely available.
Expenditure on water has been persistently higher over time in Santa Cruz and Cochabamba, among both the richest and poorest households. These cities have the highest incidence of non-affordability. However, there is a significant improvement in affordability for the poorest quintile, Cochabamba. This is related to falls in water tariffs after 2000, following the termination of the privatisation contract.
R 46 / A8
I. Study Details
Authors Hanchett, S, Akhter, S, Khan, M, Mezulianik, S and Blagbrough, V
Year 2003
Title Water, sanitation and hygiene in Bangladeshi slums: An evaluation of the
WaterAid — Bangladesh urban programme
Journal Environment and Urbanization
Source Electronic database

276
II. Study coverage
Basic service Water and sanitation
Country Bangladesh
Cities Dhaka and Chittagong
III. Context and intervention
Type of settlement/slum Slum
Nature of agencies
involved in planning and
service provision
NGO/Grant agencies (WaterAid)
Form of user
participation
Contribution
Grant agency (WaterAid) funded the water and sanitation
programmes, where implemented and operated by NGO
Project/intervention
funding agency
WaterAid
IV. Research design
Aim of the study To evaluate the WaterAid programme in order to deliver water and
sanitation effectively to the urban poor, including benefits and non-
benefits to the poorest slums of Dhaka and Chittagong.
Type of study Mixed-methods
Research design Observational
Methodology used for
data analysis
Statistical method
Descriptive analysis
V. Data and sample
Data sources Primary data
In total, 1,130 households surveyed for Dhaka and Chittagong areas, of which 491 households were WaterAid programme beneficiaries, and the remaining 639 were non-beneficiaries, selected using random sampling techniques.

277
Questionnaire-survey method
Observation method
Group discussion
Interview method
Data period November 2001
VI. Results and evidence
Evidence on outcomes Connectivity: moderately positive
Stand-pipe and tube-well water connections inside slums
Communal latrines
Summary of results More than 98% of beneficiary have access to water supply from metropolitan authority or tube wells within their slums, compared to just 77% of non-beneficiaries; that is a 27% overall improvement in access.
The effect of this intervention was to improve the different socio-economic groups’ access. The proportion of very poor beneficiary households with convenient access to safe water is 38% greater than the proportion of 72% of very poor non-beneficiary households with convenient access.
Most of the households used hanging latrines, open spaces, slabs over drains or water bodies. Thirty-seven percent of very poor households in the beneficiary group and 54% of very poor non-beneficiary households practice high-risk defecation behaviour.
Brief theory of change Because of this programme, all slum-dwellers in Dhaka and Chittagong now have a chance of improved basic water and sanitation facilities, and of the health advantages that these offer.
The programme has improved the living environment of many poor people, but large numbers still cannot gain full access to programme facilities, because they do not have enough money to use the facilities for all their water and sanitation needs.
The study has found virtually unanimous agreement among the staff and managers of partner NGOs that the programme, as organised at present, cannot do much for the poorest of the poor. While cost-recovery is manageable for many poor households, it is not for the very poorest. Indeed, some partners mentioned selecting for enhanced services only areas where people would be able to pay.

278
R 47 / A 44
I. Study Details
Authors Hasan, A
Year 2006
Title Orangi Pilot Project: The expansion of work beyond Orangi and the mapping of
informal settlements and infrastructure
Journal Environment and Urbanization
Source Electronic database
II. Study coverage
Basic service Sanitation (Connection)
Country Pakistan
Cities Karachi
III. Context and intervention
Type of settlement/slum Informal settlements
Nature of agencies
involved in planning and
service provision
Local government of Karachi
NGO-Orangi Pilot Project — Research and Training Institute (OPP–RTI)
CBOs
Form of user
participation
Participation through partnership and contribution
The institute does not collect money from communities — the local people collect and use it themselves.
Project/intervention
funding agency
ODA: UNDP
Through the UNDP-supported Karachi Master Plan 1975–85, proper land-use plans for the cities were developed through aerial surveys. For the UNDP-supported Karachi Development Plan 2000, an operational digital-mapping system (using remote sensing) was developed within the now-defunct Karachi Development Authority (KDA) to replace the old analogue-mapping system.
Community
Orangi Pilot Project (OPP) is a Pakistan NGO that has provided managerial support for improving sanitation in the informal settlement of Orangi. Community members built and financed sewers within the community.

279
IV. Research design
Aim of the study This paper aims to describe the work of the Pakistan NGO, Orangi Pilot Project–Research and Training Institute (OPP–RTI), in supporting improved provision for sanitation and other services in Orangi and other informal settlements in Karachi, and in other cities and smaller urban centres in Pakistan.
It also describes an OPP–RTI programme to map and survey informal settlements in Karachi, and the youth-training programme that supported this, and also the support for OPP–RTI partners in mapping in other urban centres.
Type of study Qualitative
Research design Observational
Methodology used for
data analysis
Narrative analysis
V. Data and sample
Data sources Primary data
Interviews with the Deputy Director of Planning (Shahid Saleem) of the Water and Sewage Department of the district government, and Deputy District Officer (Javaid Sultan) of the Master Plan Group of Offices of the city government. This is a method of surveying widely used in topographical surveys.
Secondary data
Author’s own calculations, based on figures from the Government of Pakistan.
Data acquired from the Karachi Building Control Authority and the Sindh Katchi Abadi Authority (SKAA), 2001. Information provided by the Urban Resource Centre, Karachi, which monitors evictions in Karachi.
OPP–RTI (2004), Quarterly Reports.
Data period Not clearly mentioned
VI. Results and evidence
Evidence on outcomes Connectivity: moderately positive
Internal development consists of sanitary latrines inside homes, underground sewers in lanes, and neighbourhood collector sewers. External development consists of trunk sewers and treatment plants.
By 2004, 97.1% of lanes were connected to sewer lines and 98.9% of the houses have access to sanitary latrines.

280
Affordability: moderately positive
Community volunteers collect money and use it themselves for maintenance.
98.9% of the population had in-house sanitary latrines, which gave them adequate access to sanitation facilities.
Durability: moderately positive
Since OPP provides training to community members on construction of latrines and sewage lines, and, since almost all the community members had in-house sanitary latrines, which were connected to the sewerage mains, the repairs and maintenance (durability) level of the infrastructure increased.
Summary of results As a result of the OPP–RTI’s involvement with the KMC’s upgrading work in Orangi, the cost of the ADB-funded project decreased from Rs1.3bn (US$21.6m) to Rs36.2m (US$600,000). With technical and managerial support from the OPP–RTI, local people have built and financed sewers in 1,093 lanes, with 21,866 houses, and have supervised external development work. An ADB report describes this project as the only successful sanitation project it has funded in Karachi in the KUDP.
As a result of the project, excellent relations were built with local-government engineers and administrators. Because of this, the OPP–RTI has been able to lobby successfully to convert the Orangi natural drains into box trunks.
The OPP–RTI had also become a consultant to the SKAA, a government institution in charge of regularising and improving katchi abadis in the province of Sindh, where Karachi is located.
SKAA decided to follow the OPP–RTI proposed methodology for upgrading katchi abadis.
The results of the documentation of the katchi abadis by the YTP clearly showed that the OPP–RTI concept of ‘internal’ sanitation being built by communities, and ‘external’ sanitation being built by the government, was valid and workable.
OPP-RTI decided to prepare union-council plan books for the Nazims (governors) of each UC.
OPP–RTI partner CBOs and NGOs outside Karachi have also developed expertise in mapping. This expertise is the result of the OPP–RTI strategy of supporting NGOs and CBOs wishing to replicate its programmes.
Brief theory of change Documenting katchi abadis showed people’s involvement and investment in development in clear terms. As a result, planning agencies and local government have realised the need to support this work, rather than duplicate it or simply go out and build schools (often without teachers), clinics (often without paramedics) and water and sanitation systems that are not properly designed, maintained and operated.
Community members were trained in skills and knowledge that communities require in order to establish a more equitable relationship with government agencies, improve their settlements, and build local institutions.
The documentation laid the basis for questioning government and IFI planning policies and development projects, and for

281
promoting viable alternatives that were based on a sound knowledge of on-the-ground realities that government agencies and their foreign consultants do not have, and do not possess the skills to develop.
As a result of the documentation, the OPP–RTI’s concepts were reinforced by statistics and maps for all Karachi, not just Orangi. This has increased the OPP–RTI’s standing and credibility, to the extent that its advice is now sought at the national, provincial and city levels in all matters related to sewage and katchi-abadi upgrading.
R 48 /A 43
I. Study Details
Authors Hardoy, A and Schusterman, R
Year 2000
Title New models for the privatization of water and sanitation for the urban poor
Journal Environment and Urbanization
Source Electronic database
II. Study coverage
Basic service Water and sanitation
Country Argentina
Cities Buenos Aires
III. Context and intervention
Type of settlement/slum Informal settlement
Nature of agencies
involved in planning and
service provision
Local government
Local NGO
Private sector: Aguas Argentinas
Form of user
participation
Participation through contribution
The users are increasingly engaging themselves in the formulation of proposals and participating in solutions; in many

282
cases, they are also bearing a proportion of the costs of neighbourhood improvement and maintenance.
Project/intervention
funding agency
Private
Aguas Argentinas was awarded a 30-year contract by the National Executive Authority to provide water and sanitation services to the Federal districts.
IV. Research design
Aim of the study This paper analyses the difficulties and possible solutions for the urban
poor in obtaining access to water and sanitation services under private
operation.
Type of study Qualitative
Research design Observational
Methodology used for
data analysis
Narrative analysis
V. Data and sample
Data sources Primary data
Interviewed by the authors
Secondary data
Action Plan for the Regularisation of Low-income Settlements, Buenos Aires.
Data period November 1997
VI. Results and evidence
Evidence on outcomes Connectivity: moderately positive
Summary of results Access to water supply and sanitation services constitutes a change of attitude on the part of the private operator, the regulatory body, government and politicians, communities and other civil-society organisations. This will allow a differentiated level of service to be introduced, in accordance with the different realities of the groups to be served, together with participation and coordination between the different actors’ interests and resources.
The failure to extend services to the poor is due to the lack of economic incentives offered to the private operator to invest in

283
low-income neighbourhoods, to the absence of appropriate social policies, and to the lack of experience and the lack of proven models.
Subsidies were mentioned as one of the appropriate mechanisms for the provision of water and sewerage services to low-income groups. However, it was indicated that different levels of subsidy are required for different income levels among those living in poverty.
On the one hand, private sector participation in the provision of piped water and sewers has monopolistic characteristics, thereby making it unlikely that the operator will decide to serve low-income urban residents of its own accord. On the other hand, it is impossible to extend services to low-income settlements without the participation and political will of the local government.
Brief theory of change The factors are identified as influential in the above outcomes.
Local governments and regulatory bodies are usually at a disadvantage in negotiations with private operators, due to the operator’s higher level of resources and information compared to those of the government and regulator.
The lack of a regulatory tradition.
The politicised appointment of regulators.
Influence being exerted on the regulator by the operator or politicians.
The excessive costs of regulation.
R 49 / A 46
I. Study Details
Authors Hossain, S
Year 2012
Title The production of space in the negotiation of water and electricity supply
in a bosti of Dhaka
Journal Habitat International
Source Electronic database
II. Study coverage
Basic service Water and electricity
Country Bangladesh
Cities Dhaka
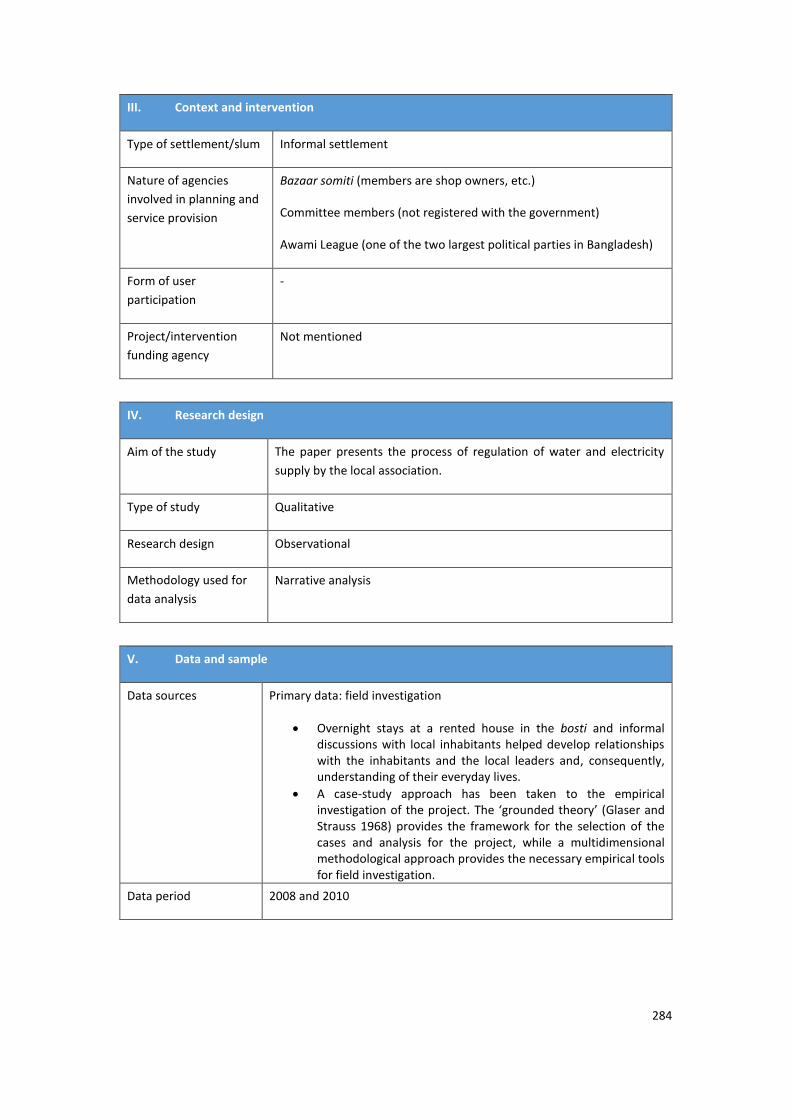
284
III. Context and intervention
Type of settlement/slum Informal settlement
Nature of agencies
involved in planning and
service provision
Bazaar somiti (members are shop owners, etc.)
Committee members (not registered with the government)
Awami League (one of the two largest political parties in Bangladesh)
Form of user
participation
-
Project/intervention
funding agency
Not mentioned
IV. Research design
Aim of the study The paper presents the process of regulation of water and electricity
supply by the local association.
Type of study Qualitative
Research design Observational
Methodology used for
data analysis
Narrative analysis
V. Data and sample
Data sources Primary data: field investigation
Overnight stays at a rented house in the bosti and informal discussions with local inhabitants helped develop relationships with the inhabitants and the local leaders and, consequently, understanding of their everyday lives.
A case-study approach has been taken to the empirical investigation of the project. The ‘grounded theory’ (Glaser and Strauss 1968) provides the framework for the selection of the cases and analysis for the project, while a multidimensional methodological approach provides the necessary empirical tools for field investigation.
Data period 2008 and 2010

285
VI. Results and evidence
Evidence on outcomes Connectivity: moderately negative
Affordability: moderately negative
Durability: moderately negative
Summary of results The case study illustrates the involvement of ruling political leaders in the production of space. Like the influential local leaders who protect their ‘invented space’ through creating fragmentation in the bosti, the ruling political leaders (including Members of Parliament and Ministers) exercise fragmentation to produce and establish an unequal, informal relationship with influential local leaders of the bosti, in such a way that inequality acts for the ruling political party as a political instrument for maintenance of social order and control.
Reciprocal relationships between the ruling political party and local leaders are based on the exchangeability of their individually produced space. This reciprocity includes, but is not limited to, guaranteed privileges for the local leaders in return for their electoral support of political leaders, and organisation of political party meetings in the bosti.
Rather more importantly for the ruling political party, it aims to selectively employ local leaders, creating a hierarchy among them, and thereby developing a dependency relationship in the community and a controlled social order that minimises the chance of a local-level movement against the government in power in this highly politicised society.
Brief theory of change No doubt, the informal practice of access to water and electricity is an outcome of the state’s reluctance to recognise the bosti bashis, who compose more than one-third of the city population of Dhaka, as its legitimate citizens.
It leads to the emergence of numerous ways in which these population groups negotiate with political party leaders and government administrations for access to governmental-welfare provisions, including utilities.
The politics of such an arrangement are very much linked to the notion of governmentality that defines the administrative logic of government authorities and that creates ‘an entirely new field of competitive mobilisation by political parties and leaders’.
R 50 / A 45
I. Study Details
Authors Hobson, J
Year 2000
Title Sustainable sanitation: Experiences in Pune with a municipal-NGO-
community partnership

286
Journal Environment and Urbanization
Source Electronic database
II. Study coverage
Basic service Sanitation (communal toilets)
Country India
Cities Pune
III. Context and intervention
Type of settlement/slum Informal settlements
Nature of agencies
involved in planning and
service provision
Government: Pune Municipal corporation
NGO: Shelter Associates
As an NGO, Shelter Associates’ objective is to work on building capacities among the poor as a basis for sustainable, community-led projects.
The current project is led and controlled by the municipal corporation, which has taken a positive step in initiating and funding the project and by establishing a new institutional partnership in Pune by bringing in NGOs.
Form of user
participation
Participation through contribution
Project/intervention
funding agency
State government — Municipal Corporation
IV. Research design
Aim of the study The objective of this paper is to give an account of the project (communal
toilet-construction programme) in the city of Pune (India), undertaken
through a partnership between the municipal corporation and eight
NGOs. It focuses on the 13 toilet blocks that are the responsibility of one
of these NGOs, Shelter Associates, and includes details of how they have
been working with local residents with regard to design, construction,
provision for maintenance and incorporation of space for community

287
activities. It highlights the positive aspects, especially the municipal
corporation’s willingness to try a new approach, while also describing the
difficulties that NGOs face in having to meet official implementation
schedules and cope with bureaucratic delays while delivering for, and
remaining accountable to, low-income groups.
Type of study Qualitative
Research design Observational
Methodology used for
data analysis
Narrative analysis
V. Data and sample
Data sources Primary data: conducted interviews
Secondary data: Shelter Associates’ own database of 400 informal
settlements in Pune, compiled in 1998‒99.
Data period 1998‒99
VI. Results and evidence
Evidence on outcomes Connectivity: Moderately positive
Shelter Associates undertook responsibility for the construction and maintenance of 13 community toilet blocks.
The corporation’s role in the project is to provide the funds and coordinate the project. It also agreed to provide electricity and water supplies to each site, free of cost, for the construction period and future use.
Affordability: Moderately positive
The caretaker is responsible for collecting the monthly payment of Rs20 per household and can prevent people from using the toilets if they have not paid.
Adequacy: Moderately positive
The number of toilets is adequate, so there have been no queuing problems with respect to the toilets that are already in operation.
Durability: Moderately positive
The caretaker is motivated by the salary, but also by the use of the caretaker’s room for the local boys.
A community room that is attached to a toilet block helps ensure that the toilets also become a community focus and the room

288
becomes an extra motivation for ensuring that the toilets and surrounding area are kept clean.
Summary of results This project represents a positive new departure in urban development, which focuses on the poor in Pune.
The combination of the municipality’s funds and powers, and the commitment of NGOs, is enabling the implementation of a large-scale and long-term project that is beginning to tackle the severe sanitation problems affecting thousands of poor women and men.
The overall project has harnessed the resources of two actors, allowing both sides to gain experience in working together constructively.
While the project is corporation-led and NGO-centred, Shelter Associates’ priority has been to support the programme and take advantage of the opportunity it has presented, simultaneously ensuring that community involvement is placed on the agenda and encouraging it, in practice, in the settlements where they are building.
Brief theory of change By working on a corporation-initiated project, Shelter Associates has placed itself in a position where it is caught between the demands and everyday workings of the corporation, which sets the terms, and the interests and priorities of local women and men whose community toilets are the purpose of the project.
Certain aspects, most notably meeting the corporation’s requirement for fast implementation, have made community- building more difficult at these early stages. However, the experience so far indicates that the project has provided a significant and tangible focus for working with women and men in informal settlements.
In initiating this project, the corporation has demonstrated a new willingness to tackle its responsibility towards providing basic amenities for the urban poor. For Shelter Associates, working with the municipality on its own project has been an intense learning process, combining the practicalities of a municipal project with the ideology that underlies their work as an NGO.
R 51 / A47
I. Study Details
Authors Ioris, A
Year 2012
Title The geography of multiple scarcities: Urban development and water problems in
Lima, Peru
Journal Geoforum
Source Electronic database

289
III. Study coverage
Basic service Water
Country Peru
Cities Lima
III. Context and intervention
Type of settlement/slum Urban poor
Nature of agencies
involved in planning and
service provision
Government: Drinking Water and Sanitation Service of Lima (SEDAPAL)
NGOs
Form of user
participation
-
Project/intervention
funding agency
State government, ODA, private sector
Public-sector surplus, foreign loans and private-sector investments
IV. Research design
Aim of the study The aim of this paper is to describe the contradictory evolution of water
services and the politicised nature of water scarcity in Lima, the capital
of Peru.
Type of study Qualitative
Research design Observational
Methodology used for
data analysis
Narrative analysis
V. Data and sample
Data sources Primary data
Fieldwork carried out, which included policy analysis, archival research and 54 in-depth interviews with local residents, regulators, policymakers and parliamentarians, NGO activists,

290
workers and managers of the water utility, and representatives of multilateral agencies.
Secondary data
SEDAPAL data
Data period 2009
VI. Results and evidence
Evidence on outcomes Connectivity: moderately positive
Total numbers of users is progressively increasing. However, public services are still lagging behind. 157,000 families still lack access to water.
Adequacy: moderately negative
Half of the houses receive treated water for only a few hours every day.
Summary of results Rather than privileging physical and administrative factors, the analytical approach provided an examination inside the multi-dimensional nature of water scarcity and an examination of the intricate barriers that prevent its resolution. Water scarcity cannot be understood as an isolated phenomenon, but as a process constantly reinserted in the totality of multiple urban scarcities of Lima.
Instead of a purely material phenomenon, the condition of water scarcity reflects the long-term development of the capital city in relation to the rest of the country and the internal inequalities within the metropolitan area.
While the old barriadas (as the slums of Lima are often called) remain areas partially integrated into the life of the city, the new barriadas propagate the same hierarchical organisation of space that presupposes renewed forms of scarcity.
Despite the higher sums of capital that now circulate in the city due to the adoption of neo-liberal economic policies in the last two decades, city expansion and economic growth have, in effect, accelerated the social presupposition of scarcity, as is made evident by the spread of unemployment and job informality, the foundation of new neighbourhoods at significant distances from the city centre, and the unresponsiveness to grass-roots demands for water and public services.
Brief theory of change The geography of water scarcity in Lima offers a representative example of the complex interlinkages that constitute the contemporary megacity.
The constant reinforcement of multiple scarcities — due to a combination of top-down strategies and the manipulation of investments and infrastructure — has become the most basic experience in the daily struggle for survival in the periphery of such vast urban areas.
In the case of the Peruvian capital, both city regeneration and water management have operated within the hegemonic

291
asymmetries that dominate the political scene and, crucially, have reinforced disparities inherited from the previous historical periods.
The dialectical interplay between scarcity and abundance has been systematically used as a political device to handle expectations in the deprived areas of the capital.
The deficiencies of the public water services are less the result of state failure than the convergence of powerful private interests in the organisation of urban water systems.
R 52 / B 14
I. Study Details
Authors Islam, S and Khan, U
Year 2013
Title Access to urban basic services and determinants of satisfaction: A
comparison by non-slum and slum-dwellers in Dhaka City.
Journal Institute of Governance Studies, BARC University, working paper
Source Website search
II. Study coverage
Basic service Water, sanitation and electricity
Country Bangladesh
Cities Dhaka
III. Context and intervention
Type of settlement/slum Slum — informal
Nature of agencies involved in
planning and service provision
Government
Form of user participation Self-mobilisation
Project/intervention funding
agency
Government

292
IV. Research design
Aim of the study This study examines both the level of satisfaction of three key urban
services — water and sanitation, waste management and electricity —
as well as the factors that determine the satisfaction level of those utility
services in Dhaka city.
Type of study Quantitative method
Research design Observational
Methodology used for
data analysis
Statistical method
V. Data and sample
Data sources Primary data
Data period August 2011
VI. Results and evidence
Evidence on outcomes Evidence
Connectivity, adequacy, affordability and effort and time
Outcome
Strongly positive, strongly negative, moderately positive
and moderately negative
Proportion of households with access to piped water
Proportion of households with access to tube well
Proportions of households with adequate water pressure
Proportion of households satisfied with distance to the facility
Proportion of households satisfied with time taken to fetch water
Proportion of households satisfied with regularity of water supply
Proportion of households with attached toilets
Proportion of households accessing public toilets
Proportion of households with simple latrine facility
Proportion of households with electricity meter installed
Proportion of households satisfied with reliable electricity supply
Proportion of households satisfied with affordable billing
Summary of results Respondents of non-slums were less satisfied (either partially or completely) about the behaviour of the staff and quality of maintenance and complaint-redress system vis-à-vis slums. The

293
pattern of satisfaction, as far as water availability and water pressure are concerned, was significantly different among people living in non-slum and those living in slum areas.
The study hypothesises that satisfaction with water services is positively related to the predictability of water-supply timing, water colour (clear), absence of foul scent in water and income level of households. In contrast, satisfaction level is adversely affected by factors including whether the respondents are house owners, large household size, lack of adequate pressure in water and consumers’ drinking of pipe water. Moreover, the satisfaction level of water services is negative if households live in non-slum areas.
In Dhaka city, households in slums mostly use common toilets (82.5%). However, in non-slum areas, attached toilets (77.5%) dominate. Moreover, very few respondents from the non-slum areas (5%) had experience of using common toilets. It was found that, in slum areas, for those who have to use common toilets, the provision of water was irregular and the cleanliness of toilets was rarely maintained. Besides, more people in slum areas had to wait in a queue to avail themselves of sanitation facilities. About 47% of people in slums, either partially or completely dissatisfied over the location of a common toilet. Cleanliness of common toilets is the major source of dissatisfaction, both in slum and non-slum areas. The survey strongly suggests that the number/availability of common toilets is inadequate, particularly in slums.
In 76% of cases households in non-slum areas have electric meters installed. Most of them responded positively to the meter reading. However, a large number of households are unaware about the current tariff structure of electricity. In non-slum areas, the survey shows that meter reading was done in 74% cases, and half of the respondents were aware of the current tariff structure of electricity. However, in slum areas, only 7.6% of households had electricity meters installed, as the service is generally provided by house-owners who buy electricity services from the DESCO and DPDC.
The study hypothesises that satisfaction over electricity services is positively related if the connection is provided by the government agencies, meter reading is done every month, and households’ annual income is more than 2 lac taka. In contrast, the satisfaction level is adversely affected if the household size is large, the respondent is a house owner, the respondent is aware of the tariff structure, there is a meter installed in the house, or the household needs to queue to pay bills. The results suggest that consumers’ awareness about electricity tariffs adversely affect their satisfaction level. This is also true for the households that have a greater number of family members. However, earning more than two lac taka annually positively affects households’ satisfaction levels in respect of electricity services.
Brief theory of change This study does not mentioned the theory of change

294
R 53 / A 3
I. Study Details
Authors Issaka, K
Year 2007
Title Environmental concerns of poor households in low-income cities: The
case of the Tamale Metropolis, Ghana
Journal Geo Journal
Source Electronic database
II. Study coverage
Basic service Water and sanitation
Country Ghana
Cities Tamale
III. Context and intervention
Type of settlement/slum Low-income
Nature of agencies
involved in planning and
service provision
Government/User involvement
Form of user
participation
Self-mobilisation
Households self-mobilised their own community toilets
Project/intervention
funding agency
Government/User involvement
IV. Research design
Aim of the study To study the environmental concerns on sanitation access in poor
households in Tamale Metropolitan area, Ghana
Type of study Mixed-methods

295
Research design Observational method
Methodology used for
data analysis
Statistical method
Descriptive analysis
V. Data and sample
Data sources Questionnaire survey among 300 households, using representative
sample of residential areas and interviews with randomly selected
households in the selected residential categories
Questionnaire-survey method
FGDs
Data period January 2005 to February 2006
VI. Results and evidence
Evidence on outcomes Sanitation
Private intervention: Connectivity: Moderately negative
State intervention: Connectivity: Moderate positive
State intervention: Electricity: Inconclusive
Water
Private intervention: Connectivity: Moderately positive
State intervention: Connectivity: Moderately negative
State intervention: Electricity: Moderately negative
Summary of results Access to private toilet facilities is highly wealth-dependent; the poor rarely have private toilets inside their homes, but usually in the yard. The high-wealth households had 75.4% of flush toilets, compared with 17.5% for the medium-wealth households and only 7% for the low-wealth households. The only facility for the poor is the KVIP/pit/pan latrine, but it is described as sub-standard and undesirable for human use.
Households with exclusive water supplies spend less than five minutes and, in case of the households sharing water sources, spend at least 25 minutes to get a bucket of water.
The role of the private sector is less evident in sanitation provision to the urban poor, rather benefitting high-income households.
A number of household environmental problems have been identified in this paper. Water supply appears to be the environmental service area that most households are concerned with, followed by solid waste-management and sanitation. Most of the affected households belong to the lowest wealth group, who have little or no capacity to improve the situation.
Moreover, the economic cost of environmental services is regressive, with a much greater impact on the poor, either

296
because they lie outside the formal system of service provision or because they depend on services from shared sources.
Brief theory of change People might lack environmental services because they are poor, or they might be poor because they lack environmental services. However, it is difficult to avoid the conclusion that there is an interaction. In many instances, the observed inequality in access to environmental services reflects the wider inequalities in life chances that have eroded the basic principles of equal opportunities.
Households did not generally view housing, indoor air pollution and insects as major problems. This reflects both a misplaced lack of concern for poor housing, indoor air pollution and insects/vectors infestation, and the fact that, unlike most environmental problems, none of these is a public problem — the burden falls on the affected individuals/households.
However, many exposed people are probably unaware of the risks, and their ignorance of the danger posed by these hazards make them unconcerned. This is a clear indication that peoples’ concerns and priorities are not based directly on health considerations. Rather, they are influenced by the lack of access to environmental services to satisfy basic living conditions.
R 54 / D 5
I. Study Details
Authors Israel, D
Year 2007
Title Impact of increased access and price on household water use in urban Bolivia
Journal The Journal of Environment Development
Source Cross-reference
II. Study coverage
Basic service Water
Country Bolivia
Cities Cochabamba, El Alto, La Paz, Oruru, Potosí, Santa Cruz, Tarija, Trinidad
III. Context and intervention
Type of settlement/slum Low-income

297
Nature of agencies
involved in planning and
service provision
Private
Form of user
participation
Passive
Project/intervention
funding agency
Private
IV. Research design
Aim of the study This article examines the equity implications of urban water reform, using data on household water expenditures and water sources from the 1994 Bolivian Integrated Household Survey.
It examines the distribution of both the impact of price increases on households with access to piped-water pre-reform and the potential impact of expanded coverage on households without access to piped-water pre-reform.
Type of study Quantitative
Research design Observational
Methodology used for
data analysis
Simple percentage analysis
V. Data and sample
Data sources Secondary
Data period July to December 1994
VI. Results and evidence
Evidence on outcomes Evidence
Connectivity and affordability
Outcome
Moderately positive, moderately negative and inconclusive
Households connected to piped in-house water connection
Households connected to water supply outside the house
Households pay more to access water from private water vendors than yard taps
Households expenditure on water per month in bolivianos
Households expenditure on water per capita in bolivianos

298
Summary of results The majority, 55%, have piped water in their buildings or yards, but not inside their homes, whereas 26% of households have piped water inside their homes. Approximately 10% have access to piped water from a tap located outside of their buildings or yards. About 5% of households obtain water directly from various groundwater and surface-water sources, whereas another 5% of households purchase water from private water vendors.
Overall, 84% of households have spending on water. Of the 16% of households (total households=992) with zero water expenditure, 251 households obtain water from free water sources, such as wells and surface water.
On average, households purchasing from private water vendors have lower monthly water spending than those obtaining piped water within their homes, but higher monthly water spending than those with piped water outside their homes, but within their buildings or yards.
Those purchasing from private water vendors spend Bs18.22 per month, which is Bs5.50 per month more than the Bs12.72 spent by those with piped water outside their homes, but within their buildings or yards. Assuming that households purchasing from vendors use a similar amount or less water, this observed difference in water spending is consistent with higher prices for private vended water than for piped water.
Brief theory of change The Bolivian urban water-supply sector reform has had a positive impact,
except on in-house connection and private connections.
R 55 / B 15
I. Study Details
Authors Joshi, D, Morgan, J and Fawcett, B
Year 2005
Title Sanitation for the urban poor: Whose choice, theirs or ours?
Journal DFID
Source Website search
II. Study coverage
Basic service Sanitation
Country India, Kenya
Cities Hyderabad, Kiambiu-Nairobi, Kibera slum

299
III. Context and intervention
Type of settlement/slum Both formal and informal
Nature of agencies
involved in planning and
service provision
India: Government
Municipality provides the sanitation service by constructing toilets
Kenya: NGO and others
Maji na Ufanisi, a local NGO, constructs public toilets
Form of user
participation
Participation through contribution
Beneficiary households have contributed 10% of the construction cost and the remaining 90% was in the form of subsidy and no-interest loan.
Participation through contribution
The users have formed themselves into a community group that pays for use either through monthly payments or per use.
Project/intervention
funding agency
India: ODA
DFID funded Andhra Pradesh Urban Services for the Poor (APUSP) programme, which complements the Integrated Low-Cost Sanitation (ILCS) Programme.
Kenya: Private
Intermediate Technology Development Group (ITDG), now called Practical Action, UK.
IV. Research design
Aim of the study The purpose of this report is to establish broad guidelines as a foundation
for effective interventions in sanitation improvements for those living in
urban poverty.
Type of study Qualitative
Research design Observational
Methodology used for
data analysis
Narrative analysis
V. Data and sample
Data sources Primary data
This includes additional and approximated information on a number of respondents, based on a number of visits per

300
respondent or group, a number of discussions with individuals, as well as number of FGDs for each particular research question in specific countries. The information in this report is, therefore, primarily qualitative and includes observing and talking to a select number of residents in a select number of urban settings, over a period of time.
Data period June 2003 to April 2004
VI. Results and evidence
Evidence on outcomes India
Connectivity: moderately negative
Only notified slums were selected as beneficiaries, thereby leaving out a large proportion of slum populations who resided in non-notified slums, as well as pavement dwellers. Even in the notified slums, toilets have been left incomplete. There are only four walls and no pans or pits in which to defecate. Water connections have also not been provided.
Kenya
Connectivity: moderately positive
Community members use the toilets, showers and water kiosks for their sanitary, bathing and drinking needs.
This toilet block serves a population of about 71,000 people.
Adequacy: moderately negative
At the time of data collection, the toilets were closed due to overflowing of a septic tank, which was not cleaned by a private company. There was no electricity or water.
Affordability: moderately negative
Casual visitors pay Ksh3 for one use and Ksh4 for A shower and community members pay a subscription fee of Ksh150 per month. Many residents preferred to pay per use, rather than pay the monthly fee, which ate into their disposable income.
Summary of results The case studies from India and Kenya reveal that water supply and sanitation in ‘illegal’ slums is often provided as a result of active leaders, mastaans and/or NGOs, all of whom will have their own interests and motivations.
The government in India provides individual pit latrines in most ‘formal’ settlements, but these latrines rarely address the sanitation needs of women, the elderly, the disabled or children, and may not even be appropriate for men.
Brief theory of change Poorer tenants in Bangladesh had to move out when NGOs provided interest-free loans to landlords in some slums to construct latrines and obtain water points. The landlords, in turn, raised their rents, which were no longer affordable for the poorest tenants.

301
Despite higher subsidies, the poorest households were unable to demand and secure individual latrines under India’s ILCS programme. Public latrines in India and Kenya are not used by many women, often as a result of cost, inconvenience or fears for safety.
Projects often fail to take into account the social and economic
dimensions of inter- and intra-household poverty, which
determines not only who lives where, but also the level of access
to services.
The designs and modes of delivery of sanitation services are planned and decided in a top-down manner and not according to user needs and situations.
R 56 / C 4
I. Study Details
Authors Kayaga, S and Franceys, R
Year 2008
Title Water services regulation for the urban poor: Zambia
Journal Water management
Source Author correspondence
II. Study coverage
Basic service Water
Country Zambia
Cities Lusaka
III. Context and intervention
Type of settlement/slum Low-income
Nature of agencies
involved in planning and
service provision
Others
Lusaka Water and Sewerage Company, wholly owned by Lusaka City Council

302
Form of user
participation
-
Project/intervention
funding agency
Others
The Water Supply and Sanitation Act of 1997 requires regulators to ensure improved service provision to the poor. A Devolution Trust Fund (DTF) was set up. DTF receives funding from the government, as well as external support agencies.
IV. Research design
Aim of the study This paper reports on research carried out in developing countries on
systems and structures put in place effectively to regulate water-service
providers for the benefit of all consumers, particularly the poor.
Type of study Qualitative
Research design Observational
Methodology used for
data analysis
Narrative analysis
V. Data and sample
Data sources Primary data
Interviews and FGDs were conducted.
Data period 2005
VI. Results and evidence
Evidence on outcomes Connectivity: Moderately positive
The Devolution Trust Fund (DTF) has improved the livelihoods of over 120,000 people living in low-income settlements.
Summary of results The operating environment was conducive to the regulator’s making independent decisions, with minimal interference from the state. The regulator has exploited this environment and made remarkable progress in fulfilling ‘good attributes’ of regulation.
The DTF has improved the livelihoods of over 120 000 people living in low-income settlements.

303
There is no doubt that water watchdog groups have increased consumer representation in the regulator’s decision-making processes.
Brief theory of change The sensitisation campaigns by water watchdog groups have led to increased awareness of roles, responsibilities and obligations for both the utilities and the consumers. Furthermore, the transformation of water watchdog groups into consumer watch groups, to cater for the three utility services of water, sanitation and electricity, is highly commended.
R 57 / A13
I. Study Details
Authors Kayaga, S and Franceys, R
Year 2007
Title Costs of urban utility water connections: Excessive burden to the poor
Journal Utilities Policy
Source Electronic database
II. Study coverage
Basic service Low income
Country Uganda
Cities Jinja and Kampala
III. Context and intervention
Type of settlement/slum Low-income
Nature of agencies
involved in planning and
service provision
Government
Form of user
participation
-
Project/intervention
funding agency
Central
National Water and Sewerage Corporation

304
IV. Research design
Aim of the study Drawing from the Uganda case study, this paper will contribute to the
understanding of the enormity of the barriers of the connection process
and costs levelled against the urban poor, and the importance of
programmes and pricing structures for enabling access to the water-
supply systems.
Type of study Quantitative
Research design Quasi-experimental
Methodology used for
data analysis
Econometric method
Ordinary Last Square (OLS) method
V. Data and sample
Data sources Primary data
Sample selected for four public and private water utilities n Cambodia, for four towns and one city, in randomly selected 428 connected and 354 non-connected households.
Questionnaire survey
Data period January 2004
VI. Results and evidence
Evidence on outcomes Connectivity: Inconclusive
Adequacy: Inconclusive
Summary of results The results of the Uganda research demonstrate the substantial and unpredictable nature of the costs involved in obtaining a new water connection, costs which are often too risky, as well as unaffordable.
The poor, almost by definition, are unable to build up such capital. A mean of US$500 with a median of US$197 for a ‘two-dollar-a-day’ household is too high.
Many more water utilities need to adjust their new connection policies, reducing charges and including costs in the type of ‘all-in’ approach now being developed by NWSC, with distribution costs depreciated over several years.
Brief theory of change Extending services to the low-income settlements in urban areas is a critical success factor for increasing access of the urban poor to water services. Given the intense capital costs associated with conventional services, utilities might need to adopt interim measures to reduce the huge service gap, and provide lower service levels that utilise appropriate technologies.
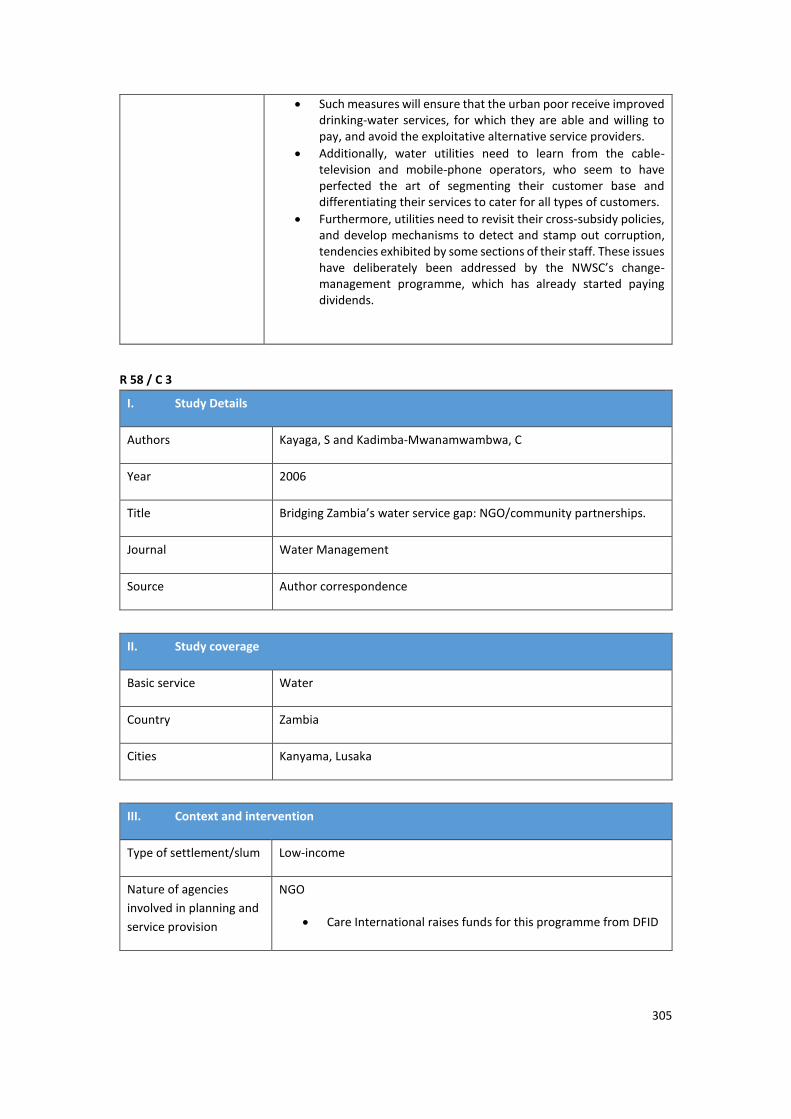
305
Such measures will ensure that the urban poor receive improved drinking-water services, for which they are able and willing to pay, and avoid the exploitative alternative service providers.
Additionally, water utilities need to learn from the cable-television and mobile-phone operators, who seem to have perfected the art of segmenting their customer base and differentiating their services to cater for all types of customers.
Furthermore, utilities need to revisit their cross-subsidy policies, and develop mechanisms to detect and stamp out corruption, tendencies exhibited by some sections of their staff. These issues have deliberately been addressed by the NWSC’s change-management programme, which has already started paying dividends.
R 58 / C 3
I. Study Details
Authors Kayaga, S and Kadimba-Mwanamwambwa, C
Year 2006
Title Bridging Zambia’s water service gap: NGO/community partnerships.
Journal Water Management
Source Author correspondence
II. Study coverage
Basic service Water
Country Zambia
Cities Kanyama, Lusaka
III. Context and intervention
Type of settlement/slum Low-income
Nature of agencies
involved in planning and
service provision
NGO
Care International raises funds for this programme from DFID

306
Form of user
participation
Participation through consultation
Through a series of zone-level meetings, community members identified water supply as the most critical issue. Further into the project, the communities were demarcated into 30 zones and each zone had a Zone Development Committee (ZDC) to enhance participation throughout the project life cycle.
Project/intervention
funding agency
ODA:
DFID funds the Programme of Support for Poverty Elimination and Community Transformation (PROSPECT)
IV. Research design
Aim of the study The aim of this paper is to explore CARE’s experience with the
establishment of the Water Trust in the Kanyama Settlement, an
unplanned low-income settlement of approximately 145,500 people.
Type of study Qualitative
Research design Observational
Methodology used for
data analysis
Narrative analysis
V. Data and sample
Data sources Primary data (fieldwork)
Data period July/August 2004
VI. Results and evidence
Evidence on outcomes Connectivity: moderately positive
101 stand-pipe connections and 120 yard-tap connections were provided.
Affordability: moderately negative
51% of the residents surveyed felt that the water service provided by the Water Trust was more expensive than that before the advent of the project. Although there is a flexible bill-payment system and a pay-as-you-fetch model, residents felt it was more expensive.
Adequacy: moderately negative

307
18% of the residents surveyed (N=801), felt the number of tap stands was inadequate.
Effort and time: moderately positive
The distance travelled and the time spent in collecting water was more favourable in the per-urban areas served by the Water Trust than with the service offered by traditional water-utility providers.
Summary of results Water Trusts, set up by CARE International through the PROSPECT project, have plugged the water-service gap in the cities of Lusaka and Livingstone in Zambia. Over a five-year project period, PROSPECT, in partnership with Lusaka City Council and LWSC, developed the organisational capacity of communities in 13 peri-urban settlements, with an estimated population of 600,000 people, and facilitated the formation of Water Trusts, which are currently providing water services to residents in these low-income settlements.
Evaluation of the community-managed Water Trusts, carried out in mid-2004, showed that the majority of service recipients were satisfied with the level of service in terms of reliability, continuity, customer relations, price and flexibility of payment methods. However, at the time of the study, there was no evidence of direct contact between the Water Trust and the Regulator.
Therefore, there is a need to explore the optimum institutional arrangement to ensure that communities served by the Water Trust fully benefit from the water-services regulatory systems.
Brief theory of change What this case study demonstrates is that partnerships between NGOs, communities and water-utility providers are capable of adequately bridging the service gap, to the extent of even providing better service levels than conventional water-utility providers, at least in the short-to-medium term.
This mode of service delivery is qualitatively better than the diversified small-scale intermediate service providers that are a common feature of many low-income cities, and who present more challenges for service-quality regulation.
R 59 / A 31
I. Study Details
Authors Kebede, B, Bekele, A and Kedir, E
Year 2002
Title Can the urban poor afford modern energy? The case of Ethiopia
Journal Energy Policy
Source Electronic database

308
II. Study coverage
Basic service Electricity
Country Ethiopia
Cities CSA data, Mekelle, Bahir Dar, Gondar, Dessie, Jimma, Nazret, Debre Zeit, Harar,
Addis Ababa, Dire Dawa, others cities in Ethiopia
III. Context and intervention
Type of settlement/slum Low-income
Nature of agencies
involved in planning and
service provision
Government
Provision of electricity services
Form of user
participation
-
Project/intervention
funding agency
State government
IV. Research design
Aim of the study Comparing rough measures of the costs of using modern fuels and
purchasing power of the urban poor in Ethiopia, this study shows that,
whether or not the kerosene is relatively cheap even for the very poor,
electricity is extremely expensive for everyone. The upper stratum of the
poor may have the purchasing power to access butane gas. In addition,
the article examines the relevance of the ‘energy-ladder’ hypothesis.
Type of study Quantitative
Research design Observational
Methodology used for
data analysis
Quantitative
V. Data and sample
Data sources Secondary data

309
This study used the data from the Household, Income, Consumption and Expenditure Survey conducted by the Central Statistical Authority (CSA).
Data period 1995‒96
VI. Results and evidence
Evidence on outcomes Affordability: moderately negative
The amount of money paid for electricity (in Birr)
Summary of results All fuels considered here, including traditional fuels, have positive income elasticity. This is true whether the parameters are computed for all households, or for only the poor or the non-poor. Even non-poor households increase their demand for traditional fuels when their income increases. These results show that Ethiopian urban households are at a very low level in respect of a transition to an energy system dominated by modern fuels.
Finally, the income elasticity for poor and non-poor households indicates that pro-poor growth probably increases the demand for firewood, while growth benefiting mainly higher-income groups will boost the consumption of electricity.
Brief theory of change Results show that the prices of electricity and butane gas are too high relative to the income of the urban population, particularly the poor. In the case of electricity, the Ethiopian Electric and Power Company (EEPCO), a government-owned autonomous enterprise, is the sole supplier and the initiatives can be attempted within its jurisdiction.
No legal complications can arise, since the government has defined the objectives of the Ethiopian Electricity Power Corporation, (EEPCO) in1997.
In the case of electricity, the EEPCO, a Government-owned autonomous enterprise, is the sole supplier and the initiatives can be attempted within its jurisdiction.
In the future, private electricity suppliers (if they emerge) can be encouraged to apply initiatives by using tax and other incentives. The latter is also applicable for butane gas distributed by oil companies.
The demand on human resources and technical capacity does not seem to be large; the initiatives mainly require reorienting the priority of electric suppliers and the changing modes of their operation. The experiences of utilities in other African countries, such as Zimbabwe, can help assess both human and technical requirements.
310
R 60 / D 6
I. Study Details
Authors Khandaker, H and Badrunnessa, G
Year 2006
Title The Value of Environmental Sanitation — Case studies, Bangladesh — CBO
management of slum neighbourhood sanitation services: the Aynal’s Bastee Case,
Dhaka, Bangladesh
Journal IRC
Source Cross-reference
II. Study coverage
Basic service Access to toilets
Country Bangladesh
Cities Dhaka
III. Context and intervention
Type of settlement/slum Informal settlement
Nature of agencies
involved in planning and
service provision
CBO
The Population Services and Training Center (PSTC) initiated the WatSan programme by following a community-based approach. Community members were formed into a Community Management Committee (CMC), which took the lead in construction and management of the sanitation blocks. The CMC negotiated with the government to secure land for construction of sanitation block, as well as water connections within toilets.
Form of user
participation
Participation through partnership
CMC appoints Sanitation Block Management Committees (SBMCs), which took care of the day-to-day operations and management of the sanitation blocks. The CMC negotiates with the government to secure land for construction of sanitation blocks. SBMCs appoint caretakers and maintain the toilets and also collect the maintenance fee from the community members.

311
Project/intervention
funding agency
Private-sector
PSTC provided interest-free loans to CMCs, to build sanitation blocks. PSTC is funded by WaterAid Bangladesh.
IV. Research design
Aim of the study This case study, discussing some fundamental issues regarding aspects of
environmental sanitation and, more specifically, ecological sanitation.
This occasional paper hopes to have provided information towards the
larger debate regarding development work and the critical role that
sanitation plays in this area.
Type of study Qualitative
Research design Observational
Methodology used for
data analysis
Narrative analysis
V. Data and sample
Data sources Primary data
Field observation
Secondary data
Referred to many reports
Data period Not clearly mentioned
VI. Results and evidence
Evidence on outcomes Connectivity: moderately positive
A total of 1,800 people from 300 slums households have been using these two sanitation blocks. 100% of the residents have been reached by this project.
Affordability: moderately negative
Each home owner pays Tk150 per month towards repaying the WatSan loan to the PSTC and all households pay Tk10 every month to maintain sanitation blocks and pay the caretaker's salary.
Adequacy: moderately positive
Sanitation blocks are open from 5am to 12midnight.

312
Durability: moderately positive
Two caretakers for each sanitation block, take care of the maintenance of the toilets. Their role is to regularly clean and maintain the toilets, for which they are paid Tk300 per month from the SBMC
Summary of results All the residents of the Aynal’s Bastee use sanitary latrines.
Residents are more aware of their health status and practice hygiene behaviour.
From SBMC reports and field staff observations, it is evident that residents wear sandals when going to the latrines and wash their hands with soap or ashes after using them.
Latrines are maintained and used in a hygienic manner and children now use sanitary latrines.
Where people, in particular newly arrived residents, are found not to be practising hygienic behaviour, efforts are made to address this problem.
Brief theory of change SBMCs meet regularly to discuss issues and resolve them in a democratic way.
They collect monthly contributions from users, and are repaying the loan to PSTC through monthly instalments.
They also discuss how to improve their management skills.
They realise that, although they have to make payments, once the capital loan is repaid, they will own the sanitation blocks and will not have to make loan repayments any longer.
A monthly contribution will be required only to pay the caretakers’ salary, for the purchase of cleaning materials, and to cover the cost of minor repairs.
Residents and users have also enhanced their information, knowledge and skills base through participating in training provided by PSTC. They regularly contact the local-government bodies and representatives at their own initiative and raise other issues, such as sewerage, with a view to gaining a greater understanding about potential solutions.
PSTC hopes gradually to transfer responsibilities to the SBMC and respective neighbourhood people. These responsibilities include approaching and negotiating with DCC, the agency that helped neighbourhood people to establish their right to sanitation services.

313
R 61 / E 5
I. Study Details
Authors Kifanyi, G, Shayo, B and Ndambuki, J
Year 2013
Title Performance of community-based organisations in managing
sustainable urban water supply and sanitation projects
Journal International Journal of Physical Science
Source Google Scholar
II. Study coverage
Basic service Water
Country Africa
Cities Tanzania
III. Context and intervention
Type of settlement/slum Slum ‒ informal
Nature of agencies
involved in planning and
service provision
CBO
Form of user
participation
Passive
Project/intervention
funding agency
CBO
IV. Research design
Aim of the study This study aims to address the effectiveness of community
participation, appropriate technologies and institutional arrangements
for the overall CBOs’ performance in Tanzania.
Type of study Quantitative

314
Research design Observational
Methodology used for
data analysis
Simple percentage analysis
V. Data and sample
Data sources Primary and secondary data
Questionnaires and semi-structure interviews
1994 and 1998 baseline-survey data
Data period 1994 and 1998 baseline survey
VI. Results and evidence
Evidence on outcomes Evidence
Connectivity, adequacy
Outcome
Moderately positive and moderately negative
Proportion of households with access to in-house water supply
Proportion of households consuming water below 100l
Summary of results The Hanna Nassif water supply depends on the water main pipe through the settlement to the Kinondoni area. The situation of water supply at the Hanna Nassif settlement area is better compared to the situation before the commencement of the project: out of 96 heads of household interviewed, 85 (88.5%) agreed that the project has reduced water shortages and improved the drainage system. The same pattern of results was gleaned from the interviews conducted with water users who were found fetching water at water-collection points: out of 270 respondents, 246 (91.1%) respondents said that water shortages had been reduced. Furthermore, a housing-registration survey, which was carried out in May 1998, revealed that, out of 1,897 houses, 20% (373) had private water connections, 8% (149) houses had plot connections, and the remaining 72% (1,375) had no water connection. People living in houses with no water connection were buying water within settlement areas.
There was relatively small change in water consumption compared to the patterns revealed in the 1994 and 1998 baseline studies. The study showed that about 27% of the 396 total respondents interviewed were using less than five buckets per day or below 100l per day; 46.2% 101‒200l per day; 18.3% 201‒250l per day; and the remaining 8.5% were using above 250l per day. Findings from the 1994 and 1998 baseline studies portrayed almost the same trend of water consumption. The

315
1994 survey study revealed that 47.9% of the sample population used below 100l per day; 40.5% used 101‒200l per day; 7.2% used 201‒250l per day; and 4.5% used above 250l per day. The 1998 water-consumption pattern indicated that 34% of the sample population was using below 100l per day; 43% were using 101‒200l per day; 15% were using 201‒250l per day; and the remaining 8% were using above 250l per day.
Brief theory of change CBO intervention slightly increased the adequate amount of water supply
to the slum-dwellers.
R 62 / E 1
I. Study Details
Authors Kolkata Metropolitan Area (KMA)
Year 2012
Title Basic services for the urban poor (BSUP): An impact-evaluation study of
BSUP programme intervention in Kolkata Metropolitan Area (KMA)
Journal Socio-Economic Planning Unit, KMDA, Research Report
Source Google Search
II. Study coverage
Basic service Water and sanitation
Country India
Cities Kolkata
III. Context and intervention
Type of
settlement/slum
Slum — informal
Nature of agencies
involved in planning
and service provision
Others
Jawaharlal Nehru National Urban Renewal Mission (JNNURM)

316
Form of user
participation
-
Project/intervention
funding agency
JNNURM
IV. Research design
Aim of the study
Type of study Mixed-methods
Research design Observational
Methodology used for
data analysis
Simple percentage analysis, Service Deprivation Index (SDI) and Basic
Amenities Deprivation Index (BADI)
V. Data and sample
Data sources Primary
Data period July 2008
VI. Results and evidence
Evidence on outcomes Evidence
Connectivity, effort and time
Outcome
Moderately positive
Deprivation index following provision of in-house water connection
Deprivation index following time taken to collect water from outside
Deprivation index following provision of yard-tap connection
Deprivation index following construction of bricked drainage facility
Summary of results Some level of improvement due to BSUP intervention in municipal water supply by house connections and roadside taps. Having access to water taps, however, does not guarantee regular and reliable supply of water with adequate pressure. It shows that the provision of piped-water supply in the region has improved, but not considerably across the slum’s population.

317
The accessibility to safe drinking water was quite low in Gayespur and in the Uttarpara Kotrung Municipality. In KMA, over 83% of the population had access to safe drinking water.
A composite water-deprivation index that shows an overall improvement (more than 20%) after intervention. In the data, all municipalities show a decline in the deprivation level that signifies a positive impact.
There are significant inter-municipality variations in access to toilet facilities. Among the municipalities in KMA, at one end is Kalyani, where 82% of the households had access to toilet facilities and. at the other end it was less than 15%in the case of Uluberia. There were a few common toilets with septic tanks in some slums and for the balance no sewerage system was available. It was proposed to provide two pit latrines, as per PWD, norms, to individual houses. Regarding changes in the deprivation level, all municipalities showed a significant improvement, especially the Rishra and Bally municipality. The Rishra and Bally municipality showed a 100% change: before intervention, the households had no toilets of their own and mostly used community toilets. The overall deprivation index (KMA) for proper latrines after intervention reduced from 0.437 to 0.004, showing a 99% improvement in impact.
Some parts of the slums fall in low-lying areas and proper drainage is necessary to drain out water to the nearby outfall through connecting drains. These drains were to be of constructed of brick with plaster lining. Bally and Rishra slums indicated a 100% improvement after intervention. The drainage facilities have improved considerably, and this has been reflected by an overall reduction in the deprivation index, from 0.765 to 0.394, leading to an improvement of 48%.
Brief theory of change After the JNNURM intervention, slum-dwellers accessed a tremendous
level of basic services for water and sanitation in the KMA.
R 63 / E 3
I. Study Details
Authors Karanthi, N and Rao, K
Year 2009
Title Security of tenure and its link to the urban basic services in slums: A case of
Hyderabad
Journal The IUP Journal of Infrastructure
Source Google Scholar

318
II. Study coverage
Basic service Water, sanitation and electricity
Country India
Cities Hyderabad
III. Context and intervention
Type of settlement/slum Slums — formal and informal
Nature of agencies
involved in planning and
service provision
Government
Form of user
participation
Passive
Project/intervention
funding agency
Government
IV. Research design
Aim of the study This paper attempts to understand the link between tenure security and access to basic urban services in slums, for which a field investigation was carried out in three slums of Hyderabad.
The paper particularly focuses on the different types of tenure system — formal, informal, etc., and examines whether a correlation exists between secure tenure and access to urban basic services.
Type of study Quantitative
Research design Observational
Methodology used for
data analysis
Simple percentage analysis
V. Data and sample
Data sources Secondary data
Data period 2003

319
VI. Results and evidence
Evidence on outcomes Evidence
Connectivity
Outcome
Moderately positive and moderately negative
Proportion of households with individual piped-water connection
Proportion of households with underground drainage facility
Proportion of households with electricity connection
Summary of results It was found that the average percentage of households having access to basic services increased, with a concomitant increase in the degree of tenure security. An average of 37.1% of households have access to basic services in Vinayak Veedhi (with threat of eviction/already evicted). The access increased to 40.5% in Suleman Nagar (with informal tenure) and in Pukat Nagar (with formal tenure), the access to basic services by the households further increased to 67.9%.
It was found that more than 57% of the sample households felt that the provision of legal tenure or patta would increase their access to basic services, connection to the source in particular.
In addition to this, nearly 67% of them had to invest in the drainage maintenance. Nearly one-fourth of the households have access to individual toilets and underground drainage.
Only one-third of the sample households are connected with individual water taps, hence there is still a shortfall of water supply. On average, the residents pay Rs147 as the monthly water bill. The households have frequent electrical-wiring problems owing to the poor condition of electricity lines and street-lights.
Brief theory of change Formal and informal slum-dwellers access to the basic service of water,
sanitation and electricity has improved vastly from the service received
from the monopoly government provider.

320
R 64 / A 48
I. Study Details
Authors Laurie, N and Crespo, C
Year 2007
Title Deconstructing the best case scenario: Lessons from water politics in La
Paz–El Alto, Bolivia
Journal Geoforum
Source Electronic database
II. Study coverage
Basic service Water and sanitation
Country Bolivia
Cities El Alto, La Paz
III. Context and intervention
Type of settlement/slum Low-income-poor
Nature of agencies
involved in planning and
service provision
Private concession
Aguas del Illumani, a French-led consortium, part of the Suez group
Form of user
participation
Participation through contribution
The terms of the concession agreement did not involve community participation in any form. The terms were finalised between the private companies and the Bolivian government, with supervision of the World Bank. However, one of the pro-poor technological innovations of this project was the contribution of labour by the community members, in the form of laying smaller tubing along pavements. This contribution was equated to the savings to the project as a result of adopting this technological improvement.
Project/intervention
funding agency
ODA
International Development Association (IDA) funded Major Cities Water and Sewerage Rehabilitation Project (1990‒97)
World bank

321
IV. Research design
Aim of the study The historical analysis of the privatisation of pro-poor credentials of the
concession in the pro-poor story of the La Paz–El Alto case.
Type of study Qualitative
Research design Observational
Methodology used for
data analysis
Narrative analysis
V. Data and sample
Data sources Primary data
Fieldwork with poor users
Data period 2006
VI. Results and evidence
Evidence on outcomes Connectivity: moderately positive
New connections were provided, although the number of connections was lower in low-income communities than for new connections in high-income areas.
Affordability: moderately negative
The tariff structures were discriminating against poor households. Several poor households did not cross the minimum-consumption level, but were required to pay for it. Although the private company was required to install meters, the majority of households did not have meters and were paying much more for their water use. The community contribution interims of labour, materials and maintenance, added together as connection cost, were higher than the conventional connection cost.
Durability: moderately negative
The shallow tubing installed in the community as a result of pro-poor technology did not withstand the weight of the Lorries passing through and often broke down. Maintenance of the infrastructure was the responsibility of the community members and this exposed them to hazardous conditions, especially while clearing blocked sewage. The slope in El Alto resulted in blocking of sewerage lines and low pressure in water connections.

322
Summary of results There was no guarantee that the poorest areas would be those targeted for new connections. Generally, the poorest areas are those on the margins of cities, farthest away from the formal network and, therefore, requiring extensive pipe-work to connect them. Rather than emphasising new connections to these distant places, however, in the Aguas del Illimani case ‘new connections’, especially for drinking water, mainly comprised the densification of the existing network in areas already serviced.
In other words, new in-house connections and secondary piping were provided to homes in zones where the main network infrastructure of deep pipes was already present. Such zones are usually in established neighbourhoods, where large plots of land have been sub-divided over time and new dwellings built.
Water management in El Alto implied a number of hidden costs for poor users, one of which was the lack of a widespread metering system. Poor users without meters continue to ‘overpay’ for their water, because they are charged at the average rate established by the company. These increased costs are very real for those living on the margins, near the poverty line.
Brief theory of change The situation was complicated by the fact that the Aguas del Illimani contract was unclear about whether the mandate to extend targets referred to the full area of the concession (which includes poor outlying communities not yet connected to the network), or only to the existing service and coverage area.
Tariff systems in La Paz–El Alto, established in the contract, generally follow pro-poor criteria by focusing on pricing structures based on consumption. These consumption charges are also linked to a commitment in the contract to install water meters, to ensure that the poor only pay for the amount of water they consume. At first glance, therefore, the La Paz–El Alto concession appears to operate a pro-poor pricing structure.
Despite the fact that the pricing systems for Aguas del Illimani adopt pro-poor structures based on consumption rates and, when introduced, were an improvement upon systems operating in other Bolivian cities, the model still contains crucial elements that work against benefiting the poor. Rather than being driven by social-equity goals, which focus on the payment capacity of the population, the concession reflects what Bakker (2001) terms ‘economic equity criteria’ (the principle of economic benefit for the company based on full-costs recovery). Consequently, pro-poor claims about the tariff structures in the Aguas del Illimani contract seem somewhat overblown.
R 65 / A 22
I. Study Details
Authors Massoud, M,Maroun, R, Abdelnabi, H, Jamali, I and El-Fadel, M
Year 2013

323
Title Public perception and economic implications of bottled water consumption in
underprivileged urban areas
Journal Environ Monit Assess
Source Electronic database
II. Study coverage
Basic service Water
Country Jordon, Lebanon
Cities Irbid, Tripoli
III. Context and intervention
Type of settlement/slum Low-income
Nature of agencies
involved in planning and
service provision
Government
Provision of in-house piped-water connection
Form of user
participation
-
Project/intervention
funding agency
Jordan
State government
Lebanon
State government
IV. Research design
Aim of the study This paper presents a comparative assessment of the public perception of drinking-water quality in two underprivileged urban areas in Lebanon and Jordan, with similar cultural and demographic characteristics.
It compares the quality of bottled water to the quality of drinking water supplied through the public network and examines the economic implications of bottled-water consumption in the two study areas.
Type of study Quantitative

324
Research design Observational
Methodology used for
data analysis
Quantitative methodology
Descriptive statistics
Chi-square
V. Data and sample
Data sources Primary data
Primary data were acquired using a standardised, closed-ended, structured and coded questionnaire, which was pre-tested to ensure that the questions were understandable and clear to respondents, and that the exact meaning of the questions was captured in the English-to-Arabic translation.
Data period Not clearly mentioned
VI. Results and evidence
Evidence on outcomes Jordan
Connectivity: moderately positive
Percentage of households connected to the drinking-water network
Adequacy: moderately negative
Average water consumption rate (L/capita/day)
Affordability: inconclusive
Water consumption costs (US$/cu metre/day)
Lebanon
Connectivity: moderately positive
Percentage of households connected to the drinking-water network
Adequacy: moderately positive
Average water consumption rate (L/capita/day)
Affordability: inconclusive
Water consumption costs (US$/cu metre/day)
Summary of results In both study areas, bottled water was perceived to be of better quality than drinking water supplied through the public network. This perception affects drinking-water preferences and consumption patterns.

325
Yet, the water-quality assessment revealed that public water provided through the network system is generally of comparable quality to bottled water, and sometimes better. Moreover, in one area, the bottled-water industry is not adequately regulated to ensure purity and safety.
Brief theory of change This study highlights the evidence that fear of contamination in the public water network compels the community to purchase bottled water at a considerable financial burden, particularly for low-income families.
More importantly, the bottled water has often similar or lower quality than the public water supply, further underscoring the burden of environmental degradation that impedes poverty alleviation.
R 66 / B 5
I. Study Details
Authors Manzetti, l and Rufin, C
Year 2006
Title Private Utility Supply in a Hostile Environment
The Experience of Water, Sanitation and Electricity Distribution Utilities in
Northern Colombia, the Dominican Republic and Ecuador
Journal Inter-American Development Bank, Sustainable Development Department
Source Website search
II. Study coverage
Basic service Water and sanitation
Country Colombia, Ecuador
Cities Barranquilla, Guayaquil
III. Context and intervention
Type of settlement/slum Low-income
Nature of agencies
involved in planning and
service provision
Other
Sociedad de Aceueducto, Alcantarillado y Aseo de Barranquilla S.A. (AAA) provides the services in place of the local

326
municipality, which was doing a very poor job of service delivery.
Interagua is a SPV established to operate the concession contract for provision of water and waste-management services in Guayaquil.
Form of user
participation
Barranquilla: participation through consultation
The company developed a social-responsibility programme to show customers that they could rely on a much-improved quality of service by identifying community leaders who served as intermediaries. These leaders not only provided information to the community, but also helped the company focus on the areas for service improvement.
Project/intervention
funding agency
Private-sector
Sociedad de Aceueducto, Alcantarillado y Aseo de Barranquilla S.A. (AAA) is a mixed company. A Spanish operator owns 60%, the municipality owns 35% and the remaining 5% is owned by a small private domestic investor.
Interagua is a SPV established to operate the concession contract for provision of water and waste management services in Guayaquil.
IV. Research design
Aim of the study The aim of this paper is to analyse the innovative experiments of two
Colombian providers of electricity and water and sanitation services.
Type of study Qualitative
Research design Observational
Methodology used for
data analysis
Narrative analysis
V. Data and sample
Data sources Secondary data
Data period Not clearly mentioned

327
VI. Results and evidence
Evidence on outcomes Barranquilla
Connectivity: Moderately positive
The company made major investments to substantially upgrade the quality of water supplied, as well as increase the coverage area. Increased coverage has resulted in increased revenue for the company, as well as higher levels of customer satisfaction. Respondents to a National Bureau of Standards survey, consistently rated AAA over 4.0 on a scale of 0‒5.
Guayaquil
Connectivity: moderately positive
In the first three years of service, Interagua expanded installation with 20,000 new connections, to cover more than 100,000 people by installing new meters. Their monthly collections jumped from US$3.3m to US$5.3m in two years.
Affordability: moderately positive
Once Interagua provided water, shantytown dwellers paid an average of 26 US cents per cu meter, as opposed to US$3.50 per cu meter for water supplied by water trucks.
Summary of results The installation of new meters allowed the company to improve billing and base it upon actual, rather than estimated consumption. In other words, as monitoring improved, people began to consume less and pay more.
Once Interagua started to provide service, water supply became continuous and prices fell.
Notwithstanding the progress made, Interagua still faces daunting problems. From a financial standpoint, the long-standing tariff dispute with Ecapag has made it difficult for the company to raise money domestically and internationally, which has had a negative impact on its investment plans.
Brief theory of change Interagua’s management emphasised that the keys to success in dealing with customers rested on a substantial improvement in service quality, good communications skills, and a transparent, straightforward management style.

328
R 67 / B 9
I. Study Details
Authors Mahadevia, D
Year 2010
Title Shelter security and urban social protection: Findings and policy implications in
India
Journal Chronic Poverty Report
Source Website search
II. Study coverage
Basic service Water and Sanitation
Country India
Cities Ahmedabad and Surat
III. Context and intervention
Type of settlement/slum Slum — informal
Nature of agencies
involved in planning and
service provision
NGOs
Form of user
participation
Passive
Project/intervention
funding agency
NGOs
IV. Research design
Aim of the study This study aims to provide empirical evidence of the link between shelter
security and social protection in Ahmedabad and Surat, Gujarat.
Type of study Mixed-methods
Research design Observational

329
Methodology used for
data analysis
Simple percentage analysis
V. Data and sample
Data sources Primary data
Data period Not mentioned
VI. Results and evidence
Evidence on outcomes Evidence
Connectivity
Outcome
Moderately positive, moderately negative
Proportion of households with individual water supply
Proportion of households depending on public water supply
Proportion of households with individual toilet facility
Proportion of households accessing community toilet
Summary of results Land ownership did not influence water-supply provision by the AMC, and
nearly 89% of households in this ward received water supply at individual
level from the local government. However, the proportion of households
depending on public water-supply taps was somewhat higher (5.9%) in
slums on public land than in slums on private land (1%). The toilet-access
situation toilets, however, is better in slums on private lands than on
public lands; in the case of the former, 92% had an individual household
toilet whereas, in the case of the former, this figure was 83.5%.
Consequently, use of community-level toilets was greater in slums on
private land than on public land.
Brief theory of change The intervention of NGOs in Ahmedabad’s and Surat’s slums, together
with tenure security, had a positive impact on individual water
connections and toilet facilities.
R 68 / A 49
I. Study Details
Authors McFarlane, C
Year 2008

330
Title Sanitation in Mumbai's informal settlements: State, 'slum' and
infrastructure
Journal Environment and Planning A
Source Electronic database
II. Study coverage
Basic service Sanitation
Country India
Cities Mumbai
III. Context and intervention
Type of settlement/slum Informal settlements
Nature of agencies
involved in planning and
service provision
NGO
NGOs and engineering firms are contractors in this Slum Sanitation Project and are responsible for the construction of toilet blocks.
Form of user
participation
Participation through contribution
Community members are consulted on the design and location of the toilet blocks, and are also involved in the actual construction by contributing labour. However, the author concludes that community involvement has been very low and the main NGO has taken most of the decisions.
Project/intervention
funding agency
State government
ODA
The Brihanmumbai Municipal Corporation (BMC) uses World Bank credit, matching funds from the state government of Maharashtra to pay for water, sewer and electricity connections and provide land under the SSP.
IV. Research design
Aim of the study The aim of this paper is to examine an ongoing intervention in sanitation in informal settlements in Mumbai, India. The SSP is premised upon partnership, participation and cost-recovery in the delivery of large toilet blocks, as a practical solution to the inadequacy of sanitation, and offers an opportunity to examine

331
and test a growing consensus on sanitation provision among mainstream development agencies.
This paper argues for a more flexible approach to policy infrastructure, technical infrastructure, and cost recovery in urban sanitation interventions.
This paper also considers whether the SSP, as the largest city project of its nature in Indian history, marks a shift in the relationship between the state and the slums in Mumbai.
Type of study Qualitative
Research design Observational
Methodology used for
data analysis
Narrative analysis
V. Data and sample
Data sources Primary data
The paper is based on fieldwork conducted in Mumbai.
Secondary data
In addition to fieldwork, the tentative reflections on sanitation and the SSP programme presented in the paper draw on the work of researchers based at Mumbai’s Tata Institute for Social Sciences.
Data period Between November 2005 and April 2006
VI. Results and evidence
Evidence on outcomes Connectivity: moderately positive
300,000 people were connected to a water and sanitation network. Out of 86% of total work orders completed, 75% had water connections and 70% had an electricity connection.
Affordability: moderately negative
Community members are charged Rs10‒20 per household per month for the use of toilets.
Durability: moderately negative
91% of SPARC- (NGO) built toilets lacked water connections and 93% of the toilets lacked electricity connections. A few blocks had not been opened due to unsound construction. Overall, 25% of the new blocks lacked water connections and 81% lacked electricity connections. Furthermore, a majority of the toilet blocks are not connected to the sewerage system and instead use septic tanks. This results in blocking or over-flowing, which when not cleared, leads to disuse of the toilet blocks.

332
Maintenance of blocks is indicated as a problem due to the high ratio of use (1:250), even though a separate caretaker is appointed by the local CBO for maintenance.
Adequacy: moderately positive
Toilets are open and available for use throughout the day and night, and are well maintained by the local caretaker.
Summary of results First, the discussion of partnership and participation indicates that greater flexibility could allow a more plural policy infrastructure. The SSP could usefully make its tendering process more flexible to enable smaller NGOs to bid for smaller contracts, rather than simply favouring large contracts and NGOs. This could make space for smaller organisations that have a greater familiarity with particular settlements, and that are not divisively associated with particular groups, to use their local expertise to extend participation and maximise the sanitation needs of these settlements.
Second, the discussion, of technical infrastructure production indicates that the programme could usefully be more driven by the needs, constitution and geography of specific settlements. This could result in more effective results over the long term, including individual, twin and shared toilets, rather than simply large common blocks.
Third, the discussion of cost recovery suggests a need for caution. In particular, there may be a requirement for full subsidies in areas that clearly cannot afford to spare money (as in the case of Rafi Nagar), if sanitation delivery is to reach poorer groups. In addition, it is worth considering more effective monitoring of how contributions are being used locally, as well as more general monitoring of user and non-user views on sanitation.
Brief theory of change The SSP distinguishes itself from the previous ad hoc model of sanitation provision.
It is a citywide, long-term project to improve informal settlements. The SSP is, in part, an attempt to foster a particular kind of civic consciousness of community responsibility deemed lacking among those living in informal settlements.
To this extent, it is an attempt to instil a particular sense of urban modernity, which echoes nationalist discourses in the early years of independence.
The subaltern is condemned as lacking a sense of civic consciousness and is viewed as integral to the making of a modern city. The view peddled in the media and among many neighbourhood-improvement groups is often that it is their fault that sanitation is the way it is, and, if things don’t improve, then it is they who are to blame. For example, some BMC officials complained that one of the reasons for health problems among the poor is a lack of discipline, or the wrong mentality. These perceptions often act as an explanation for emerging shortcomings in community maintenance.
In this act of condemnation, the slum remains fixed to the terrain of population, without any inherent moral claim on the state. Slums remain populations outside of the sphere of citizenship, outside of discourses of rights, and remain, in the view of these

333
officials and many others in the city, a necessary scourge on visions of the modern, clean and ordered city.
R 69 / B 13
I. Study Details
Authors MdAdbul, B, MdMustak, A and Tofail Md Alamgir, A
Year 2012
Title Health status and its implications for the livelihoods of slum-dwellers in Dhaka city
Journal External Poverty Research Group, Shiree Working paper
Source Website search
II. Study coverage
Basic service Water and sanitation
Country Bangladesh
Cities Dhaka
III. Context and intervention
Type of settlement/slum Slum — informal
Nature of agencies
involved in planning and
service provision
NGOs
Form of user
participation
Passive
Project/intervention
funding agency
NGOs
IV. Research design
Aim of the study To investigate the impact illness has had on livelihoods, and what coping
strategies have been employed in terms of getting access to health
services and basic infrastructure.

334
To evaluate the effectiveness of existing health services and basic-
infrastructure access, including those provided by DSK.
Type of study Quantitative method
Research design Observational
Methodology used for
data analysis
Simple percentage analysis
V. Data and sample
Data sources Primary data
Data period 2011
VI. Results and evidence
Evidence on outcomes Evidence
Connectivity, adequacy
Outcome Moderately positive and moderately negative
Proportion of households with in-house piped-water connection
Proportion of households with access to yard tap outside
Proportion of households with individual toilet facility
Regular supply of water
Adequate water supply
Hours of water supply
Proportion of households with access to yard tap outside
Summary of results From the quantitative survey, it was found that 74% of slum-dwellers were using drinking water from a pipe or supply water. As government policy prevents a legal water supply, most of this water came from illegal sources and the pipes had been set up through drains and sewerage channels. The supply system was also irregular and usually only ran twice per day, for an hour at a time. The remaining 26% of respondents were using deep hand tube wells. Non-beneficiary households, in particular, used hand tube wells as more of them were from newly developed areas where no supply water is available.
The quantitative survey showed that 37% of non-beneficiary households used hanging latrines, 30% used sanitary latrines, and 30% used ring-slab latrines. Forty-four percent of beneficiary households had access to sanitary latrines, 34% used ring slabs, 13% used pit latrines, 8%used hanging latrines, and 1%used other types.
Only 54% (n=78) of beneficiary and 43% (n=30) of non-beneficiary households were using latrines with functioning,

335
water-sealed facilities. Thirty-eight percent (2 to 200 persons) of beneficiary and 46% (7 to 150 persons) of non-beneficiary households were sharing latrines among households. Each of these cluster latrines had 1‒3 chambers, but varied from house to house. The DSK-Shiree project established 62 community latrines during the last three years of the project.
Brief theory of change Bangladesh Water Supply and Sewerage Authority (WASA) policy changes
have a positive impact on in-house water connection and individual toilet
facilities. Other than the yard-tap or community-tap water supply, there
is negative impact on house water supply and an adequate amount of
water supply.
R 70 / A 28
I. Study Details
Authors Mimmi, L and Ecer, S
Year 2010
Title An econometric study of illegal electricity connections in the urban
favelas of Belo Horizonte, Brazil
Journal Energy Policy
Source Electronic database
II. Study coverage
Basic service Electricity
Country Brazil
Cities Belo Horizonte
III. Context and intervention
Type of settlement/slum Low-income
Nature of agencies
involved in planning and
service provision
Government
Provision of electricity services
Form of user
participation
-

336
Project/intervention
funding agency
State government
IV. Research design
Aim of the study This paper studies the incidence and determinants of illegality in the
context of low-income urban favelas. The probability of engaging in
illegal behaviour is explained not just by low income, but by a
combination of concurring factors: sub-standard energy provision and
equipment, inefficient/incorrect use of domestic electric appliances, and
running an informal in-house business.
Type of study Quantitative
Research design Observational
Methodology used for
data analysis
Quantitative
V. Data and sample
Data sources Primary data
We use data from the baseline survey conducted by the Conviver Agents in 12 Belo Horizonte communities.
Data period October 2006 to October 2007
VI. Results and evidence
Evidence on outcomes Adequacy: moderately positive
Affordability: inconclusive
Summary of results Illegal connections and energy thefts are mostly explained as the urban slum-dwellers’ response to non-affordable prices of electricity.
The findings from the analysis of the Conviver-programme data (carefully controlling for endogeneity of certain variables) verify this intuitive explanation that low incomes lead to illegality, but, importantly, also prove how income is not the only relevant factor.
In obtaining these results, we assess the determinants of illegality in a comprehensive way, taking into account also the socio-economic texture of these communities.
Brief theory of change A robust outcome of the present study is that, when energy is supplied via poor-quality equipment and the supply is

337
consequently of a low, the probability of illegal behaviour consistently increases.
This is not a purely technical issue, but one that has social and cultural implications for the urban favela residents, as well. In fact, poor-quality equipment and unreliable and unsafe delivery (together with disproportionate costs) aggravate the perception of exclusion and abandonment among low-income customers, thereby creating a further incentive to illegality.
This finding validates the emphasis that many recent slum-electrification programmes put on tangible improvements in energy equipment and service for low-income customers, as a way to overcome hostility and the sense of disparity that is at the root of illegality. In general, once the service improves in a noticeable way, the non-payment culture that generates non-technical losses slowly starts to change.
R 71 / B 10
I. Study Details
Authors Moulik, T, Singh, N, Mallick, M and Datta, S
Year 1999
Title Energy provision for the urban poor
Journal Environmental Resources Management India, Report
Source Website search
II. Study coverage
Basic service Electricity
Country India
Cities New Delhi
III. Context and intervention
Type of settlement/slum Slum — formal and informal
Nature of agencies
involved in planning and
service provision
Government

338
Form of user
participation
Passive
Project/intervention
funding agency
Government
IV. Research design
Aim of the study This study focuses on the urban poor and their specific problems related
to access to energy, and the impacts on them of current government
policies on energy provisions.
Type of study Mixed-methods
Research design Observational
Methodology used for
data analysis
Simple percentage analysis
V. Data and sample
Data sources Primary and secondary data
Household survey
Case studies
NSSO data 1997
Data period NSSO data 1997, (primary household survey data-collection period not
mentioned)
VI. Results and evidence
Evidence on outcomes Evidence
Connectivity and affordability
Outcome
Moderately positive and moderately negative
Households’ monthly per capita consumption of electricity as proportion of overall spending
Proportion of households with legal electricity connection
Summary of results Although electricity was available in all the clusters, households did not have legal connections, and were using street lighting connections. This is a common practice in areas where households do not have a legal electricity supply. Households buy their own wires, make a loop or hook at the end, and attach

339
that hook to the low-tension wires running over their houses for street lighting. Electricity is accessed in this way, and is connected to switchboards in the houses and used for various purposes. Meters had not been installed in any of the houses. All the households possessed at least two electrical gadgets, mainly for lighting (bulbs and tube lights) and cooling (fans and coolers) purposes.
As none of the houses had meters provided by the government, no-one received any bills for the use of electricity. However, in places, informal systems had been set up within clusters, with one or two people taking responsibility for installing wires on to the electric cables (hooking) and of maintaining and repairing whenever necessary. Each household paid between Rs25‒50 per month as maintenance costs to these middlemen. In other places, families had set up their own wires, and only paid a paltry Rs5‒10 for maintenance to local electricians.
Brief theory of change Under the government provision, there is a positive impact on cost and
consumption of electricity in the formal slums, while there is a negative
impact on electricity connections in the informal slums.
R 72 / A 9
I. Study Details
Authors Mustafa, D and Reeder, P
Year 2009
Title People is all that is left to Privatize: Water supply privatization, globalization and
social justice in Belize City, Belize
Journal International Journal of Urban and Regional Research
Source Electronic database
II. Study coverage
Basic service Water
Country Belize (Central America)
Cities Belize
III. Context and intervention
Type of settlement/slum Informal settlements

340
Nature of agencies
involved in planning and
service provision
Private
Form of user
participation
Contribution
Private provider to provide the urban water supply to the informal
settlements
Project/intervention
funding agency
Private
IV. Research design
Aim of the study To study the perception of water-supply privatisation in Belize City’s
informal settlements
Type of study Mixed-methods
Research design Observational
Methodology used for
data analysis
Statistical method
Descriptive analysis
V. Data and sample
Data sources A total of 225 questionnaires distributed across Belize City, including
informal settlements, and a convenience sampling method was adopted.
Questionnaire-survey method
Focus group discussions
Data period 2005 (Pre- and post-privatisation)
VI. Results and evidence
Evidence on outcomes Connectivity: moderately positive
Access to piped-water connection by indoor plumbing
Affordability: moderately positive
Cost of accessing water services pre- and post-privatisation
Adequacy: moderately positive
Proportion of households with reliable and quality water supply, post-privatisation

341
Summary of results Belize City survey indicated 82% households having s proper water connection; the remaining 18% from the poorest part of the city were associated with sources of domestic water including public faucets, neighbours, street pipes and, most commonly, stored of rainwater, in addition to bottled water for drinking.
The study revealed that 31% of households felt that access to water was better pre-privatisation, while 42% and 27% of the households, respectively, felt that it was either the same or much worse.
Affordability of water supply: 84% of households reported that it was less affordable than before privatisation, while only 5% of the households reported that it was more affordable and 11% that it was just as affordable as pre-privatization.
Brief theory of change The experience of water-supply privatisation was largely negative. Residents complained bitterly about an increase in water tariffs and excessive disconnection rates by the privatised Belize Water Supply Limited (BWSL).
Many policymakers also accused BWSL of front-loading investments and not making strategic investments in infrastructure. But the symbolic significance of water privatisation for the residents of a small Caribbean country such as Belize exceeded its practical implications.
We argue that the major themes to emerge from the ethnographic data collected for the study can be synthesised into three ‘popular privatization narratives’ (PPNs). The first is based on the perception that poor governance led to privatisation; the second is based on a preference for national over global-scale politics, so that objections to privatisation were based on nationalism; the third on angst about losing control to the systemic compulsions of neo-liberal globalization.
R 73 / A 32
I. Study Details
Authors Obrist, B, Cisse, G, Koné, B, Dongo, K, Granado, S and Tanner, M
Year 2006
Title Interconnected Slums: Water, Sanitation and Health in Abidjan, Côte D’Ivoire
Journal The European Journal of Development Research
Source Electronic database

342
II. Study coverage
Basic service Water and sanitation
Country Côte d’Ivoire
Cities Abidjan, Dokoure and Yao-sehi
III. Context and intervention
Type of settlement/slum Both formal and informal settlements
Nature of agencies
involved in planning and
service provision
Abidjan: water: private (SODECI)
Private provision of water supply
Abidjan: sanitation: local government
Provision of sewerage service
Dokoure: water: local government
Installed water pumps
Yao-sehi: water: private: PAMS & NGO
Construction of communal taps
Form of user
participation
Yao-sehi
Participation through providing information (community request for water service)
Project intervention
funding agency
Abidjan: water: private (SODECI)
Abidjan: sanitation: local government
Dokoure: water: local government
Yao-sehi: water: private: PAMS & NGO
IV. Research design
Aim of the study This paper questions whether a focus exclusively on slums is useful for the examination of the provision of water, sanitation and health in African cities and suggests a complementary perspective, emphasising urban interconnectedness.
Using a comparative-case-study approach, it examines responses to environmental conditions in urban, as well as rural contexts along drainage channels in Abidjan, West Africa.
The paper traces linkages on various and partly interrelated analytical levels: spatial, material, social, political, local, national and international. Such an analysis of multi-level dynamics

343
between stakeholders contributes to a better understanding of slums as a phenomenon of urbanisation.
Type of study Mixed-methods
Research design Observational
Methodology used for
data analysis
Quantitative
V. Data and sample
Data sources Primary data
Conducted household survey, in-depth interviews. The study was carried out in Abidjan, the commercial centre in Côte D’Ivoire.
Secondary data
Data period 2003 to 2005
VI. Results and evidence
Evidence on outcomes Abidjan
Water: connectivity: moderately negative
Households with water in-house connection
Households receive water from public tap
Water: adequacy: moderately negative
Households get water supply at a low pressure
Water: effort and time: moderately negative
Households walk long distances to fetch water
Sanitation: connectivity: moderately negative
Households connected to sewerage service
Dokoure: connectivity: inconclusive
Households get water supply through water pumps
Yao-sehi: connectivity: inconclusive
Households get water supply from community taps
Summary of results The new, illegal and ethnically heterogeneous inner-city ‘slums’ are becoming better connected to the municipality and official service providers than the old, legal Ebrié villages. These findings indicate that connectedness has a dynamic dimension and may

344
change in intensity: links do not just exist, they are strengthened and maintained, but they can also be weakened and given up.
This means that individuals, households and communities are not only social actors, but stakeholders who push their interests forward, whether this means building illegal water connections or mobilising community members to form neighbourhood committees. For example, in the case of illegal water connections, collective action has forced the SODECI company and the government into action to license water resellers. The formation of local neighbourhood organisations enables representatives to create political connections, both in horizontal (with similar committees in other neighbourhoods), and vertical (with municipal, city and national governments) directions.
Brief theory of change The findings of this study suggest that a rigid division between the development of ‘slums’ and the rest of the city does not reflect the reality of African cities. A focus on interconnectedness, rather than differentiation, is needed for a better understanding of slums as a structural phenomenon of urbanisation. This is particularly true for approaches to the study of environmental health in densely populated urban areas. The three closely interrelated issues of fluid- and solid-waste removal, water provision and healthcare call for a broader and more integrated perspective. Waste produced in one area may cause pollution in another area, and the provision of services to a large number of households necessitates concerted action.
Not only the material flow, but, more importantly, the management of waste water connects various settlements (horizontal connections), as well as individuals, social groups and institutions (vertical connections). Networks of sewage channels and water pipes are concrete manifestations of connections between service providers and households. Policies, regulations and contracts are less visible, but also create connections between government bodies, private companies and customers.
R 74 / A 19
I. Study Details
Authors Omole, K
Year 2010
Title An assessment of housing conditions and socioeconomic life styles of
slum dwellers in Akure, Nigeria
Journal Federal University of Technology
Source Electronic database

345
II. Study coverage
Basic service Water, sanitation and electricity
Country Nigeria
Cities Akure
III. Context and intervention
Type of settlement/slum Informal settlement
Nature of agencies
involved in planning and
service provision
Government
Provide piped in-house water connection
User involvement
Construction of toilets at home
Form of user
participation
User involvement
Participation through self-mobilisation
Project/intervention
funding agency
Central government
IV. Research design
Aim of the study The study seeks to assess the condition of housing and the socio-economic life style of slum-dwellers in Akure’s urban centre.
To effectively carry out this assessment, the various components of the buildings need to be examined in terms of materials used for construction, age of building, structural condition of building, the level of household facilities and infrastructure available within the neighbourhood.
Also, the literacy level, occupation and income-distribution pattern of respondents, the effects of slum condition of the residents were equally investigated.
Type of study Quantitative
Research design Observational
Methodology used for
data analysis
Quantitative

346
V. Data and sample
Data sources Primary data
Secondary data
The data for this study was collected through primary and secondary sources. Questionnaire administration constitutes the major instrument used in information collection.
Information from related ministries and government departments, in particular, the state Ministry of Environment, Town Planning Office and Akure South Local Government Secretariat were also used.
Data period 2006
VI. Results and evidence
Evidence on outcomes Water: connectivity: moderately positive
Proportion of households with piped-water connection
Sanitation: connectivity: moderately negative
Proportion of households with toilets
Electricity: connectivity: moderately positive
Proportion of households with electricity connection
Electricity: adequacy: moderately positive
Reliability of electricity supply
Summary of results The main source of water supply is largely through underground well water, some of which has shallow depth. This poses some problems because the water is not treated before use. Only a small proportion of the population, about 14.3%, enjoys tap water, supply of which is not regular. From this situation, the existing water supply does not guarantee a good-quality water supply in the area, hence the people are at greater risk of contracting acute water-borne diseases. The state of waste disposal in the area is generally absurd, in spite of government efforts to curb indiscriminate disposal.
Over 30% dispose of their refuse indiscriminately, some in open spaces (21.3%); some through burning within a residential environment, thereby causing air pollution (11.7%); and 1.7% leaves theirs at roadsides and drainages, where nobody disposes of it.
The main source of electricity supply to the area is through the Power Holding Company of Nigeria (PHCN), which accounts for over 90% of the sampled buildings. About 1.7% use generating plants as supplements, while 17.4% depends solely on hurricane lamps. This is quite impressive, except for the erratic nature of the electricity supply from the PHCN.

347
Brief theory of change Findings from the study reveal that the area chosen for the study exhibits slum conditions that have an undeniable impact on the socio-economic lifestyles and the health of the residents, as well as the general outlook for the environment.
Recommendations were proffered to guide policymakers towards enhancing the lives of the residents of the area. Some of these include an upgrading programme through the provision of urban basic services and improved sanitation strategies for sustainable management of the area. A public-enlightenment campaign is also recommended, so that the residents know the importance of good living conditions to their health and recognise the dangers of abusing their environment.
R 75 / E 2
I. Study Details
Authors Owusu, G and Afutu-Kotey, L
Year 2010
Title Poor urban communities and municipal interface in Ghana: A case study
of Accra and Sekondi-Takoradi metropolis.
Journal Centre for African Studies
Source Google Search
II. Study coverage
Basic service Sanitation
Country Ghana
Cities Accra and Sekondi-Takoradi
III. Context and intervention
Type of settlement/slum Informal settlement
Nature of agencies
involved in planning and
service provision
CBO
After devolution, the Metropolitan Assemblies attempted to provide poor urban communities with toilets and solid-waste

348
collection by sub-contracting public services to micro-enterprises and individuals.
Form of user
participation
-
Project/intervention
funding agency
Others
Decentralisation programme was initiated by the government. Metropolitan Assemblies sub-contract public services and communities pay for the use of toilets and solid-waste services.
IV. Research design
Aim of the study The aim of this article is to explore slums and municipal interfaces in Ghana, based on a study carried out in selected poor communities in two metropolitan areas of Ghana, namely, Accra and Sekondi-Takoradi.
It also explores the effectiveness of Metropolitan Assemblies (municipal governments) in Accra and Sekondi-Takoradi in engaging poor communities, as well as addressing the needs of these communities.
Type of study Qualitative
Research design Observational
Methodology used for
data analysis
Narrative analysis
V. Data and sample
Data sources Primary data
The primary data generated from interviews, FGDs, and transect walks included oral histories of settlements, community infrastructure/services and opportunities, social structures, and local-government activities in the communities.
Secondary data
The secondary data sources generated information on the general Ghanaian urban environment: governance structure of Ghanaian cities; key stakeholders and their influence on urban development; and city-level poverty levels.
Data period June‒July 2008
VI. Results and evidence
Evidence on outcomes Connectivity: moderately negative

349
Although users pay for the service, the quality has remained very poor. In
fact, some respondents claimed the service had worsened after
decentralisation and sub-contracting.
Summary of results Poor urban communities in Accra and Sekondi-Takoradi are confronted by weak infrastructure and services provision. Most critical to these poor urban communities is the poor state of waste and sanitation facilities.
To address this situation, Accra Metropolitan Assembly (AMA) and the Sekondi-Takoradi Metropolitan Assembly (STMA) have adopted two approaches: namely, privatisation and community-based participation in waste collection and management of public toilets.
These approaches have, however, run into difficulties, due to weak local institutional structures (especially local-government sub-structures) to monitor the activities of private operators, as well as public agitation regarding payment for poor services.
In addition, the franchising of waste collection and sanitation has enhanced the city government’s political patronage, as contract awards have become a means of rewarding political loyalists. This has further weakened the Metropolitan Assemblies’ capacity to regulate private operators and ensure improved service delivery.
Brief theory of change In large metropolitan areas such as Accra and Sekondi-Takoradi, changes are occurring within the context of the decentralisation programme introduced in 1988. A widely shared view is that poor city infrastructure and neighbourhoods are the result of poor city governance.
In this direction, decentralisation has been strongly advocated as a solution to the emergence of urban slums and other challenges of rapid urban growth in many parts of the developing world.
However, the Ghanaian case, as explored in this study, indicates that decentralisation is unlikely to have meaningful impact on poor urban communities if it is based on mere rhetoric.
R 76 / A 27
I. Study Details
Authors Parikh, P, Chaturvedi, S and George, G
Year 2012
Title Empowering change: The effects of energy provision on individual aspirations in
slum communities
Journal Energy Policy
Source Electronic database

350
II. Study coverage
Basic service Water
Country India
Cities Ahmadabad, Baroda
III. Context and intervention
Type of settlement/slum Formal settlement
Nature of agencies
involved in planning and
service provision
User involvement
Self-construction of services
Form of user
participation
Participation through partnership
Partnership with the government to access their needs
Project/intervention
funding agency
Community residents
IV. Research design
Aim of the study This paper discusses the role of energy provision in influencing the social aspirations of people living in slums.
This paper examines the factor that influences the shift in aspirations in five slum settlements.
Type of study Mixed-methods
Research design Observational
Methodology used for
data analysis
Quantitative
V. Data and sample
Data sources Primary data
We examine factors that influence the shift in aspirations in five slum settlements, using data from 500 interviews conducted in serviced and non-serviced slums from the state of Gujarat in India.
Data period 1996 and 2006

351
VI. Results and evidence
Evidence on outcomes Connectivity: inconclusive
Summary of results The non-serviced slums did not have access to basic services such as water, sanitation, energy, roads, solid waste and rainwater management.
It was found that, when basic infrastructure provisions are met, slum-dwellers shift their focus from lower-order aspirations to higher-order aspirations, such as healthcare, education, housing and land ownership.
The study argues that energy provision enhances productivity and enables slum-dwellers to shift their aspirations upwards.
Furthermore, the study test the effect of work-days lost due to illness on the relationship between higher-order aspirations and aspirations for energy provision. When provision of energy is low, greater work-day losses dampen higher-order aspirations.
For policymakers, this study highlights the critical link between the infrastructure services preferred by slum-dwellers and their social aspirations for growth.
Brief theory of change In India, issues surrounding access to basic services such as electricity, piped water, and cooking fuels provoke extensive policy debates about the role and level of intervention and investment on the part of the state.
From a policy perspective, the prioritisation of services that match social norms and individual aspirations in slums implies that initial government investment can be more effectively targeted towards lower-order services.
In order to trigger co-investment and community investments in creating housing stock, for example, the provision of basic services such as water, sanitation and energy, can be used as a powerful incentive.
Such targeted government interventions could empower slum-dwellers to shift from inferior living conditions to a clean environment with reasonable housing, healthcare and educational facilities.
R 77 / A 50
I. Study Details
Authors Rana Md, M
Year 2011
Title Urbanization and sustainability: Challenges and strategies for sustainable urban
development in Bangladesh
Journal Environment Development Sustainability

352
Source Electronic database
II. Study coverage
Basic service Water
Country Bangladesh
Cities Dhaka
III. Context and intervention
Type of settlement/slum Informal settlements
Nature of agencies
involved in planning and
service provision
Government and NGO
In Bangladesh, the WSS services are provided by the public authorities
named Water Supply and Sewerage Authority (WASA), Department of
Public Health and Engineering (DPHE) and Local Government and
Engineering Department (LGED). There are some NGOs that are working
for water and sanitation, besides government.
Form of user
participation
-
Project / intervention
funding agency
State government
IV. Research design
Aim of the study This paper attempts to examine this situation, drawing upon examples of developing cities in general and Dhaka in Bangladesh, in particular.
The paper indicates that the inadequacy of infrastructural services, basic amenities and environmental goods, environmental degradation, traffic jams and accidents, violence and socio-economic insecurity are the major challenges for the city.
To analyse these challenges, the paper provides an overview of urbanisation of the world and tries to introduce Dhaka as one of the fastest-growing megacities in developing countries, which suffers from inadequacy of water supply.
Type of study Qualitative

353
Research design Observational
Methodology used for
data analysis
Narrative analysis
V. Data and sample
Data sources Secondary data
The paper is based on secondary data that were collected from different published and unpublished documents.
Data period Not clearly mentioned
VI. Results and evidence
Evidence on outcomes Connectivity: moderately negative
Only 7 1% of the demand for water is met.
Affordability: moderately negative
Since water ‘lords’ supply water to the communities illegally, they often charge much more than the normal water charge in the city. People pay due to their dependence on these water lords and also because of their need for clean drinking water.
Effort and time: moderately negative
45.8% of slum clusters shared one tap connection between 6‒10 households.
Adequacy: moderately negative
Slum-dwellers have to pay Tk400/month for water supplied for one hour per day.
Summary of results DWASA is capable of supplying only 184m l of water (71% of the demand) per day for the population of about 10m, while the demand of the consumers is 256m l per day.
Therefore, small segments of the city population are receiving an adequate supply of piped water, and the rest of the population are experiencing inadequate supply of water, while the situation in low-income communities is unpleasant. The price and pricing mechanism of water varies from settlement to settlement, depending upon ownership patterns. Community leaders decide how much each family will pay.
The case study of water supply in Dhaka demonstrates that a large proportion of people in the city do not have access to water connections or a formal water-revenue system. It also emphasises the issue of ‘system hijacking’ in the name of system losses by the water lords and corrupt DWASA officials.
Brief theory of change The real problems of water and sanitation provisions are:
354
Incomplete customer base.
Unmetered connections.
Illegal and illegally reconnected service connections.
Inaccurate and tempered meters, and
Incorrect meter reading as part of corrupt practice of the revenue collectors.
Technical losses, which include leaking piped water because of poor management, and illegal motors used in pipelines.
R 78 / A 29
I. Study Details
Authors Reddy, B , Balachandra, P and Nathan, H
Year 2009
Title Universalization of access to modern energy services in Indian households:
Economic and policy analysis
Journal Energy Policy
Source Electronic database
II. Study coverage
Basic service Electricity
Country India
Cities NSSO — 64th round
III. Context and intervention
Type of settlement/slum Low-income
Nature of agencies
involved in planning and
service provision
Government
Provision of electricity services
Form of user
participation
-
Project/intervention
funding agency
State government

355
IV. Research design
Aim of the study The individual goals of this paper are to (i) study existing energy-use
patterns in the household sector; (ii) estimate the number of needy
households; (iii) estimate the economics of providing modern energy
services to all; (iv) estimate the environmental cost of such
universalisation; (v) develop a PPP business model in this regard; and (vi)
suggest an enabling policy framework for implementation.
Type of study Quantitative
Research design Observational
Methodology used for
data analysis
Quantitative
V. Data and sample
Data sources Secondary data
This study uses the National Sample Survey (NSS) data, 61st round, on
consumer expenditure.
Data period 2004‒05
VI. Results and evidence
Evidence on outcomes Adequacy: moderately negative
Quantity of electricity used per month, per household (kWh)
Affordability: inconclusive
Income spent on electricity by households (Rs/unit)
Summary of results A targeted programme based access creation is proposed, which envisages multi-stakeholder responsibility and cost sharing. A desirable scenario is developed with base year 2010–11 and 2030–31 as the final target year for universal provision of modern energy services; the interim period is divided into four five-year plans. The cost estimates of energy empowerment are calculated separately for rural and urban areas, where the former is higher than the later due to greater deprivation.
The annual investments for the four plan periods are estimated to be Rs93bn, Rs93bn, Rs102 and Rs87bn,. respectively. The annual CO2 emission-reduction potential is quite substantial at 94m tons (mt) at the end of 2016, which reaches a peak of 458 mt by the end of 2031, when all the households are projected to have provision of modern energy services. The cumulative CO2-
356
emission reduction in the entire plan period is approximately 2300 mt.
At the outset, it appears that the combination of benefits accruing through energy access, improved living standards of the poor, livelihood opportunities and climate-change mitigation more than justifies the expected investments.
Brief theory of change The following are some of the driving forces of, and barriers to,
improvement.
Political will
Centralisation/decentralisation
Initial cost
Fuel inferiority
Social advocacy
Academic activism
R 79 / A 51
I. Study Details
Authors Roma, E and Jeffrey, P
Year 2011
Title Using a diagnostic tool to evaluate the longevity of urban community
sanitation systems: A case study from Indonesia
Journal Environment Development and Sustainability
Source Electronic database
II. Study coverage
Basic service Sanitation
Country Indonesia
Cities Java and Bali
III. Context and intervention
Type of
settlement/slum
Informal settlements

357
Nature of agencies
involved in planning
and service provision
Government and NGOs
Local government and NGOs implement the SANIMAS approach to Decentralized wastewater treatment systems (DEWATS). Bremen Overseas Research and Development Agency (BORDA) offers technical support.
Form of user
participation
Participation through consultation
SANIMAS is a community-developed programme where community members participate in the implementation and management of the DEWATS infrastructure.
Project/intervention
funding agency
Central government
Government of Indonesia introduced the SANIMAS programme as a pilot case study.
IV. Research design
Aim of the study The aim of the study is to compare the intended performance and benefits of DEWATS technologies with early post-implementation user experiences.
The timing of such an evaluation is significant, as sufficient opportunity is still available to diagnose potential challenges and develop sound solutions. The article contributes to the continuing discourse on MDG achievement by exploring those aspects that may compromise sustained and beneficial use of sanitation technologies.
Type of study Qualitative
Research design Observational
Methodology used for
data analysis
Narrative analysis
V. Data and sample
Data sources Primary data
Survey and qualitative interviews
Data period Between 2003 and 2008
VI. Results and evidence
Evidence on outcomes Connectivity: moderately positive
78% of communities surveyed used the communal sanitation centres (CSD) and 100% used the simplified sewerage system (SSS) of DEWATS.

358
Adequacy: moderately negative
Users reported difficulties such as poor or intermittent water supply, clogged waste-water pipes and poor maintenance.
Durability: moderately negative
Users’ inability to fix the technical problems represents a challenge in maintaining the technology. The social and managerial aspects. such as maintenance and queuing outside facilities. are disincentives for people to use the DEWATS facility.
Summary of results This study investigated the intended performance and experience of DEWATS by means of interviews with key stakeholders and users.
The analysis of results shows that SANIMAS is a financially, socially and environmentally effective programme, well suited to improving progress towards the attainment of MDG Target 10.
Users believe SANIMAS to be an affordable approach and recognise the health benefits gained from the use of appropriate sanitation.
The high degree of community satisfaction with DEWATS and users’ proactive attitudes towards problem-solving, generated by the use of participatory approaches in the planning and implementation stages, is equally rooted in the country’s tradition of community-development programmes and well established village committees.
Compared to other community-managed approaches implemented in developing countries, the SANIMAS participatory programme has proven to be successful to DEWATS implementation.
The balance between technical soundness and knowledge management, coupled with the country’s tradition of community activism, contributes to a high level of ownership for the implemented technologies.
Notwithstanding the positive engagement of communities, in fact, two main discrepancies between technology’s intended performance and users’ experiences have emerged from the RECAP assessment. A first challenge relates to a lack of mechanisms to monitor and assess problems within communities.
Each community presents a specific set of problems perceived as challenges to sustained system use. A high number of communities are preoccupied with challenges posed by technical problems with DEWATS.
Brief theory of change Within the Indonesian government, a lack of organised strategies, coupled with shortage of trained and skilled staff, undermines the ability to sustain successful and accepted sanitation, in a legal environment featuring no specific regulations to allocate responsibilities and enforce practices for maintenance and monitoring.
The lack of institutional agendas for system maintenance corroborates the argument increasingly maintained by scholars, which warns of a limitation of community- (and demand-) driven approaches, which may lead to a process of disenfranchisement

359
by local governments from playing a supportive role to WatSan technology users.
R 80 / A 11
I. Study Details
Authors Russ, L and Takahashi, L
Year 2012
Title Exploring the influence of participation on programme satisfaction:
Lessons from the Ahmedabad slum-networking project
Journal Urban studies
Source Electronic database
II. Study coverage
Basic service Water and sanitation
Country India
Cities Ahmedabad
III. Context and intervention
Type of settlement/slum Formal settlement
Nature of agencies
involved in planning and
service provision
NGO
Gujarat Mahila Housing SEWA Trust (MHT), SAATH and World Vision.
Form of user
participation
Participation through contribution
Residents who continue to participate in the project (via maintenance and community-development activities)
Project/intervention
funding agency
CBO
IV. Research design
Aim of the study This paper examines the importance of continued project involvement and participation for long-term resident satisfaction in terms of programme results, after services have

360
been provided and municipal funding for community involvement withdrawn.
In so doing, the authors seek to clarify project satisfaction, given what other scholars have argued, namely, that professed programme satisfaction may be a less accurate reflection of the quality of services provided, and is more likely to reflect other factors, such as individual preferences, socio-economic status, strength of social networks and neighbourhood location.
Type of study Quantitative
Research design Observational
Methodology used for
data analysis
Quantitative
V. Data and sample
Data sources Primary data
A survey of 300 CBO leaders and members, representing 38 separate neighbourhood organisations in Ahmedabad, was conducted.
Data period January and June 2009
VI. Results and evidence
Evidence on outcomes Adequacy: moderately positive
Satisfaction in respect of quality and quantity of water service.
Satisfaction in respect of quality and quantity of sewerage service.
Summary of results All four models of respondent satisfaction suggest that continued involvement and participation in the project (as measured by meeting attendance), access to and pursuit of redress (frequency of service requests on behalf of the community), and an on-going partnering relationship with a sponsoring NGO are associated with respondents’ expressing greater satisfaction with project outcomes.
Nevertheless, the results of the logistic regression models used to explain the variation in negative comments about specific service types have greater explanatory value than a general measure of overall satisfaction with programme quality.
The models also suggest that different characteristics are significant in explaining the variation in negative comments and how CBO and NGO organisational factors might matter in the variation of negative comments made by respondents.
Brief theory of change For overall SNP satisfaction, participation in the CBO (measured by attendance at meetings of the CBO) was positively associated with overall SNP satisfaction.

361
For water services, however, negative comments were associated with not having a strong partnering relationship with the sponsoring NGO, and with not communicating with the NGO or with the municipality to request service assistance.
Negative comments about sewerage services were associated with being a member of the ethnic/linguistic majority, lower density of projects per city region, and not contacting the sponsoring NGO to request service assistance.
Finally, negative comments for street-lighting services were associated with being a member of a not-highly active CBO and contacting the municipality (in contrast to the other service types, in which contacting the municipality was associated with less likelihood of negative comments).
These results suggest that satisfaction with service types differs substantially in terms of the importance of CBO activity, contact with NGOs and municipalities, as well as project characteristics (density of projects in city region) and community characteristics (neighbourhoods’ relative wealth).
R 81 / E 9
I. Study Details
Authors Sankar, S
Year 2005
Title Study of the World Bank-financed slum-sanitation project in Mumbai
Journal Water and Sanitation Programme (WSP) and The World Bank Research Report
Source Google Scholar
II. Study coverage
Basic service Water and sanitation
Country India
Cities Mumbai
III. Context and intervention
Type of settlement/slum Slum — informal

362
Nature of agencies
involved in planning and
service provision
Government
Form of user
participation
Passive
Project/intervention
funding agency
Government
IV. Research design
Aim of the study Suggesting an appropriate demand-responsive participatory approach to scaling up sustainable environmental-sanitation services in Mumbai, which enable improvement in the quality of life of slum-dwellers, recognising the constraints of land availability, complex land-ownership issues and the existence of several supply-driven sanitation programmes being implemented by various agencies.
Recommending an appropriate and effective strategy and operational plan that will enable the implementation of a cost-effective, sustainable, replicable, socially and environmentally acceptable slum-sanitation programme. This plan is expected to give due consideration to bundling of environmental sanitation services via coordinated implementation efforts of various actors involved after defining key risks, and possible mitigation measures.
Type of study Quantitative
Research design Observational
Methodology used for
data analysis
Simple percentage analysis
V. Data and sample
Data sources Primary survey
MCBM Slum Survey
Data period 2001
VI. Results and evidence
Evidence on outcomes Evidence
Connectivity, adequacy
363
Outcome
Moderately positive, moderately negative
Proportion of households with individual water connections
Proportion of households accessing public tap water
Proportion of households receiving water for less than one hour per day
Proportion of households satisfied with the adequate amount of water supplied
Proportion of households with access to community-toilet facility
Summary of results The survey indicated that water to nearly half (49%) of the settlements is supplied through shared connections. Individual household connections are available in 5% of the slums, while 12% of the slums are only provided with stand posts. The study further indicates that there are no water-supply arrangements in 17 slums, with an estimated total population of 100,000.
More than half of the surveyed households reported that they receive a sufficient quantity of water; however, almost 43% mentioned that the quantity of water received is insufficient.
The duration of water supply was reported to be less than an hour per day in 3% of the study slums. In 23% of the study slums, it was reported to be between one and three hours a day, whereas, in 40% of slums, it was reported to be 3–5 hours. The remaining 34% of slums reported the duration to be more than five hours. In the Chikhalwadi slum in Govandi, there is no piped-water supply. The residents in this slum fetch water from long distances, as observed.
A majority of study households (84%) expressed satisfaction over the quality of water supplied. Nevertheless, nearly 16% of households complained that the water was contaminated.
The Slum survey indicated that populations in nearly three-quarters of the slums had access to public toilets, with 17% of the population of the Mumbai slums having access to individual toilets. Fewer than 5% of the slum population had access to other facilities, including mixed provisioning, pay-and-use toilets (less than 1% each), and one slum has mobile-toilet facilities. Residents in more than 5% of slums exclusively practise open defecation, due to absence of sanitation facilities. These are clearly primary areas for MCBM interventions, irrespective of tenure or other constraints.
Brief theory of change MCBM interventions are enhancing the provision of basic services to the
slum-dwellers but with inadequate proportion.
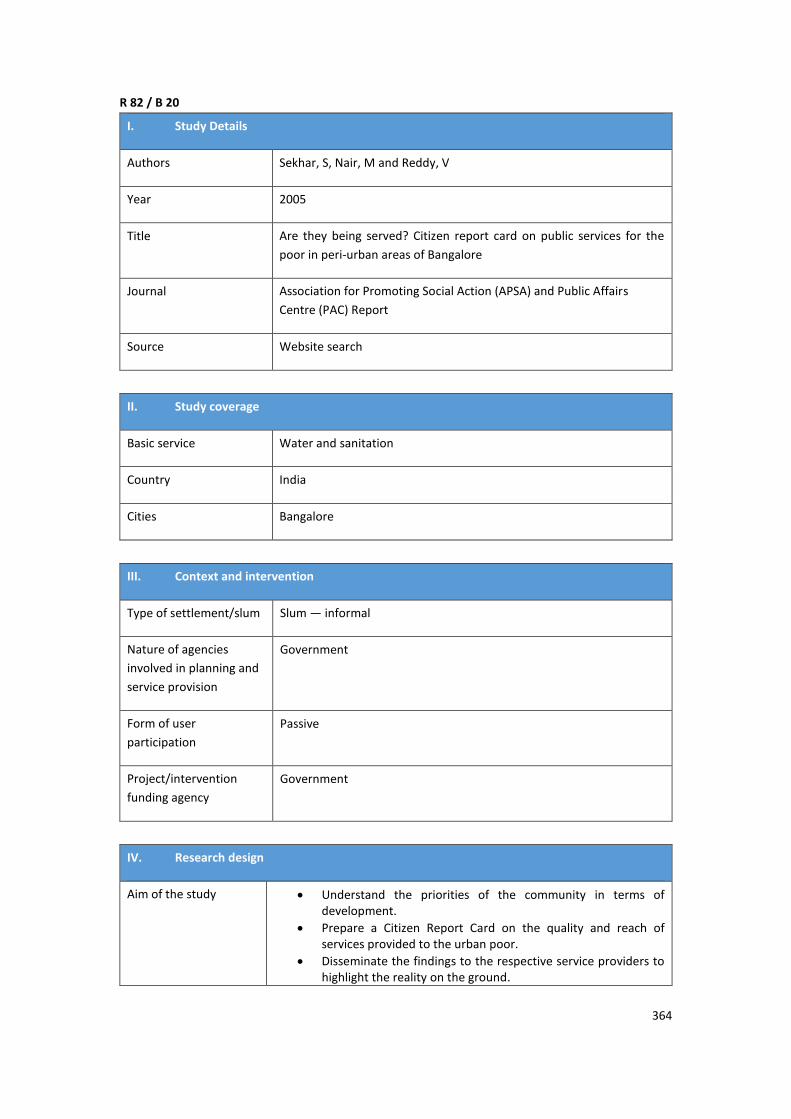
364
R 82 / B 20
I. Study Details
Authors Sekhar, S, Nair, M and Reddy, V
Year 2005
Title Are they being served? Citizen report card on public services for the
poor in peri-urban areas of Bangalore
Journal Association for Promoting Social Action (APSA) and Public Affairs
Centre (PAC) Report
Source Website search
II. Study coverage
Basic service Water and sanitation
Country India
Cities Bangalore
III. Context and intervention
Type of settlement/slum Slum — informal
Nature of agencies
involved in planning and
service provision
Government
Form of user
participation
Passive
Project/intervention
funding agency
Government
IV. Research design
Aim of the study Understand the priorities of the community in terms of development.
Prepare a Citizen Report Card on the quality and reach of services provided to the urban poor.
Disseminate the findings to the respective service providers to highlight the reality on the ground.

365
Use the findings to implement a pilot project involving community mobilisation, and empowering the people of four slums in two CMCs to seek and access better-quality basic amenities from the local government, in particular with regard to water and sanitation.
Type of study Mixed-methods
Research design Observational
Methodology used for
data analysis
Simple percentage analysis
V. Data and sample
Data sources Primary data
Household Survey and Focus Group Discussion (FGD)
Data period Not mentioned
VI. Results and evidence
Evidence on outcomes Evidence
Connectivity, adequacy, affordability and effort and time
Outcome Moderately positive and moderately negative
Proportion of households with access to piped-water connection
Proportion of households with access to public tap
Proportion of households with access to public water throughout the year
Proportion of households with once-a-week frequency of water supply
Proportion of households accessing public tap at less than 50m distance
Proportion of households with adequacy of water supply
Proportion of households spending about Rs20 every month on piped-water supply
Proportion of households with private-toilet facility
Proportion of households with access to community-toilet facility
Proportion of households with sewerage-system connection
Proportion of households with drainage facility outside
Proportion of households that can afford to pay to access community-toilet facility
Summary of results Access to piped water is very limited, with only about 9% of the population having access. The major sources is public taps or mini-water supply taps (95%). Other sources available include hand pumps, community wells and water supplied by cart. Only

366
about 30% of users have said water is available throughout the year from public taps. This availability is much higher in KR Puram (44%) than in Mahadevapura (20%).
On average, people travel a distance of 48.7 metres to access water. While Mahadevapura slum-dwellers have a public tap just 13 metres from their residences, residents of KR Puram have to travel 102 meters to access the tap.
Less than one-quarter of the slum citizens (23%) find the water to be adequate for their needs. In KR Puram, 40% find the quantity adequate and 11.9% of residents of Mahadevapura complain that the water is inadequate. Only 22% of the residents of the two CMCs find their timing convenient.
Water is available throughout the year for 66.7% of the residents (68% in KR Puram and 60% in Mahadevapura).
On average, households spend about Rs20 every month on piped water. While, in KR Puram, the average amount paid is Rs16.67, it is Rs50 In Mahadevapura. The frequency of supply was found to be insufficient by 56.7% of the slum residents. While 68% of KR Puram slum-dwellers said they did not find the frequency sufficient, all five households in Mahadevapura who have access to piped water found it to be insufficient.
Out of the 51 respondents using the public toilet in KR Puram CMC, 76% say that they pay for the use of the toilets.
Brief theory of change The introduction of citizen report card (CRC) has provided information to
the government about quality and reach of services to the urban poor. It
is observed that the performance of water and sanitation services needs
improvement on many fronts.
R 83 / A 52
I. Study Details
Authors Scott, P, Cotton, A and Sohail, K
Year 2013
Title Tenure security and household investment decisions for urban sanitation: The case
of Dakar, Senegal
Journal Habitat International
Source Electronic database
II. Study coverage
Basic service Sanitation

367
Country Senegal
Cities Dakar
III. Context and intervention
Type of settlement/slum Informal settlements
Nature of agencies
involved in planning and
service provision
User involvement
Users in low-income communities construct their own toilets, as the government is significantly absent from provision of sanitation services. Low-income informal settlements are not serviced adequately due to the irregular city layout and narrow streets.
Form of user
participation
Participation through self-mobilisation
This paper examines the correlation between tenure security and investments made in sanitation. Since the state does not provide sanitation services, households often provide for themselves.
Project/intervention
funding agency
Private sector
Communities build/upgrade their own toilets, which may be private in-house connections or toilets shared among a few households.
IV. Research design
Aim of the study The aim of this paper is to address how tenure security affects household-investment decisions for urban sanitation. This is achieved through a review of the relevant literature on sanitation for the urban poor and urban land tenure, including peer-reviewed and grey literature, which is not case-specific to Dakar. Significant gaps in knowledge are identified and explored through field studies in Dakar.
The paper seeks to answer what the relationships are between tenure issues and sanitation, and to what extent they affect investment in on-site sanitation systems (that is, systems in which the disposal of excreta takes place on or near the housing plot, in the absence of networked sewerage; pit latrines and septic tanks fall into this category).
Throughout the paper, an important distinction is drawn between: capital-investment costs that are incurred through constructing a new latrine or otherwise improving the quality of a sanitation asset by upgrading; and operating costs, which are paid to service the facility, for emptying the pit or tank and subsequent transport and disposal of the contents.
Type of study Qualitative

368
Research design Observational
Methodology used for
data analysis
Narrative analysis
V. Data and sample
Data sources Primary data
Field studies in Dakar, Senegal.
Primary data were collected in relation to tenure status, available sanitation services, and the expenditure by users on different aspects of sanitation services.
Data period Not clearly mentioned
VI. Results and evidence
Evidence on outcomes Connectivity: moderately positive
62.8% of residents in informal settlements had access to sanitation.
72% and 64.7% of residents in regularised and planned settlements, respectively, had access to sanitation.
Affordability: moderately negative
Regardless of ownership of toilets (by landlord or tenant), users pay the latrine-pit-emptying charges.
Summary of results The study has found that de facto tenure security is a sufficient, but necessary, precondition for household capital investment in sanitation.
Equally important is the finding that tenants and those lacking tenure security, while they are unlikely to be willing to invest in the capital cost of latrines, do pay substantial fees to service providers for operational sanitation services, such as the emptying of full pits and tanks, and the removal and disposal of their contents.
These operational investments are not accounted for in formal-policy settings. Tenure status is associated with a much greater disparity in the levels of service for sanitation than it is for either water supply or electricity.
Brief theory of change This research has shown that low-income residents can, and do, progressively invest in the capital cost of their own sanitation infrastructure; however, this was only found to be the case with owners who enjoyed relatively good tenure security.
Tenant households, or those with lower levels of tenure security, were less likely to invest. This confirms that residents have the tendency progressively to improve their own infrastructure and do so based upon tenure security, thereby implying a parallel development between housing and infrastructure.

369
The study also suggests that, where sanitation is an on-plot, independently managed infrastructure, it is de facto, rather than de jure tenure security that is a necessary, but sufficient precursor to household investment in sanitation. This argument is underpinned by two essential facts: firstly, in the developing-world context, tenure security and legal tenure are not necessarily the same, and secondly, non-networked sanitation (for example, a pit latrine or septic tank) constitutes improved sanitation.
R 84 / B 16
I. Study Details
Authors Scott, N, McKemey, K and Batchelor, S
Year 2005
Title Energy in low-income urban communities: Barriers to access to modern energy in
slums
Journal DFID Report
Source Website search
II. Study coverage
Basic service Electricity
Country India, Philippines and South Africa
Cities Delhi, Rodriguez, Payatas, Davao, Khayelitsha, Makhaya, Monwabisi, Site C, Kuyas
III. Context and intervention
Type of settlement/slum Low-income
Nature of agencies
involved in planning and
service provision
Others
Form of user
participation
Passive
Project/intervention
funding agency
Others

370
IV. Research design
Aim of the study To identify barriers preventing low-income urban households from
accessing electricity, and, in particular, preventing them from making
formal connections.
Type of study Mixed-methods.
Research design Observation
Methodology used for
data analysis
Simple percentage analysis
Non-parametric statistical test
V. Data and sample
Data sources Primary data
Household questionnaire survey, Interviews and FGDs
Data period Not mentioned clearly
VI. Results and evidence
Evidence on outcomes Evidence
Connectivity, adequacy
Outcome
Moderately positive and moderately negative
Metered electricity connection in resettlement area
Metered electricity connection in unauthorised area
Metered electricity connection in Rodriguez community
Metered electricity connection in Payatas community
Metered electricity connection in Davao community
Metered electricity connection
Electricity consumption
Summary of results The New Delhi sample is characterised by a high proportion (approaching 50%) of households with illegal connections (stealing). Their main concern is related to power cuts, which affect the activities for which they use electricity, and there is also a regular experience of electrical shocks. Contrary to what might be expected, the economic status of slum-dwellers was highest here, and respondents in unauthorised communities had the lowest reported levels of expenditure. The mean proportion of household expenditure on energy is 14%.
In the Philippines sample, the mean proportion of income spent on energy is 11%, but this increases among the poorer households. Almost all have electricity, so physical access is not a barrier, and all households have an electricity connection, used

371
for lighting and cooling (fans); there is also a high penetration of entertainments.
In the case of South Africa, the price structure on the ground has been successful in extending the benefits of electrification to the poor. Most households use electricity for cooking and water heating, but paraffin remains more commonly used than electricity for space heating.
The fact that two-thirds of households with a metered electricity supply indicate that they mainly use electricity for cooking, is considered one of the most important findings of the survey.
The proportion of household income spent on energy is moderate (mean for whole sample = 9%), although the proportion is higher among poorer households.
17% of the sample has no electricity; 16% have extension cords, and 67% have metered connections. All of those households without metered electricity are unserved shacks located in Monwabisi Park in South Africa, and the low-income households using extension cords do not benefit from Free Basic Electricity.
Brief theory of change Not mentioned
R 85 / A 5
I. Study Details
Authors Shrestha, R, Kumar, S, Martin, S and Dhakal, A
Year 2008
Title Modern energy use by the urban poor in Thailand: A study of slum households in
two cities
Journal Energy for Sustainable Development
Source Electronic database
II. Study coverage
Basic service Electricity
Country Thailand
Cities Bangkok and Khon Kaen

372
III. Context and intervention
Type of settlement/slum Slum
Nature of agencies
involved in planning and
service provision
Government
Form of user
participation
-
Government has been independently providing the infrastructure to
urban-slum households
Project/intervention
funding agency
Government
IV. Research design
Aim of the study To assess the current level of access to modern forms of electricity in
the slums of two cities in Thailand
Type of study Qualitative
Research design Observational method
Methodology used for
data analysis
Statistical method
Descriptive analysis
V. Data and sample
Data sources Primary data
Questionnaire survey
Secondary data
National Statistical Office (NSO) • National Economic and Social Development Board (NESDB) • Statistical Yearbook • Census data • Household Socio-Economic Survey • Household Energy Consumption Survey • Metropolitan Electricity Authority (MEA) • Provincial Electricity Authority (PEA) • Community Organizations • Community Organization Development Institute (CODI)
Data period January‒February 2007

373
VI. Results and evidence
Evidence on outcomes Connectivity: moderately negative
Affordability: moderately negative
Summary of results This study finds that, even in the slums of Bangkok and Khon Kaen, almost 100% of the households have electricity connections. In Greater Bangkok, over 67% of households use LPG and about 13% use electricity for cooking. Interestingly, about 16% of the households in Greater Bangkok do not cook at home and so do not use energy for cooking. This study finds that a very high percentage of slum-dwellers (about 87% in Bangkok and 86% in Khon Kaen) use LPG for cooking.
The limited survey under this study of slum-dwellers shows that they spend about 16% of their monthly income on energy (that is, LPG and other cooking fuels, electricity and gasoline) in Bangkok, while the corresponding figure is about 2 % in Khon Kaen. It also shows that the poor (households below the poverty line) spend a higher percentage of their income on energy; for example, in Bangkok slums, the poor were found to spend 18.5% of their monthly income, compared to 16.5% in the case of average households.
Brief theory of change Household registration: Although more and more households are believed to be getting access to a legal electricity connection, with the introduction of quasi-Ids. Some households still do not have a quasi-household ID and, therefore, have to rely on neighbours to provide them with access to electricity.
Connection fees: Initial connection fees can pose a barrier to enhancing electricity access. The lowest price to get a legal connection is Bt2,380. In the course of the limited survey under this study, it was reported that the cost of getting an electricity connection from the neighbours was about t1,700 (that is., nearly 29% less than the legal connection fee). Consequently, the latter option might seem more attractive to some households (especially the poor) although the price charged by neighbours (Bt5‒6 per kWh) can be more than twice the price charged by the utility.
LPG cost: Although, at present, the retail LPG price is subsidised, the poor households, which cannot afford to buy LPG in a standard (15-kg) cylinder, may have to buy it in small (4-kg) cylinders, which may require paying a substantially higher price (up to Bt 24) per kg than the average retail price of LPG (Bt16.81 per kg). This puts the poorest households at a disadvantage. Policies and measures to reduce the price of LPG, especially that in small cylinders, would, therefore, increase its affordability for and the welfare of the poor households.

374
R86 / A4
I. Study Details
Authors Smith, L and Hanson, S
Year 2003
Title Access to water for the urban poor in Cape Town: Where equity meets
cost recovery
Journal Urban studies
Source Electronic database
II. Study coverage
Basic service Water
Country Africa
Cities Tygerberg and Cape Town
III. Context and intervention
Type of settlement/slum Low-income
Nature of agencies
involved in planning and
service provision
Government
Form of user
participation
Government
Government has independently provided the infrastructure to the urban low-income informal settlements.
Project/intervention
funding agency
Government
IV. Research design
Aim of the study To investigate the effect of corporatisation on equity in access to water
in the post-apartheid period in Cape Town, South Africa, between 1997
and 2001.
Type of study Mixed-methods

375
Research design Observational method
Methodology used for
data analysis
Descriptive analysis
V. Data and sample
Data sources Primary data
120 households randomly selected for the Tygerberg and Cape Town areas, interviews were designed to assess territorial differences in households’ access to water according to race and class in the post-apartheid period. In addition, three neighbourhoods were selected for each township according to the standard South African typology of urban service levels.
Personal-interview method
Semi-structured interviews
Data period 2001
VI. Results and evidence
Evidence on outcomes Adequacy: moderately negative
Affordability: moderately positive
Summary of results Households with standpipe access living in informal settlement areas have extremely low consumption levels and have arrived more recently to the township areas.
Households in the informal settlements consume an average of 17l per person per day, an amount that is well below the 25l-a-day South African standard.
Local authorities are not even meeting the very low basic-needs mandate in delivering water to residents living in these settlements. Households with an income of R800 per month or more would get access to in-house waterborne sanitation; people with lower incomes would have to get water from communal taps and use chemical toilets as a form of sanitation.
Brief theory of change The essential point is that taking the technocratic route through cost recovery, at the expense of democratising the delivery of essential services that shape individual, household and community development undermines both the equity and the efficiency objectives of local authorities.
It has been shown that the cost-recovery methods associated with local-government efforts to improve water provision to poor households and improve distributional equity have been undermined by the lack of attention to procedural equity.
Local governments, especially those in Cape Town, lack the institutional wisdom to understand how low-income households prioritise expenditure.

376
South African local authorities do, however, lack the ability to translate existing legislation into practice and the mechanisms to transform skewed distribution systems. These limitations have created bottlenecks in implementation.
R 87 / A 23
I. Study Details
Authors Snyder, R, Jaimes, G, Riley, L, Faerstein, E and Corburn, J
Year 2013
Title A Comparison of Social and Spatial Determinants of Health Between Formal and
Informal Settlements in a Large Metropolitan Setting in Brazil
Journal Urban Health
Source Electronic database
II. Study coverage
Basic service Water, sanitation and electricity
Country Brazil
Cities Rio de Janeiro
III. Context and intervention
Type of settlement/slum Informal
Nature of agencies
involved in planning and
service provision
Government
Provision of service
Form of user
participation
-
Project/intervention
funding agency
State government

377
IV. Research design
Aim of the study This paper examines the key socio-demographic and infrastructure characteristics that are associated with health outcomes in Rio de Janeiro with the census tract as the unit of analysis.
The author tries to describe some aspects of Rio de Janeiro's informal settlements by disaggregating census data to identify distinct differences among and between these communities.
Type of study Quantitative
Research design Observational
Methodology used for
data analysis
Quantitative
V. Data and sample
Data sources Secondary data
Brazilian Census data through the official open-access IBGE 2010 Census website
Data period 2010
VI. Results and evidence
Evidence on outcomes Water: connectivity: moderately negative
Proportion of households with access to water services
Sanitation: connectivity: moderately negative
Proportion of households with access to sanitation services
Electricity: connectivity: moderately negative
Proportion of households with access to electricity services
Summary of results The analysis explored spatial heterogeneity of services access
between AGSN and non-AGSN census tracts within three areas of the municipality: Centro, Copacabana, and Complexo do Alemão.
In all areas, access to sanitation and electricity had a distinctive spatial pattern, in which AGSN areas were less well served.
Fewer than 70% of AGSN households had adequate sanitation in Complexo do Alemão and Centro. Contrastingly, more than 90% of the households outside of AGSNs in Copacabana and Complexo do Alemão had adequate electricity, but less than 80%

378
of households within AGSNs in these areas had adequate electricity.
Census tracts in the oldest area of the city, Centro, had fewer households with adequate electricity than in Copacabana and Complexo do Alemão.
Brief theory of change The 2010 Brazilian Census indicated that there is heterogeneity
of demographic and infrastructure characteristics between and within AGSNs in the municipality of Rio de Janeiro.
In general, AGSN residents in Rio de Janeiro were poorer, less literate, younger, and had less access to basic services than residents of non-AGSN census tracts. These variables are important determinants of health outcomes. Further, inequalities between these determinants are frequently cited as drivers of disease disparity.
It also highlighted spatial variation in the distribution of poverty and services between different AGSN census tracts in different regions of the city. Relative inequality and service needs in Rio's different districts suggest that policy and planning might pay special attention to the most impoverished areas.
For instance, the AGSN census tracts in the western district of Rio were more vulnerable in terms of poverty and lack of services than the older southern and central AGSN census tracts of the city (APs 1, 2, 3).
R 88 / C 1
I. Study Details
Authors Subbaraman, R, Shitole, S, Shitole, T, Sawant, K, Brien, O, Bloom, E, Patil-
Deshmukh, A
Year 2013
Title The social ecology of water in a Mumbai slum: Failures in water quality, quantity,
and reliability
Journal BMC Public Health
Source Author correspondence
II. Study coverage
Basic service Water
Country India
Cities Mumbai

379
III. Context and intervention
Type of settlement/slum Slum — informal
Nature of agencies
involved in planning and
service provision
Government and private
Form of user
participation
Passive
Project/intervention
funding agency
Government and private
IV. Research design
Aim of the study To evaluate an informal water-distribution system in Kaula Bandar (KB),
a non-notified slum in Mumbai, using the following commonly accepted
social-equity indicators: cost of water, quantity of water consumed at
household level, and residents’ opinions of hardships associated with
water access.
Type of study Mixed-methods
Research design Observational
Methodology used for
data analysis
Simple percentage analysis
V. Data and sample
Data sources Primary
Data period 2008 and 2011

380
VI. Results and evidence
Evidence on outcomes Evidence
Connectivity, affordability and effort and time
Outcome
Moderately positive, moderately negative
Community access to water supply
Communities cost of access water
Access to water from outside their lanes
Time spent to reach water connection from outside their lanes
Summary of results Most of the KB residents roll large storage drums at least 1km,
and as far as 2km, to access taps in the closest community, while others get water from private tankers.
A majority of households pay a monthly base fee to water vendors of R150‒400 per month (US$2.73‒7.27) for water during all study periods.
KB residents spend 52 to 206 times more than residents of slums with legal water access, depending on the season.
The mean total cost of water spent by a household over an entire year Is R6,479 (US$117.80).
In the BNA, 952 households (99.3%) report having to regularly purchase water. The majority, 529 (55.2%), are only able to access water every three or more days. Most households, 817 (85.2%), have water delivered via water vendors’ hoses, while 125 (13.1%) must fetch water from outside of their lanes. Due to queues at hoses or time involved in fetching water, 370 (38.5%) spend more than 30 minutes per day on obtaining water.
Brief theory of change Private water vendors have improved access to water services; however,
costs of these services have adversely affected the urban poor. The state
monopoly did not meet the demand of slum-dwellers in this non-notified
slum.
R 89 / A 25
I. Study Details
Authors Subbaraman, R, Brien, O, Shitole, T, Shitole, S, Sawant, K, Bloom, D and Patil-
Deshmukh, A
Year 2012
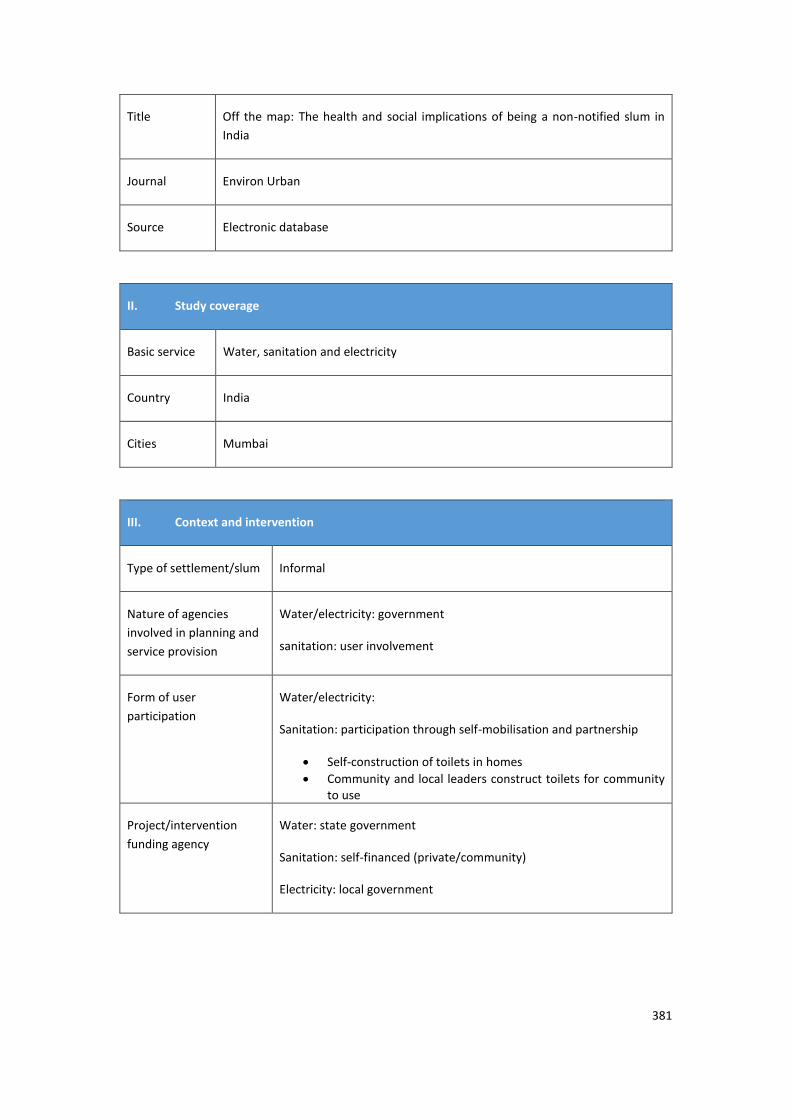
381
Title Off the map: The health and social implications of being a non-notified slum in
India
Journal Environ Urban
Source Electronic database
II. Study coverage
Basic service Water, sanitation and electricity
Country India
Cities Mumbai
III. Context and intervention
Type of settlement/slum Informal
Nature of agencies
involved in planning and
service provision
Water/electricity: government
sanitation: user involvement
Form of user
participation
Water/electricity:
Sanitation: participation through self-mobilisation and partnership
Self-construction of toilets in homes
Community and local leaders construct toilets for community to use
Project/intervention
funding agency
Water: state government
Sanitation: self-financed (private/community)
Electricity: local government

382
IV. Research design
Aim of the study This paper highlights the problem of inter-slum health disparities in
Mumbai, India, using the findings of a four-year series of studies of KB.
Type of study Mixed-methods
Research design Observational
Methodology used for
data analysis
Quantitative and qualitative
V. Data and sample
Data sources Primary data
Secondary data
Datasets on KB from the PUKARHSPH-NYU collaboration and datasets from India’s NFHS-3. The Anthropometrics survey collected health and social information (for example., literacy, immunisation history), as well as anthropometric measurements (height, weight, etc.).
Data period March 2010 to January 2011
VI. Results and evidence
Evidence on outcomes Water: connectivity: moderately negative
Proportion of households with piped drinking water
Sanitation (self-mobilisation): connectivity: moderately negative
Proportion of households using private toilet facility
Sanitation (partnership): connectivity: moderately positive
Proportion of households accessing community toilets
Electricity: adequacy: inconclusive
Reliable electricity supply

383
Summary of results The result shows a significant gap in access to basic services.
Access to piped water (through community or home water taps) is almost universal in the NFHS slums, while virtually no KB households have access to piped water.
KB residents have a lower rate of access to a non-shared toilet and a higher rate of open defecation among adults.
A higher proportion of KB households use biomass fuels for cooking, which is associated with an increased risk of lung disease.
Brief theory of change KB’s non-notified status is a major contributing factor to its
relatively poor health and social indicators.
Based on four years of community-based research, this paper shows the health consequences of widespread failures of basic entitlements that occur due to a legal vacuum.
Social and legal exclusion become embodied in poor health outcomes; indeed, this structural violence takes its toll on the very lives and bodies of the urban poor.
R 90 / C 2
I. Study Details
Authors Sohail, M and Cavill, S
Year 2009
Title Public-private partnerships in the water and sanitation sector
Journal Water Management
Source Author correspondence
II. Study coverage
Basic service Water and sanitation
Country South Africa
Cities Queenstown and the Dolphin Coast

384
III. Context and intervention
Type of settlement/slum Low-income
Nature of agencies
involved in planning and
service provision
Government and private-sector
Water and sanitation service in Africa (WSSA) meets all the operational costs, the prescribed standards and performance to provide/repair/replace the water and sewer network, including new connections and civic structures.
Siza Water Company (SWC) is responsible for the provision of water and sanitation services to the Dolphin Coast since 1999. The three levels of water and sanitation provided by SWC are: Level 1 is a water dispenser; that is, community standpipe pre-payment meter. Level 2 is a 200l tank and a septic tank for each household. Level 3 is a full water connection with a flushable toilet for each household.
Form of user
participation
-
Project/intervention
funding agency
Government and private-sector
Queenstown municipality enters into a concession contract with the WSSA, a joint venture with Group Five, for a period of 25 years.
Borough of Dolphin Coast signed a 30-year contract with Umgeni Water and SWC worth R4m. SWC buys water from Umgeni and distributes it to retail consumers in the area.
IV. Research design
Aim of the study The key objective of this research was to fill in some of the gaps that exist
in evidence-based reporting of the facts and issues around the impacts
of PPP on poor consumers. The case studies undertaken in South Africa
reveal factors that determine the effectiveness of PPPs, and thereby lead
to a better understanding of the conditions under which such
arrangements work best.
Type of study Qualitative
Research design Observational

385
Methodology used for
data analysis
Narrative analysis
V. Data and sample
Data sources Primary data
Interviews were conducted.
In-depth household questionnaires were conducted in Queenstown.
In the Dolphin Coast area, FGDs were conducted with consumers.
Data period Not clearly mentioned
VI. Results and evidence
Evidence on outcomes Queenstown
Connectivity: moderately positive
Almost all residents were connected to the water-supply service. Interviews with households indicated that water quality is good.
Affordability: moderately negative
Although bills are received regularly, non-payment is high, as residents felt it was unaffordable. Households were not willing to take on the responsibility for leaks on private property.
Tariffs for waterborne sewerage are beyond the majority of households’ ability and willingness to pay.
Dolphin Coast
Connectivity: moderately negative
Some people who had household connections were reverting back to using standpipes because they could not afford their bills.
Affordability: moderately negative
Some people who had household connections were reverting back to using standpipes because they could not afford their bills. Communities did not fully understand the implications of full water and sewerage connections before occupying the houses. Due to the block tariffs, even those residents who

386
consumed much less than the first block of 10,000l had to pay the basic tariff of R24.20, which was a heavy burden for some families. However, with the introduction of 6,000l of free water, several households gained access. Despite this scheme, several households could not pay their bills due to unemployment and poverty.
Summary of results There was a visible acceleration of privatisation in service
delivery in South Africa. While PPPs can work well, implementation of a concession poses a number of risks to all.
There are clear advantages in spelling out these risks at an early stage of such an arrangement, so that the various stakeholders are aware of the pressures that exist and are, therefore, more likely to approach negotiations more realistically.
Brief theory of change In Queenstown, ward councillors have become involved in credit
control and in arranging the reconnection of customers who have been disconnected.
On the Dolphin Coast it was reported that some people who have household connections are reverting back to using standpipes because they cannot afford their bills.
The main danger to the poor under PPP water and sanitation provision is that tariffs and/or connection charges become unaffordable, meaning that this group does not gain access to better water and sanitation services.
Sanitation is a particularly difficult service to provide under a PPP. Respondents in both case studies were dissatisfied with the increased sewerage costs that resulted from the PPP.
The Queenstown PPP case study indicated that, while the quality of supply had improved significantly on a broad scale, the improvements had accrued largely to the municipality (improved maintenance and reduction in aged pipes) and had not been felt by poor households, who are unhappy with tariff issues and the way leaks on private property are dealt with.
R 91 / B 17
I. Study Details
Authors Sohail, M
Year 2007
Title Accountability arrangements to combat corruption in the delivery of infrastructure
service in Bangladesh
Journal Institute for Developmental Policy Analysis and Advocacy (IDPAA) Report
Source Website search

387
II. Study coverage
Basic service Water, sanitation and electricity
Country Bangladesh
Cities Dhaka
III. Context and intervention
Type of settlement/slum Slum —informal
Nature of agencies
involved in planning and
service provision
Government, CSOs and NGOs
Form of user
participation
-
Project/intervention
funding agency
Government, CBOs and NGOs
IV. Research design
Aim of the study The purpose of the study is to improve governance through appropriate
accountability arrangements for combating corruption in the delivery of
infrastructure services such as water supply, sanitation, electricity and
drainage in Dhaka, leading to an improvement of the livelihoods of the
poor.
Type of study Mixed-methods.
Research design Observational
Methodology used for
data analysis
Simple percentage analysis
V. Data and sample
Data sources Primary data
Structured interview, semi-structured interview, FGD and transact-walk interview
Data period Not mentioned

388
VI. Results and evidence
Evidence on outcomes Evidence
Connectivity
Outcome
Moderately positive and moderately negative
Access to water
Access to sanitary latrine facilities
Access to electricity service
Access to drainage service
Summary of results Currently, the majority of people have access to water supply, but very few of them are satisfied with the service. Only 12% expressed their satisfaction with the quantity and quality of the water supply.
Almost all CSOs working with the community have a sanitation programme. Only 26.7% respondents expressed their satisfaction with the sanitary latrine facilities. So, the access of poor people to sanitary latrines is relatively better in communities.
There are some unstructured water-passing facilities in the community and only 12.4% have expressed their satisfaction with these.
Brief theory of change Service delivery with a top-down approach mechanism leads to
corruption in the provision of public utilities; therefore, slum-dwellers
lack access to basic services.
I. Study Details
Authors Sohail, M and Surjadi, C
Year 2003
Title Public Private Partnerships and the poor drinking water concessions: A study for
better understanding of public-private partnerships and water provision in low-
income settlements.
Journal WEDC, Loughborough University, UK
Source Cross-reference

389
II. Study coverage
Basic service Water
Country Indonesia
Cities Jakarta
III. Context and intervention
Type of settlement/slum Low-income
Nature of agencies
involved in planning and
service provision
Others
Private companies: Thames and Lyonnaise supply water to consumers directly through piped connections and water vendors.
Form of user
participation
-
Project/intervention
funding agency
Others
A consortium of international and domestic investors, including Thames Water Company, Lyonnaise, PAM, the government water company, and a private-government water company, manage the potable water supply in terms of product and service delivery to consumers.
IV. Research design
Aim of the study The purpose of this report is to determine workable processes whereby the needs of the poor are promoted in strategies, which encourage PPPs in the provision of water supply and sanitation services.
One of the key objectives is to fill in some of the gaps, which exist in evidence-based reporting of the facts and issues around the impacts of PPP on poor consumers.
This series of reports present the interim findings and case studies of an analysis of both the pre-contract and operational phases of a number of PPP contracts.
Central to this study will be a comparison of the experiences, perceptions and priorities of different stakeholders.
By comparing and contrasting these different experiences, the study is expected to gain an understanding of how PPPs can better serve the poor.
Type of study Qualitative
Research design Observational

390
Methodology used for
data analysis
Narrative analysis
V. Data and sample
Data sources Primary data
In-depth interviews
Secondary data
Collect policy documents and agreements between public and private actors, and review PPPs and their operations in Jakarta.
Data period Not clearly mentioned
VI. Results and evidence
Evidence on outcomes Connectivity: moderately positive
Under both the categories of poor households and poor/simple households, coverage by Palyja and Thames PJ had improved to 56.8% and 60.9%, respectively.
Affordability: no impact
A majority (61%) of households thought that the price paid for drinking water was the same as before privatisation.
Adequacy: moderately negative
Several respondents also felt that the quality of water had not improved after privatisation and the flow of water (that is, water pressure) was also very poor.
Summary of results These data indicate that expectation of the improvement of flow of the drinking water and quality of the water is still high, but has yet to be fulfilled.
On the issues of the cost of drinking water, half of the respondents perceive the cost to be the same as before privatisation. The percentage of the respondents who perceive the cost of drinking water to be the same is 55%, whereas 44% believe it to be higher.
From the review, it seems as though the water company has performed well in terms of the amount of water sold, but has performed poorly in respect of consumer services and increasing the number of customers.
Another issue is the transfer of skills and technology from the private company to the government, although it is not clear how this will be achieved.
Brief theory of change The study indicated that there is concern regarding the fairness of the agreement in representing the interests of the government and the public.

391
In relation to the welfare of the urban poor, the study found that there is no specific statement in the PPP agreements.
Study review indicates that the water company has performed well in terms of the amount of water sold, but more is needed in respect of consumer services and increasing the numbers of new customers, especially the poor.
This indicates that there is lack of improvements in control and regulatory mechanisms and in collaboration among stakeholders.
R 93 / E11
I. Study Details
Authors Stanwix, B
Year 2009
Title Urban slums in Gujarat and Rajasthan: Study of basic infrastructure in
seven cities
Journal Mahila Milan SEWA Trust Research Report
Source Google Scholar
II. Study coverage
Basic service Water, sanitation and electricity
Country India
Cities Ahmedabad, Nadiad, Godhra, Ankleshwar, Jaipur, Bikaner, Jodhpur
III. Context and intervention
Type of settlement/slum Slum — informal
Nature of agencies
involved in planning and
service provision
NGO
Form of user
participation
Passive
Project/intervention
funding agency
NGO

392
IV. Research design
Aim of the study To provide a basic picture of the conditions facing the average household in these slums by presenting and examining data on household characteristics.
To investigate some underlying relationships in the data that would help to tell the story of these households more accurately.
Type of study Quantitative method
Research design Observational
Methodology used for
data analysis
Simple percentage and regression analysis
V. Data and sample
Data sources Secondary data
Data period Not mentioned
VI. Results and evidence
Evidence on outcomes Outcome Connectivity
Evidence Moderately positive, moderately negative, strongly negative
Proportion of households connected to in-house tap facility
Proportion of households with access to public tap
Proportion of households with access to public toilet facility
Proportion of households with access to sewerage system
Proportion of households with access to metered electricity
Summary of results Ahmedabad slum
The majority of households in these slums had an in-house tap (66%), but there were still a large number of households who had to fetch water.
Fifty-eight percent of households spent more than 30 minutes per trip to collect water, and 27% of the families had to travel more than 1km to obtain water. In addition, for those who used public taps installed by the municipality, water supply was available on average for only 2.5 hours per day.
The majority of the slum families had in-house toilets (74%), but there was still a large number of families who had to defecate in the open (14% or 1,827 households). Of those who did not have their own toilet facility, 2,700 households stated that they urgently required a toilet in their house, and, of these families,

393
80% showed willingness to pay to acquire a toilet. The average payment offered was Rs338.
It was found that 17% of households did not have any storm-water drainage, and only 10% had no gutter for sewerage. Of those that did have some kind of drainage, 20% reported problems of water clogging. One-third of all households had to pay for repairs on their houses in the rainy season because of lack of a drainage system or due to dysfunction of drains.
Ninety-two percent of the households in these areas had electricity in their homes. Of these, a vast majority had an in-house meter. On average, each household paid Rs235 per month for electricity.
Nadiad slum
Seventy-one percent of households had access to some kind of water facility, while the rest stated that they had no regular access to water.
Out of the total slum population, only 43% families had adequate toilet facilities. Of the families without access to proper toilet facilities, 58% used open areas to defecate, and only a small percentage made use of public toilets.
It was found that 70% of houses had electricity meters, and their average monthly bill was Rs306.
Around 90% of houses had no storm-water drainage.
Godhra slum
For households who relied on conventional water sources, approximately 81% stated that they had running water for only 1‒2hrs per day, and half of the residents said that the water pressure was inadequate to meet their needs during that time.
About 44% of households had bathroom facilities in their house, around 26% of the population used public bathrooms to wash and bathe, and 30% used other facilities.
Only 7% of the residents had drainage in their homes and the rest had no drainage facility.
Around 71% of the families had electricity, and all of them used an in-house meter.
Ankleshwar slum
65% of the families had individual water connections, and the remaining 35% did not have access to private connection.
On average, a household had spent Rs1,010 to install a water connection in their house and the families that did not have water connections were willing to pay Rs420 to get a connection. It was predominantly the households with lower earnings that did not have access to individual water connections: 41% of those who did not have water connections were from the poorest quintile.
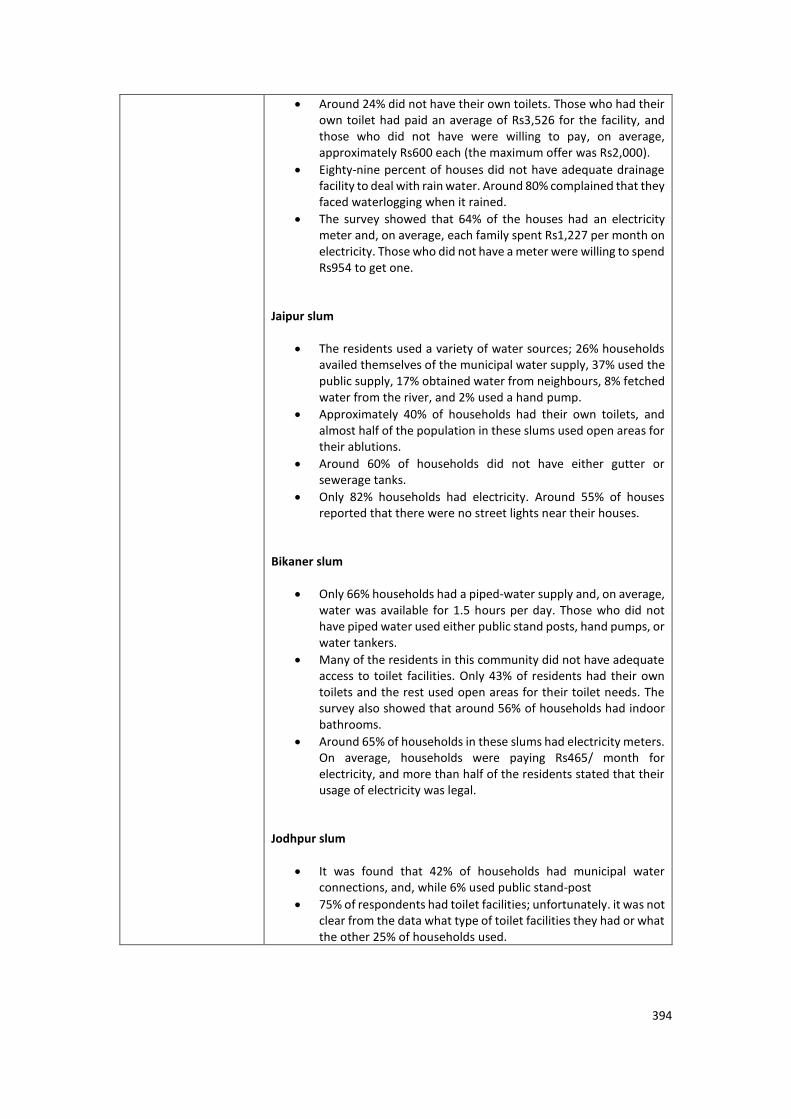
394
Around 24% did not have their own toilets. Those who had their own toilet had paid an average of Rs3,526 for the facility, and those who did not have were willing to pay, on average, approximately Rs600 each (the maximum offer was Rs2,000).
Eighty-nine percent of houses did not have adequate drainage facility to deal with rain water. Around 80% complained that they faced waterlogging when it rained.
The survey showed that 64% of the houses had an electricity meter and, on average, each family spent Rs1,227 per month on electricity. Those who did not have a meter were willing to spend Rs954 to get one.
Jaipur slum
The residents used a variety of water sources; 26% households availed themselves of the municipal water supply, 37% used the public supply, 17% obtained water from neighbours, 8% fetched water from the river, and 2% used a hand pump.
Approximately 40% of households had their own toilets, and almost half of the population in these slums used open areas for their ablutions.
Around 60% of households did not have either gutter or sewerage tanks.
Only 82% households had electricity. Around 55% of houses reported that there were no street lights near their houses.
Bikaner slum
Only 66% households had a piped-water supply and, on average, water was available for 1.5 hours per day. Those who did not have piped water used either public stand posts, hand pumps, or water tankers.
Many of the residents in this community did not have adequate access to toilet facilities. Only 43% of residents had their own toilets and the rest used open areas for their toilet needs. The survey also showed that around 56% of households had indoor bathrooms.
Around 65% of households in these slums had electricity meters. On average, households were paying Rs465/ month for electricity, and more than half of the residents stated that their usage of electricity was legal.
Jodhpur slum
It was found that 42% of households had municipal water connections, and, while 6% used public stand-post
75% of respondents had toilet facilities; unfortunately. it was not clear from the data what type of toilet facilities they had or what the other 25% of households used.

395
A large percentage (68%) of residents had no sewerage facility in their homes, while 83% said that they had no storm-water drainage for their homes.
The survey revealed that around 68% of households had electricity, and, on average, households paid Rs910 per month for it.
Brief theory of change The NGOs actively participated in the provision of basic infrastructure
service to the informal-slum-dwellers.
R 94 / B 8
I. Study Details
Authors Takeuchi, A, Cropper, M and Bento, A
Year 2006
Title The welfare effects of slum improvement programs: The case of Mumbai
Journal World Bank policy research working paper
Source Website search
II. Study coverage
Basic service Water and sanitation
Country India
Cities Mumbai
III. Context and intervention
Type of settlement/slum Slum ― informal
Nature of agencies
involved in planning and
service provision
Government
Form of user
participation
Self-mobilisation
Project/intervention
funding agency
Government

396
IV. Research design
Aim of the study The goal of this paper is to evaluate the welfare effects of such
programmes (policies to improve the welfare of slum-dwellers include
upgrading slum housing in situ ― for example, by providing piped-water
and sewage connections-and relocating slum-dwellers to better quality,
low-cost housing.) using data for Mumbai ( formerly Bombay), India.
Type of study Mixed-methods
Research design Observational
Methodology used for
data analysis
Simple percentage analysis
V. Data and sample
Data sources Primary data
Data period 2003 and 2004
VI. Results and evidence
Evidence on outcomes Evidence
Connectivity
Outcome
Moderately negative
Proportion of households with access to in-house piped-water supply
Proportion of households with access to in-house piped-water supply based on zone (proximity affects access)
Proportion of households with private toilet facility
Summary of results Chawls, which house approximately 35% of sample households, are usually low-rise apartments with community toilets that, on average, have better amenities than slums. The remaining 25% of households live in either cooperative housing, which includes modern, high-rise apartments; in bungalows; or in employer-provided housing.
The quality of slum housing varies considerably by zone: whereas 61% of slum households in zone 2 have piped water, only 19% of slum households in zone 4have piped water.
Slum dwellings are, on average, smaller than either chawls or cooperative housing, and less likely to have piped-water connections inside the dwelling.
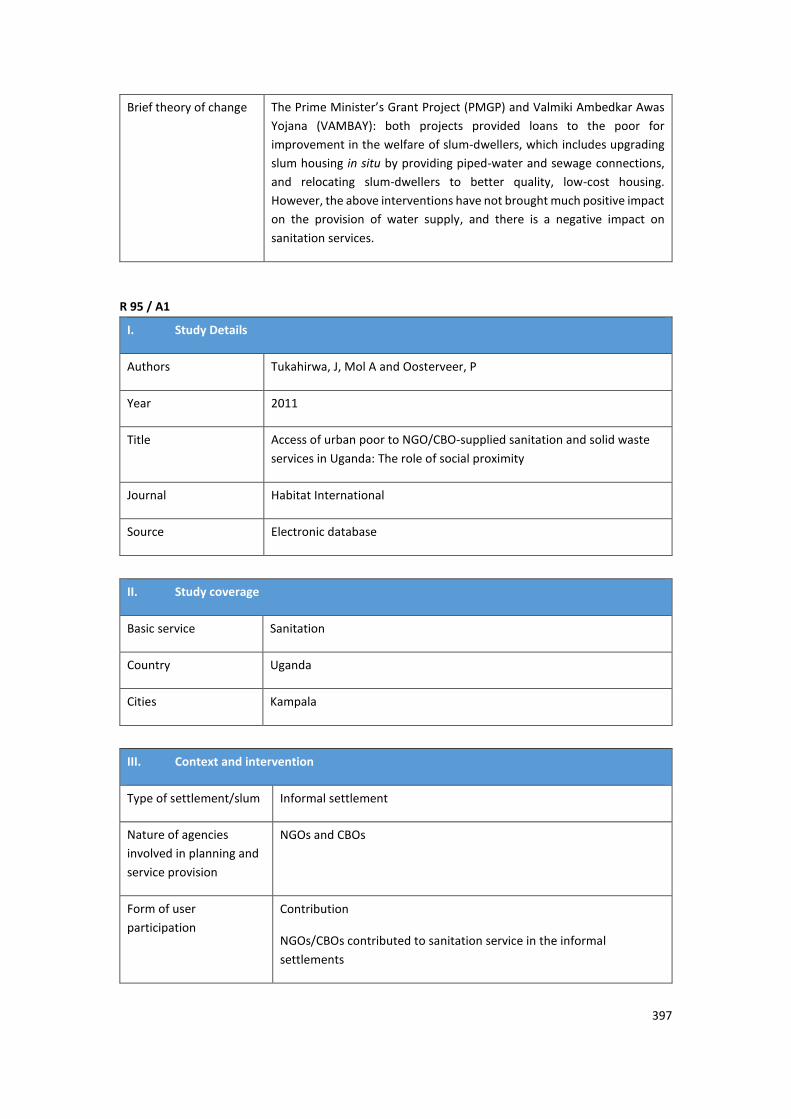
397
Brief theory of change The Prime Minister’s Grant Project (PMGP) and Valmiki Ambedkar Awas
Yojana (VAMBAY): both projects provided loans to the poor for
improvement in the welfare of slum-dwellers, which includes upgrading
slum housing in situ by providing piped-water and sewage connections,
and relocating slum-dwellers to better quality, low-cost housing.
However, the above interventions have not brought much positive impact
on the provision of water supply, and there is a negative impact on
sanitation services.
R 95 / A1
I. Study Details
Authors Tukahirwa, J, Mol A and Oosterveer, P
Year 2011
Title Access of urban poor to NGO/CBO-supplied sanitation and solid waste
services in Uganda: The role of social proximity
Journal Habitat International
Source Electronic database
II. Study coverage
Basic service Sanitation
Country Uganda
Cities Kampala
III. Context and intervention
Type of settlement/slum Informal settlement
Nature of agencies
involved in planning and
service provision
NGOs and CBOs
Form of user
participation
Contribution
NGOs/CBOs contributed to sanitation service in the informal
settlements
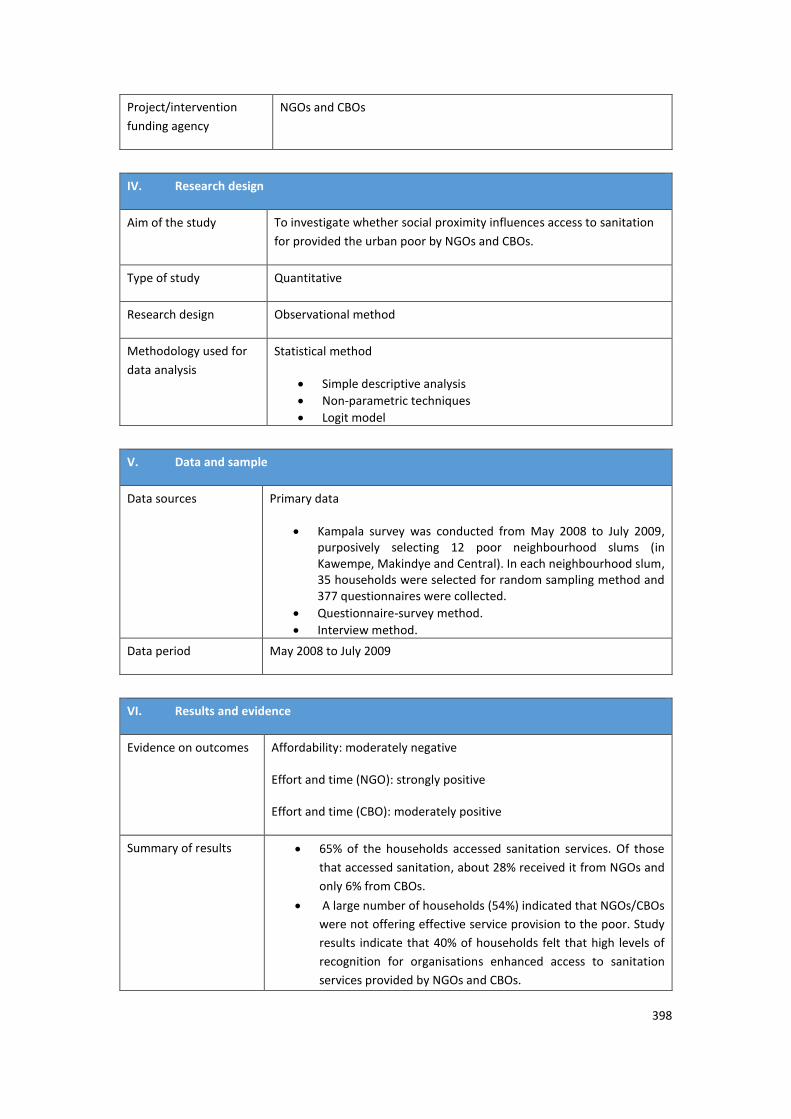
398
Project/intervention
funding agency
NGOs and CBOs
IV. Research design
Aim of the study To investigate whether social proximity influences access to sanitation
for provided the urban poor by NGOs and CBOs.
Type of study Quantitative
Research design Observational method
Methodology used for
data analysis
Statistical method
Simple descriptive analysis
Non-parametric techniques
Logit model
V. Data and sample
Data sources Primary data
Kampala survey was conducted from May 2008 to July 2009, purposively selecting 12 poor neighbourhood slums (in Kawempe, Makindye and Central). In each neighbourhood slum, 35 households were selected for random sampling method and 377 questionnaires were collected.
Questionnaire-survey method.
Interview method.
Data period May 2008 to July 2009
VI. Results and evidence
Evidence on outcomes Affordability: moderately negative
Effort and time (NGO): strongly positive
Effort and time (CBO): moderately positive
Summary of results 65% of the households accessed sanitation services. Of those
that accessed sanitation, about 28% received it from NGOs and
only 6% from CBOs.
A large number of households (54%) indicated that NGOs/CBOs
were not offering effective service provision to the poor. Study
results indicate that 40% of households felt that high levels of
recognition for organisations enhanced access to sanitation
services provided by NGOs and CBOs.

399
A large number of poor households did not access the NGO/CBO
sanitation service due to the income and service costs.
NGOs and CBOs play a major role in the provision of sanitation
to urban slum-dwellers in Kampala. Slum-dwellers benefited
from the CBO/NGOs sanitation service, in the form of
connectivity and affordability.
Brief theory of change This study investigated the urban poor’s access to sanitation and solid-waste services provided by NGOs/CBOs, and estimated the determinants of access to these services.
The results reveal that, indeed, some of the poor households in Uganda’s capital, Kampala, have access to sanitation and solid-waste services as a result of active intervention from NGOs and CBOs.
Although the contribution from NGOs and CBOs to servicing the poor may not be as great as that from government authorities, it is comparable to that from the private sector.
Without the involvement of NGOs and CBOs, more urban poor would suffer from inadequate sanitation and solid-waste services and the related health impacts.
R 96 / B 6
I. Study Details
Authors USAID
Year 2004
Title Innovative approaches to slum electrification
Journal USAID
Source Website search
II. Study coverage
Basic service Electricity
Country Philippines, South Africa, Brazil
Cities Manila, Cape Town, Rio de Janeiro, Salvador, Bahia
III. Context and intervention
Type of settlement/slum Informal

400
Nature of agencies
involved in planning and
service provision
Others
Philippines
Manila Electric Company (MERALCO) supplies the electricity to the urban slums and leaves the distribution and policing of electricity lines to community members.
South Africa
PN Energy, a community-based distribution, was created to electrify the Khayelitsha slum.
Brazil
RIO LIGHT's Program for Normalization of Informal Areas (PRONAI)
COELBA ― a private company.
Form of user
participation
-
Project/intervention
funding agency
ODA and private sector
Philippines: ODA
Japan Bank for International Construction (JBIC) provides assistance to the Philippines Government (PCUP), the National Electrification Agency (NEA) and MERALCO to implement a Depressed Areas Electrification Programme (DAEP) to expand electricity connections to low-income urban settlements throughout Manila.
South Africa: private sector
ESKOM, Électricité de France (EDF) and East Midlands Electricity of the UK jointly created PN Energy, a community-based distribution company to electrify the Khayelistsha slum.
Brazil: ODA and private sector
Self-financing commercial loan guaranteed by MIGA and IDB.
COELBA ― a private company.
IV. Research design
Aim of the study A few electricity companies have forged new approaches, in partnership with national and local governments, donors, NGOs, and the communities themselves, to show that there are effective ways to achieve legal and safe electrification with generally low costs and improved service.
As a first step toward finding effective solutions to the problems of providing electricity to the urban poor, USAID launched a study in May 2003 of innovative approaches to slum electrification.

401
In this report, out of 12 potential cases, five programmes were selected that represented creative and distinct approaches to promoting legal access and addressing theft of electricity in urban slums.
Type of study Qualitative
Research design Observational
Methodology used for
data analysis
Narrative analysis
V. Data and sample
Data sources Primary data
Site visits were conducted to each community
Formal meetings were held with the governmental agencies and private entities, as well as a number of NGOs and other programme.
Secondary data
Annual report, E-paper etc.
Data period 2003
VI. Results and evidence
Evidence on outcomes Philippines: connectivity: moderately positive
More than 300,000 households were connected to electricity for the first time.
South Africa: connectivity: moderately positive
Between 1994 and 2003, PN Energy added 60,000 new connections.
Brazil: connectivity: moderately positive
Over 250,000 households were provided access to electricity for the first time.
181,000 customers were newly added to COELBA's customer base, 150,000 legal customers with inadequate connections were upgraded, and 100,000 illegal connections were regularised.
Summary of results Manila, Philippines
Households: Became eligible for individual lifeline tariff that was substantially below illegal-service-provider charges; connection fee subsidised and house-wiring loans offered.
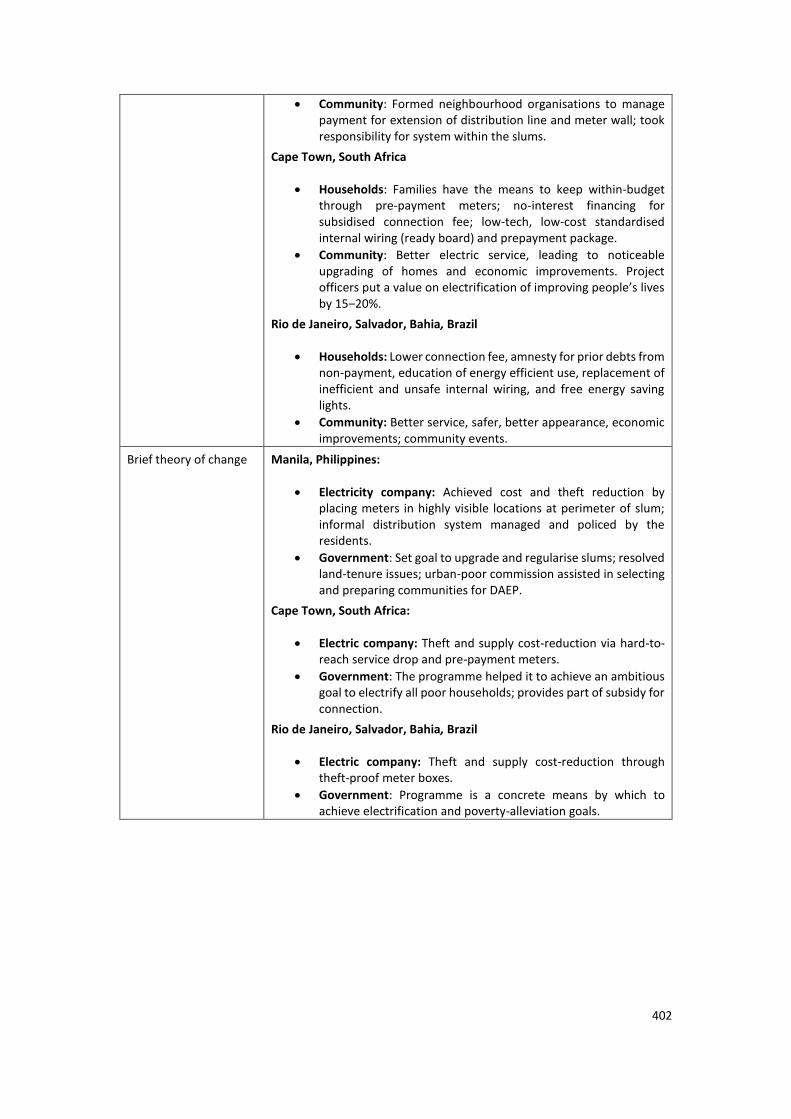
402
Community: Formed neighbourhood organisations to manage payment for extension of distribution line and meter wall; took responsibility for system within the slums.
Cape Town, South Africa
Households: Families have the means to keep within-budget through pre-payment meters; no-interest financing for subsidised connection fee; low-tech, low-cost standardised internal wiring (ready board) and prepayment package.
Community: Better electric service, leading to noticeable upgrading of homes and economic improvements. Project officers put a value on electrification of improving people’s lives by 15‒20%.
Rio de Janeiro, Salvador, Bahia, Brazil
Households: Lower connection fee, amnesty for prior debts from non-payment, education of energy efficient use, replacement of inefficient and unsafe internal wiring, and free energy saving lights.
Community: Better service, safer, better appearance, economic improvements; community events.
Brief theory of change Manila, Philippines:
Electricity company: Achieved cost and theft reduction by placing meters in highly visible locations at perimeter of slum; informal distribution system managed and policed by the residents.
Government: Set goal to upgrade and regularise slums; resolved land-tenure issues; urban-poor commission assisted in selecting and preparing communities for DAEP.
Cape Town, South Africa:
Electric company: Theft and supply cost-reduction via hard-to-reach service drop and pre-payment meters.
Government: The programme helped it to achieve an ambitious goal to electrify all poor households; provides part of subsidy for connection.
Rio de Janeiro, Salvador, Bahia, Brazil
Electric company: Theft and supply cost-reduction through theft-proof meter boxes.
Government: Programme is a concrete means by which to achieve electrification and poverty-alleviation goals.

403
R 97 / B 7
I. Study Details
Authors UN-HABITAT
Year 2006
Title UN-HABITAT report on poverty mapping: A situation analysis of poverty
zones in Jabalpur
Journal Water Aid India Report
Source Website search
II. Study coverage
Basic service Water and Sanitation
Country India
Cities Jabalpur
III. Context and intervention
Type of settlement/slum Slum ― informal
Nature of agencies
involved in planning and
service provision
NGO
Form of user
participation
-
Project/intervention
funding agency
ODA Fund
UN-HABITAT and NGOs
IV. Research design
Aim of the study In consultation with the Jabalpur Municipal Corporation (JMC) select Poverty Pockets (PPs), covering 5,000 households that were poorly placed on the MDG 7 target 10 (that is, double, by 2015, the percentage of households with access to improved water source and percentage of households with access to improved sanitation).

404
To collate the data on all PPs on availability of environmental deficiency parameters for kick starting the MAPP process by the Municipal Corporation.
Type of study Mixed-methods
Research design Observations
Methodology used for
data analysis
Simple percentage analysis
V. Data and sample
Data sources Primary
Data period April 2006
VI. Results and evidence
Evidence on outcomes Evidence
Connectivity, adequacy and affordability
Outcome Moderately positive and moderately negative
Proportion of households with water supply from stand posts
Proportion of households with piped-water connection
Proportion of households accessing water for up to two hours per day
Proportion of households accessing public toilets
Proportion of households pay for accessing public toilets
Proportion of households connected to drainage facility
Proportion of households with individual toilet facility
Summary of results The availability of public stand posts in Jabalpur is relatively high, with only 25 of the 324 PPs reporting no availability of stand posts. This seems to be indicative of the water supply’s being at a relatively acceptable level in the surveyed PPs, especially if these data are combined with findings of the drinking-water supply scenario.
In the surveyed PPs, a large proportion of households depend on public stand posts, boreholes, wells, springs, etc., for drinking water (62%), which have been designated as a safe source of drinking water. Overall, an overwhelming 66% of the households do not have access to a piped-water supply. But, of the 37,668 households that do have access to piped water, more than 64% are in areas where water supply is only available for up to two hours a day and at extremely low pressure, representing again the limited usability of available infrastructure.
In the surveyed PPs an overwhelmingly large proportion of households depend on public stand posts, boreholes, wells, springs etc, for drinking water (61%) which have been designated

405
as a safe source of drinking water. Only 34% of the households have access to piped water. Only 3% rely on relatively unsafe sources of water, such as tankers and vendors, or unprotected wells and springs.
The average amount of water availability per household is 15‒20 buckets per day, which varies in summer, because of the reduced water supply from existing water sources.
The supply of water from sources of water, such as tube wells and municipal taps, is comparatively good, and supplies water for 2‒3 hours at each time (twice in a day), but, in the summer, this becomes a problem, where water is available for around 1.5 hours only once a day, despite increased consumption during the season.
The average time spent on fetching water is not uniform; it varies from slum to slum. People spend on average 30 minutes to 2 hours a day on fetching water, sources as close as 100m to some as far as 2km.
Brief theory of change The UN-HABITAT and NGO interventions in JMC have had a positive
impact on access to water-supply services, however; other service
measures, such as affordability, and effort and time, require considerable
improvements.
R 98 / E 6
I. Study Details
Authors Wagah, G, Onyango, M and Kibwage, K
Year 2010
Title Accessibility of water services in Kisumu municipality, Kenya
Journal Journal of Geography and Regional Planning
Source Google Scholar
II. Study coverage
Basic service Water
Country Kenya
Cities Kisumu

406
III. Context and intervention
Type of settlement/slum Slum ― formal informal
Nature of agencies
involved in planning and
service provision
Government
Form of user
participation
Passive
Project/intervention
funding agency
Government
IV. Research design
Aim of the study This paper aims to demonstrate that the stated policy of increasing the proportion of people with access to safe water through privatisation of water services is likely to be unattainable with the current small and ageing distribution network.
The paper assesses the accessibility to water services, by income category, of the residential estates.
The study examines households’ accessibility in four residential estates in Kisumu: Milimani (high-income), Migosi (middle-income); Arina (low-income, planned); and Nyalenda (low- income, unplanned).
Type of study Mixed-methods
Research design Observation
Methodology used for
data analysis
Simple percentage analysis
V. Data and sample
Data sources Primary and secondary data
Primary data Household survey (stratified random sampling)
Secondary data
libraries, Internet, KIWASCO, Lake Victoria South Water Service
Board, Water Resources Management Authority, Municipal
Council of Kisumu and NEMA, among others.
Data period Not mentioned

407
VI. Results and evidence
Evidence on outcomes Outcome
Connectivity, adequacy, effort and time
Evidence
Moderately positive and moderately negative
Average per capita water use by households
Average hours of water service per day
Average distance of access to water service
Households access to piped or community tap
Summary of results The study, therefore, found that 77.1% of the households access water within a distance of 200m or less. The study further found that the unplanned low-income Nyalenda estate enjoys shorter distances to the nearest water source than the low-income, planned, Arina and middle-income Migosi estates. This is because of the existence of many water kiosks on the unplanned low-income Nyalenda estate.
The kiosks have been established at closer intervals, reducing the distance travelled by households to the nearest water points. Only 17.3% of the households in Nyalenda travel a distance of over 200m to reach the nearest water point, compared to Migosi and Arina Estate,38.6 and 32.4%, respectively, travel the same distance.
Private in-house piped connections are of primary important, yet only 19.8% of the sampled households use them as their primary source. An additional 18.6% of the households use yard taps as their primary source. In other words, 38.4% of the households in the four estates have access to a piped-water supply, either in their houses or in their yard. The study found out that 35.7% of the sampled households use the vendors as their primary source, while 21% rely on the kiosks. Therefore, 56.7% of the households in the four estates surveyed depend on either vendors or kiosks. Kiosk operators sell their water to both the vendors and household customers, who, therefore, have to transport the water over varying distances.
Brief theory of change Government has provided the piped water connections, while the private
vendor has fixed the water points nearby to the unplanned settlement
areas.

408
R 99 / B 21
I. Study Details
Authors WaterAid India
Year 2008
Title Tiruchirappalli shows the way: Community-Municipal Corporation-NGO
Partnership for City-wide Pro-poor Slums Infrastructure Improvement
Journal WaterAid Report
Source Website search
II. Study coverage
Basic service Water and sanitation
Country India
Cities Tiruchirappalli
III. Context and intervention
Type of settlement/slum Slum ― informal
Nature of agencies
involved in planning and
service provision
Government and NGOs
Form of user
participation
Passive
Project/intervention
funding agency
ODA (WaterAid)
IV. Research design
Aim of the study This study, undertaken by Gramalaya and WaterAid, with the support of Tiruchirappalli City Corporation in July 2006, sought to understand the benefits of community manageg toilets and the challenges facing this model after six years of experimentation.

409
This study is an attempt to take stock of the achievement in Trichy over the last six years and draw out lessons for building on this success.
Type of study Mixed-methods
Research design Observation
Methodology used for
data analysis
Simple percentage analysis
V. Data and sample
Data sources Primary
Structured questionnaire survey, interviews and group discussions
Data period July 2006
VI. Results and evidence
Evidence on outcomes Evidence
Connectivity, affordability
Outcome
Moderately positive and moderately negative
Proportion of households with access to community toilets
Proportion of households access to piped or community water tap
Proportion of households who can afford t to pay for and receive a water connection
Proportion of households who can afford to pay for and receive a sanitation facility
Summary of results Seventy eight percent of the total population and 92% of the 211 approved slums are reported to have access to TCC water supply, either through household connections or stand-posts. There are around 70,500 household connections, of which 6,050 (9%) are metered.
Sanitation coverage is reported at 70% in the city. In slum communities where there are no sanitation facilities, people defecate in open areas and along the banks of the Cauvery. There are 359 toilet units, with 3,146 seats, including 1,653 seats for women. Twenty of these are pay-and-use public toilets managed by TCC, located in commercial areas, and used by passers-by and people working nearby. The remaining toilet units have been constructed mainly for use by communities, mostly by TCC, and a few by Gramalaya. In recent years, TCC has constructed these toilets under the Tamil Nadu Urban Development Programme (TNUDP).

410
In Tiruchirappalli, there are 20 pay-and-use toilets, located primarily in commercial areas, are spread across the four zones. Out of these, 12 are leased to the private sector and the rest are managed by TCC.
The water-connection charge in Trichy is Rs3,000 and the sewage-connection charge Rs6,000. Households wanting a water connection must also pay for a sewage connection. These charges apply in all city corporations in the state. The water tariff for domestic use is R8 per 1,000l and Rs 25 for commercial use. However, many meters do not function and TCC levies a flat rate of Rs85 per household per month for domestic water supply and Rs30 for sewage. The poor find these connection fees and tariffs unaffordable and rely upon shared stand-posts, household toilets with septic tanks, community toilets or open defecation.
The slum has 107 households, six of which had individual latrines in 2005; this figure had increased to 18 in 2007.
It has an Integrated sanitary programmewith 10 seats (five each for men and women), two bathing units and three child-friendly toilet (CFT) seats constructed in 2005.
Brief theory of change The involvement of Gramalaya and WAVE (NGOs), and WaterAid have
resulted in a positive impact on the provision of community sanitation
and water connection in Tiruchirapalli.
R 100 / D 3
I. Study Details
Authors Weitz, A and Franceys, R
Year 2002
Title Beyond boundaries: Extending services to the urban poor
Journal Asian Development Bank
Source Cross-reference
II. Study coverage
Basic service Water and sanitation
Country Bangladesh: Informal settlement
Nepal, Pakistan, India, Vietnam, Philippines: low-income
Cities Kathmandu, Dhaka, Karachi, Hyderabad and Vijayawada, Phan Rang-Thap Cham,
Olongapo

411
III. Context and intervention
Type of settlement/slum Nepal, Bangladesh, Pakistan, India, Vietnam, Philippines
Nature of agencies
involved in planning and
service provision
Kathmandu, Nepal: government
Nepal Water Supply Corporation
Dhaka, Bangladesh: government
Dhaka Water Supply and Sewerage Authority (DWASA)
Karachi, Pakistan: user involvement
Communities lay their own sewerage lines to connect their toilets to the street laterals, and then onto the sewer pipes and storm-water drains.
Hyderabad and Vijayawada, India: NGO
Sulabh International
Phan Rang-Thap Cham, Vietnam: Others
Dong My Hai Water Supply Enterprise invested US$230,000 of its own resources raised from high-interest loans from the state and private sources to establish a private-water-supply project.
Olongapo, Philippines: Others
Subic Water and Sewerage Company Inc.
Form of user
participation
Karachi, Pakistan: participation through contribution
Community members often construct their own lines and provide for the internal infrastructure costs.
Phan Rang-Thap Cham, Vietnam: participation through contribution
The company collected advance payment from households that would use the water-supply system and after three months of operation, return the advance to the households. Water meters were to be fitted at the expense of the households, but, due to the presence of poor-quality meters, the company decided to install their own.
Project /intervention
funding agency
Kathmandu, Nepal: private sector
Lumanti, an NGO that offers a credit programme for the poor, helps to negotiate with municipal wards to secure metered community taps.
Dhaka, Bangladesh: private sector
Dusthya Shasthya Kendra (DSK) is an NGO that works primarily in the field of public health, but has assisted the communalities to secure water connections from DWASA by negotiation with the city corporation for road cutting, bearing capital costs and paying bills regularly.

412
Karachi, Pakistan: ODA
Bank of Credit and Commerce International ― UNDP-funded project to connect 500 households to a large, communal septic tank.
Hyderabad and Vijayawada, India: local government
Municipal government provides land, utilities and capital finance to Sulabh International, to construct pay-and-use community toilets in slums.
Phan Rang-Thap Cham, Vietnam: private-sector
Dong My Hai Water Supply Enterprise invested US$230,000 of its own resources, raised from high-interest loans from the state and private sources, to establish a private-water-supply project.
Olongapo, Philippines: others
Subicwater is a joint venture of Biwater International (UK), local construction firm, D.M. Consunji, Subic Metropolitan Area (SBMA) and Olongapo City Water District (OCWD).
IV. Research design
Aim of the study The case studies represent three service sectors — water supply,
sanitation, and solid-waste management — and show how the urban
poor are being served and what roles the various stakeholders play.
Type of study Qualitative
Research design Observational
Methodology used for
data analysis
Narrative analysis
V. Data and sample
Data sources Primary data
Secondary data
Data period Jan 2001‒June 2002
VI. Results and evidence
Evidence on outcomes Kathmandu, Nepal

413
Connectivity: moderately positive
Dhaka, Bangladesh
Connectivity: moderately positive
Affordability: moderately negative
Effort and time: moderately positive
Durability: moderately positive
Karachi, Pakistan
Connectivity: moderately negative
Hyderabad and Vijayawada, India
Connectivity: moderately positive
Affordability: moderately positive
Durability: moderately positive
Phan Rang-Thap Cham, Vietnam
Connectivity: moderately positive
Affordability: moderately negative
Olongapo, Philippines
Connectivity: moderately positive
Affordability: moderately negative
Summary of results Kathmandu, Nepal
13 community connections, benefiting 168 households in five communities were provided by Nepal Water Supply Corporation.
After the launch of the community-sanitation programme, 59 toilets were constructed within a month in the community.
Dhaka, Bangladesh
93 water points had been installed, providing water to an estimated 8,000 squatter households.
The rates are fixed by the community, with guidelines agreed upon by DSK to cover water bills, instalment of capital costs, and caretakers’ salaries.
Before installation of water points, residents had to wait until 1am to collect water. However, after the installation, the wait has been reduced and water is easily accessible.
DSK has involved the community by forming them into a Community Water Management Committee, which collectively manages the infrastructure, including payments, etc. DSK monitors the activities of the committee, but hands over the bank accounts to the committee after one year, during which time, the capital costs are recovered by the NGO.
Karachi, Pakistan
Over 500 households were connected to the communal septic tank, but, after a few years, the tank ceased to function due to lack of regular dislodging. Some neighbourhoods have disconnected their lines and have resumed discharge into the natural storm-water drains. Government is also implementing a

414
Greater Karachi Sewerage Plan, which superimposes a new system over the existing one and does not take into account the numerous community-built sewerage systems.
Hyderabad and Vijayawada, India
Sulabh has constructed and maintained 58 community-toilet complexes in Hyderabad and 50 free-of-charge complexes in 29 slums. Over 75% of users expressed satisfaction with access to toilets with water and soap.
Poor people are allowed to use the services free of charge.
Sulabh International has adopted innovative construction-management practices and materials, which have reduced long-term maintenance costs. Sulabh appoints caretakers to maintain the toilets and staff members regularly visit the complexes to check for cleanliness and collection of user charges.
Phan Rang-Thap Cham, Vietnam
The company was supplying water to around 6,000 families and, in the seven years of operations, customer groups expressed satisfaction with the quantity and quality of water supplied.
Cost of water was high compared to household-income levels.
Olongapo, Philippines
Disadvantaged groups, such as river squatters, now have reliable and good-quality water due to installation of piped connections.
Tariffs increased from 12 to 20 US cents per cu.
Brief theory of change The environmental health sector is in need of reform. The public-health needs in urban areas are being served by a mixture of public agencies, resourced to provide only the bare minimum water supply, sanitation, and solid-waste services; and by small-scale private enterprises.
High-income households rely upon a mixture of self-provision through ‘coping strategies’ and public supply. Low-income households cope by queuing for a long time for inadequate water, overpaying small private enterprises, and disposing of waste unhygienically.
Efficient NGOs working with communities make a difference, but usually only for a limited time and in a restricted area. Public-health provision is a government responsibility because of the scale of the task and because of the benefits to the whole of society. However, in many countries, the public sector has largely failed to deliver, and it has not proved possible to reform government agencies sufficiently to provide public health services directly.
R 101 / A 53
I. Study Details
Authors Winayanti, L and Lang, H

415
Year 2004
Title Provision of urban services in an informal settlement: A case study of Kampung
Penas Tanggul, Jakarta
Journal Habitat International
Source Electronic database
II. Study coverage
Basic service Water and sanitation
Country Indonesia
Cities Jakarta
III. Context and intervention
Type of settlement/slum Informal settlements
Nature of agencies
involved in planning and
service provision
Government
Government provided electricity connections to those houses that were legal.
NGO
World Vision International (WVI), with funds from USAID, provided the community with communal toilets with a septic tank.
SJ provides the community with resources to undertake infrastructure improvements. ISJ was also instrumental in securing the tenure of this community by organising a protest against proposed eviction. It is after the security of tenure that all infrastructures were created in the community with the help of NGOs.
Form of user
participation
Participation through contribution
Project/intervention
funding agency
ODA
USAID funds provision of basic services to the selected slum through World Vision International, an NGO working in the community.
Private

416
Institute Social Jakarta (ISJ), an NGO working in the community provided some funds to upgrade pathways, build communal bathing and toilet facilities, and water pumps.
After the slum was granted legal status, community members undertook housing improvements using their own resources, as they were sure they would not be evicted.
IV. Research design
Aim of the study The objective of this paper is to understand how poor communities gain access to urban services in informal settlements, and how NGOs and governments engage in this process.
It investigates the tensions between NGOs and governments on informal settlements and what the implications are for improvement in the quality of the housing and its environment.
Type of study Qualitative
Research design Observational
Methodology used for
data analysis
Narrative analysis
V. Data and sample
Data sources Primary data
The research is based on field observations, in-depth interviews with 21 households in the kampong, and interviews with the head of the NGO, who had assisted the community since 1986.
Data period April‒July 2011
VI. Results and evidence
Evidence on outcomes Connectivity: moderately positive
New community toilet blocks with septic tanks were added 10 meters away from the river bank.
Five communal bath, washing facilities and toilets (MCK) with hand pumps were constructed for the first time in the community.
Ten households had installed their own electricity meters after the slum was granted legal status.
Affordability: no impact
The toilets were managed collectively without routine expenses or user charges for maintenance or cleaning. Residents took turns to clean, repair or replace worn-out parts.
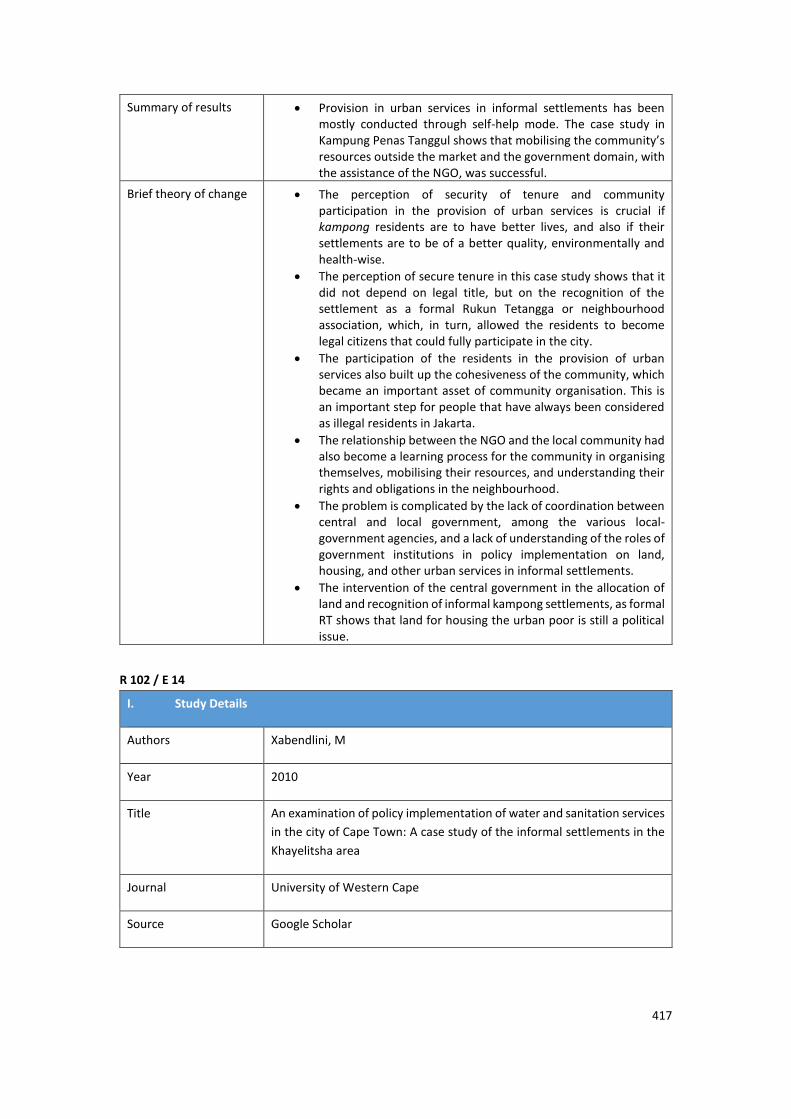
417
Summary of results Provision in urban services in informal settlements has been mostly conducted through self-help mode. The case study in Kampung Penas Tanggul shows that mobilising the community’s resources outside the market and the government domain, with the assistance of the NGO, was successful.
Brief theory of change The perception of security of tenure and community participation in the provision of urban services is crucial if kampong residents are to have better lives, and also if their settlements are to be of a better quality, environmentally and health-wise.
The perception of secure tenure in this case study shows that it did not depend on legal title, but on the recognition of the settlement as a formal Rukun Tetangga or neighbourhood association, which, in turn, allowed the residents to become legal citizens that could fully participate in the city.
The participation of the residents in the provision of urban services also built up the cohesiveness of the community, which became an important asset of community organisation. This is an important step for people that have always been considered as illegal residents in Jakarta.
The relationship between the NGO and the local community had also become a learning process for the community in organising themselves, mobilising their resources, and understanding their rights and obligations in the neighbourhood.
The problem is complicated by the lack of coordination between central and local government, among the various local-government agencies, and a lack of understanding of the roles of government institutions in policy implementation on land, housing, and other urban services in informal settlements.
The intervention of the central government in the allocation of land and recognition of informal kampong settlements, as formal RT shows that land for housing the urban poor is still a political issue.
R 102 / E 14
I. Study Details
Authors Xabendlini, M
Year 2010
Title An examination of policy implementation of water and sanitation services
in the city of Cape Town: A case study of the informal settlements in the
Khayelitsha area
Journal University of Western Cape
Source Google Scholar

418
II. Study coverage
Basic service Sanitation
Country South Africa
Cities Cape town
III. Context and intervention
Type of settlement/slum Informal settlement
Nature of agencies
involved in planning and
service provision
Government
The Integrated Development Plan (IDP) is the mechanism for attaining integration between players at local level, as well as between municipalities and their provincial and national counterparts. The local municipality has the responsibility for implementing the IDP and providing the services.
Form of user
participation
-
Project/intervention
funding agency
National government
The IDP recognised the inadequacy of the sanitation services for the informal slums and aimed to increase universal access to basic services, such as water and sanitation, by replacing old and damaged infrastructure, as well as maintaining existing passable infrastructure.
IV. Research design
Aim of the study The primary objective of this research is to identify the problems and challenges confronting the implementation of policies relating to water and sanitation at local-government level.
To review specific legislation and policies in the water and sanitation sector that apply to informal settlements.
To provide an overview of the role played by national, provincial and local government and other stakeholders in policy implementation and evaluation in this sector.
To assess the current status of implementation on the bucket-eradication project in the Khayelitsha area.
To make recommendations to policymakers for improving service delivery, particularly in the informal Khayelitsha settlement.
Type of study Qualitative
Research design Observational

419
Methodology used for
data analysis
Narrative analysis
V. Data and sample
Data sources Primary data
Secondary data
Numerical statistics, such as the number of different sanitation facilities available in the targeted informal settlements, including containerised toilets, flushable toilets and pit toilets. In addition, questionnaires will be utilised to collect data from the informal-settlements-dwellers. However, the documentary and content analyses will be used to collect data from policy documents, legal instruments and documented material.
Data period Not clearly mentioned
VI. Results and evidence
Evidence on outcomes Connectivity: moderately negative
Even though the bucket system of toilets has been replaced by the container type of toilets in all informal slums, the sanitation facility does not function properly, due to lack of water. Users are unable to wash their hands due to lack of water, posing health risks.
Adequacy: moderately negative
Maintaining the condition of these toilets is a challenge in itself. One toilet is often shared by five households. Facilities are often leaking or blocked every week.
Durability: moderately negative
Communal toilets are dysfunctional, since no-one takes the responsibility of maintenance.
Summary of results The majority of the communities in the informal settlements of Khayelitsha have access to clean water and sanitation. However, the challenge is the management and maintenance of the facilities in place.
The major informal settlements of Khayelitsha, such as Site B, Site C and Nkanini are utilising containerised toilets and a few flushable toilets.
The containerised sanitation system is a container type of toilets, which is similar to the bucket system. The difference between the containerised and bucket system is the size of the bucket and the facilities itself.
The challenge is that the communal taps in the informal settlements are located far from the sanitation facilities.

420
The lack of provision of basic services, such as water and sanitation, has a negative impact on the livelihood of the communities. This relate to the health of the community and the protection of the environment from contamination, particularly in the informal settlements. This also links to the management and collection of solid waste in the informal settlements. In fact, environment, health, and socio-economic conditions are directly linked to the provision of water and sanitation.
Brief theory of change The three identified issues include infrastructure development, solid waste and access to water and sanitation for the informal settlements dwellers.
This study also analyses the causes of the challenges confronting government on the implementation of water and services policies.
It has alluded to the South Africa’s political history, the effects of political differences, and lack of communication and consultation with communities.
One of the critical aspects highlighted in this chapter is the role of projects and programmes in the implementation of public policies.
The provision of basic services, such as water and sanitation, cannot be completely separated from the economic and environmental issues.
This includes the protection of the environment, in the process of implementing projects and programmes meant to bring services to the people.
It is also important to mention that the contaminated environment has a negative impact on the lives of the community. In essence, the provision of water and sanitation is linked to the socio-economic conditions, environment and health.
R 103 / A 2
I. Study Details
Authors Zaki, S and Nurul, A
Year 2009
Title Does the basic service privatization benefit the urban poor? Some evidence from
water supply privatization in Thailand
Journal Urban studies
Source Electronic database
II. Study coverage
Basic service Water

421
Country Thailand
Cities Pathumthani
III. Context and intervention
Type of settlement/slum Slums or formal and informal settlements (urban poor)
Nature of agencies
involved in planning and
service provision
Private-sector
Form of user
participation
Contribution
Privatisation to contribute water-service delivery to the urban slums or
informal settlements
Project/intervention
funding agency
Private-sector
IV. Research design
Aim of the study To evaluate the effect of water-supply privatisation on the urban poor
Type of study Quantitative method
Research design Quasi-experimental
Methodology used for
data analysis
Statistical methods
Descriptive analysis
Chi-squared test
V. Data and sample
Data sources A total of 212 household samples were surveyed in slum or informal
settlements in the Pathumthani province of Thailand, and were used for
the systematic sampling method adopted for survey.
Questionnaire survey
Data period 1998‒2003 pre- and post-privatisation
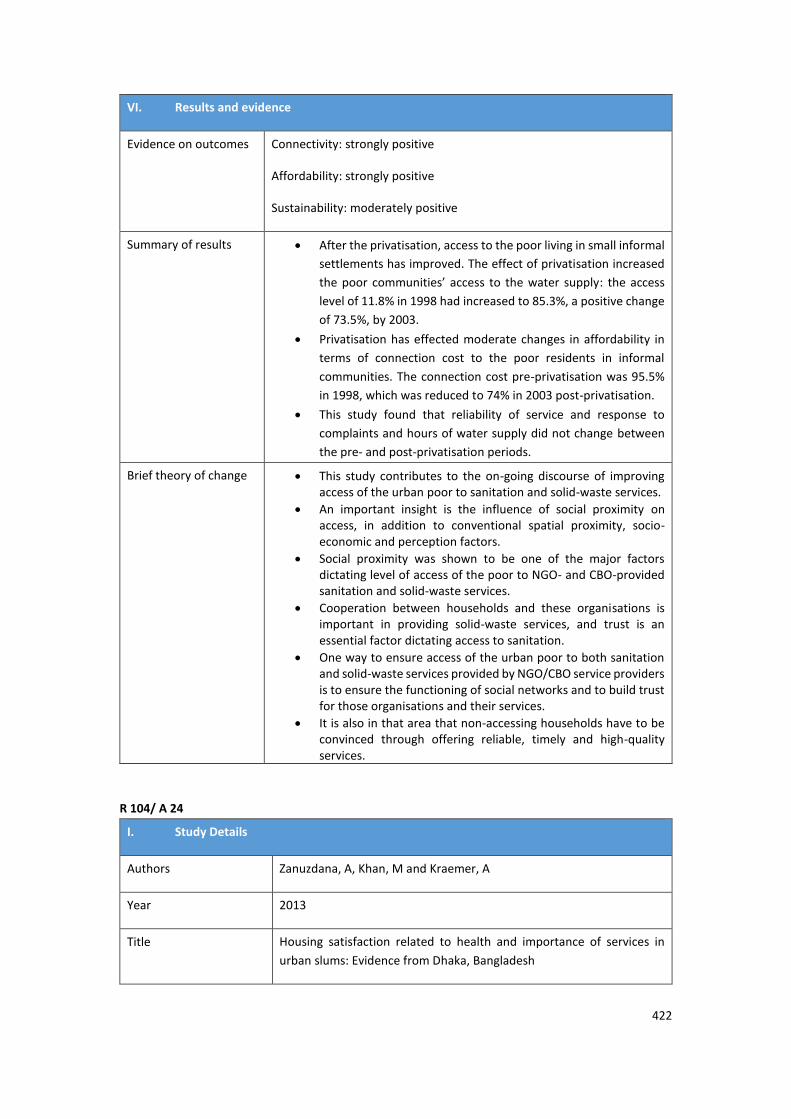
422
VI. Results and evidence
Evidence on outcomes Connectivity: strongly positive
Affordability: strongly positive
Sustainability: moderately positive
Summary of results After the privatisation, access to the poor living in small informal
settlements has improved. The effect of privatisation increased
the poor communities’ access to the water supply: the access
level of 11.8% in 1998 had increased to 85.3%, a positive change
of 73.5%, by 2003.
Privatisation has effected moderate changes in affordability in
terms of connection cost to the poor residents in informal
communities. The connection cost pre-privatisation was 95.5%
in 1998, which was reduced to 74% in 2003 post-privatisation.
This study found that reliability of service and response to
complaints and hours of water supply did not change between
the pre- and post-privatisation periods.
Brief theory of change This study contributes to the on-going discourse of improving access of the urban poor to sanitation and solid-waste services.
An important insight is the influence of social proximity on access, in addition to conventional spatial proximity, socio-economic and perception factors.
Social proximity was shown to be one of the major factors dictating level of access of the poor to NGO- and CBO-provided sanitation and solid-waste services.
Cooperation between households and these organisations is important in providing solid-waste services, and trust is an essential factor dictating access to sanitation.
One way to ensure access of the urban poor to both sanitation and solid-waste services provided by NGO/CBO service providers is to ensure the functioning of social networks and to build trust for those organisations and their services.
It is also in that area that non-accessing households have to be convinced through offering reliable, timely and high-quality services.
R 104/ A 24
I. Study Details
Authors Zanuzdana, A, Khan, M and Kraemer, A
Year 2013
Title Housing satisfaction related to health and importance of services in
urban slums: Evidence from Dhaka, Bangladesh

423
Journal Social Indicators Research
Source Electronic database
II. Study coverage
Basic service Water
Country Bangladesh
Cities Dhaka
III. Context and intervention
Type of settlement/slum Slum ― informal
Nature of agencies
involved in planning and
service provision
Government
Provision of in-house piped-water connection
Provision of piped-water connection outside home
Form of user
participation
-
Project/intervention
funding agency
State government
IV. Research design
Aim of the study The aim of our study is to identify the multiple sources of the satisfaction
with housing in urban-slum populations and rural areas in Dhaka,
Bangladesh.
Type of study Quantitative
Research design Observational
Methodology used for
data analysis
Quantitative
Ordinal regression, logistic regression
V. Data and sample
Data sources Primary data

424
The data used in this study were generated through baseline surveys
Data period March‒April 2008; March‒April 2009
VI. Results and evidence
Evidence on outcomes Connectivity (Inside home): moderately negative
Proportion of households with piped-water connection inside home
Connectivity (outside home): moderately positive
Proportion of households with piped-water connection outside home
Summary of results This study uncovered a strong link between in-house access to a water supply and overall satisfaction with the housing
In general, access to drinking water in Dhaka for slum-dwellers can be very expensive, time-consuming and physically demanding.
Other results of this study showed positive associations between unhygienic toilet facilities and overall dissatisfaction with housing. Therefore, access to clean water and sanitation, as well as waste disposal, remains a traditional challenge for the urban poor population, significantly affecting the quality of their housing and life.
At the same time, from the point of view of urban planners, this challenge can be addressed by targeted housing programmes and reaching positive results within assessable periods of time.
Brief theory of change The findings of this study clearly demonstrate the complexity of the concept of housing satisfaction and its socio-economic predictors, as well as the importance of including several sets of explanatory variables in analysis.
The existing link between health and housing satisfaction was made obvious and should be the focus of further research in urban housing and urban-planning policy. The study brings evidence for urban planners and municipal governors about which issues should be prioritised to provide urban residents with satisfactory and safe housing, taking into account growing urbanisation and migration in the megacities such as Dhaka. Beyond efforts to reduce poverty, action is required to improve sub-standard housing conditions in the long term.

425
APPENDIX 3: IDENTIFYING AND DESCRIBING STUDIES
Table A3.1: List of countries covered in the evidence base and the study count for
each country
S. No. Countries No. of studies Percentage
1 India 36 35%
2 Bangladesh 13 13%
3 Indonesia 7 7%
4 South Africa 6 6%
6 Bolivia 5 5%
7 Ghana 5 5%
8 Philippines 5 5%
5 Thailand 4 4%
9 Argentina 3 3%
10 Brazil 3 3%
11 Jordan 3 3%
12 Pakistan 3 3%
13 Peru 3 3%
14 Uganda 3 3%
15 Zambia 3 3%
16 Kenya 2 2%
17 Mexico 2 2%
18 Vanuatu 2 2%
19 Nigeria 1 1%
20 Belize 1 1%
21 Côte d’Ivoire 1 1%
22 El Salvador 1 1%
23 Ethiopia 1 1%
24 Guatemala 1 1%

426
S. No. Countries No. of studies Percentage
25 Malaysia 1 1%
26 Lebanon 1 1%
27 Namibia 1 1%
28 North Colombia 1 1%
29 Senegal 1 1%
30 Sudan 1 1%
31 Tanzania 1 1%
32 Uruguay 1 1%
33 Zimbabwe 1 1%
34 Nepal 1 1%
Total 104

427
Table A3.2: List of cities covered in the evidence base and the study count for each
city
S. No. Cities No. of studies Percentage
1 Dhaka 13 13%
2 Mumbai 9 9%
3 Ahmedabad 7 7%
4 Jakarta 5 5%
5 Delhi 4 4%
6 Kolkata 4 4%
7 Bangalore 3 3%
8 Buenos Aires 3 3%
9 Cape Town 3 3%
10 El Alto 3 3%
11 Hyderabad 3 3%
12 Karachi 3 3%
13 La Paz 3 3%
14 Manila 3 3%
15 Pune 3 3%
16 Jaipur 3 3%
17 Accra 2 2%
18 Bangkok 2 2%
19 Cochabamba 2 2%
20 Indore 2 2%
21 Jabalpur 2 2%
22 Kampala 2 2%
23 Khon Kaen 2 2%
24 Lusaka 2 2%
25 Nairobi 2 2%
26 Port Vila 2 2%

428
S. No. Cities No. of studies Percentage
27 Rio de Janeiro 2 2%
28 Rajasthan* 2 2%
29 Santa Cruz 2 2%
30 Akura 1 1%
31 Abidjan 1 1%
32 Addis Ababa 1 1%
33 Ankleshwar 1 1%
34 Asawase 1 1%
35 Baroda 1 1%
36 Bahir Dar 1 1%
37 Belize City 1 1%
38 Belo Horizonte 1 1%
39 Bali 1 1%
40 Bikaner 1 1%
41 Bhopal 1 1%
42 Cancún 1 1%
43 Central Katatura 1 1%
44 Chennai 1 1%
45 Chittagong 1 1%
46 Dakar 1 1%
47 Davao 1 1%
48 Dire Dawa 1 1%
49 Dessie 1 1%
50 Debre Zeit 1 1%
51 Dokoure 1 1%
52 Eastern Cape 1 1%
53 Greenwell Matongo C 1 1%
54 Greater Amman 1 1%

429
S. No. Cities No. of studies Percentage
55 Gondar 1 1%
56 Godhra 1 1%
57 Gwalior 1 1%
58 Gujarat* 1 1%
59 Hanna Nassif 1 1%
60 Harar 1 1%
61 Irbid 1 1%
62 Inderpuri 1 1%
63 Java 1 1%
64 Jinja 1 1%
65 Jimma 1 1%
66 Jodhpur 1 1%
67 Kathmandu 1 1%
68 Kakamega 1 1%
69 Kanpur 1 1%
70 Karnataka* 1 1%
71 Khartoum 1 1%
72 Khayelitsha 1 1%
73 Kota Kinabalu 1 1%
74 Kisumu 1 1%
75 Kumasi 1 1%
76 Holumbi Kalan 1 1%
77 Luganville 1 1%
78 Lima 1 1%
79 Mekele 1 1%
80 Meerut 1 1%
81 Mombasa 1 1%
82 Nagpur 1 1%

430
S. No. Cities No. of studies Percentage
83 Nadiad 1 1%
84 Nazret 1 1%
85 Oruro 1 1%
86 Pathumthani 1 1%
87 PotosÍ 1 1%
88 Phnom Penh 1 1%
89 Payatas 1 1%
90 Phan Rang 1 1%
91 Rosario 1 1%
92 Salvador 1 1%
93 Sekondi-Takoradi 1 1%
94 Sucre 1 1%
95 Surat 1 1%
96 Tarija 1 1%
97 Tamale 1 1%
98 Trinidad* 1 1%
99 Tiruchirappalli 1 1%
100 Vishakapatnam 1 1%
101 Vikas Nagar 1 1%
102 Yao-sehi 1 1%
103 Windhoek 1 1%
Total studies 104
(* Specific name of the city not given in the study. Only the state or country has been mentioned)

431
APPENDIX 4: META-ANALYSIS RESULTS
Figure A4.1: Forest plots for government provision of connectivity services to the
slum (by type of facility)
Egger’s test: p = 0.163
Begg-Mazumdar test: z=0.46 p=0.643
NOTE: Weights are from random effects analysis
.
.
.
.
.
Overall (I-squared = 97.1%, p = 0.000)
Kranthi,N.,Rao,D.K.(2009)
Subtotal (I-squared = 94.9%, p = 0.000)
Sanitation - Sewerage
Shrestha,R.M.et al(2008)
Snyder,R.E.et al(2013)
Field,E.(2005)
Ahmad,S.,Choi,M.J.,Ko,J.(2013)
Gulyani,S.,Talukdar,D.,Mukami,K. R.(2005)
Ahmad,S.,Choi,M.J.,Ko,J.(2013)
Snyder,R.E.et al(2013)
Ahmad,S.,Choi,M.J.,Ko,J.(2013)
Ahmad,S.,Choi,M.J.,Ko,J.(2013)
Evidence
Subtotal (I-squared = 92.4%, p = 0.000)
Sankar, S.(2005)
Electricity
Sanitation - Community Toilet
Water - Community Tap
Islam,S.M.,Khan,U.N.M.(2013)
Subbaraman,R.et al(2012)
Sankar, S.(2005)
Subtotal (I-squared = 92.2%, p = 0.000)
Sankar, S.(2005)
Ahmad,S.,Choi,M.J.,Ko,J.(2013)
Ahmad,S.,Choi,M.J.,Ko,J.(2013)
Daniere,A.G.,Takahashi,L.M.(1999)
Kranthi,N.,Rao,D.K.(2009)
Issaka,K.O.(2007)
Snyder,R.E.et al(2013)
Issaka,K.O.(2007)
Islam,S.M.,Khan,U.N.M.(2013)
Islam,S.M.,Khan,U.N.M.(2013)
Islam,S.M.,Khan,U.N.M.(2013)
Subtotal (I-squared = 87.5%, p = 0.000)
Subtotal (I-squared = 54.9%, p = 0.137)
Water - Individual Tap
Kranthi,N.,Rao,D.K.(2009)
0.63 (0.58, 0.69)
0.06 (0.00, 1.07)
0.71 (0.39, 1.31)
0.53 (0.33, 0.85)
0.48 (0.48, 0.48)
0.78 (0.48, 1.26)
0.37 (0.25, 0.57)
0.16 (0.08, 0.33)
0.63 (0.48, 0.84)
0.54 (0.54, 0.55)
0.76 (0.51, 1.15)
0.14 (0.09, 0.22)
ES (95% CI)
0.71 (0.40, 1.29)
1.09 (0.69, 1.71)
0.20 (0.15, 0.28)
33.76 (10.75, 105.99)
0.78 (0.53, 1.14)
1.13 (0.61, 2.11)
1.42 (0.78, 2.56)
0.78 (0.52, 1.18)
0.22 (0.12, 0.39)
1.38 (0.58, 3.26)
10.12 (3.45, 29.68)
0.36 (0.05, 2.81)
0.54 (0.53, 0.55)
0.11 (0.01, 1.80)
2.75 (2.12, 3.56)
1.74 (1.36, 2.21)
0.17 (0.12, 0.25)
0.42 (0.26, 0.67)
1.12 (0.28, 4.43)
10.12 (3.45, 29.68)
1.00382 1 262Ratio favours Intervention

432
Figure A4.2: Forest plots for government provision of connectivity services to slums
(by region, for different facilities)
NOTE: Weights are from random effects analysis
.
.
.
.
.
.
.
.
.
.
Overall (I-squared = 97.1%, p = 0.000)
Ahmad,S.,Choi,M.J.,Ko,J.(2013)
Subtotal (I-squared = 74.0%, p = 0.050)
Sanitation - Sewerage - South America
Subtotal (I-squared = .%, p = .)
Ahmad,S.,Choi,M.J.,Ko,J.(2013)
Subtotal (I-squared = 83.0%, p = 0.003)
Subtotal (I-squared = 94.8%, p = 0.000)
Islam,S.M.,Khan,U.N.M.(2013)
Subtotal (I-squared = 0.0%, p = 0.805)
Snyder,R.E.et al(2013)
Electricity - South America
Sanitation - Sewerage - Asia
Water - Community Tap - Asia
Snyder,R.E.et al(2013)
Islam,S.M.,Khan,U.N.M.(2013)
Subtotal (I-squared = .%, p = .)
Islam,S.M.,Khan,U.N.M.(2013)
Electricity - Asia
Evidence
Ahmad,S.,Choi,M.J.,Ko,J.(2013)
Kranthi,N.,Rao,D.K.(2009)
Gulyani,S.,Talukdar,D.,Mukami,K. R.(2005)
Subbaraman,R.et al(2012)
Issaka,K.O.(2007)
Kranthi,N.,Rao,D.K.(2009)
Ahmad,S.,Choi,M.J.,Ko,J.(2013)
Subtotal (I-squared = .%, p = .)
Kranthi,N.,Rao,D.K.(2009)
Subtotal (I-squared = .%, p = .)
Ahmad,S.,Choi,M.J.,Ko,J.(2013)
Islam,S.M.,Khan,U.N.M.(2013)
Sankar, S.(2005)
Snyder,R.E.et al(2013)
Subtotal (I-squared = 96.2%, p = 0.000)
Subtotal (I-squared = 92.2%, p = 0.000)
Water - Individual Tap - Asia
Sankar, S.(2005)
Sanitation - Community Toilet - Asia
Field,E.(2005)
Ahmad,S.,Choi,M.J.,Ko,J.(2013)
Daniere,A.G.,Takahashi,L.M.(1999)
Sanitation - Community Toilet - Africa
Water - Individual Tap - South America
Issaka,K.O.(2007)
Shrestha,R.M.et al(2008)
Water - Individual Tap - Africa
Sankar, S.(2005)
0.63 (0.58, 0.69)
0.22 (0.12, 0.39)
0.57 (0.36, 0.90)
0.54 (0.54, 0.55)
0.14 (0.09, 0.22)
0.28 (0.12, 0.69)
1.01 (0.24, 4.34)
1.74 (1.36, 2.21)
0.15 (0.08, 0.32)
0.54 (0.54, 0.55)
0.48 (0.48, 0.48)
0.20 (0.15, 0.28)
0.36 (0.05, 2.81)
0.17 (0.12, 0.25)
ES (95% CI)
0.76 (0.51, 1.15)
0.06 (0.00, 1.07)
0.16 (0.08, 0.33)
33.76 (10.75, 105.99)
0.36 (0.05, 2.81)
10.12 (3.45, 29.68)
0.63 (0.48, 0.84)
0.54 (0.53, 0.55)
10.12 (3.45, 29.68)
1.74 (1.36, 2.21)
0.78 (0.52, 1.18)
2.75 (2.12, 3.56)
1.42 (0.78, 2.56)
0.54 (0.53, 0.55)
1.13 (0.38, 3.29)
1.13 (0.61, 2.11)
1.09 (0.69, 1.71)
0.78 (0.48, 1.26)
0.37 (0.25, 0.57)
1.38 (0.58, 3.26)
0.11 (0.01, 1.80)
0.53 (0.33, 0.85)
0.78 (0.53, 1.14)
1.00382 1 262
Ratio favours Intervention

433
Figure A4.3: Forest plots for provision of connectivity to slums by alternative
service providers (by type of facility)
Egger’s test: p = 0.097
Begg-Mazumdar test: z=1.60 p=0.109
NOTE: Weights are from random effects analysis
.
.
.
.
.
.
Overall (I-squared = 100.0%, p = 0.000)
Das, A.K (2012)
Zaki,S.,Nurul,A.A.T.M.(2009)
Das, M(2011)
Das, A.K (2012)
Subtotal (I-squared = 54.8%, p = 0.065)
Electricity
Water - Community Tap
Das, M(2011)
Subtotal (I-squared = 98.8%, p = 0.000)
Subbaraman,R.et al(2012)
Das, A.K (2012)
Subtotal (I-squared = 98.4%, p = 0.000)
Mustafa,D.,Reeder,P.(2009)
Subbaraman,R.et al(2012)
Stanwix, B.(2009)
Hanchett,S.et al(2003)Sanitation - Community Toilet
Galiani,S et al(2013)
Foster,V.,Araujo,C.M.(2004)
Das, A.K (2012)
MdAdbul,B.,et al(2013)
Hailu,D.,Osorio,R.G.,Tsukada,R.(2012)
Galiani,S et al(2013)
Issaka,K.O.(2007)
Hanchett,S.et al(2003)
Galiani,S et al(2013)
Galiani,S et al(2013)Galiani,S et al(2013)
Galiani,S et al(2013)
Kranthi,N.,Rao,D.K.(2009)
Ahmad,S.,Choi,M.J.,Ko,J.(2013)
Subtotal (I-squared = 97.0%, p = 0.000)
Das, A.K (2012)
Das, A.K (2012)
Subtotal (I-squared = 99.7%, p = 0.000)
Das, M(2011)
Sanitation - Sewerage
Water - Individual Tap
Galiani,S et al(2013)
Foster,V.,Araujo,C.M.(2004)
Hailu,D.,Osorio,R.G.,Tsukada,R.(2012)
Das, M(2011)
Sanitation - Individual Toilet
Kifanyi,G.E.,et al(2013)
Galiani,S et al(2013)
Stanwix, B.(2009)
Das, A.K (2012)
Das, M(2011)
Foster,V.,Araujo,C.M.(2004)
Kayaga,S.,Kadimba-Mwanamwambwa,C.(2006)
Das, A.K (2012)
Galiani,S et al(2013)
Zaki,S.,Nurul,A.A.T.M.(2009)
MdAdbul,B.,et al(2013)
MdAdbul,B.,et al(2013)
Hanchett,S.et al(2003)
Hailu,D.,Osorio,R.G.,Tsukada,R.(2012)
Islam,S.M.,Khan,U.N.M.(2013)
Evidence
Hailu,D.,Osorio,R.G.,Tsukada,R.(2012)
Foster,V.,Araujo,C.M.(2004)
Subtotal (I-squared = .%, p = .)
1.05 (0.73, 1.52)
1.36 (0.84, 2.20)
0.41 (0.19, 0.91)
3.63 (1.68, 7.83)
0.88 (0.69, 1.12)
1.18 (0.96, 1.45)
0.94 (0.76, 1.17)
0.96 (0.53, 1.75)
1.15 (0.86, 1.54)
0.99 (0.61, 1.59)
2.53 (2.22, 2.87)
0.56 (0.35, 0.90)
0.85 (0.70, 1.03)
0.75 (0.64, 0.87)
1.33 (1.01, 1.74)
1.11 (0.68, 1.80)
0.31 (0.30, 0.31)
1.93 (1.40, 2.65)
0.41 (0.15, 1.06)
1.11 (0.19, 6.43)
2.43 (2.31, 2.56)
1.11 (0.41, 3.04)
1.42 (1.12, 1.81)
0.97 (0.54, 1.75)
2.56 (2.45, 2.68)2.40 (2.28, 2.53)
0.00 (0.00, 0.00)
9.54 (8.14, 11.18)
1.19 (0.48, 2.96)
0.89 (0.61, 1.30)
2.89 (2.76, 3.02)
1.15 (1.00, 1.34)
0.30 (0.05, 1.71)
0.66 (0.50, 0.87)
1.11 (0.59, 2.08)
2.12 (2.12, 2.13)
0.55 (0.21, 1.44)
2.32 (2.21, 2.44)
1.03 (0.88, 1.21)
5.28 (4.00, 6.97)
0.79 (0.31, 2.00)
1.04 (0.71, 1.52)
1.24 (1.01, 1.52)
0.23 (0.22, 0.23)
3.01 (0.95, 9.57)
1.09 (0.94, 1.26)
1.76 (1.33, 2.33)
0.33 (0.15, 0.68)
3.46 (2.19, 5.48)
2.46 (0.94, 6.45)
1.02 (0.81, 1.30)
2.07 (0.47, 9.18)
1.73 (1.57, 1.91)
ES (95% CI)
0.91 (0.23, 3.60)
0.34 (0.34, 0.34)
1.15 (1.00, 1.34)
1.00081 1 1232
Ratio favours Intervention
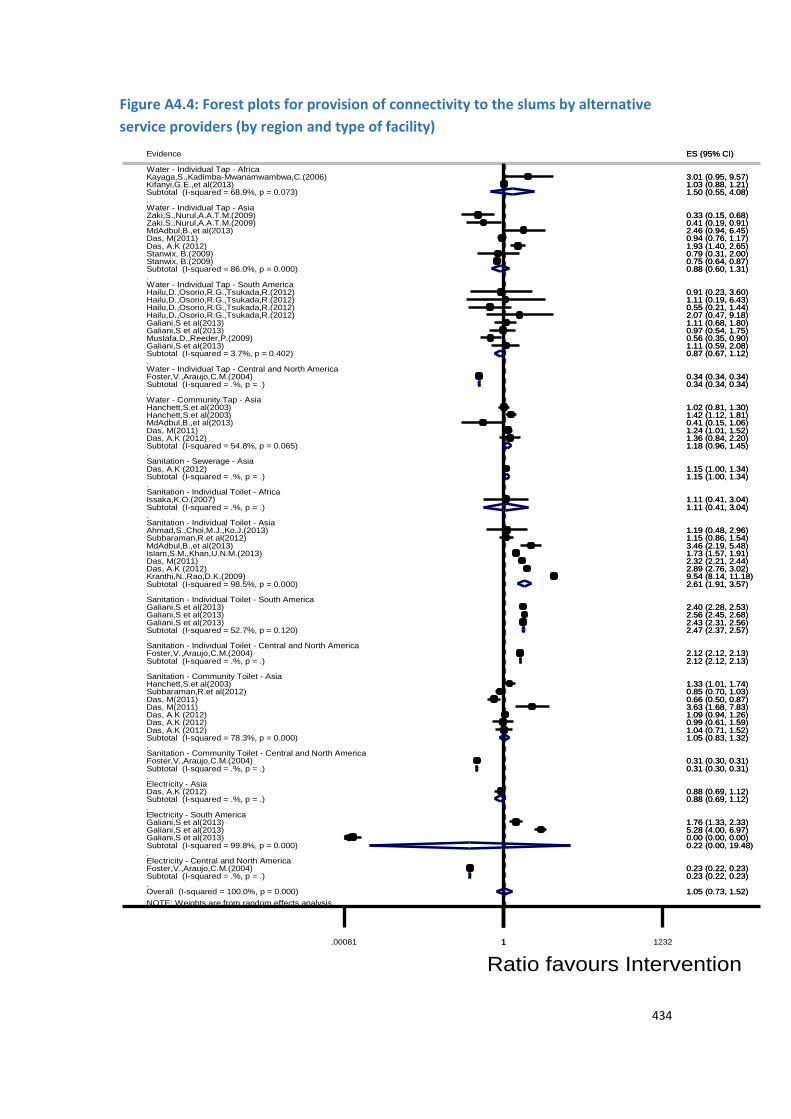
434
Figure A4.4: Forest plots for provision of connectivity to the slums by alternative
service providers (by region and type of facility)
NOTE: Weights are from random effects analysis
.
.
.
.
.
.
.
.
.
.
.
.
.
.
.
Overall (I-squared = 100.0%, p = 0.000)
Subtotal (I-squared = .%, p = .)
Subtotal (I-squared = .%, p = .)
Issaka,K.O.(2007)
Subtotal (I-squared = .%, p = .)
Foster,V.,Araujo,C.M.(2004)
Mustafa,D.,Reeder,P.(2009)
Galiani,S et al(2013)Galiani,S et al(2013)
Sanitation - Sewerage - Asia
Das, M(2011)
Hailu,D.,Osorio,R.G.,Tsukada,R.(2012)
Subtotal (I-squared = 52.7%, p = 0.120)
Hailu,D.,Osorio,R.G.,Tsukada,R.(2012)
Electricity - South America
Galiani,S et al(2013)
Foster,V.,Araujo,C.M.(2004)
Water - Individual Tap - Central and North America
Galiani,S et al(2013)
Sanitation - Individual Toilet - Central and North America
Kifanyi,G.E.,et al(2013)
Ahmad,S.,Choi,M.J.,Ko,J.(2013)
Das, A.K (2012)
Das, M(2011)
Sanitation - Individual Toilet - Asia
Subtotal (I-squared = 98.5%, p = 0.000)
Stanwix, B.(2009)
Subtotal (I-squared = 78.3%, p = 0.000)
Zaki,S.,Nurul,A.A.T.M.(2009)
Stanwix, B.(2009)
Das, M(2011)
Hailu,D.,Osorio,R.G.,Tsukada,R.(2012)
Galiani,S et al(2013)
Kayaga,S.,Kadimba-Mwanamwambwa,C.(2006)Water - Individual Tap - Africa
Sanitation - Individual Toilet - Africa
Galiani,S et al(2013)
Das, M(2011)
Das, A.K (2012)
Subbaraman,R.et al(2012)
Subtotal (I-squared = .%, p = .)
Subtotal (I-squared = .%, p = .)
Galiani,S et al(2013)
Subtotal (I-squared = 54.8%, p = 0.065)
Subtotal (I-squared = .%, p = .)
Electricity - Asia
Kranthi,N.,Rao,D.K.(2009)
Zaki,S.,Nurul,A.A.T.M.(2009)
MdAdbul,B.,et al(2013)
Das, A.K (2012)
Electricity - Central and North America
Das, A.K (2012)
Hanchett,S.et al(2003)Hanchett,S.et al(2003)Water - Community Tap - Asia
Water - Individual Tap - Asia
Subtotal (I-squared = .%, p = .)
Subtotal (I-squared = 3.7%, p = 0.402)
Islam,S.M.,Khan,U.N.M.(2013)
Das, M(2011)
Evidence
Sanitation - Community Toilet - Central and North America
Das, A.K (2012)
Das, A.K (2012)
Foster,V.,Araujo,C.M.(2004)
Subtotal (I-squared = 68.9%, p = 0.073)
Water - Individual Tap - South AmericaHailu,D.,Osorio,R.G.,Tsukada,R.(2012)
Subbaraman,R.et al(2012)
Foster,V.,Araujo,C.M.(2004)
Galiani,S et al(2013)
Subtotal (I-squared = 99.8%, p = 0.000)
MdAdbul,B.,et al(2013)
Sanitation - Individual Toilet - South America
Das, A.K (2012)
Galiani,S et al(2013)
Sanitation - Community Toilet - AsiaHanchett,S.et al(2003)
Das, A.K (2012)
MdAdbul,B.,et al(2013)
Subtotal (I-squared = 86.0%, p = 0.000)
1.05 (0.73, 1.52)
1.15 (1.00, 1.34)
0.23 (0.22, 0.23)
1.11 (0.41, 3.04)
0.31 (0.30, 0.31)
2.12 (2.12, 2.13)
0.56 (0.35, 0.90)
0.00 (0.00, 0.00)5.28 (4.00, 6.97)
0.94 (0.76, 1.17)
2.07 (0.47, 9.18)
2.47 (2.37, 2.57)
0.55 (0.21, 1.44)
2.43 (2.31, 2.56)
0.31 (0.30, 0.31)
2.40 (2.28, 2.53)
1.03 (0.88, 1.21)
1.19 (0.48, 2.96)
0.99 (0.61, 1.59)
0.66 (0.50, 0.87)
2.61 (1.91, 3.57)
0.75 (0.64, 0.87)
1.05 (0.83, 1.32)
0.33 (0.15, 0.68)
0.79 (0.31, 2.00)
2.32 (2.21, 2.44)
1.11 (0.19, 6.43)
2.56 (2.45, 2.68)
3.01 (0.95, 9.57)
1.76 (1.33, 2.33)
3.63 (1.68, 7.83)
2.89 (2.76, 3.02)
1.15 (0.86, 1.54)
2.12 (2.12, 2.13)
0.88 (0.69, 1.12)
1.11 (0.59, 2.08)
1.18 (0.96, 1.45)
1.11 (0.41, 3.04)
9.54 (8.14, 11.18)
0.41 (0.19, 0.91)
3.46 (2.19, 5.48)
1.36 (0.84, 2.20)
1.09 (0.94, 1.26)
1.42 (1.12, 1.81)1.02 (0.81, 1.30)
0.34 (0.34, 0.34)
0.87 (0.67, 1.12)
1.73 (1.57, 1.91)
1.24 (1.01, 1.52)
ES (95% CI)
1.15 (1.00, 1.34)
0.88 (0.69, 1.12)
0.23 (0.22, 0.23)
1.50 (0.55, 4.08)
0.91 (0.23, 3.60)
0.85 (0.70, 1.03)
0.34 (0.34, 0.34)
0.97 (0.54, 1.75)
0.22 (0.00, 19.48)
0.41 (0.15, 1.06)
1.04 (0.71, 1.52)
1.11 (0.68, 1.80)
1.33 (1.01, 1.74)
1.93 (1.40, 2.65)
2.46 (0.94, 6.45)
0.88 (0.60, 1.31)
1.00081 1 1232
Ratio favours Intervention

435
Figure A4.5: Forest plots for proportion of households who find it affordable to pay
the cost incurred for accessing basic services provided by alternative providers
Egger’s test: p = 0.320
Begg-Mazumdar test: z=1.43 p=0.152
NOTE: Weights are from random effects analysis
.
.
Overall (I-squared = 73.1%, p = 0.000)
Mustafa,D.,Reeder,P.(2009)
Kayaga,S.,Kadimba-Mwanamwambwa,C.(2006)
Water - Community Tap - Affordability
Water - Individual Tap - Affordability
Hailu,D.,Osorio,R.G.,Tsukada,R.(2012)
Zaki,S.,Nurul,A.A.T.M.(2009)
Zaki,S.,Nurul,A.A.T.M.(2009)
Subtotal (I-squared = 81.1%, p = 0.000)
Hailu,D.,Osorio,R.G.,Tsukada,R.(2012)
Subtotal (I-squared = 0.0%, p = 0.668)
Hailu,D.,Osorio,R.G.,Tsukada,R.(2012)
Zaki,S.,Nurul,A.A.T.M.(2009)
Zaki,S.,Nurul,A.A.T.M.(2009)
Hailu,D.,Osorio,R.G.,Tsukada,R.(2012)
Evidence
1.11 (0.67, 1.83)
0.20 (0.10, 0.38)
1.28 (0.74, 2.24)
0.87 (0.43, 1.79)
2.66 (0.76, 9.28)
0.97 (0.44, 2.10)
0.82 (0.33, 2.06)
2.11 (0.78, 5.68)
1.42 (1.02, 1.97)
1.28 (0.27, 6.08)
1.75 (0.70, 4.38)
1.60 (0.84, 3.06)
1.11 (0.45, 2.72)
ES (95% CI)
1.11 (0.67, 1.83)
0.20 (0.10, 0.38)
1.28 (0.74, 2.24)
0.87 (0.43, 1.79)
2.66 (0.76, 9.28)
0.97 (0.44, 2.10)
0.82 (0.33, 2.06)
2.11 (0.78, 5.68)
1.42 (1.02, 1.97)
1.28 (0.27, 6.08)
1.75 (0.70, 4.38)
1.60 (0.84, 3.06)
1.11 (0.45, 2.72)
ES (95% CI)
1.105 1 9.53Ratio favours Intervention

436
Figure A4.6: Forest plots for mean amount spent on water consumption in
US$/month for government and alternative provision of service
Egger’s test: p = 0.796
Begg-Mazumdar test: z=0.24 p=0.806
NOTE: Weights are from random effects analysis
.
.
Top-down / Service by public agencies
Gulyani et al (2005)
Subtotal (I-squared = .%, p = .)
Bottom - Up/ service by alternate agencies
Israel (2007)
Tukahirwa et al (2011)
Tukahirwa et al (2011)
Israel (2007)
Subtotal (I-squared = 83.4%, p = 0.000)
Evidence
0.83 (0.53, 1.29)
0.83 (0.53, 1.29)
1.00 (0.16, 6.41)
0.22 (0.13, 0.38)
0.15 (0.06, 0.40)
1.00 (0.54, 1.84)
0.39 (0.14, 1.08)
ES (95% CI)
0.83 (0.53, 1.29)
0.83 (0.53, 1.29)
1.00 (0.16, 6.41)
0.22 (0.13, 0.38)
0.15 (0.06, 0.40)
1.00 (0.54, 1.84)
0.39 (0.14, 1.08)
ES (95% CI)
1.0585 1 17.1Ratio favours Intervention

437
Figure A4.7: Forest plots for households who have reported that the availability of
basic services was adequate for government and alternative provision of basic
services
Egger’s test: p = 0.332
Begg-Mazumdar test: z=-0.34 p=1.00
NOTE: Weights are from random effects analysis
.
.
Top-down / Service by public agencies
Gulyani et al (2005)
Subtotal (I-squared = .%, p = .)
Bottom - Up/ service by alternate agencies
Israel (2007)
Tukahirwa et al (2011)
Tukahirwa et al (2011)
Israel (2007)
Subtotal (I-squared = 83.4%, p = 0.000)
Evidence
0.83 (0.53, 1.29)
0.83 (0.53, 1.29)
1.00 (0.16, 6.41)
0.22 (0.13, 0.38)
0.15 (0.06, 0.40)
1.00 (0.54, 1.84)
0.39 (0.14, 1.08)
ES (95% CI)
0.83 (0.53, 1.29)
0.83 (0.53, 1.29)
1.00 (0.16, 6.41)
0.22 (0.13, 0.38)
0.15 (0.06, 0.40)
1.00 (0.54, 1.84)
0.39 (0.14, 1.08)
ES (95% CI)
1.0585 1 17.1Ratio favours Intervention

438
Figure A4.8: Forest plots for consumption of electricity (in kwh) and water (in litres)
indicating adequacy levels under government service provision
Begg-Mazumdar test: z=0.00 p=1.00
NOTE: Weights are from random effects analysis
.
.
Overall (I-squared = 98.0%, p = 0.000)
Evidence
Subtotal (I-squared = .%, p = .)
Electricity - Adequacy
Mimmi and Ecer (2010)
Smith and Hanson (2003)
Water - Individual Tap - Adequacy
Subtotal (I-squared = .%, p = .)
0.09 (0.00, 7.73)
ES (95% CI)
0.01 (0.00, 0.03)
0.84 (0.78, 0.90)
0.01 (0.00, 0.03)
0.84 (0.78, 0.90)
0.09 (0.00, 7.73)
ES (95% CI)
0.01 (0.00, 0.03)
0.84 (0.78, 0.90)
0.01 (0.00, 0.03)
0.84 (0.78, 0.90)
1.00106 1 946
Ratio favours Intervention

439
Figure A4.9: Forest plots for proportion of households that have reported less
effort to access the basic services under alternative service provision
Begg-Mazumdar test: z=0.00 p=1.00
NOTE: Weights are from random effects analysis
.
Bottom-up/ Service provided by alternate services - Effort
Kayaga,S.,Kadimba-Mwanamwambwa,C.(2006)
Kayaga,S.,Kadimba-Mwanamwambwa,C.(2006)
Subtotal (I-squared = 0.0%, p = 0.617)
Evidence
1.15 (0.73, 1.84)
0.98 (0.62, 1.54)
1.06 (0.77, 1.47)
ES (95% CI)
1.15 (0.73, 1.84)
0.98 (0.62, 1.54)
1.06 (0.77, 1.47)
ES (95% CI)
1.544 1 1.84
Ratio favours Intervention

440
Figure A4.10: Forest plots for distance travelled (in meters) to access the basic
service under alternative service provision
Begg-Mazumdar test: z=0.00 p=1.00
NOTE: Weights are from random effects analysis
.
Bottom-up / Service provider by alternate service - Effort (Distance)
Tukahirwa,J.T.et al(2011)
Tukahirwa,J.T.et al(2011)
Subtotal (I-squared = 0.0%, p = 0.402)
Evidence
1.00 (0.38, 2.65)
0.62 (0.35, 1.08)
0.70 (0.43, 1.13)
ES (95% CI)
1.00 (0.38, 2.65)
0.62 (0.35, 1.08)
0.70 (0.43, 1.13)
ES (95% CI)
1.351 1 2.85Ratio favours Intervention

441
Figure A4.11: Forest plots for level of community participation (on connectivity)
under alternative service provision
NOTE: Weights are from random effects analysis
.
.
Overall (I-squared = 100.0%, p = 0.000)
Das, A.K (2012)
Foster,V.,Araujo,C.M.(2004)Galiani,S et al(2013)
MdAdbul,B.,et al(2013)
Subtotal (I-squared = 100.0%, p = 0.000)
Subbaraman,R.et al(2012)
Das, M(2011)
Kayaga,S.,Kadimba-Mwanamwambwa,C.(2006)
Zaki,S.,Nurul,A.A.T.M.(2009)
Das, M(2011)
Das, A.K (2012)
Das, A.K (2012)
Subbaraman,R.et al(2012)
Hailu,D.,Osorio,R.G.,Tsukada,R.(2012)
Galiani,S et al(2013)
Das, A.K (2012)
Galiani,S et al(2013)
Stanwix, B.(2009)
Mustafa,D.,Reeder,P.(2009)
Das, M(2011)
Issaka,K.O.(2007)
Das, A.K (2012)
MdAdbul,B.,et al(2013)
Stanwix, B.(2009)
Hailu,D.,Osorio,R.G.,Tsukada,R.(2012)
Foster,V.,Araujo,C.M.(2004)
Galiani,S et al(2013)
Das, A.K (2012)
Galiani,S et al(2013)
Das, A.K (2012)
Hailu,D.,Osorio,R.G.,Tsukada,R.(2012)
Zaki,S.,Nurul,A.A.T.M.(2009)
Active community participation
Hanchett,S.et al(2003)
Kranthi,N.,Rao,D.K.(2009)
Foster,V.,Araujo,C.M.(2004)
Subtotal (I-squared = 98.0%, p = 0.000)
Das, M(2011)
Galiani,S et al(2013)
Das, A.K (2012)
Ahmad,S.,Choi,M.J.,Ko,J.(2013)
Galiani,S et al(2013)
Galiani,S et al(2013)
Das, M(2011)
Foster,V.,Araujo,C.M.(2004)
Hanchett,S.et al(2003)
Kifanyi,G.E.,et al(2013)
Limited or No Participation
Islam,S.M.,Khan,U.N.M.(2013)
MdAdbul,B.,et al(2013)
Hanchett,S.et al(2003)
Hailu,D.,Osorio,R.G.,Tsukada,R.(2012)
Galiani,S et al(2013)
Evidence
1.05 (0.73, 1.52)
1.09 (0.94, 1.26)
2.12 (2.12, 2.13)0.97 (0.54, 1.75)
2.46 (0.94, 6.45)
0.79 (0.48, 1.29)
0.85 (0.70, 1.03)
0.66 (0.50, 0.87)
3.01 (0.95, 9.57)
0.33 (0.15, 0.68)
0.94 (0.76, 1.17)
1.36 (0.84, 2.20)
1.15 (1.00, 1.34)
1.15 (0.86, 1.54)
0.55 (0.21, 1.44)
2.43 (2.31, 2.56)
2.89 (2.76, 3.02)
1.76 (1.33, 2.33)
0.79 (0.31, 2.00)
0.56 (0.35, 0.90)
3.63 (1.68, 7.83)
1.11 (0.41, 3.04)
1.04 (0.71, 1.52)
3.46 (2.19, 5.48)
0.75 (0.64, 0.87)
2.07 (0.47, 9.18)
0.34 (0.34, 0.34)
0.00 (0.00, 0.00)
0.99 (0.61, 1.59)
2.56 (2.45, 2.68)
1.93 (1.40, 2.65)
1.11 (0.19, 6.43)
0.41 (0.19, 0.91)
1.42 (1.12, 1.81)
9.54 (8.14, 11.18)
0.31 (0.30, 0.31)
1.92 (1.62, 2.27)
2.32 (2.21, 2.44)
1.11 (0.59, 2.08)
0.88 (0.69, 1.12)
1.19 (0.48, 2.96)
5.28 (4.00, 6.97)
1.11 (0.68, 1.80)
1.24 (1.01, 1.52)
0.23 (0.22, 0.23)
1.02 (0.81, 1.30)
1.03 (0.88, 1.21)
1.73 (1.57, 1.91)
0.41 (0.15, 1.06)
1.33 (1.01, 1.74)
0.91 (0.23, 3.60)
2.40 (2.28, 2.53)
ES (95% CI)
1.00081 1 1232
Ratio favours Intervention

442
Figure A4.12: Forest plots for connectivity by type of slum under government
service provision
NOTE: Weights are from random effects analysis
.
.
.
Overall (I-squared = 97.1%, p = 0.000)
Slum - informal
Islam,S.M.,Khan,U.N.M.(2013)Islam,S.M.,Khan,U.N.M.(2013)
Ahmad,S.,Choi,M.J.,Ko,J.(2013)
Subtotal (I-squared = .%, p = .)
Low income househld
Slum - formal
Islam,S.M.,Khan,U.N.M.(2013)
Ahmad,S.,Choi,M.J.,Ko,J.(2013)Sankar, S.(2005)Sankar, S.(2005)Subbaraman,R.et al(2012)Snyder,R.E.et al(2013)
Ahmad,S.,Choi,M.J.,Ko,J.(2013)
Subtotal (I-squared = 96.8%, p = 0.000)
Islam,S.M.,Khan,U.N.M.(2013)
Daniere,A.G.,Takahashi,L.M.(1999)
Kranthi,N.,Rao,D.K.(2009)
Evidence
Snyder,R.E.et al(2013)
Ahmad,S.,Choi,M.J.,Ko,J.(2013)
Issaka,K.O.(2007)
Kranthi,N.,Rao,D.K.(2009)
Subtotal (I-squared = 97.5%, p = 0.000)
Field,E.(2005)
Shrestha,R.M.et al(2008)
Issaka,K.O.(2007)
Sankar, S.(2005)
Ahmad,S.,Choi,M.J.,Ko,J.(2013)
Gulyani,S.,Talukdar,D.,Mukami,K. R.(2005)
Ahmad,S.,Choi,M.J.,Ko,J.(2013)
Snyder,R.E.et al(2013)
Kranthi,N.,Rao,D.K.(2009)
0.63 (0.58, 0.69)
2.75 (2.12, 3.56)1.74 (1.36, 2.21)
0.76 (0.51, 1.15)
0.78 (0.48, 1.26)
0.20 (0.15, 0.28)
0.63 (0.48, 0.84)0.78 (0.53, 1.14)1.09 (0.69, 1.71)33.76 (10.75, 105.99)0.54 (0.54, 0.55)
0.78 (0.52, 1.18)
0.55 (0.50, 0.60)
0.17 (0.12, 0.25)
1.38 (0.58, 3.26)
10.12 (3.45, 29.68)
ES (95% CI)
0.48 (0.48, 0.48)
0.22 (0.12, 0.39)
0.11 (0.01, 1.80)
0.06 (0.00, 1.07)
0.94 (0.36, 2.47)
0.78 (0.48, 1.26)
0.53 (0.33, 0.85)
0.36 (0.05, 2.81)
1.42 (0.78, 2.56)
0.37 (0.25, 0.57)
0.16 (0.08, 0.33)
0.14 (0.09, 0.22)
0.54 (0.53, 0.55)
10.12 (3.45, 29.68)
1.00382 1 262
Ratio favours Intervention

443
Figure A4.13: Forest plots for connectivity by type of slum when service was
delivered by alternative providers
NOTE: Weights are from random effects analysis
Overall (I-squared = 100.0%, p = 0.000)
Das, A.K (2012)
Das, M(2011)
Das, A.K (2012)
Das, M(2011)
Hailu,D.,Osorio,R.G.,Tsukada,R.(2012)
Das, A.K (2012)
MdAdbul,B.,et al(2013)
Hanchett,S.et al(2003)
Zaki,S.,Nurul,A.A.T.M.(2009)
Das, A.K (2012)
Das, M(2011)Kifanyi,G.E.,et al(2013)
Galiani,S et al(2013)
Hailu,D.,Osorio,R.G.,Tsukada,R.(2012)
Hailu,D.,Osorio,R.G.,Tsukada,R.(2012)
MdAdbul,B.,et al(2013)
Subbaraman,R.et al(2012)
Hailu,D.,Osorio,R.G.,Tsukada,R.(2012)
Galiani,S et al(2013)
Galiani,S et al(2013)
Galiani,S et al(2013)
Galiani,S et al(2013)
Hanchett,S.et al(2003)
Foster,V.,Araujo,C.M.(2004)
Das, M(2011)
Foster,V.,Araujo,C.M.(2004)
Kranthi,N.,Rao,D.K.(2009)
Galiani,S et al(2013)
Hanchett,S.et al(2003)
Zaki,S.,Nurul,A.A.T.M.(2009)
Galiani,S et al(2013)
Issaka,K.O.(2007)
Das, A.K (2012)
Mustafa,D.,Reeder,P.(2009)
Stanwix, B.(2009)
Evidence
Stanwix, B.(2009)
Das, A.K (2012)
Subbaraman,R.et al(2012)
Foster,V.,Araujo,C.M.(2004)
Galiani,S et al(2013)
Ahmad,S.,Choi,M.J.,Ko,J.(2013)
Galiani,S et al(2013)Islam,S.M.,Khan,U.N.M.(2013)
Das, M(2011)Das, A.K (2012)
Foster,V.,Araujo,C.M.(2004)
Das, A.K (2012)
MdAdbul,B.,et al(2013)
Kayaga,S.,Kadimba-Mwanamwambwa,C.(2006)
1.05 (0.73, 1.52)
1.36 (0.84, 2.20)
0.66 (0.50, 0.87)
0.99 (0.61, 1.59)
2.32 (2.21, 2.44)
0.55 (0.21, 1.44)
1.04 (0.71, 1.52)
3.46 (2.19, 5.48)
1.02 (0.81, 1.30)
0.33 (0.15, 0.68)
1.93 (1.40, 2.65)
1.24 (1.01, 1.52)1.03 (0.88, 1.21)
5.28 (4.00, 6.97)
2.07 (0.47, 9.18)
0.91 (0.23, 3.60)
2.46 (0.94, 6.45)
0.85 (0.70, 1.03)
1.11 (0.19, 6.43)
1.11 (0.59, 2.08)
1.76 (1.33, 2.33)
0.00 (0.00, 0.00)
2.40 (2.28, 2.53)
1.42 (1.12, 1.81)
2.12 (2.12, 2.13)
3.63 (1.68, 7.83)
0.31 (0.30, 0.31)
9.54 (8.14, 11.18)
2.56 (2.45, 2.68)
1.33 (1.01, 1.74)
0.41 (0.19, 0.91)
1.11 (0.68, 1.80)
1.11 (0.41, 3.04)
1.09 (0.94, 1.26)
0.56 (0.35, 0.90)
0.79 (0.31, 2.00)
ES (95% CI)
0.75 (0.64, 0.87)
0.88 (0.69, 1.12)
1.15 (0.86, 1.54)
0.23 (0.22, 0.23)
2.43 (2.31, 2.56)
1.19 (0.48, 2.96)
0.97 (0.54, 1.75)1.73 (1.57, 1.91)
0.94 (0.76, 1.17)1.15 (1.00, 1.34)
0.34 (0.34, 0.34)
2.89 (2.76, 3.02)
0.41 (0.15, 1.06)
3.01 (0.95, 9.57)
1.00081 1 1232
Ratio favours Intervention

444
Figure A4.14: Forest plots for proportion of households who found the services
affordable, by type of slum, when service was delivered by alternative providers
NOTE: Weights are from random effects analysis
.
.
.
Overall (I-squared = 73.1%, p = 0.000)
Hailu,D.,Osorio,R.G.,Tsukada,R.(2012)
Mustafa,D.,Reeder,P.(2009)
Zaki,S.,Nurul,A.A.T.M.(2009)
Low income household
Hailu,D.,Osorio,R.G.,Tsukada,R.(2012)
Hailu,D.,Osorio,R.G.,Tsukada,R.(2012)
Zaki,S.,Nurul,A.A.T.M.(2009)
Subtotal (I-squared = 0.0%, p = 0.535)
Hailu,D.,Osorio,R.G.,Tsukada,R.(2012)
Zaki,S.,Nurul,A.A.T.M.(2009)
Slum - formal
Zaki,S.,Nurul,A.A.T.M.(2009)
Kayaga,S.,Kadimba-Mwanamwambwa,C.(2006)
Slum - informal
Subtotal (I-squared = .%, p = .)
Subtotal (I-squared = 81.1%, p = 0.000)
Evidence
1.11 (0.67, 1.83)
1.11 (0.45, 2.72)
0.20 (0.10, 0.38)
2.66 (0.76, 9.28)
2.11 (0.78, 5.68)
1.28 (0.27, 6.08)
0.97 (0.44, 2.10)
1.50 (0.99, 2.26)
0.87 (0.43, 1.79)
1.60 (0.84, 3.06)
1.75 (0.70, 4.38)
1.28 (0.74, 2.24)
1.28 (0.74, 2.24)
0.82 (0.33, 2.06)
ES (95% CI)
1.11 (0.67, 1.83)
1.11 (0.45, 2.72)
0.20 (0.10, 0.38)
2.66 (0.76, 9.28)
2.11 (0.78, 5.68)
1.28 (0.27, 6.08)
0.97 (0.44, 2.10)
1.50 (0.99, 2.26)
0.87 (0.43, 1.79)
1.60 (0.84, 3.06)
1.75 (0.70, 4.38)
1.28 (0.74, 2.24)
1.28 (0.74, 2.24)
0.82 (0.33, 2.06)
ES (95% CI)
1.105 1 9.53Ratio favours Intervention

445
LIST OF ABBREVIATIONS
AAA Sociedad de Aceueducto, Alcantarillado y Aseo de Barranquilla S.A
ADB Asian Development Bank
AEC Ahmedabad Electricity Company
AMA Accra Metropolitan Assembly
AMC Ahmedabad Municipal Corporation
APSA Association for Promoting Social Action
BADI Basic Amenities Deprivation Index
BMC Mumbai Municipal Corporation
BSUP Basic services for the urban poor
BWSL Belize Water Supply Limited
BWSSB Bangalore Water Supply and Sewerage Board
CBO Community-Based Organization
CLIFF Community-led Infrastructure Facility
CMC Community Management Committee
CODI Community Organizations Development Institute
CSA Central Statistical Authority
DAEP Depressed Area Electrification Program
DEWATS Decentralized wastewater treatment systems
DFID UK Department of International Development
DFID SARH UK Department for International Development South Asia Research Hub
DSK Dusthya Shasthya Kendra
DTF Devolution Trust Fund
DWASA Dhaka Water Supply and Sewerage Authority
EDF Électricité de France
EEPCO Ethiopian Electric and Power Company
EngKAR Engineering Knowledge Research Programme

446
EPPI-Centre Evidence for Policy and Practice Information and Co-ordinating Centre
ESKOM South African Utility
FGD Focus Group Discussion
GDP Gross domestic product
GNESD Global Network on Energy for Sustainable Development
IDA International Development Association
IDP Integrated Development Plan
IDPAA Institute for Developmental Policy Analysis and Advocacy
ISJ Institute Social Jakarta
JBIC Japanese Bank for International Co-operation
JMC Jabalpur Municipal Corporation
JNNURM Jawaharlal Nehru National Urban Renewal Mission
KIEB Kolkata Environment Improvement Programme
KMA Kumasi Metropolitan Assembly
KMC Kolkata Municipal Corporation
KUSP Kampala Urban Sanitation Project
KWSB Karachi Water and Sewerage Board
LGEB Local Government Engineering Bureau
LGED Local Government and Engineering Department
LMIC Low- and Middle-Income Country
LPG Liquefied petroleum gas
MDG Millennium Development Goal
MEA Metropolitan Electricity Authority
MERALCO Manila Electric Company
MPUSP Madhya Pradesh urban services for the poor programme
NEA National Electrification Agency
NESDB National Economic and Social Development Board
NGO Non-Governmental Organization
447
NSO National Statistical Office
NSS National Sample Survey
OCWD Olongapo City Water District
ODA Overseas development assistance
OPP Orangi Pilot Project
OPP-RTI Orangi Pilot Project-Research and Training Institute
PAC Public Affairs Centre
PCUP Presidents Commission on Urban Poor
PHCN Power Holding Company of Nigeria
PHED Public Health and Engineering Department
PMGP Prime Minister’s Grant Project
PMU Program Management Unit
PP Poverty Pocket
PPN Popular privatization narrative
PRONAI Program for Normalisation of Informal Areas
PSTC Population Services and Training Center
RERC Rajasthan Electricity Regulatory Commission
RWSSMB Rajasthan Water Supply and Sewerage Management Board
SBMA Subic Metropolitan Area
SBMC Sanitation Block Management Committees
SDI Service Deprivation Index
SHAHAR Supporting Household Activities for Health, Assets and Revenue project
SIDA Swedish Development Cooperation Agency
SIP Slum Improvement Project
SKAA Sindh Katchi Abadi Authority
SMD Standardised Mean Difference
SPARC Society for Promotion of Area Resource Centres
ULB Urban local bodies

448
VAMBAY Valmiki Ambedkar Awas Yojana
WASA Water Supply and Sewerage Authority
WASH Water, Sanitation and Hygiene
WSP Water and Sanitation Programme
WSS Water supply and sanitation
WSSA Water and sanitation service in Africa
WVI World Vision International