Embed Size (px)
Citation preview
1
1
What does “happiness” prompt in your mind?
Culture, word choice, and experienced happiness
Ji-eun Shin and Eunkook M. Suh
Yonsei University
Kimin Oem and Heejung S. Kim
University of California, Santa Barbara
Corresponding Author:
Eunkook M. Suh
Department of Psychology, Yonsei University
50 Yonsei-ro, Seoul, Korea, 120-749
Tel: 82-2-2123-2446
Fax: 82-2-365-4354
Email: [email protected]
Acknowledgement
This research was supported by the National Research Foundation of Korea Grant funded by
the Korean Government (NRF-2011-330-B00230).
The authors declare that they have no conflict of interest.
Cover Page
What three words come to your mind in association with “happiness”? We analyzed the 1,563
words reported by 521 Korean and American participants in this free association task. The
most frequently endorsed word was “family” in Korea, whereas the most popular word
among Americans was “smile.” The overall frequency of social words (e.g., relationships,
social emotions) reported by Koreans was higher, and the most often mentioned relationship
type differed between the two groups (family in Korea; friend in the US). Nonetheless, both
in Korea and the US, individuals who mentioned more social words were significantly more
satisfied with their lives. The amount of social support provision mediated the link between
the number of reported social words and experienced happiness. Regardless of culture, a
simple count of social words associated with happiness appears to offer a reasonably good
clue for how happy the person actually is.
Abstract
1
1
What does “happiness” prompt in your mind? 1
Culture, word choice, and experienced happiness 2
Although happiness is a universally desired state, thoughts and opinions about this 3
elusive concept exist in various forms. Some believe happiness comes primarily from unique 4
personal achievements, whereas others see it more as a communal experience attained 5
through social relationships (Diener & Suh, 2000). Also, in evaluating happiness, people 6
focus on different aspects of their lives—some look at the best, but others focus on the worst 7
(Diener, Lucas, Oishi, & Suh, 2002). What is brought forth to the mind, when thinking of 8
happiness, varies considerably across people and between cultures. In the present research, 9
we aim to measure the lay beliefs about happiness among Koreans and Americans by 10
adopting a classic method in psychology (free association), and examine how these word 11
associations predict the person’s actual happiness in each culture. 12
Beliefs about happiness matter because they tend to influence the person’s actual 13
level of happiness. In other words, how happy you are partly depends on the type of beliefs 14
and assumptions you have about happiness. In one study (Koo & Suh, 2007), for instance, 15
people reported whether they thought the total amount of happiness in one’s life is more or 16
less fixed or infinite. This lay belief predicted a wide array of attitudes and behaviors relevant 17
with happiness. The more the person believed that the total happiness in life was “fixed,” the 18
more often she engaged in social comparison, was less likely to capitalize on positive events, 19
was less popular among peers, and most importantly, was less happy. In short, there appears 20
to be an empirically meaningful link between the person’s lay thoughts about happiness and 21
how happy she actually is. 22
Although lay thoughts about happiness seem highly germane for furthering our 23
Manuscript Click here to view linked References
1 2 3 4 5 6 7 8 9 10 11 12 13 14 15 16 17 18 19 20 21 22 23 24 25 26 27 28 29 30 31 32 33 34 35 36 37 38 39 40 41 42 43 44 45 46 47 48 49 50 51 52 53 54 55 56 57 58 59 60 61 62 63 64 65
2
2
understanding of happiness, thus far, theoretical advancement in this area has been somewhat 24
limited. One reason might have to do with a commonly used study method—factor analysis 25
of questionnaire reports. For instance, in one study, Furnham and Cheng (2000) asked 26
English students to rate whether 38 statements (e.g., “having a brighter outlook on life”) 27
would be a cause of happiness. Factor analysis yielded 6 factors, such as Personal 28
Advantages, Social Support & Esteem and Optimism & Contentment. The paper concludes 29
that what people believe to be the cause of happiness corresponds highly with major research 30
conclusions. Such convergence between the participants’ ratings and literature findings, 31
however, is not entirely surprising given that the initial questionnaire items were, as the 32
authors note, “derived from the literature” (p. 231) on happiness. 33
As such, when researchers adopt a different theoretical perspective, the study often 34
reaches different conclusions. For instance, when McMahan and Estes (2011) studied 35
people’s lay beliefs of happiness by using items from hedonic and eudaimonic theories of 36
happiness, they found factors (e.g., Contribution to Others) that were quite different from 37
those reported by Furnham and Cheng (2000). As these two studies illustrate, in 38
questionnaire-based studies of lay beliefs, participants have relatively little latitude in 39
expressing their unique thoughts about happiness. Rather, they are restricted to the option of 40
either agreeing or disagreeing with items pre-selected by the researcher. In such designs, 41
theory-confirming outcomes are more likely to emerge than new insights about people’s 42
happiness beliefs. 43
Another approach, used often in cross-cultural investigations, asks participants to 44
write free-format sentences or essays about happiness, often without time or length 45
restrictions (e.g., Hitokoto & Uchida, 2015; Lu & Gilmour, 2004; Pflug, 2009; Uchida & 46
1 2 3 4 5 6 7 8 9 10 11 12 13 14 15 16 17 18 19 20 21 22 23 24 25 26 27 28 29 30 31 32 33 34 35 36 37 38 39 40 41 42 43 44 45 46 47 48 49 50 51 52 53 54 55 56 57 58 59 60 61 62 63 64 65
3
3
Kitayama, 2009). Compared to structured questionnaire studies, this approach, particularly 47
when combining qualitative and quantitative data, has been successful in probing 48
spontaneous beliefs of happiness across cultures (e.g., Delle Fave, Brdar, Freire, Vella-49
Brodrick, & Wissing, 2011; Delle Fave et al., 2016). Significant contributions have been 50
made through this approach, but it also faces several challenges. Data collection is often time 51
consuming and costly, and analyzing the free response data is highly laborious and 52
susceptible to interpretive biases. Although the studies provide valuable insights about the 53
rich content of happiness thoughts across people, less attention has been given to the question 54
of whether holding a certain belief about happiness actually relates with the experiential level 55
of happiness. 56
In this present study, we attempt to analyze lay thoughts of happiness by adopting a 57
classic method in psychology that dates back to Wundt and Freud (see Szalay & Deese, 58
1978)—a free association task (Nelson, McEmvoy, & Dennis, 2000). A free association task 59
requires participants to produce words that come to her mind that is related with a prompted 60
cue (in our study, the word “happiness”). We analyzed the responses from two cultural groups 61
(Koreans and Americans), with more attention to finding a link between happiness thought-62
experience than summarizing the contents of the happiness beliefs per se. We believe this 63
method can complement existing measures in several ways—it gives more voice to 64
participants in expressing their thoughts about happiness, and by generating a hypothesis 65
based on existing findings, it allows an opportunity to examine how beliefs about happiness 66
relate with actual experiences of happiness. 67
Despite its simplicity, researchers find that the free association procedure is a reliable 68
and valid method for capturing stable aspects of one’s associative memory network (Nelson 69
1 2 3 4 5 6 7 8 9 10 11 12 13 14 15 16 17 18 19 20 21 22 23 24 25 26 27 28 29 30 31 32 33 34 35 36 37 38 39 40 41 42 43 44 45 46 47 48 49 50 51 52 53 54 55 56 57 58 59 60 61 62 63 64 65
4
4
et al., 2000; Rozin, Kurzer, & Cohen, 2002). The specific responses given with different 70
probabilities in the free association task reflect one’s personal experiences. For instance, in 71
association with the word “alcohol,” heavy drinkers come up with more positive and arousing 72
words than light drinkers, who tended to offer more negative and sedating responses (Reich 73
& Goldman, 2005). The free association method also captures the default thoughts of groups 74
(e.g., gender, culture) on various topics. In response to the word “food,” for example, 75
Americans offer more words related with “fat” and affective states than French respondents 76
(Rozin et al., 2002). Thus, the free association method could offer a less obtrusive window to 77
the spontaneous thoughts held by lay persons on happiness. 78
Recent developments in the study of word analysis add promise to the use of the free 79
association task. A person’s simple choice of words reveals surprisingly many things about 80
her. By analyzing one’s use of vocabulary, for instance, researchers have been able to predict 81
the person’s personality (Fast & Funder, 2008), demographic characteristics (Pennebaker & 82
Stone, 2003), level of sense of power (Wakslak, Smith, & Han, 2014), physical health 83
(Pennebaker, Mayne, & Francis, 1997), and even her chance of longevity (Danner, Snowdon, 84
& Friesen, 2001). Although fruitful results have been obtained through such word analyses, 85
this approach has been rarely applied to the study of happiness. In one recent study that 86
examined words (Oishi, Graham, Kesebir, & Galinha, 2013), the focus was on dictionary 87
definitions of happiness across cultures rather than on personal patterns of word usage. 88
In this study, we analyzed, in total, 1563 words Koreans and Americans freely 89
associated with the word “happiness” (3 words per participant). Rather than documenting 90
every responded word, our analysis focused primarily on the frequency of social words that 91
the participants associated with happiness. There is a strong consensus among researchers 92
1 2 3 4 5 6 7 8 9 10 11 12 13 14 15 16 17 18 19 20 21 22 23 24 25 26 27 28 29 30 31 32 33 34 35 36 37 38 39 40 41 42 43 44 45 46 47 48 49 50 51 52 53 54 55 56 57 58 59 60 61 62 63 64 65
5
5
that positive social experience is one of the most important predictors of happiness (e.g., 93
Caprariello & Reis, 2013; Diener, Suh, Lucas, & Smith; 1999; Epley & Schroeder, 2014; 94
Myers & Diener, 1995). In a classic paper contrasting very happy versus unhappy people, for 95
instance, Diener and Seligman (2002) even concluded that social experience is the only other 96
“necessary” condition of happiness besides the absence of psychopathology. The number of 97
social words reported in association with happiness, we reasoned, could reflect the degree to 98
which the person holds a “socially schematized” theory of happiness. Using the free 99
association data as a proxy for the centrality of social experience in happiness, we focused on 100
two questions. 101
First, are the happiness theories held by Koreans more socially tainted than those 102
endorsed by Americans? One prominent difference between the two cultural regions is the 103
extent to which the independent (US) versus the interdependent (Korea) aspects of the self 104
are chronically thought of (Markus & Kitayama, 1991). Such difference in self-construal 105
pattern shapes how happiness is conceptualized and experienced. For instance, compared to 106
independent cultures, happiness in East Asian cultures is affected more by social appraisal 107
than inner feelings (Suh, Diener, Oishi, & Triandis, 1998), is linked more closely with 108
socially-engaged than socially–disengaged affect (Kitayama & Markus, 2000), and is built 109
firmly on a sense of being understood by others (Oishi, Koo, & Akimoto, 2008). As Kitayama 110
and Markus aptly summarized, happiness is considered primarily as an inner, subjective state 111
in Western cultures, whereas it is viewed as an intersubjective experience that crucially 112
involves others in East Asian cultures. 113
Given the inevitable influence of culture on linguistic patterns and habits 114
(Rommetveit, 1968), happiness is more likely to be framed with social words in Korea than 115
1 2 3 4 5 6 7 8 9 10 11 12 13 14 15 16 17 18 19 20 21 22 23 24 25 26 27 28 29 30 31 32 33 34 35 36 37 38 39 40 41 42 43 44 45 46 47 48 49 50 51 52 53 54 55 56 57 58 59 60 61 62 63 64 65
6
6
in the US. Although a strong possibility, whether this is actually true needs an empirical 116
investigation. Free association data appears to be an excellent means for answering this 117
question. We compared the frequency and salience (order of report) of social words 118
associated with happiness in the two cultural groups, and also examined whether the content 119
of social words differ in ways that are consistent with past research. 120
Second, at an individual difference level, we examined whether a meaningful link 121
exists between the person’s reported words and actual level of happiness. Given the universal 122
significance of social needs (Baumeister & Leary, 1995; Dunbar, 1998), we expected that 123
individuals who hold a more socially saturated theory of happiness would actually enjoy 124
higher levels of happiness, regardless of one’s cultural background. They may engage life in 125
ways conducive for experiencing happiness, for instance, by investing more on social 126
activities that are inherently important for experiencing happiness. Conversely, those who tie 127
happiness with non-social sources, such as money, may act or make decisions that are 128
distracting for happiness. In fact, simply thinking of money creates an asocial mindset 129
(Gasiorowska, Chaplin, Zaleskiewicz, Wygrab, & Vohs, 2016; Vohs, Mead, & Goode, 2006), 130
which in turn distances the self from a key source of happiness—other people. 131
As one potential reason for why holding a socially rich theory of happiness is 132
hedonically beneficial, we considered the possibility that people who stress the social aspects 133
engage in behaviors that enrich their social network. This idea was inspired from findings 134
that suggest that giving social support to others increases one’s own happiness (Aknin et al., 135
2013; Dunn, Aknin, & Norton, 2008; Thoits & Hewitt, 2001). Although social support is a 136
reciprocal process (giving and receiving), giving support, as opposed to receiving, is more 137
intentional and reflective of the actor’s desire for social interaction. Hence, we examined 138
1 2 3 4 5 6 7 8 9 10 11 12 13 14 15 16 17 18 19 20 21 22 23 24 25 26 27 28 29 30 31 32 33 34 35 36 37 38 39 40 41 42 43 44 45 46 47 48 49 50 51 52 53 54 55 56 57 58 59 60 61 62 63 64 65
7
7
whether those who report more social words indeed offer more support to others. We do not 139
believe that this is the sole reason for why social words predict higher happiness (for 140
instance, positive mood might also prime social words), yet it is a novel hypothesis that 141
seemed worth examining with the free association data. 142
Finally, in order to use the free association report as an individual difference 143
measure, it seemed informative to know about the person who tends to associate social words 144
with happiness. If the choice of specific happiness-related words is merely an “on-spot” 145
reaction constructed at the spur of the moment, it may not correlate meaningfully with 146
dispositional characteristics. On the other hand, if the response pattern is partly grounded on 147
stable social characteristics, it should show convergence with conceptually relevant factors. 148
We included several well-established measures that reflect the person’s level of interest, 149
desire, and competence for establishing relationship with others (e.g., need for belongingness, 150
Leary, Kelly, Cottrell, & Schreindorfer, 2012; inclusion of other scale, Aron, Aron, & 151
Smollan, 1992; loneliness scale, Russell, Peplau, & Cutrona, 1980). We expected to find a 152
significant relationship between these social dispositions and the number of social words 153
reported. Measures of optimism and self-efficacy were also included to ensure that the social 154
word reporting tendency is distinct from a general positive view about the self or future. 155
In sum, the purpose of this study was to gain insights about a person’s view of 156
happiness through a relatively novel, yet simple source—three words that the individual 157
chose to associate with happiness. We expected to find meaningful individual and cultural 158
differences in the lay belief of happiness by simply counting, out of three, the number of 159
words that convey social meaning. It was hypothesized that: a) Koreans, compared to 160
Americans, will report more social words in this task, b) regardless of culture, individuals 161
1 2 3 4 5 6 7 8 9 10 11 12 13 14 15 16 17 18 19 20 21 22 23 24 25 26 27 28 29 30 31 32 33 34 35 36 37 38 39 40 41 42 43 44 45 46 47 48 49 50 51 52 53 54 55 56 57 58 59 60 61 62 63 64 65

8
8
who report more social words would experience greater happiness, and c) those who mention 162
more social words would provide more social support to others. 163
Method 164
Participants 165
As part of a large international research project, 226 American undergraduates 166
(female =149, Mage= 19.74, SD = 5.00) and 301 Korean undergraduates participated in this 167
study. Six Korean participants were excluded because of missing data, leaving a total of 295 168
participants in the final analysis (female =145, Mage =18.77, SD = 0.90). Students in both 169
cultures were paid US $10 for their participation. The ethnic make-up of the U.S. sample was 170
67.3% Caucasian, 30.5% Asian, and 2.2 % others. Questionnaires originally written in 171
English were translated into Korean by a bilingual speaker, which was back-translated by 172
another bilingual person. Minor wording changes, when necessary, were resolved in a lab 173
discussion session participated by multiple bilingual psychology graduate students. 174
Procedure 175
After providing informed consent, participants were instructed to freely write words 176
associated with “happiness.” Following the procedure of previous studies (e.g., Rozin et al., 177
2002), the task was worded as: “Please write down three words that come to mind when you 178
think of happiness.” All word responses were coded as either social or nonsocial by two 179
research assistants who were unaware of the purpose of this study (Cohen’s κ = .97). The 180
majority of words coded as “social” referred to abstract values (e.g., love), a specific person 181
(e.g., friend, family), or relationships (e.g., dating). Minor disagreements between the coders 182
were resolved through discussion. Most relevant to our interest, out of the three words, the 183
number of social words was counted (range: 0 to 3). In total, 1563 responses (3 words per 184
1 2 3 4 5 6 7 8 9 10 11 12 13 14 15 16 17 18 19 20 21 22 23 24 25 26 27 28 29 30 31 32 33 34 35 36 37 38 39 40 41 42 43 44 45 46 47 48 49 50 51 52 53 54 55 56 57 58 59 60 61 62 63 64 65

9
9
521 participants) were included in the analysis. 185
Measures 186
After the free association task, participants completed a questionnaire that included 187
measures of happiness, emotional support provision, and social and non-social dispositional 188
characteristics. Because the current data were collected as part of a large cross-cultural 189
research project, the full scale was not available for certain dispositional variables. After 190
completing the questionnaire, participants were thanked and debriefed. 191
Happiness. Global happiness was measured using Cantril’s Self-Anchoring Scale 192
(Cantril, 1965). It asked participants to evaluate their current life satisfaction on a ladder 193
scale, which ranged from 0 (worst possible life) to 10 (best possible life). Although a single-194
item scale, the Cantril measure demonstrates strong psychometric properties (Veenhoven, 195
2012), and is one of the most widely used tools in international surveys of happiness (e.g., 196
Gallup Organization, 2009; Tay & Diener, 2011). 197
Emotional support provision. Participants were asked to indicate how much 198
emotional care and comfort they typically provide to their family and friends during times of 199
need, respectively. Responses for the two items were coded on a 7-point scale, ranging from 1 200
(none) to 7 (very much) and combined to form a social support giving variable. 201
Need for belonging. The need for belonging was measured by administrating the 202
even-numbered items (2, 4, 6, 8, and 10) from the original 10-item Need to Belong Scale 203
(Leary et al., 2012). It included items such as “I do not like being alone,” and “My feelings 204
are easily hurt when I feel that others do not accept me.” Items were reported on a 7-point 205
scale, ranging from 1 (strongly disagree) to 7 (strongly agree). The internal consistency of the 206
scale (alpha) was .72. 207
1 2 3 4 5 6 7 8 9 10 11 12 13 14 15 16 17 18 19 20 21 22 23 24 25 26 27 28 29 30 31 32 33 34 35 36 37 38 39 40 41 42 43 44 45 46 47 48 49 50 51 52 53 54 55 56 57 58 59 60 61 62 63 64 65

10
10
Interpersonal closeness. Interpersonal closeness was assessed through the Inclusion 208
of Other in the Self scale (IOS; Aron et al., 1992). The IOS scale presents seven figures in 209
which two circles, each representing the self and others, overlap to a different degree. 210
Participants were asked to choose the figure that best indicates the extent to which they feel 211
connected to others. 212
Loneliness. Loneliness was measured using 3 items (4, 5, and 16; α = .72) from the 213
original 20-item revised UCLA Loneliness Scale (Russell et al., 1980) that measures 214
subjective feelings of being alone. Statements included items such as “There are people who 215
really understand me (reversed),” “I feel part of a group of friends.” Items were reported on a 216
7-point scale, ranging from 1 (strongly disagree) to 7 (strongly agree). 217
Optimism. An item from the Life Orientation Test-Revised (LOT-R; Scheier, Carver, 218
& Bridges, 1994) that seemed to have high face validity (“I'm always optimistic about my 219
future”) was used to measure optimism. Participants answered on a 7-point scale, ranging 220
from 1 (strongly disagree) to 7 (strongly agree). 221
Self-efficacy. Participants' level of self-efficacy were assessed by a single item 222
measure of self-efficacy (“I can do just about anything I really set my mind to”), adapted 223
from Pearlin and Schooler (1978). Response was made on a 7-point scale, ranging from 1 224
(strongly disagree) to 7 (strongly agree). 225
Results 226
Of the 1,563 total words associated with happiness, 38 percent of them were 227
categorized as social. When analyzed separately by cultural group, a number of interesting 228
differences were found. First, the most commonly associated word with happiness in Korea 229
was “family” (113 out of 885 total responses; 12.8%), whereas affective states or expressions 230
1 2 3 4 5 6 7 8 9 10 11 12 13 14 15 16 17 18 19 20 21 22 23 24 25 26 27 28 29 30 31 32 33 34 35 36 37 38 39 40 41 42 43 44 45 46 47 48 49 50 51 52 53 54 55 56 57 58 59 60 61 62 63 64 65
11
11
(e.g., “smile,” “laugh”) topped the list (78 out of 678 total responses; 11.5%) in the response 231
of Americans. Consistent with past research, happiness seemed to be strongly attached to a 232
relational dimension among Koreans, whereas it reminds Americans foremost of a hedonic 233
emotional state (Schimmack, Radhakrishnan, Oishi, Dzokoto, & Ahadi, 2002; Suh et al., 234
1998). 235
When the words categorized as social were probed in more detail, “family” (113 out 236
of 373 social words; 30.3%) was the most popular response among Koreans, whereas in the 237
US, “friend/friendship” was mentioned the most (69 out of 220 social words, 31.4 %). The 238
most central relationship associated with happiness seems different in the two cultures, which 239
is in line with the general claim that ascribed, in-group (versus self-chosen) relationships play 240
a more prominent role in the psychological experiences of Eastern than Western cultural 241
members (Markus & Kitayama, 1991). Quite interestingly, the current pattern is nearly an 242
exact mirror image of a recent report on loneliness. Among European nations, the primary 243
predictor of loneliness is the absence of family interactions in more collectivist societies, 244
whereas the absence of confidant or friend is key in more individualistic societies (Lykes & 245
Kemmelmeier, 2014). 246
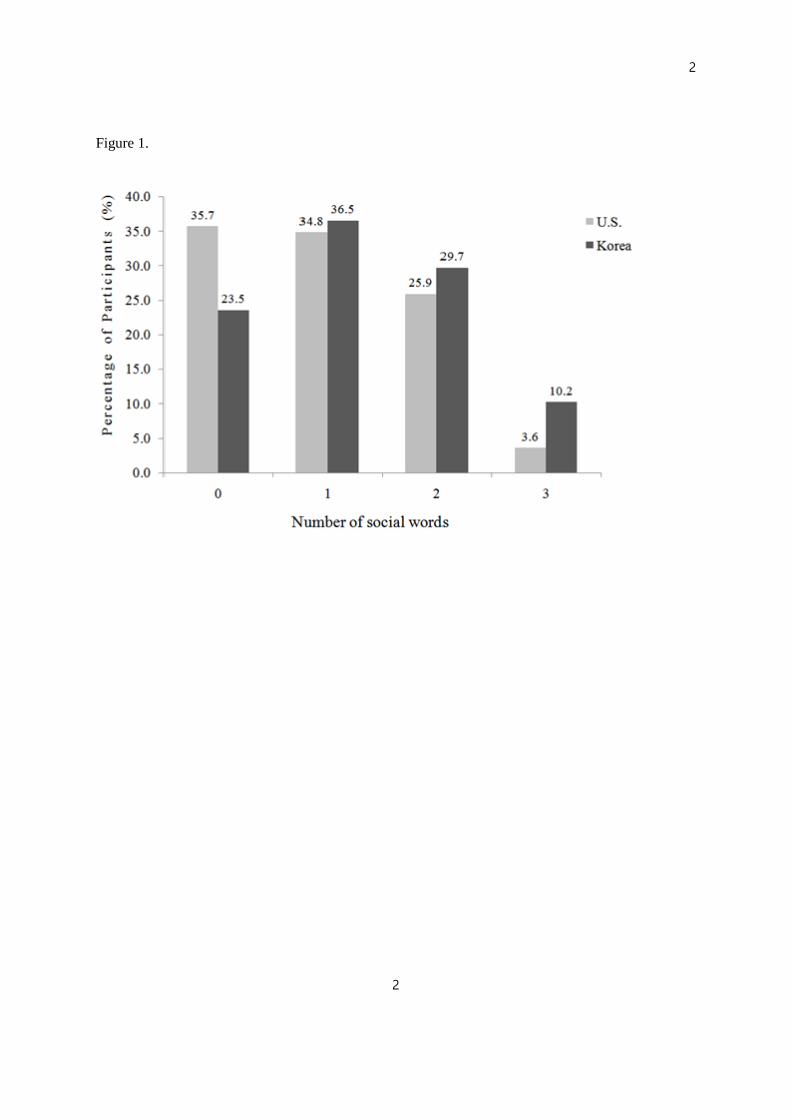
We also examined possible cultural differences at a quantitative level. Among the 247
three possible responses, Koreans mentioned 1.26 words pertaining to social experiences, 248
relationships, or relational values (e.g., love). Such social words were mentioned significantly 249
less (0.97 times) by Americans, t(519) = 3.63, p < .001, d = 0.32. As shown in Figure 1, the 250
three blanks were filled entirely by social words among approximately 10% of the Koreans, 251
whereas only 4% of Americans did so. On the flipside, 24% of Koreans and 36% of the 252
Americans did not mention a single social word. Additionally, as suggested by Nelson and 253
1 2 3 4 5 6 7 8 9 10 11 12 13 14 15 16 17 18 19 20 21 22 23 24 25 26 27 28 29 30 31 32 33 34 35 36 37 38 39 40 41 42 43 44 45 46 47 48 49 50 51 52 53 54 55 56 57 58 59 60 61 62 63 64 65
12
12
colleagues (2000), we compared the first word the two groups wrote in this free association 254
task to examine the relative salience of the social dimension. Roughly half of the Korean 255
respondents (51.5%) chose a social word as a first response, whereas only 35.8% of 256
Americans did so, χ2 (1, n = 521) = 12.73, p < .001. As a whole, inferring from these word 257
analyses, lay beliefs of happiness seem to contain more social notions in Korea than in the 258
US. 259
Between individuals, what type of persons write more or less social words in this 260
task? To find out, we examined whether the number of social word associated with happiness 261
correlates with stable social characteristics. Both in Korea and in the US, individuals who 262
reported more social words felt a stronger sense of psychological overlap between the self 263
and others (r with IOS: Korea, .22, p < .001; US, .14, p < .05), and reported less loneliness (r 264
with loneliness: Korea, -.19, p < .01; US, -.19, p < .01). Although the direction was similar, 265
the correlation between social word frequency and need to belong was significant only in 266
Korea (Korea, r = .15, p < .05; US, r = .09, ns). On the other hand, in both cultures, positive 267
attitudes about life in general (optimism) and self-efficacy did not predict how many social 268
words the person reported. The overall pattern suggests that the frequency of social words 269
reported in this task may not be due to a random response nor a general positive bias, but 270
rather, reflect how much the person prioritizes the social aspects in her overall life. 271
The most central question of this research was whether the number of social terms 272
reported in this task predicts the person’s actual happiness level. In both cultures, those who 273
mentioned more social words enjoyed significantly higher life satisfaction (Korea, β = .19, b 274
= .28, SE = .08, t(293) = 3.35, p = .001; US, β = .15, b = .24, SE =.11, t(224) = 2.23, p 275
= .027). Is this pattern more pronounced in one culture than another? No significant culture × 276
1 2 3 4 5 6 7 8 9 10 11 12 13 14 15 16 17 18 19 20 21 22 23 24 25 26 27 28 29 30 31 32 33 34 35 36 37 38 39 40 41 42 43 44 45 46 47 48 49 50 51 52 53 54 55 56 57 58 59 60 61 62 63 64 65

13
13
social word interaction on well-being was found, β = -.01, t(517) = -0.25, ns, suggesting that 277
defining happiness in social terms is beneficial to happiness in both cultures. We find it quite 278
remarkable that one’s level of happiness is captured by three (social) words a person chooses 279
to associate with happiness. The current finding affirms in a novel way that social experience 280
is indeed a core block of happiness. 281
There may be various reasons for why having a highly social theory of happiness 282
translates into greater well-being. Within the constraints of our correlational data, we 283
considered one possibility. Those who endorse a social theory of happiness might engage 284
more often in behaviors that enrich social ties, such as giving social support to others. To 285
examine this possibility, the PROCESS method (Model 58; Preacher & Hayes, 2008) was 286
conducted. Social support was entered as a mediator between number of social words and life 287
satisfaction, where mediation was assessed on a point estimate and bootstrapped 95% 288
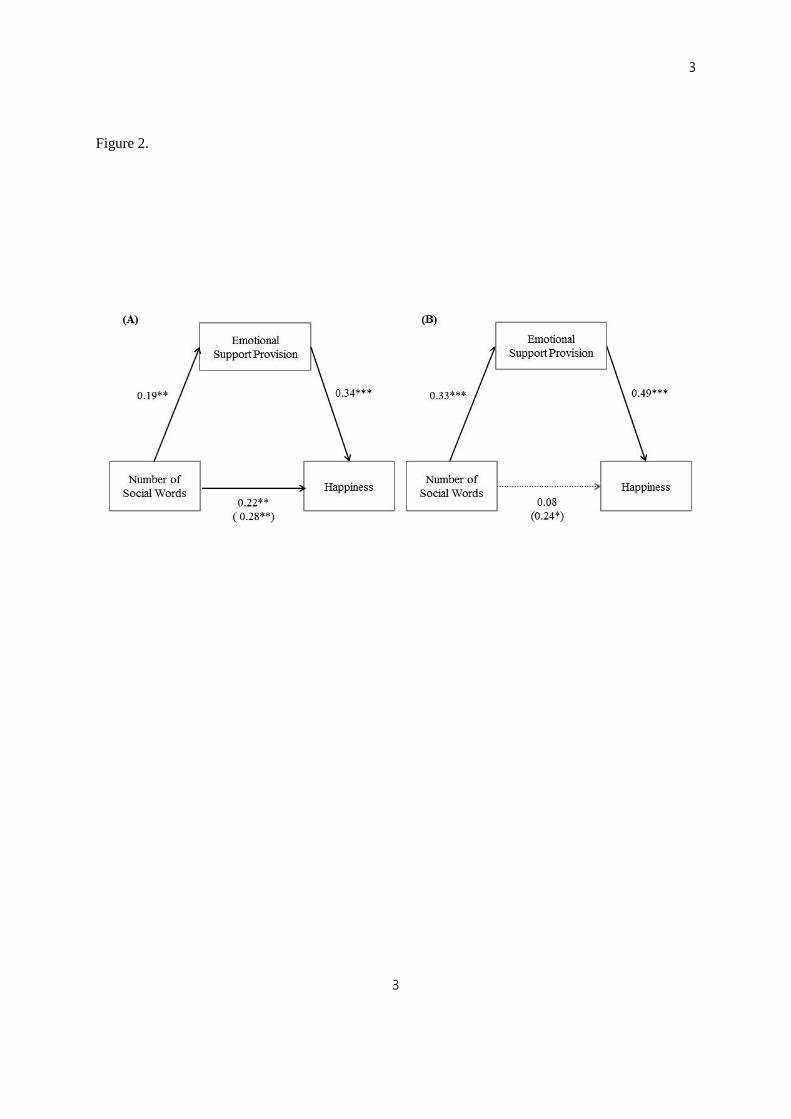
confidence interval (CI; 5,000 bootstrap iterations). As shown in Figure 2, in both cultural 289
groups, emotional support provision significantly mediated the link between the number of 290
social words and life satisfaction: The indirect effect was .07 among Koreans, SE = .03, 95% 291
CI = [0.02, 0.14], and .16 among Americans, SE = .05, 95% CI = [0.07, 0.28]. 292
Although the mediation effect of social support on happiness was not moderated by 293
culture, SE = .06, 95% CI = [-0.02, 0.21], one difference was observed. When emotional 294
support provision was included as a mediator, the direct effect from the frequency of social 295
words to life satisfaction remained significant among Koreans, β = .15, b = .22, SE = .08, 296
t(292) = 2.62, p = .008, whereas it became non-significant among Americans, β = .05, b 297
= .08, SE =.10, t(223) = .98, p = .455, indicating full mediation. The pattern is conceptually 298
consistent with the recent finding that provision of emotion-focused social support is more 299
1 2 3 4 5 6 7 8 9 10 11 12 13 14 15 16 17 18 19 20 21 22 23 24 25 26 27 28 29 30 31 32 33 34 35 36 37 38 39 40 41 42 43 44 45 46 47 48 49 50 51 52 53 54 55 56 57 58 59 60 61 62 63 64 65

14
14
common among European Americans than those with an Asian cultural background (Chen, 300
Kim, Sherman, & Hashimoto, 2015). Also in our data, emotional support provision was more 301
prevalent among Americans (M = 5.51, SD = 1.20) than among Koreans (M = 4.63, SD = 302
1.07), t(519) = 8.77, p < .001. Thus, based on Chen et al.’s finding and the current outcome, 303
we speculate that our current measure of emotion-focused social support is more modal of 304
American’s way of giving help, whereas Koreans may employ more diverse routes (e.g., 305
practical assistance) when they help out others. More research is warranted to clarify this 306
issue. Nonetheless, both in Korea and in the US, social support provision seems to be one 307
bridge that links the socially rich theory of happiness with higher life satisfaction. 308
General Discussion 309
Sometimes we deliberately analyze and try to make sense of our conscious thoughts. 310
But more often, our mind simply wanders around. We find ourselves thinking about A 311
because of B, which in turn was brought to attention by C, and so forth (Killingsworth & 312
Gilbert, 2010). Interestingly, people believe that these loose, free associative mental states are 313
sometimes more revealing about a person than her explicit and deliberate thoughts (Christoff, 314
Gordon, Smith, & Vancouver, 2011; Morewedge, Giblin, & Norton, 2014). Yet, such 315
spontaneously flowing thoughts have seldom been the target of traditional happiness research 316
that relies heavily on structured questionnaires. 317
In this research, we allowed participants to express their beliefs about happiness 318
more freely through a word association method. They provided little in an absolute sense—319
just 3 words prompted by the word happiness. Still, we were able to uncover a number of 320
interesting patterns from this simple report that not only confirms many findings, but also 321
lends further insights about individual and cultural differences in happiness. 322
1 2 3 4 5 6 7 8 9 10 11 12 13 14 15 16 17 18 19 20 21 22 23 24 25 26 27 28 29 30 31 32 33 34 35 36 37 38 39 40 41 42 43 44 45 46 47 48 49 50 51 52 53 54 55 56 57 58 59 60 61 62 63 64 65
15
15
As expected, the “default” happiness schema held by a person seems to be 323
substantially influenced by one’s cultural worldview (Rommetveit, 1968). Words related to 324
social experience and/or relationships were reported significantly more by Koreans (than 325
Americans) who are chronically reminded of the inherent connectedness of self with others 326
(Markus & Kitayama, 1991). Much of current findings, obtained via a drastically different 327
format, coincide with past conclusions derived from survey or experimental methods. 328
Conceptually similar to past research (e.g., Suh et al., 1998), in-group relationship was most 329
commonly mentioned by Koreans (“family”), whereas the first word that occurred to 330
Americans was an emotional state (“smile”). Also, Koreans mentioned more ascribed 331
relationships, whereas Americans more often nominated self-chosen relationships. 332
When the data was analyzed at the individual difference level, those who wrote more 333
social words in response to happiness were distinct from others in a number of ways. They 334
didn’t necessarily view life in a more positive manner (no difference in optimism), but 335
seemed to prioritize the social dimensions of life more than others. They believed that their 336
selves overlapped more with others, desired more social belongingness, and presumably as a 337
consequence, were less lonely. Although significant, the correlations between social word 338
frequency and the social disposition measures were relatively low (mostly less than .20). It 339
suggests that the free association outcome is related with, but not completely redundant with 340
the dispositional information. This suggests that the free association procedure may provide 341
interesting supplementary information in future individual difference studies on happiness. 342
Perhaps the most intriguing finding is that the content of happiness provided by the 343
person was linked with her level of happiness; those who associated more social words with 344
happiness were happier. The interaction effect between number of social words and culture 345
1 2 3 4 5 6 7 8 9 10 11 12 13 14 15 16 17 18 19 20 21 22 23 24 25 26 27 28 29 30 31 32 33 34 35 36 37 38 39 40 41 42 43 44 45 46 47 48 49 50 51 52 53 54 55 56 57 58 59 60 61 62 63 64 65
16
16
was not significant, indicating that holding a socially rich theory of happiness is beneficial to 346
the mental health of both Americans and Koreans. Although various culture-specific 347
predictors of happiness have been documented in the past (e.g., Hitokoto & Uchida, 2015; 348
Kwan, Bond, & Singelis, 1997; Suh, 2002), the fulfillment of social need seems to be a 349
universally important condition of happiness. 350
More research is needed to clarify why associating happiness with social words 351
relates positively with a person’s happiness level. We found at least one possibility that seems 352
worthy of more research. Those who reported more social words engaged more in an activity 353
that builds an important reservoir of happiness—social relationships. They gave more social 354
support to others, which in itself is known to generate positive affect (Moynihan, DeLeire, & 355
Enami, 2015; Thoits & Hewitt, 2001). We believe that our finding, rather than being a 356
conclusive statement, should serve as a trigger for further research on the various happiness-357
promoting behaviors that people with socially imbued happiness beliefs may display (e.g., 358
Bojanowska & Zalewska, 2016). For instance, do they engage more in social capitalization 359
(Langston, 1994) or prefer experiential over materialistic purchases that are easier to savor 360
with others (Caprariello & Reis, 2013)? 361
Given the correlational nature of our data, firm causal conclusions await future 362
research. Although this article focused on the possibility that socially rich beliefs of happiness 363
trigger happiness promoting actions (e.g., helping others), we believe that the opposite 364
process can also occur. That is, the rich social theory of happiness could be partly a product 365
of the person’s chronic happiness level. Indeed, research finds that happy people engage in 366
more altruistic behaviors (Diener, Kanazawa, Suh, & Oishi, 2015), and such episodes may 367
consolidate and become more accessible in their memory (e.g., Srull & Wyer, 1983). 368
1 2 3 4 5 6 7 8 9 10 11 12 13 14 15 16 17 18 19 20 21 22 23 24 25 26 27 28 29 30 31 32 33 34 35 36 37 38 39 40 41 42 43 44 45 46 47 48 49 50 51 52 53 54 55 56 57 58 59 60 61 62 63 64 65
17
17
The most realistic picture, in our view, is that the link between the person’s social 369
theory of happiness and actual happiness level is formed through a positive feedback loop. 370
Happy people may act and think more socially, but such social beliefs might also play a role 371
in sustaining and increasing opportunities for happiness. This latter scenario was highlighted 372
in the current article, because it seems to be the less researched among the two possibilities. 373
In addition to the experimental data that we have started to collect (Shin & Scollon, 2016), 374
longitudinal data will shed more light on the causal issues. In addition to the future need of 375
collecting more diverse data, our current study calls for a future replication with diverse 376
samples (Fairclough, 2007). Given that college student samples are selected groups in terms 377
of age, education, and resources, they may not be representative of the typical person. 378
Finally, one finding in this research might appear somewhat paradoxical, and 379
warrants some comment. At the individual difference level, we found that individuals who 380
report more social words in link to happiness are more satisfied with their lives than others. 381
Between groups, Koreans overall reported more social words than the Americans, but many 382
past studies have reported that life satisfaction is lower in Korea than in the US (Diener, Suh, 383
Smith, & Shao, 1995; Suh, 2002). Although somewhat counterintuitive on the surface, such 384
discrepant findings across level of analysis (cf., individual versus national/cultural level) are 385
not uncommon in the happiness literature. For instance, income is a potent predictor of 386
happiness across nations, but within an affluent nation, it often becomes considerably weaker 387
in predicting individual differences in happiness (Diener & Oishi, 2000, Howell & Howell, 388
2008; Schyns, 2002). 389
Such inconsistency between analysis levels can occur because the factors that 390
influence the happiness of individuals (e.g., temperament, personality) are often different 391
1 2 3 4 5 6 7 8 9 10 11 12 13 14 15 16 17 18 19 20 21 22 23 24 25 26 27 28 29 30 31 32 33 34 35 36 37 38 39 40 41 42 43 44 45 46 47 48 49 50 51 52 53 54 55 56 57 58 59 60 61 62 63 64 65
18
18
from those that effect national or cultural differences (e.g., political turmoil, GDP). Also, the 392
influence of certain factors (e.g., natural disaster) that could predict national differences 393
might “disappear” when individuals within a group are compared (because all members of 394
the group experienced the hardship). Our study has found another instance where the 395
individual difference level finding does not go in the same direction as the group level 396
pattern. Within a culture, individuals who hold a highly social theory of happiness have a 397
higher chance of being satisfied with her life. It appears, however, that this formula may not 398
be applicable for explaining the happiness level of different cultures/nations. Various group-399
level characteristics, such as degree of freedom in the society (Suh, 2007; Veenhoven, 2000), 400
interpersonal trust (Diener, Suh, Kim-Prieto, Biswas-Diener, & Tay, 2010), income inequality 401
(Oishi & Kesebir, 2015) or ecological characteristics (Koh, Scollon, Li, & Suh, 2016) may 402
override the effects of personal characteristics when group differences are compared. In short, 403
how much one thinks of happiness in social terms seem to a reasonably good predictor for 404
knowing how happy the person is within a culture, but additional information seems to be 405
required to predict happiness differences between cultures. 406
The field of subjective well-being played a critical role in launching the scientific 407
investigation of happiness. As the term suggests, one key idea endorsed in the field is that 408
considering the “subjective” viewpoint of the person is pivotal in the study of happiness 409
(Diener, Sapyta, & Suh, 1998). The vast majority of happiness research asks people to 410
indicate, most often on a Likert scale, the degree to which they are cognitively and affectively 411
pleased with their lives. Unfortunately, participants are seldom asked, from their own 412
perspective, what happiness personally means and reminds them of. When this was done in 413
this present study, one notable pattern emerged amidst the array of responses. Whether living 414
1 2 3 4 5 6 7 8 9 10 11 12 13 14 15 16 17 18 19 20 21 22 23 24 25 26 27 28 29 30 31 32 33 34 35 36 37 38 39 40 41 42 43 44 45 46 47 48 49 50 51 52 53 54 55 56 57 58 59 60 61 62 63 64 65
19
19
in a highly collectivist or an individualist culture, those who associated happiness with the 415
foremost important human need (social relationship) reported higher happiness. 416
417
1 2 3 4 5 6 7 8 9 10 11 12 13 14 15 16 17 18 19 20 21 22 23 24 25 26 27 28 29 30 31 32 33 34 35 36 37 38 39 40 41 42 43 44 45 46 47 48 49 50 51 52 53 54 55 56 57 58 59 60 61 62 63 64 65
20
20
References 418
Aknin, L. B., Barrington-Leigh, C. P., Dunn, E. W., Helliwell, J. F., Burns, J., Biswas-419
Diener, R., . . . Norton, M. I. (2013). Prosocial spending and well-being: Cross-cultural 420
evidence for a psychological universal. Journal of Personality and Social Psychology, 421
104, 635-652. 422
Aron, A., Aron, E. N., & Smollan, D. (1992). Inclusion of Other in the Self Scale and the 423
structure of interpersonal closeness. Journal of Personality and Social Psychology, 63, 424
596-612. 425
Baumeister, R. F., & Leary, M. R. (1995). The need to belong: desire for interpersonal 426
attachments as a fundamental human motivation. Psychological Bulletin, 117, 497-529. 427
Bojanowska, A., & Zalewska, A. M. (2016). Lay understanding of happiness and the 428
experience of well-being: Are some conceptions of happiness more beneficial than 429
others? Journal of Happiness Studies, 17, 793-815. 430
Cantril, H. (1965). The pattern of human concerns. New Brunswick, NJ: Rutgers University 431
Press. 432
Caprariello, P. A., & Reis, H. T. (2013). To do, to have, or to share? Valuing experiences 433
over material possessions depends on the involvement of others. Journal of Personality 434
and Social Psychology, 104, 199-215. 435
Chen, J. M., Kim, H. S., Sherman, D. K., & Hashimoto, T. (2015). Cultural differences in 436
support provision: The importance of relationship quality. Personality and Social 437
Psychology Bulletin, 41, 1575-1589. 438
1 2 3 4 5 6 7 8 9 10 11 12 13 14 15 16 17 18 19 20 21 22 23 24 25 26 27 28 29 30 31 32 33 34 35 36 37 38 39 40 41 42 43 44 45 46 47 48 49 50 51 52 53 54 55 56 57 58 59 60 61 62 63 64 65

21
21
Christoff, K., Gordon, A., Smith, R., & Vancouver, B. C. (2011). The role of spontaneous 439
thought in human cognition. In Vartanian, O., Mandel, D.R. (Eds.), Neuroscience of 440
Decision Making (pp. 259–284). Psychology Press, New York, NY. 441
Danner, D. D., Snowdon, D. A., & Friesen, W. V. (2001). Positive emotions in early life and 442
longevity: findings from the nun study. Journal of Personality and Social Psychology, 443
80, 804-813. 444
Delle Fave, A. D., Brdar, I., Freire, T., Vella-Brodrick, D., & Wissing, M. P. (2011). The 445
eudaimonic and hedonic components of happiness: Qualitative and quantitative 446
findings. Social Indicators Research, 100, 185–207. 447
Delle Fave A., Brdar I., Wissing M.P., Araujo U., Castro Solano A., Freire T., Hernández-448
Pozo M.D.R., Jose P., Martos T., Nafstad H.E., Nakamura J., Singh K., & Soosai-449
Nathan L. (2016). Lay definitions of happiness across nations: The primacy of inner 450
harmony and relational connectedness. Frontiers in Psychology, 7, 1-23. 451
Diener, E., Lucas, R. E., Oishi, S., & Suh, E. M. (2002). Looking up and looking down: 452
Weighting good and bad information in life satisfaction judgments. Personality and 453
Social Psychology Bulletin, 28, 437-445. 454
Diener, E., Kanazawa, S., Suh, E. M., & Oishi, S. (2015). Why people are in a generally good 455
mood. Personality and Social Psychology Review, 19, 235-256. 456
Diener, E., & Oishi, S. (2000). Money and happiness: Income and subjective well-being 457
across nations. In E. Diener & E. M. Suh (Eds.), Culture and subjective well-being (pp. 458
185–218). Cambridge, MA: MIT Press. 459
Diener, E., Sapyta, J. J., & Suh, E. (1998). Subjective well-being is essential to well-being. 460
Psychological Inquiry, 9, 33-37. 461
1 2 3 4 5 6 7 8 9 10 11 12 13 14 15 16 17 18 19 20 21 22 23 24 25 26 27 28 29 30 31 32 33 34 35 36 37 38 39 40 41 42 43 44 45 46 47 48 49 50 51 52 53 54 55 56 57 58 59 60 61 62 63 64 65
22
22
Diener, E., & Seligman, M. E. (2002). Very happy people. Psychological Science, 13, 81-84. 462
Diener, E., & Suh, E. M. (Eds.). (2000). Culture and subjective well-being. Cambridge, MA: 463
MIT Press. 464
Diener, E., Suh, E. M., Kim-Prieto, C., Biswas-Diener, R., & Tay, L. S. (2010). Unhappiness 465
in South Korea: Why it is high and what might be done about it. Keynote Address, 466
Annual Meeting of the Korean Psychological Association, Seoul, Korea. 467
Diener, E., Suh, E. M., Lucas, R. E., & Smith, H. (1999). Subjective well-being: Three 468
decades of progress. Psychological Bulletin, 125, 276-302. 469
Diener, E., Suh, E. M., Smith, H., & Shao, L. (1995). National differences in reported 470
subjective well-being: Why do they occur? Social Indicators Research, 34, 7-32. 471
Dunbar, R. I. M. (1998). The social brain hypothesis. Evolutionary Anthropology, 6, 178-190. 472
Dunn, E. W., Aknin, L. B., & Norton, M. I. (2008). Spending money on others promotes 473
happiness. Science, 319, 1687-1688. 474
Epley, N., & Schroeder, J. (2014). Mistakenly seeking solitude. Journal of Experimental 475
Psychology: General, 143, 1980-1999. 476
Fairclough, N. (2007). Language and globalization. London: Routledge. 477
Fast, L. A., & Funder, D. C. (2008). Personality as manifest in word use: correlations with 478
self-report, acquaintance report, and behavior. Journal of Personality and Social 479
Psychology, 94, 334-346. 480
Furnham, A., & Cheng, H. (2000). Lay theories of happiness. Journal of Happiness Studies, 481
1, 227-246. 482
Gallup Organization. (2009, August 28). Gallup world poll: Methodology. Retrieved from 483
http://www.gallup.com/consulting/worldpoll/108079/ Methodological-Design.aspx 484
1 2 3 4 5 6 7 8 9 10 11 12 13 14 15 16 17 18 19 20 21 22 23 24 25 26 27 28 29 30 31 32 33 34 35 36 37 38 39 40 41 42 43 44 45 46 47 48 49 50 51 52 53 54 55 56 57 58 59 60 61 62 63 64 65
23
23
Gasiorowska, A., Chaplin, L. N., Zaleskiewicz, T., Wygrab, S., & Vohs, K. D. (2016). 485
Money cues increase agency and decrease prosociality among children: Early signs of 486
market-mode behaviors. Psychological Science, 27, 331-344. 487
Hitokoto, H., & Uchida, Y. (2015). Interdependent happiness: Theoretical importance and 488
measurement validity. Journal of Happiness Studies, 16, 211-239. 489
Howell, R. T., & Howell, C. J. (2008). The relation of economic status to subjective well-490
being in developing countries: a meta-analysis. Psychological Bulletin, 134, 536-560. 491
Kwan, V. S., Bond, M. H., & Singelis, T. M. (1997). Pancultural explanations for life 492
satisfaction: adding relationship harmony to self-esteem. Journal of Personality and 493
Social Psychology, 73, 1038-1051. 494
Killingsworth, M. A., & Gilbert, D. T. (2010). A wandering mind is an unhappy mind. 495
Science, 330, 932-932. 496
Koh, S., Scollon, C. N., Li, N. P., & Suh, E. M. (2016). The (un) desirability of happiness: 497
Pathogen threats predict differences in the valuing of happiness. Manuscript under 498
review, Singapore Management University, Singapore. 499
Koo, J., & Suh, E. M. (2007). Is happiness a zero-sum game? Belief in fixed amount of 500
happiness (BIFAH) and subjective well-being. Korean Journal of Social and 501
Personality Psychology, 21, 1-19. 502
Kitayama, S., & Markus, H. R. (2000). The pursuit of happiness and the realization of 503
sympathy: Cultural patterns of self, social relations, and well-being. In E. Diener & E. 504
M. Suh (Eds.), Culture and Subjective Well-Being (pp. 113-161). Cambridge, MA: 505
MIT Press. 506
1 2 3 4 5 6 7 8 9 10 11 12 13 14 15 16 17 18 19 20 21 22 23 24 25 26 27 28 29 30 31 32 33 34 35 36 37 38 39 40 41 42 43 44 45 46 47 48 49 50 51 52 53 54 55 56 57 58 59 60 61 62 63 64 65
24
24
Langston, C. A. (1994). Capitalizing on and coping with daily-life events: Expressive 507
responses to positive events. Journal of Personality and Social Psychology, 67, 1112-508
1125. 509
Leary, M. R., Kelly, K. M., Cottrell, C. A., & Schreindorfer, L. S. (2012). Individual 510
differences in the need to belong: Mapping the nomological network. Unpublished 511
manuscript, Duke University. 512
Lykes, V. A., & Kemmelmeier, M. (2014). What predicts loneliness? Cultural difference 513
between individualistic and collectivistic societies in Europe. Journal of Cross-514
Cultural Psychology, 45, 468-490. 515
McMahan, E. A., & Estes, D. (2011). Measuring lay conceptions of well-being: The beliefs 516
about well-being scale. Journal of Happiness Studies, 12, 267-287. 517
Markus, H. R., & Kitayama, S. (1991). Culture and the self: Implications for cognition, 518
emotion, and motivation. Psychological Review, 98, 224-253. 519
Morewedge, C. K., Giblin, C. E., & Norton, M. I. (2014). The (perceived) meaning of 520
spontaneous thoughts. Journal of Experimental Psychology, 143, 1742-1754. 521
Myers, D. G., & Diener, E. (1995). Who is happy? Psychological Science, 6, 10-19. 522
Nelson, D. L., McEvoy, C. L., & Dennis, S. (2000). What is free association and what does it 523
measure? Memory & Cognition, 28, 887-899. 524
Oishi, S., Graham, J., Kesebir, S., & Galinha, I. C. (2013). Concepts of happiness across time 525
and cultures. Personality and Social Psychology Bulletin, 39, 559-577. 526
Oishi, S., & Kesebir, S. (2015). Income inequality explains why economic growth does not 527
always translate to an increase in happiness. Psychological Science, 20, 1630-1638. 528
1 2 3 4 5 6 7 8 9 10 11 12 13 14 15 16 17 18 19 20 21 22 23 24 25 26 27 28 29 30 31 32 33 34 35 36 37 38 39 40 41 42 43 44 45 46 47 48 49 50 51 52 53 54 55 56 57 58 59 60 61 62 63 64 65
25
25
Oishi, S., Koo, M., & Akimoto, S. (2008). Culture, interpersonal perceptions, and happiness 529
in social interactions. Personality and Social Psychology Bulletin, 34, 307-320. 530
Pearlin, L. I., & Schooler, C. (1978). The structure of coping. Journal of Health and Social 531
Behavior, 19, 2-21. 532
Pennebaker, J. W., Mayne, T. J., & Francis, M. E. (1997). Linguistic predictors of adaptive 533
bereavement. Journal of Personality and Social Psychology, 72, 863-871. 534
Pennebaker, J. W., & Stone, L. D. (2003). Words of wisdom: Language use over the life 535
span. Journal of Personality and Social Psychology, 85, 291-301. 536
Preacher, K. J., & Hayes, A. F. (2008). Asymptotic and resampling strategies for assessing 537
and comparing indirect effects in multiple mediator models. Behavior Research 538
Methods, 40, 879-891. 539
Reich, R. R., & Goldman, M. S. (2005). Exploring the alcohol expectancy memory network: 540
The utility of free associates. Psychology of Addictive Behaviors, 19, 317-325. 541
Rommetveit, R. (1968). Words, meanings, and messages: Theory and experiments in 542
psycholinguistics. New York: Academic Press. 543
Rozin, P., Kurzer, N., & Cohen, A. B. (2002). Free associations to “food:” the effects of 544
gender, generation, and culture. Journal of Research in Personality, 36, 419-441. 545
Russell, D., Peplau, L. A., & Cutrona, C. E. (1980). The revised UCLA Loneliness Scale: 546
Concurrent and discriminant validity evidence. Journal of Personality and Social 547
Psychology, 39, 472-480. 548
Scheier, M. F., Carver, C. S., & Bridges, M. W. (1994). Distinguishing optimism from 549
neuroticism (and trait anxiety, self-mastery, and self-esteem): A reevaluation of the 550
Life Orientation Test. Journal of Personality and Social Psychology, 67, 1063-1078. 551
1 2 3 4 5 6 7 8 9 10 11 12 13 14 15 16 17 18 19 20 21 22 23 24 25 26 27 28 29 30 31 32 33 34 35 36 37 38 39 40 41 42 43 44 45 46 47 48 49 50 51 52 53 54 55 56 57 58 59 60 61 62 63 64 65
26
26
Schimmack, U., Radhakrishnan, P., Oishi, S., Dzokoto, V., & Ahadi, S. (2002). Culture, 552
personality, and subjective well-being: integrating process models of life satisfaction. 553
Journal of Personality and Social Psychology, 82, 582-593. 554
Schyns, P. (2002). Wealth of nations, individual income and life satisfaction in 42 countries: 555
A multilevel approach. Social Indicators Research, 60, 5-40. 556
Shin, J., & Scollon, C. N. (2016). Social-behavioral consequences of associating happiness 557
with relationship, Working paper, Singapore Management University. 558
Suh, E. M. (2002). Culture, identity consistency, and subjective well-being. Journal of 559
Personality and Social Psychology, 83, 1378-1391. 560
Suh, E. M. (2007). Downsides of an overly-context sensitive self: Implications from the 561
culture and subjective well-being research. Journal of Personality, 75, 1321-1343. 562
Suh, E., Diener, E., Oishi, S., & Triandis, H. C. (1998). The shifting basis of life satisfaction 563
judgments across cultures: Emotions versus norms. Journal of Personality and Social 564
Psychology, 74, 482-493. 565
Srull, T. K., & Wyer, R. S. (1983). The role of control processes and structural constraints in 566
models of memory and social judgment. Journal of Experimental Social Psychology, 567
19, 497-521. 568
Szalay, L. B., & Deese, J. (1978). Subjective meaning and culture: An assessment through 569
word associations. Hillsdale, NJ: Lawrence Erlbaum. 570
Tay, L., & Diener, E. (2011). Needs and subjective well-being around the world. Journal of 571
Personality and Social psychology, 101, 354-365. 572
Thoits, P. A., & Hewitt, L. N. (2001). Volunteer work and well-being. Journal of Health and 573
Social Behavior, 42, 115-131. 574
1 2 3 4 5 6 7 8 9 10 11 12 13 14 15 16 17 18 19 20 21 22 23 24 25 26 27 28 29 30 31 32 33 34 35 36 37 38 39 40 41 42 43 44 45 46 47 48 49 50 51 52 53 54 55 56 57 58 59 60 61 62 63 64 65
27
27
Veenhoven, R. (2000). Freedom and happiness: A comparative study in forty-four nations in 575
the early 1990s. In E. Diener & E. M. Suh (Eds.), Culture and Subjective Well-Being 576
(pp. 257-288). Cambridge, MA: MIT Press. 577
Veenhoven, R. (2012). Cross-national differences in happiness: Cultural measurement bias or 578
effect of culture? International Journal of Wellbeing, 2, 333-353. 579
Vohs, K. D., Mead, N. L., & Goode, M. R. (2006). The psychological consequences of 580
money. Science, 314, 1154-1156. 581
Wakslak, C. J., Smith, P. K., & Han, A. (2014). Using abstract language signals power. 582
Journal of Personality and Social Psychology, 107, 41-55. 583
584
585
1 2 3 4 5 6 7 8 9 10 11 12 13 14 15 16 17 18 19 20 21 22 23 24 25 26 27 28 29 30 31 32 33 34 35 36 37 38 39 40 41 42 43 44 45 46 47 48 49 50 51 52 53 54 55 56 57 58 59 60 61 62 63 64 65
1
1
Figure Legend
Figure 1. Frequency of number of social words as a function of culture.
Figure 2. Emotional support provision as a mediator of life satisfaction for Korean (A) and American
participants (B). Regression coefficients are unstandardized, and the total effect of the number of
social words is inside parentheses. Dotted path is not significant, and bold paths are statistically
significant (*p < .05, **p < .01, ***p < .001).
Figure
2
2
Figure 1.
3
3
Figure 2.