Embed Size (px)
Citation preview
Lingying Zhao, Associate Professor
Lara Jane Hadlocon, Graduate Research Associate
Roderick Manuzon, Research Associate
Department of Food, Agricultural and Biological Engineering
The Ohio State University
Wet Scrubbers Wet Scrubbers
for Recovering Ammonia Emissions from for Recovering Ammonia Emissions from
Poultry FacilitiesPoultry Facilities
for Nitrogen Fertilizerfor Nitrogen Fertilizer
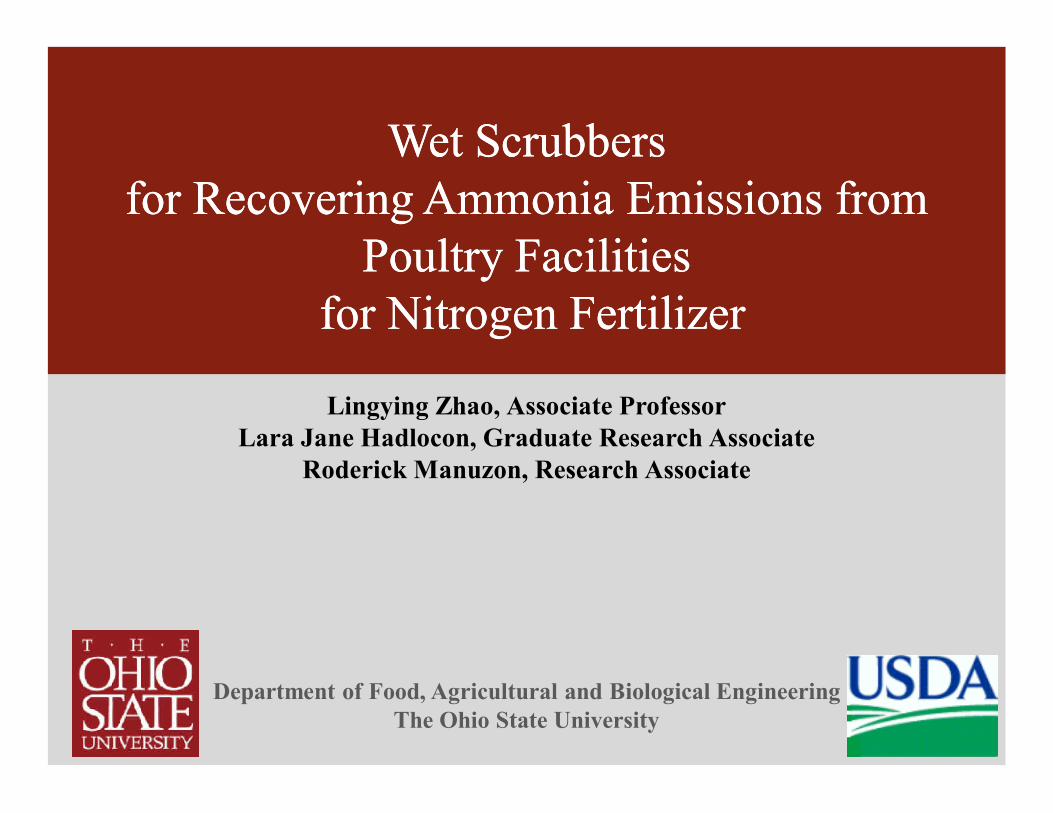
Acid Spray ScrubberAcid Spray Scrubber
Spray acid wet scrubbers -- effective in NH3 recovery, low
pressure drop, and feasible for poultry operations.
Average NH3 scrubbing efficiency 70% in field and 81% in lab.
Scrubbing effluent liquid is produced as fertilizer.
It is feasible to run the wet scrubber at poultry farms
Dust issue needs to be resolved for smooth scrubber operation
Outline
Introduction, need analysis, and the project objectives
Step1--Laboratory simulation of ammonia absorption in a spray
scrubber
• Optimization of wet scrubber design and operating
parameters
• Development of a prototype acid spray wet scrubber
• A modeling tool for design acid spray wet scrubbers
Step II -- A full-scale scrubber for a poultry composting facility
Step III--Field evaluation of operation and maintenance of the full-
scale wet scrubber
Wet scrubber effluent as nitrogen fertilizer
Economical analysis of the wet scrubber operation
Conclusions
Ammonia (NH3) emission impacts health and ecosystems
Animal production contributes about 80% of anthropogenic NH3emissions to the atmosphere, a very significant nitrogen nutrient loss.
High cost of natural gas resulted high cost of nitrogen fertilizer for farming
Wet scrubbing technology is effective in recover NH3 emisionand packed-bed wet scrubbers have been used at European animal farms.
Packed-bed wet scrubbers cause high back pressure on fans and are not feasible to run with fans at the U.S. poultry farms, which are axial fans that can drive large airflow with small pressure drop.
There is a need to develop wet scrubbers that can work with fans used at poultry farms in the U.S.
Introduction & Need Analysis

NH3 acid spray scrubber:
uses spray nozzles to
generate liquid droplets for
absorbing NH3
H2SO4 is used as
scrubbing liquid:
2NH3+H2SO4(NH4)2SO
NHNH33 Absorption in Acid Spray Scrubber Absorption in Acid Spray Scrubber
drops
particles
pollutant
gases
Scrubbing
Liquid
Effluent
Liquid
Mixture of
Air and
Ammonia
Clean
AirDemister
Spray
Chamber
Develop wet scrubbers for NH3 recovery from exhausts of poultry buildings and poultry manure composting facilities.
Evaluate the performance, maintenance, and cost of the wet scrubbers at a commercial poultry farm to assess the technical practicality and economic feasibility.
Explore the processes to convert the scrubber effluent into nitrogen fertilizer
Disseminate and demonstrate the wet scrubber technology and its applications through various existing extension programs, workshops, and scientific and extension publications.
Objectives

Design Variables
nozzle type & size
nozzle spacing
scrubber dimensions
number of stages
flow configuration
Wet Scrubber
Efficiency
Operation Variables
nozzle operating pressure
scrubbing liquid flow rate
droplet velocity
droplet distribution
liquid pH
airflow rate
air velocity
Environment
Variables
NH3 concentration
air temperature
relative humidity
Factors Affecting NH3 Spray Absorption
Step I:
Laboratory Simulation
OBJECTIVES:
Laboratory simulation of ammonia absorption in a spray scrubber for
Optimization of wet scrubber design and operating parameters,
Development of a prototype acid spray wet scrubber, and
A modeling tool for design acid spray wet scrubbers.
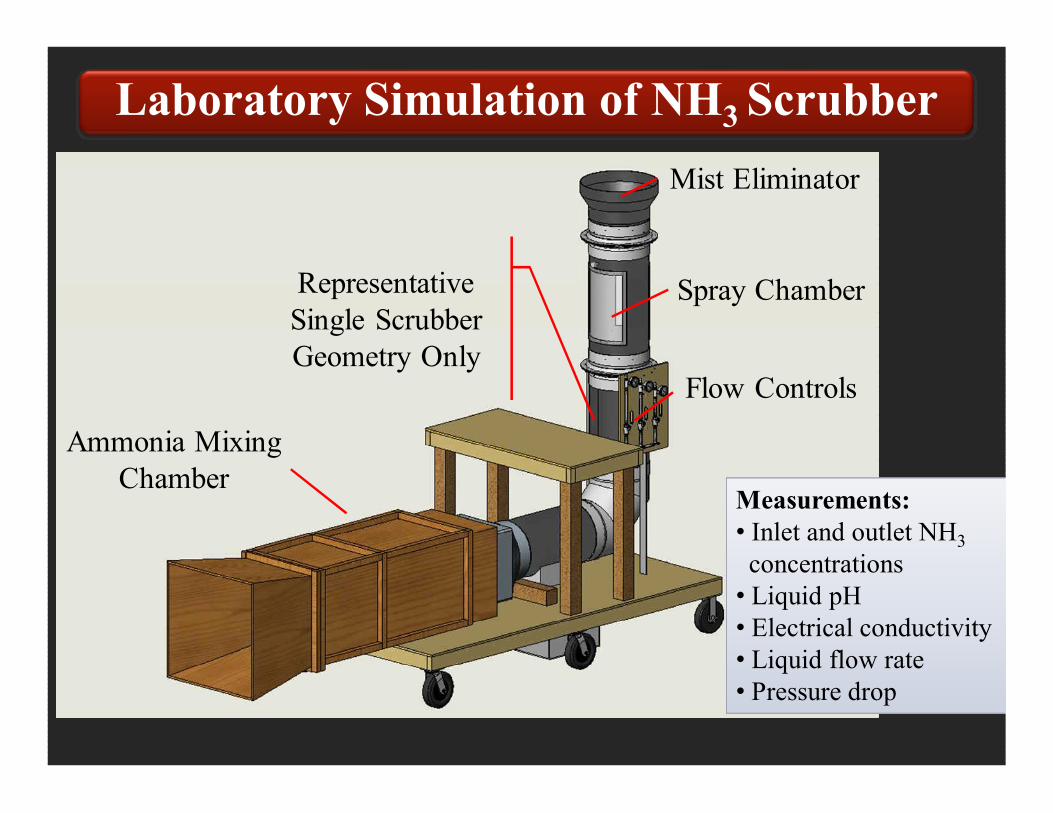
Laboratory Simulation of NH3 Scrubber
Mist Eliminator
Spray Chamber
Flow Controls
Ammonia Mixing
Chamber
Representative
Single Scrubber
Geometry Only
Measurements:
• Inlet and outlet NH3
concentrations
• Liquid pH
• Electrical conductivity
• Liquid flow rate
• Pressure drop
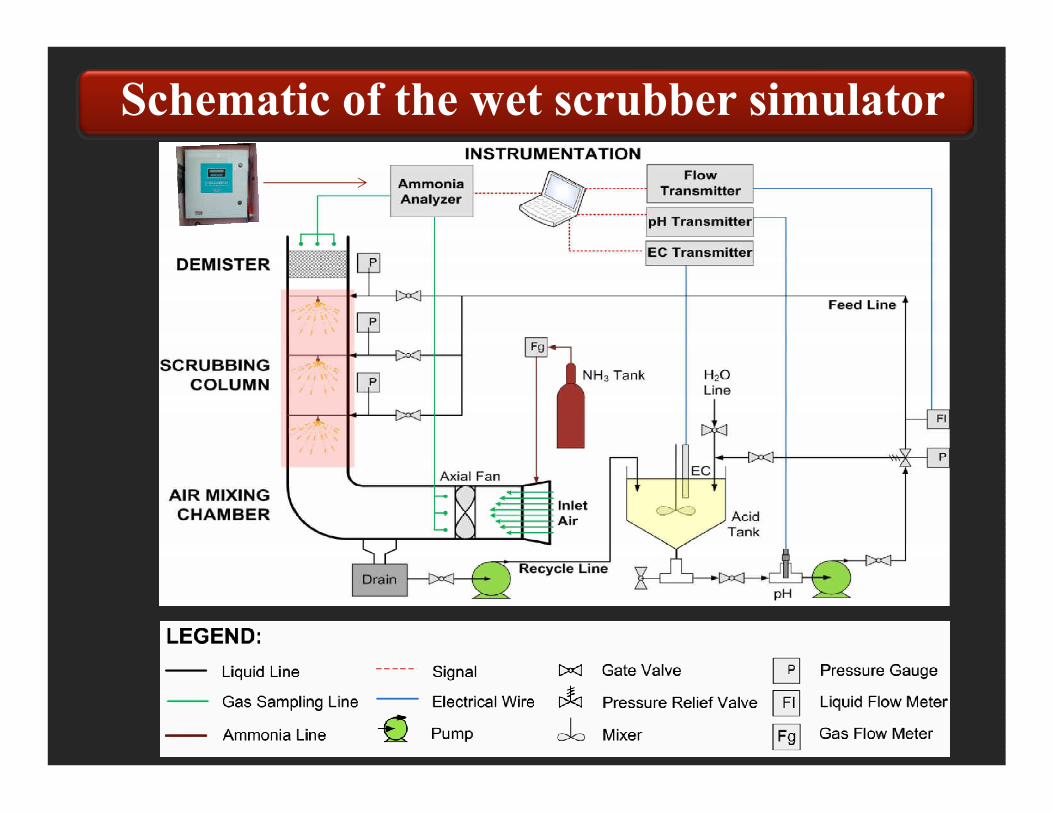
Schematic of the wet scrubber simulator
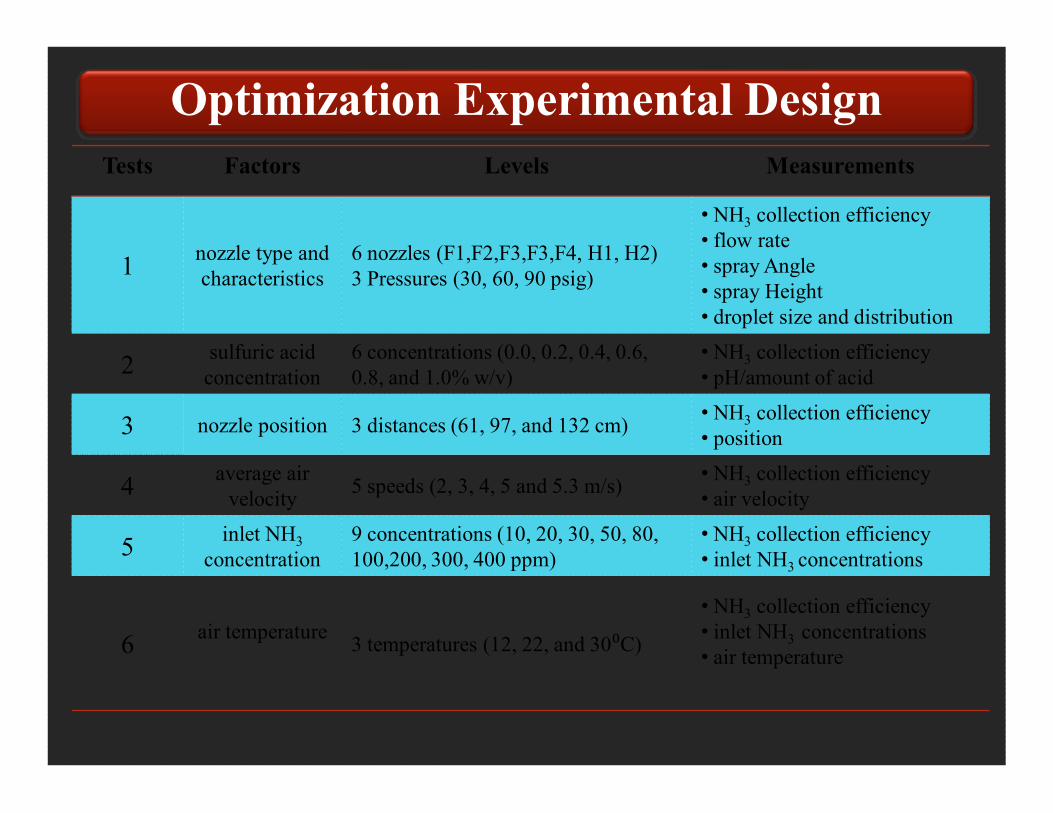
Optimization Experimental Design
Tests Factors Levels Measurements
1nozzle type and
characteristics
6 nozzles (F1,F2,F3,F3,F4, H1, H2)
3 Pressures (30, 60, 90 psig)
• NH3 collection efficiency
• flow rate
• spray Angle
• spray Height
• droplet size and distribution
2sulfuric acid
concentration
6 concentrations (0.0, 0.2, 0.4, 0.6,
0.8, and 1.0% w/v)
• NH3 collection efficiency
• pH/amount of acid
3 nozzle position 3 distances (61, 97, and 132 cm)• NH3 collection efficiency
• position
4average air
velocity5 speeds (2, 3, 4, 5 and 5.3 m/s)
• NH3 collection efficiency
• air velocity
5inlet NH3
concentration
9 concentrations (10, 20, 30, 50, 80,
100,200, 300, 400 ppm)
• NH3 collection efficiency
• inlet NH3 concentrations
6air temperature
3 temperatures (12, 22, and 30⁰C)
• NH3 collection efficiency
• inlet NH3 concentrations
• air temperature

0
20
40
60
80
100
0 20 40 60 80 100
Am
mo
nia
Co
llec
tio
n E
fici
ency
(%
)
Nozzle Pressure (psig)
H1 actual
H1 predicted
F1 actual
F1 predicted
F2 actual
F2 predicted
F3 actual
F3 predicted
F4 actual
F4 predicted
F5 actual
F5 predicted
Single Nozzle Efficiency Plots

0
20
40
60
80
100
0 0.2 0.4 0.6 0.8 1
Co
llec
tio
n E
ffic
ien
cy (
%)
Acid concentration (%w/v)
No significant difference (alpha=0.05) between 0.6 to 1% w/v H2SO4
and beyond (Manuzon et al. 2007)
maximum absorption was obtained
from 0.6 to 1.0% w/v H2SO4
Effect of Acid Concentration
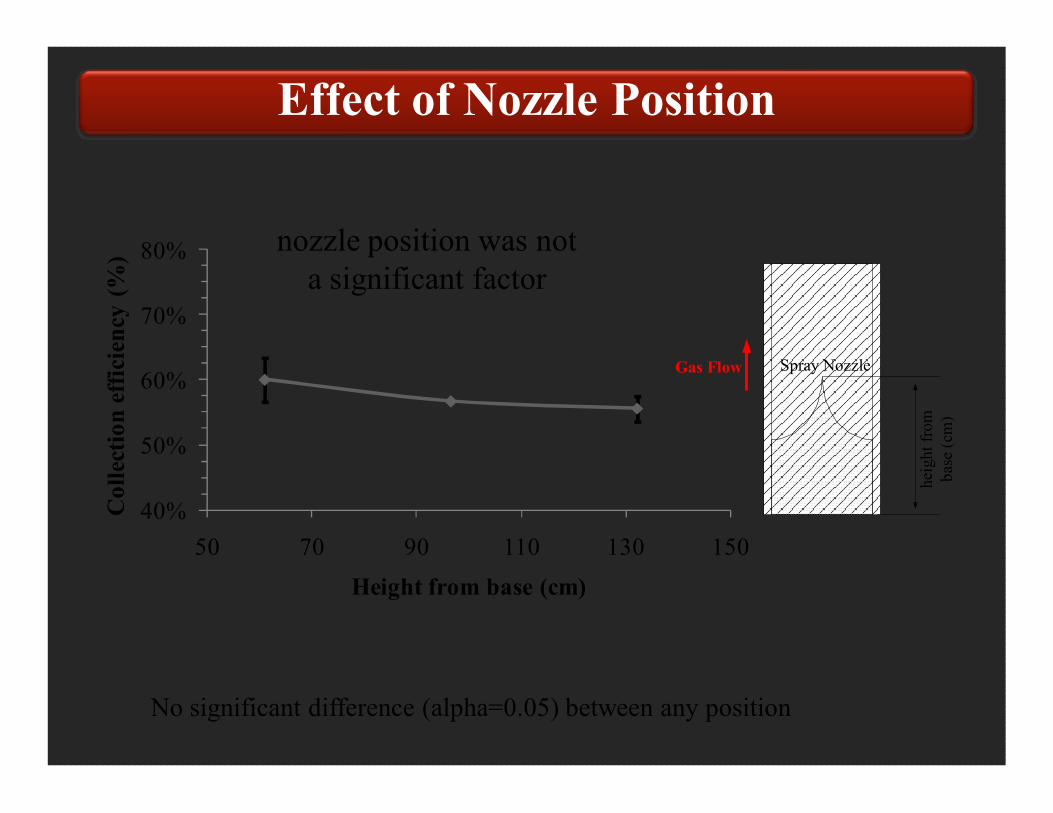
40%
50%
60%
70%
80%
50 70 90 110 130 150
Co
llec
tio
n e
ffic
ien
cy (
%)
Height from base (cm)
No significant difference (alpha=0.05) between any position
nozzle position was not
a significant factor
Spray NozzleGas Flow
hei
ght
from
bas
e (c
m)
Effect of Nozzle Position
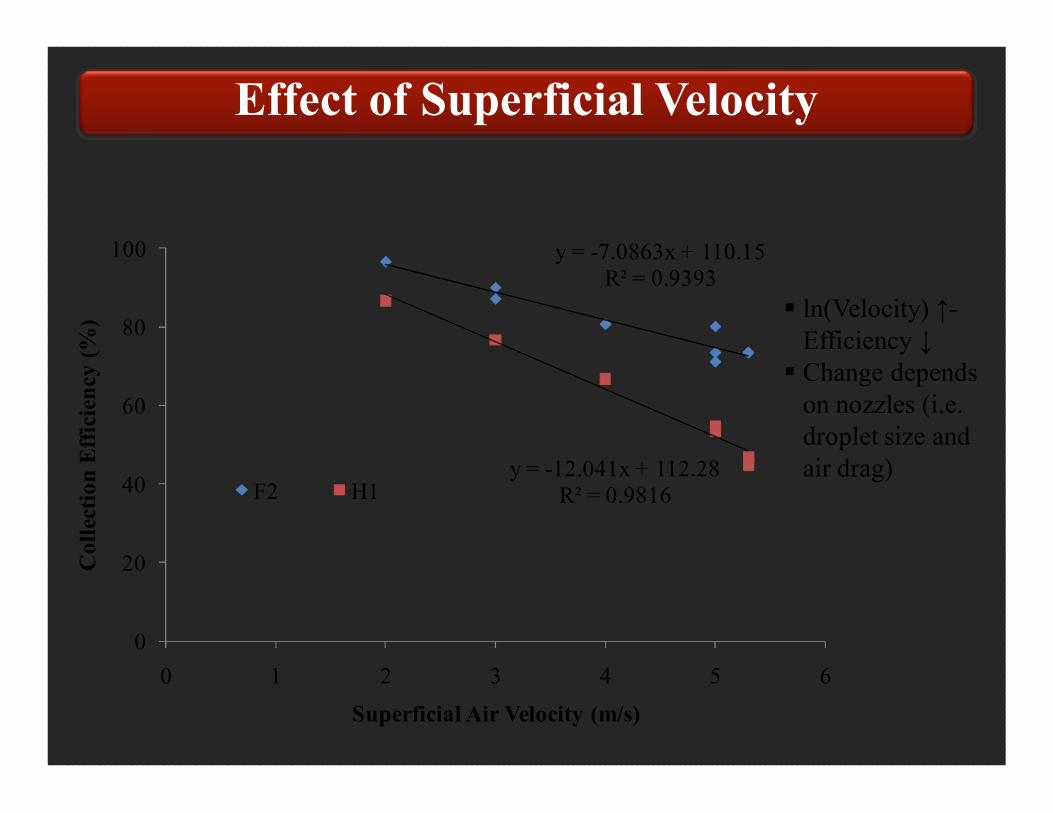
y = -7.0863x + 110.15R² = 0.9393
y = -12.041x + 112.28R² = 0.9816
0
20
40
60
80
100
0 1 2 3 4 5 6
Co
llec
tio
n E
ffic
ien
cy (
%)
Superficial Air Velocity (m/s)
F2 H1
ln(Velocity) ↑-
Efficiency ↓ Change depends
on nozzles (i.e.
droplet size and
air drag)
Effect of Superficial Velocity
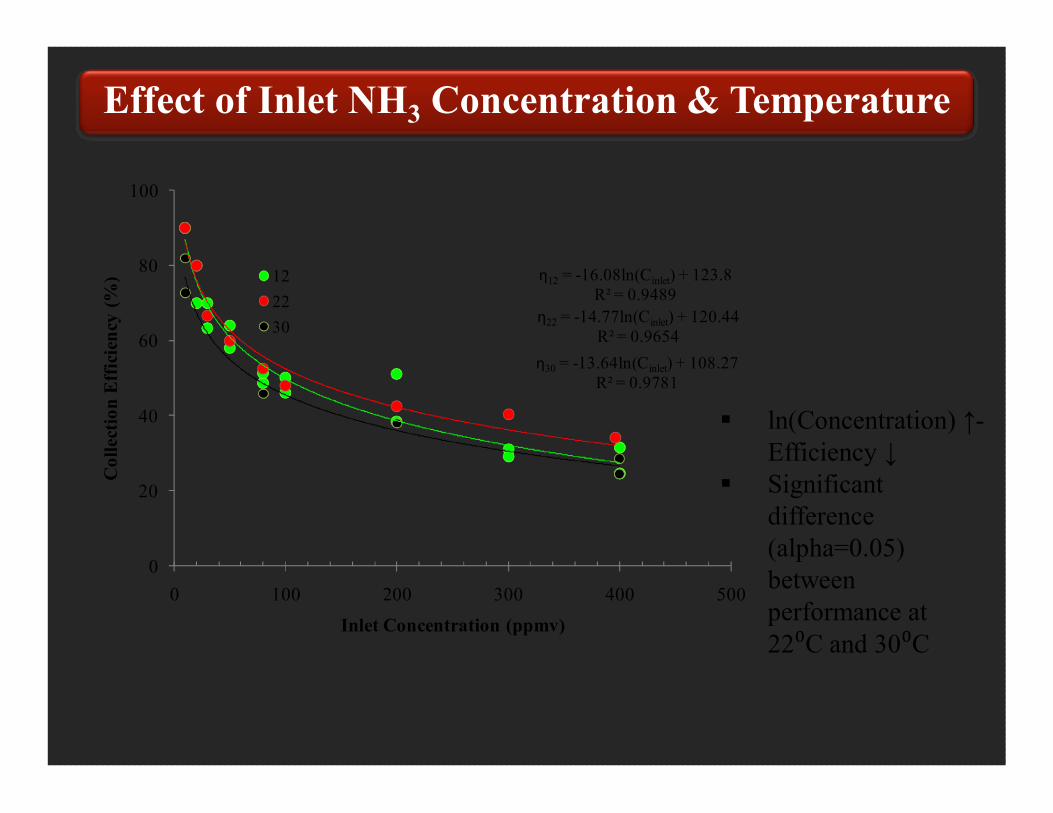
η12 = -16.08ln(Cinlet) + 123.8R² = 0.9489
η22 = -14.77ln(Cinlet) + 120.44R² = 0.9654
η30 = -13.64ln(Cinlet) + 108.27R² = 0.9781
0
20
40
60
80
100
0 100 200 300 400 500
Co
llec
tio
n E
ffic
ien
cy (
%)
Inlet Concentration (ppmv)
12
22
30
ln(Concentration) ↑-
Efficiency ↓ Significant
difference
(alpha=0.05)
between
performance at
22⁰C and 30⁰C
Effect of Inlet NH3 Concentration & Temperature
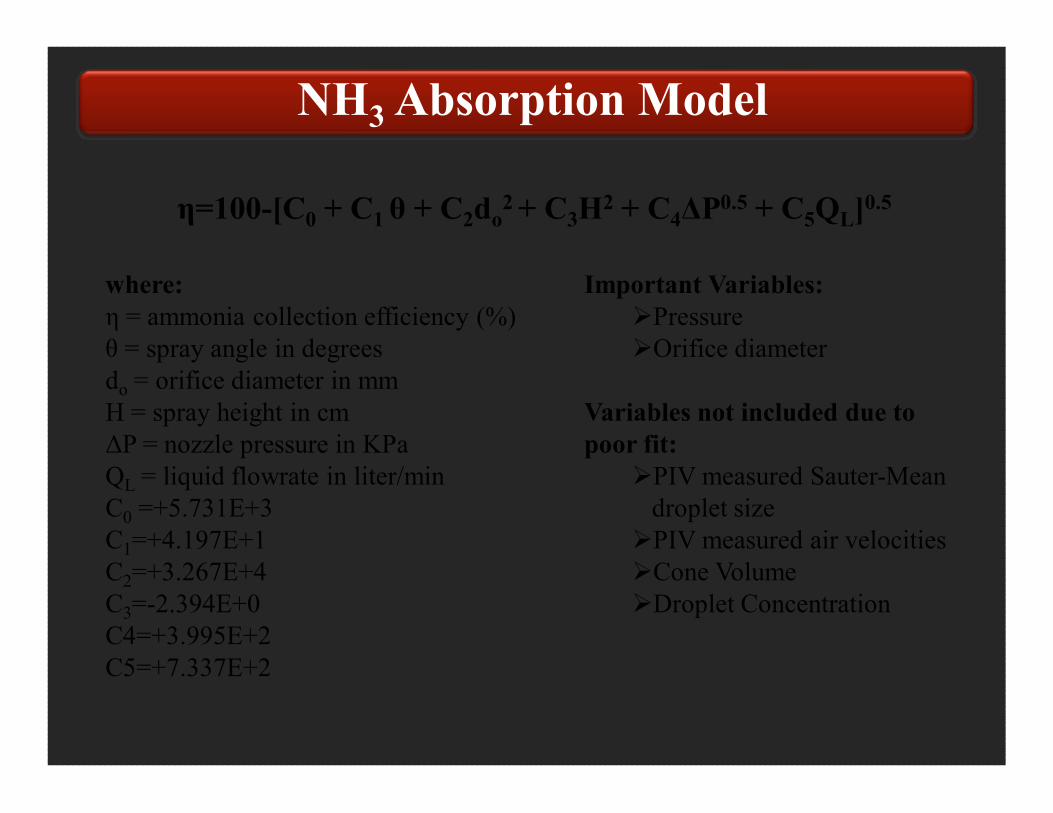
η=100-[C0 + C1 θ + C2do2 + C3H
2 + C4ΔP0.5 + C5QL]0.5
where:
η = ammonia collection efficiency (%)θ = spray angle in degreesdo = orifice diameter in mm
H = spray height in cm
ΔP = nozzle pressure in KPa
QL = liquid flowrate in liter/min
C0 =+5.731E+3
C1=+4.197E+1
C2=+3.267E+4
C3=-2.394E+0
C4=+3.995E+2
C5=+7.337E+2
Important Variables:
Pressure
Orifice diameter
Variables not included due to
poor fit:
PIV measured Sauter-Mean
droplet size
PIV measured air velocities
Cone Volume
Droplet Concentration
NH3 Absorption Model
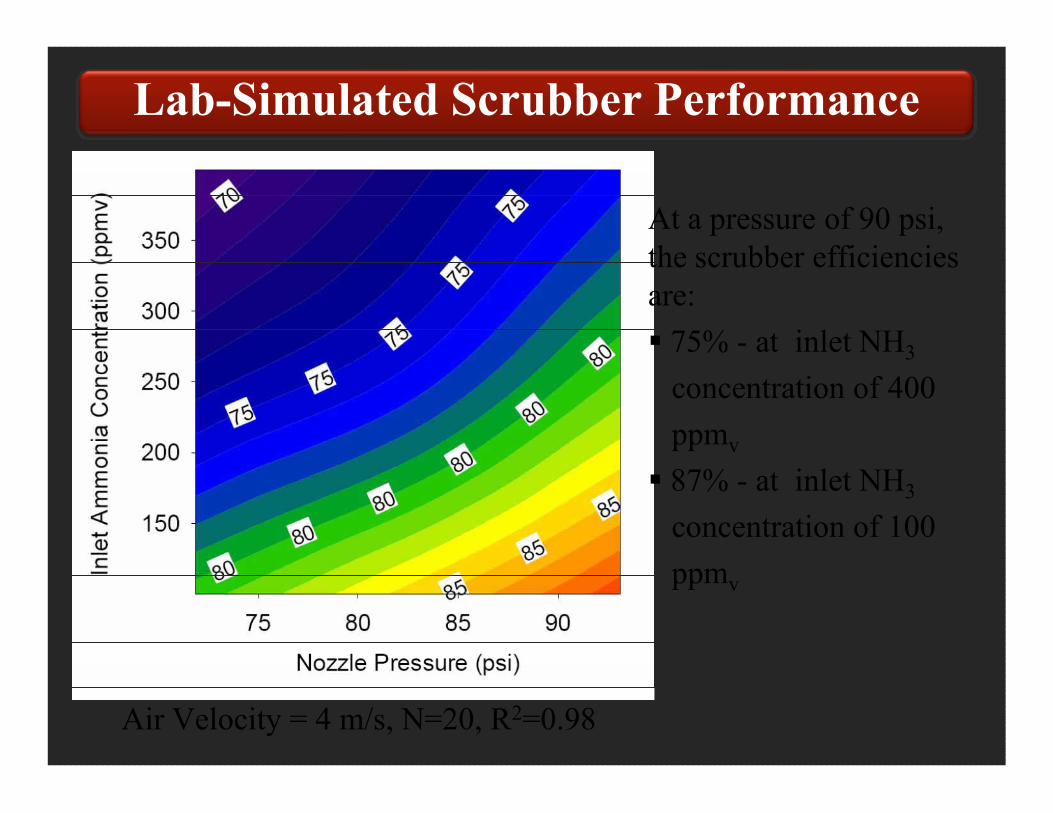
At a pressure of 90 psi,
the scrubber efficiencies
are:
75% - at inlet NH3
concentration of 400
ppmv
87% - at inlet NH3
concentration of 100
ppmv
Air Velocity = 4 m/s, N=20, R2=0.98
Lab-Simulated Scrubber Performance
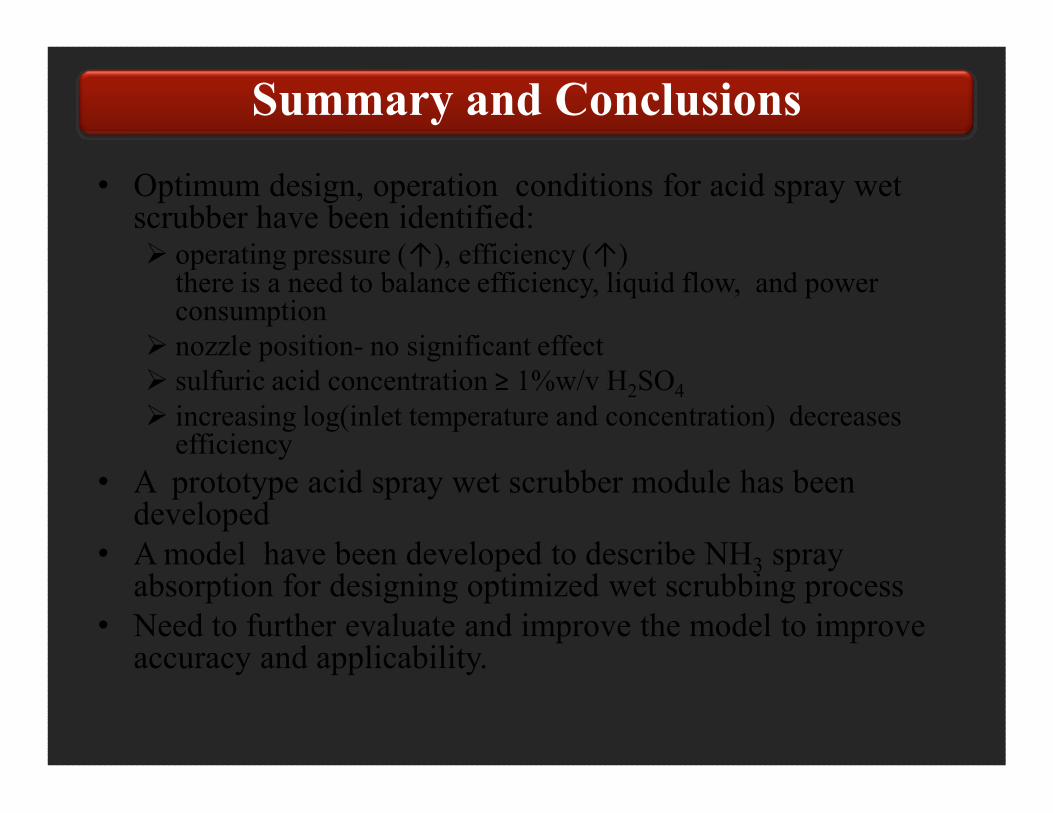
• Optimum design, operation conditions for acid spray wet scrubber have been identified: operating pressure (↑), efficiency (↑)
there is a need to balance efficiency, liquid flow, and power consumption
nozzle position- no significant effect
sulfuric acid concentration ≥ 1%w/v H2SO4
increasing log(inlet temperature and concentration) decreases efficiency
• A prototype acid spray wet scrubber module has been developed
• A model have been developed to describe NH3 spray absorption for designing optimized wet scrubbing process
• Need to further evaluate and improve the model to improve accuracy and applicability.
Summary and Conclusions
Step II:
Scale-up Design of Optimized
Wet Scrubber
OBJECTIVES:1. Develop a full-scale wet scrubber for poultry buildings and
manure composting facilities
2. Maintain high efficiency and optimized conditions of the
large-scale wet scrubber
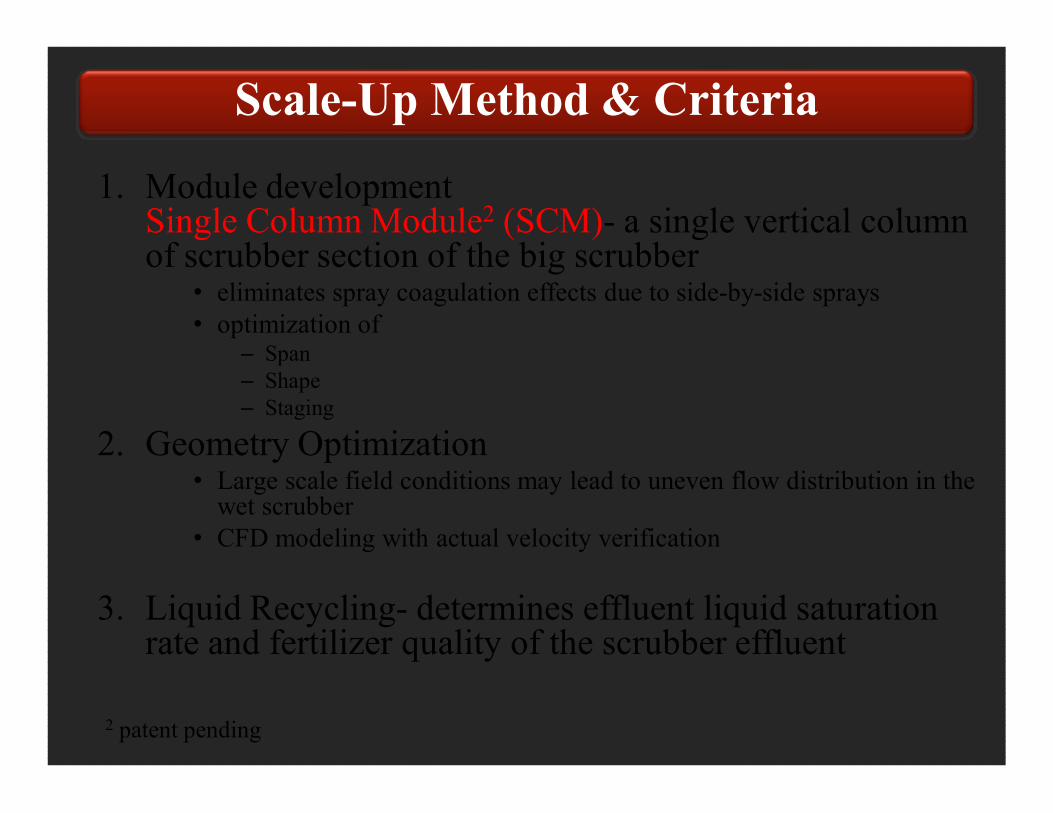
1. Module developmentSingle Column Module2 (SCM)- a single vertical column of scrubber section of the big scrubber
• eliminates spray coagulation effects due to side-by-side sprays
• optimization of– Span
– Shape
– Staging
2. Geometry Optimization• Large scale field conditions may lead to uneven flow distribution in the
wet scrubber
• CFD modeling with actual velocity verification
3. Liquid Recycling- determines effluent liquid saturation rate and fertilizer quality of the scrubber effluent
2 patent pending
Scale-Up Method & Criteria
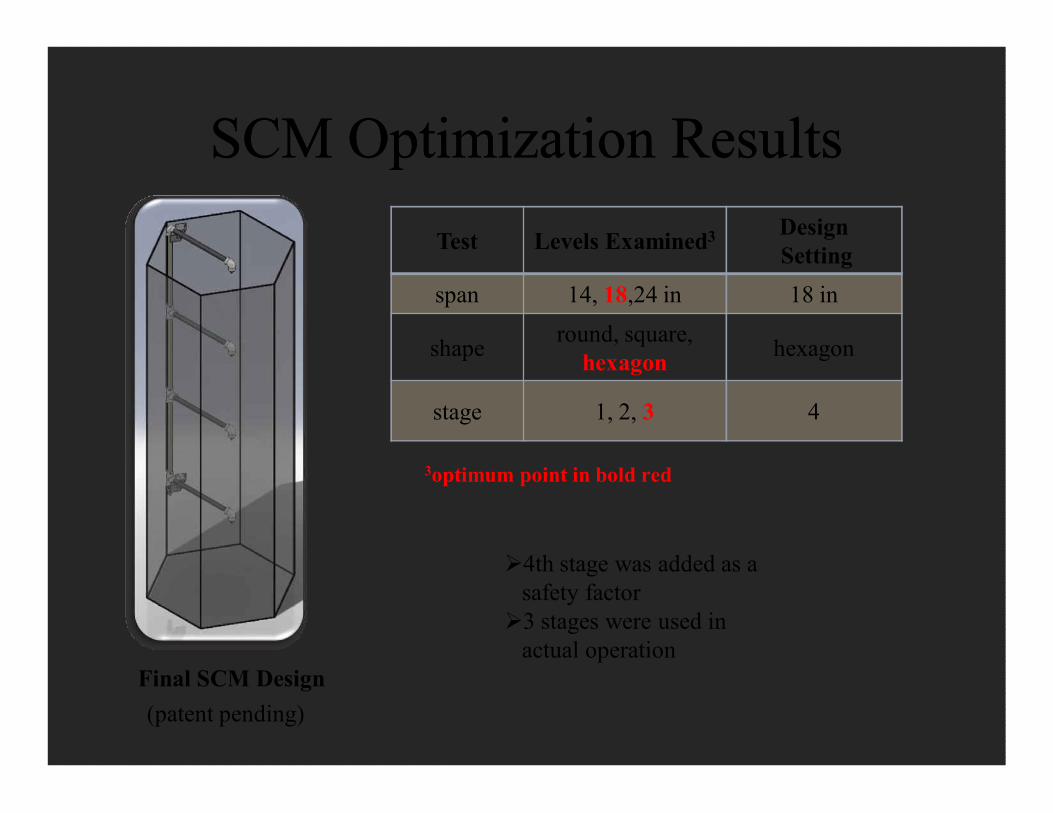
Test Levels Examined3 Design
Setting
span 14, 18,24 in 18 in
shaperound, square,
hexagonhexagon
stage 1, 2, 3 4
SCM Optimization ResultsSCM Optimization Results
Final SCM Design
4th stage was added as a
safety factor
3 stages were used in
actual operation
3optimum point in bold red
(patent pending)

CFD Optimized GeometryCFD Optimized Geometry
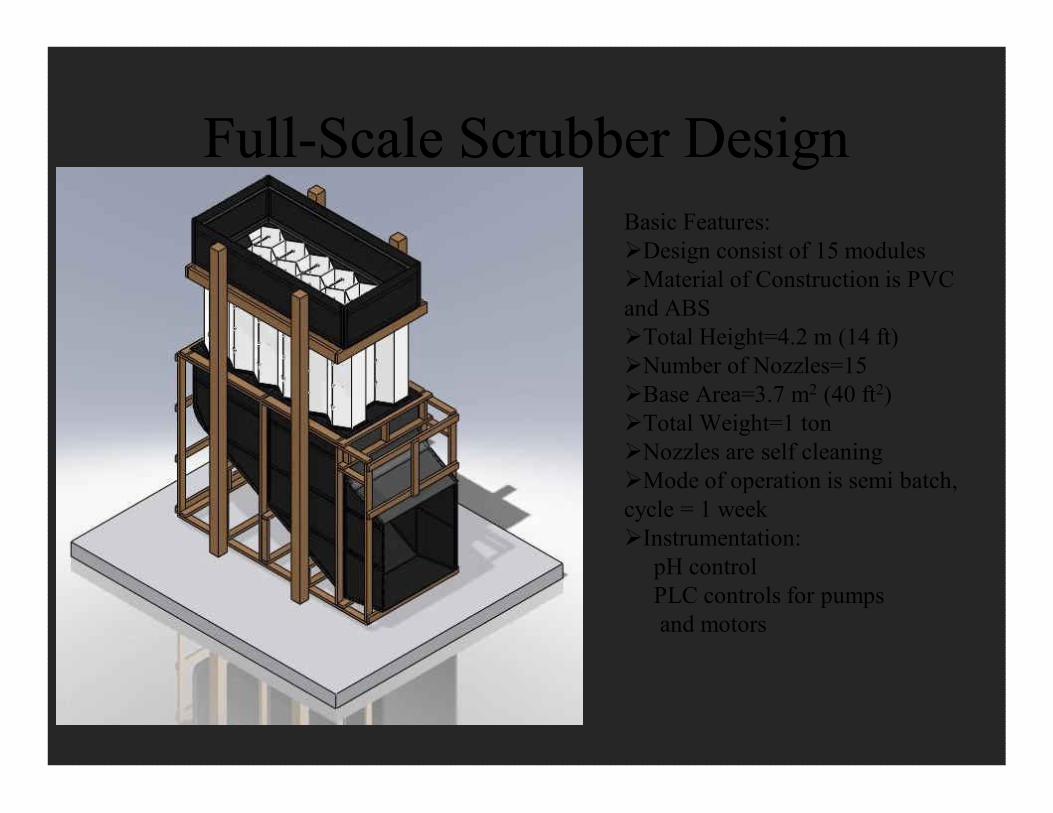
FullFull--Scale Scrubber DesignScale Scrubber Design
Basic Features:
Design consist of 15 modules
Material of Construction is PVC
and ABS
Total Height=4.2 m (14 ft)
Number of Nozzles=15
Base Area=3.7 m2 (40 ft2)
Total Weight=1 ton
Nozzles are self cleaning
Mode of operation is semi batch,
cycle = 1 week
Instrumentation:
pH control
PLC controls for pumps
and motors

Step III:
Field Evaluation
OBJECTIVES:1. Evaluate the scrubber performance at a poultry composting
facility in Ohio
2. Assess quality of liquid effluent of the scrubber
3. Assess economic feasibility of NH3 wet scrubber operation
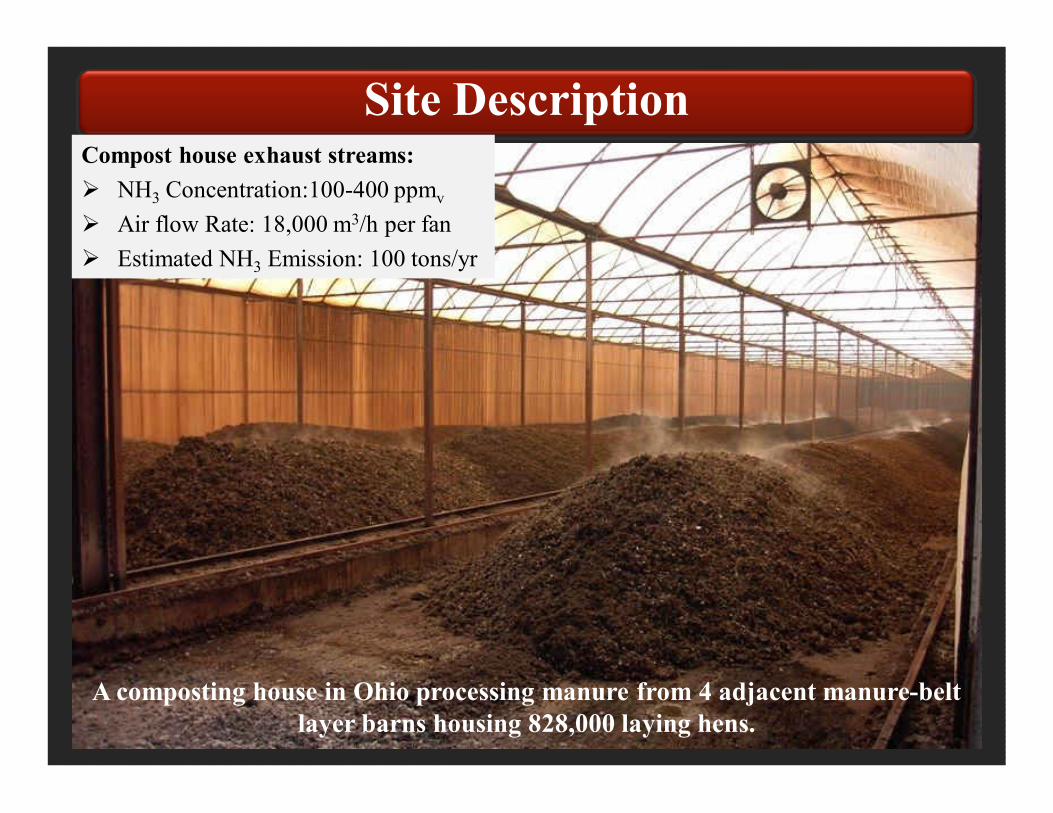
Site DescriptionCompost house exhaust streams:
NH3 Concentration:100-400 ppmv
Air flow Rate: 18,000 m3/h per fan
Estimated NH3 Emission: 100 tons/yr
A composting house in Ohio processing manure from 4 adjacent manure-belt
layer barns housing 828,000 laying hens.
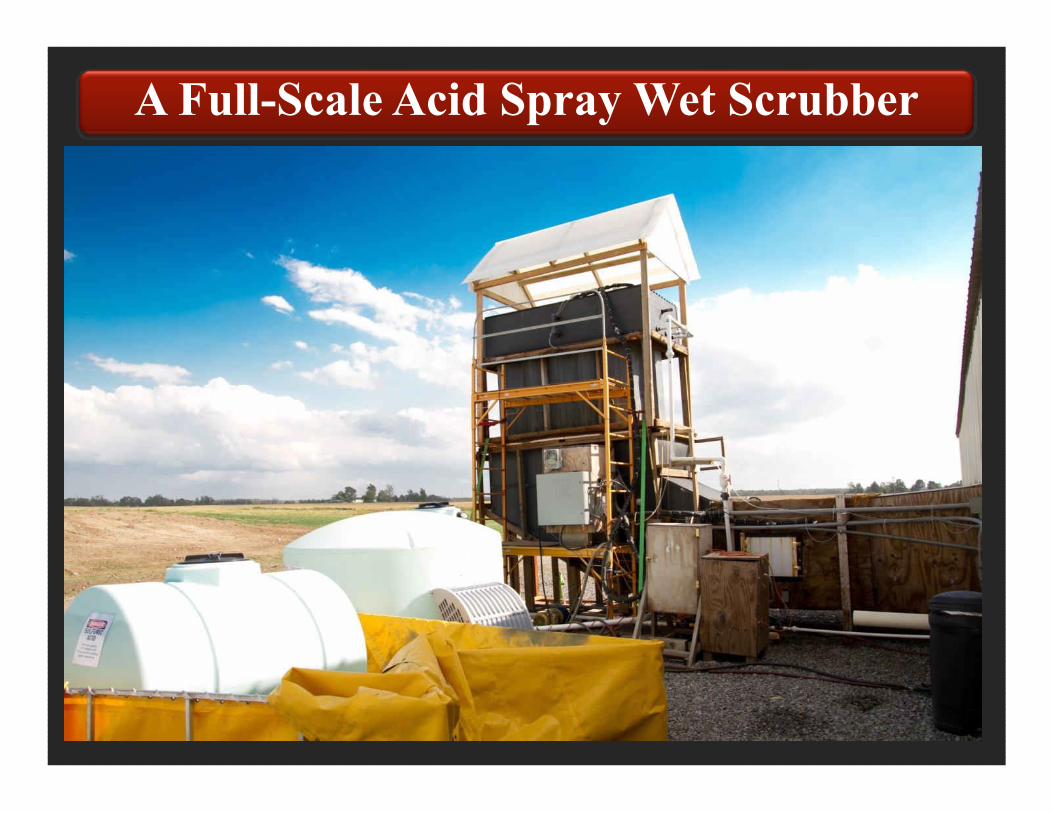
A Full-Scale Acid Spray Wet Scrubber
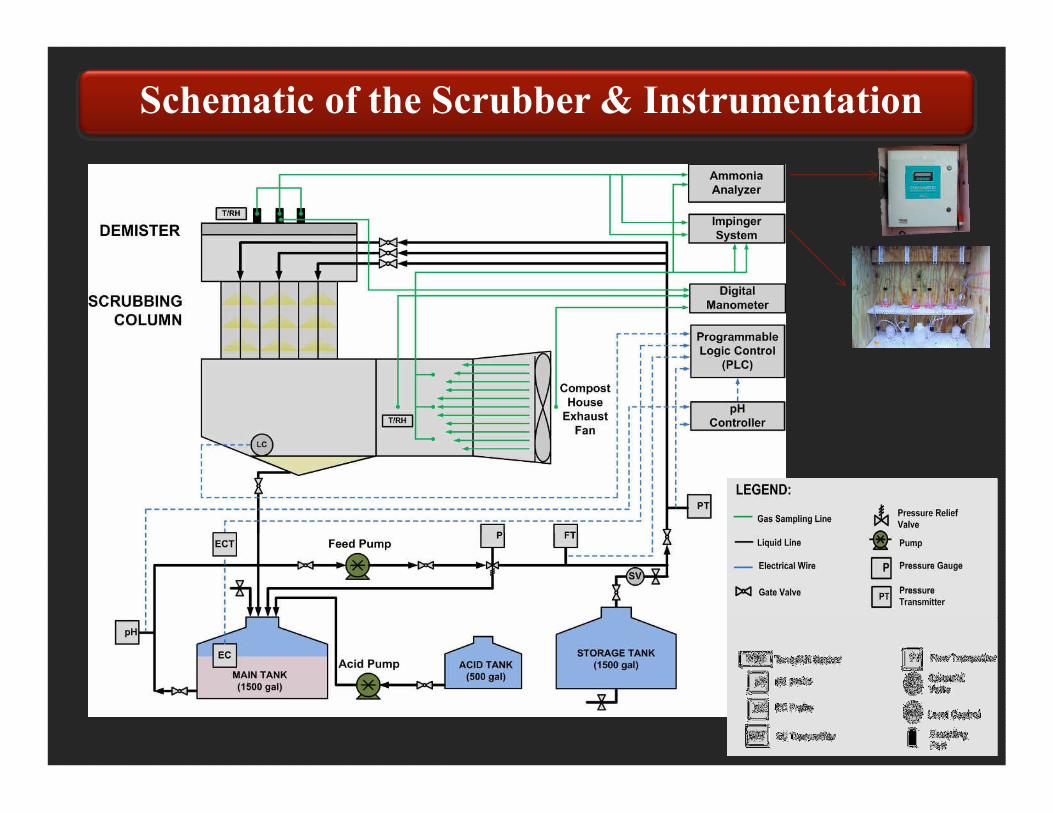
Schematic of the Scrubber & Instrumentation
Field Measurement Plan
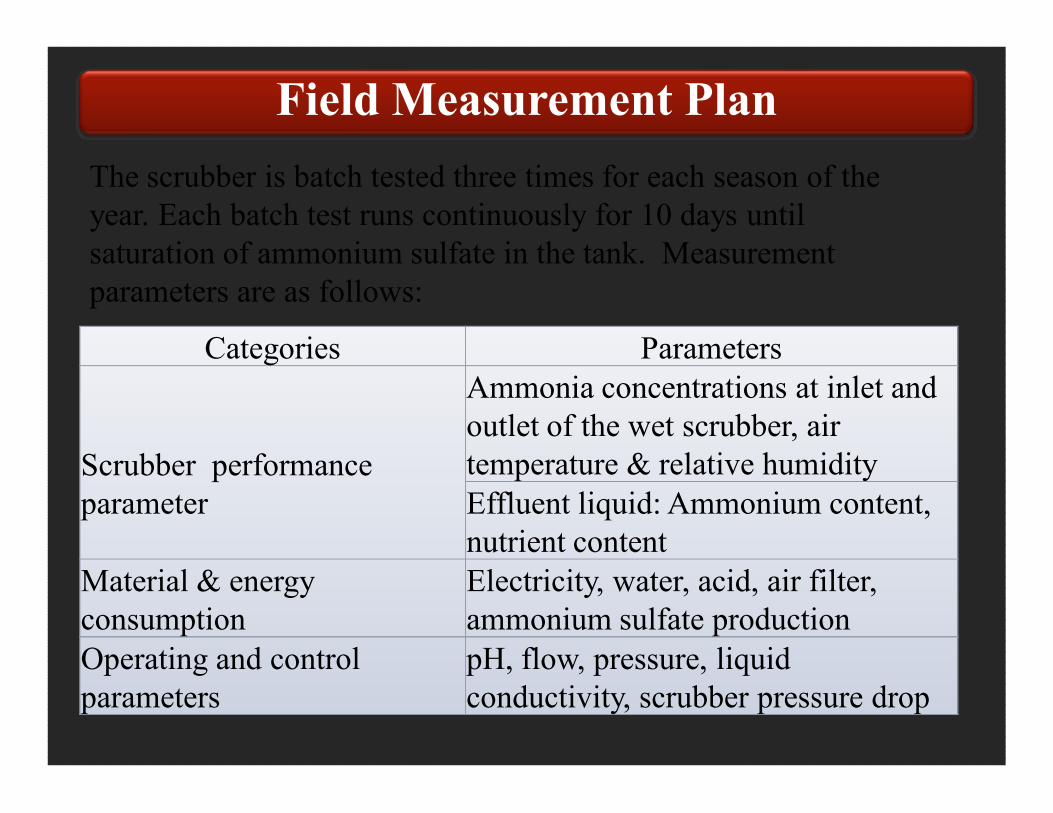
The scrubber is batch tested three times for each season of the
year. Each batch test runs continuously for 10 days until
saturation of ammonium sulfate in the tank. Measurement
parameters are as follows:
Categories Parameters
Scrubber performance
parameter
Ammonia concentrations at inlet and
outlet of the wet scrubber, air
temperature & relative humidity
Effluent liquid: Ammonium content,
nutrient content
Material & energy
consumption
Electricity, water, acid, air filter,
ammonium sulfate production
Operating and control
parameters
pH, flow, pressure, liquid
conductivity, scrubber pressure drop
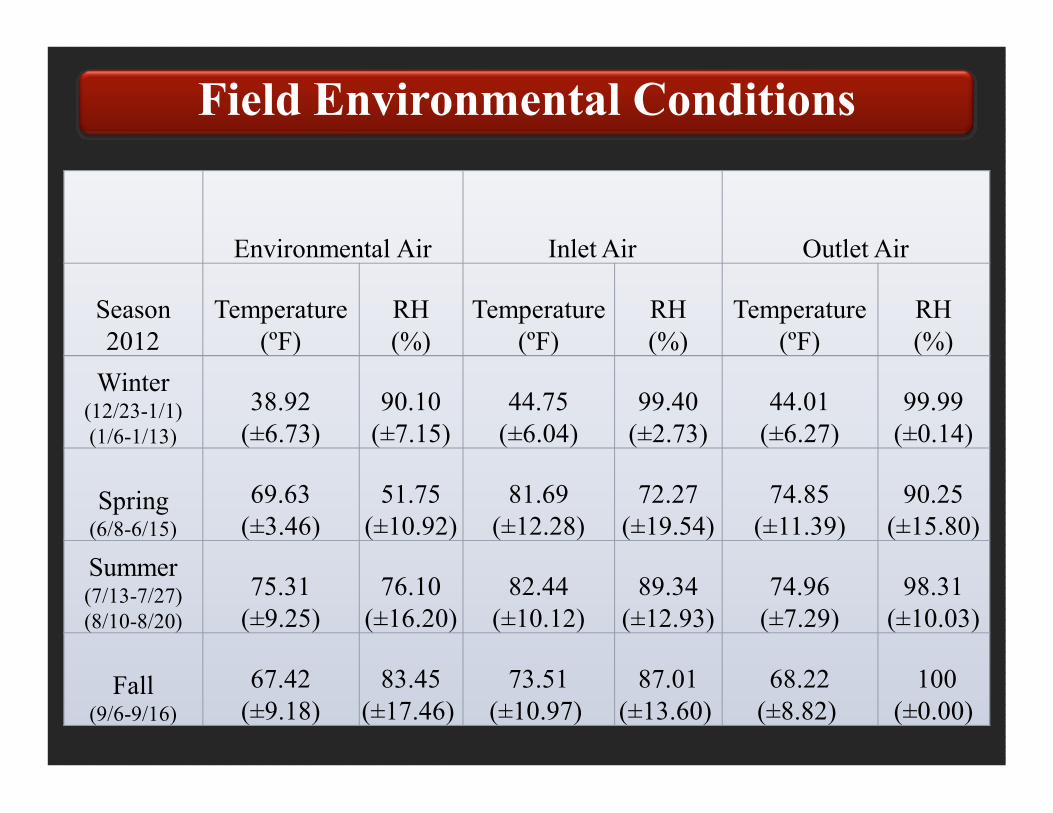
Field Environmental Conditions
Environmental Air Inlet Air Outlet Air
Season
2012
Temperature
(ºF)
RH
(%)
Temperature
(ºF)
RH
(%)
Temperature
(ºF)
RH
(%)
Winter (12/23-1/1)
(1/6-1/13)
38.92
(±6.73)
90.10
(±7.15)
44.75
(±6.04)
99.40
(±2.73)
44.01
(±6.27)
99.99
(±0.14)
Spring(6/8-6/15)
69.63
(±3.46)
51.75
(±10.92)
81.69
(±12.28)
72.27
(±19.54)
74.85
(±11.39)
90.25
(±15.80)
Summer(7/13-7/27)
(8/10-8/20)
75.31
(±9.25)
76.10
(±16.20)
82.44
(±10.12)
89.34
(±12.93)
74.96
(±7.29)
98.31
(±10.03)
Fall(9/6-9/16)
67.42
(±9.18)
83.45
(±17.46)
73.51
(±10.97)
87.01
(±13.60)
68.22
(±8.82)
100
(±0.00)
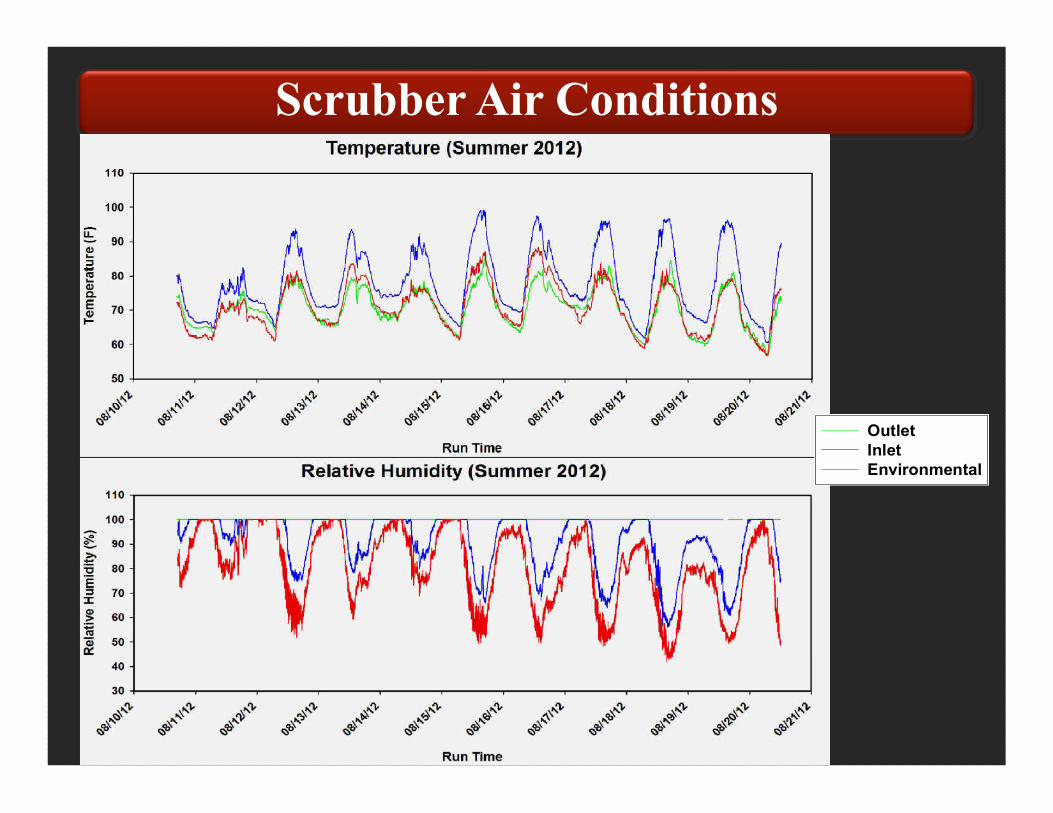
Scrubber Air Conditions
Outlet
Inlet
Environmental
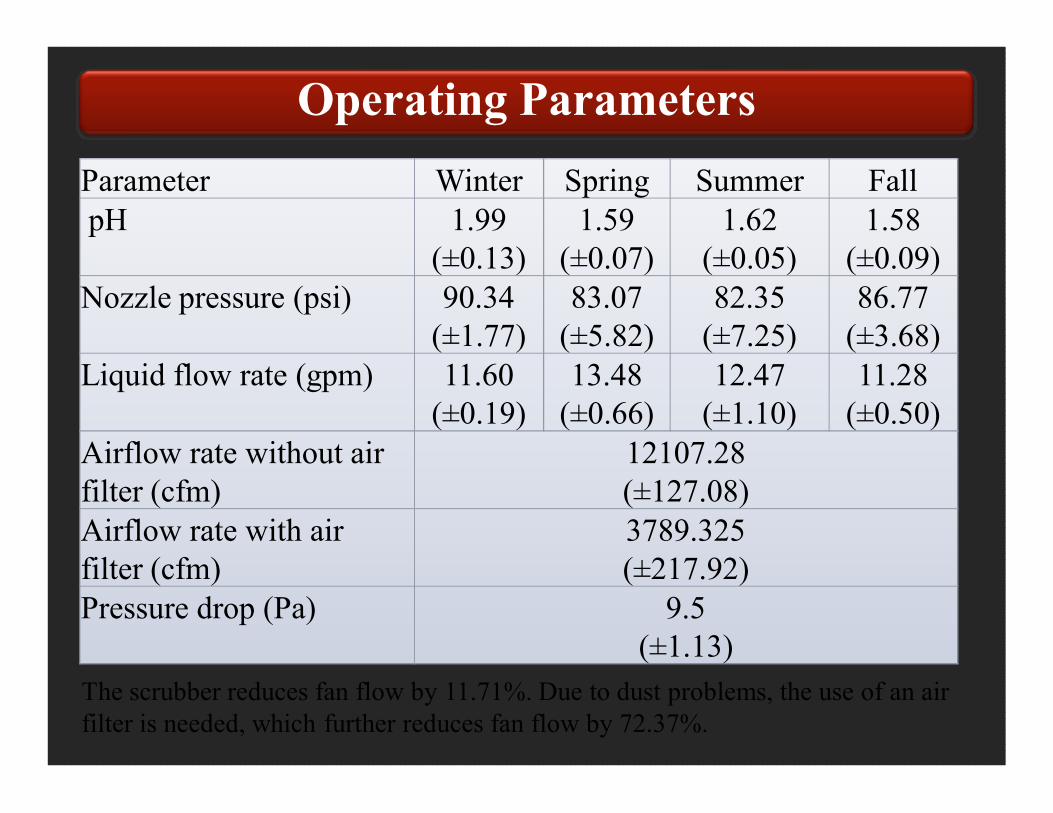
Operating Parameters
Parameter Winter Spring Summer Fall
pH 1.99
(±0.13)
1.59
(±0.07)
1.62
(±0.05)
1.58
(±0.09)
Nozzle pressure (psi) 90.34
(±1.77)
83.07
(±5.82)
82.35
(±7.25)
86.77
(±3.68)
Liquid flow rate (gpm) 11.60
(±0.19)
13.48
(±0.66)
12.47
(±1.10)
11.28
(±0.50)
Airflow rate without air
filter (cfm)
12107.28
(±127.08)
Airflow rate with air
filter (cfm)
3789.325
(±217.92)
Pressure drop (Pa) 9.5
(±1.13)
The scrubber reduces fan flow by 11.71%. Due to dust problems, the use of an air
filter is needed, which further reduces fan flow by 72.37%.
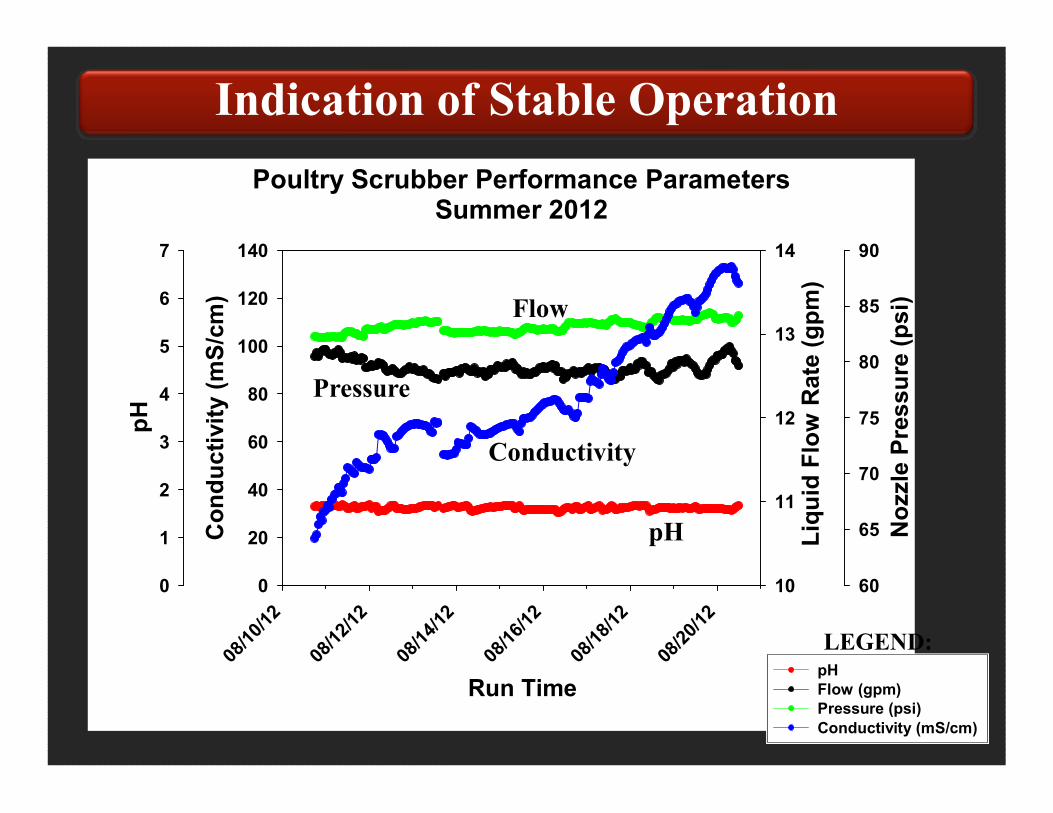
Poultry Scrubber Performance ParametersSummer 2012
Run Time
08/1
0/12
08/1
2/12
08/1
4/12
08/1
6/12
08/1
8/12
08/2
0/12
pH
0
1
2
3
4
5
6
7
Liq
uid
Flo
w R
ate
(g
pm
)
10
11
12
13
14
No
zzle
Pre
ssu
re (
ps
i)
60
65
70
75
80
85
90
Co
nd
uc
tivit
y (
mS
/cm
)
0
20
40
60
80
100
120
140
Indication of Stable Operation
pH
Conductivity
Pressure
Flow
pH
Flow (gpm)
Pressure (psi)
Conductivity (mS/cm)
LEGEND:
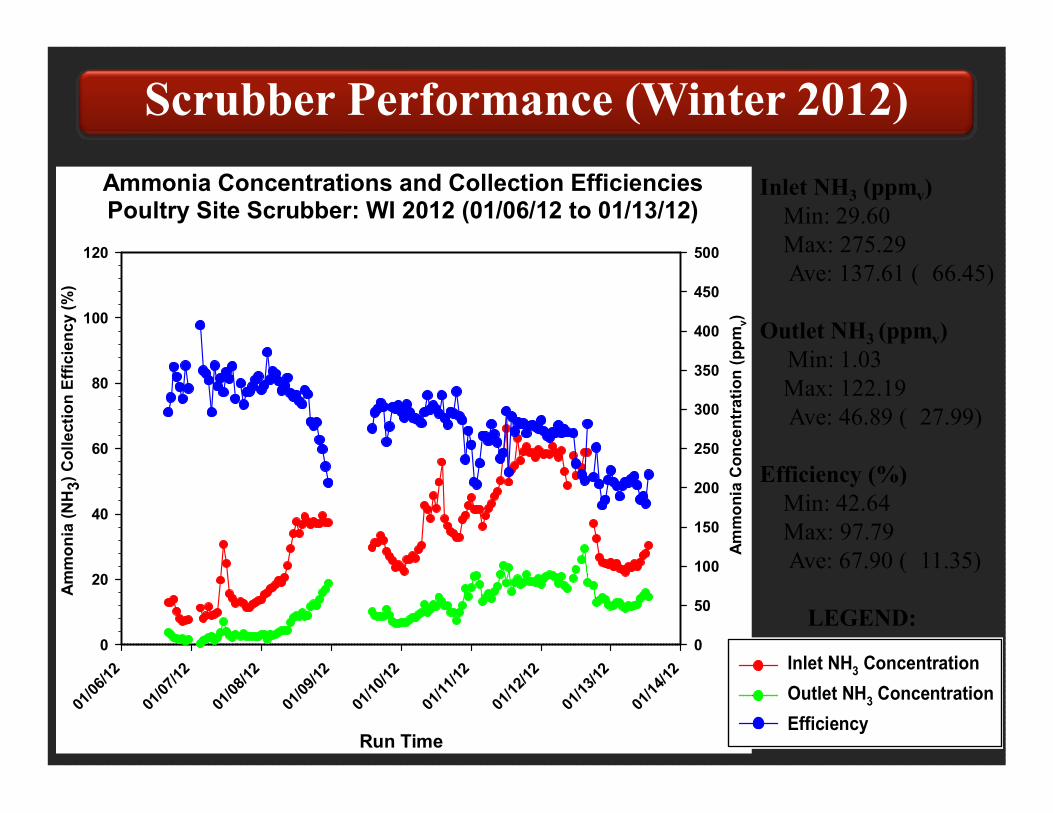
Ammonia Concentrations and Collection EfficienciesPoultry Site Scrubber: WI 2012 (01/06/12 to 01/13/12)
Run Time
01/0
6/12
01/0
7/12
01/0
8/12
01/0
9/12
01/1
0/12
01/1
1/12
01/1
2/12
01/1
3/12
01/1
4/12
Am
mo
nia
Co
nc
en
tra
tio
n (
pp
mv)
0
50
100
150
200
250
300
350
400
450
500
Am
mo
nia
(N
H3
) C
oll
ecti
on
Eff
icie
nc
y (
%)
0
20
40
60
80
100
120
Scrubber Performance (Winter 2012)
Inlet NH3 Concentration
Outlet NH3 Concentration
Efficiency
LEGEND:
Inlet NH3 (ppmv)
Min: 29.60
Max: 275.29
Ave: 137.61 ( 66.45)
Outlet NH3 (ppmv)
Min: 1.03
Max: 122.19
Ave: 46.89 ( 27.99)
Efficiency (%)
Min: 42.64
Max: 97.79
Ave: 67.90 ( 11.35)
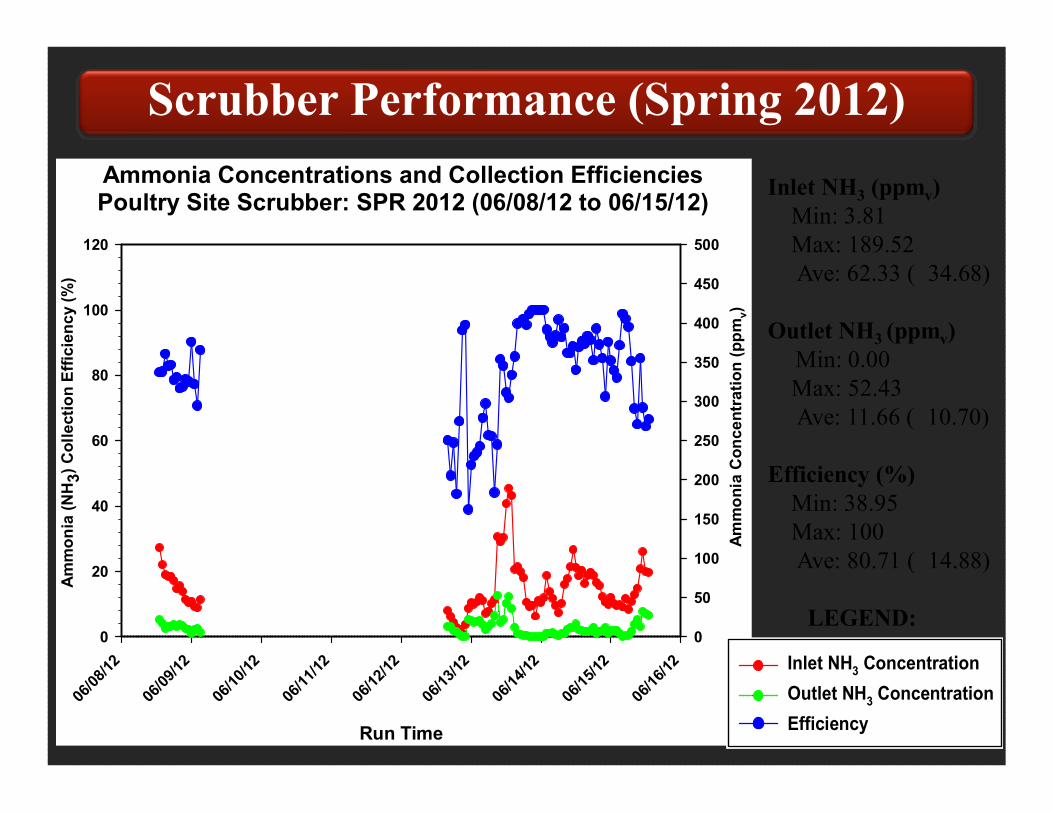
Ammonia Concentrations and Collection EfficienciesPoultry Site Scrubber: SPR 2012 (06/08/12 to 06/15/12)
Run Time
06/0
8/12
06/0
9/12
06/1
0/12
06/1
1/12
06/1
2/12
06/1
3/12
06/1
4/12
06/1
5/12
06/1
6/12
Am
mo
nia
Co
nc
en
tra
tio
n (
pp
mv)
0
50
100
150
200
250
300
350
400
450
500
Am
mo
nia
(N
H3
) C
oll
ecti
on
Eff
icie
nc
y (
%)
0
20
40
60
80
100
120
Scrubber Performance (Spring 2012)
Inlet NH3 Concentration
Outlet NH3 Concentration
Efficiency
LEGEND:
Inlet NH3 (ppmv)
Min: 3.81
Max: 189.52
Ave: 62.33 ( 34.68)
Outlet NH3 (ppmv)
Min: 0.00
Max: 52.43
Ave: 11.66 ( 10.70)
Efficiency (%)
Min: 38.95
Max: 100
Ave: 80.71 ( 14.88)
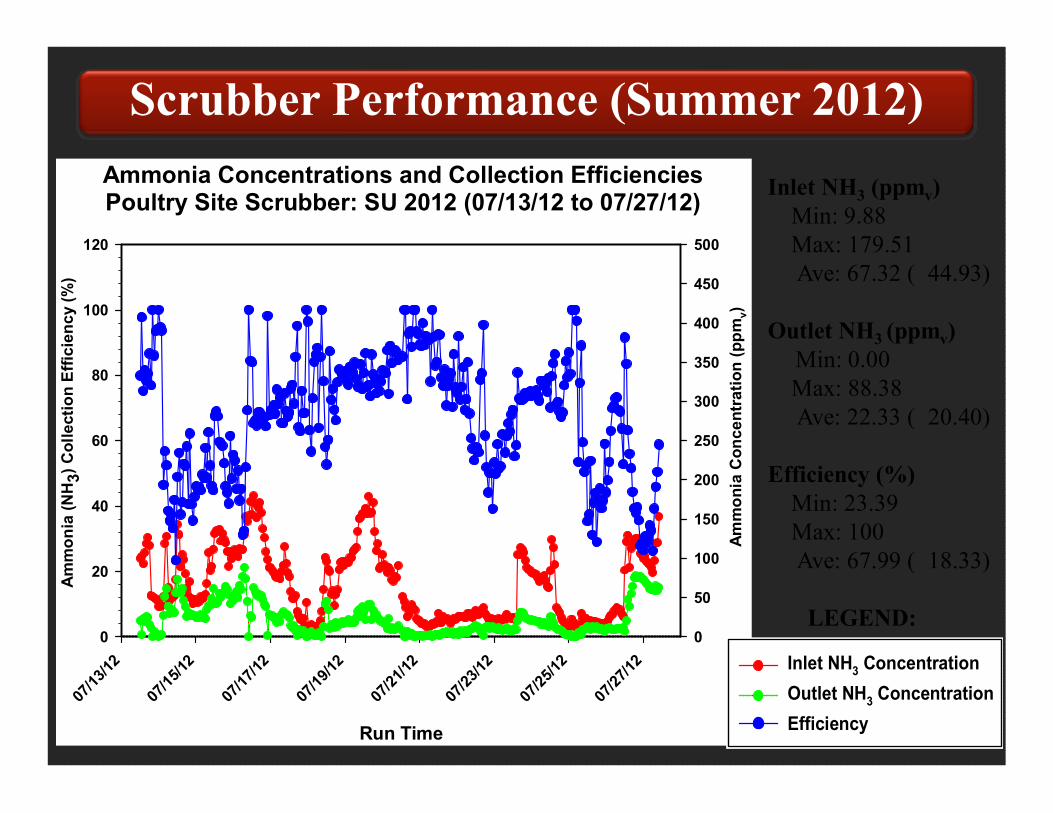
Ammonia Concentrations and Collection EfficienciesPoultry Site Scrubber: SU 2012 (07/13/12 to 07/27/12)
Run Time
07/1
3/12
07/1
5/12
07/1
7/12
07/1
9/12
07/2
1/12
07/2
3/12
07/2
5/12
07/2
7/12
Am
mo
nia
Co
nc
en
tra
tio
n (
pp
mv)
0
50
100
150
200
250
300
350
400
450
500
Am
mo
nia
(N
H3
) C
oll
ecti
on
Eff
icie
nc
y (
%)
0
20
40
60
80
100
120
Scrubber Performance (Summer 2012)
Inlet NH3 Concentration
Outlet NH3 Concentration
Efficiency
LEGEND:
Inlet NH3 (ppmv)
Min: 9.88
Max: 179.51
Ave: 67.32 ( 44.93)
Outlet NH3 (ppmv)
Min: 0.00
Max: 88.38
Ave: 22.33 ( 20.40)
Efficiency (%)
Min: 23.39
Max: 100
Ave: 67.99 ( 18.33)
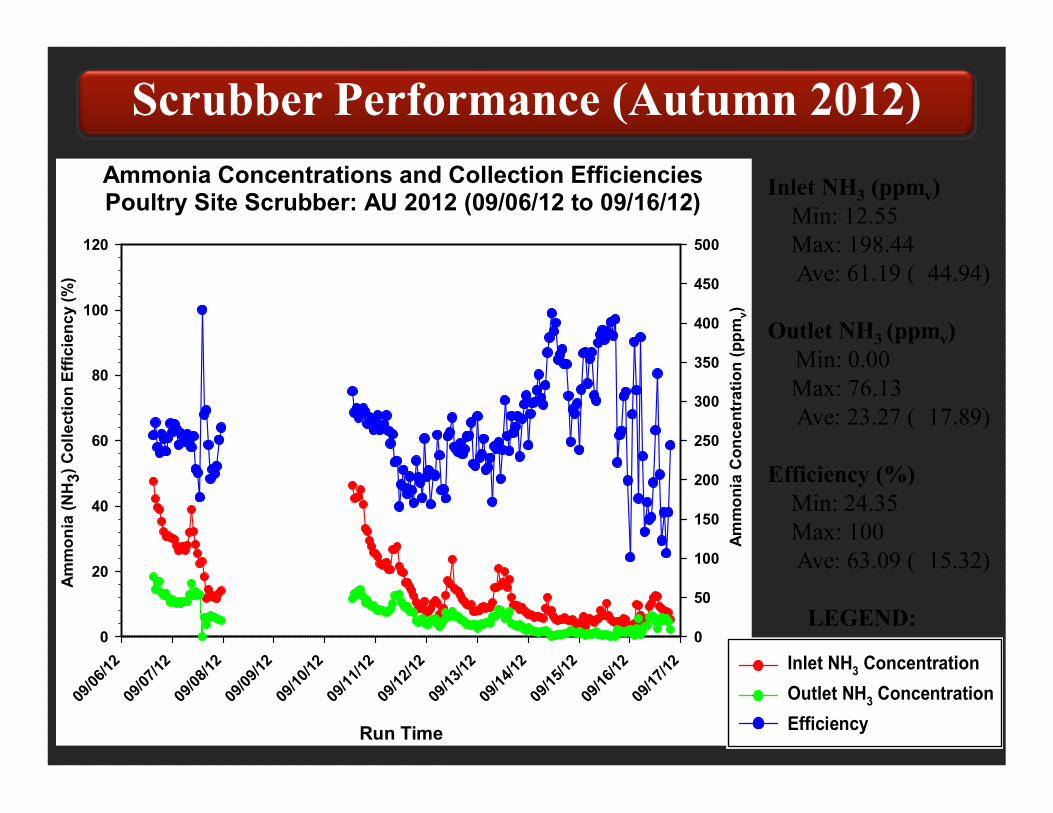
Ammonia Concentrations and Collection EfficienciesPoultry Site Scrubber: AU 2012 (09/06/12 to 09/16/12)
Run Time
09/0
6/12
09
/07/
12
09/0
8/12
09
/09/
12
09/1
0/12
09
/11/
12
09/1
2/12
09
/13/
12
09/1
4/12
09
/15/
12
09/1
6/12
09
/17/
12
Am
mo
nia
Co
nc
en
tra
tio
n (
pp
mv)
0
50
100
150
200
250
300
350
400
450
500
Am
mo
nia
(N
H3
) C
oll
ecti
on
Eff
icie
nc
y (
%)
0
20
40
60
80
100
120
Scrubber Performance (Autumn 2012)
Inlet NH3 Concentration
Outlet NH3 Concentration
Efficiency
LEGEND:
Inlet NH3 (ppmv)
Min: 12.55
Max: 198.44
Ave: 61.19 ( 44.94)
Outlet NH3 (ppmv)
Min: 0.00
Max: 76.13
Ave: 23.27 ( 17.89)
Efficiency (%)
Min: 24.35
Max: 100
Ave: 63.09 ( 15.32)
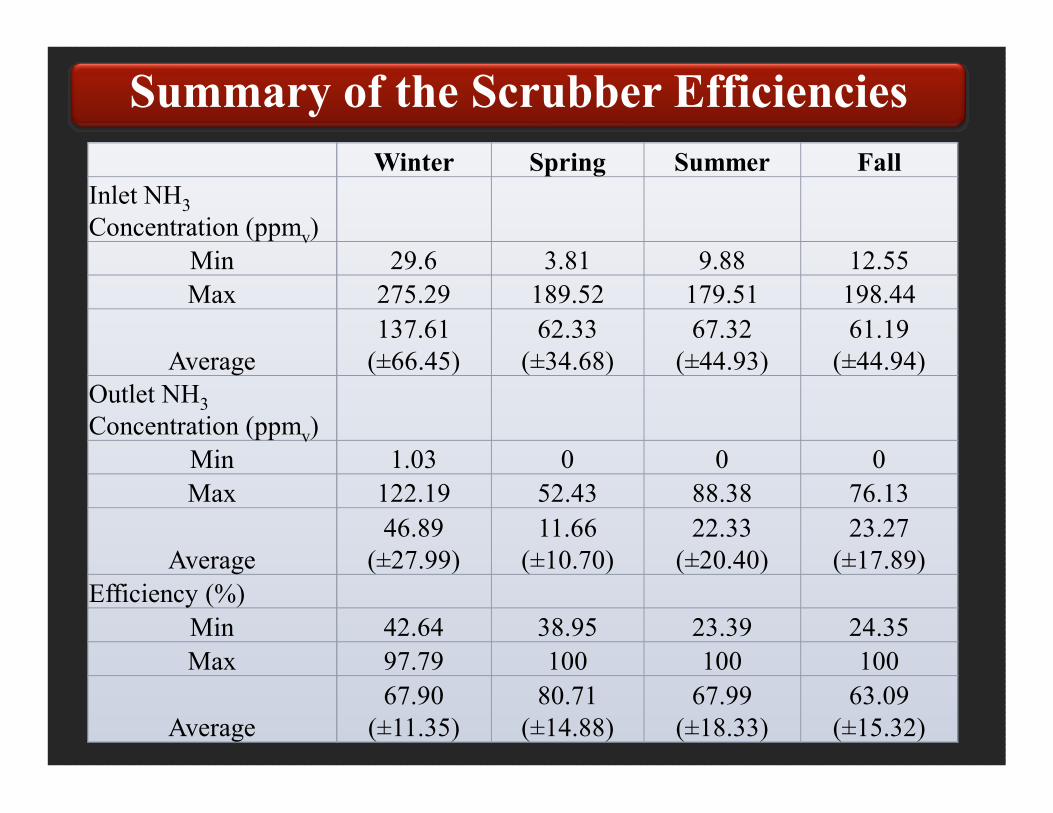
Summary of the Scrubber Efficiencies
Winter Spring Summer Fall
Inlet NH3
Concentration (ppmv)
Min 29.6 3.81 9.88 12.55
Max 275.29 189.52 179.51 198.44
Average
137.61
(±66.45)
62.33
(±34.68)
67.32
(±44.93)
61.19
(±44.94)
Outlet NH3
Concentration (ppmv)
Min 1.03 0 0 0
Max 122.19 52.43 88.38 76.13
Average
46.89
(±27.99)
11.66
(±10.70)
22.33
(±20.40)
23.27
(±17.89)
Efficiency (%)
Min 42.64 38.95 23.39 24.35
Max 97.79 100 100 100
Average
67.90
(±11.35)
80.71
(±14.88)
67.99
(±18.33)
63.09
(±15.32)
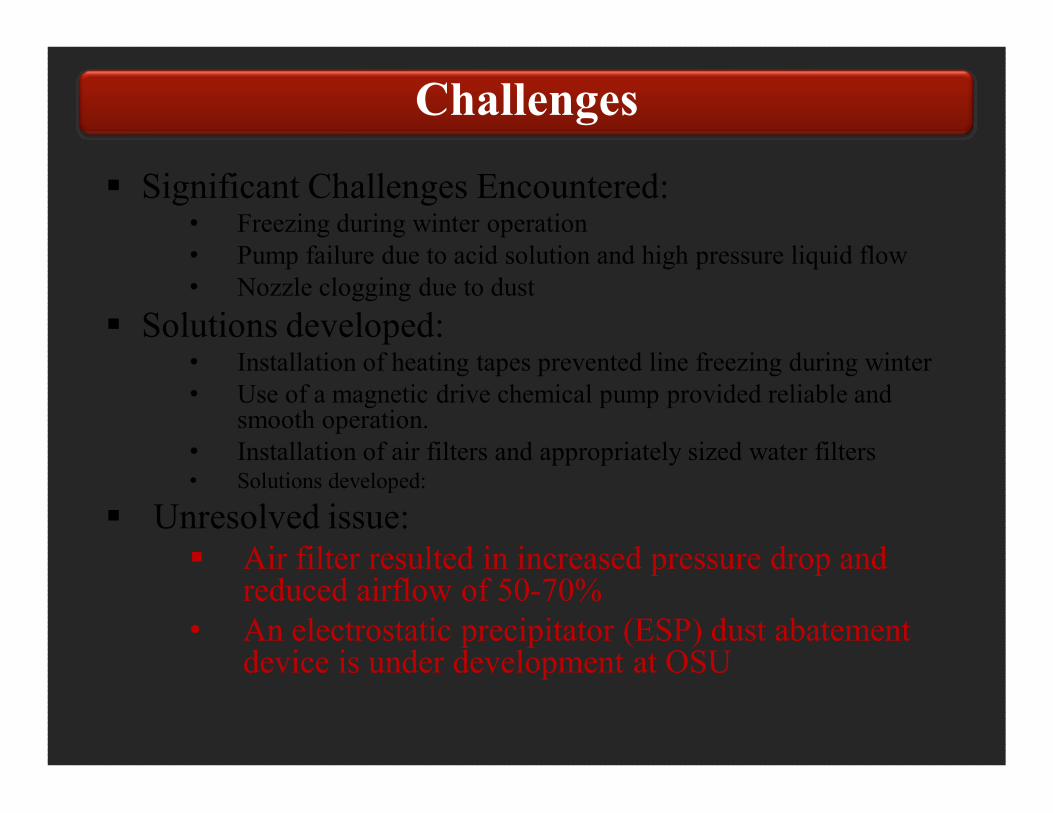
Significant Challenges Encountered:• Freezing during winter operation
• Pump failure due to acid solution and high pressure liquid flow
• Nozzle clogging due to dust
Solutions developed: • Installation of heating tapes prevented line freezing during winter
• Use of a magnetic drive chemical pump provided reliable and smooth operation.
• Installation of air filters and appropriately sized water filters • Solutions developed:
Unresolved issue: Air filter resulted in increased pressure drop and
reduced airflow of 50-70%
• An electrostatic precipitator (ESP) dust abatement device is under development at OSU
Challenges
A Preliminary
Economic Analysis of
the Wet Scrubber Operation
OBJECTIVES:1. Examine if it is economically feasible to run the wet
scrubbers on poultry farms
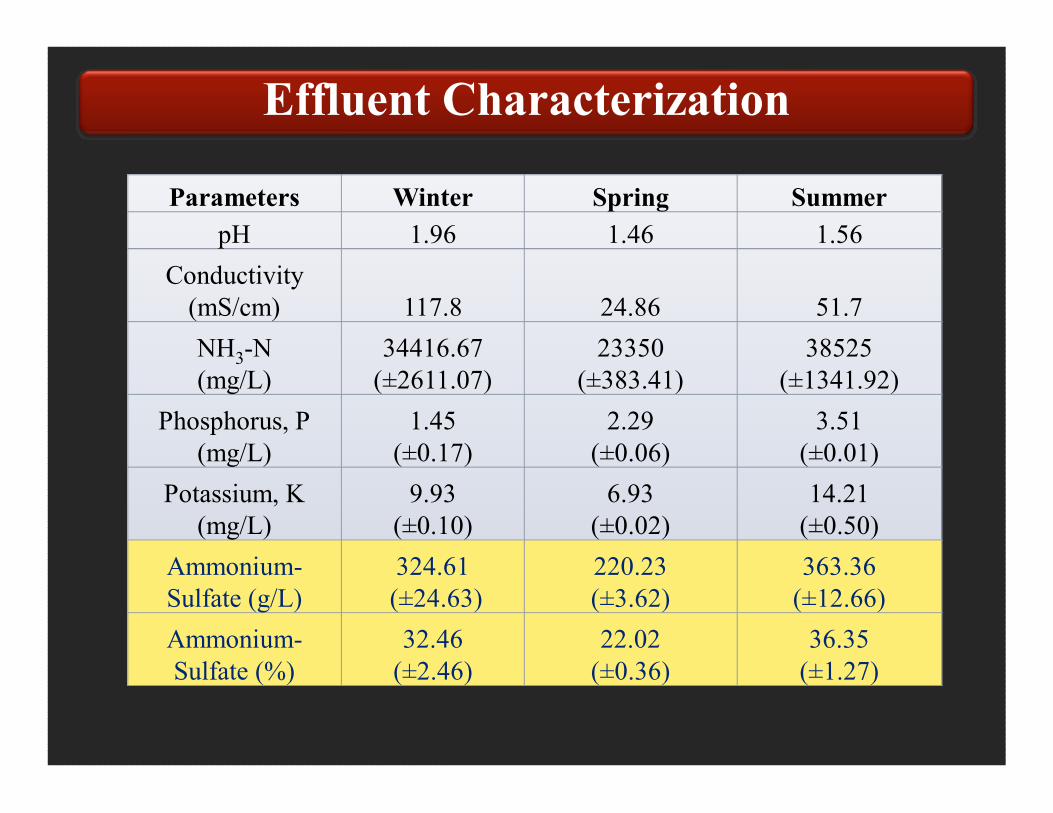
Effluent Characterization
Parameters Winter Spring Summer
pH 1.96 1.46 1.56
Conductivity
(mS/cm) 117.8 24.86 51.7
NH3-N
(mg/L)
34416.67
(±2611.07)
23350
(±383.41)
38525
(±1341.92)
Phosphorus, P
(mg/L)
1.45
(±0.17)
2.29
(±0.06)
3.51
(±0.01)
Potassium, K
(mg/L)
9.93
(±0.10)
6.93
(±0.02)
14.21
(±0.50)
Ammonium-
Sulfate (g/L)
324.61
(±24.63)
220.23
(±3.62)
363.36
(±12.66)
Ammonium-
Sulfate (%)
32.46
(±2.46)
22.02
(±0.36)
36.35
(±1.27)
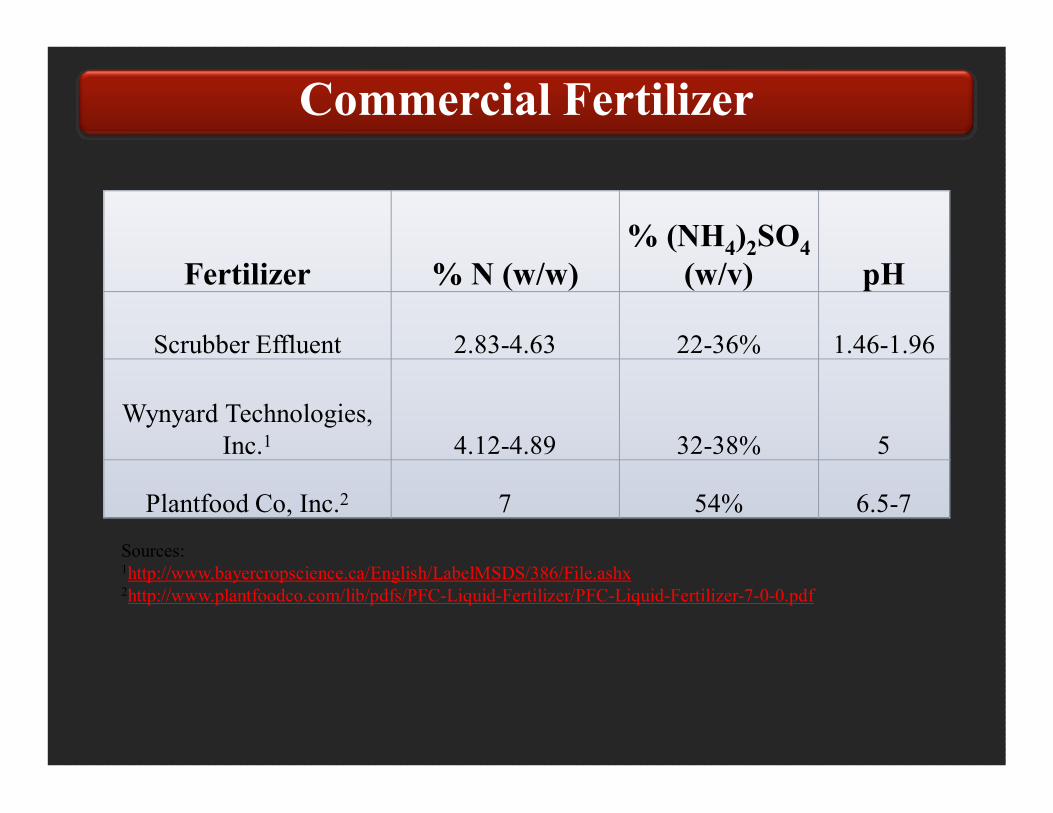
Fertilizer % N (w/w)
% (NH4)2SO4
(w/v) pH
Scrubber Effluent 2.83-4.63 22-36% 1.46-1.96
Wynyard Technologies,
Inc.1 4.12-4.89 32-38% 5
Plantfood Co, Inc.2 7 54% 6.5-7
Commercial Fertilizer
Sources:1http://www.bayercropscience.ca/English/LabelMSDS/386/File.ashx2http://www.plantfoodco.com/lib/pdfs/PFC-Liquid-Fertilizer/PFC-Liquid-Fertilizer-7-0-0.pdf
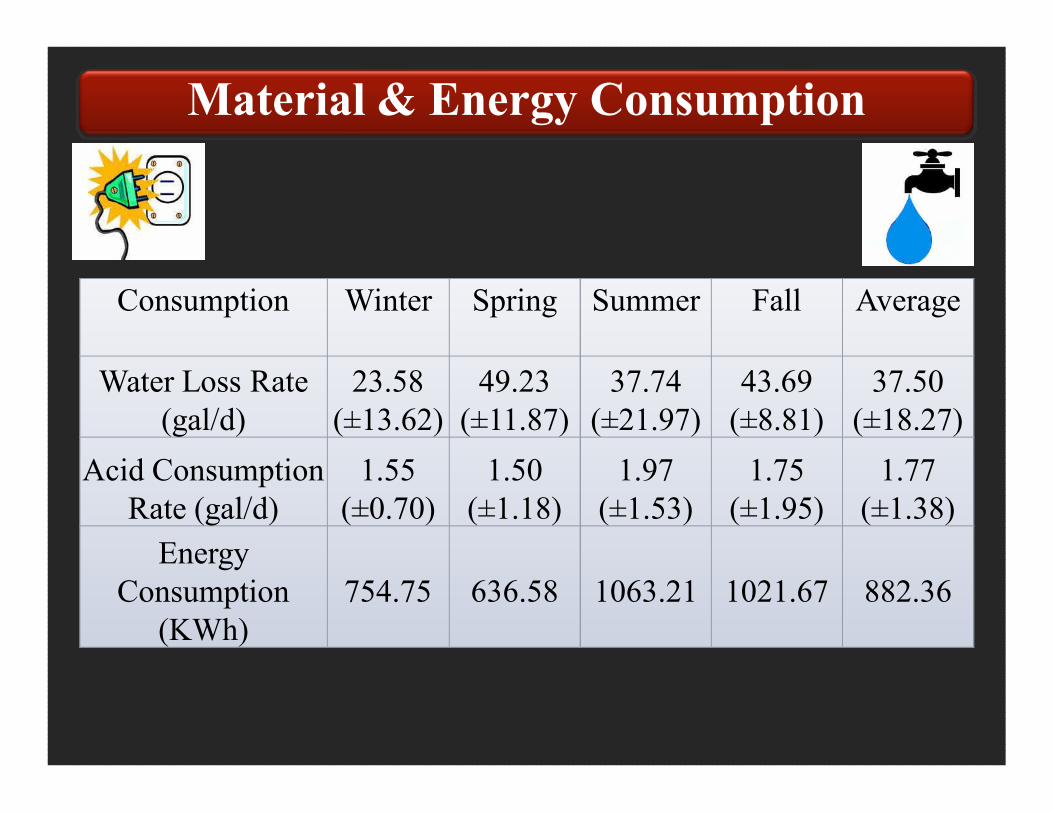
Material & Energy Consumption
Consumption Winter Spring Summer Fall Average
Water Loss Rate
(gal/d)
23.58
(±13.62)
49.23
(±11.87)
37.74
(±21.97)
43.69
(±8.81)
37.50
(±18.27)
Acid Consumption
Rate (gal/d)
1.55
(±0.70)
1.50
(±1.18)
1.97
(±1.53)
1.75
(±1.95)
1.77
(±1.38)
Energy
Consumption
(KWh)
754.75 636.58 1063.21 1021.67 882.36
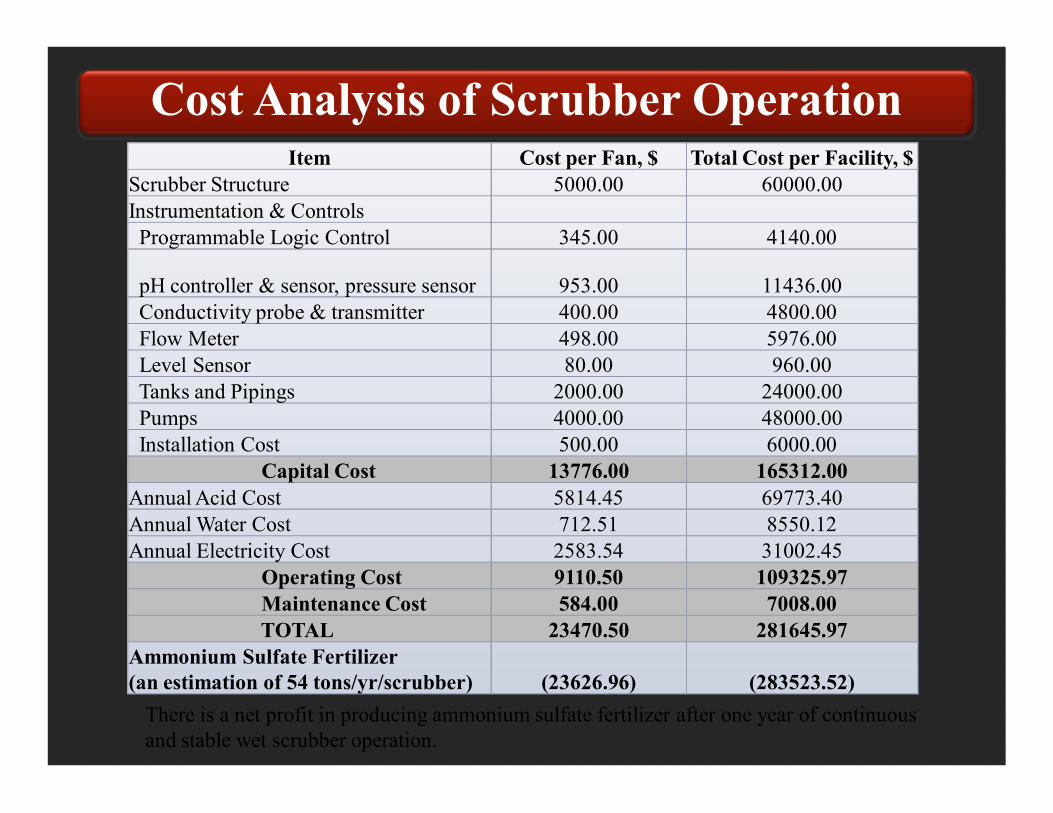
Cost Analysis of Scrubber Operation
There is a net profit in producing ammonium sulfate fertilizer after one year of continuous
and stable wet scrubber operation.
Item Cost per Fan, $ Total Cost per Facility, $
Scrubber Structure 5000.00 60000.00
Instrumentation & Controls
Programmable Logic Control 345.00 4140.00
pH controller & sensor, pressure sensor 953.00 11436.00
Conductivity probe & transmitter 400.00 4800.00
Flow Meter 498.00 5976.00
Level Sensor 80.00 960.00
Tanks and Pipings 2000.00 24000.00
Pumps 4000.00 48000.00
Installation Cost 500.00 6000.00
Capital Cost 13776.00 165312.00
Annual Acid Cost 5814.45 69773.40
Annual Water Cost 712.51 8550.12
Annual Electricity Cost 2583.54 31002.45
Operating Cost 9110.50 109325.97
Maintenance Cost 584.00 7008.00
TOTAL 23470.50 281645.97
Ammonium Sulfate Fertilizer
(an estimation of 54 tons/yr/scrubber) (23626.96) (283523.52)
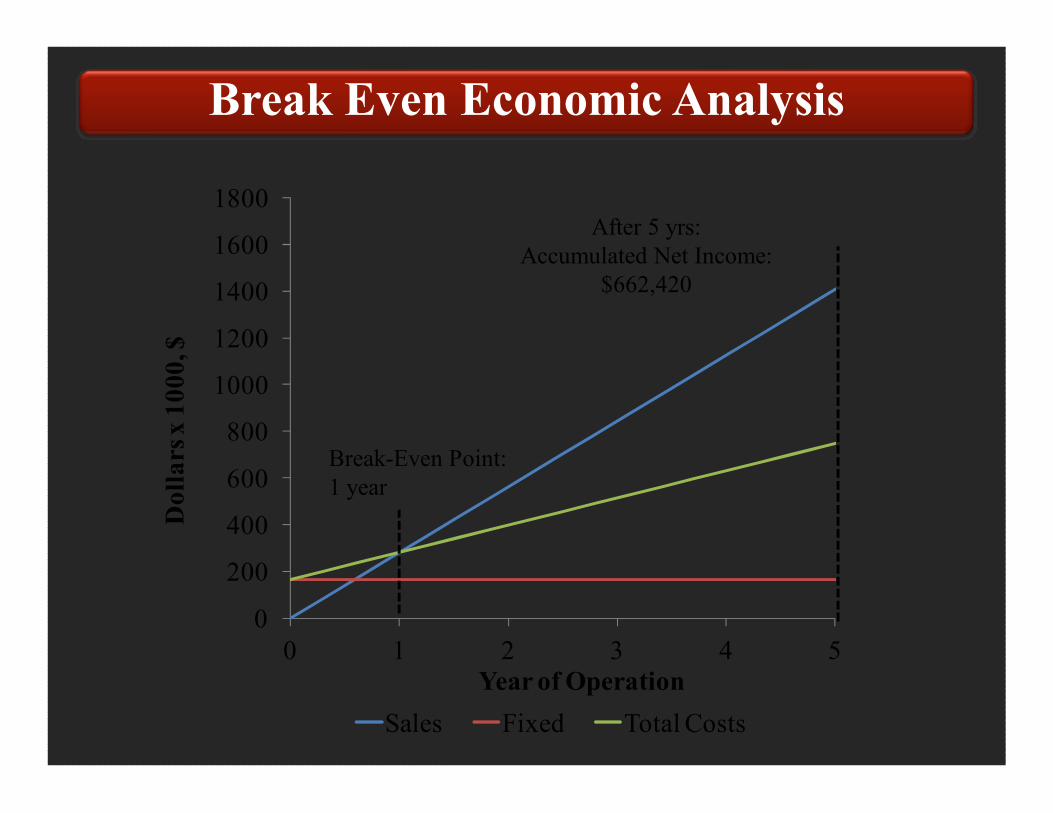
Break Even Economic Analysis
0
200
400
600
800
1000
1200
1400
1600
1800
0 1 2 3 4 5
Do
lla
rs x
10
00
, $
Year of Operation
Sales Fixed Total Costs
Break-Even Point:
1 year
After 5 yrs:
Accumulated Net Income:
$662,420

• A full-scale acid spray scrubber prototype has been
developed in lab, scaled-up to a full wet scrubber for poultry
operation, and evaluated in a commercial poultry farm for its
ammonia absorption performance, operation and
maintenance cost.
• NH3 scrubbing efficiency varied from 75% to 87% in lab
as ammonia concentrations varied from 100 to 400 ppmv.
However, in field operation, the efficiency varied from 63%
to 80% seasonally.
• The average scrubber operating conditions were: 12.21
gal/min liquid flow, 85.63 psi liquid pressure, and 9.5 Pa
pressure drop.
Conclusions

• Water consumption rate was observed to be 37.50 gal/day;
sulfuric consumption rate was 1.8 gal/day; electricity use was 882
KWh, and ammonia sulfate fertilizer production rate was 54
tons/year.
• A preliminary breakeven economic analysis was conducted.
The breakeven point was about 1 year operation (648 tons). A
stable wet scrubber operation would result in a net income from
production of ammonium fertilizer.
• Large reduction on airflow (50-70%) was observed due to
installation of air filter for dust control. Only 11% of flow
reduction accounted to the spray scrubber. Further development
is needed to resolve the dust issue for the wet scrubber operation.
Conclusions (cont.)
ACKNOWLEDGEMENTS
“This project was supported by National Research Initiative
Competitive Grant no. 2008-55112-1876 from the USDA Cooperative
State Research, Education, and Extension Service Air Quality
Program.”
“This project was supported by National Research Initiative
Competitive Grant no. 2008-55112-1876 from the USDA Cooperative
State Research, Education, and Extension Service Air Quality
Program.”
Support and Technical Assistance:
PIV technical and facilities support provided by Mr. Barry Nud of USDA-
ARS, Wooster, OH
Fabrication and laboratory help provided by Mr. Carl Cooper, Mr. Alan
Yost, Mr. Craig Cox, and Mr. Jared Felder, Jeff Nazwati, Bryan Stickel of
FABE-OSU, Columbus, OH
Scrubber inspection and maintenance help provided by Dr. Ibrahim
Elbatawi , Dr. Jungang Dong, Kyle Schimmoeller, Anatoliy Meleshchuk,
Josh Griffin of FABE-OSU, Columbus, OH

Lingying Zhao
Associate Professor and Extension Specialist
Dept. of Food, Agri. and
Biological Engineering
The Ohio State University
Phone: (614) 292-2366
Fax: (614) 292-9448
Email: [email protected]
Thank You!


![Chemical Examination of Fly Ash and Bottom Ash Derived ... 1-2018-a35.pdfflue gas cleaning technologies [8–10]. The cleaning method applied (wet scrubbers, semi-dry scrubbers and](https://img.dokumen.tips/doc/110x75/5f993aa77952467ae77a2483/chemical-examination-of-fly-ash-and-bottom-ash-derived-1-2018-a35pdf-flue-gas.jpg)