Embed Size (px)
Citation preview
Western Forest Products Inc.
2018 First Quarter Report
Management’s Discussion & Analysis
The following Management’s Discussion and Analysis (“MD&A”) reports and comments on the financial condition and results of operations of Western Forest Products Inc. (the “Company”, “Western”, “us”, “we”, or “our”), on a consolidated basis, for the three months ended March 31, 2018 to help security holders and other readers understand our Company and the key factors underlying our financial results. This discussion and analysis should be read in conjunction with our unaudited condensed consolidated interim financial statements and the notes thereto for the three months ended March 31, 2018, and our audited annual consolidated financial statements and management’s discussion and analysis for the year ended December 31, 2017 (the “2017 Annual Report”), which can be found on SEDAR at www.sedar.com.
The Company has prepared the consolidated financial statements for the three months ended March 31, 2018 in accordance with International Financial Reporting Standards (“IFRS”), as issued by the International Accounting Standards Board. Amounts discussed herein are based on our unaudited condensed consolidated interim financial statements and are presented in millions of Canadian dollars unless otherwise noted. Certain prior period comparative figures have been reclassified to conform to the current period’s presentation.
Reference is made in this MD&A to adjusted EBITDA1. Adjusted EBITDA is defined as operating income prior to operating restructuring items and other income (expenses), plus amortization of property, plant, and equipment and intangible assets, impairment adjustments, and changes in fair value of biological assets. Adjusted EBITDA margin is adjusted EBITDA as a proportion of revenue. Western uses adjusted EBITDA and adjusted EBITDA margin as benchmark measurements of our own operating results and as benchmarks relative to our competitors. We consider adjusted EBITDA to be a meaningful supplement to operating income as a performance measure primarily because amortization expense, impairment adjustments and changes in the fair value of biological assets are non-cash costs, and vary widely from company to company in a manner that we consider largely independent of the underlying cost efficiency of their operating facilities. Further, the inclusion of operating restructuring items which are unpredictable in nature and timing may make comparisons of our operating results between periods more difficult. We also believe adjusted EBITDA and adjusted EBITDA margin are commonly used by securities analysts, investors and other interested parties to evaluate our financial performance.
Adjusted EBITDA does not represent cash generated from operations as defined by IFRS and it is not necessarily indicative of cash available to fund cash needs. Furthermore, adjusted EBITDA does not reflect the impact of a number of items that affect our net income. Adjusted EBITDA and adjusted EBITDA margin are not measures of financial performance under IFRS, and should not be considered as alternatives to measures of performance under IFRS. Moreover, because all companies do not calculate adjusted EBITDA in the same manner, adjusted EBITDA and adjusted EBITDA margin calculated by Western may differ from similar measures calculated by other companies. A reconciliation between the Company’s net income as reported in accordance with IFRS and adjusted EBITDA is included in Appendix A to this report.
Also in this MD&A, management uses key performance indicators such as net debt, net debt to capitalization and current assets to current liabilities. Net debt is defined as long-term debt less cash and cash equivalents. Net debt to capitalization is a ratio defined as net debt divided by capitalization, with capitalization being the sum of net debt and shareholders’ equity. Current assets to current liabilities is defined as total current assets divided by total current liabilities. These key performance indicators are non-GAAP financial measures that do not have a standardized meaning and may not be comparable to similar measures used by other issuers. They are not recognized by IFRS; however, they are meaningful in that they indicate the Company’s ability to meet its obligations on an ongoing basis, and indicate whether the Company is more or less leveraged than in prior periods.
This MD&A contains statements that may constitute forward-looking statements under the applicable securities laws. Readers are cautioned against placing undue reliance on forward-looking statements. All statements herein, other than statements of historical fact, may be forward-looking statements and can be identified by the use of words such as “estimate”, “project”, “expect”, “anticipate”, “plan”, “intend”, “believe”, “seek”, “should”, “may”, “likely”, “pursue” and similar references to future periods. Forward-looking statements in this MD&A include, but are not limited to, statements relating to: our current intent, belief or expectations primarily with respect to market and general economic conditions, future costs, expenditures, available harvest levels and our future operating performance, objectives, capital expenditures and strategies. Although such statements reflect management’s current reasonable beliefs, expectations and assumptions as to, amongst other things, the future supply and demand of forest products, global and regional economic activity and the consistency of the regulatory framework, there can be no assurance that forward-looking statements are accurate, and actual results and performance may materially vary. Many factors could cause our actual results or performance to be materially different including: general economic conditions, international demand for lumber, competition and selling prices, international trade disputes, changes in foreign currency exchange rates, labour disruptions, natural disasters, relations with First Nations groups, changes in laws, the availability of allowable annual cut, regulations or public policy, changes in opportunities and other factors referenced under the “Risks and Uncertainties” section herein. The foregoing list is not exhaustive, as other factors could adversely affect our actual results and performance. Forward-looking statements are based only on information currently available to us and refer only as of the date hereof. Except as required by law, we undertake no obligation to update forward-looking statements.
Unless otherwise noted, the information in this discussion and analysis is updated to May 2, 2018.
1 Earnings Before Interest, Tax, Depreciation and Amortization
1
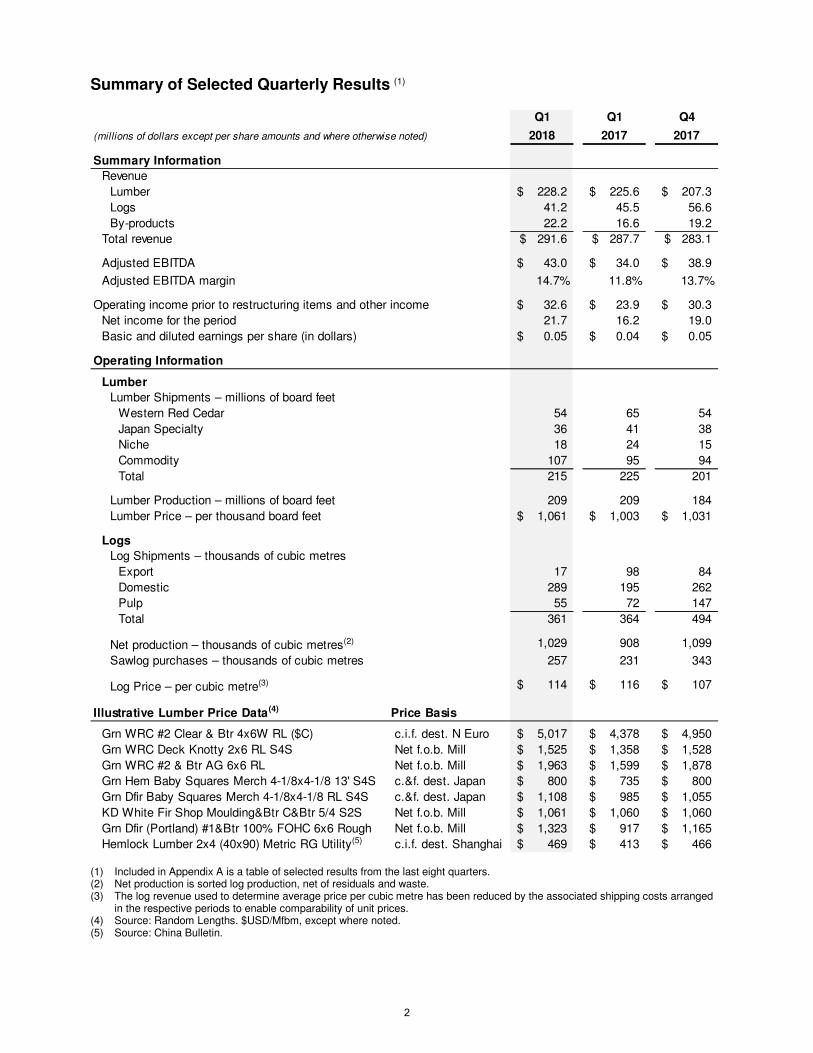
Summary of Selected Quarterly Results (1)
(1) Included in Appendix A is a table of selected results from the last eight quarters. (2) Net production is sorted log production, net of residuals and waste. (3) The log revenue used to determine average price per cubic metre has been reduced by the associated shipping costs arranged
in the respective periods to enable comparability of unit prices. (4) Source: Random Lengths. $USD/Mfbm, except where noted. (5) Source: China Bulletin.
Q1 Q1 Q4
(millions of dollars except per share amounts and where otherwise noted) 2018 2017 2017
Summary Information
Revenue
Lumber 228.2$ 225.6$ 207.3$
Logs 41.2 45.5 56.6
By-products 22.2 16.6 19.2
Total revenue 291.6$ 287.7$ 283.1$
Adjusted EBITDA 43.0$ 34.0$ 38.9$
Adjusted EBITDA margin 14.7% 11.8% 13.7%
Operating income prior to restructuring items and other income 32.6$ 23.9$ 30.3$
Net income for the period 21.7 16.2 19.0
Basic and diluted earnings per share (in dollars) 0.05$ 0.04$ 0.05$
Operating Information
Lumber
Lumber Shipments – millions of board feet
Western Red Cedar 54 65 54
Japan Specialty 36 41 38
Niche 18 24 15
Commodity 107 95 94
Total 215 225 201
Lumber Production – millions of board feet 209 209 184
Lumber Price – per thousand board feet 1,061$ 1,003$ 1,031$
Logs
Log Shipments – thousands of cubic metres
Export 17 98 84
Domestic 289 195 262
Pulp 55 72 147
Total 361 364 494
Net production – thousands of cubic metres(2) 1,029 908 1,099
Sawlog purchases – thousands of cubic metres 257 231 343
Log Price – per cubic metre(3) 114$ 116$ 107$
Illustrative Lumber Price Data(4) Price Basis
c.i.f. dest. N Euro 5,017$ 4,378$ 4,950$
Net f.o.b. Mill 1,525$ 1,358$ 1,528$
Net f.o.b. Mill 1,963$ 1,599$ 1,878$
c.&f. dest. Japan 800$ 735$ 800$
c.&f. dest. Japan 1,108$ 985$ 1,055$
Net f.o.b. Mill 1,061$ 1,060$ 1,060$
Net f.o.b. Mill 1,323$ 917$ 1,165$
c.i.f. dest. Shanghai 469$ 413$ 466$ Hemlock Lumber 2x4 (40x90) Metric RG Utility(5)
Grn WRC #2 Clear & Btr 4x6W RL ($C)
Grn WRC Deck Knotty 2x6 RL S4S
Grn WRC #2 & Btr AG 6x6 RL
Grn Hem Baby Squares Merch 4-1/8x4-1/8 13' S4S
Grn Dfir Baby Squares Merch 4-1/8x4-1/8 RL S4S
KD White Fir Shop Moulding&Btr C&Btr 5/4 S2S
Grn Dfir (Portland) #1&Btr 100% FOHC 6x6 Rough
2
Summary of First Quarter 2018 Results
We delivered first quarter adjusted EBITDA of $43.0 million in 2018, overcoming US lumber export duties of $9.7 million and rising stumpage costs. Operating income prior to restructuring items and other income increased to $32.6 million from $23.9 million in the same period last year. We leveraged improved log inventories to support higher sawmill uptime which delivered lower manufacturing costs.
Revenue
Lumber revenue was $228.2 million, compared to $225.6 million in the first quarter of 2017, as rising price realizations offset lower sales volumes. Strong global lumber demand drove a 6% increase in lumber price realizations despite a weaker sales mix and the impact of a stronger Canadian dollar (“CAD”), which was 4% higher on average against the United States dollar (“USD”). Commodity lumber increased to 50% of total lumber shipments in the first quarter of 2018, from 42% in the same quarter last year. The first quarter of 2017 included a higher mix of specialty lumber as we expedited the sale of US-bound lumber in anticipation of the application of export duties in April 2017.
First quarter log revenue was $41.2 million in 2018, a decrease of $4.3 million from the same period due to a weaker sales mix and the suspension of our export log sales program to supply our coastal sawmills.
By-products revenue increased to $22.2 million in the first quarter of 2018, from $16.6 million in the same period in 2017. Improved pulp markets drove a 36% increase in chip sales price realizations, which more than offset the impact of a stronger CAD in 2018.
Operating Costs
Lumber production was 209 million board feet, consistent with the first quarter of 2017 and 14% higher than the fourth quarter of 2017. In addition to our production volume, we provided 14 million board feet equivalent of custom cut manufacturing services for a key pulp customer in the first quarter of 2018. Increased sawmill uptime, the benefits of our margin improvement programs and a heavier mix of commodity lumber drove lower manufacturing costs quarter-over-quarter.
First quarter log production was 1,029,000 cubic metres, 13% higher than the same period last year, due to improved winter operating conditions. Rising stumpage rates and increased production from higher cost operations drove a 5% increase in harvest costs, which more than offset benefits of our simplified log sort optimization and other timberlands cost savings initiatives.
Low market log availability driven by poor operating conditions in 2017 and high coastal log export volumes have distorted coastal log market pricing, which serves as a primary input to coastal stumpage rates. As a result, first quarter 2018 stumpage rates have increased more than expected. The Provincial Government has raised concerns with export log sales which we anticipate may prompt favourable policy changes in support of supply for domestic sawmill manufacturing.
We supplemented our internal log supply with saw log purchases of 257,000 cubic metres, an 11% increase from the same quarter last year. Constrained domestic log supply led to higher market pricing for purchased logs.
Freight expense decreased by $5.8 million as compared to the first quarter of 2017, due to reduced export log freight expense and lower lumber sales volume. A stronger CAD largely offset rising USD-denominated fuel surcharges.
Western’s results for the first quarter of 2018 include $9.7 million of export duty expense, comprised of countervailing duty (“CVD”) and anti-dumping duty (“AD”), whereas no duties were applicable in the first quarter of 2017. We leveraged our margin-focused sales strategy by directing lumber sales to alternative markets to limit the impacts of duty on our business.
Selling and Administration Expense
First quarter selling and administration expense was $8.6 million in 2018 as compared to $8.4 million in the same period last year. Incremental expense was primarily due to investments in foundational systems and process improvements to support our growth strategy, as well as increased performance related compensation.
3
Net Income
Net income for the first quarter of 2018 was $21.7 million, as compared to $16.2 million for the same period of 2017. Improved revenue and operating margin drove an increased net income that was partly offset by export lumber duties and higher operating restructuring items.
Operating Restructuring Items
Included in $2.2 million of operating restructuring items in the first quarter of 2018 were $1.0 million in severance and related expenses attributable to ongoing business optimization initiatives, $0.6 million relating to the indefinite curtailment of our Somass sawmill, and $0.4 million incurred to retrain employees affected by the closure of the Englewood train announced November 7, 2017. We incurred $0.5 million in operating restructuring items in the first quarter of 2017.
Our Somass sawmill remains indefinitely curtailed as a result of rising costs associated with the US Softwood Lumber dispute and a fibre supply deficit arising from years of tenure takebacks and land use decisions. We are evaluating options to create a sustainable, long-term solution for the site, and we are considering the input of government, First Nations and other stakeholders.
Income Taxes
Current income tax expense of $0.1 million and deferred income tax expense of $8.0 million were recognized in net income in the first quarter of 2018, primarily relating to operating earnings. Total income tax expense was $6.3 million in the same quarter last year.
We continue to receive deferred treatment of Canadian income taxes due to outstanding non-capital loss carryforwards, which we expect to fully utilize in 2018.
4
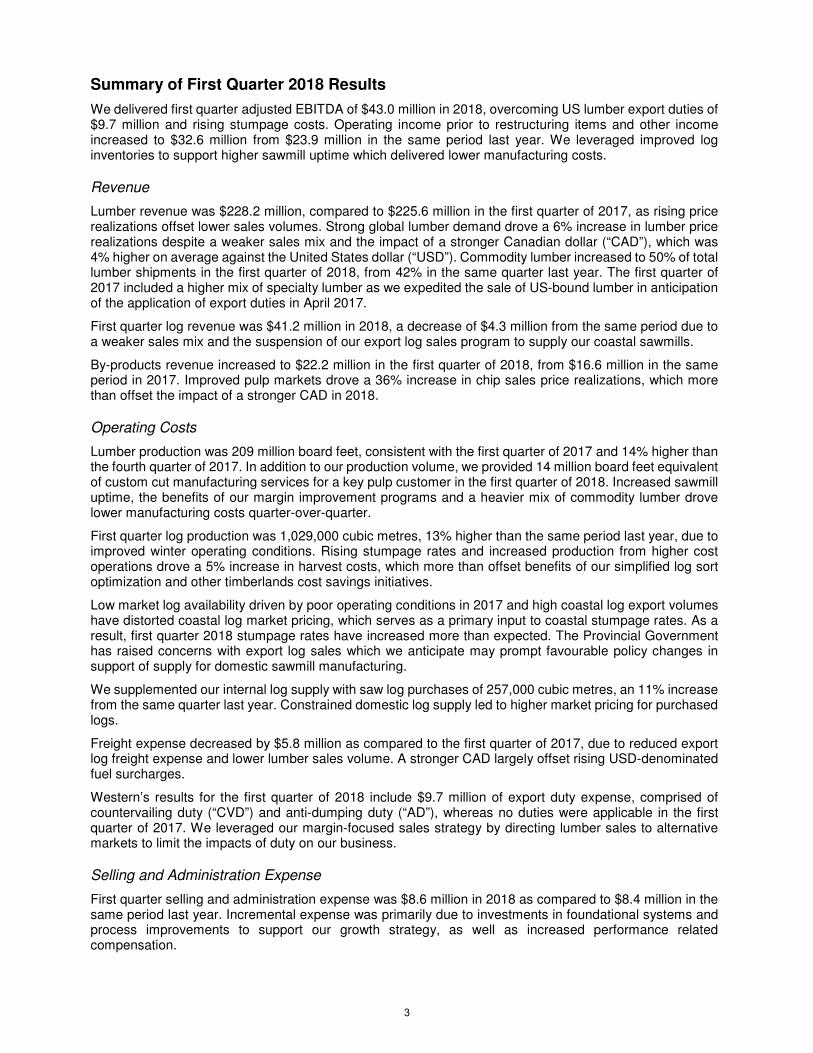
Financial Position and Liquidity
(1) Net debt (cash) is defined as the sum of long-term debt, current portion of long-term debt, revolving credit facility, less cash and cash equivalents.
(2) Total liquidity comprises cash and cash equivalents, and available credit under the Company’s revolving credit facility and revolving term loan.
(3) Capitalization comprises net debt and shareholders’ equity.
In the first three months of 2018, we invested $24.6 million in capital including the acquisition of operating assets in Arlington, Washington; returned $7.9 million to shareholders through quarterly dividends; repurchased shares equivalent to $1.6 million; and, increased our cash balance by $11.6 million.
Cash provided by operating activities during the first quarter of 2018 was $45.6 million, as compared to $67.9 million during the first quarter of 2017. We leveraged improved winter operating conditions in the first quarter of 2018 to replenish our log inventory volume. Cash provided by operating activities in the first quarter of 2017 was supplemented by a significant reduction in working capital due to reduced log inventory.
Q1 Q1 Q4
(millions of dollars except where otherwise noted) 2018 2017 2017
Selected Cash Flow Items
Operating Activities
Net income 21.7$ 16.2$ 19.0$
Amortization 9.8 8.6 9.4
Other 8.9 8.3 3.5
Subtotal 40.4 33.1 31.9
Change in non-cash working capital 5.2 34.8 (28.4)
Cash provided by (used in) operating activities 45.6$ 67.9$ 3.5$
Investing Activities
Additions to property, plant and equipment (22.6)$ (6.1)$ (19.0)$
Additions to capital logging roads (2.1) (3.3) (3.5)
Other 0.1 0.4 0.1
Cash provided by (used in) investing activities (24.6)$ (9.0)$ (22.4)$
Financing Activities
Repayment of debt -$ (35.0)$ -$
Dividends (7.9) (7.9) (7.9)
Share repurchases (1.6) - (2.7)
Other 0.1 (0.4) (0.4)
Cash provided by (used in) investing activities (9.4)$ (43.3)$ (11.0)$
Increase (decrease) in cash 11.6$ 15.6$ (29.9)$
Summary of Financial Position
Cash and cash equivalents 46.9$ 34.6$ 35.3$
Current assets 314.5 274.0 292.5
Current liabilities 126.9 117.7 107.8
Total debt - - -
Net debt (cash)(1) (46.9) (34.6) (35.3)
Shareholders' equity 574.4 530.5 562.7
Total liquidity (2) 280.9 268.7 269.3
Financial ratios:
Current assets to current liabilities 2.48 2.33 2.71
Net debt to capitalization (3) - - -
5
Cash used in investing activities was $24.6 million during the first quarter of 2018, as compared to $9.0 million invested during the same period of 2017. We invested $13.3 million in strategic capital in the first quarter, including $11.6 million related to the acquisition of our distribution and processing centre in Arlington, Washington. Our strategic capital program is discussed in more detail in the “Strategy and Outlook” section.
Cash used in financing activities was $9.4 million during the first quarter of 2018, as compared to cash used in financing activities of $43.3 million during the same period of 2017. Incremental cash used in financing activities in the comparative period reflects the repayment of all outstanding debt.
Liquidity
Total liquidity increased to $280.9 million at March 31, 2018, from $269.3 million at the end of 2017. Liquidity is comprised of cash and cash equivalents of $46.9 million, unused availability under the secured revolving credit facility of $124.0 million, and $110.0 million available under the revolving term loan facility. Based on our current forecasts, we expect sufficient liquidity will be available to meet our obligations in 2018.
Capital Allocation
Dividend Increase
On May 2, 2018, we announced a 12.5% increase in our quarterly dividend from $0.02 per Share to $0.0225 per Share. The quarterly dividend increase is effective immediately and is payable June 15, 2018 to shareholders of record on June 1, 2018. This dividend qualifies as an “eligible dividend” for Canadian income tax purposes.
Normal Course Issuer Bid
On August 2, 2017, we announced a normal course issuer bid permitting us to purchase and cancel up to 19,778,383 of our Common Shares (“Shares”) or approximately 5% of our Shares issued and outstanding.
During the three months ended March 31, 2018, we repurchased 623,435 Shares for cancellation at an average price of $2.59. We have purchased and cancelled a total of 1,702,435 Shares under the normal course issuer bid at an average price of $2.53 per Share, or $4.3 million in aggregate.
Strategy and Outlook
Western’s long-term business objective is to create superior value for shareholders by building a margin-focused log and lumber business of scale to compete successfully in global softwood markets. We believe this will be achieved by maximizing the sustainable utilization of our forest tenures, operating safe, efficient, low-cost manufacturing facilities and producing and selling high-value specialty products for global markets. We seek to manage our business with a focus on operating cash flow and maximizing the value of our fibre resource through the production cycle, from the planning of our logging operations to the production, marketing, sale and delivery of our log and lumber products. We routinely evaluate our performance using the measure Return on Capital Employed.
For more detail on our strategic initiatives and actions, refer to “Strategy and Outlook” in our management’s discussion and analysis for the year ended December 31, 2017.
Market Outlook
The gradual improvement in US new home construction, and the continued strength of the repair and renovation segment, combined with the increased use of lumber in China are expected to continue to drive demand for our log and lumber products. We expect near-term pricing to be positively influenced by the spring building season.
North American demand for our Western Red Cedar (“WRC”) products continues to be supported by robust repair and renovation spending. Pricing for our targeted specialty products is expected to remain strong. As anticipated, lumber pricing in Japan has improved due to a combination of steady demand and low inventories. Demand and pricing for our Niche products is expected to move higher as markets adjust to the ongoing application of US export lumber duties.
6
The domestic saw log market remains undersupplied despite a 28% increase in coastal log production over the first quarter of 2017, as reported by the Province of BC’s Harvest Billing System. Strong domestic saw log demand is expected to support pricing despite seasonally increased production as we move through the second quarter. Demand for small-diameter saw logs and pulp logs will remain strong as pulp mills seek additional sources of fibre to capitalize on resilient pulp markets.
Softwood Lumber Dispute and US Market Update
On January 3, 2018, US Department of Commerce (“DoC”) published amended final determinations, resulting in reduced, final CVD and AD rates of 14.19% and 6.04% respectively for “all other” Canadian lumber producers including Western.
During the first quarter of 2018, we expensed $6.8 million of CVD and $2.9 million of AD for a total of $9.7 million, as compared to nil in the first quarter of 2017. To March 31, 2018, we have paid total CVD and AD of $26.5 million since the latest imposition of export lumber duties by the United States beginning in April 2017.
Our shipments to the US market are predominantly high-value, appearance grade lumber, representing less than 25% of Western’s total revenue in 2017. Continued strong demand and a lack of supply has supported ongoing improvements in our specialty lumber product pricing, partly offsetting the impact of duties.
The US application of duties continues a long-standing pattern of US protectionist action against Canadian lumber producers. We disagree with the US trade determination and the inclusion of specialty lumber products in this commodity lumber focused dispute.
Our recent acquisition of a distribution and processing centre in Arlington, Washington is expected to assist in mitigating the damaging effects of duties on our products destined for the US market while increasing US market sales. We intend to preserve our strong balance sheet and leverage our flexible operating platform to continue to overcome any challenges that arise from this trade dispute.
For a more detailed timeline of recent history of the softwood lumber dispute, refer to “Risks and Uncertainties – Softwood Lumber Dispute” in our management’s discussion and analysis for the year ended December 31, 2017.
Strategic Capital Program Update
We continue to implement a strategic capital program that is designed to position Western as the only company capable of sustainably consuming the complete profile of the coastal forest and competitively manufacturing a diverse product mix for global markets.
Our strategic capital program is focused on the installation of technology that will deliver top quartile performance and improve our ability to manufacture targeted products that yield the best margin. In addition to investments in our manufacturing assets, we also allocate capital to strategic, high-return projects involving our information systems, timberlands assets, and forest inventories.
In the first quarter of 2018, we acquired a distribution and processing centre in Arlington, Washington and commenced the first phase of planned capital upgrades at that facility. We continued to make advancements with the auto-grading component of our Duke Point planer rebuild. We also made significant progress in the start-up of the timber deck enhancements at our Chemainus sawmill. That timber deck investment will support incremental production of high-value, appearance-grade timbers. In addition, we began a number of small, high-return capital projects at our other operations.
7
Non-GAAP Measures
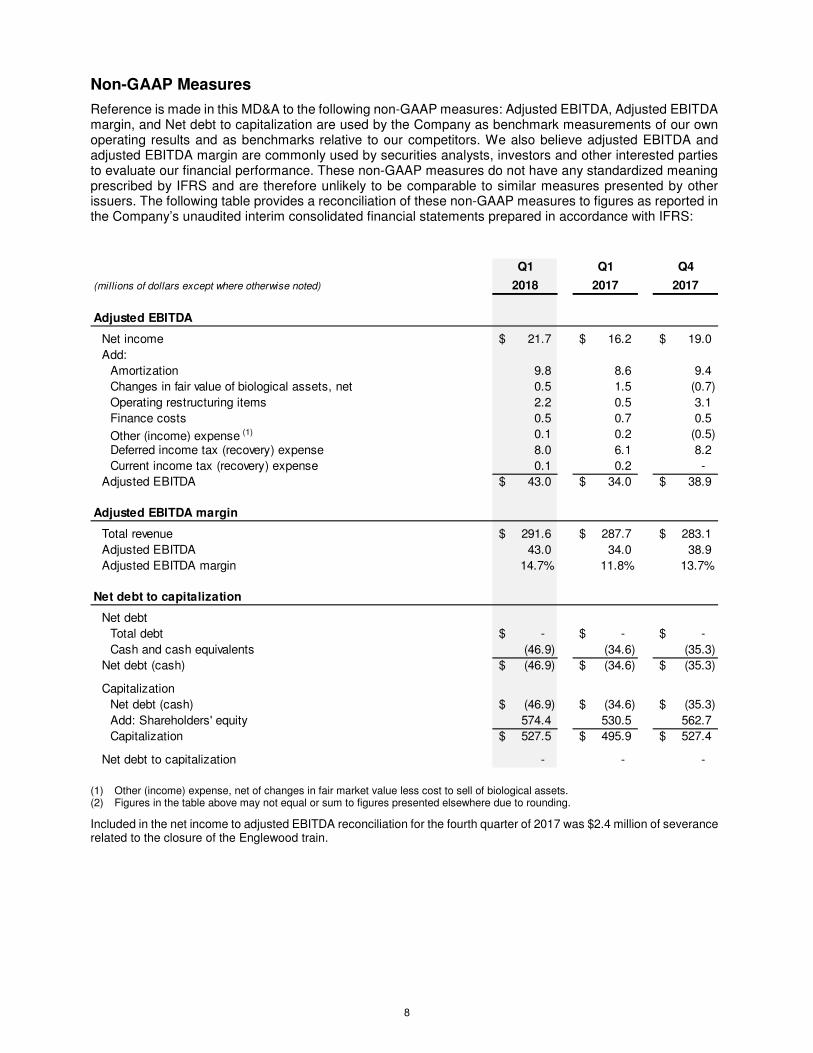
Reference is made in this MD&A to the following non-GAAP measures: Adjusted EBITDA, Adjusted EBITDA margin, and Net debt to capitalization are used by the Company as benchmark measurements of our own operating results and as benchmarks relative to our competitors. We also believe adjusted EBITDA and adjusted EBITDA margin are commonly used by securities analysts, investors and other interested parties to evaluate our financial performance. These non-GAAP measures do not have any standardized meaning prescribed by IFRS and are therefore unlikely to be comparable to similar measures presented by other issuers. The following table provides a reconciliation of these non-GAAP measures to figures as reported in the Company’s unaudited interim consolidated financial statements prepared in accordance with IFRS:
(1) Other (income) expense, net of changes in fair market value less cost to sell of biological assets. (2) Figures in the table above may not equal or sum to figures presented elsewhere due to rounding.
Included in the net income to adjusted EBITDA reconciliation for the fourth quarter of 2017 was $2.4 million of severance related to the closure of the Englewood train.
Q1 Q1 Q4
(millions of dollars except where otherwise noted) 2018 2017 2017
Adjusted EBITDA
Net income 21.7$ 16.2$ 19.0$
Add:
Amortization 9.8 8.6 9.4
Changes in fair value of biological assets, net 0.5 1.5 (0.7)
Operating restructuring items 2.2 0.5 3.1
Finance costs 0.5 0.7 0.5
Other (income) expense (1) 0.1 0.2 (0.5)
Deferred income tax (recovery) expense 8.0 6.1 8.2
Current income tax (recovery) expense 0.1 0.2 -
Adjusted EBITDA 43.0$ 34.0$ 38.9$
Adjusted EBITDA margin
Total revenue 291.6$ 287.7$ 283.1$
Adjusted EBITDA 43.0 34.0 38.9
Adjusted EBITDA margin 14.7% 11.8% 13.7%
Net debt to capitalization
Net debt
Total debt -$ -$ -$
Cash and cash equivalents (46.9) (34.6) (35.3)
Net debt (cash) (46.9)$ (34.6)$ (35.3)$
Capitalization
Net debt (cash) (46.9)$ (34.6)$ (35.3)$
Add: Shareholders' equity 574.4 530.5 562.7
Capitalization 527.5$ 495.9$ 527.4$
Net debt to capitalization - - -
8
Accounting Policies and Standards
Please refer to Note 3 of our unaudited condensed consolidated interim financial statements for the three months ended March 31, 2018 for further information on the new accounting standards referenced below.
New Accounting Standards
The Company has adopted the following standards with a date of initial application of January 1, 2018, which had no significant impact on the Company’s interim financial statements:
• IFRS 15, Revenue from Contracts with Customers
• IFRS 9, Financial Instruments
Accounting Standards Not Yet Applied
A number of new and amended IFRS standards are not yet effective for the year ended December 31, 2018 and have not been applied in preparing these interim financial statements. IFRS 16 Leases is considered by the Company to be the most significant of several pronouncements that may affect future financial statements. The Company intends to adopt IFRS 16 in its consolidated financial statements for the year commencing January 1, 2019. The extent of the impact of adoption of the standard has not yet been determined.
Critical Accounting Estimates
For a review of significant management judgements affecting financial results and critical accounting estimates, please see our 2017 Annual reporting, which can be found on SEDAR at www.sedar.com.
Risks and Uncertainties
The business of the Company is subject to a number of risks and uncertainties, including those described in the 2017 Annual Report which can be found on SEDAR at www.sedar.com. Any of the risks and uncertainties described in the above-noted document could have a material adverse effect on our operations and financial condition and cash flows and, accordingly, should be carefully considered in evaluating Western’s business.
Evaluation of Disclosure Controls and Procedures
There have been no changes in the Company’s internal controls over financial reporting (“ICFR”) during the three months ended March 31, 2018, that have materially affected or are reasonably likely to materially affect, its ICFR.
In the three months ended March 31, 2018, we completed the acquisition of a distribution and processing centre in Arlington, Washington, and we have completed introductory Western safety and controls training at the facility.
Outstanding Share Data
As of May 2, 2018, there were 394,812,657 Common Shares of the Company issued and outstanding.
We have reserved 20,000,000 of our Shares for issuance upon the exercise of options granted under our incentive stock option plan, and have requested shareholder approval at our upcoming annual meeting to reserve an additional 10,000,000 Shares for issuance upon the exercise of options granted under our incentive stock option plan. During the three months ended March 31, 2018, 1,235,788 options were granted and 660,000 previously granted options were exercised. As of May 2, 2018, 12,294,271 options were outstanding under our incentive stock option plan.
Additional Information
Additional information relating to the Company and its operations, including the Company’s Annual Information Form, can be found on SEDAR at www.sedar.com.
9
Management’s Discussion and Analysis – Appendix A
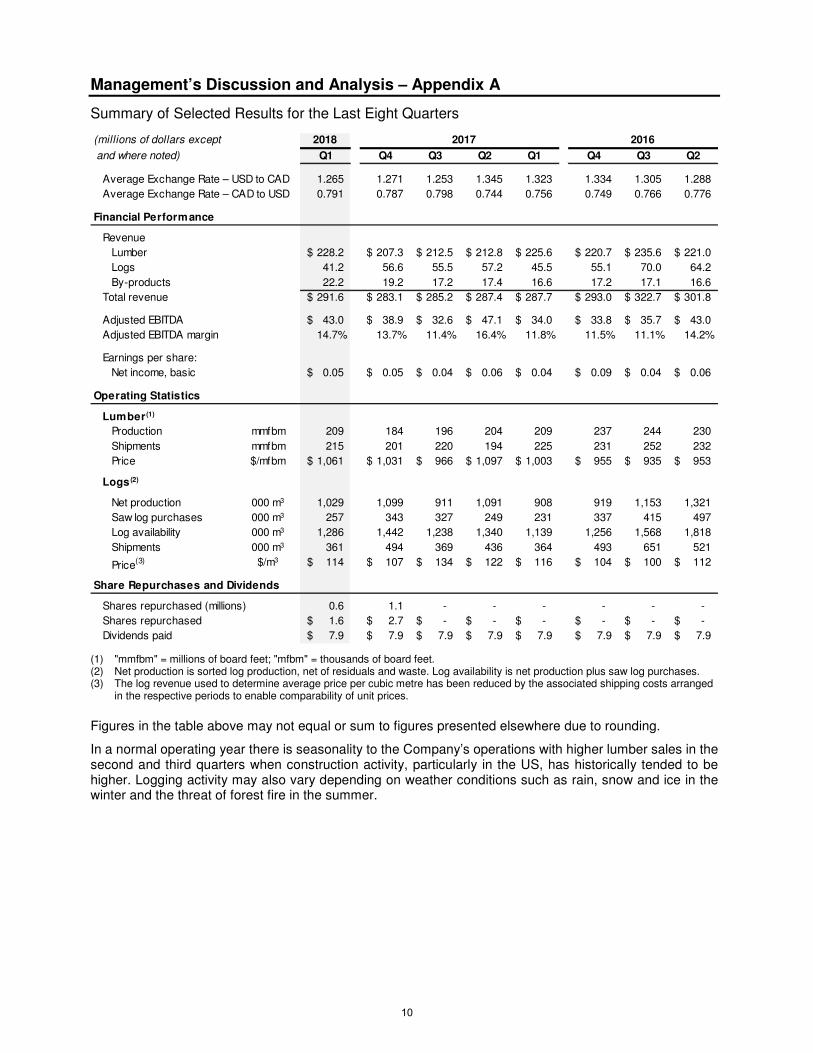
Summary of Selected Results for the Last Eight Quarters
(1) "mmfbm" = millions of board feet; "mfbm" = thousands of board feet. (2) Net production is sorted log production, net of residuals and waste. Log availability is net production plus saw log purchases. (3) The log revenue used to determine average price per cubic metre has been reduced by the associated shipping costs arranged
in the respective periods to enable comparability of unit prices.
Figures in the table above may not equal or sum to figures presented elsewhere due to rounding.
In a normal operating year there is seasonality to the Company’s operations with higher lumber sales in the second and third quarters when construction activity, particularly in the US, has historically tended to be higher. Logging activity may also vary depending on weather conditions such as rain, snow and ice in the winter and the threat of forest fire in the summer.
2018 2017 2016
Q1 Q4 Q3 Q2 Q1 Q4 Q3 Q2
Average Exchange Rate – USD to CAD 1.265 1.271 1.253 1.345 1.323 1.334 1.305 1.288
Average Exchange Rate – CAD to USD 0.791 0.787 0.798 0.744 0.756 0.749 0.766 0.776
Financial Performance
Revenue
Lumber 228.2$ 207.3$ 212.5$ 212.8$ 225.6$ 220.7$ 235.6$ 221.0$
Logs 41.2 56.6 55.5 57.2 45.5 55.1 70.0 64.2
By-products 22.2 19.2 17.2 17.4 16.6 17.2 17.1 16.6
Total revenue 291.6$ 283.1$ 285.2$ 287.4$ 287.7$ 293.0$ 322.7$ 301.8$
Adjusted EBITDA 43.0$ 38.9$ 32.6$ 47.1$ 34.0$ 33.8$ 35.7$ 43.0$
Adjusted EBITDA margin 14.7% 13.7% 11.4% 16.4% 11.8% 11.5% 11.1% 14.2%
Earnings per share:
Net income, basic 0.05$ 0.05$ 0.04$ 0.06$ 0.04$ 0.09$ 0.04$ 0.06$
Operating Statistics
Lumber (1)
Production mmfbm 209 184 196 204 209 237 244 230
Shipments mmfbm 215 201 220 194 225 231 252 232
Price $/mfbm 1,061$ 1,031$ 966$ 1,097$ 1,003$ 955$ 935$ 953$
Logs (2)
Net production 000 m3 1,029 1,099 911 1,091 908 919 1,153 1,321
Saw log purchases 000 m3 257 343 327 249 231 337 415 497
Log availability 000 m3 1,286 1,442 1,238 1,340 1,139 1,256 1,568 1,818
Shipments 000 m3 361 494 369 436 364 493 651 521
Price(3) $/m3 114$ 107$ 134$ 122$ 116$ 104$ 100$ 112$
Share Repurchases and Dividends
Shares repurchased (millions) 0.6 1.1 - - - - - -
Shares repurchased 1.6$ 2.7$ -$ -$ -$ -$ -$ -$
Dividends paid 7.9$ 7.9$ 7.9$ 7.9$ 7.9$ 7.9$ 7.9$ 7.9$
and where noted)
(millions of dollars except
10
Western Forest Products Inc.
Unaudited Condensed Consolidated Interim Financial Statements For the three months ended March 31, 2018 and 2017
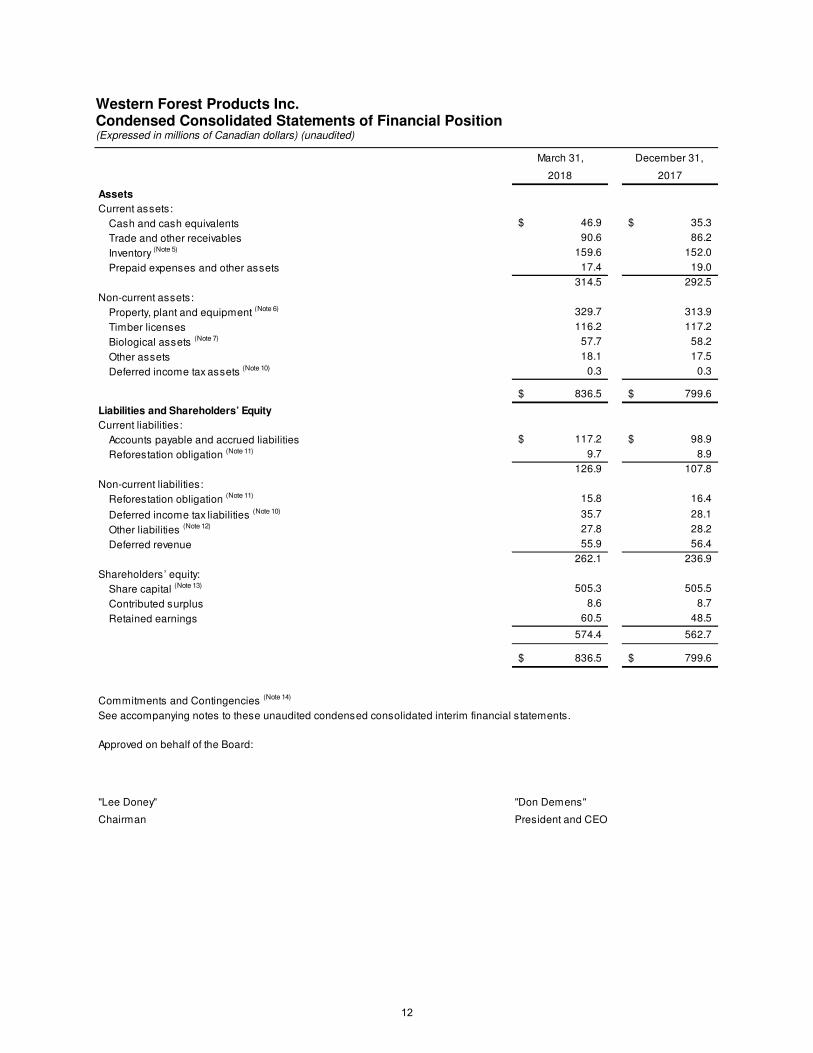
Western Forest Products Inc. Condensed Consolidated Statements of Financial Position (Expressed in millions of Canadian dollars) (unaudited)
March 31, December 31,
2018 2017
Assets
Current assets:
Cash and cash equivalents 46.9$ 35.3$
Trade and other receivables 90.6 86.2
Inventory (Note 5) 159.6 152.0
Prepaid expenses and other assets 17.4 19.0
314.5 292.5
Non-current assets:
Property, plant and equipment (Note 6) 329.7 313.9
Timber licenses 116.2 117.2
Biological assets (Note 7) 57.7 58.2
Other assets 18.1 17.5
Deferred income tax assets (Note 10) 0.3 0.3
836.5$ 799.6$
Liabilities and Shareholders’ Equity
Current liabilities:
Accounts payable and accrued liabilities 117.2$ 98.9$
Reforestation obligation (Note 11) 9.7 8.9
126.9 107.8
Non-current liabilities:
Reforestation obligation (Note 11) 15.8 16.4
Deferred income tax liabilities (Note 10) 35.7 28.1
Other liabilities (Note 12) 27.8 28.2
Deferred revenue 55.9 56.4
262.1 236.9
Shareholders’ equity:
Share capital (Note 13) 505.3 505.5
Contributed surplus 8.6 8.7
Retained earnings 60.5 48.5
574.4 562.7
836.5$ 799.6$
Commitments and Contingencies (Note 14)
See accompanying notes to these unaudited condensed consolidated interim financial statements.
Approved on behalf of the Board:
"Lee Doney" "Don Demens"
Chairman President and CEO
12
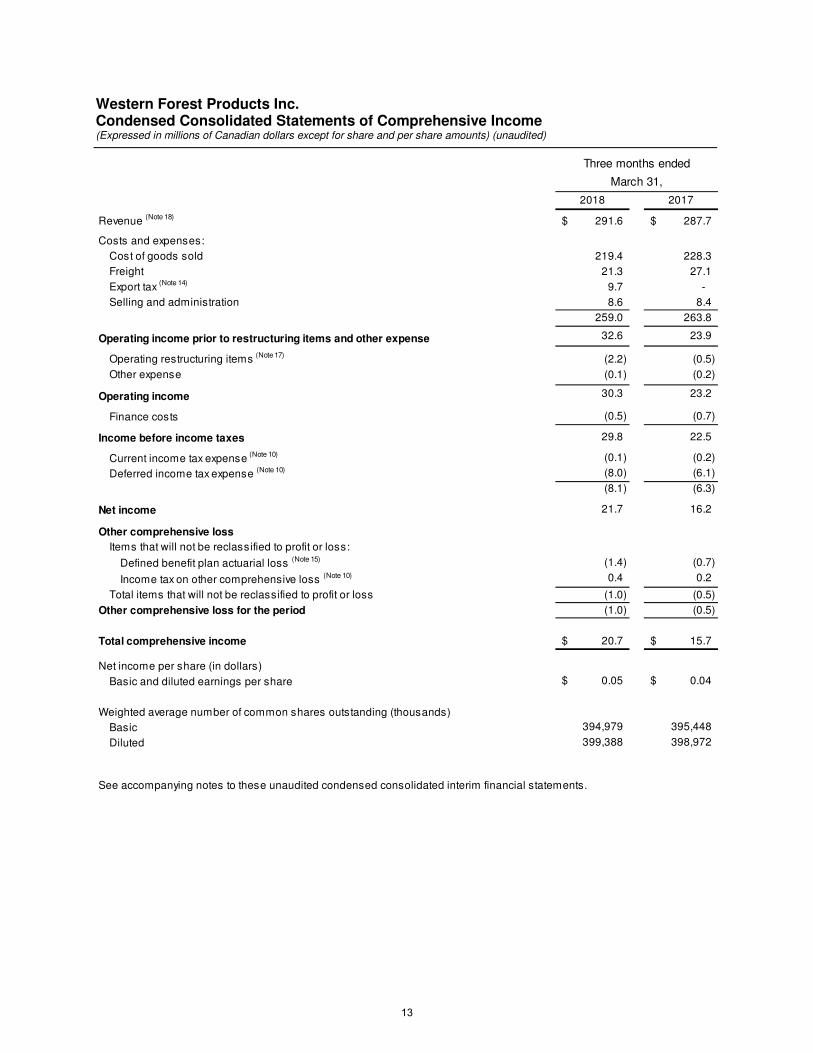
Western Forest Products Inc. Condensed Consolidated Statements of Comprehensive Income (Expressed in millions of Canadian dollars except for share and per share amounts) (unaudited)
Three months ended
March 31,
2018 2017
Revenue (Note 18) 291.6$ 287.7$
Costs and expenses:
Cost of goods sold 219.4 228.3
Freight 21.3 27.1
Export tax (Note 14) 9.7 -
Selling and administration 8.6 8.4
259.0 263.8
Operating income prior to restructuring items and other expense 32.6 23.9
Operating restructuring items (Note 17) (2.2) (0.5)
Other expense (0.1) (0.2)
Operating income 30.3 23.2
Finance costs (0.5) (0.7)
Income before income taxes 29.8 22.5
Current income tax expense (Note 10) (0.1) (0.2)
Deferred income tax expense (Note 10) (8.0) (6.1)
(8.1) (6.3)
Net income 21.7 16.2
Other comprehensive loss
Items that will not be reclassified to profit or loss:
Defined benefit plan actuarial loss (Note 15) (1.4) (0.7)
Income tax on other comprehensive loss (Note 10) 0.4 0.2
Total items that will not be reclassified to profit or loss (1.0) (0.5)
Other comprehensive loss for the period (1.0) (0.5)
Total comprehensive income 20.7$ 15.7$
Net income per share (in dollars)
Basic and diluted earnings per share 0.05$ 0.04$
Weighted average number of common shares outstanding (thousands)
Basic 394,979 395,448
Diluted 399,388 398,972
See accompanying notes to these unaudited condensed consolidated interim financial statements.
13
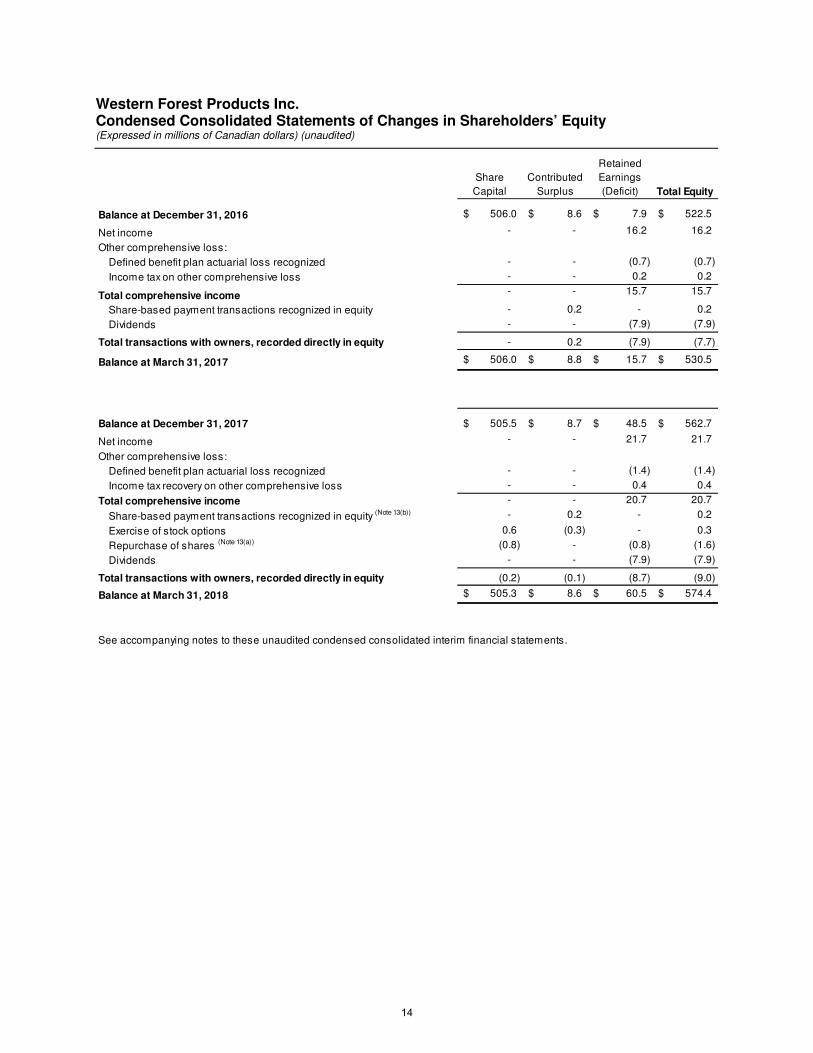
Western Forest Products Inc. Condensed Consolidated Statements of Changes in Shareholders’ Equity (Expressed in millions of Canadian dollars) (unaudited)
Share
Capital
Contributed
Surplus
Retained
Earnings
(Deficit) Total Equity
Balance at December 31, 2016 506.0$ 8.6$ 7.9$ 522.5$
Net income - - 16.2 16.2
Other comprehensive loss:
Defined benefit plan actuarial loss recognized - - (0.7) (0.7)
Income tax on other comprehensive loss - - 0.2 0.2
Total comprehensive income - - 15.7 15.7
Share-based payment transactions recognized in equity - 0.2 - 0.2
Dividends - - (7.9) (7.9)
- 0.2 (7.9) (7.7)
Balance at March 31, 2017 506.0$ 8.8$ 15.7$ 530.5$
Balance at December 31, 2017 505.5$ 8.7$ 48.5$ 562.7$
Net income - - 21.7 21.7
Other comprehensive loss:
Defined benefit plan actuarial loss recognized - - (1.4) (1.4)
Income tax recovery on other comprehensive loss - - 0.4 0.4
Total comprehensive income - - 20.7 20.7
Share-based payment transactions recognized in equity (Note 13(b)) - 0.2 - 0.2
Exercise of stock options 0.6 (0.3) - 0.3
Repurchase of shares (Note 13(a)) (0.8) - (0.8) (1.6)
Dividends - - (7.9) (7.9)
(0.2) (0.1) (8.7) (9.0)
Balance at March 31, 2018 505.3$ 8.6$ 60.5$ 574.4$
See accompanying notes to these unaudited condensed consolidated interim financial statements.
Total transactions with owners, recorded directly in equity
Total transactions with owners, recorded directly in equity
14
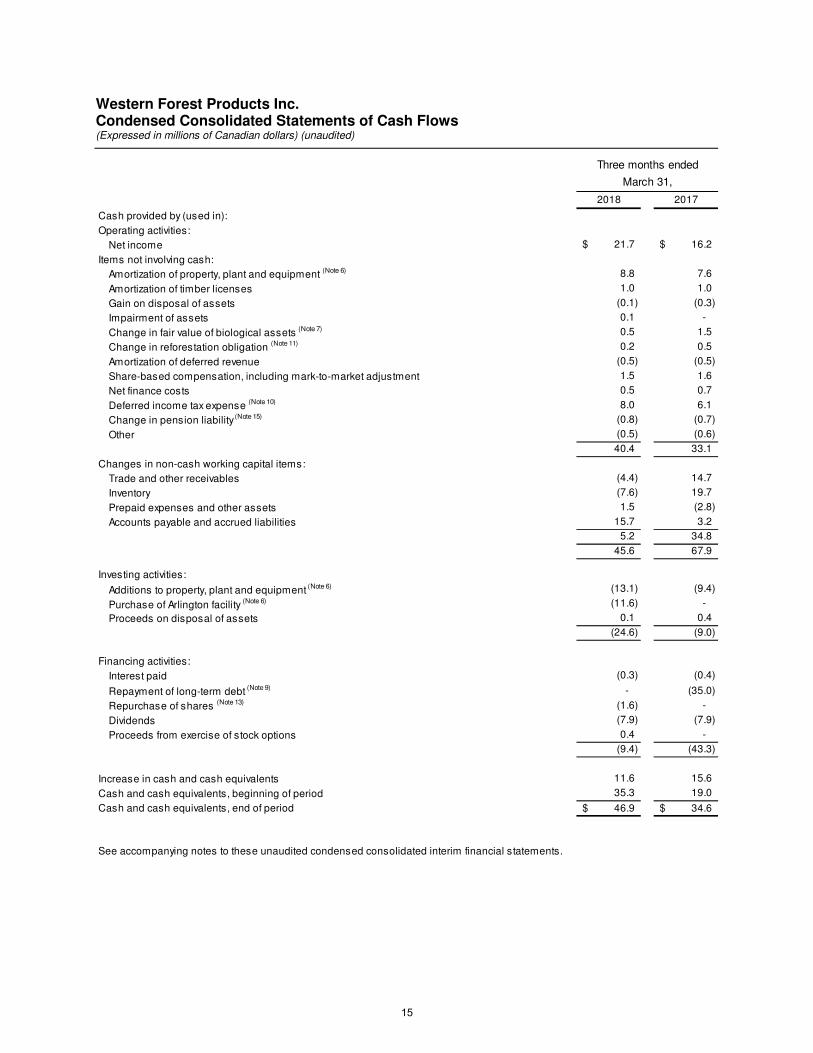
Western Forest Products Inc. Condensed Consolidated Statements of Cash Flows (Expressed in millions of Canadian dollars) (unaudited)
Three months ended
March 31,
2018 2017
Cash provided by (used in):
Operating activities:
Net income from continuing operations 21.7$ 16.2$
Items not involving cash:
Amortization of property, plant and equipment (Note 6) 8.8 7.6
Amortization of timber licenses 1.0 1.0
Gain on disposal of assets (0.1) (0.3)
Impairment of assets 0.1 -
Change in fair value of biological assets (Note 7) 0.5 1.5
Change in reforestation obligation (Note 11) 0.2 0.5
Amortization of deferred revenue (0.5) (0.5)
Share-based compensation, including mark-to-market adjustment 1.5 1.6
Net finance costs 0.5 0.7
Deferred income tax expense (Note 10) 8.0 6.1
Change in pension liability (Note 15) (0.8) (0.7)
Other (0.5) (0.6)
40.4 33.1
Changes in non-cash working capital items:
Trade and other receivables (4.4) 14.7
Inventory (7.6) 19.7
Prepaid expenses and other assets 1.5 (2.8)
Accounts payable and accrued liabilities 15.7 3.2
5.2 34.8
45.6 67.9
Investing activities:
Additions to property, plant and equipment (Note 6) (13.1) (9.4)
Purchase of Arlington facility (Note 6) (11.6) -
Proceeds on disposal of assets 0.1 0.4
(24.6) (9.0)
Financing activities:
Interest paid (0.3) (0.4)
Repayment of long-term debt (Note 9) - (35.0)
Repurchase of shares (Note 13) (1.6) -
Dividends (7.9) (7.9)
Proceeds from exercise of stock options 0.4 -
(9.4) (43.3)
Increase in cash and cash equivalents 11.6 15.6
Cash and cash equivalents, beginning of period 35.3 19.0
Cash and cash equivalents, end of period 46.9$ 34.6$
See accompanying notes to these unaudited condensed consolidated interim financial statements.
15
Western Forest Products Inc. Notes to the Unaudited Condensed Consolidated Interim Financial Statements Three months ended March 31, 2018 and 2017 (Tabular amounts expressed in millions of Canadian dollars except number of shares and per share amounts)
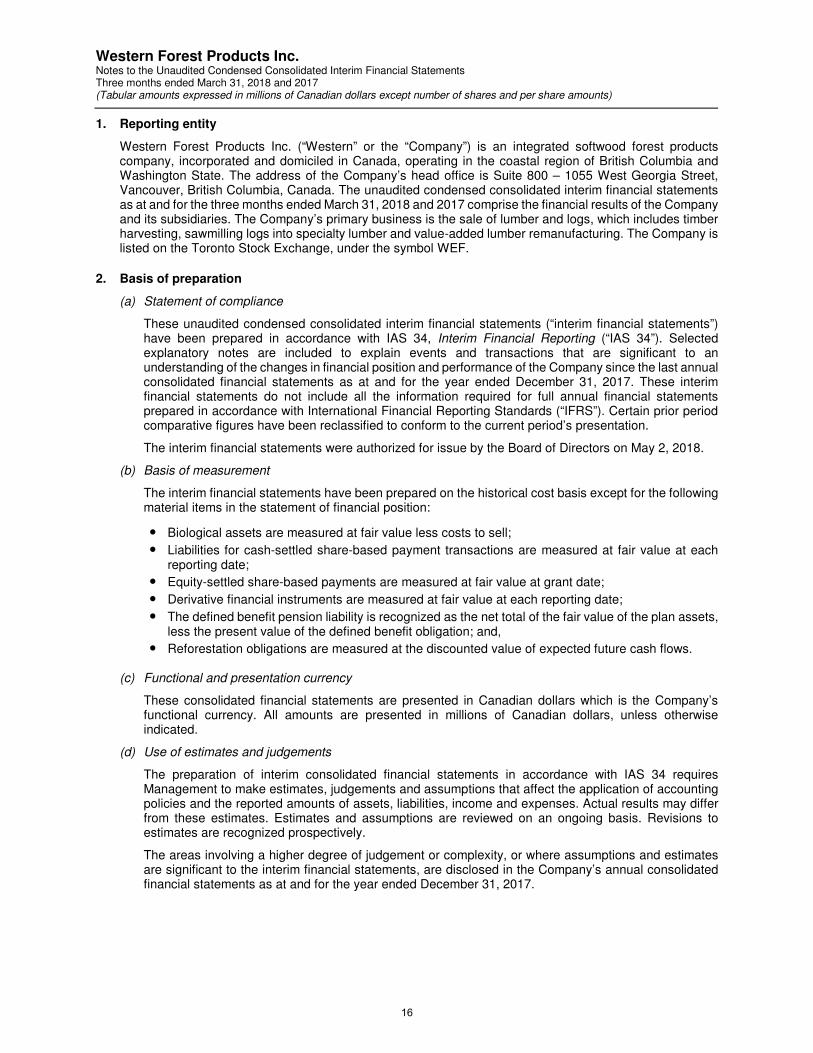
1. Reporting entity
Western Forest Products Inc. (“Western” or the “Company”) is an integrated softwood forest products company, incorporated and domiciled in Canada, operating in the coastal region of British Columbia and Washington State. The address of the Company’s head office is Suite 800 – 1055 West Georgia Street, Vancouver, British Columbia, Canada. The unaudited condensed consolidated interim financial statements as at and for the three months ended March 31, 2018 and 2017 comprise the financial results of the Company and its subsidiaries. The Company’s primary business is the sale of lumber and logs, which includes timber harvesting, sawmilling logs into specialty lumber and value-added lumber remanufacturing. The Company is listed on the Toronto Stock Exchange, under the symbol WEF.
2. Basis of preparation
(a) Statement of compliance
These unaudited condensed consolidated interim financial statements (“interim financial statements”) have been prepared in accordance with IAS 34, Interim Financial Reporting (“IAS 34”). Selected explanatory notes are included to explain events and transactions that are significant to an understanding of the changes in financial position and performance of the Company since the last annual consolidated financial statements as at and for the year ended December 31, 2017. These interim financial statements do not include all the information required for full annual financial statements prepared in accordance with International Financial Reporting Standards (“IFRS”). Certain prior period comparative figures have been reclassified to conform to the current period’s presentation.
The interim financial statements were authorized for issue by the Board of Directors on May 2, 2018.
(b) Basis of measurement
The interim financial statements have been prepared on the historical cost basis except for the following material items in the statement of financial position:
• Biological assets are measured at fair value less costs to sell;
• Liabilities for cash-settled share-based payment transactions are measured at fair value at each reporting date;
• Equity-settled share-based payments are measured at fair value at grant date;
• Derivative financial instruments are measured at fair value at each reporting date;
• The defined benefit pension liability is recognized as the net total of the fair value of the plan assets, less the present value of the defined benefit obligation; and,
• Reforestation obligations are measured at the discounted value of expected future cash flows.
(c) Functional and presentation currency
These consolidated financial statements are presented in Canadian dollars which is the Company’s functional currency. All amounts are presented in millions of Canadian dollars, unless otherwise indicated.
(d) Use of estimates and judgements
The preparation of interim consolidated financial statements in accordance with IAS 34 requires Management to make estimates, judgements and assumptions that affect the application of accounting policies and the reported amounts of assets, liabilities, income and expenses. Actual results may differ from these estimates. Estimates and assumptions are reviewed on an ongoing basis. Revisions to estimates are recognized prospectively.
The areas involving a higher degree of judgement or complexity, or where assumptions and estimates are significant to the interim financial statements, are disclosed in the Company’s annual consolidated financial statements as at and for the year ended December 31, 2017.
16
Western Forest Products Inc. Notes to the Unaudited Condensed Consolidated Interim Financial Statements Three months ended March 31, 2018 and 2017 (Tabular amounts expressed in millions of Canadian dollars except number of shares and per share amounts)
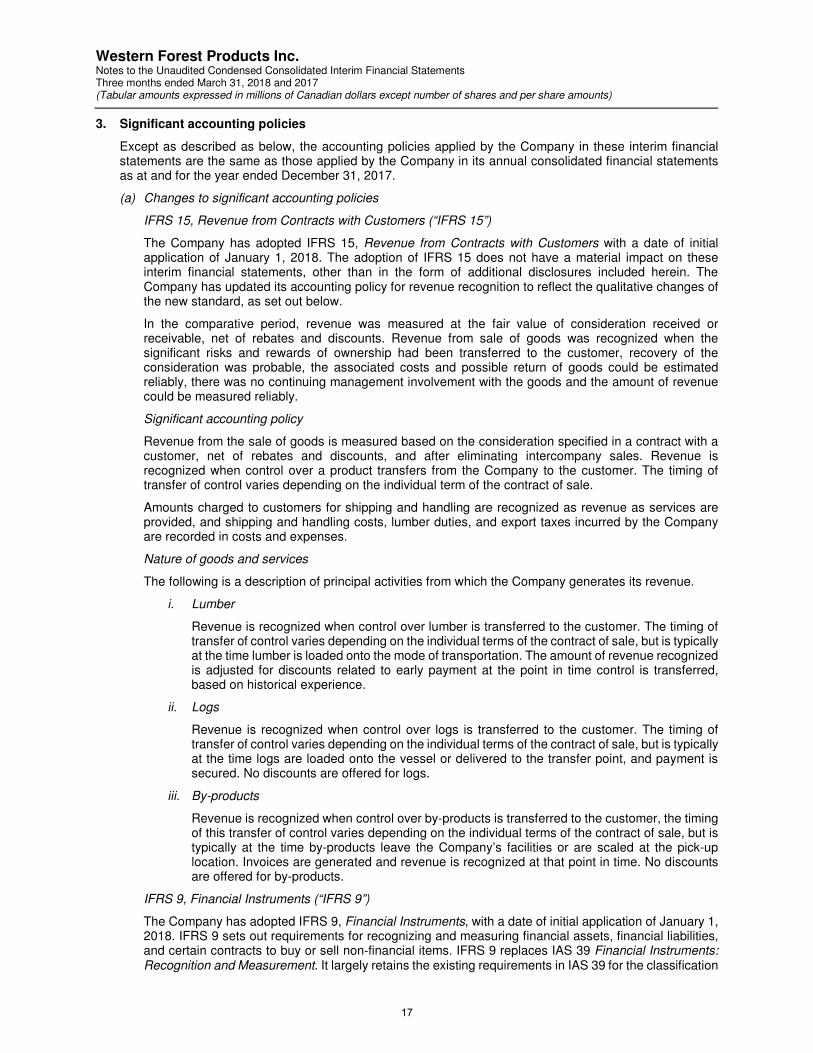
3. Significant accounting policies
Except as described as below, the accounting policies applied by the Company in these interim financial statements are the same as those applied by the Company in its annual consolidated financial statements as at and for the year ended December 31, 2017.
(a) Changes to significant accounting policies
IFRS 15, Revenue from Contracts with Customers (“IFRS 15”)
The Company has adopted IFRS 15, Revenue from Contracts with Customers with a date of initial application of January 1, 2018. The adoption of IFRS 15 does not have a material impact on these interim financial statements, other than in the form of additional disclosures included herein. The Company has updated its accounting policy for revenue recognition to reflect the qualitative changes of the new standard, as set out below.
In the comparative period, revenue was measured at the fair value of consideration received or receivable, net of rebates and discounts. Revenue from sale of goods was recognized when the significant risks and rewards of ownership had been transferred to the customer, recovery of the consideration was probable, the associated costs and possible return of goods could be estimated reliably, there was no continuing management involvement with the goods and the amount of revenue could be measured reliably.
Significant accounting policy
Revenue from the sale of goods is measured based on the consideration specified in a contract with a customer, net of rebates and discounts, and after eliminating intercompany sales. Revenue is recognized when control over a product transfers from the Company to the customer. The timing of transfer of control varies depending on the individual term of the contract of sale.
Amounts charged to customers for shipping and handling are recognized as revenue as services are provided, and shipping and handling costs, lumber duties, and export taxes incurred by the Company are recorded in costs and expenses.
Nature of goods and services
The following is a description of principal activities from which the Company generates its revenue.
i. Lumber
Revenue is recognized when control over lumber is transferred to the customer. The timing of transfer of control varies depending on the individual terms of the contract of sale, but is typically at the time lumber is loaded onto the mode of transportation. The amount of revenue recognized is adjusted for discounts related to early payment at the point in time control is transferred, based on historical experience.
ii. Logs
Revenue is recognized when control over logs is transferred to the customer. The timing of transfer of control varies depending on the individual terms of the contract of sale, but is typically at the time logs are loaded onto the vessel or delivered to the transfer point, and payment is secured. No discounts are offered for logs.
iii. By-products
Revenue is recognized when control over by-products is transferred to the customer, the timing of this transfer of control varies depending on the individual terms of the contract of sale, but is typically at the time by-products leave the Company’s facilities or are scaled at the pick-up location. Invoices are generated and revenue is recognized at that point in time. No discounts are offered for by-products.
IFRS 9, Financial Instruments (“IFRS 9”)
The Company has adopted IFRS 9, Financial Instruments, with a date of initial application of January 1, 2018. IFRS 9 sets out requirements for recognizing and measuring financial assets, financial liabilities, and certain contracts to buy or sell non‐financial items. IFRS 9 replaces IAS 39 Financial Instruments: Recognition and Measurement. It largely retains the existing requirements in IAS 39 for the classification
17
Western Forest Products Inc. Notes to the Unaudited Condensed Consolidated Interim Financial Statements Three months ended March 31, 2018 and 2017 (Tabular amounts expressed in millions of Canadian dollars except number of shares and per share amounts)
3. Significant accounting policies (continued)
(a) Changes to significant accounting policies (continued)
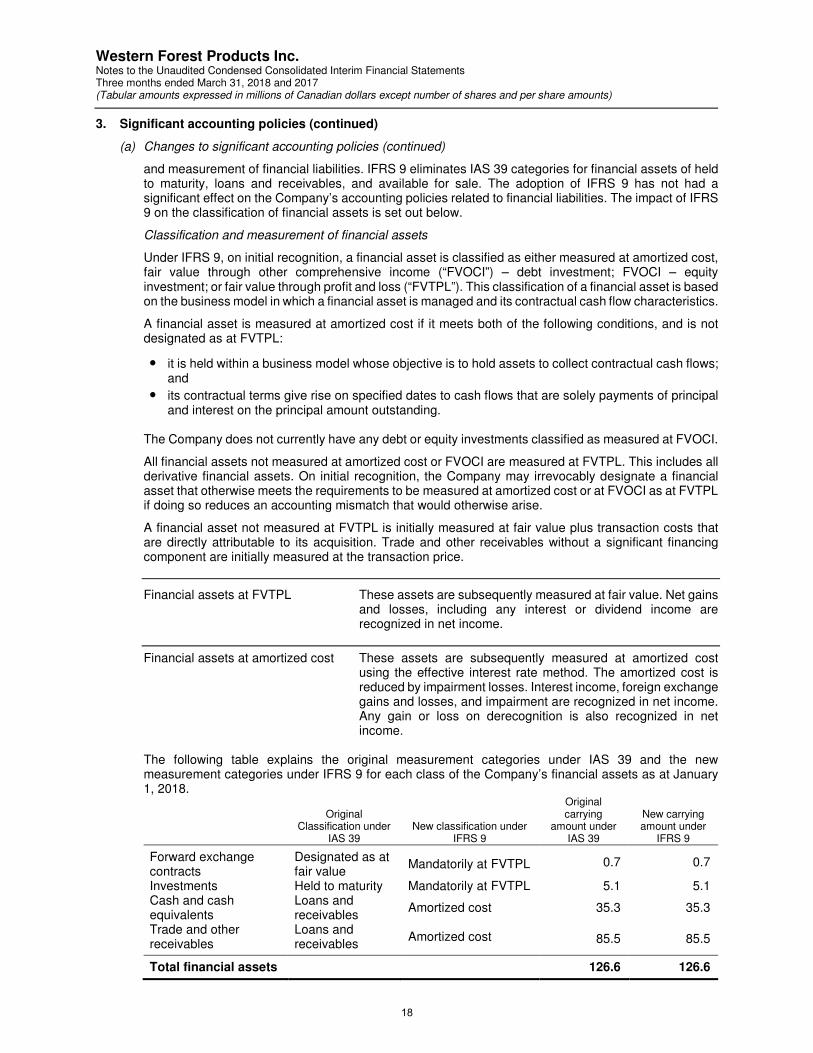
and measurement of financial liabilities. IFRS 9 eliminates IAS 39 categories for financial assets of held to maturity, loans and receivables, and available for sale. The adoption of IFRS 9 has not had a significant effect on the Company’s accounting policies related to financial liabilities. The impact of IFRS 9 on the classification of financial assets is set out below.
Classification and measurement of financial assets
Under IFRS 9, on initial recognition, a financial asset is classified as either measured at amortized cost, fair value through other comprehensive income (“FVOCI”) – debt investment; FVOCI – equity investment; or fair value through profit and loss (“FVTPL”). This classification of a financial asset is based on the business model in which a financial asset is managed and its contractual cash flow characteristics.
A financial asset is measured at amortized cost if it meets both of the following conditions, and is not designated as at FVTPL:
• it is held within a business model whose objective is to hold assets to collect contractual cash flows; and
• its contractual terms give rise on specified dates to cash flows that are solely payments of principal and interest on the principal amount outstanding.
The Company does not currently have any debt or equity investments classified as measured at FVOCI.
All financial assets not measured at amortized cost or FVOCI are measured at FVTPL. This includes all derivative financial assets. On initial recognition, the Company may irrevocably designate a financial asset that otherwise meets the requirements to be measured at amortized cost or at FVOCI as at FVTPL if doing so reduces an accounting mismatch that would otherwise arise.
A financial asset not measured at FVTPL is initially measured at fair value plus transaction costs that are directly attributable to its acquisition. Trade and other receivables without a significant financing component are initially measured at the transaction price.
Financial assets at FVTPL These assets are subsequently measured at fair value. Net gains and losses, including any interest or dividend income are recognized in net income.
Financial assets at amortized cost These assets are subsequently measured at amortized cost using the effective interest rate method. The amortized cost is reduced by impairment losses. Interest income, foreign exchange gains and losses, and impairment are recognized in net income. Any gain or loss on derecognition is also recognized in net income.
The following table explains the original measurement categories under IAS 39 and the new measurement categories under IFRS 9 for each class of the Company’s financial assets as at January 1, 2018.
Original Classification under
IAS 39 New classification under
IFRS 9
Original carrying
amount under IAS 39
New carrying amount under
IFRS 9
Forward exchange contracts
Designated as at fair value
Mandatorily at FVTPL 0.7 0.7
Investments Held to maturity Mandatorily at FVTPL 5.1 5.1 Cash and cash equivalents
Loans and receivables
Amortized cost 35.3 35.3
Trade and other receivables
Loans and receivables
Amortized cost 85.5 85.5
Total financial assets 126.6 126.6
18
Western Forest Products Inc. Notes to the Unaudited Condensed Consolidated Interim Financial Statements Three months ended March 31, 2018 and 2017 (Tabular amounts expressed in millions of Canadian dollars except number of shares and per share amounts)
3. Significant accounting policies (continued)
(a) Changes to significant accounting policies (continued)
Impairment of financial assets
IFRS 9 also replaces the incurred loss model in IAS 39 with an expected credit loss (“ECL”) model. The new impairment model applies to financial assets measured at amortized costs, contract assets and debt investments at FVOCI. Under IFRS 9, credit losses are recognized earlier than under IAS 39. The financial assets held at amortized cost consist of cash and cash equivalents and trade and other receivables.
Under IFRS 9, loss allowances are measured on either of 12 month ECLs where the ECLs result from all possible default events within the 12 months after the reporting date; or lifetime ECLs, where the ECLs result from all possible default events over the expected life of a financial instrument.
The Company measures loss allowances at an amount equal to twelve months ECLs for cash and cash equivalent balances where credit risk has not increased significantly since initial recognition. The Company has elected to measure loss allowances for trade receivables and any future contract assets at an amount equal to lifetime ECLs
Measurement of ECLs
ECLs are a probability‐weighted estimate of credit losses. Credit losses are measured as the present value of all expected cash shortfalls and are discounted at the effective interest rate of the financial asset. At each reporting date the Company assesses whether financial assets carried at amortized costs are credit‐impaired. A financial asset is considered credit‐impaired when one or more events that have a detrimental impact on the estimated future cash flows of the financial asset have occurred.
Loss allowances for financial assets measured at amortized cost are deducted from the gross carrying amount of the assets. Impairment losses related to trade and other receivables, including contract assets, are presented separately in the statement of comprehensive income.
No adjustment to credit losses was required on adoption of IFRS 9.
(b) Standards and interpretations not yet adopted
IFRS 16, Leases (“IFRS 16”)
IFRS 16 is effective for years commencing on or after January 1, 2019, and will replace IAS 17, Leases (“IAS 17”). IFRS 16 provides a single lessee accounting model, requiring the recognition of assets and liabilities for all leases, unless the lease term is 12 months or less or the underlying asset has a low value, while lessor accounting remains largely unchanged from IAS 17 and the distinction between operating and finance leases is retained. The Company intends to adopt IFRS 16 in its consolidated financial statements for the year commencing January 1, 2019. The extent of the impact of adoption of the standard has not yet been determined.
4. Seasonality of operations
In a normal operating year, there is some seasonality to the Company’s operations, with higher lumber sales in the second and third quarters when construction activity in certain key markets has historically tended to be higher. Logging activity may also vary depending on weather conditions such as rain, snow and ice in the winter and the threat of forest fires in the summer.
19
Western Forest Products Inc. Notes to the Unaudited Condensed Consolidated Interim Financial Statements Three months ended March 31, 2018 and 2017 (Tabular amounts expressed in millions of Canadian dollars except number of shares and per share amounts)
5. Inventory
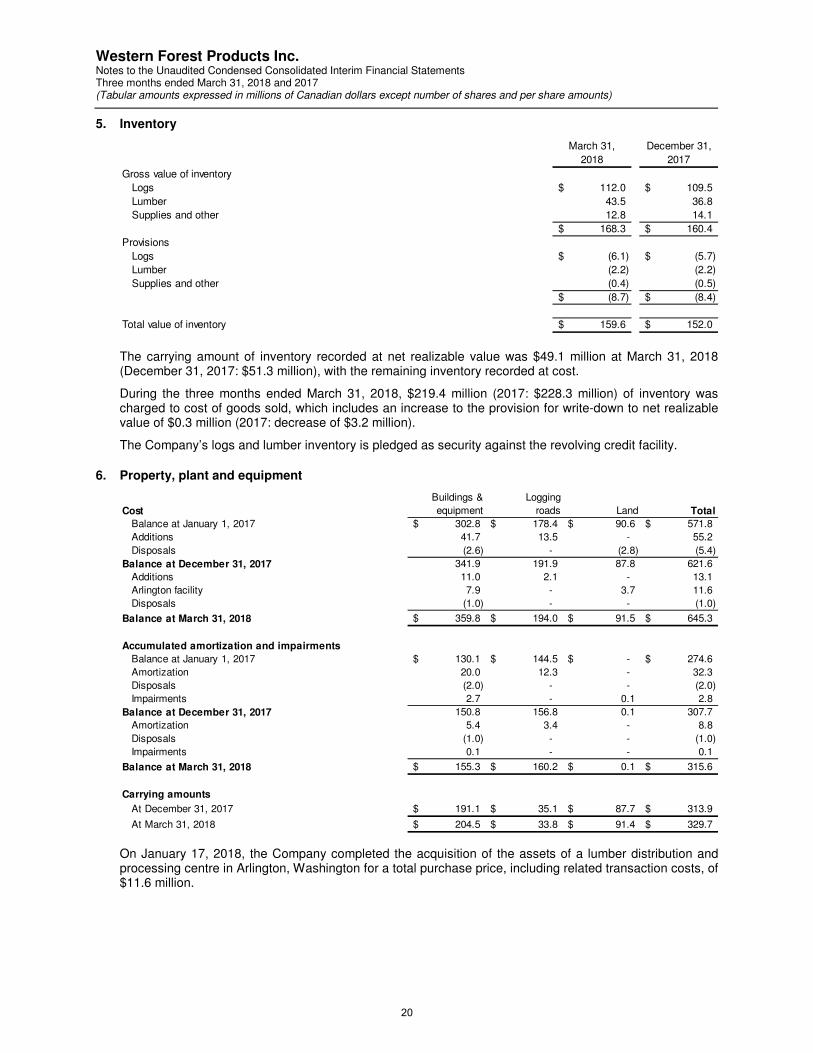
The carrying amount of inventory recorded at net realizable value was $49.1 million at March 31, 2018 (December 31, 2017: $51.3 million), with the remaining inventory recorded at cost.
During the three months ended March 31, 2018, $219.4 million (2017: $228.3 million) of inventory was charged to cost of goods sold, which includes an increase to the provision for write-down to net realizable value of $0.3 million (2017: decrease of $3.2 million).
The Company’s logs and lumber inventory is pledged as security against the revolving credit facility.
6. Property, plant and equipment
On January 17, 2018, the Company completed the acquisition of the assets of a lumber distribution and processing centre in Arlington, Washington for a total purchase price, including related transaction costs, of $11.6 million.
March 31, December 31,
2018 2017
Gross value of inventory
Logs 112.0$ 109.5$
Lumber 43.5 36.8
Supplies and other 12.8 14.1
168.3$ 160.4$
Provisions
Logs (6.1)$ (5.7)$
Lumber (2.2) (2.2)
Supplies and other (0.4) (0.5)
(8.7)$ (8.4)$
Total value of inventory 159.6$ 152.0$
Cost
Buildings &
equipment
Logging
roads Land Total
Balance at January 1, 2017 302.8$ 178.4$ 90.6$ 571.8$
Additions 41.7 13.5 - 55.2
Disposals (2.6) - (2.8) (5.4)
Balance at December 31, 2017 341.9 191.9 87.8 621.6
Additions 11.0 2.1 - 13.1
Arlington facility 7.9 - 3.7 11.6
Disposals (1.0) - - (1.0)
Balance at March 31, 2018 359.8$ 194.0$ 91.5$ 645.3$
Accumulated amortization and impairments
Balance at January 1, 2017 130.1$ 144.5$ -$ 274.6$
Amortization 20.0 12.3 - 32.3
Disposals (2.0) - - (2.0)
Impairments 2.7 - 0.1 2.8
Balance at December 31, 2017 150.8 156.8 0.1 307.7
Amortization 5.4 3.4 - 8.8
Disposals (1.0) - - (1.0)
Impairments 0.1 - - 0.1
Balance at March 31, 2018 155.3$ 160.2$ 0.1$ 315.6$
Carrying amounts
At December 31, 2017 191.1$ 35.1$ 87.7$ 313.9$
At March 31, 2018 204.5$ 33.8$ 91.4$ 329.7$
20
Western Forest Products Inc. Notes to the Unaudited Condensed Consolidated Interim Financial Statements Three months ended March 31, 2018 and 2017 (Tabular amounts expressed in millions of Canadian dollars except number of shares and per share amounts)
7. Biological assets
(a) Reconciliation of carrying amount
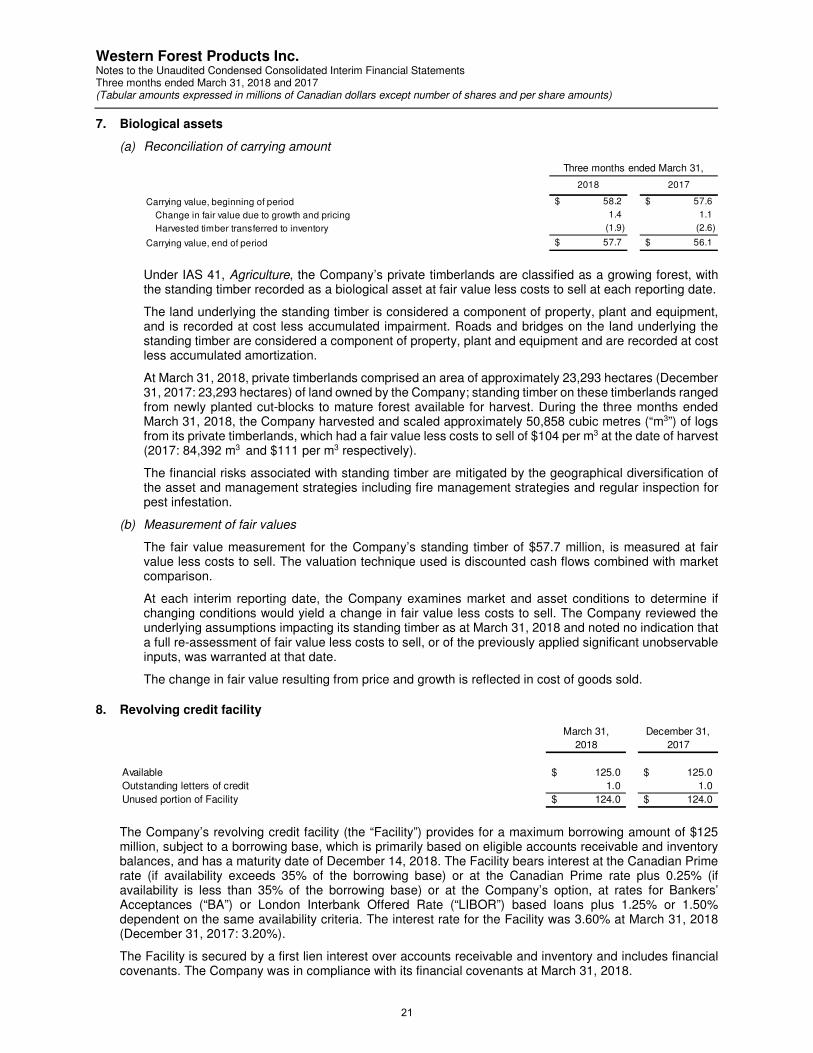
Under IAS 41, Agriculture, the Company’s private timberlands are classified as a growing forest, with the standing timber recorded as a biological asset at fair value less costs to sell at each reporting date.
The land underlying the standing timber is considered a component of property, plant and equipment, and is recorded at cost less accumulated impairment. Roads and bridges on the land underlying the standing timber are considered a component of property, plant and equipment and are recorded at cost less accumulated amortization.
At March 31, 2018, private timberlands comprised an area of approximately 23,293 hectares (December 31, 2017: 23,293 hectares) of land owned by the Company; standing timber on these timberlands ranged from newly planted cut-blocks to mature forest available for harvest. During the three months ended March 31, 2018, the Company harvested and scaled approximately 50,858 cubic metres (“m3”) of logs from its private timberlands, which had a fair value less costs to sell of $104 per m3 at the date of harvest (2017: 84,392 m3 and $111 per m3 respectively).
The financial risks associated with standing timber are mitigated by the geographical diversification of the asset and management strategies including fire management strategies and regular inspection for pest infestation.
(b) Measurement of fair values
The fair value measurement for the Company’s standing timber of $57.7 million, is measured at fair value less costs to sell. The valuation technique used is discounted cash flows combined with market comparison.
At each interim reporting date, the Company examines market and asset conditions to determine if changing conditions would yield a change in fair value less costs to sell. The Company reviewed the underlying assumptions impacting its standing timber as at March 31, 2018 and noted no indication that a full re-assessment of fair value less costs to sell, or of the previously applied significant unobservable inputs, was warranted at that date.
The change in fair value resulting from price and growth is reflected in cost of goods sold.
8. Revolving credit facility
The Company’s revolving credit facility (the “Facility”) provides for a maximum borrowing amount of $125 million, subject to a borrowing base, which is primarily based on eligible accounts receivable and inventory balances, and has a maturity date of December 14, 2018. The Facility bears interest at the Canadian Prime rate (if availability exceeds 35% of the borrowing base) or at the Canadian Prime rate plus 0.25% (if availability is less than 35% of the borrowing base) or at the Company’s option, at rates for Bankers’ Acceptances (“BA”) or London Interbank Offered Rate (“LIBOR”) based loans plus 1.25% or 1.50% dependent on the same availability criteria. The interest rate for the Facility was 3.60% at March 31, 2018 (December 31, 2017: 3.20%).
The Facility is secured by a first lien interest over accounts receivable and inventory and includes financial covenants. The Company was in compliance with its financial covenants at March 31, 2018.
Three months ended March 31,
2018 2017
Carrying value, beginning of period 58.2$ 57.6$
Change in fair value due to growth and pricing 1.4 1.1
Harvested timber transferred to inventory (1.9) (2.6)
Carrying value, end of period 57.7$ 56.1$
March 31, December 31,
2018 2017
Available 125.0$ 125.0$
Outstanding letters of credit 1.0 1.0
Unused portion of Facility 124.0$ 124.0$
21

Western Forest Products Inc. Notes to the Unaudited Condensed Consolidated Interim Financial Statements Three months ended March 31, 2018 and 2017 (Tabular amounts expressed in millions of Canadian dollars except number of shares and per share amounts)
9. Long-term debt
The Company’s revolving term loan facility (the “Term Loan”) provides for a maximum borrowing amount of $110.0 million and has a maturity date of June 29, 2019. The Term Loan bears interest at an index rate, determined as the higher of (i) the Canadian Prime rate plus 0.15%, and (ii) the 30 day BA rate plus 1.65% or at the election of the Company, the applicable BA rate plus 1.65%. The interest rate for the Term Loan was 3.45% at March 31, 2018 (December 31, 2017: 3.35%).
The Term Loan is secured by a first lien interest over all of the Company’s properties and assets, excluding those of the Englewood Logging Division and accounts receivable and inventory, over which it has a second lien interest, and includes financial covenants. The Company was in compliance with its financial covenants at March 31, 2018. Transaction costs are deferred and amortized to finance costs over the term of the Term Loan using the effective interest rate method.
At March 31, 2018, there were no amounts outstanding under the Company’s Term Loan and as a result, the associated deferred transaction costs of $0.4 million are included in other assets on the statement of financial position.
10. Income taxes
The reconciliation of income taxes calculated at the statutory rate to the actual income tax provision is as follows:
In addition to the amounts recorded to net income, a deferred income tax recovery of $0.4 million was recorded to other comprehensive income for the three month period ended March 31, 2018 (2017: $0.2 million deferred income tax recovery) in relation to current period actuarial losses on defined benefit employee future benefit obligations.
March 31, December 31,
2018 2017
Available 110.0$ 110.0$
Drawings - -
Unused portion of Term Loan 110.0$ 110.0$
Three months ended March 31,
2018 2017
Current income tax expense (0.1)$ (0.2)$
Deferred income tax expense (8.0) (6.1)
(8.1)$ (6.3)$
Three months ended March 31,
2018 2017
Income before income taxes 29.8$ 22.5$
Income tax expense at statutory rate of 27% (2017 - 26%) (8.0) (5.8)
Permanent differences (0.1) (0.5)
(8.1)$ (6.3)$
22
Western Forest Products Inc. Notes to the Unaudited Condensed Consolidated Interim Financial Statements Three months ended March 31, 2018 and 2017 (Tabular amounts expressed in millions of Canadian dollars except number of shares and per share amounts)
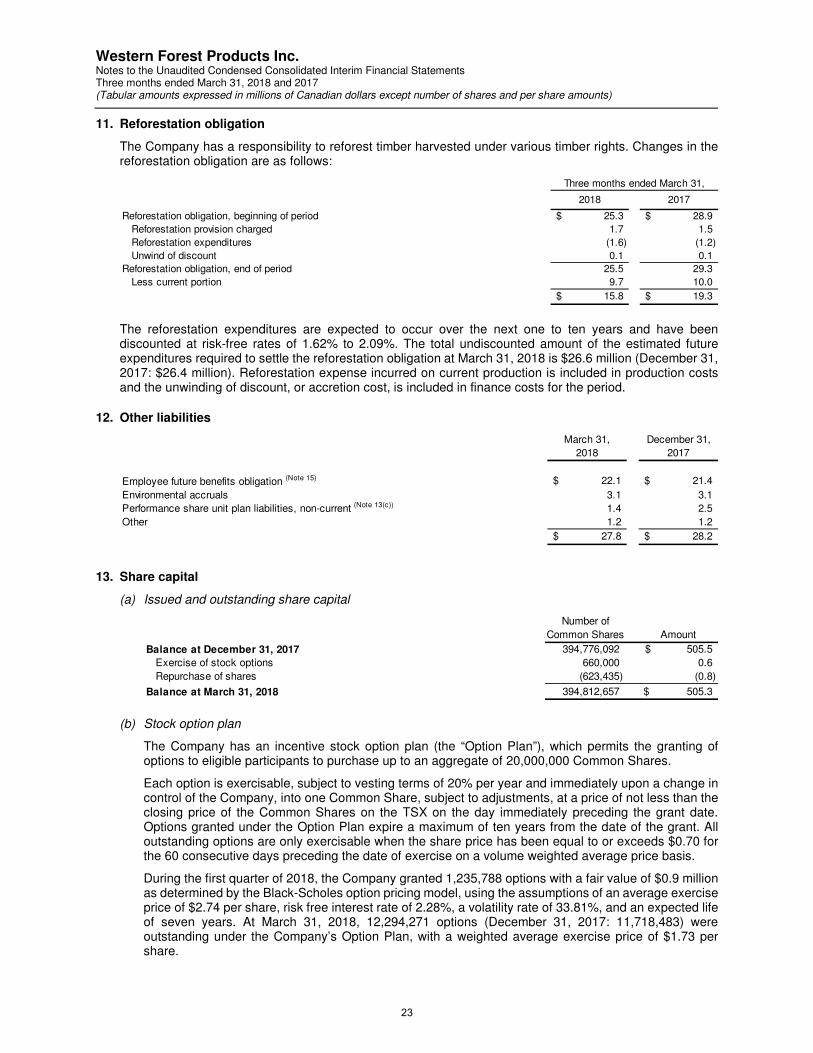
11. Reforestation obligation
The Company has a responsibility to reforest timber harvested under various timber rights. Changes in the reforestation obligation are as follows:
The reforestation expenditures are expected to occur over the next one to ten years and have been discounted at risk-free rates of 1.62% to 2.09%. The total undiscounted amount of the estimated future expenditures required to settle the reforestation obligation at March 31, 2018 is $26.6 million (December 31, 2017: $26.4 million). Reforestation expense incurred on current production is included in production costs and the unwinding of discount, or accretion cost, is included in finance costs for the period.
12. Other liabilities
13. Share capital
(a) Issued and outstanding share capital
(b) Stock option plan
The Company has an incentive stock option plan (the “Option Plan”), which permits the granting of options to eligible participants to purchase up to an aggregate of 20,000,000 Common Shares.
Each option is exercisable, subject to vesting terms of 20% per year and immediately upon a change in control of the Company, into one Common Share, subject to adjustments, at a price of not less than the closing price of the Common Shares on the TSX on the day immediately preceding the grant date. Options granted under the Option Plan expire a maximum of ten years from the date of the grant. All outstanding options are only exercisable when the share price has been equal to or exceeds $0.70 for the 60 consecutive days preceding the date of exercise on a volume weighted average price basis.
During the first quarter of 2018, the Company granted 1,235,788 options with a fair value of $0.9 million as determined by the Black-Scholes option pricing model, using the assumptions of an average exercise price of $2.74 per share, risk free interest rate of 2.28%, a volatility rate of 33.81%, and an expected life of seven years. At March 31, 2018, 12,294,271 options (December 31, 2017: 11,718,483) were outstanding under the Company’s Option Plan, with a weighted average exercise price of $1.73 per share.
2018 2017
Reforestation obligation, beginning of period 25.3$ 28.9$
Reforestation provision charged 1.7 1.5
Reforestation expenditures (1.6) (1.2)
Unwind of discount 0.1 0.1
Reforestation obligation, end of period 25.5 29.3
Less current portion 9.7 10.0
15.8$ 19.3$
Three months ended March 31,
March 31, December 31,
2018 2017
Employee future benefits obligation (Note 15) 22.1$ 21.4$
Environmental accruals 3.1 3.1
Performance share unit plan liabilities, non-current (Note 13(c)) 1.4 2.5
Other 1.2 1.2
27.8$ 28.2$
Number of
Common Shares Amount
Balance at December 31, 2017 394,776,092 505.5$
Exercise of stock options 660,000 0.6
Repurchase of shares (623,435) (0.8)
Balance at March 31, 2018 394,812,657 505.3$
23
Western Forest Products Inc. Notes to the Unaudited Condensed Consolidated Interim Financial Statements Three months ended March 31, 2018 and 2017 (Tabular amounts expressed in millions of Canadian dollars except number of shares and per share amounts)
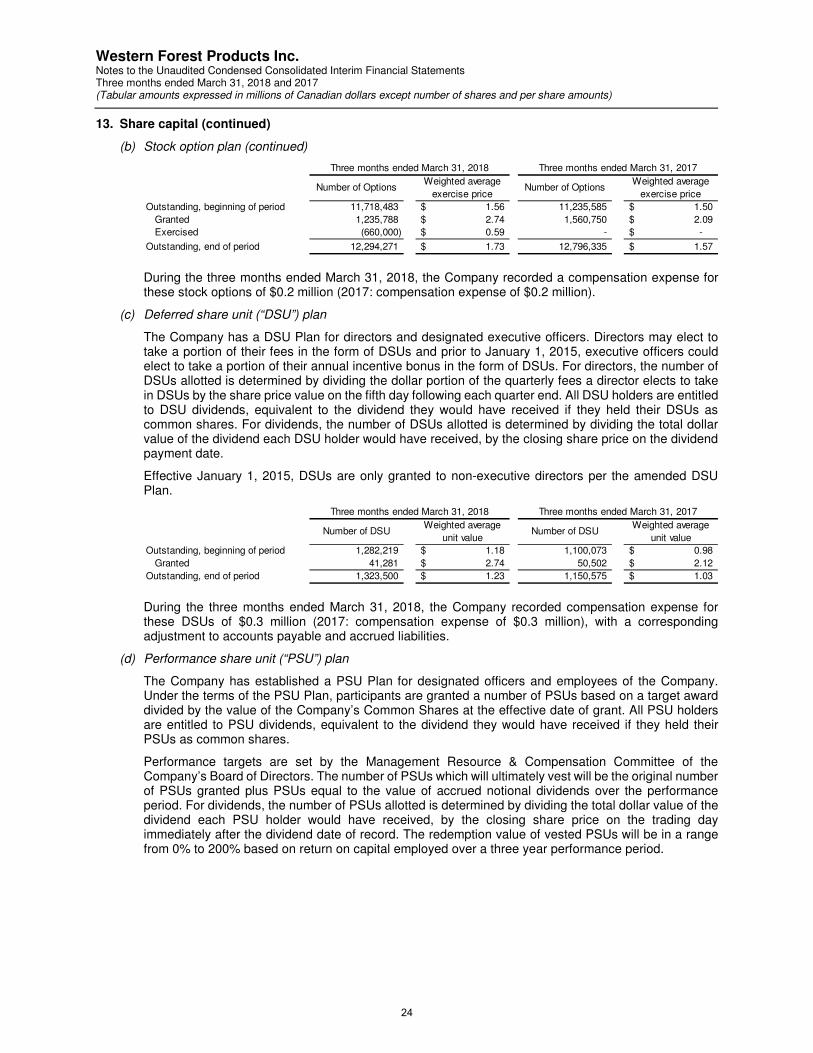
13. Share capital (continued)
(b) Stock option plan (continued)
During the three months ended March 31, 2018, the Company recorded a compensation expense for these stock options of $0.2 million (2017: compensation expense of $0.2 million).
(c) Deferred share unit (“DSU”) plan
The Company has a DSU Plan for directors and designated executive officers. Directors may elect to take a portion of their fees in the form of DSUs and prior to January 1, 2015, executive officers could elect to take a portion of their annual incentive bonus in the form of DSUs. For directors, the number of DSUs allotted is determined by dividing the dollar portion of the quarterly fees a director elects to take in DSUs by the share price value on the fifth day following each quarter end. All DSU holders are entitled to DSU dividends, equivalent to the dividend they would have received if they held their DSUs as common shares. For dividends, the number of DSUs allotted is determined by dividing the total dollar value of the dividend each DSU holder would have received, by the closing share price on the dividend payment date.
Effective January 1, 2015, DSUs are only granted to non-executive directors per the amended DSU Plan.
During the three months ended March 31, 2018, the Company recorded compensation expense for these DSUs of $0.3 million (2017: compensation expense of $0.3 million), with a corresponding adjustment to accounts payable and accrued liabilities.
(d) Performance share unit (“PSU”) plan
The Company has established a PSU Plan for designated officers and employees of the Company. Under the terms of the PSU Plan, participants are granted a number of PSUs based on a target award divided by the value of the Company’s Common Shares at the effective date of grant. All PSU holders are entitled to PSU dividends, equivalent to the dividend they would have received if they held their PSUs as common shares.
Performance targets are set by the Management Resource & Compensation Committee of the Company’s Board of Directors. The number of PSUs which will ultimately vest will be the original number of PSUs granted plus PSUs equal to the value of accrued notional dividends over the performance period. For dividends, the number of PSUs allotted is determined by dividing the total dollar value of the dividend each PSU holder would have received, by the closing share price on the trading day immediately after the dividend date of record. The redemption value of vested PSUs will be in a range from 0% to 200% based on return on capital employed over a three year performance period.
Three months ended March 31, 2018 Three months ended March 31, 2017
Number of OptionsWeighted average
exercise priceNumber of Options
Weighted average
exercise price
Outstanding, beginning of period 11,718,483 1.56$ 11,235,585 1.50$
Granted 1,235,788 2.74$ 1,560,750 2.09$
Exercised (660,000) 0.59$ - -$
Outstanding, end of period 12,294,271 1.73$ 12,796,335 1.57$
Three months ended March 31, 2018 Three months ended March 31, 2017
Number of DSUWeighted average
unit valueNumber of DSU
Weighted average
unit value
Outstanding, beginning of period 1,282,219 1.18$ 1,100,073 0.98$
Granted 41,281 2.74$ 50,502 2.12$
Outstanding, end of period 1,323,500 1.23$ 1,150,575 1.03$
24

Western Forest Products Inc. Notes to the Unaudited Condensed Consolidated Interim Financial Statements Three months ended March 31, 2018 and 2017 (Tabular amounts expressed in millions of Canadian dollars except number of shares and per share amounts)
13. Share capital (continued)
(d) Performance share unit (“PSU”) plan (continued)
During the three months ended March 31, 2018, the Company recorded compensation expense for these PSUs of $1.0 million (2017: compensation expense of $0.7 million), with a corresponding adjustment to accounts payable and accrued liabilities and other liabilities.
14. Commitments and contingencies
Long term fibre supply agreements
Certain of the Company’s long term fibre supply agreements with third parties have minimum volume requirements and may, in the case of a failure to produce the minimum annual volume, require the Company to conduct whole log chipping or sell saw logs, which could reduce log availability for our sawmills, source the deficiency from third parties at additional cost to the Company or pay the party to the fibre supply agreement a penalty calculated based on the provisions contained in the relevant agreement. Should Western take significant market related curtailments in its sawmills, the volume of chips produced is reduced and accordingly there is greater risk that the Company may not meet its contractual obligations, if it is not possible to secure replacement chips on the open market during that period.
The Company had met all fibre commitments as at December 31, 2017 and, based on chip and pulp log volumes supplied year-to-date, the Company anticipates satisfying annual fibre commitments for 2018.
Key dates in the softwood lumber duty dispute
Under the softwood lumber agreement (“SLA”) between Canada and the United States (“US”), the Company’s exports to the US were assessed an export tax by the Canadian Government. The SLA expired on October 12, 2015, eliminating export tax measures on Canadian softwood lumber shipments to the US.
Throughout 2016 and 2016 there were several announcements made by US Department of Commerce (“DoC”) and the US International Trade Commission (“ITC”) outlining tax rates on Countervailing (“CVD”) and Anti-dumping duties (“AD”) on Canadian softwood lumber shipments to the US. The Company disclosed these in its audited annual consolidated financial statements for the year ended December 31, 2017.
On January 3, 2018, DoC published amended final determinations, resulting in reduced, final CVD and AD rates of 14.19% and 6.04% respectively for “all other” Canadian lumber producers including Western.
Lumber duties and export tax
Cash deposits for CVD were required for lumber imports to the US effective April 28, 2017 through August 25, 2017, after which they were not applicable pending the ITC’s final CVD determination. Cash deposits for CVD resumed on publication of ITC final affirmative CVD determination in the US Federal Register on December 28, 2017.
Cash deposits for AD were required for lumber imports to the US effective June 30, 2017 until December 26, 2017, and resumed on publication of the ITC final affirmative injury determination on December 28, 2017.
The Company recorded an export tax recovery of $3.6 million arising from the difference between export duties paid at preliminary determination rates and the latest final duty rates, in the fourth quarter of 2017. A corresponding increase was recognized in other assets in the consolidated statement of financial position. Incremental export duty recoveries from any future change in CVD and AD rates will be netted against export tax expense and included in other assets.
Three months ended March 31,
2018 2017
Outstanding, beginning of period 1,582,285 952,236
Granted 511,870 557,916
Redeemed (429,002) -
Outstanding, end of period 1,665,153 1,510,152
25

Western Forest Products Inc. Notes to the Unaudited Condensed Consolidated Interim Financial Statements Three months ended March 31, 2018 and 2017 (Tabular amounts expressed in millions of Canadian dollars except number of shares and per share amounts)
15. Employee benefits
The amounts recognized in the statement of financial position for the Company’s employee future benefit obligations, consisting of both the defined benefit salaried pension plans and other non-pension benefits are as follows:
The change in the liability recognized in the statement of financial position at March 31, 2018 was due primarily to actuarial losses resulting from lower than expected returns on plan assets, offset by estimated quarterly changes in the discount rate used to value the defined benefit obligations, offset. The discount rate used as at March 31, 2018 was 3.40% per annum (December 31, 2017 3.35% per annum).
The Company expects to make funding contributions to its defined benefit plans of $3.1 million during 2018.
16. Financial instruments – fair values
The following table shows the carrying amounts and fair values of financial assets and financial liabilities, including their levels in the fair valuation hierarchy. It does not include fair value information for financial assets or liabilities not measured at fair value if the carrying amount is a reasonable approximation of fair value. There has been no movement between fair value levels since December 31, 2017.
As at March 31, 2018, the Company had outstanding obligations to sell an aggregate Japanese Yen (“JPY”) 240.0 million at an average rate of JPY 81.98 per CAD with maturities through April 27, 2018, and an aggregate USD$47.5 million at an average rate of CAD$1.27 per USD with maturities through May 31, 2018.
All foreign currency gains or losses related to currency forward contracts to March 31, 2018 have been recognized in revenue for the period and the fair value of these instruments at March 31, 2018 was a net liability of $0.8 million, which is included in accounts payable and accrued liabilities on the statement of financial position (December 31, 2017: net asset of $0.7 million). A net loss of $0.4 million was recognized on contracts which were settled in the three months ended March 31, 2018 (2017: net gain of $0.4 million), which was included in revenue for the period.
March 31, December 31,
2018 2017
Present value of obligations 132.3$ 133.9$
Fair value of plan assets (110.2) (112.5)
Liability recognized in the statement of financial position (Note 12) 22.1$ 21.4$
March 31, 2018 December 31, 2017
Mandatory at Amortized Mandatory Amortized
at FVTPL Cost Total at FVTPL Cost Total
Financial assets
Investments 5.1$ -$ 5.1$ 5.1$ -$ 5.1$
Foreign currency forward contracts - - - 0.7 - 0.7
Cash and cash equivalents - 46.9 46.9 - 35.3 35.3
Trade and other receivables - 90.6 90.6 - 85.5 85.5
Total financial assets -$ 137.5$ 142.6$ 5.8$ 120.8$ 126.6$
Mandatory Other Financial Mandatory Other Financial
at FVTPL Liabilities Total at FVTPL Liabilities Total
Financial liabilities
Foreign currency forward contracts 0.8$ -$ 0.8$ -$ -$ -$
Revolving credit facility - - - - - -
Accounts payable and accrued liabilities - 116.4 116.4 - 98.9 98.9
Long-term debt (Note 10) - - - - - -
Total financial liabilities 0.8$ 116.4$ 117.2$ -$ 98.9$ 98.9$
26
Western Forest Products Inc. Notes to the Unaudited Condensed Consolidated Interim Financial Statements Three months ended March 31, 2018 and 2017 (Tabular amounts expressed in millions of Canadian dollars except number of shares and per share amounts)
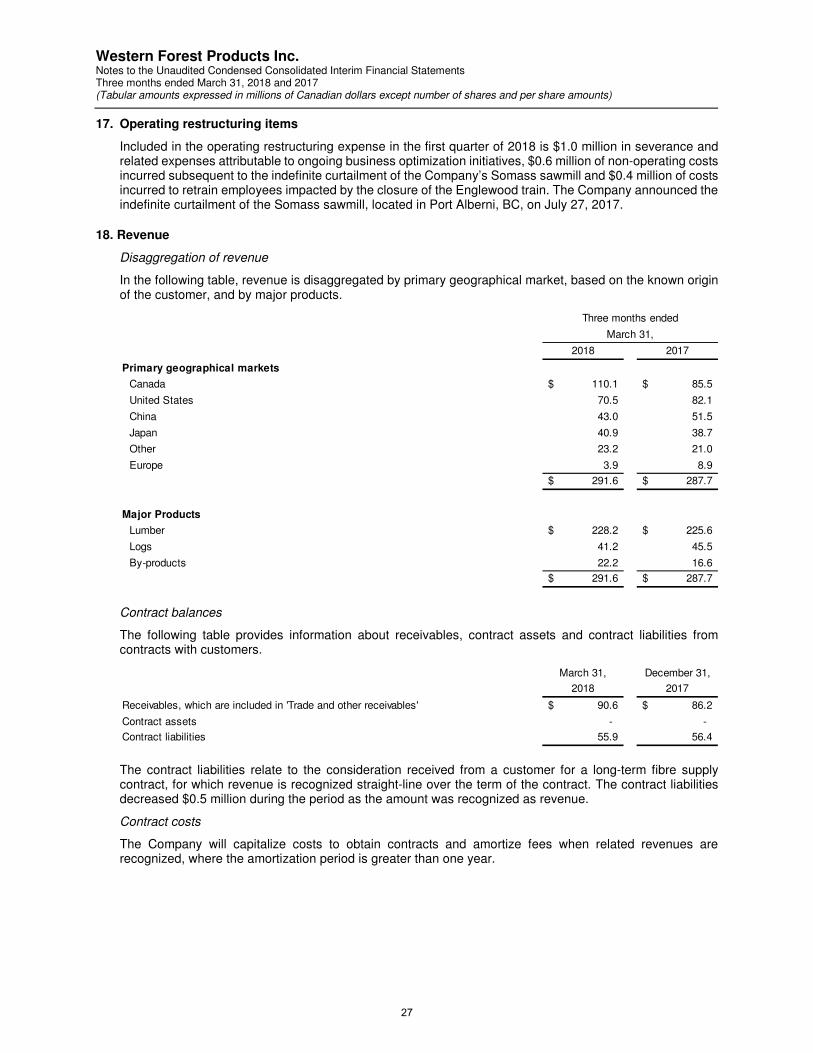
17. Operating restructuring items
Included in the operating restructuring expense in the first quarter of 2018 is $1.0 million in severance and related expenses attributable to ongoing business optimization initiatives, $0.6 million of non-operating costs incurred subsequent to the indefinite curtailment of the Company’s Somass sawmill and $0.4 million of costs incurred to retrain employees impacted by the closure of the Englewood train. The Company announced the indefinite curtailment of the Somass sawmill, located in Port Alberni, BC, on July 27, 2017.
18. Revenue
Disaggregation of revenue
In the following table, revenue is disaggregated by primary geographical market, based on the known origin of the customer, and by major products.
Contract balances
The following table provides information about receivables, contract assets and contract liabilities from contracts with customers.
The contract liabilities relate to the consideration received from a customer for a long-term fibre supply contract, for which revenue is recognized straight-line over the term of the contract. The contract liabilities decreased $0.5 million during the period as the amount was recognized as revenue.
Contract costs
The Company will capitalize costs to obtain contracts and amortize fees when related revenues are recognized, where the amortization period is greater than one year.
Three months ended
March 31,
2018 2017
Primary geographical markets
Canada 110.1$ 85.5$
United States 70.5 82.1
China 43.0 51.5
Japan 40.9 38.7
Other 23.2 21.0
Europe 3.9 8.9
291.6$ 287.7$
Major Products
Lumber 228.2$ 225.6$
Logs 41.2 45.5
By-products 22.2 16.6
291.6$ 287.7$
March 31, December 31,
2018 2017
Receivables, which are included in 'Trade and other receivables' 90.6$ 86.2$
Contract assets - -
Contract liabilities 55.9 56.4
27
Suite 800
1055 West Georgia Street
Royal Centre, PO Box 11122
Vancouver, British Columbia
Canada V6E 3P3
Telephone: 604 648 4500
www.westernforest.com
Trading on the TSX as “WEF”