Embed Size (px)
Citation preview

Journal of Personality and Social Psychology1980, Vol. 39, No. 5, 806-820
Unrealistic Optimism About Future Life Events
Neil D. WeinsteinDepartment of Human Ecology and Social Sciences
Cook College, Rutgers—The State University
Two studies investigated the tendency of people to be unrealistically optimisticabout future life events. In Study 1, 258 college students estimated how muchtheir own chances of experiencing 42 events differed from the chances of theirclassmates. Overall, they rated their own chances to be above average for posi-tive events and below average for negative events, ps<.001. Cognitive andmotivational considerations led to predictions that degree of desirability, per-ceived probability, personal experience, perceived controllability, and stereotypesalience would influence the amount of optimistic bias evoked by differentevents. All predictions were supported, although the pattern of effects differedfor positive and negative events. Study 2 tested the idea that people are un-realistically optimistic because they focus on factors that improve their ownchances of achieving desirable outcomes and fail to realize that others may havejust as many factors in their favor. Students listed the factors that they thoughtinfluenced their own chances of experiencing eight future events. When suchlists were read by a second group of students, the amount of unrealistic opti-mism shown by this second group for the same eight events decreased signifi-cantly, although it was not eliminated.
According to popular belief, people tend tothink they are invulnerable. They expectothers to be victims of misfortune, not them-selves. Such ideas imply not merely a hopefuloutlook on life, but an error in judgment thatcan be labeled unrealistic optimism.
It is usually impossible to demonstrate thatan individual's optimistic expectations aboutthe future are unrealistic. An individual mightbe quite correct in asserting that his or herchances of experiencing a negative event areless than average. On a group basis, however,it is relatively easy to test for an optimisticbias. If all people claim their changes of ex-periencing a negative event are less than
The author is indebted to Dorothy Schmidt forher valuable assistance in conducting this researchand to Claudia Cohen, David Wilder, Carol Weinstein,Ilene Gochman, and Richard Ashmore for helpfulsuggestions during the preparation of this manuscript.
Requests for reprints should be sent to Neil D.Weinstein, Department of Human Ecology and SocialSciences, Cook College, Rutgers—The State Univer-sity, P.O. Box 231, New Brunswick, New Jersey 08903.
average, they are clearly making a systematicerror, thus demonstrating unrealistic optimism.
Various data suggest that people do tendto be unrealistically optimistic about thefuture. Surveys concerning automobile acci-dents (Robertson, 1977), crime (Weinstein,Note 1), and disease (Harris & Guten, 1979;Kirscht, Haefner, Kegeles, & Rosenstock,1966; American Cancer Society, Note 2) findmany people who say their risk is less thanaverage but few who say their risk is greaterthan average. When people are asked to pre-dict the outcomes of social and political issues,their predictions tend to coincide with theirpreferences (Cantril, 1938; Lund, 1925;McGregor, 1938; McGuire, 1960). Even forpurely chance events (picking a card out ofa deck, for example), people sometimes showoptimistic biases (Irwin, 1953; Langer & Roth,1975; Marks, 1951). None of these studies,however, has examined a range of positiveand negative events to determine the extentof optimistic biases and the conditions underwhich they occur.
The principal goal of the present research
Copyright 1980 by the American Psychological Association, Inc. 0022-3514/80/3905-0806J00.75
806
UNREALISTIC OPTIMISM ABOUT FUTURE LIFE EVENTS 807
was to test the following hypothesis:
1. People believe that negative events are lesslikely to happen to them than to others, andthey believe that positive events are more likelyto happen to them than to others.
In addition, the two studies described heretested several specific hypotheses about thefactors that influence the amount of opti-mistic bias evoked by different events andabout the mechanisms that produce this bias.
Event Characteristics Affecting UnrealisticOptimism
In past research, optimistic biases weregenerally regarded as evidence of defensive-ness or wishful thinking. People were said toexaggerate the likelihood of events the antici-pation of which produces positive affect andunderestimate the likelihood of events theanticipation of which produces negative affect.Presumably, the stronger the affect, thestronger the distortion of reality. This mo-tivational analysis of expectations about futurelife events suggests the second hypothesis:
2. Among negative events, the more undesir-able the event, the stronger the tendency tobelieve that one's own chances are less thanaverage; among positive events, the more de-sirable the event, the stronger the tendency tobelieve that one's own chances are greater thanaverage.
Supporting this degree of desirability/un-desirability prediction, Kirscht et al. (1966)reported that judgments of disease suscepti-bility were correlated with perceptions ofdisease severity. The people who regarded adisease as very serious were the ones mostlikely to believe that their own chances wereless than average. No data or significancelevels were given, however.
In recent years, explanations that em-phasize flaws in the information handlingcapabilities of human beings have been ad-vanced for phenomena once explained inmotivational terms (e.g., Miller & Ross,1975; Ross, Greene, & House, 1977; Slovic,Kunreuther, & White, 1974). According tothis perspective, people may be unrealisticallyoptimistic because they lack certain informa-
tion needed to make accurate risk assessmentsor use procedures to judge future probabilitiesthat introduce systematic errors.
In making comparative risk assessments,errors may arise because people have difficultyin adopting the perspective of others (cf.Jones & Nisbett, 1971; Ross et al., 1977;Ross & Sicoly, 1979). Many of the factorsthat make us feel that an event is likely orunlikely to happen to us may also makeother people feel that it is likely or unlikelyto happen to them. If people focus only ontheir own circumstances, they may concludeincorrectly that their chances differ fromthose of other people. Through this mecha-nism, any factor that influences people's beliefsabout their own chances could influence com-parative judgments. One factor that willaffect these beliefs is the perceived proba-bility of the event for the general population.The preceding reasoning then suggests thehypothesis:
3. The greater the perceived probability of anevent, the stronger the tendency for people tobelieve that their own chances are greater thanaverage.
Another factor that should influence peo-ple's beliefs about their chances of experiencingan event is past personal experience (Lichten-stein, Slovic, Fischhoff, Layman, & Combs,1978; Hoffman & Brewer, Note 3). Personalexperience should make it easier to recall pastoccurrences of the event and to imagine situ-ations in which the event could occur, leadingto greater perceived probability through themechanism of "availability" (Tversky &Kahneman, 1973, 1974). Furthermore, formany events causal sequences can be con-structed which imply that past experienceincreases the probability of future experience.Someone who has had a heart attack or hasclose relatives with heart disease is morelikely to have a heart attack in the futurethan someone who has had no contact withheart ailments. Consequently, we predict:
4. Previous personal experience with an eventincreases the likelihood that people will believetheir own chances are greater than average.
Hypotheses 3 and 4 concern two eventcharacteristics that may lead people to make
808 NEIL D. WEINSTEIN
systematic errors when comparing their ownchances with those of other people, but theydo not explain the phenomenon of unrealisticoptimism. The direction of the errors producedby these characteristics depends on the proba-bility of the event and the frequency ofpersonal experience, not on the type of event.To explain why people would say that theirchances are greater than average for positiveevents but less than average for negativeevents by using these hypotheses would re-quire that positive events always be asso-ciated with high probability or high personalexperience and that negative events alwaysbe associated with low probability or lowpersonal experience.
There is a way, however, in which ego-centric tendencies can produce an optimisticbias for both positive and negative events.If an event is perceived to be controllable,it signifies that people believe there are stepsone can take to increase the likelihood of adesirable outcome. Because they can moreeasily bring to mind their own actions thanthe actions of others, people are likely toconclude that desired outcomes are morelikely to happen to them than to other people.Even for events that are far in the futureand have not yet been associated with anyovert behavior, people may still be aware oftheir intentions to act in ways that will helpthem achieve the desired outcomes.
The preceding argument assumes that peoplegenerally bring to mind actions that facilitaterather than impede goal achievement. Theymight do this because facilitating actionsreally are more plentiful, because they findreassurance in selectively recalling facilitatingactions or in exaggerating their importance(a motivational explanation), or becauseactions taken to produce desired outcomesare, for various reasons, actually easier toremember (a cognitive viewpoint).
Since the process just outlined would notapply to uncontrollable events, we are led tothe prediction:
5. The greater the perceived controllability ofa negative event, the greater the tendency forpeople to believe that their own chances are lessthan average; the greater the perceived con-trollability of a positive event, the greater thetendency for people to believe that their ownchances are greater than average.
The final event characteristic to be exam-ined was suggested by the "representativeness"heuristic (Kahneman & Tversky, 1972; Tver-sky & Kahneman, 1977). Representativenessdenotes the process of judging the probabilitythat an individual fits into a particular cate-gory by examining the degree to which theindividual displays a few salient features ofcategory members but ignoring base rates forthe categories. For many events—contractinglung cancer and becoming an alcoholic, forexample—people may have a stereotypedconception of the kind of person to whomthis event happens. If they do not see them-selves as fitting the stereotype, the repre-sentativeness heuristic suggests that peoplewill conclude that the event will not happento them, overlooking the possibility that fewof the people who experience the event mayactually fit the stereotype.
If stereotypes of the victim tend to servean ego-defensive function, people would seldomsee themselves as representing the type ofperson who falls prey to misfortune. Further-more, if stereotypes are defensive, an indi-vidual's image of the people who experiencepositive events would overemphasize his orher own characteristics. These tendencieswould exaggerate optimistic biases for anyevent associated with a stereotype.
A different line of reasoning does not as-sume any motivational bias in the construc-tion or use of stereotypes. It suggests thatpeople may be struck by the superficial dif-ferences between themselves and the stereotype(differences such as sex, age, or appearance)and fail to see more fundamental similaritiesbetween themselves and the people to whomthe event occurs. This would lead people toconclude that the event will not happen tothem, producing optimism for negative eventsbut pessimism for positive events.
The final hypothesis states:
6. When a stereotype exists of a particulartype of person to whom a negative event is likelyto happen, people will tend to believe that theirown chances are less than average. (No clearprediction can be made from the precedingdiscussion about the effects of stereotypesalience on expectations for positive events.)
The preceding hypotheses can each bereached by several lines of reasoning, ofteninvolving both motivational and cognitive
UNREALISTIC OPTIMISM ABOUT FUTURE LIFE EVENTS 809
considerations. Personal experience, for ex-ample, might decrease optimism about nega-tive events by making images of the eventsmore available or by undercutting defensivedenial. Consequently, these hypotheses arenot offered as a test of motivational versuscognitive points of view or as an examination ofthe importance of availability and representa-tiveness in generating unrealistic optimism.
Study 1 was designed to test the hypothesesthemselves. Its goal was to determine theamount of unrealistic optimism associatedwith different events and to relate this opti-mism to the characteristics of the events.
Study 1
In this study college students estimatedhow much their own chances of experiencingfuture life events differed from the averagechances of their classmates. If all studentsclaimed that their chances of experiencing anegative event were less than average (orthat their chances of experiencing a positiveevent were greater than average), this wouldclearly indicate unrealistic optimism. How-ever, a simple comparison of the numbers ofoptimistic and pessimistic responses is notsufficient to demonstrate a systematic bias.Unless the median and the mean of theactual probability distribution happen to co-incide, there is no reason why the number ofpeople whose chances are below the average(below the mean) should equal the numberwhose chances are above the average. If theprobability distribution is positively skewed,for example, most people's chances will bebelow the average.
To determine the presence of a systematicbias we have to consider the degree of opti-mism or pessimism expressed. The compara-tive judgments students were asked to makein the present studies concern the differencebetween their own individual chances and thepopulation average. (The population, as de-nned here, included all the other students atthe same college.) Mathematically, this dif-ference is (Pi — P), where Pt is the proba-bility that the event will happen to a particularindividual and P is the population mean of P,-.1
Because P is defined as the average of P,over the population, the mean value of thisdifference score ought to be zero. In other
words, if the judgments students generate areunbiased and the students form a representa-tive sample of the population, the mean valueof their comparative judgments should be zero.If the mean of their judgments is significantlydifferent from zero, it indicates that theirjudgments have a systematic bias. Wheneverthe mean value of students' comparativejudgments departs significantly from zero inan optimistic direction, this will be interpretedas unrealistic optimism, and the size of themean will be taken as a measure of the mag-nitude of the optimistic bias.
Method
Subjects
One group of students made comparative judgmentsabout the likelihood that specific events would takeplace in their lives (comparative rating group). Thesesubjects were enrolled in two interdisciplinary coursesat Cook College, Rutgers University, that attract anextremely diverse group of students.
Event characteristics were rated by a group of 120female students (event rating group) from an intro-ductory psychology course at the same universityThese students also served as the subjects in Study 2.
Materials
Events. The 18 positive and 24 negative life eventsused in the study are listed in Table 1. The intentionwas to assemble a diverse group of events that satis-fied two criteria. First, each event had to be clearlypositive or negative. Second, there could be no ob-vious precondition that would make any event relevantto only a limited number of people. For example, theevent "being injured while skiing" would be inappro-priate because it only applies to people who chooseto ski.
Comparative rating forms. The 42 events were di-vided randomly between two rating forms. Positiveand negative events were intermixed. Instructions onthe forms stated "Compared to other Cook students—same sex as you—what do you think are the chancesthat the following events will happen to you? Thechoices range from much less than average, throughaverage, to much more than average" (italics inoriginal). Beneath the description of each event werethe following choices: "100% less (no chance), 80%less, 60% less, 40% less, 20% less, 10% less, average,10% more, 20% more, 40% more, 60% more, 80%
1 Actually subjects expressed this difference as apercentage of the average chances—100 X (Pi — P)/P.Estimating the percentage difference is easier andmore natural for students and does not alter theinterpretation of their responses.
810 NEIL D.
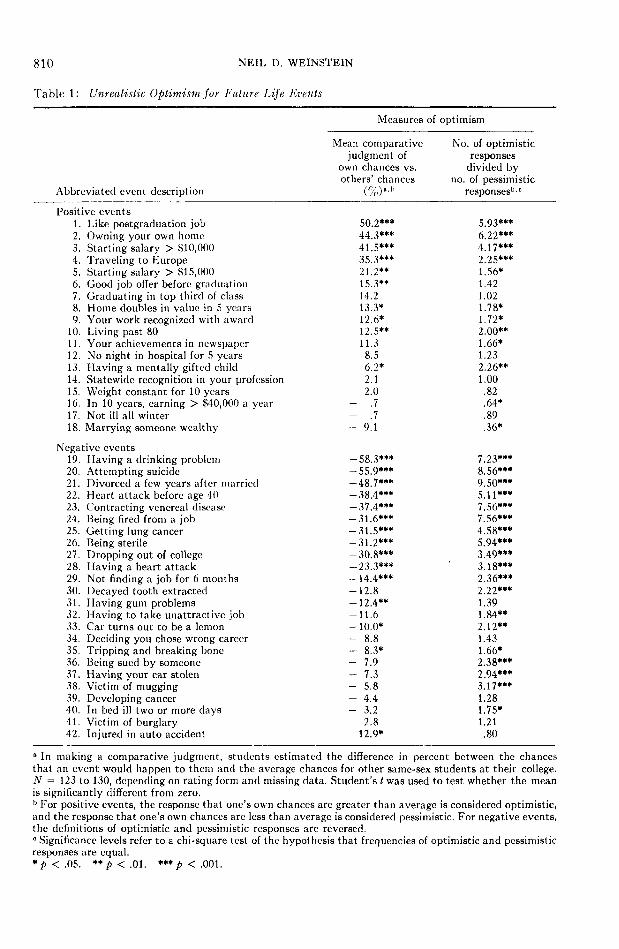
Table 1 : Unrealistic Optimism for Future Life
Abbreviated event description
Positive events1. Like postgraduation job2. Owning your own home3. Starting salary > $10,0004. Traveling to Europe5. Starting salary > $15,0006. Good job offer before graduation7. Graduating in top third of class8. Home doubles in value in 5 years9. Your work recognized with award
10. Living past 8011. Your achievements in newspaper12. No night in hospital for 5 years13. Having a mentally gifted child14. Statewide recognition in your profession15. Weight constant for 10 years16. In 10 years, earning > $40,000 a year17. Not ill all winter18. Marrying someone wealthy
Negative events19. Having a drinking problem20. Attempting suicide21. Divorced a few years after married22. Heart attack before age 4023. Contracting venereal disease24. Being fired from a job25. Getting lung cancer26. Being sterile27. Dropping out of college28. Having a heart attack29. Not finding a job for 6 months30. Decayed tooth extracted31. Having gum problems32. Having to take unattractive job33. Car turns out to be a lemon34. Deciding you chose wrong career35. Tripping and breaking bone36. Being sued by someone37. Having your car stolen38. Victim of mugging39. Developing cancer40. In bed ill two or more days41. Victim of burglary42. Injured in auto accident
WEINSTEIN
Events
Measures of
Mean comparativejudgment of
own chances vs.others' chances
(%)••>'
50.2***44.3***41.5***35.3***21.2**15.3**14.213.3*12.6*12.5**11.38.56.2*2.12.0
- .7- .7- 9.1
-58.3***-55.9***-48.7***-38.4***-37.4***-31.6***-31.5***-31.2***-30.8***-23.3***-14.4***-12.8-12.4**-11.6-10.0*- 8.8- 8.3*- 7.9- 7.3- 5.8- 4.4- 3.2
2.812.9*
optimism
No. of optimisticresponses
divided byno. of pessimistic
responses'1 •"
5.93***6.22***4.17***2.25***1.56*1.421.021.78*1.72*2.00**1.66*1.232.26**1.00.82.64*.89.36*
7.23***8.56***9.50***5.11***7.56***7.56***4.58***5.94***3.49***3.18***2.36***2.22***1.391.84**2.12**1.431.66*2.38***2.94***3.17***1.281.75*1.21.80
" In making a comparative judgment, students estimated the difference in percent between the chancesthat an event would happen to them and the average chances for other same-sex students at their college.N = 123 to 130, depending on rating form and missing data. Student's t was used to test whether the meanis significantly different from zero.b For positive events, the response that one's own chances are greater than average is considered optimistic,and the response that one's own chances are less than average is considered pessimistic. For negative events,the definitions of optimistic and pessimistic responses are reversed.0 Significance levels refer to a chi-square test of the hypothesis that frequencies of optimistic and pessimisticresponses are equal.V < .05. ** p < .01. ***p<.001.
UNREALISTIC OPTIMISM ABOUT FUTURE LIFE EVENTS 811
more, 100% more, 3 times average, and 5 timesaverage." The lowest choice possible was 100% lessthan average, since this indicated a probability of zero.At the other extreme, no probability could exceed100%, but this upper limit could be many times theaverage probability. The task of comparing one's ownchances with the average chances of other studentswas readily accepted by students and carried outwithout any apparent confusion.
To calculate the mean comparative judgment, the15 response choices were given the values —100%,-80%, -60%, -40%, -20%, -10%, 0%, 10%,20%, 40%, 60%,, 80%, 100%, 200%, and 400% toreflect their deviation from a response of "average."
Kvent ratings. For the rating of event characteris-tics, events were divided into the same sets as on thecomparative rating forms. Written instructions askedsubjects to evaluate first the probability of each event.Students were required to estimate the percentage ofstudents at the university to whom the event wouldoccur. Several examples were presented to illustratethe relationship between percentage ratings and oddsratios. Next, events were rated for controllability(1 = there is nothing one can do that will changethe likelihood that the event will take place, 2 = thingsone can do have a small effect on the chances thatthe event will occur; 3 = things one can do havea moderate effect; 4 = things one can do have a largeeffect; S = completely controllable) and desirability(1 = extremely undesirable; 3 = undesirable; 5 = neu-tral; 7 = desirable; 9 = extremely desirable). Finally,events were rated for personal experience (1 = has nothappened to anyone I know; 2 = has happened toacquaintances; 3 = has happened to friends or closerelatives; 4 = has happened to me once; 5 = hashappened to me more than once) and salience of ahigh chance group (1 = no type of person with a par-ticularly high chance comes to mind; 2 = when I thinkabout the event a type of person comes to mind towhom it is likely to happen, but this image is notvery clear; 3 = when I think about the event a clearpicture comes to mind of a particular type of personto whom it is likely to happen).
Procedure
The experimenter visited the classes selected forthe comparative rating measure and explained thatthe project concerned college students' expectationsabout the future. Task instructions emphasized thatsubjects should compare themselves with other stu-dents and not merely rate each event in terms of howlikely or unlikely it seemed. The different versionsof the comparative rating form, each listing 21 events,were handed to alternate students.
The ratings of the event characteristics were com-pleted separately by members of the event ratinggroup after their participation in Study 2.
Results
The ratings of event characteristics showedthat a clear differentiation between positive
and negative events was achieved. The leastundesirable of all the negative events wasstill perceived to be relatively undesirable(M = 3.92), and the least desirable of all thepositive events was still perceived to be rela-tively desirable (M = 6.37). Both values aresignificantly different from the neutral ratingof 5 (ps < .001).2
Unrealistic Optimism: Hypothesis 1
Both positive and negative events in Table 1are arranged in order of decreasing optimismas indicated by the mean comparative judg-ment. A positive value in Column 1 indicatesthat subjects tend to believe that their ownchances are greater than average; a negativevalue indicates that students believe theirchances are less than average. These valuesstrongly support Hypothesis 1; the means inColumn 1 are in the predicted direction for 37of the 42 events (p < .001 by the binomialtest). Averaged over all positive events, thecomparative judgments of individuals weresignificantly greater than zero, M = 15.4%,^(255) = 6.8, p < .001; averaged over nega-tive events, individuals' judgments were sig-nificantly less than zero, M = -20.4%, /(255)= 13.9, p < .001.
Column 2 shows the ratio of the numberof optimistic to pessimistic responses. Althoughthe significance levels derived from the statis-tics in Columns 1 and 2 differ for a few events,the existence of strong optimistic tendenciesis clear in both. The correlation between theratio in Column 2 and the values in Column 1was .90 for both positive and negative events.3
2 All statistical tests reported in this article arctwo-tailed.
3 The possibility that artifacts might have beenintroduced by the use of a response scale with unequalintervals was tested by ignoring the response labelsand simply treating the choices as a 15-point, equal-interval scale. The insensitivity of the results to suchchanges is indicated by the correlation of .98 betweenevent means from this new scale and the mean valuesfrom Column 1. In addition, a pilot study examineda simple scale labeled: "1—below average, 2—slightlybelow average, 3—average, 4—slightly above average,and 5—above average." This scale was completed by98 members of an introductory psychology class forIS of the events included in the present study. A cor-relation of .91 was found between the mean ratingof the events on this S-point scale and the values inthe first column of Table 1.
812 NEIL D. WEINSTEIN
An additional calculation tested whetherdifferences in comparative judgments for posi-tive and negative events might have beencaused by unintended differences in the per-ceived probability, personal experience, per-ceived controllability, or stereotype salienceof the two types of events. To control forthe possible effects of such differences, thepartial correlation was calculated between themean comparative judgments (Column 1) andevent type (a dummy variable differentiatingbetween positive and negative events; —1= negative event; 1 = positive event) con-trolling for these four other variables. Thesignificant result (r = .74, p < .001) demon-strates that event type has a powerful effectindependent of the effects of the other eventcharacteristics.
Event Characteristics Influencing UnrealisticOptimism: Hypotheses 2-6
It is clear from Table 1 that the amountof unrealistic optimism evoked by differentevents varied greatly. In many cases themean comparative judgment was not signifi-cantly different from zero, indicating theabsence of a significant optimistic bias. Hy-potheses 2 through 6 attempt to explain thesevariations. They were each tested separatelyby means of a linear model that included theterms event type (positive or negative), eventcharacteristic (the mean rating for the char-acteristic cited in the hypothesis; medianprobability ratings were used because of thelarge variability of these estimates), and TypeX Characteristic interaction. (Hypothesis 6makes a specific prediction only for negativeevents and was tested by a separate correla-tion coefficient for each type of event.)4
The event characteristic term in the modelstests whether the pooled within-type regres-sion coefficient for that characteristic is sig-nificantly different from zero. The Type XCharacteristic interaction tests whether theregression lines for positive and negativeevents have the same slope.r> The data forthese analyses consisted of the mean com-parative judgments for the 42 events, themean characteristic ratings, and the typedesignations. Consequently, significance testsrefer to the null hypothesis that the effects
are zero in the larger population of eventsfrom which the present sample was drawn."
The significance levels for the event charac-teristic terms and the magnitudes of the cor-responding pooled within-type correlation co-efficients are shown in the first column of
' The dependent variable in the models that testedthe contributions of degree of desirability, perceivedprobability, and personal experience was the meancomparative judgment from Column 1 of Table 1.Hypothesis 5, however, was phrased differently, pre-dicting a positive association between perceived con-trollability and optimism. Therefore, the dependentvariable in the test of this hypothesis was the degreeof optimism produced. For positive events, the meancomparative judgment indicates the size of the opti-mistic bias, but for negative events, the measure ofoptimistic bias was obtained by reversing the signof the mean comparative judgment.
6 If the analysis found no appreciable Type X Char-acteristic interaction (p > .2), the event characteristiceffect was estimated after first removing the eventtype sum of squares from the total sum of squares.If a Type X Characteristic effect did appear to bepresent (p < .2), both event type and Type X Char-acteristic sums of squares were removed before esti-mating the event characteristic effect. The latterprocedure was needed only for degree of desirability,interaction F(\, 38) = 1.91, p = .18, and perceivedcontrollability, interaction F(\, 38) = 3.23, p < .08.
6 Because the data were analyzed on an event basis,with variables averaged over all subjects, it was notnecessary for the same individuals to rate both theevent characteristics and their own chances of ex-periencing the events. What was necessary was thatthe perceptions of the event characteristics and theamount of personal experience with these events beessentially the same for the comparative rating groupand the event rating group. In addition to the factthat all subjects were students at the same university,there are several specific indications that this condi-tion was satisfied. In a pilot study, a mixed-sex groupof students from another of the special interdiscipli-nary courses from which subjects in Study 1 weredrawn rated 21 of the events in Table 1 on threeof the dimensions used here. Correlations between thepilot ratings and those utilized in Study 1 were:controllability, .78; desirability, .98; and probability,.50 (.54 among positive events and .80 among negativeevents). Thus, ratings seem unlikely to change greatlyfrom one group to another, although probabilityratings do seem to be somewhat variable. It was alsofound that the relationships between event charac-teristics (rated by females) and comparative judgmentswere the same when the judgments of male and femalemembers of the comparative rating group were ex-amined separately. Apparently the event character-istic ratings were equally relevant to males andfemales.
UNREALISTIC OPTIMISM ABOUT FUTURE LIFE EVENTS 813
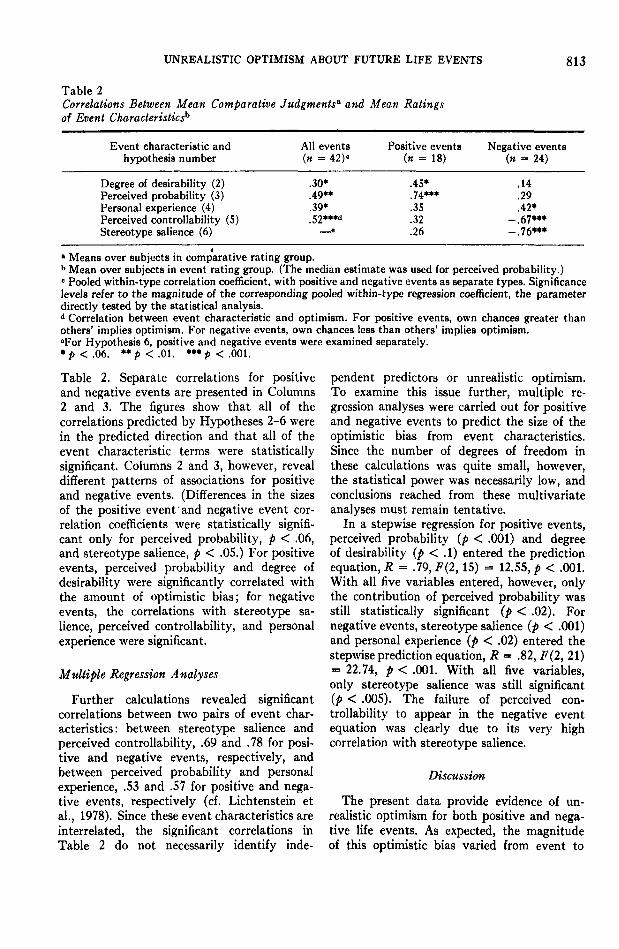
Table 2Correlations Between Mean Comparative Judgments* and Mean Ratingsof Event Characteristics^
Event characteristic andhypothesis number
Degree of desirability (2)Perceived probability (3)Personal experience (4)Perceived controllability (5)Stereotype salience (6)
All events(» = 42)"
.30*
.49**
.39*
.52***"
Positive events(» = 18)
.45*
.74***
.35
.32
.26
Negative events(» = 24)
.14
.29
.42*-.67***-.76***
• Means over subjects in comparative rating group.b Mean over subjects in event rating group. (The median estimate was used for perceived probability.)0 Pooled within-type correlation coefficient, with positive and negative events as separate types. Significancelevels refer to the magnitude of the corresponding pooled within-type regression coefficient, the parameterdirectly tested by the statistical analysis.d Correlation between event characteristic and optimism. For positive events, own chances greater thanothers' implies optimism. For negative events, own chances less than others' implies optimism."For Hypothesis 6, positive and negative events were examined separately.* p < .06. ** p < .01. *** p < .001.
Table 2. Separate correlations for positiveand negative events are presented in Columns2 and 3. The figures show that all of thecorrelations predicted by Hypotheses 2-6 werein the predicted direction and that all of theevent characteristic terms were statisticallysignificant. Columns 2 and 3, however, revealdifferent patterns of associations for positiveand negative events. (Differences in the sizesof the positive event'and negative event cor-relation coefficients were statistically signifi-cant only for perceived probability, p < .06,and stereotype salience, p < .05.) For positiveevents, perceived probability and degree ofdesirability were significantly correlated withthe amount of optimistic bias; for negativeevents, the correlations with stereotype sa-lience, perceived controllability, and personalexperience were significant.
Multiple Regression Analyses
Further calculations revealed significantcorrelations between two pairs of event char-acteristics: between stereotype salience andperceived controllability, .69 and .78 for posi-tive and negative events, respectively, andbetween perceived probability and personalexperience, .53 and .57 for positive and nega-tive events, respectively (cf. Lichtenstein etal., 1978). Since these event characteristics areinterrelated, the significant correlations inTable 2 do not necessarily identify inde-
pendent predictors or unrealistic optimism.To examine this issue further, multiple re-gression analyses were carried out for positiveand negative events to predict the size of theoptimistic bias from event characteristics.Since the number of degrees of freedom inthese calculations was quite small, however,the statistical power was necessarily low, andconclusions reached from these multivariateanalyses must remain tentative.
In a stepwise regression for positive events,perceived probability (p < .001) and degreeof desirability ( /><.!) entered the predictionequation, R = .79, F(2,15) = 12.55, p < .001.With all five variables entered, however, onlythe contribution of perceived probability wasstill statistically significant (p < .02). Fornegative events, stereotype salience (/> < .001)and personal experience (/> < .02) entered thestepwise prediction equation, R = .82, F(2, 21)= 22.74, p < .001. With all five variables,only stereotype salience was still significant(p < .005). The failure of perceived con-trollability to appear in the negative eventequation was clearly due to its very highcorrelation with stereotype salience.
Discussion
The present data provide evidence of un-realistic optimism for both positive and nega-tive life events. As expected, the magnitudeof this optimistic bias varied from event to
814 NEIL D. WEINSTEIN
event, but most of the variability could beexplained by reference to a few dimensionson which the events differed.
Although all six hypotheses posed in theintroduction were supported, different factorsappeared to govern responses to positive andnegative events. For negative events, opti-mism, perceived controllability, and stereotypesalience were all strongly intercorrelated.When an event was judged to be controllable,a stereotype existed in subjects' minds of thekind of person to whom the event generallyoccurred. Presumably, this person was believedto be at risk because he or she failed to takeany action to control the risk. Subjects seemedto compare themselves with the stereotypicvictim, leading them to conclude that theirown risks were less than average. For eventsperceived to be uncontrollable, there was nostereotype of the victim, and subjects did notshow any systematic bias.
In retrospect, some of the different correla-tions for positive events are not surprising.It seems likely that everyone would want toavoid the negative events in this study; yetjust because the result of an event is desirabledoes not mean that everyone is committedto achieving that result. For example, anaward for community service may be veryattractive, but it may be a goal for very fewpeople. The finding that optimism was notgreater among the positive events judged tobe controllable or found to be associated witha stereotypic, high-chance group may simplyreflect the fact that many subjects were notattempting to control (i.e., influence) theseevents.
This same explanation may account for thestrong correlation for positive events betweenperceived probability and comparative judg-ments. Examination of the positive eventsin Table 1 suggests that the high probabilityevents are the only ones likely to be widelyaccepted as personal goals. Subjects are pre-sumably working toward these goals, andbecause their efforts should increase the likeli-hood that they will succeed, they mistakenlyconclude that their prospects are better thanaverage. Of course, one can only work towarda goal if the outcome is somewhat controllable,and in fact, the high probability positiveevents in the study were also relatively high
in controllability.7 There is no obvious reasonwhy personal experience and degree of de-sirability were significant for one type of eventbut not the other.
Thus, for both positive and negative events,an optimistic bias appears to result when twoconditions are satisfied. First, the event isperceived to be controllable, so that there arethings one can do or contemplate doing toinfluence the event. Second, people have somedegree of commitment or emotional invest-ment in the outcome. Under these conditions,optimism arises because people compare them-selves with an inappropriate standard: a personwho does little or nothing to improve his orher prospects.
Contrary to expectations based on a moti-vational interpretation of optimism, degree ofdesirability had no appreciable effect on thesize of the optimistic bias for negative events.In fact, optimism was not appreciably greaterfor the seven life threatening events in thesample—numbers 20, 22, 25, 28, 38, 39, and 42(M =— 20.4%)—than for the other negativeevents (M = -19.5%).
Study 2
Previously it was suggested that people maybe optimistically biased because their imageof other people is inaccurate or incomplete.Aware of the factors that improve their own
7 The proposed difference in commitment betweenthe positive and negative events in this study wassubjected to a preliminary test. A mixed-sex groupof students from Cook College (n = 64) rated allevents on a scale that ranged from 1 (not at all im-portant to me whether or not the event occurs) to 4(quite important to me whether or not the eventoccurs). It was expected that: (a) negative eventswould be rated higher in importance than positiveevents; (b) importance would be positively correlatedwith optimism for both positive and negative events;and (c) for positive events, importance would bestrongly related to event probability. The resultsstrongly supported all three predictions. Mean ratingsof importance for negative and positive events were3.22 and 2.58, respectively, <(40) = 4.05, p < .001.The correlation of importance with optimism was .62(p < .01) for positive events, and .46 (p < .025) fornegative events. Finally, importance and probabilitywere strongly correlated for positive events, .63(p < .01), but uncorrelated for negative events(-.22, ns).
UNREALISTIC OPTIMISM ABOUT FUTURE LIFE EVENTS 815
chances of achieving desirable outcomes, theymay not realize that others may have just asmany factors in their favor. The differentconditions created in Study 2 were designedto manipulate subjects' awareness of thefactors that other people consider when esti-mating their chances of experiencing variousevents.
Subjects in Study 2 made written lists ofthe factors that increase or decrease thelikelihood that specific events would happento them. (It was hypothesized that peoplenormally prepare similar mental lists whenmaking comparative judgments, so requiringsubjects to prepare such lists was not expectedto influence their optimism.) Some subjectswere then given copies of the lists generatedby others and asked to make comparativejudgments of their chances of experiencingthese events as in Study 1. It was predictedthat exposure to others' lists would decreaseand perhaps eliminate subjects' optimisticbiases. Furthermore, since participants in thisexperiment both made comparative judgmentsand listed the event-influencing reasons, it waspossible to examine the relationship betweenthese two variables at the individual level.
One other variable was added to the ex-periment to examine the possibility that sub-jects in Study 1 were incorrectly reportingthe perceived likelihood that events wouldhappen to them rather than the relativelikelihood using their peers as a comparisongroup. Half of the subjects in each conditionof Study 2 were explicitly warned aboutmaking this mistake and received suggestionsdesigned to help them remember to makecomparative judgments.
Method
Subjects
Students in this experiment were 120 female mem-bers of an introductory psychology class at RutgersUniversity who participated to fulfill a course require-ment.
Materials
Comparative rating booklets. A booklet was pre-pared containing many of the events that had evokedunrealistic optimism in Study 1. The booklet wasdivided into three parts (pretreatment events, treat-ment events and posttreatment events) that were
similar in the numbers of positive and negative eventsand the amount of optimistic bias that had beenproduced by these events. The exact sequence ofevents (using identification numbers from Table 1)was: 8, 24, 40, 13, 23, 30, 1, 22, and 27 (pretreatmentevents); 31, 2, 19, 25, 32, 3, 21, and 26 (treatmentevents); and 10, 34, 38, 11, 28, 36, 4, 20, and 29(posttreatment events). The response format was un-changed from Study 1.
A cover sheet on half of the booklets was entitledWarning. It stated: "It's easy to forget the directionsand start to respond to events in terms of how likelythey are INSTEAD of how likely they are for you com-pared to other students . . . . Don't do that." A spe-cific example was then given. The warning concluded:"To help you keep this in mind, when you sec thechoice '40% more,' think of it as 'my chances are40% more than other students'.' "
Own reasons lists. Subjects generated lists of thefactors that tend to increase or decrease the chancesthat the eight treatment events would happen tothem. A detailed instruction sheet requested subjectsto "think of things you do now and things you mightdo in the future" and to think of any personal charac-teristics—"including your personality, abilities, physi-cal characteristics, attitudes, etc."—that would in-fluence the chance of this event happening to them.
Others' reasons packets. During the first day of theexperiment only control groups were tested. Multiplecopies of the lists of personal reasons prepared bythese groups were prepared. The packets of others'reasons given to subjects in the experimental groupwere then made up. Each packet contained five listschosen at random from among the 19 lists that hadbeen reproduced. Twenty-five different packets wereprepared in this way. This random-selection procedureassured that, on the average, the reasons read bysubjects in the experimental group were just as nu-merous and as optimistic as the reasons they listedthemselves.
Procedure
Three different conditions were created, one experi-mental condition and two controls. During everysession, two of the three conditions were conductedsimultaneously in adjacent rooms by different experi-menters. Subjects arriving for the study were assignedrandomly to one of these conditions. All subjectsworked independently.
The experimenters' introductory instructions wereessentially the same as those in Study 1. Subjects inall conditions then made comparative judgments forthe pretreatment events. Next, members of the ex-perimental group (n — 39) were told, "We want toget your thoughts about the factors that increase ordecrease the chances that certain events will happento you," and they were given a blank form on whichto list their own reasons concerning the treatmentevents. Then experimental group subjects receivedone of the packets of others' reasons for these sameevents along with the explanation: "These forms weretaken at random from people who were in our study

816 NEIL D. WEINSTEIN
Table 3Optimism of Experimental Groups onDifferent Sets of Events
% difference between ownchances and others' chances
Events
Experi-mentalgroup'
ControlGroup lb
ControlGroup 2°
Positive events
PretreatmentTreatmentPosttreatment
11.017.318.3
18.024.027.2
14.440.121.4
Negative events
PretreatmentTreatmentPosttreatment
-24.2-17.4-13.2
-25.6-31.7-12.2
-31.5-35.7-15.5
Note. Entries are group means over all events of thetype specified. All means are significantly differentfrom zero, p < .001.• Own and others' reasons group, n = 39. b Ownreasons group, n = 41. ° No reasons group, n = 40.
in the past. Each set is different. Their ideas may behelpful to you in estimating how your chances com-pare to others', but keep in mind that you're sup-posed to compare yourself with all Rutgers females,not just these five." Finally, experimental group sub-jects made comparative judgments for the treatmentevents and for the posttreatment events.
Control Group 1 (» = 41) was employed to testwhether just listing one's own reasons might influencethe degree of optimism expressed on treatment events.Their procedure differed from the experimental grouponly in that they did not receive the packet of others'reasons. Members of Control Group 2 (n = 40) madecomparative judgments without either generatingtheir own lists of reasons or seeing lists produced byother students. Subjects in Control Group 2 did,however, list their own reasons for the treatmentevents after they finished the comparative ratingbooklet.
Half of the subjects in each group received a com-parative rating booklet with the cover sheet warningthem to make comparative judgments. To concludethe sessions, participants in all conditions rated thecharacteristics of 21 events as described in Study 1.
Results and Discussion
Effects of Experimental Treatments
Mean comparative judgments are presentedin Table 3 for each of the. three groups in thestudy. Figures are given for each set of events,and values for positive and negative eventsare presented separately.
The data were first examined by an analysisof variance that included the variables group,warning, and event set. Event set was awithin-subject variable, whereas group andwarning were between-subjects variables. Posi-tive and negative events were tested separately.The calculations revealed that the warningmanipulation main effects and interactionswere not significant, ps > .2. Apparently,even without the extra reminder, subjectsunderstood the comparative nature of thetask and tried to compare their own chanceswith those of other students.
In contrast, Group X Event Set interac-tions for both negative and positive eventswere statistically significant, F(4, 227) = 2.80,p < .05, and jF(4, 227) = 2.48, p < .05, re-spectively. These interactions show that theexperimental treatments did change the re-sponses of the experimental groups. Thesechanges were studied in additional analysesthat treated pretreatment event responses ascovariates and tested for group differences ontreatment and posttreatment events (Huck& McLean, 1975). These calculations showedthat the manipulations produced group dif-ferences on negative and positive treatmentevents, F(2, 116) = 6.20, p < .005, andF(2, 116) = 5.06, p < .01, respectively. Com-parisons among the covariance adjusted nega-tive events means (SAS Institute, 1979)indicated that the experimental group wassignificantly less optimistic than the twocontrol groups (/>s < .005), and that thecontrol groups did not differ from one another(p > .2). For positive events, both the ex-perimental group and Control Group 1 weresignificantly less optimistic than ControlGroup 2 (p < .01), but they did not differfrom one another.
The negative event results provide supportfor the proposition that people tend to usean inaccurate image of others when makingcomparative judgments. In the case of posi-tive events, however, just asking subjects tolist the factors that influence their ownchances decreased their optimism, and pro-viding information about others had no ad-ditional effect. This second finding suggeststhat people's first thoughts about their futuremay be more optimistic than their later, morereflective conclusions. Further research is
UNREALISTIC OPTIMISM ABOUT FUTURE LIFE EVENTS 817
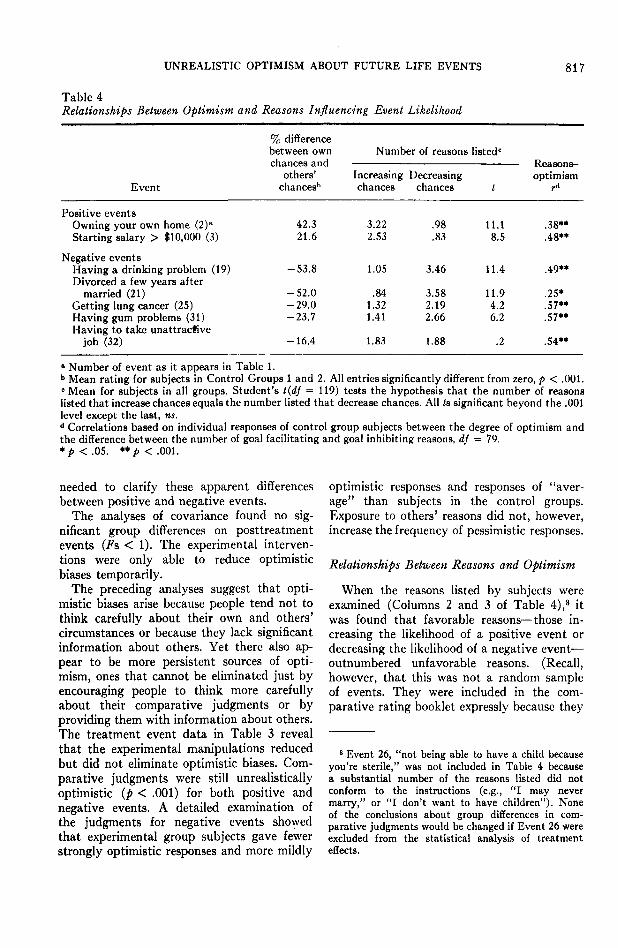
Table 4Relationships Between Optimism and Reasons Influencing Event Likelihood
Event
Positive eventsOwning your own home (2)1
Starting salary > $10,000 (3)
% differencebetween ownchances and
others'chancesb
42.321.6
Number of reasons
Increasingchances
3.222.53
Decreasingchances
.98
.83
listed"
t
11.18.5
Reasons-optimism
rd
.38**
.48**
Negative eventsHaving a drinking problem (19) -53.8 1.05 3.46 11.4 .49**Divorced a few years after
married (21) -52.0 .84 3.58 11.9 .25*Getting lung cancer (25) -29.0 1.32 2.19 4.2 .57**Having gum problems (31) -23.7 1.41 2.66 6.2 .57**Having to take unattractive
job (32) -16.4 1.83 1.88 .2 .54**
• Number of event as it appears in Table 1.b Mean rating for subjects in Control Groups 1 and 2. All entries significantly different from zero, p < .001.0 Mean for subjects in all groups. Student's t(df = 119) tests the hypothesis that the number of reasonslisted that increase chances equals the number listed that decrease chances. All /s significant beyond the .001level except the last, ns.d Correlations based on individual responses of control group subjects between the degree of optimism andthe difference between the number of goal facilitating and goal inhibiting reasons, df — 79.V < .05. **p<.001.
needed to clarify these apparent differencesbetween positive and negative events.
The analyses of covariance found no sig-nificant group differences on posttreatmentevents (Fs < 1). The experimental interven-tions were only able to reduce optimisticbiases temporarily.
The preceding analyses suggest that opti-mistic biases arise because people tend not tothink carefully about their own and others'circumstances or because they lack significantinformation about others. Yet there also ap-pear to be more persistent sources of opti-mism, ones that cannot be eliminated just byencouraging people to think more carefullyabout their comparative judgments or byproviding them with information about others.The treatment event data in Table 3 revealthat the experimental manipulations reducedbut did not eliminate optimistic biases. Com-parative judgments were still unrealisticallyoptimistic (p < .001) for both positive andnegative events. A detailed examination ofthe judgments for negative events showedthat experimental group subjects gave fewerstrongly optimistic responses and more mildly
optimistic responses and responses of "aver-age" than subjects in the control groups.Exposure to others' reasons did not, however,increase the frequency of pessimistic responses.
Relationships Between Reasons and Optimism
When the reasons listed by subjects wereexamined (Columns 2 and 3 of Table 4),8 itwas found that favorable reasons—those in-creasing the likelihood of a positive event ordecreasing the likelihood of a negative event-outnumbered unfavorable reasons. (Recall,however, that this was not a random sampleof events. They were included in the com-parative rating booklet expressly because they
8 Event 26, "not being able to have a child becauseyou're sterile," was not included in Table 4 becausea substantial number of the reasons listed did notconform to the instructions (e.g., "I may nevermarry," or "I don't want to have children"). Noneof the conclusions about group differences in com-parative judgments would be changed if Event 26 wereexcluded from the statistical analysis of treatmenteffects.
818 NEIL D. WEINSTEIN
had evoked unrealistic optimism in Study 1.)The size of the / statistics in Column 4 de-monstrates that the preponderance of favor-able reasons was very consistent acrosssubjects.
Further calculations revealed that there wasgreater excess of favorable reasons for the twonegative treatment events that had producedthe greatest optimism (Events 19 and 21)than for the two negative events that evokedthe least optimism (Events 31 and 32), /(119)= 8.71, p < .001. Similarly, the excess offavorable reasons over unfavorable reasonswas greater for positive Event 2, whichelicited strong optimism, than for positiveEvent 3, which evoked less optimism, /(119)= 2.16, p < .05.
The last column in Table 4 shows that thisrelationship between the kinds of reasonslisted and the degree of optimism persistsbetween subjects. When individual studentsin Control Groups 1 and 2 made their com-parative judgments,9 the responses they gavefor each event correlated strongly with thedifference between the number of likelihood-increasing and likelihood-decreasing reasonsthey had listed for those events. The magni-tudes of these correlations were the samewhether they were based only on ControlGroup 1 subjects, who listed their reasonsbefore estimating their chances, or ControlGroup 2 subjects, who listed their reasonsonly after completing the comparative ratingbooklet. This close correspondence betweenthe degree of optimism reported and thenumber of favorable and unfavorable reasonslisted—both across events and between sub-jects within events—reinforces the suggestionthat the generation of similar mental listsforms an important stage in the process ofdeciding whether one's own chances differfrom average.
Relationship of Desirability to OptimismBetween Subjects
A final set of calculations looked for anassociation between an individual's rating ofthe desirability of an event and the degreeof optimism shown by that individual. Cor-relation coefficients based on data from Groups2 and 3 between desirability ratings and opti-
mism were greater than zero for seven of theeight positive events, but the coefficients werequite small (median r = .14). For negativeevents, the correlations tended to be negativeand small (13 negative, 5 positive, medianr = .13). That is, individual students whoregarded a negative event as particularlyundesirable were slightly more optimisticabout avoiding it than students who did notthink that the event was so undesirable,a finding similar to that reported by Kirsehtet al. (1966). Thus, 20 of 26 correlationcoefficients were in the direction predicted bya motivational interpretation of optimisticbiases (p < .01 by the binomial test).
General Discussion
In the past, unrealistic optimism about thefuture was regarded as a defensive phenome-non, a distortion of reality motivated to reduceanxiety (e.g., Kirseht et al., 1966; Lund,1925). The present article has described severalways in which purely cognitive errors mightbe responsible for optimistic biases. Twostudies were carried out to test hypothesesabout the conditions under which unrealisticoptimism would appear, hypotheses derivedfrom both cognitive and motivational con-siderations. Although the results provide somesupport for both points of view, the studieswere not designed to pit one against theother, nor is there any reason why optimismcannot have both cognitive and motivationalsources.
What these investigations have demon-strated is the existence of an optimistic biasconcerning many future life events. As pre-dicted in Hypothesis 1, students tend tobelieve that they are more likely than theirpeers to experience positive events and lesslikely to experience negative events. Cognitiveand motivational considerations led to theidentification of five event characteristics—degree of desirability, perceived probability,personal experience, perceived controllability,and stereotype salience (Hypotheses 2-6)—
9 Data from subjects in the experimental group wereexcluded from these calculations and from Column 1of Table 4 because their comparative judgments hadbeen affected by the lists of others' reasons.

UNREALISTIC OPTIMISM ABOUT FUTURE LIFE EVENTS 819
that were shown in Study 1 to determine theamount of optimistic bias evoked by differentevents. It was also demonstrated in Study 2that providing information about the attri-butes and actions of others reduced the opti-mistic bias for negative events but did noteliminate it.
The results suggest a mechanism that maypartly explain these optimistically biased ex-pectations. In comparing their chances withthose of their classmates, it appears thatstudents brought to mind any personal actions,plans, or attributes that might affect theirchances of experiencing the events. If anevent was one they perceived to be con-trollable and if they were commited to aparticular outcome, the majority of factorsthey brought to mind were ones that in-creased the likelihood that it would turn outthe way they would like. Comparing them-selves to an unrealistic stereotype of a personwho does nothing to improve his or herchances or even engages in counterproductiveactivity, students concluded that their ownprospects were better than average.
Yet there seems to be more to unrealisticoptimism than just an inappropriate com-parison group or a possible bias in the recallof relevant actions, plans, and attributes.When experimental group subjects in Study 2received the packet of event-influencing fac-tors listed by other students, they shouldhave concluded that their chances were aboutthe same as those of their classmates. Theirclassmates had listed the same types ofreasons and just as many optimistic reasonsas they had. Instead, subjects continued toclaim that they were more likely to ex-perience positive events and less likely toexperience negative events. Unfortunately, wedo not know how they justified this conclusion.
Further research is obviously needed to testthe event characteristics and mechanisms pro-posed here, with other populations of subjects,with a wider sample of events, and with othermethods of assessing optimism. Optimisticbiases may be much less prevalent amongolder people, for example. Studies must alsoexamine the relationship between unrealisticoptimism and self-protective behavior. Peoplewho believe, falsely, that their personal at-tributes exempt them from risk or that their
present actions reduce their risks below thoseof other people may be inclined to engage inrisky behaviors and to ignore precautions. Todiscover whether unrealistic optimism about thefuture increases individual and societal vul-nerability to disease, accidents, criminal vic-timization, and hazard loss is thus a centralgoal for future research.
Reference Notes
1. Weinstein, N. D. Coping with environmental hazards:Reactions to the threat of crime. Paper presented at themeeting of the American Psychological Association,San Francisco, September 1977.
2. American Cancer Society. A study of motivationaland environmental deterrents to the taking of physicalexaminations that include cancer tests. Unpublishedreport, 1966. (Available on loan from MedicalLibrary, American Cancer Society, 219 East 42ndStreet, New York, New York 10017.)
3. Hoffman, D. M., and Brewer, M. B. Perception ofrape: A subjective probability analysis. Paper pre-sented at the meeting of the American Psycho-logical Association, Toronto, Canada, September1978.
References
Cantril, H. The prediction of social events. Journalof Abnormal and Social Psychology, 1938,33, 364-389.
Harris, D. M., & Guten, S. Health protective behavior:An exploratory study. Journal of Health and SocialBehavior, 1979, 20, 17-29.
Huck, S. W., & McLean, R. A. Using a repeatedmeasures ANOVA to analyze the data from a pretest-posttest design: A potentially confusing task. Psy-chological Bulletin, 1975, 82, 511-518.
Irwin, F. W. Stated expectations as functions ofprobability & desirability of outcomes. Journalof Personality, 1953, 21, 329-335.
Jones, E. E., & Nisbett, R. E. The actor and theobserver: Divergent perceptions of the causes ofbehavior. In E. E. Jones et al. (Eds.), Attribution:Perceiving the causes of behavior. Morristown, N.J.:General Learning Press, 1971.
Kahneman, D., & Tversky, A. Subjective probability:A judgment of representativeness. Cognitive Psy-chology, 1972, 3, 430-454.
Kirscht, J. P., Haefner, D. P., Kegeles, S. S., & Rosen-stock, I. M. A national study of health beliefs.Journal of Health and Human Behavior, 1966, 7,248-254.
Langer, E. J., & Roth, J. Heads I win, tails it's chance:The illusion of control as a function of the sequenceof outcomes in a purely chance task. Journal ofPersonality and Social Psychology, 1975, 32, 951-955.
Lichtenstein, S., Slovic, P., Fischhoff, B., Layman, M.,& Combs, B. Judged frequency of lethal events.Journal of Experimental Psychology: Human Learningand Memory, 1978, 4, 551-578.
820 NEIL D. WEINSTEIN
Lund, F. H. The psychology of belief. Journal ofAbnormal and Social Psychology, 1925, 20, 63-81;174-196.
Marks, R. W. The effect of probability, desirability,and privilege on the stated expectations of children.Journal of Personality, 1951, 19, 431-465.
McGregor, D. The major determinants of the predic-tion of social events. Journal of Abnormal and SocialPsychology, 1938, 33, 179-204.
McGuire, W. J. A syllogistic analysis of cognitiverelationships. In M. J. Rosenberg, C. I. Hovland,W. J. McGuire, R. P. Abelson, & J. W. Brehm(Eds.), Attitude organization and change. New Haven:Yale University Press, 1960.
Miller, D. T., & Ross, M. Self-serving biases in theattribution of causality: Fact or fiction? Psycho-logical Bulletin, 1975, 82, 213-225.
Robertson, L. S. Car crashes: Perceived vulnerabilityand willingness to pay for crash protection. Journalof Community Health, 1977, 3, 136-141.
Ross, L., Greene, D., & House, P. The "false con-sensus effect": An egocentric bias in social percep-
tion and attribution processes. Journal of Experi-mental Social Psychology, 1977, 13, 279-301.
Ross, M., & Sicoly, F. Egocentric biases in availabilityand attribution. Journal of Personality and SocialPsychology, 1979, 37, 322-337.
SAS Institute. User's guide to SAS (1979 ed.), Raleigh,North Carolina: Author, 1979.
Slovic, P., Kunreuther, H., & White, G. F. Decisionprocesses, rationality, and adjustment to naturalhazards. In G. F. White (Ed.), Natural Hazards:Local, national, global. New York: Oxford UniversityPress, 1974.
Tversky, A., & Kahneman, D. Availability: A heu-ristic for judging frequency and probability. Cogni-tive Psychology, 1973, 5, 207-232.
Tversky, A., & Kahneman, D. Judgment under un-certainty: Heuristics and biases. Science, 1974, 185,1124-1131.
Tversky, A., & Kahneman, D. Causal schemata injudgments under uncertainty. In M. Fishbein (Ed.),Progress in social psychology. Hillsdale, N.J.: Erl-baum, 1977.
Received August 27, 1979 •