Embed Size (px)
Citation preview
Market insight
By Panos Makrinos
Offshore Director
Amidst a challenging dry bulk and tanker market, very little time has been spent on the offshore industry developments during the past couple of years. The harsh reality is that offshore owners have been dealing with equally bad and sometimes even worse conditions that those owners in the more conventional sectors have been facing.
Since the second half of 2014 and up until today, offshore owners have wit-nessed a very depressed and volatile market, while as the majority of indus-try specialists all around keeps stressing that the market is due to face at least another couple of difficult years before things start to improve, senti-ment remains very fragile.
The key factor behind this depressed and volatile offshore marker has with-out a doubt been the continuous decrease in the crude oil price, which pri-marily happened for two reasons. On one hand there was/is the over-supply in production/stock combined with decreased demand for crude oil in Eu-rope, China and a number of developing economies. The second reason is the lack of a common strategic approach between OPEC and non-OPEC countries that has consistently been weighing down on crude oil prices since 2014. In fact, from the level of $115/bbl in June 2014, prices reached $35/bbl in February 2016 and have currently settled at around $46/bbl. Irrespec-tively of how optimistic someone is, the above is certainly evidence that unless very specific and collective action on behalf of major producers takes place, prices will need sufficient time in order to reach again levels closer to $100/bbl.
The current lows have led major oil and gas companies to significant losses, with the majority of them trying to alter their strategic approach and to minimize their investments with respect to production and exploration. Global investment in production and exploration has in fact fallen from $700 billion in 2014 to around $580 billion in 2015, while a decrease of at least 20% is expected this year. The end of 2016 will also mark the first time that the offshore industry witnesses three years of continuous decrease in invest-ment production.
The cost/investment downsize approach that oil companies are undertaking, is directly affecting oil workers and companies owning OSV (Offshore Supply Vessels) that provide services in re-supply functions and towage or rescue services to offshore drilling platforms. As expected, in the current state of the market, oversupply poses a major issue in both the Anchor Handling Tug Supply (AHTS) as well as the Platform Supply Vessels (PSVs) fleet, while tak-ing into account the new-building vessels that will be delivered in the re-mainder of 2016 as well as during next year, we expect excess supply to keep weighing down on the market for longer. Having identified the specific issue, big offshore groups like MAERSK for example, which own the specific vessels types, have announced that they will recycle, modify or sell to non-Oil and Gas owners in order to minimize the help tackle the issue.
This over-supply in the offshore market has resulted in both modern and older offshore vessels being offered for sale in very attractive prices com-pared to previous years but also with respect to the price these were built, creating without a doubt asset play opportunities for those willing to risk a prolonged - possible beyond 2018 - market downturn.
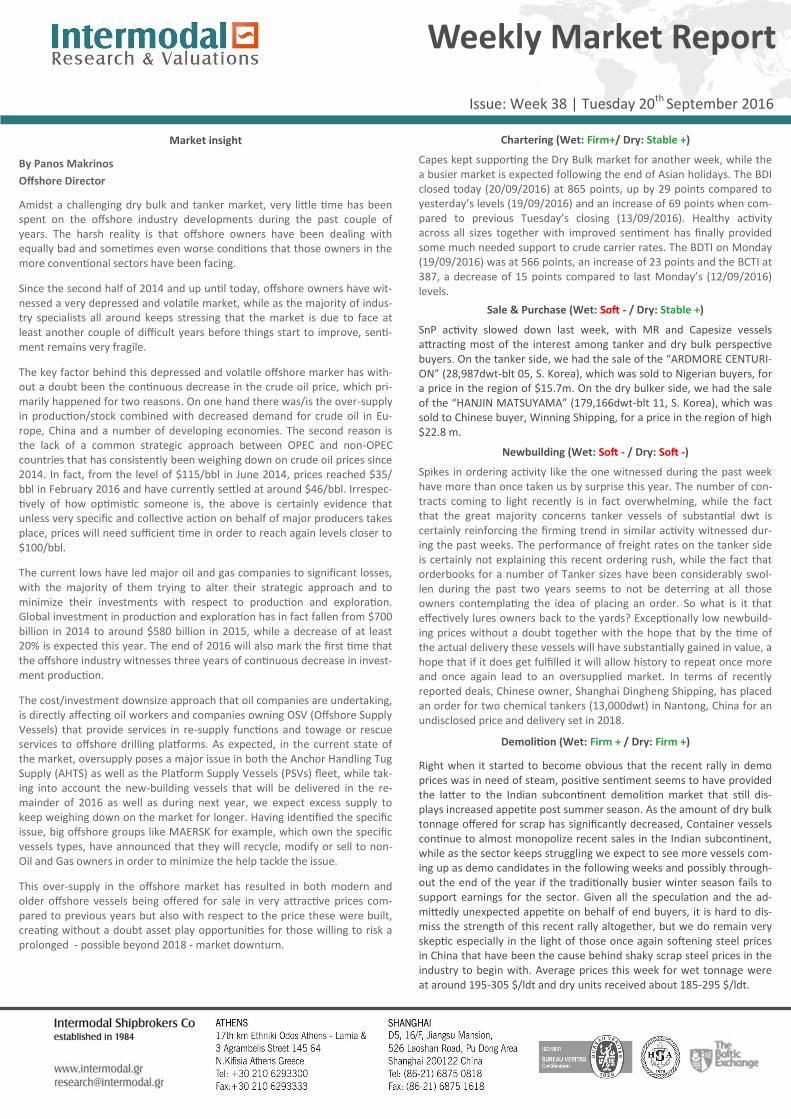
Chartering (Wet: Firm+/ Dry: Stable +)
Capes kept supporting the Dry Bulk market for another week, while the a busier market is expected following the end of Asian holidays. The BDI closed today (20/09/2016) at 865 points, up by 29 points compared to yesterday’s levels (19/09/2016) and an increase of 69 points when com-pared to previous Tuesday’s closing (13/09/2016). Healthy activity across all sizes together with improved sentiment has finally provided some much needed support to crude carrier rates. The BDTI on Monday (19/09/2016) was at 566 points, an increase of 23 points and the BCTI at 387, a decrease of 15 points compared to last Monday’s (12/09/2016) levels.
Sale & Purchase (Wet: Soft - / Dry: Stable +)
SnP activity slowed down last week, with MR and Capesize vessels attracting most of the interest among tanker and dry bulk perspective buyers. On the tanker side, we had the sale of the “ARDMORE CENTURI-ON” (28,987dwt-blt 05, S. Korea), which was sold to Nigerian buyers, for a price in the region of $15.7m. On the dry bulker side, we had the sale of the “HANJIN MATSUYAMA” (179,166dwt-blt 11, S. Korea), which was sold to Chinese buyer, Winning Shipping, for a price in the region of high $22.8 m.
Newbuilding (Wet: Soft - / Dry: Soft -)
Spikes in ordering activity like the one witnessed during the past week have more than once taken us by surprise this year. The number of con-tracts coming to light recently is in fact overwhelming, while the fact that the great majority concerns tanker vessels of substantial dwt is certainly reinforcing the firming trend in similar activity witnessed dur-ing the past weeks. The performance of freight rates on the tanker side is certainly not explaining this recent ordering rush, while the fact that orderbooks for a number of Tanker sizes have been considerably swol-len during the past two years seems to not be deterring at all those owners contemplating the idea of placing an order. So what is it that effectively lures owners back to the yards? Exceptionally low newbuild-ing prices without a doubt together with the hope that by the time of the actual delivery these vessels will have substantially gained in value, a hope that if it does get fulfilled it will allow history to repeat once more and once again lead to an oversupplied market. In terms of recently reported deals, Chinese owner, Shanghai Dingheng Shipping, has placed an order for two chemical tankers (13,000dwt) in Nantong, China for an undisclosed price and delivery set in 2018.
Demolition (Wet: Firm + / Dry: Firm +)
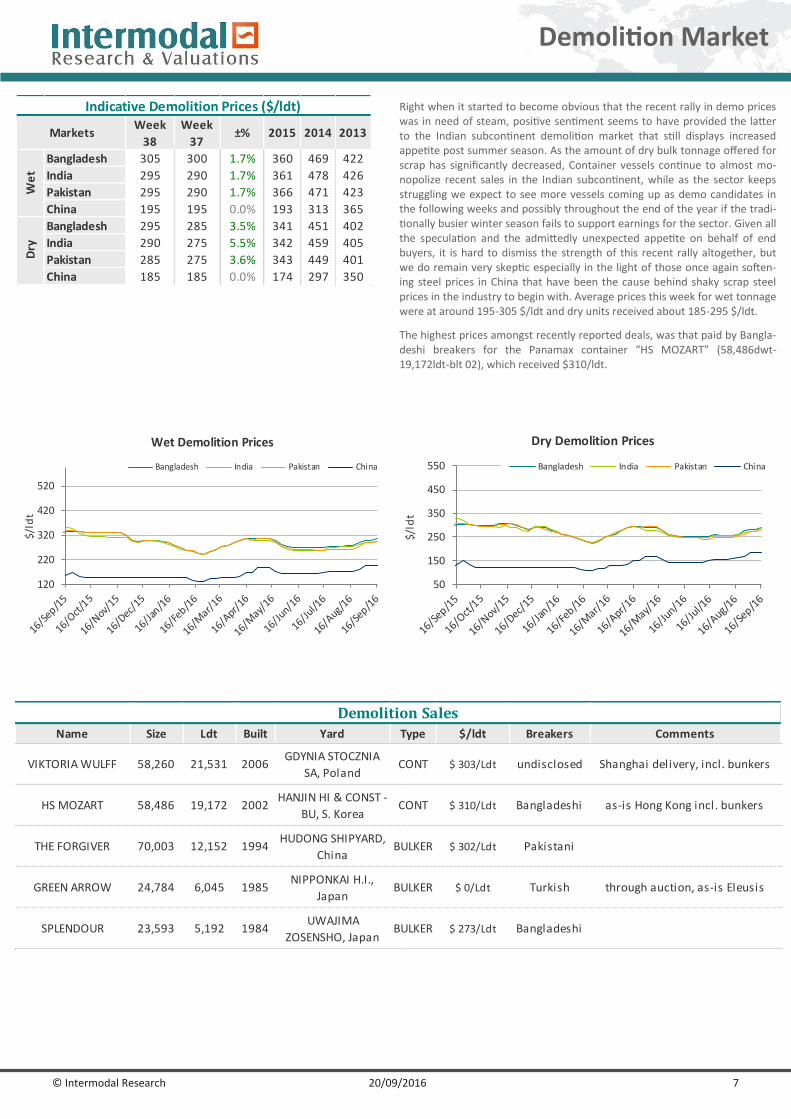
Right when it started to become obvious that the recent rally in demo prices was in need of steam, positive sentiment seems to have provided the latter to the Indian subcontinent demolition market that still dis-plays increased appetite post summer season. As the amount of dry bulk tonnage offered for scrap has significantly decreased, Container vessels continue to almost monopolize recent sales in the Indian subcontinent, while as the sector keeps struggling we expect to see more vessels com-ing up as demo candidates in the following weeks and possibly through-out the end of the year if the traditionally busier winter season fails to support earnings for the sector. Given all the speculation and the ad-mittedly unexpected appetite on behalf of end buyers, it is hard to dis-miss the strength of this recent rally altogether, but we do remain very skeptic especially in the light of those once again softening steel prices in China that have been the cause behind shaky scrap steel prices in the industry to begin with. Average prices this week for wet tonnage were at around 195-305 $/ldt and dry units received about 185-295 $/ldt.
Weekly Market Report
Issue: Week 38 | Tuesday 20th September 2016
© Intermodal Research 20/09/2016 2
2015 2014
WS
points$/day
WS
points$/day $/day $/day
265k MEG-JAPAN 34 13,668 34 13,141 4.0% 65,906 30,469
280k MEG-USG 24 9,333 24 8,651 7.9% 49,575 17,173
260k WAF-USG 47.5 27,349 45 26,054 5.0% 76,251 40,541
130k MED-MED 70 22,119 55 13,012 70.0% 50,337 30,950
130k WAF-USAC 63 18,400 48 10,557 74.3% 40,490 24,835
130k BSEA-MED 67 20,258 52.5 11,159 81.5% 50,337 30,950
80k MEG-EAST 62.5 7,809 62.5 7,301 7.0% 34,131 19,956
80k MED-MED 95 18,115 73 9,754 85.7% 37,127 28,344
80k UKC-UKC 97 18,294 92.5 13,613 34.4% 39,338 33,573
70k CARIBS-USG 90 13,130 103 17,828 -26.4% 36,519 25,747
75k MEG-JAPAN 75 9,871 95 14,996 -34.2% 30,482 16,797
55k MEG-JAPAN 87 9,979 95 11,261 -11.4% 24,854 14,461
37K UKC-USAC 70 2,213 75 2,647 -16.4% 19,973 10,689
30K MED-MED 100 1,694 100 1,552 9.1% 24,473 18,707
55K UKC-USG 87 10,826 85 9,860 9.8% 27,228 23,723
55K MED-USG 87 11,063 82.5 9,420 17.4% 26,083 21,089
50k CARIBS-USAC 85 8,521 85 8,277 2.9% 27,146 25,521
Dir
tyA
fram
axC
lean
VLC
CSu
ezm
ax
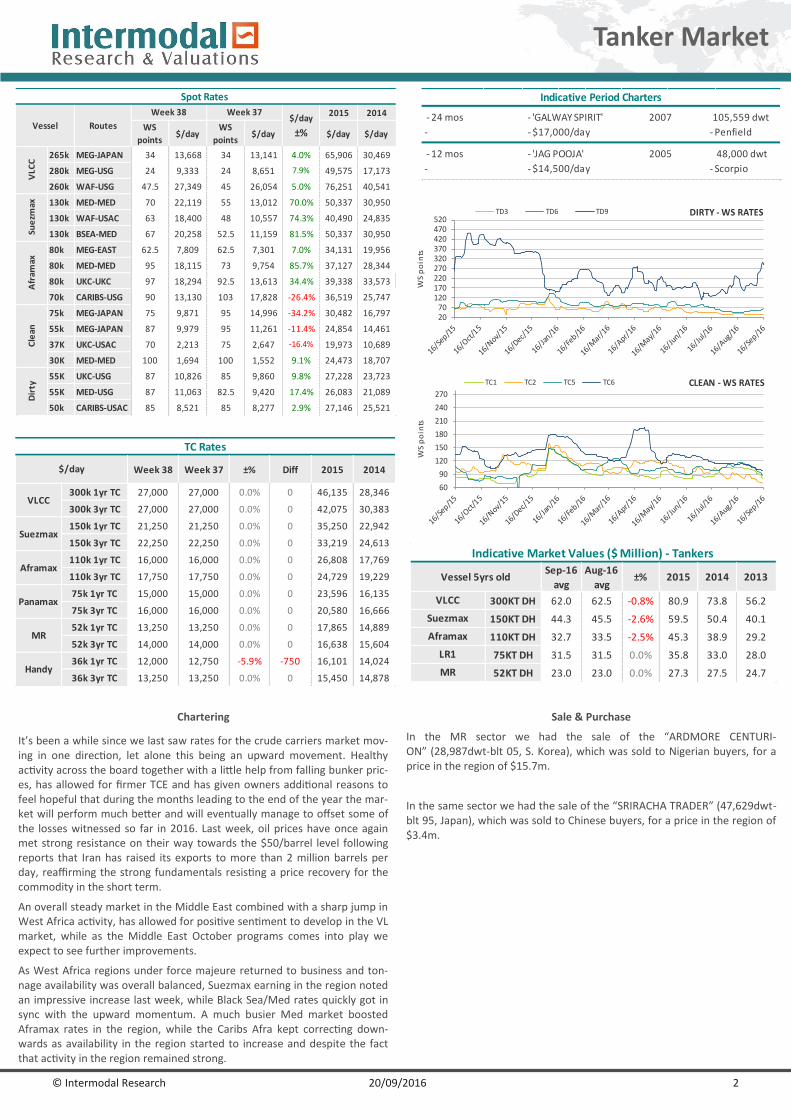
Spot Rates
Vessel Routes
Week 38 Week 37$/day
±%
Sep-16
avg
Aug-16
avg±% 2015 2014 2013
300KT DH 62.0 62.5 -0.8% 80.9 73.8 56.2
150KT DH 44.3 45.5 -2.6% 59.5 50.4 40.1
110KT DH 32.7 33.5 -2.5% 45.3 38.9 29.2
75KT DH 31.5 31.5 0.0% 35.8 33.0 28.0
52KT DH 23.0 23.0 0.0% 27.3 27.5 24.7
VLCC
Suezmax
Indicative Market Values ($ Million) - Tankers
Vessel 5yrs old
MR
Aframax
LR1
Chartering
It’s been a while since we last saw rates for the crude carriers market mov-ing in one direction, let alone this being an upward movement. Healthy activity across the board together with a little help from falling bunker pric-es, has allowed for firmer TCE and has given owners additional reasons to feel hopeful that during the months leading to the end of the year the mar-ket will perform much better and will eventually manage to offset some of the losses witnessed so far in 2016. Last week, oil prices have once again met strong resistance on their way towards the $50/barrel level following reports that Iran has raised its exports to more than 2 million barrels per day, reaffirming the strong fundamentals resisting a price recovery for the commodity in the short term.
An overall steady market in the Middle East combined with a sharp jump in West Africa activity, has allowed for positive sentiment to develop in the VL market, while as the Middle East October programs comes into play we expect to see further improvements.
As West Africa regions under force majeure returned to business and ton-nage availability was overall balanced, Suezmax earning in the region noted an impressive increase last week, while Black Sea/Med rates quickly got in sync with the upward momentum. A much busier Med market boosted Aframax rates in the region, while the Caribs Afra kept correcting down-wards as availability in the region started to increase and despite the fact that activity in the region remained strong.
Sale & Purchase
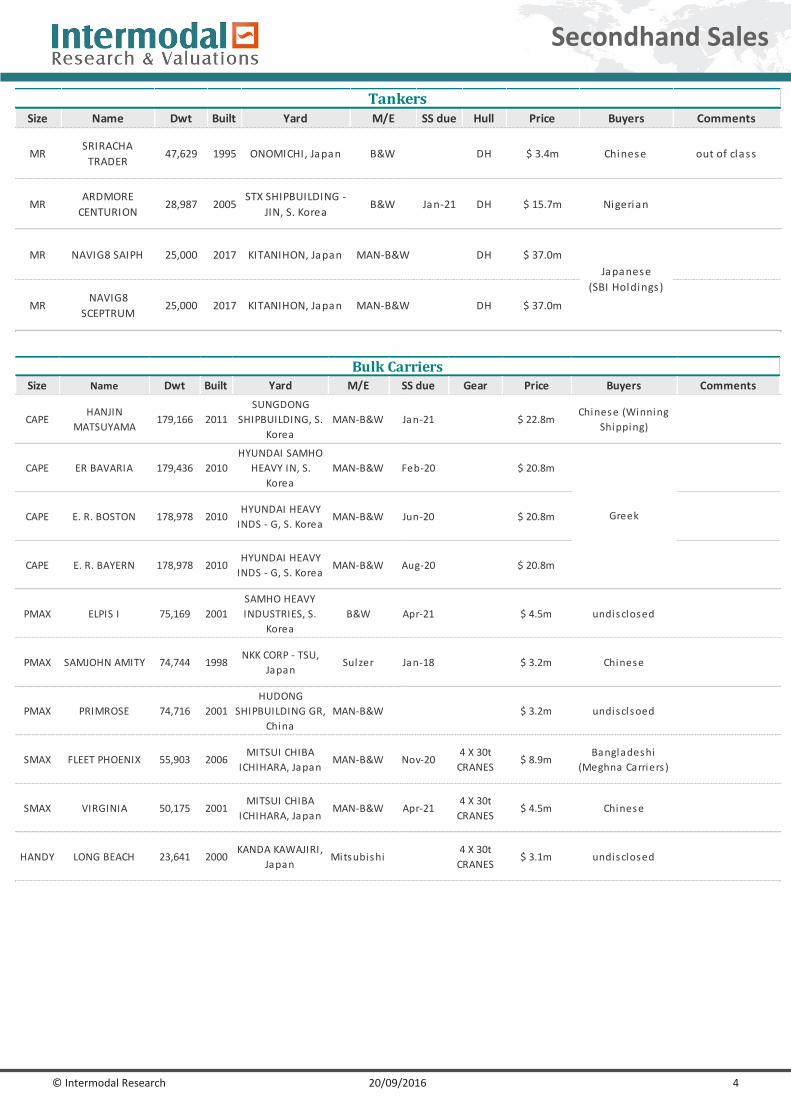
In the MR sector we had the sale of the “ARDMORE CENTURI-ON” (28,987dwt-blt 05, S. Korea), which was sold to Nigerian buyers, for a price in the region of $15.7m.
In the same sector we had the sale of the “SRIRACHA TRADER” (47,629dwt-blt 95, Japan), which was sold to Chinese buyers, for a price in the region of $3.4m.
Tanker Market
Indicative Period Charters
- 24 mos - 'GALWAY SPIRIT' 2007 105,559 dwt
- - $17,000/day - Penfield
- 12 mos - 'JAG POOJA' 2005 48,000 dwt
- - $14,500/day - Scorpio
2070
120170220270320370420470520
WS
po
ints
DIRTY - WS RATESTD3 TD6 TD9
Week 38 Week 37 ±% Diff 2015 2014
300k 1yr TC 27,000 27,000 0.0% 0 46,135 28,346
300k 3yr TC 27,000 27,000 0.0% 0 42,075 30,383
150k 1yr TC 21,250 21,250 0.0% 0 35,250 22,942
150k 3yr TC 22,250 22,250 0.0% 0 33,219 24,613
110k 1yr TC 16,000 16,000 0.0% 0 26,808 17,769
110k 3yr TC 17,750 17,750 0.0% 0 24,729 19,229
75k 1yr TC 15,000 15,000 0.0% 0 23,596 16,135
75k 3yr TC 16,000 16,000 0.0% 0 20,580 16,666
52k 1yr TC 13,250 13,250 0.0% 0 17,865 14,889
52k 3yr TC 14,000 14,000 0.0% 0 16,638 15,604
36k 1yr TC 12,000 12,750 -5.9% -750 16,101 14,024
36k 3yr TC 13,250 13,250 0.0% 0 15,450 14,878
Panamax
MR
Handy
TC Rates
$/day
VLCC
Suezmax
Aframax
60
90
120
150
180
210
240
270
WS
po
ints
CLEAN - WS RATESTC1 TC2 TC5 TC6
© Intermodal Research 20/09/2016 3
0
500
1,000
1,500
2,000
2,500
3,000
Ind
ex
Baltic Indices
BCI BPI BSI BHSI BDI
0
5000
10000
15000
20000
25000
$/d
ay
Average T/C Rates
Average of the 4 T / C AVR 4TC BPI AVR 5TC BSI AVR 6TC BHSI
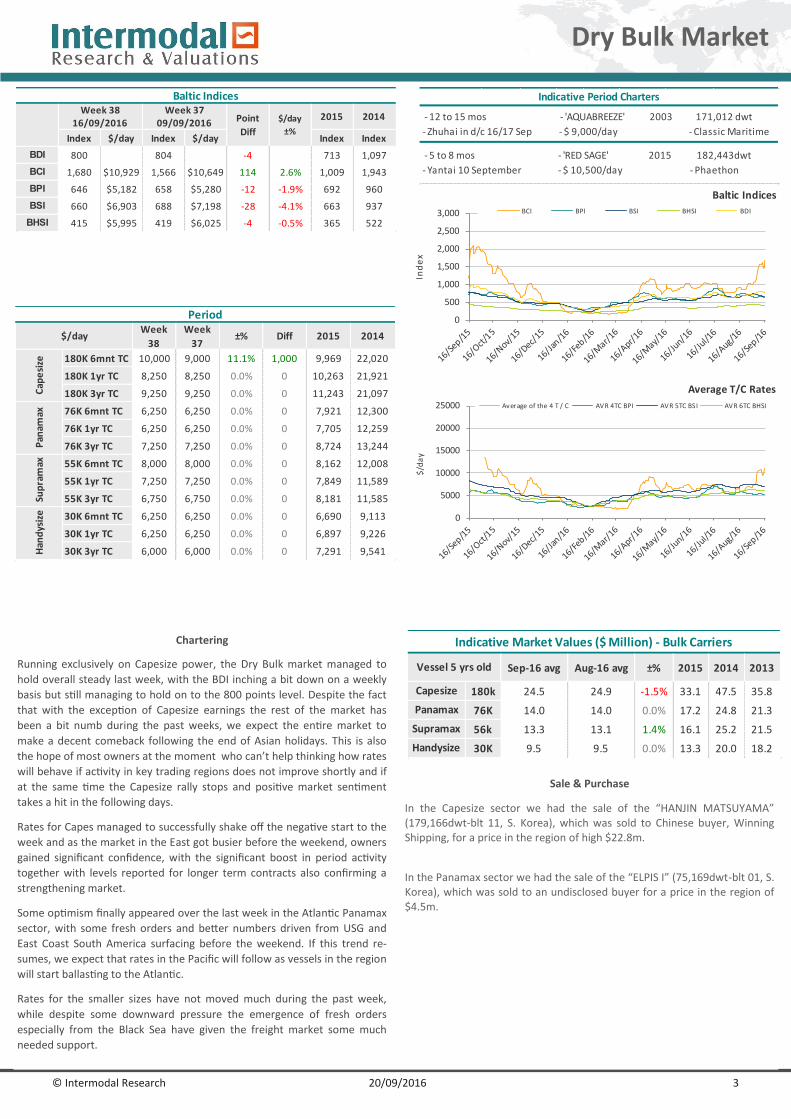
Chartering
Running exclusively on Capesize power, the Dry Bulk market managed to
hold overall steady last week, with the BDI inching a bit down on a weekly
basis but still managing to hold on to the 800 points level. Despite the fact
that with the exception of Capesize earnings the rest of the market has
been a bit numb during the past weeks, we expect the entire market to
make a decent comeback following the end of Asian holidays. This is also
the hope of most owners at the moment who can’t help thinking how rates
will behave if activity in key trading regions does not improve shortly and if
at the same time the Capesize rally stops and positive market sentiment
takes a hit in the following days.
Rates for Capes managed to successfully shake off the negative start to the
week and as the market in the East got busier before the weekend, owners
gained significant confidence, with the significant boost in period activity
together with levels reported for longer term contracts also confirming a
strengthening market.
Some optimism finally appeared over the last week in the Atlantic Panamax
sector, with some fresh orders and better numbers driven from USG and
East Coast South America surfacing before the weekend. If this trend re-
sumes, we expect that rates in the Pacific will follow as vessels in the region
will start ballasting to the Atlantic.
Rates for the smaller sizes have not moved much during the past week,
while despite some downward pressure the emergence of fresh orders
especially from the Black Sea have given the freight market some much
needed support.
Sale & Purchase
In the Capesize sector we had the sale of the “HANJIN MATSUYAMA” (179,166dwt-blt 11, S. Korea), which was sold to Chinese buyer, Winning Shipping, for a price in the region of high $22.8m.
In the Panamax sector we had the sale of the “ELPIS I” (75,169dwt-blt 01, S. Korea), which was sold to an undisclosed buyer for a price in the region of $4.5m.
Sep-16 avg Aug-16 avg ±% 2015 2014 2013
180k 24.5 24.9 -1.5% 33.1 47.5 35.8
76K 14.0 14.0 0.0% 17.2 24.8 21.3
56k 13.3 13.1 1.4% 16.1 25.2 21.5
30K 9.5 9.5 0.0% 13.3 20.0 18.2
Capesize
Panamax
Supramax
Indicative Market Values ($ Million) - Bulk Carriers
Vessel 5 yrs old
Handysize
Indicative Period Charters
- 12 to 15 mos - 'AQUABREEZE' 2003 171,012 dwt
- Zhuhai in d/c 16/17 Sep - $ 9,000/day - Classic Maritime
- 5 to 8 mos - 'RED SAGE' 2015 182,443dwt
- Yantai 10 September - $ 10,500/day - Phaethon
Dry Bulk Market
Index $/day Index $/day Index Index
BDI 800 804 -4 713 1,097
BCI 1,680 $10,929 1,566 $10,649 114 2.6% 1,009 1,943
BPI 646 $5,182 658 $5,280 -12 -1.9% 692 960
BSI 660 $6,903 688 $7,198 -28 -4.1% 663 937
BHSI 415 $5,995 419 $6,025 -4 -0.5% 365 522
09/09/2016
Baltic IndicesWeek 38
16/09/2016Week 37
Point
Diff
2015 2014$/day
±%
180K 6mnt TC 10,000 9,000 11.1% 1,000 9,969 22,020
180K 1yr TC 8,250 8,250 0.0% 0 10,263 21,921
180K 3yr TC 9,250 9,250 0.0% 0 11,243 21,097
76K 6mnt TC 6,250 6,250 0.0% 0 7,921 12,300
76K 1yr TC 6,250 6,250 0.0% 0 7,705 12,259
76K 3yr TC 7,250 7,250 0.0% 0 8,724 13,244
55K 6mnt TC 8,000 8,000 0.0% 0 8,162 12,008
55K 1yr TC 7,250 7,250 0.0% 0 7,849 11,589
55K 3yr TC 6,750 6,750 0.0% 0 8,181 11,585
30K 6mnt TC 6,250 6,250 0.0% 0 6,690 9,113
30K 1yr TC 6,250 6,250 0.0% 0 6,897 9,226
30K 3yr TC 6,000 6,000 0.0% 0 7,291 9,541Han
dys
ize
Period
2014
Pan
amax
Sup
ram
ax
Week
38
Week
37
Cap
esi
ze
2015$/day ±% Diff
© Intermodal Research 20/09/2016 4
Secondhand Sales
Size Name Dwt Built Yard M/E SS due Hull Price Buyers Comments
MRSRIRACHA
TRADER47,629 1995 ONOMICHI, Japan B&W DH $ 3.4m Chinese out of class
MRARDMORE
CENTURION28,987 2005
STX SHIPBUILDING -
JIN, S. KoreaB&W Jan-21 DH $ 15.7m Nigerian
MR NAVIG8 SAIPH 25,000 2017 KITANIHON, Japan MAN-B&W DH $ 37.0m
MRNAVIG8
SCEPTRUM25,000 2017 KITANIHON, Japan MAN-B&W DH $ 37.0m
Japanese
(SBI Holdings)
Tankers
Size Name Dwt Built Yard M/E SS due Gear Price Buyers Comments
CAPEHANJIN
MATSUYAMA179,166 2011
SUNGDONG
SHIPBUILDING, S.
Korea
MAN-B&W Jan-21 $ 22.8mChinese (Winning
Shipping)
CAPE ER BAVARIA 179,436 2010
HYUNDAI SAMHO
HEAVY IN, S.
Korea
MAN-B&W Feb-20 $ 20.8m
CAPE E. R. BOSTON 178,978 2010HYUNDAI HEAVY
INDS - G, S. KoreaMAN-B&W Jun-20 $ 20.8m
CAPE E. R. BAYERN 178,978 2010HYUNDAI HEAVY
INDS - G, S. KoreaMAN-B&W Aug-20 $ 20.8m
PMAX ELPIS I 75,169 2001
SAMHO HEAVY
INDUSTRIES, S.
Korea
B&W Apr-21 $ 4.5m undisclosed
PMAX SAMJOHN AMITY 74,744 1998NKK CORP - TSU,
JapanSulzer Jan-18 $ 3.2m Chinese
PMAX PRIMROSE 74,716 2001
HUDONG
SHIPBUILDING GR,
China
MAN-B&W $ 3.2m undisclsoed
SMAX FLEET PHOENIX 55,903 2006MITSUI CHIBA
ICHIHARA, JapanMAN-B&W Nov-20
4 X 30t
CRANES$ 8.9m
Bangladeshi
(Meghna Carriers )
SMAX VIRGINIA 50,175 2001MITSUI CHIBA
ICHIHARA, JapanMAN-B&W Apr-21
4 X 30t
CRANES$ 4.5m Chinese
HANDY LONG BEACH 23,641 2000KANDA KAWAJIRI,
JapanMitsubishi
4 X 30t
CRANES$ 3.1m undisclosed
Bulk Carriers
Greek
© Intermodal Research 20/09/2016 5
Secondhand Sales
Name Dwt Built Yard M/E SS due Gear Price Buyers Comments
PINE 2 34,038 2010NANTONG YAHUA
SHIPBUIL, ChinaMAN-B&W Mar-15
2 X 40t
CRS,3 X 35t
CRS
$ 6.0m
PINE 6 34,022 2010NANTONG YAHUA
SHIPBUIL, ChinaMAN-B&W Sep-15
2 X 40t
CRS,3 X 35t
CRS
$ 6.0m
PINE 4 34,006 2009NANTONG YAHUA
SHIPBUIL, ChinaMAN-B&W Sep-14
2 X 40t
CRS,3 X 35t
CRS
$ 6.0m
KARINE BULKER 32,271 2008KANDA KAWAJIRI,
JapanMitsubishi Jan-18
4 X 30,5t
CRANES$ 8.2m undisclosed
LONDON SPIRIT 20,427 1999WUHU SHIPYARD,
ChinaB&W
3 X 30t
CRANES$ 1.7m Bangladeshi
Chinese
MPP/General Cargo
© Intermodal Research 20/09/2016 6
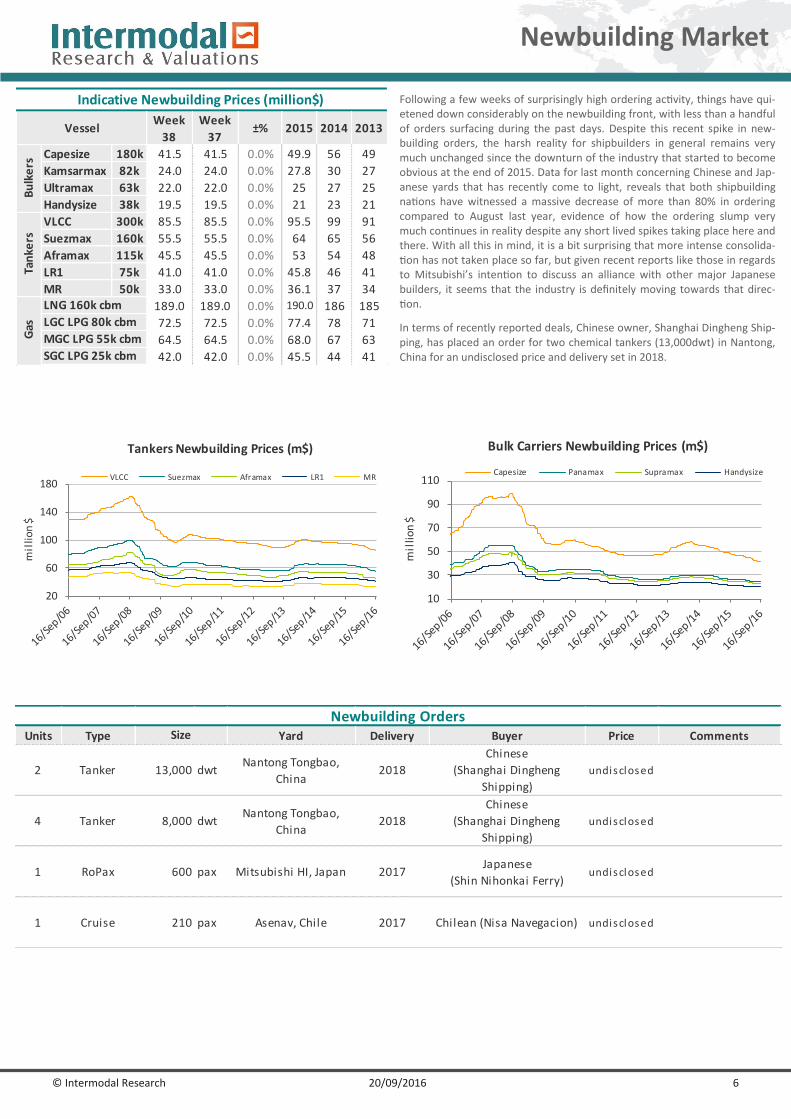
Following a few weeks of surprisingly high ordering activity, things have qui-etened down considerably on the newbuilding front, with less than a handful of orders surfacing during the past days. Despite this recent spike in new-building orders, the harsh reality for shipbuilders in general remains very much unchanged since the downturn of the industry that started to become obvious at the end of 2015. Data for last month concerning Chinese and Jap-anese yards that has recently come to light, reveals that both shipbuilding nations have witnessed a massive decrease of more than 80% in ordering compared to August last year, evidence of how the ordering slump very much continues in reality despite any short lived spikes taking place here and there. With all this in mind, it is a bit surprising that more intense consolida-tion has not taken place so far, but given recent reports like those in regards to Mitsubishi’s intention to discuss an alliance with other major Japanese builders, it seems that the industry is definitely moving towards that direc-tion.
In terms of recently reported deals, Chinese owner, Shanghai Dingheng Ship-ping, has placed an order for two chemical tankers (13,000dwt) in Nantong, China for an undisclosed price and delivery set in 2018.
Newbuilding Market
20
60
100
140
180
mil
lion
$
Tankers Newbuilding Prices (m$)
VLCC Suezmax Aframax LR1 MR
10
30
50
70
90
110
mil
lion
$
Bulk Carriers Newbuilding Prices (m$)
Capesize Panamax Supramax Handysize
Week
38
Week
37±% 2015 2014 2013
Capesize 180k 41.5 41.5 0.0% 49.9 56 49
Kamsarmax 82k 24.0 24.0 0.0% 27.8 30 27
Ultramax 63k 22.0 22.0 0.0% 25 27 25
Handysize 38k 19.5 19.5 0.0% 21 23 21
VLCC 300k 85.5 85.5 0.0% 95.5 99 91
Suezmax 160k 55.5 55.5 0.0% 64 65 56
Aframax 115k 45.5 45.5 0.0% 53 54 48
LR1 75k 41.0 41.0 0.0% 45.8 46 41
MR 50k 33.0 33.0 0.0% 36.1 37 34
189.0 189.0 0.0% 190.0 186 185
72.5 72.5 0.0% 77.4 78 71
64.5 64.5 0.0% 68.0 67 63
42.0 42.0 0.0% 45.5 44 41
LNG 160k cbm
LGC LPG 80k cbm
MGC LPG 55k cbm
SGC LPG 25k cbm
Gas
Bu
lke
rsTa
nke
rs
Vessel
Indicative Newbuilding Prices (million$)
Units Type Yard Delivery Buyer Price Comments
2 Tanker 13,000 dwtNantong Tongbao,
China2018
Chinese
(Shanghai Dingheng
Shipping)
undisclosed
4 Tanker 8,000 dwtNantong Tongbao,
China2018
Chinese
(Shanghai Dingheng
Shipping)
undisclosed
1 RoPax 600 pax Mitsubishi HI, Japan 2017Japanese
(Shin Nihonkai Ferry)undisclosed
1 Cruise 210 pax Asenav, Chile 2017 Chilean (Nisa Navegacion) undisclosed
Newbuilding OrdersSize
© Intermodal Research 20/09/2016 7
50
150
250
350
450
550
$/ld
t
Dry Demolition Prices
Bangladesh India Pakistan China
Right when it started to become obvious that the recent rally in demo prices was in need of steam, positive sentiment seems to have provided the latter to the Indian subcontinent demolition market that still displays increased appetite post summer season. As the amount of dry bulk tonnage offered for scrap has significantly decreased, Container vessels continue to almost mo-nopolize recent sales in the Indian subcontinent, while as the sector keeps struggling we expect to see more vessels coming up as demo candidates in the following weeks and possibly throughout the end of the year if the tradi-tionally busier winter season fails to support earnings for the sector. Given all the speculation and the admittedly unexpected appetite on behalf of end buyers, it is hard to dismiss the strength of this recent rally altogether, but we do remain very skeptic especially in the light of those once again soften-ing steel prices in China that have been the cause behind shaky scrap steel prices in the industry to begin with. Average prices this week for wet tonnage were at around 195-305 $/ldt and dry units received about 185-295 $/ldt.
The highest prices amongst recently reported deals, was that paid by Bangla-deshi breakers for the Panamax container “HS MOZART” (58,486dwt-19,172ldt-blt 02), which received $310/ldt.
Demolition Market
Week
38
Week
37±% 2015 2014 2013
Bangladesh 305 300 1.7% 360 469 422
India 295 290 1.7% 361 478 426
Pakistan 295 290 1.7% 366 471 423
China 195 195 0.0% 193 313 365
Bangladesh 295 285 3.5% 341 451 402
India 290 275 5.5% 342 459 405
Pakistan 285 275 3.6% 343 449 401
China 185 185 0.0% 174 297 350
Dry
Indicative Demolition Prices ($/ldt)
Markets
We
t
120
220
320
420
520
$/l
dt
Wet Demolition Prices
Bangladesh India Pakistan China
Name Size Ldt Built Yard Type $/ldt Breakers Comments
VIKTORIA WULFF 58,260 21,531 2006GDYNIA STOCZNIA
SA, PolandCONT $ 303/Ldt undisclosed Shanghai delivery, incl. bunkers
HS MOZART 58,486 19,172 2002HANJIN HI & CONST -
BU, S. KoreaCONT $ 310/Ldt Bangladeshi as-is Hong Kong incl. bunkers
THE FORGIVER 70,003 12,152 1994HUDONG SHIPYARD,
ChinaBULKER $ 302/Ldt Pakistani
GREEN ARROW 24,784 6,045 1985NIPPONKAI H.I.,
JapanBULKER $ 0/Ldt Turkish through auction, as-is Eleusis
SPLENDOUR 23,593 5,192 1984UWAJIMA
ZOSENSHO, JapanBULKER $ 273/Ldt Bangladeshi
Demolition Sales
The information contained in this report has been obtained from various sources, as reported in the market. Intermodal Shipbrokers Co. believes such information to be factual and reliable without mak-ing guarantees regarding its accuracy or completeness. Whilst every care has been taken in the production of the above review, no liability can be accepted for any loss or damage incurred in any way whatsoever by any person who may seek to rely on the information and views contained in this material. This report is being produced for the internal use of the intended recipients only and no re-producing is allowed, without the prior written authorization of Intermodal Shipbrokers Co.
Compiled by Intermodal Research & Valuations Department | [email protected] Ms. Eva Tzima | [email protected]
Mr. George Panagopoulos | [email protected]
Market News
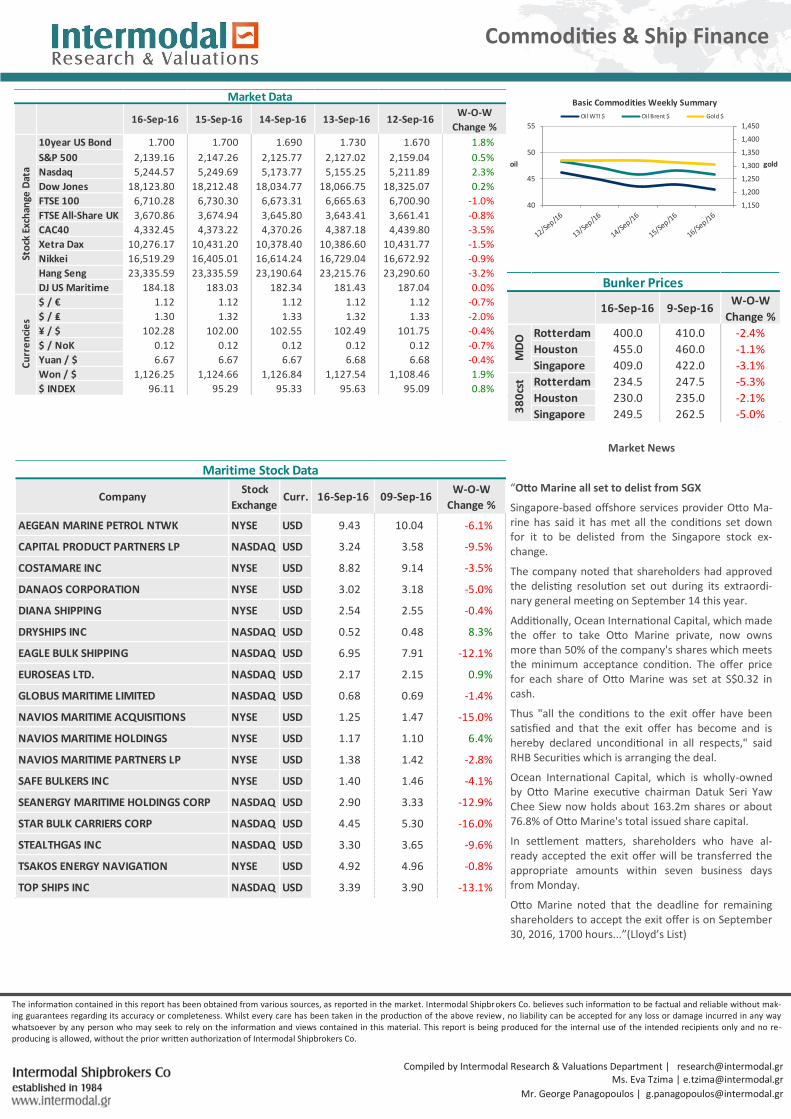
“Otto Marine all set to delist from SGX
Singapore-based offshore services provider Otto Ma-rine has said it has met all the conditions set down for it to be delisted from the Singapore stock ex-change.
The company noted that shareholders had approved the delisting resolution set out during its extraordi-nary general meeting on September 14 this year.
Additionally, Ocean International Capital, which made the offer to take Otto Marine private, now owns more than 50% of the company's shares which meets the minimum acceptance condition. The offer price for each share of Otto Marine was set at S$0.32 in cash.
Thus "all the conditions to the exit offer have been satisfied and that the exit offer has become and is hereby declared unconditional in all respects," said RHB Securities which is arranging the deal.
Ocean International Capital, which is wholly-owned by Otto Marine executive chairman Datuk Seri Yaw Chee Siew now holds about 163.2m shares or about 76.8% of Otto Marine's total issued share capital.
In settlement matters, shareholders who have al-ready accepted the exit offer will be transferred the appropriate amounts within seven business days from Monday.
Otto Marine noted that the deadline for remaining shareholders to accept the exit offer is on September 30, 2016, 1700 hours...”(Lloyd’s List)
Commodities & Ship Finance
16-Sep-16 15-Sep-16 14-Sep-16 13-Sep-16 12-Sep-16W-O-W
Change %
10year US Bond 1.700 1.700 1.690 1.730 1.670 1.8%
S&P 500 2,139.16 2,147.26 2,125.77 2,127.02 2,159.04 0.5%
Nasdaq 5,244.57 5,249.69 5,173.77 5,155.25 5,211.89 2.3%
Dow Jones 18,123.80 18,212.48 18,034.77 18,066.75 18,325.07 0.2%
FTSE 100 6,710.28 6,730.30 6,673.31 6,665.63 6,700.90 -1.0%
FTSE All-Share UK 3,670.86 3,674.94 3,645.80 3,643.41 3,661.41 -0.8%
CAC40 4,332.45 4,373.22 4,370.26 4,387.18 4,439.80 -3.5%
Xetra Dax 10,276.17 10,431.20 10,378.40 10,386.60 10,431.77 -1.5%
Nikkei 16,519.29 16,405.01 16,614.24 16,729.04 16,672.92 -0.9%
Hang Seng 23,335.59 23,335.59 23,190.64 23,215.76 23,290.60 -3.2%
DJ US Maritime 184.18 183.03 182.34 181.43 187.04 0.0%
$ / € 1.12 1.12 1.12 1.12 1.12 -0.7%
$ / ₤ 1.30 1.32 1.33 1.32 1.33 -2.0%
¥ / $ 102.28 102.00 102.55 102.49 101.75 -0.4%
$ / NoK 0.12 0.12 0.12 0.12 0.12 -0.7%
Yuan / $ 6.67 6.67 6.67 6.68 6.68 -0.4%
Won / $ 1,126.25 1,124.66 1,126.84 1,127.54 1,108.46 1.9%
$ INDEX 96.11 95.29 95.33 95.63 95.09 0.8%
Market Data
Cu
rre
nci
es
Sto
ck E
xch
ange
Dat
a
1,150
1,200
1,250
1,300
1,350
1,400
1,450
40
45
50
55
goldoil
Basic Commodities Weekly Summary
Oil WTI $ Oil Brent $ Gold $
16-Sep-16 9-Sep-16W-O-W
Change %
Rotterdam 400.0 410.0 -2.4%
Houston 455.0 460.0 -1.1%
Singapore 409.0 422.0 -3.1%
Rotterdam 234.5 247.5 -5.3%
Houston 230.0 235.0 -2.1%
Singapore 249.5 262.5 -5.0%
Bunker Prices
MD
O3
80
cst
CompanyStock
ExchangeCurr. 16-Sep-16 09-Sep-16
W-O-W
Change %
AEGEAN MARINE PETROL NTWK NYSE USD 9.43 10.04 -6.1%
CAPITAL PRODUCT PARTNERS LP NASDAQ USD 3.24 3.58 -9.5%
COSTAMARE INC NYSE USD 8.82 9.14 -3.5%
DANAOS CORPORATION NYSE USD 3.02 3.18 -5.0%
DIANA SHIPPING NYSE USD 2.54 2.55 -0.4%
DRYSHIPS INC NASDAQ USD 0.52 0.48 8.3%
EAGLE BULK SHIPPING NASDAQ USD 6.95 7.91 -12.1%
EUROSEAS LTD. NASDAQ USD 2.17 2.15 0.9%
GLOBUS MARITIME LIMITED NASDAQ USD 0.68 0.69 -1.4%
NAVIOS MARITIME ACQUISITIONS NYSE USD 1.25 1.47 -15.0%
NAVIOS MARITIME HOLDINGS NYSE USD 1.17 1.10 6.4%
NAVIOS MARITIME PARTNERS LP NYSE USD 1.38 1.42 -2.8%
SAFE BULKERS INC NYSE USD 1.40 1.46 -4.1%
SEANERGY MARITIME HOLDINGS CORP NASDAQ USD 2.90 3.33 -12.9%
STAR BULK CARRIERS CORP NASDAQ USD 4.45 5.30 -16.0%
STEALTHGAS INC NASDAQ USD 3.30 3.65 -9.6%
TSAKOS ENERGY NAVIGATION NYSE USD 4.92 4.96 -0.8%
TOP SHIPS INC NASDAQ USD 3.39 3.90 -13.1%
Maritime Stock Data
© Intermodal Shipbrokers Co
9
20/09/2016
Your Contact Details
Full Name: Title:
Company: Position:
Address:
Address:
If you wish to subscribe to our reports please contact us directly by phone or by e-mailing, faxing or posting the below form,
which can also be found on our website.
Tel: +30 210 6293 300 Intermodal Shipbrokers Co.
Fax:+30 210 6293 333-4 17th km Ethniki Odos Athens-Lamia & 3 Agrambelis St.
Email: [email protected] 145 64 N.Kifisia,
Website: www.intermodal.gr Athens - Greece
Telephone:
E-mail:
Company Website: