Embed Size (px)
Citation preview
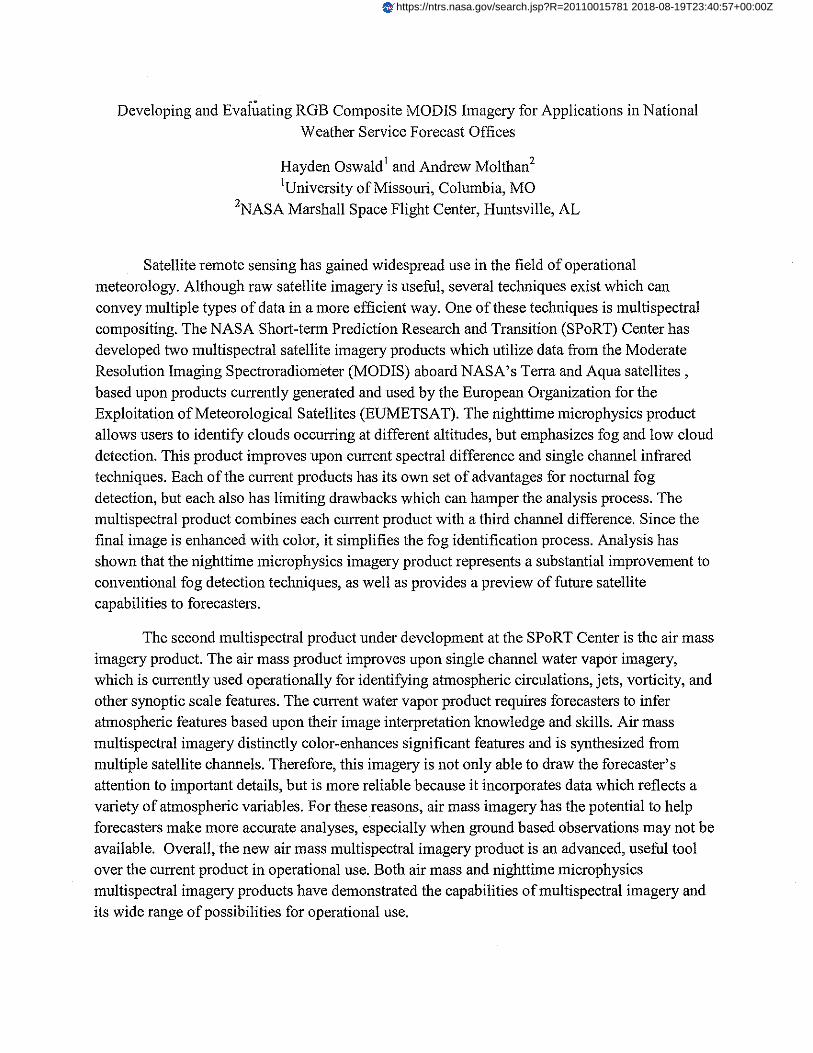
Developing and Evaiiiating RGB Composite MODIS Imagery for Applications in National
Weather Service Forecast Offices
Hayden Oswald 1 and Andrew Molthan2
lUniversity of Missouri, Columbia, MO
2NASA Marshall Space Flight Center, Huntsville, AL
Satellite remote sensing has gained widespread use in the field of operational meteorology. Although raw satellite imagery is useful, several techniques exist which can
convey multiple types of data in a more efficient way. One of these techniques is multispectral compositing. The NASA Short-term Prediction Research and Transition (SPoRT) Center has developed two multispectral satellite imagery products which utilize data from the Moderate Resolution Imaging Spectroradiometer (MODIS) aboard NASA's Terra and Aqua satellites,
based upon products currently generated and used by the European Organization for the Exploitation of Meteorological Satellites (EUMETSAT). The nighttime microphysics product allows users to identify clouds occurring at different altitudes, but emphasizes fog and low cloud detection. This product improves upon current spectral difference and single channel infrared techniques. Each of the current products has its own set of advantages for nocturnal fog detection, but each also has limiting drawbacks which can hamper the analysis process. The multispectral product combines each current product with a third channel difference. Since the final image is enhanced with color, it simplifies the fog identification process. Analysis has shown that the nighttime microphysics imagery product represents a substantial improvement to
conventional fog detection techniques, as well as provides a preview of future satellite capabilities to forecasters.
The second multispectral product under development at the SPoRT Center is the air mass imagery product. The air mass product improves upon single channel water vapor imagery, which is currently used operationally for identifying atmospheric circulations, jets, vorticity, and other synoptic scale features. The current water vapor product requires forecasters to infer atmospheric features based upon their image interpretation knowledge and skills. Air mass multispectral imagery distinctly color-enhances significant features and is synthesized from multiple satellite channels. Therefore, this imagery is not only able to draw the forecaster's attention to important details, but is more reliable because it incorporates data which reflects a variety of atmospheric variables. For these reasons, air mass imagery has the potential to help
forecasters make more accurate analyses, especially when ground based observations may not be available. Overall, the new air mass multispectral imagery product is an advanced, useful tool over the current product in operational use. Both air mass and nighttime microphysics multispectral imagery products have demonstrated the capabilities of multispectral imagery and
its wide range of possibilities for operational use.
https://ntrs.nasa.gov/search.jsp?R=20110015781 2018-08-19T23:40:57+00:00Z
1
Developing and Evaluating RGB Composite MODIS Imagery for Applications in National
Weather Service Forecast Offices
Hayden K. Oswald
University of Missouri, Columbia, Missouri
Andrew L. Molthan
NASA Short-term Prediction Research and Transition (SPoRT) Center, Huntsville, Alabama
ABSTRACT
Satellite remote sensing has gained widespread use in the field of operational
meteorology. Although raw satellite imagery is useful, several techniques exist which can
convey multiple types of data in a more efficient way. One of these techniques is multispectral
compositing. The NASA SPoRT Center has developed two multispectral products which utilize
data from the MODIS imager and follow guidelines set by EUMETSAT. The nighttime
microphysics product allows users to identify clouds occurring at different altitudes, but
emphasizes fog detection. This product improves upon spectral difference and single channel
infrared techniques. The air mass product improves upon single channel water vapor imagery
which is currently used operationally for identifying atmospheric circulations, jets, vorticity, and
other synoptic scale features. Analysis shows that each of these products combines the
advantages of other products into an efficient, consistent image.
1. Introduction
Satellite remote sensing has gained heavy use in the field of operational meteorology.
Through collaboration among agencies and nations, satellite coverage of nearly all the Earth has
been achieved. This data is often freely available to atmospheric scientists and operational
meteorologists, providing a much-needed perspective that ground-based remote sensing cannot
give. In the United States, a variety of geostationary and polar orbiting satellites allow
meteorologists to identify and diagnose weather features that are outside the detection
capabilities of other observation networks. Along with raw imagery, data from these satellites
can be manipulated to create products which help forecasters identify specific meteorological
patterns and features. One useful product is multispectral imagery, also referred to as RGB
imagery. RGB imagery relies upon the assignment of paired channels or channel differences to
red, green, and blue intensities that create a unique color for each pixel.
Current instruments, such as the Moderate Resolution Imaging Spectroradiometer
(MODIS) aboard NASA’s Terra and Aqua, provide a large volume of data for forecasters to
process. RGB composites offer a technique to use multiple channels from these imagers, but in a
manner which is easier to use and more intuitive than using all of the raw data separately. As a
result, large amounts of information can be provided to the operational meteorologist through a
single product. The challenge to meteorological satellite product developers is the development
of multispectral imagery which optimizes the forecast process and improves the accuracy of
analysis, diagnosis, and forecasts.
The NASA Short-term Prediction Research and Transition (SPoRT) Center is working to
develop RGB products of value for operations. SPoRT is a NASA group whose mission is to
transition unique observations and research capabilities to the operational weather community to
improve short-term forecasts on a regional scale. SPoRT engages in modeling and remote
2
sensing research by using NASA datasets and capabilities to design new products and improve
upon current capabilities. Along with NASA data, SPoRT also works closely with the National
Oceanic and Atmospheric Administration (NOAA), the University of Alabama in Huntsville,
and local NOAA National Weather Service (NWS) Weather Forecast Offices (WFOs) to design
and implement new methods and products.
SPoRT has developed a nighttime microphysics and air mass product, analogous to
products developed by the European Organization for the Exploitation of Meteorological
Satellites (EUMETSAT) for use with the Spinning Enhanced Visible and Infrared Imager
(SEVIRI) aboard Meteosat-9. These products are multispectral RGB imagery derived from
MODIS data with spectral bands comparable to SEVIRI, directed at identifying specific
atmospheric and cloud features. Both products are under development with the intent to improve
upon current satellite products. Multispectral products from MODIS will also demonstrate future
capabilities of the Geostationary Operational Environmental Satellite R-Series (GOES-R)
program. The Advanced Baseline Imager (ABI) on GOES-R will have 16 bands similar to
MODIS, but at a spatial resolution of 500 m to 2 km and a temporal resolution of 5 minutes for
scans of the continental United States (Schmit et al. 2005). The spectral channels included on the
ABI will provide the data necessary to create multispectral imagery products currently generated
from only MODIS and SEVIRI data.
2. Data and Methodology
To demonstrate the capabilities and applications of multispectral imagery, products were
developed for case studies to illustrate their strengths, weaknesses, and general characteristics.
The EUMETSAT guidelines provide a standardization of RGB generation techniques and offer
suggested methods for creating and enhancing each image product (EUMETSAT User Service
Division). For the nighttime microphysics imagery, two cases were identified for study,
emphasizing widespread low clouds and fog. MODIS raw data for both products were obtained
via the Level 1 and Atmospheric Archive and Distribution Center (LAADS). Surface visibility
observations for the nighttime microphysics product were obtained from automated surface
observing systems (ASOS) stations located across the United States. Single channel and spectral
difference imagery were generated for comparison to the multispectral nighttime microphysics
product. In addition, a vigorous mid-latitude cyclone was examined to compare and analyze
single channel or multispectral air mass products.
3. Nighttime Microphysics
The SPoRT nighttime microphysics product was developed to improve upon current
nocturnal fog and stratus cloud detection techniques. The EUMETSAT method was used for
producing the nighttime microphysics RGB image (Table 1). Two fog cases were identified for
the purpose of analyzing imagery current imagery products, in addition to the nighttime
microphysics product. Imagery examined here include conventional, single channel infrared
imagery and the 11 – 3.9 µm brightness temperature difference technique. However, there are
issues with each of these products, some of which can be corrected with multispectral techniques
included within the RGB product.
a) Case Study: 19 November 2010
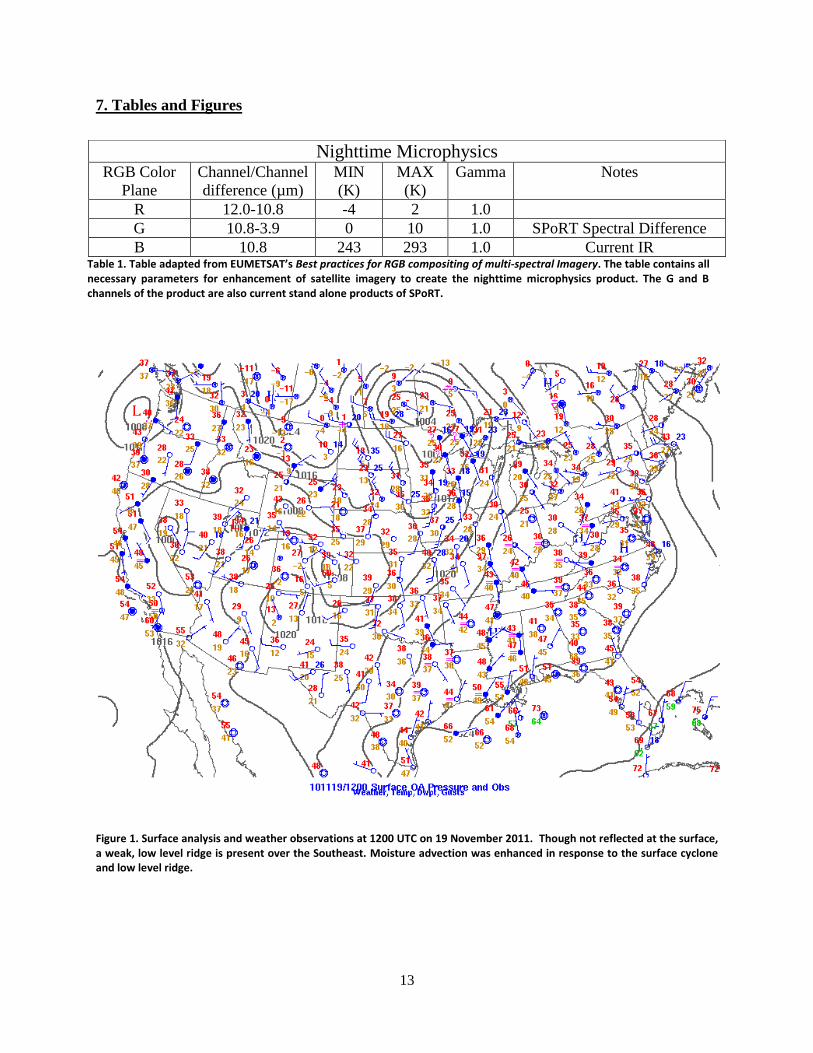
Synoptic-scale conditions on 19 November 2010 were favorable for the development of a
widespread fog event (Fig. 1). A cyclone was centered over Minnesota, allowing light winds to
3
occur over the southeastern United States while still enhancing moisture advection off of the
Gulf of Mexico. Along with the cyclone to the northwest, a low level anticyclone was centered
over the eastern half of the continental United States. The light winds, combined with relatively
high dew points, created an ideal situation for fog to form over the Southeast.
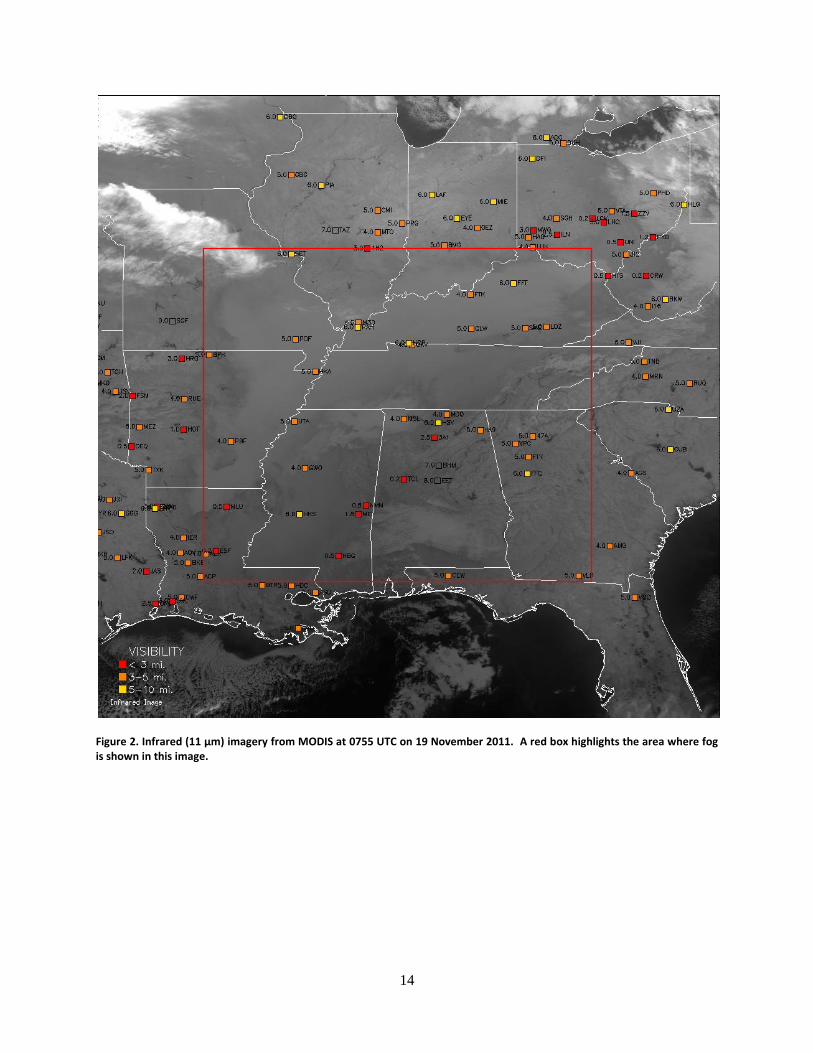
The simplest product that can be used for analysis of fog events is a single-channel
infrared image (Fig. 2), such as channel 31 (11 μm) on MODIS. Several features can be
identified in the single channel infrared image from the 19 November case. Upper level cirrus
clouds are present over Missouri and the Great Lakes while low level cumuliform clouds are
located just off the Gulf Coast. With the 1 km spatial resolution of MODIS, fine thermal details
are apparent. Over the Gulf and Southeast, darker colors indicate the presence of warmer water
and land, respectively. Near the Great Lakes, however, land takes on a lighter gray color, and
water appears as a charcoal color, as opposed to the nearly black color of the Gulf. These
differences in coloration of land and water surfaces are due to the latitude-dependent variations
in temperature, which cause differences in emitted longwave radiation from the Earth’s surface.
Along with thermal details, distinct geographical details such as elevated terrain, valleys, and
inland water bodies are visible with the 1 km spatial resolution of MODIS. These details are not
as easily detected with current GOES imagers, which have a 4 km spatial resolution; however the
ABI on GOES-R systems will have a 1 km resolution comparable to MODIS.
Although many details and features are present in the infrared image, fog is more difficult
to locate. Upon closer investigation, it is apparent that the fog bank of 19 November 2010 is
shown by a smooth, relatively dark gray swath extending from Arkansas and Missouri through
Kentucky at 0755 UTC. Fog is difficult to locate in this type of image for the same reason that
clouds, land, and water are easy to locate. Since fog occurs at or near the Earth’s surface, it has a
similar brightness temperature as the surface, and a similar thermal gradient with latitude. As
with bare terrain, the southern portion of the fog bank is darker than the northern portion. Since
the fog is similar in temperature to the surface, very few details can be ascertained from it. It is
difficult to differentiate fog from stratus clouds. A visual inspection of this imagery does not
allow the user to estimate the depth of fog, although other methods and satellite products attempt
to do this. Because of this ambiguity, it is unlikely that any in-depth forecast regarding the
clearing time or local visibilities can be made qualitatively. The only conclusion that can be
drawn from the infrared imagery is spatial extent of the fog. Since the fog is revealed by a
smooth, opaque appearance, the coverage is relatively simple to observe, however its similarity
in color to land surfaces make accurate discernment of edges difficult to accomplish. Overall, the
MODIS single-channel infrared image provides high-resolution detail; however, a single channel
image does not provide clear indications of locations where fog or low-altitude stratus might be
occurring. A trained forecaster can use this imagery for fog detection, but the imagery does not
lend itself to efficient use. Single channel infrared imagery provides a resource to forecasters
attempting to identify fog and low clouds. However, other products give more information to a
forecaster than what is presented by single channel imagery.
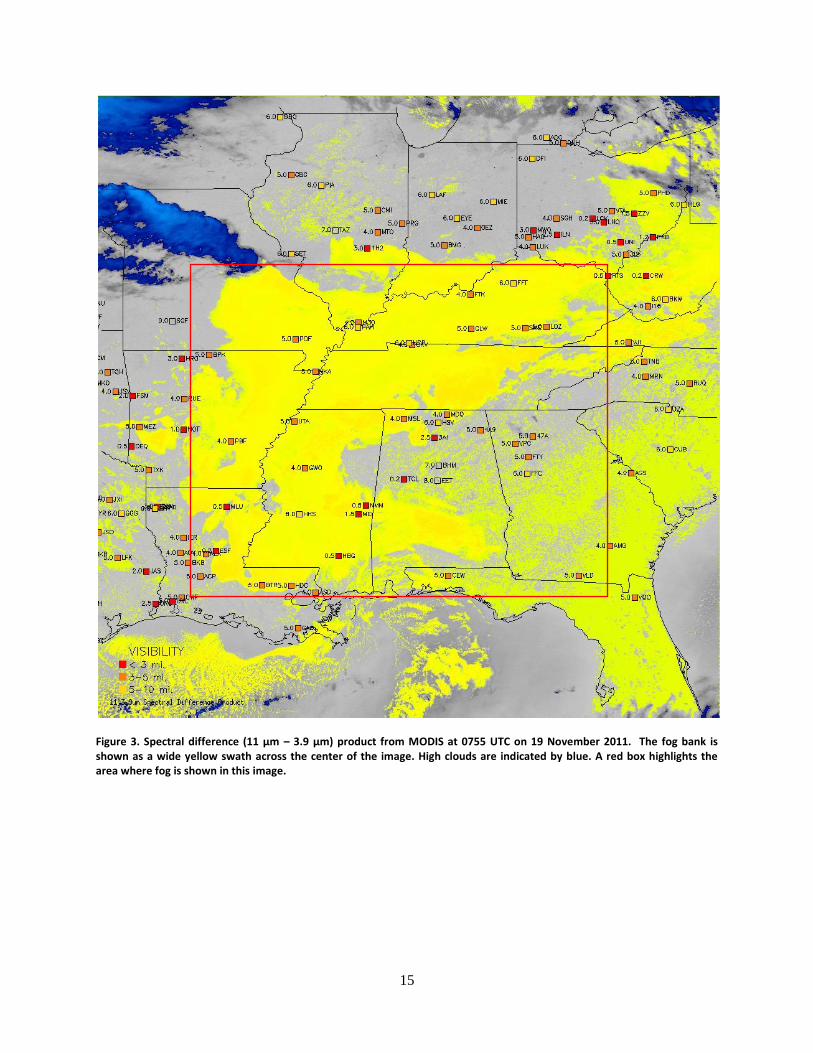
Another option for detecting fog and low stratus clouds uses a spectral difference
technique (Fig. 3). This technique is given by ΔT=ΔTβ10.7-ΔTβ3.9 where ΔTβ10.7 is the brightness
temperature for MODIS channel 31 and ΔTβ3.9 is the brightness temperature for MODIS channel
20 (Underwood et al. 2004). Positive ΔT values indicate fog, where greater values represent
thicker fog and smaller positive values indicate thinner fog. The resultant channel difference is
then color enhanced in order to highlight certain features. The NASA SPoRT Center produces a
4
color enhanced spectral difference product for identifying fog and stratus clouds. In this product,
land and water take on a uniform gray color, high ice crystal clouds are blue colors, and lower
clouds are yellow or yellow green colors. This product represents a significant improvement over
single channel infrared imagery. In a spectral difference image from 19 November 2010, the fog
bank appears more distinctly than in the single channel image. The fog is easily differentiable
from the land around it and scattered high clouds throughout the image. Since high ice crystal
clouds appear as a blue color in this imagery and low clouds appear as yellow colors, the relative
altitudes of cloud features are easily identifiable. Compared to the single channel product, this
imagery is more intuitive, aesthetically pleasing, and easier to analyze.
Although the spectral difference product has advantages, it also has some drawbacks.
Unlike infrared imagery, temperature differences cannot be readily deduced from color-enhanced
spectral difference imagery. In the infrared image, temperature contrasts were easy to see at
different latitudes, even on bare land. However, spectral difference imagery removes these
contrasts, causing both land and water to appear as a uniform color with few variations or
contrasts. Since the spectral difference image is constrained to such a narrow range of colors,
differentiating details within specific feature types is a more difficult process. For example,
spectral difference imagery from 19 November shows both fog and low stratus clouds over the
southeastern United States and cumuliform clouds off the Gulf Coast. Both of these cloud types
are relatively low altitude, and both of these cloud types contain liquid water droplets. These two
cloud types are difficult to distinguish in cloud top temperature and phase. Therefore, the
technique will work in the same way for both. Though these are two separate types of cloud,
their shared characteristic of being low level clouds causes them to be nearly the same color. In
this type of case, the only way to tell the difference is to qualitatively examine the shape,
coverage, and texture of clouds in each region.
Another issue with the spectral difference image from this case is the indication of low
altitude clouds over Georgia, the Carolinas, and Florida. Although the infrared image indicates
bare land in these areas, the spectral difference image indicates widespread fog or other low
clouds in this area. Surface observations for this region indicate visibilities four statute miles and
greater. This false detection and lack of detail are the most prevalent issues with the spectral
difference product. However, the spectral difference technique produces images that are more
intuitive and visually pleasing than single channel imagery for the purpose of fog detection.
Because of its improvement over single channel imagery, it can serve as a solid tool for
forecasters but should be used carefully and in conjunction with other observations.
The third product is nighttime microphysics multispectral satellite imagery. This product
combines several advantages of both single channel and spectral difference products. Like the
spectral difference product, nighttime microphysics imagery identifies fog or low clouds with
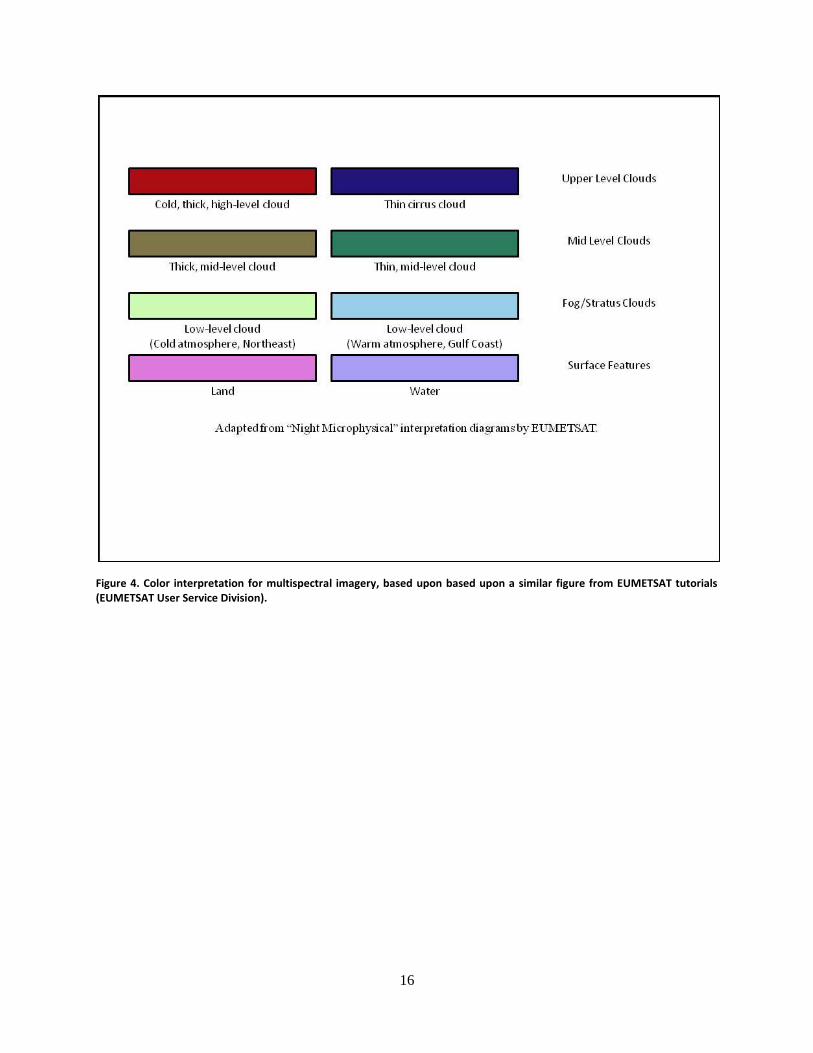
distinct colors. An interpretation diagram adapted from EUMETSAT identifies several
prominent colors in this product (Fig. 4). Land surfaces take on pink or magenta colors, high
clouds are deep purple or dark magenta colors, water surfaces are blue, and low cloud features
are yellow-green. Fine geographic and thermal details are retained in the imagery. Since the final
RGB product combines two channel differences and one single channel through red, green, and
blue color combinations, contributions to each color’s intensity are physically related to cloud or
land surface properties. The red (12.0 µm-10.8 µm) and green (10.8 µm-3.9 µm) components
serve to differentiate low cloud features from land, water, or other clouds. Variations in
brightness temperature, though subtle, can be deduced from this image. Northern land and water
5
surfaces tend to take on a redder tint, while southern land and water surfaces have a slightly bluer
tint. This change in blue shading is a direct result from the use of single channel infrared (11
µm) brightness temperatures to set the blue color intensity (EUMETSAT User Service Division).
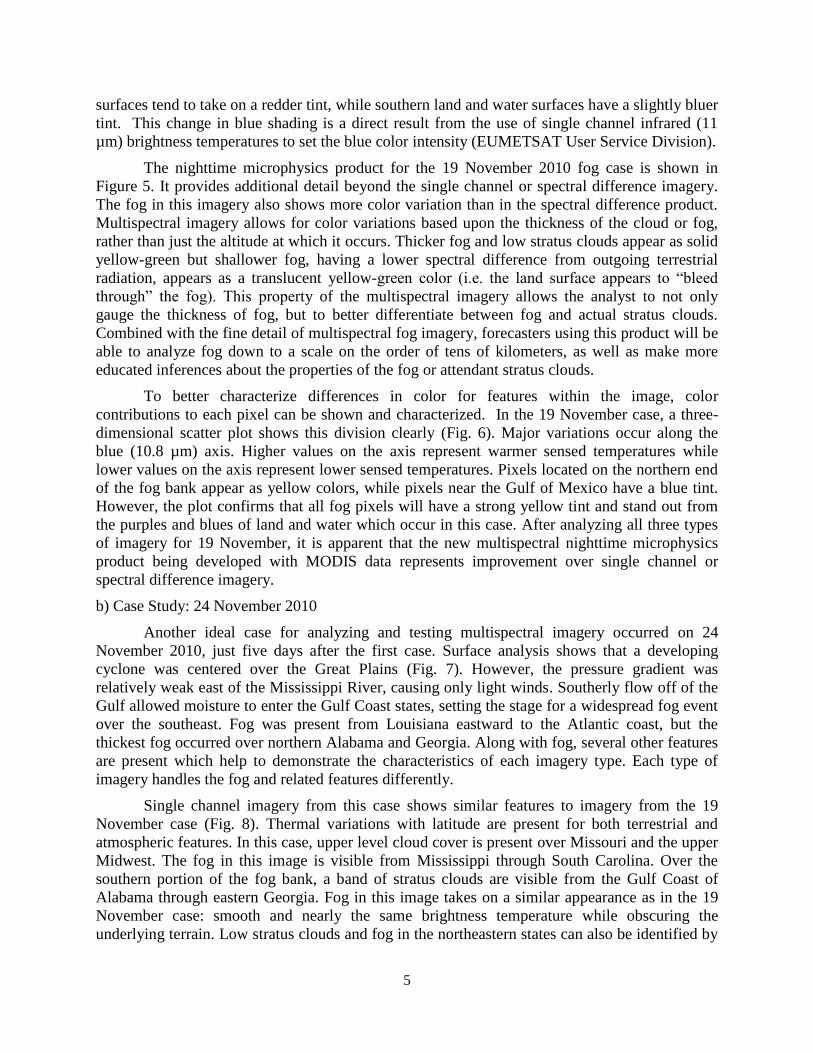
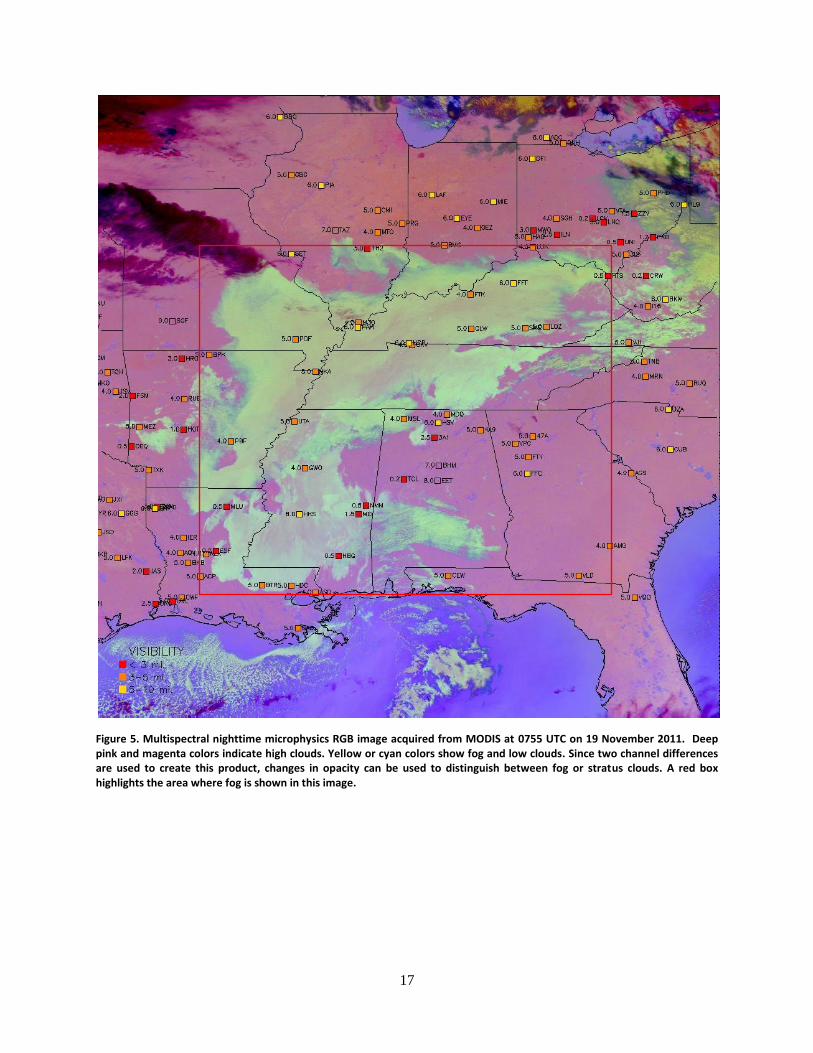
The nighttime microphysics product for the 19 November 2010 fog case is shown in
Figure 5. It provides additional detail beyond the single channel or spectral difference imagery.
The fog in this imagery also shows more color variation than in the spectral difference product.
Multispectral imagery allows for color variations based upon the thickness of the cloud or fog,
rather than just the altitude at which it occurs. Thicker fog and low stratus clouds appear as solid
yellow-green but shallower fog, having a lower spectral difference from outgoing terrestrial
radiation, appears as a translucent yellow-green color (i.e. the land surface appears to “bleed
through” the fog). This property of the multispectral imagery allows the analyst to not only
gauge the thickness of fog, but to better differentiate between fog and actual stratus clouds.
Combined with the fine detail of multispectral fog imagery, forecasters using this product will be
able to analyze fog down to a scale on the order of tens of kilometers, as well as make more
educated inferences about the properties of the fog or attendant stratus clouds.
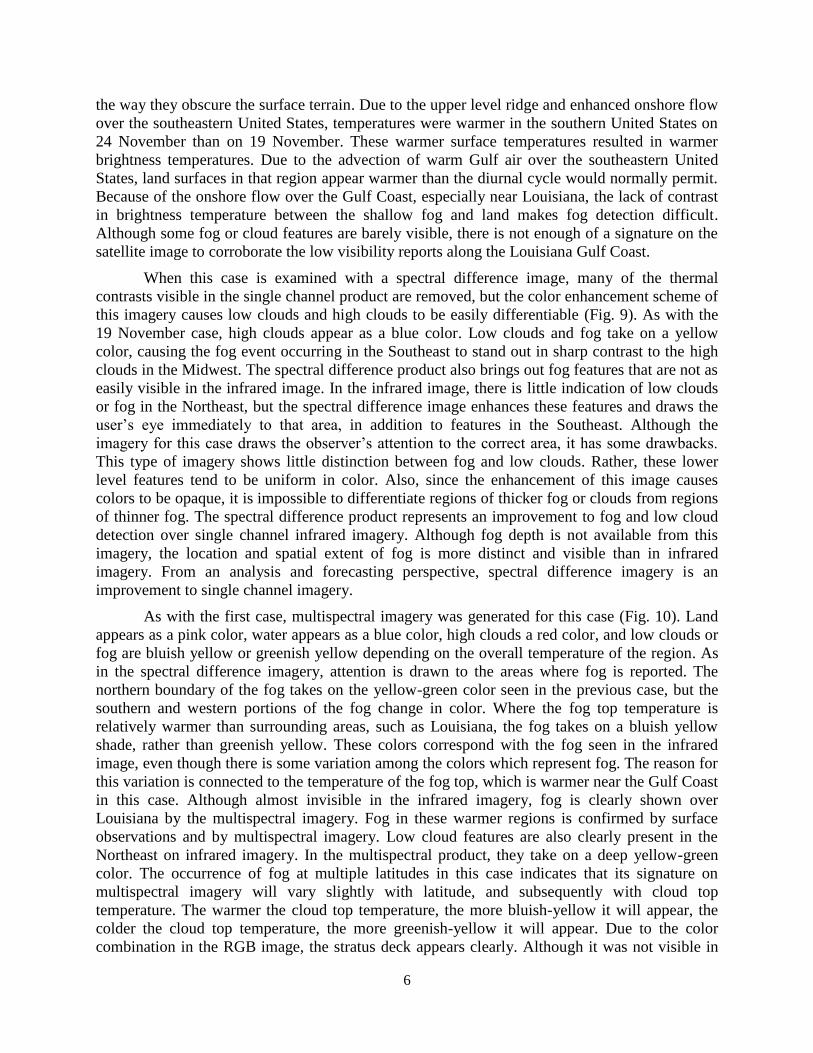
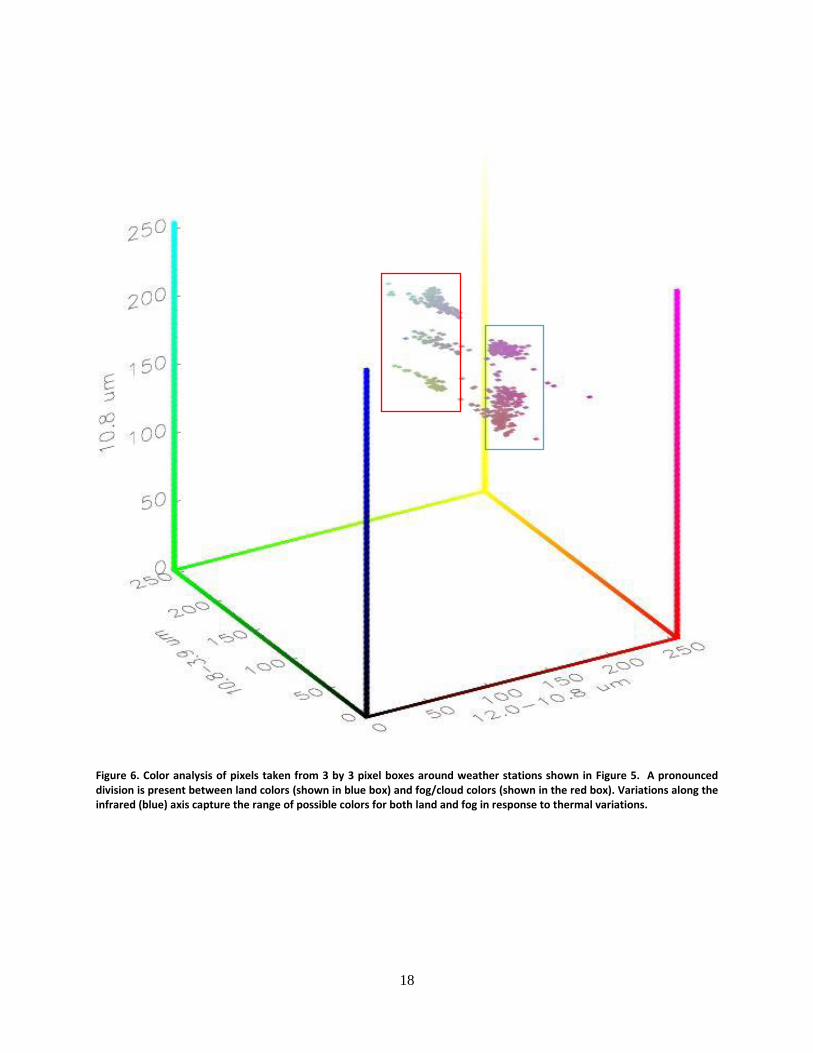
To better characterize differences in color for features within the image, color
contributions to each pixel can be shown and characterized. In the 19 November case, a three-
dimensional scatter plot shows this division clearly (Fig. 6). Major variations occur along the
blue (10.8 µm) axis. Higher values on the axis represent warmer sensed temperatures while
lower values on the axis represent lower sensed temperatures. Pixels located on the northern end
of the fog bank appear as yellow colors, while pixels near the Gulf of Mexico have a blue tint.
However, the plot confirms that all fog pixels will have a strong yellow tint and stand out from
the purples and blues of land and water which occur in this case. After analyzing all three types
of imagery for 19 November, it is apparent that the new multispectral nighttime microphysics
product being developed with MODIS data represents improvement over single channel or
spectral difference imagery.
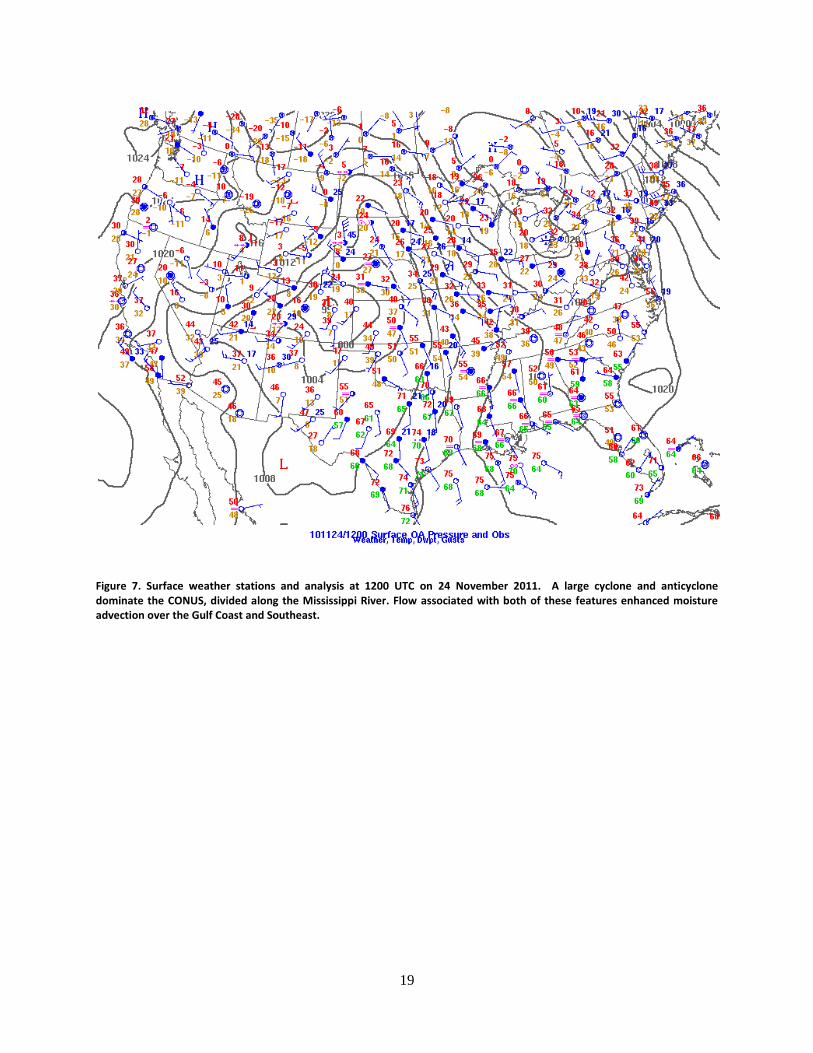
b) Case Study: 24 November 2010
Another ideal case for analyzing and testing multispectral imagery occurred on 24
November 2010, just five days after the first case. Surface analysis shows that a developing
cyclone was centered over the Great Plains (Fig. 7). However, the pressure gradient was
relatively weak east of the Mississippi River, causing only light winds. Southerly flow off of the
Gulf allowed moisture to enter the Gulf Coast states, setting the stage for a widespread fog event
over the southeast. Fog was present from Louisiana eastward to the Atlantic coast, but the
thickest fog occurred over northern Alabama and Georgia. Along with fog, several other features
are present which help to demonstrate the characteristics of each imagery type. Each type of
imagery handles the fog and related features differently.
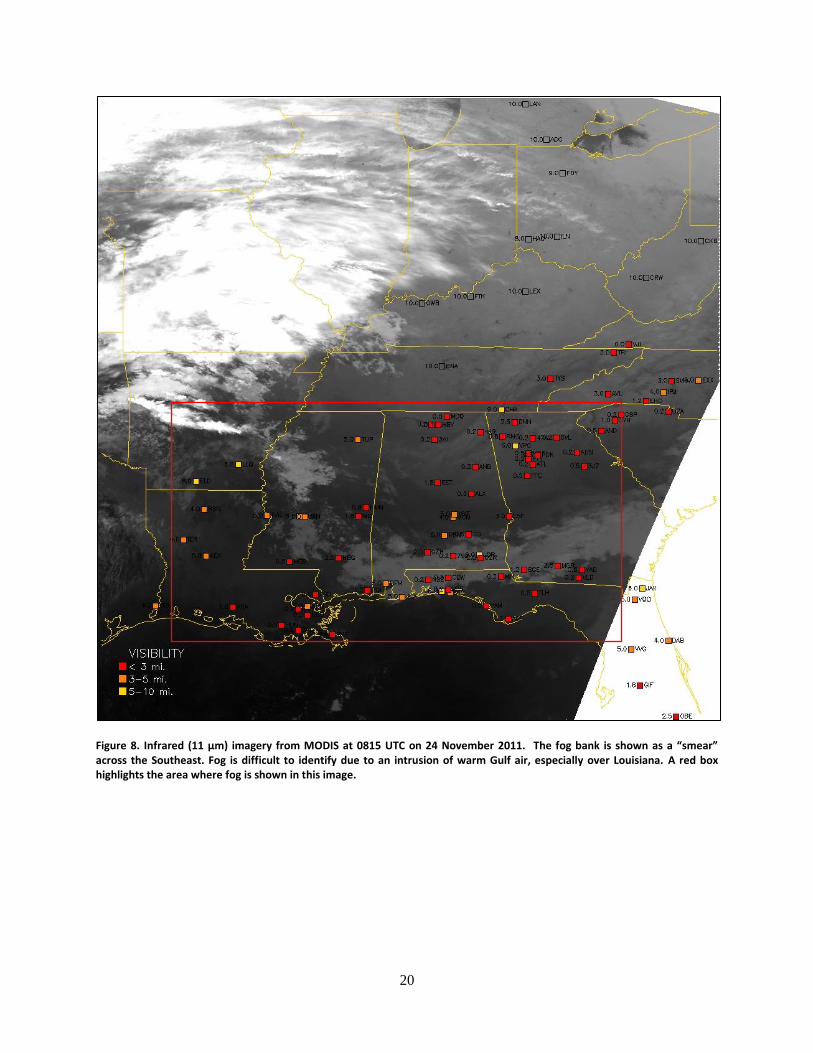
Single channel imagery from this case shows similar features to imagery from the 19
November case (Fig. 8). Thermal variations with latitude are present for both terrestrial and
atmospheric features. In this case, upper level cloud cover is present over Missouri and the upper
Midwest. The fog in this image is visible from Mississippi through South Carolina. Over the
southern portion of the fog bank, a band of stratus clouds are visible from the Gulf Coast of
Alabama through eastern Georgia. Fog in this image takes on a similar appearance as in the 19
November case: smooth and nearly the same brightness temperature while obscuring the
underlying terrain. Low stratus clouds and fog in the northeastern states can also be identified by
6
the way they obscure the surface terrain. Due to the upper level ridge and enhanced onshore flow
over the southeastern United States, temperatures were warmer in the southern United States on
24 November than on 19 November. These warmer surface temperatures resulted in warmer
brightness temperatures. Due to the advection of warm Gulf air over the southeastern United
States, land surfaces in that region appear warmer than the diurnal cycle would normally permit.
Because of the onshore flow over the Gulf Coast, especially near Louisiana, the lack of contrast
in brightness temperature between the shallow fog and land makes fog detection difficult.
Although some fog or cloud features are barely visible, there is not enough of a signature on the
satellite image to corroborate the low visibility reports along the Louisiana Gulf Coast.
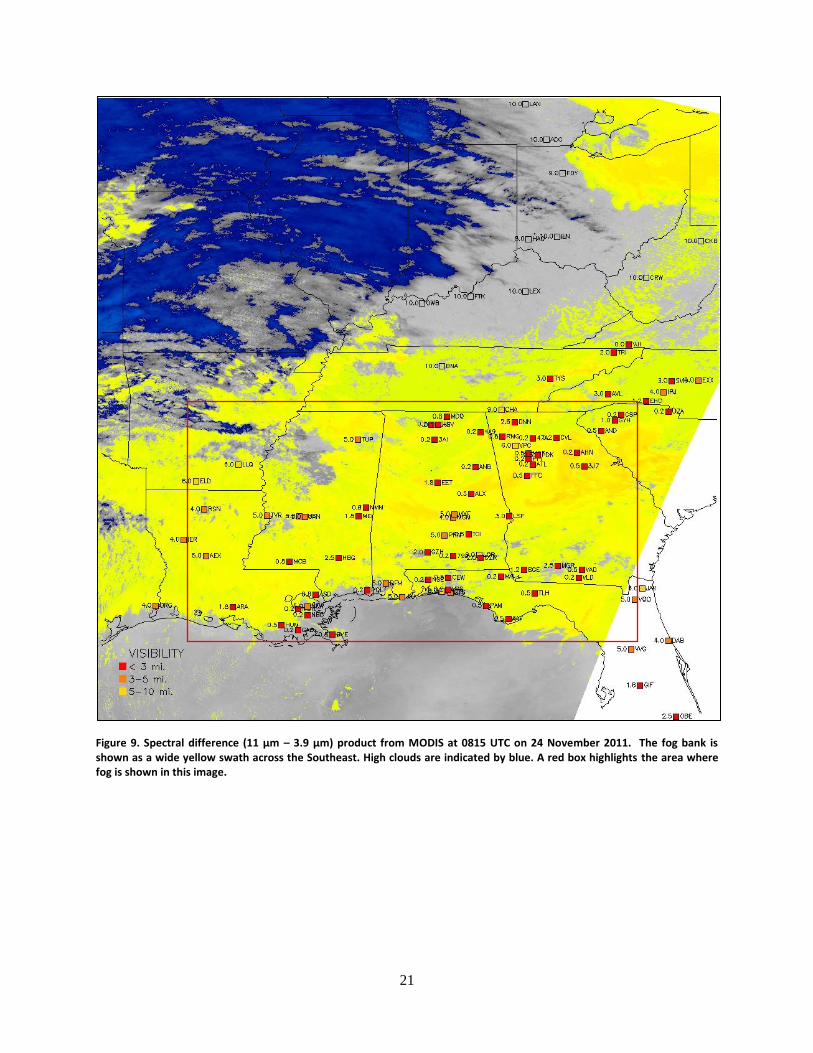
When this case is examined with a spectral difference image, many of the thermal
contrasts visible in the single channel product are removed, but the color enhancement scheme of
this imagery causes low clouds and high clouds to be easily differentiable (Fig. 9). As with the
19 November case, high clouds appear as a blue color. Low clouds and fog take on a yellow
color, causing the fog event occurring in the Southeast to stand out in sharp contrast to the high
clouds in the Midwest. The spectral difference product also brings out fog features that are not as
easily visible in the infrared image. In the infrared image, there is little indication of low clouds
or fog in the Northeast, but the spectral difference image enhances these features and draws the
user’s eye immediately to that area, in addition to features in the Southeast. Although the
imagery for this case draws the observer’s attention to the correct area, it has some drawbacks.
This type of imagery shows little distinction between fog and low clouds. Rather, these lower
level features tend to be uniform in color. Also, since the enhancement of this image causes
colors to be opaque, it is impossible to differentiate regions of thicker fog or clouds from regions
of thinner fog. The spectral difference product represents an improvement to fog and low cloud
detection over single channel infrared imagery. Although fog depth is not available from this
imagery, the location and spatial extent of fog is more distinct and visible than in infrared
imagery. From an analysis and forecasting perspective, spectral difference imagery is an
improvement to single channel imagery.
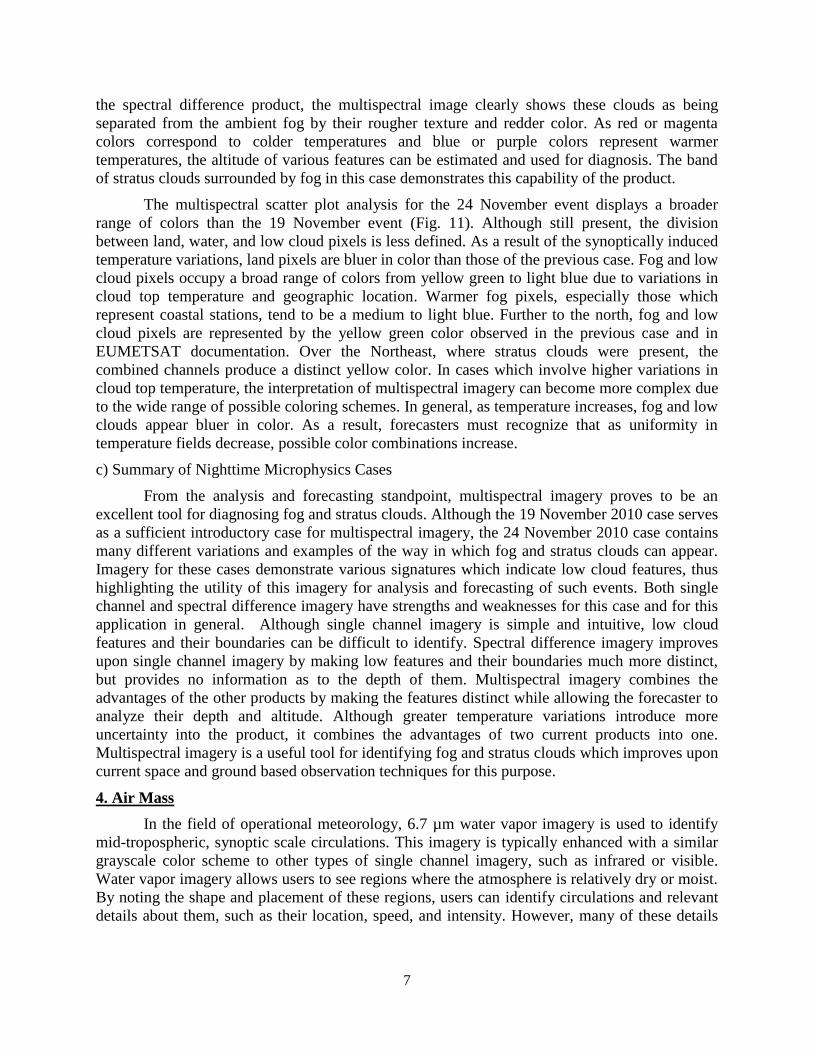
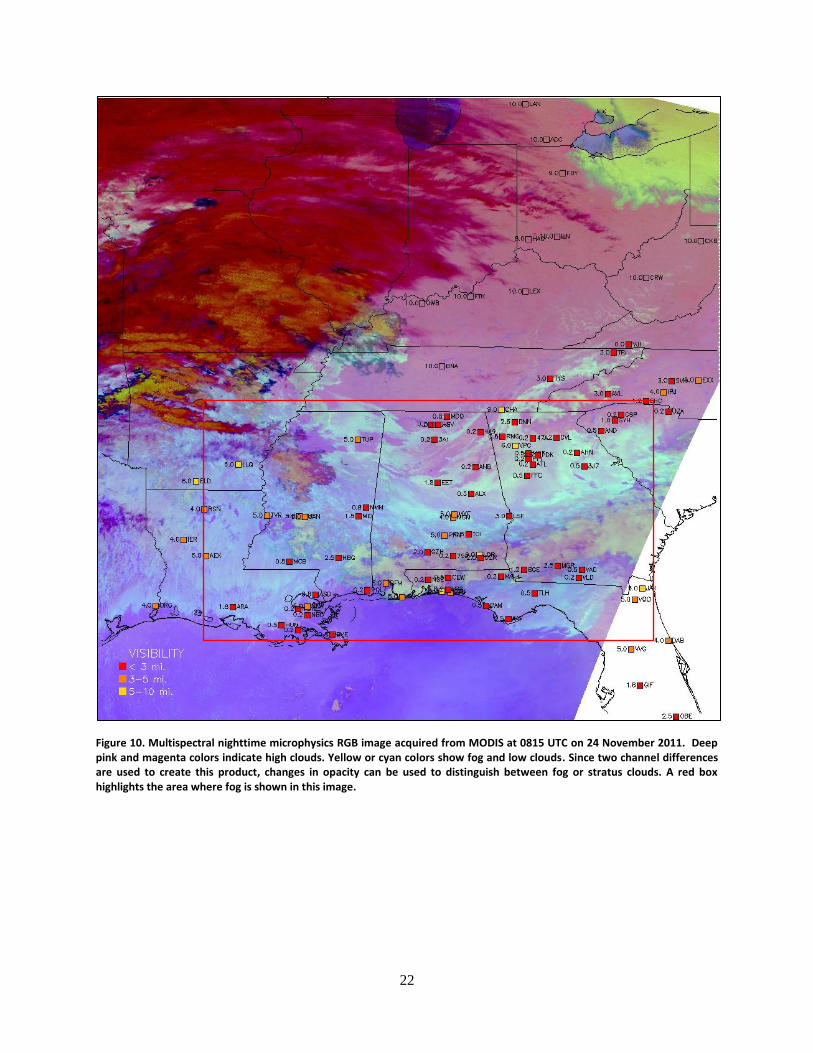
As with the first case, multispectral imagery was generated for this case (Fig. 10). Land
appears as a pink color, water appears as a blue color, high clouds a red color, and low clouds or
fog are bluish yellow or greenish yellow depending on the overall temperature of the region. As
in the spectral difference imagery, attention is drawn to the areas where fog is reported. The
northern boundary of the fog takes on the yellow-green color seen in the previous case, but the
southern and western portions of the fog change in color. Where the fog top temperature is
relatively warmer than surrounding areas, such as Louisiana, the fog takes on a bluish yellow
shade, rather than greenish yellow. These colors correspond with the fog seen in the infrared
image, even though there is some variation among the colors which represent fog. The reason for
this variation is connected to the temperature of the fog top, which is warmer near the Gulf Coast
in this case. Although almost invisible in the infrared imagery, fog is clearly shown over
Louisiana by the multispectral imagery. Fog in these warmer regions is confirmed by surface
observations and by multispectral imagery. Low cloud features are also clearly present in the
Northeast on infrared imagery. In the multispectral product, they take on a deep yellow-green
color. The occurrence of fog at multiple latitudes in this case indicates that its signature on
multispectral imagery will vary slightly with latitude, and subsequently with cloud top
temperature. The warmer the cloud top temperature, the more bluish-yellow it will appear, the
colder the cloud top temperature, the more greenish-yellow it will appear. Due to the color
combination in the RGB image, the stratus deck appears clearly. Although it was not visible in
7
the spectral difference product, the multispectral image clearly shows these clouds as being
separated from the ambient fog by their rougher texture and redder color. As red or magenta
colors correspond to colder temperatures and blue or purple colors represent warmer
temperatures, the altitude of various features can be estimated and used for diagnosis. The band
of stratus clouds surrounded by fog in this case demonstrates this capability of the product.
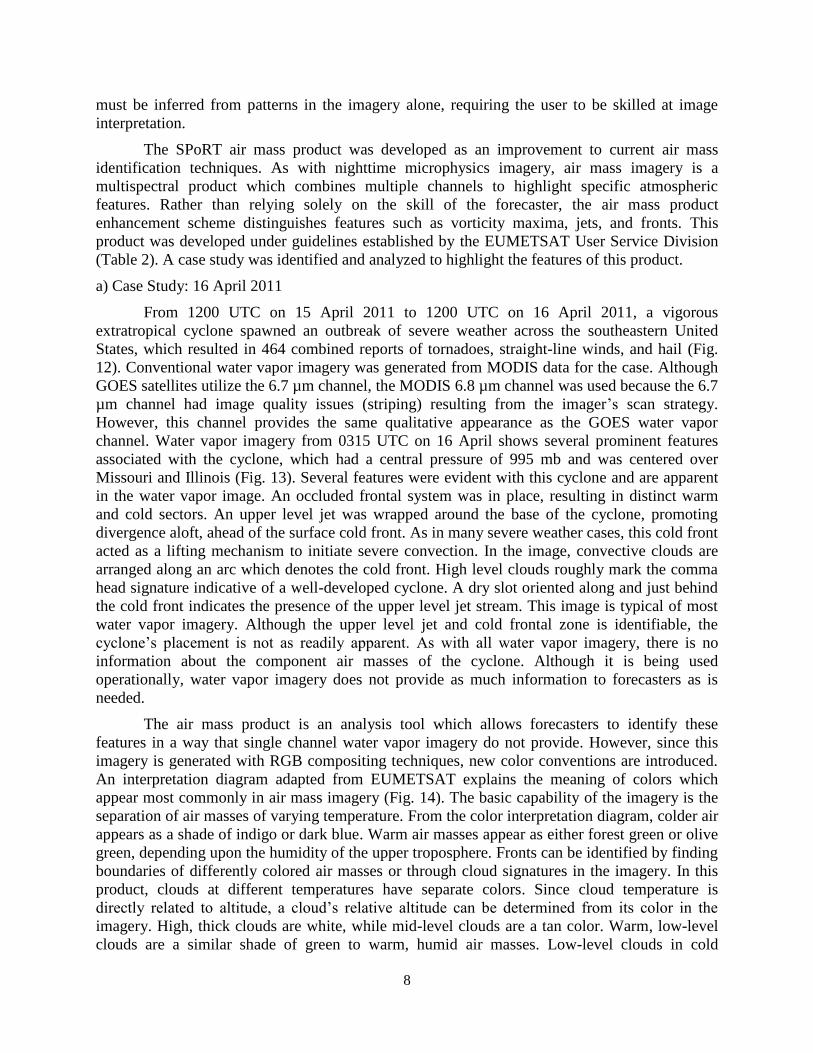
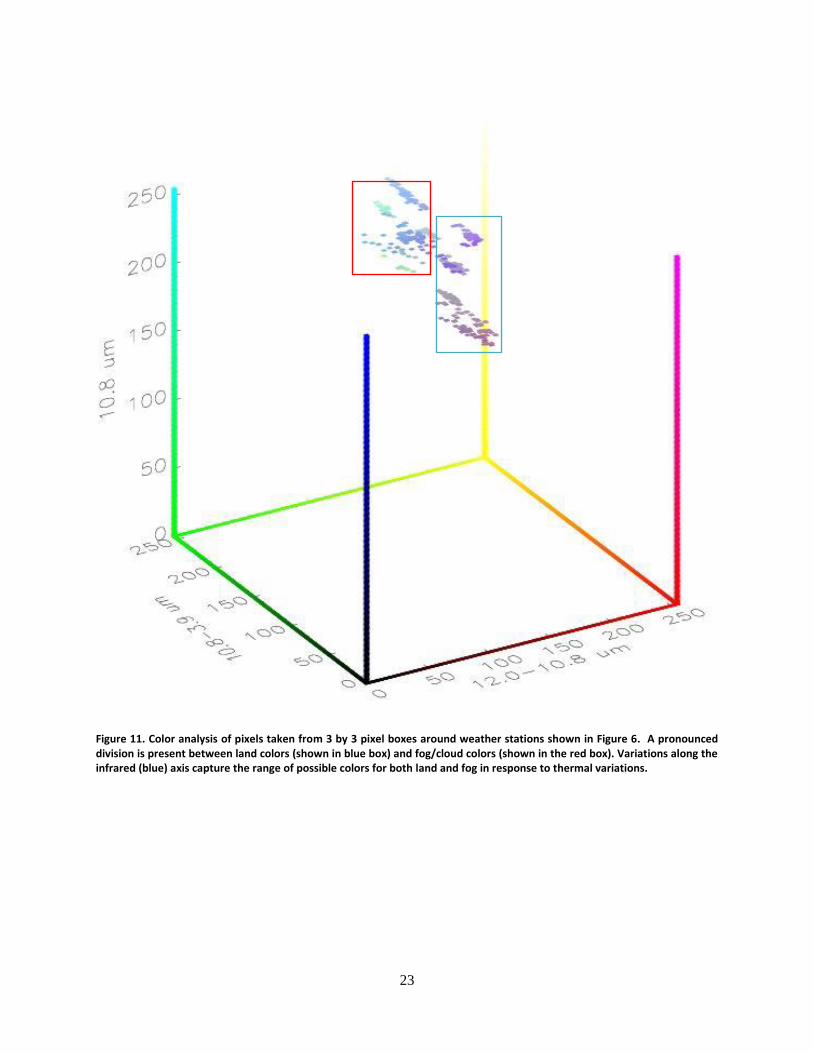
The multispectral scatter plot analysis for the 24 November event displays a broader
range of colors than the 19 November event (Fig. 11). Although still present, the division
between land, water, and low cloud pixels is less defined. As a result of the synoptically induced
temperature variations, land pixels are bluer in color than those of the previous case. Fog and low
cloud pixels occupy a broad range of colors from yellow green to light blue due to variations in
cloud top temperature and geographic location. Warmer fog pixels, especially those which
represent coastal stations, tend to be a medium to light blue. Further to the north, fog and low
cloud pixels are represented by the yellow green color observed in the previous case and in
EUMETSAT documentation. Over the Northeast, where stratus clouds were present, the
combined channels produce a distinct yellow color. In cases which involve higher variations in
cloud top temperature, the interpretation of multispectral imagery can become more complex due
to the wide range of possible coloring schemes. In general, as temperature increases, fog and low
clouds appear bluer in color. As a result, forecasters must recognize that as uniformity in
temperature fields decrease, possible color combinations increase.
c) Summary of Nighttime Microphysics Cases
From the analysis and forecasting standpoint, multispectral imagery proves to be an
excellent tool for diagnosing fog and stratus clouds. Although the 19 November 2010 case serves
as a sufficient introductory case for multispectral imagery, the 24 November 2010 case contains
many different variations and examples of the way in which fog and stratus clouds can appear.
Imagery for these cases demonstrate various signatures which indicate low cloud features, thus
highlighting the utility of this imagery for analysis and forecasting of such events. Both single
channel and spectral difference imagery have strengths and weaknesses for this case and for this
application in general. Although single channel imagery is simple and intuitive, low cloud
features and their boundaries can be difficult to identify. Spectral difference imagery improves
upon single channel imagery by making low features and their boundaries much more distinct,
but provides no information as to the depth of them. Multispectral imagery combines the
advantages of the other products by making the features distinct while allowing the forecaster to
analyze their depth and altitude. Although greater temperature variations introduce more
uncertainty into the product, it combines the advantages of two current products into one.
Multispectral imagery is a useful tool for identifying fog and stratus clouds which improves upon
current space and ground based observation techniques for this purpose.
4. Air Mass
In the field of operational meteorology, 6.7 µm water vapor imagery is used to identify
mid-tropospheric, synoptic scale circulations. This imagery is typically enhanced with a similar
grayscale color scheme to other types of single channel imagery, such as infrared or visible.
Water vapor imagery allows users to see regions where the atmosphere is relatively dry or moist.
By noting the shape and placement of these regions, users can identify circulations and relevant
details about them, such as their location, speed, and intensity. However, many of these details
8
must be inferred from patterns in the imagery alone, requiring the user to be skilled at image
interpretation.
The SPoRT air mass product was developed as an improvement to current air mass
identification techniques. As with nighttime microphysics imagery, air mass imagery is a
multispectral product which combines multiple channels to highlight specific atmospheric
features. Rather than relying solely on the skill of the forecaster, the air mass product
enhancement scheme distinguishes features such as vorticity maxima, jets, and fronts. This
product was developed under guidelines established by the EUMETSAT User Service Division
(Table 2). A case study was identified and analyzed to highlight the features of this product.
a) Case Study: 16 April 2011
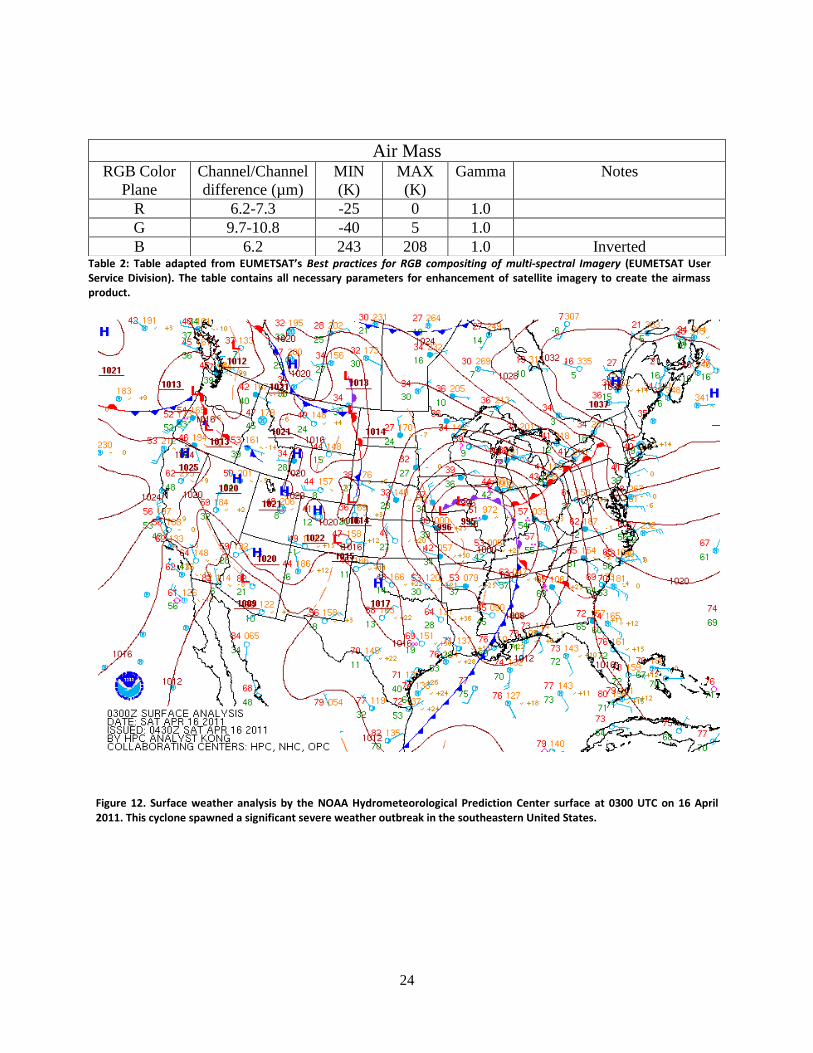
From 1200 UTC on 15 April 2011 to 1200 UTC on 16 April 2011, a vigorous
extratropical cyclone spawned an outbreak of severe weather across the southeastern United
States, which resulted in 464 combined reports of tornadoes, straight-line winds, and hail (Fig.
12). Conventional water vapor imagery was generated from MODIS data for the case. Although
GOES satellites utilize the 6.7 µm channel, the MODIS 6.8 µm channel was used because the 6.7
µm channel had image quality issues (striping) resulting from the imager’s scan strategy.
However, this channel provides the same qualitative appearance as the GOES water vapor
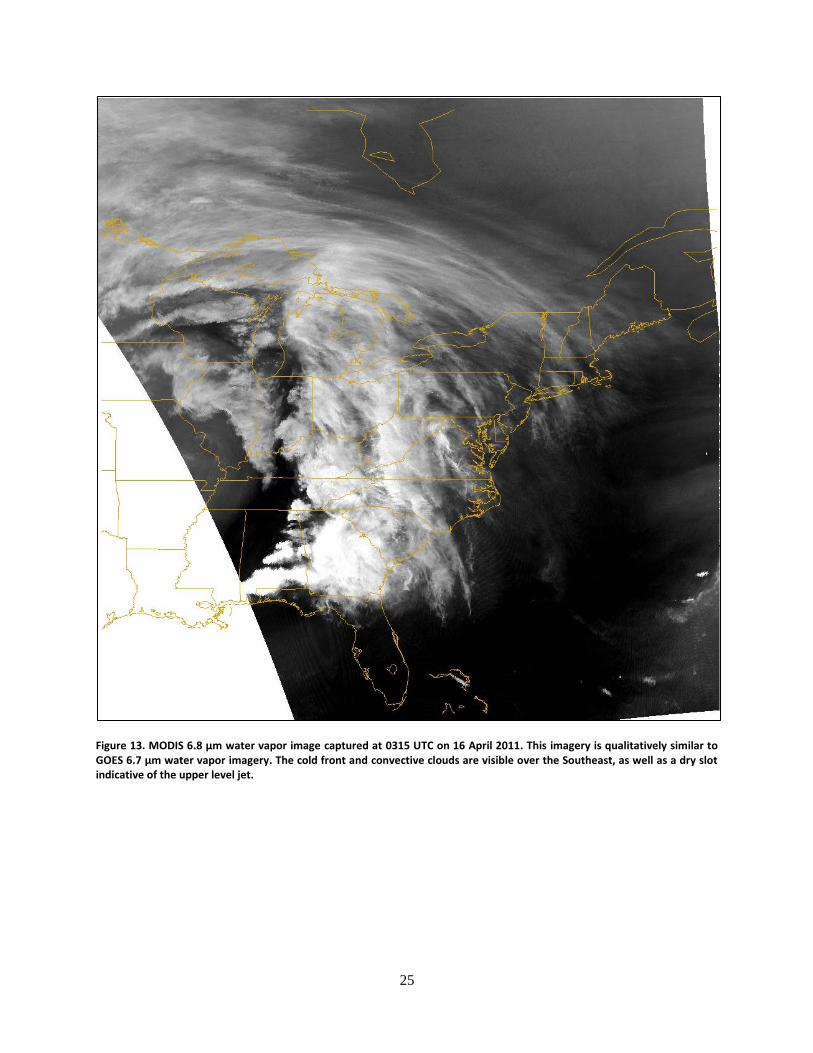
channel. Water vapor imagery from 0315 UTC on 16 April shows several prominent features
associated with the cyclone, which had a central pressure of 995 mb and was centered over
Missouri and Illinois (Fig. 13). Several features were evident with this cyclone and are apparent
in the water vapor image. An occluded frontal system was in place, resulting in distinct warm
and cold sectors. An upper level jet was wrapped around the base of the cyclone, promoting
divergence aloft, ahead of the surface cold front. As in many severe weather cases, this cold front
acted as a lifting mechanism to initiate severe convection. In the image, convective clouds are
arranged along an arc which denotes the cold front. High level clouds roughly mark the comma
head signature indicative of a well-developed cyclone. A dry slot oriented along and just behind
the cold front indicates the presence of the upper level jet stream. This image is typical of most
water vapor imagery. Although the upper level jet and cold frontal zone is identifiable, the
cyclone’s placement is not as readily apparent. As with all water vapor imagery, there is no
information about the component air masses of the cyclone. Although it is being used
operationally, water vapor imagery does not provide as much information to forecasters as is
needed.
The air mass product is an analysis tool which allows forecasters to identify these
features in a way that single channel water vapor imagery do not provide. However, since this
imagery is generated with RGB compositing techniques, new color conventions are introduced.
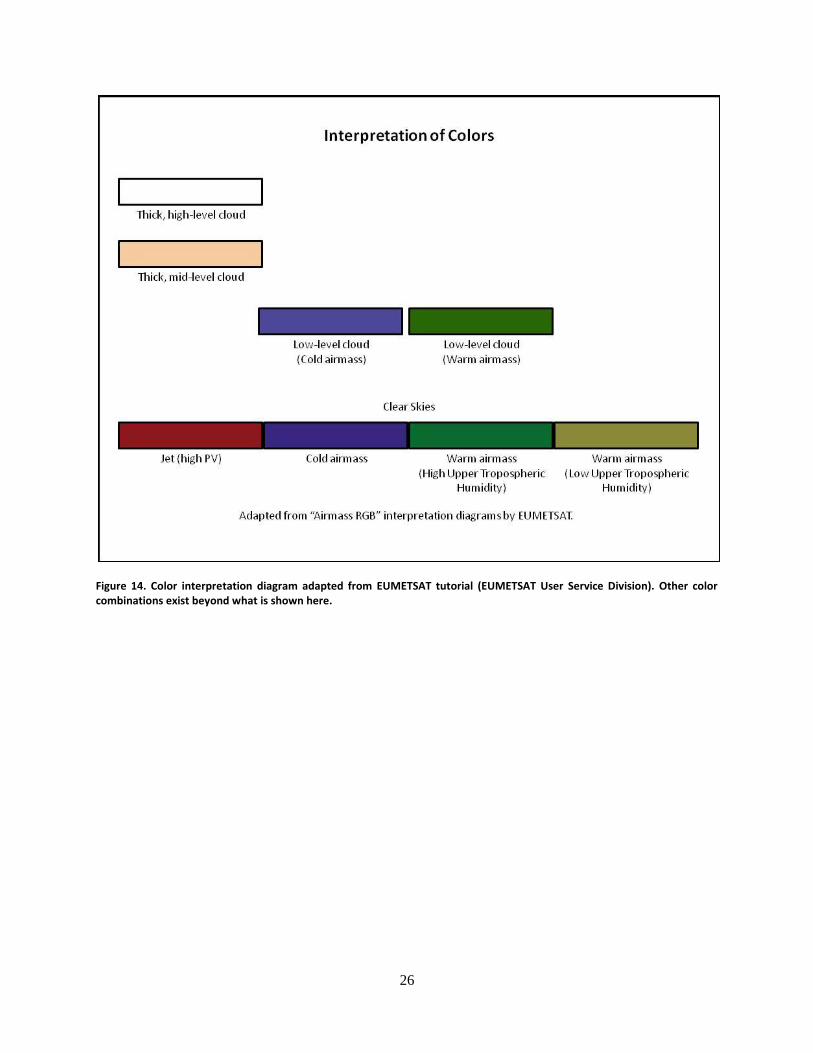
An interpretation diagram adapted from EUMETSAT explains the meaning of colors which
appear most commonly in air mass imagery (Fig. 14). The basic capability of the imagery is the
separation of air masses of varying temperature. From the color interpretation diagram, colder air
appears as a shade of indigo or dark blue. Warm air masses appear as either forest green or olive
green, depending upon the humidity of the upper troposphere. Fronts can be identified by finding
boundaries of differently colored air masses or through cloud signatures in the imagery. In this
product, clouds at different temperatures have separate colors. Since cloud temperature is
directly related to altitude, a cloud’s relative altitude can be determined from its color in the
imagery. High, thick clouds are white, while mid-level clouds are a tan color. Warm, low-level
clouds are a similar shade of green to warm, humid air masses. Low-level clouds in cold
9
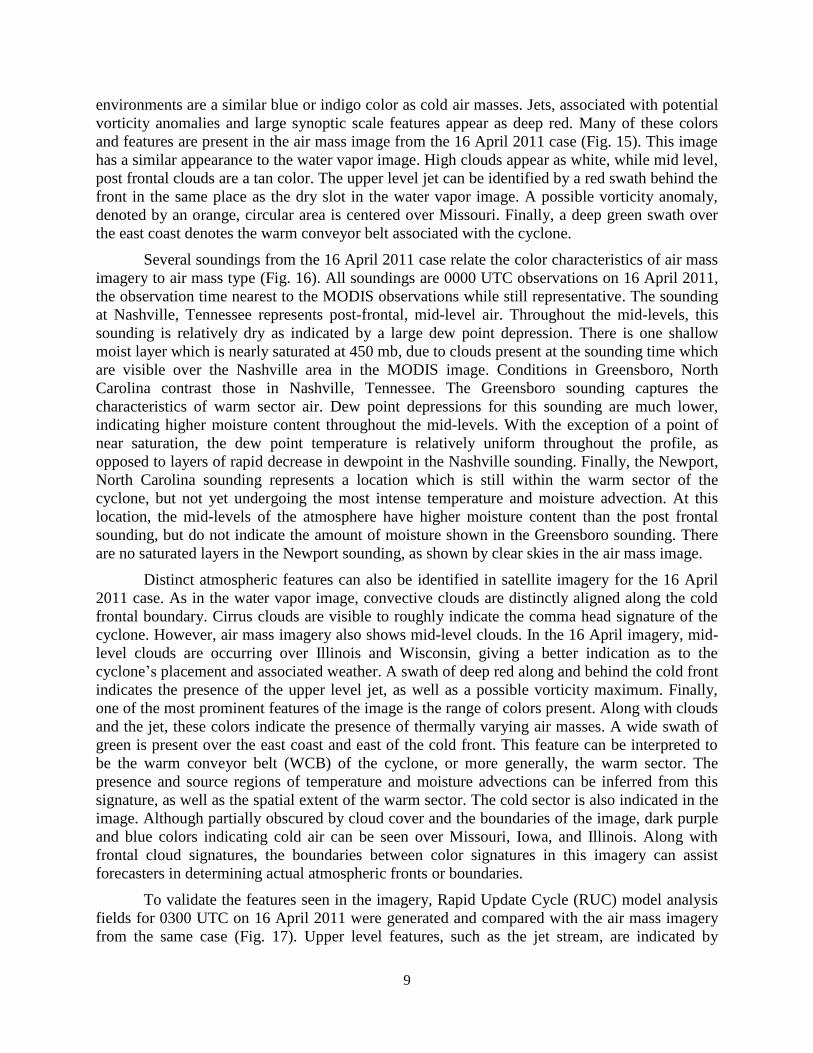
environments are a similar blue or indigo color as cold air masses. Jets, associated with potential
vorticity anomalies and large synoptic scale features appear as deep red. Many of these colors
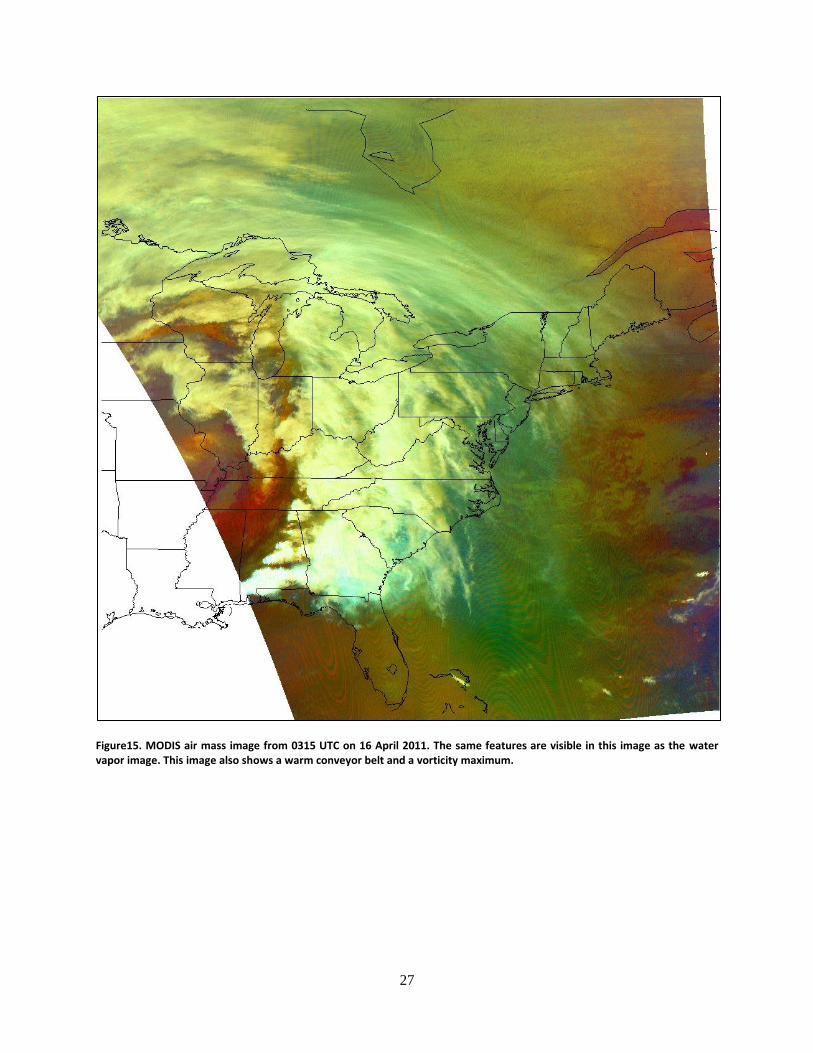
and features are present in the air mass image from the 16 April 2011 case (Fig. 15). This image
has a similar appearance to the water vapor image. High clouds appear as white, while mid level,
post frontal clouds are a tan color. The upper level jet can be identified by a red swath behind the
front in the same place as the dry slot in the water vapor image. A possible vorticity anomaly,
denoted by an orange, circular area is centered over Missouri. Finally, a deep green swath over
the east coast denotes the warm conveyor belt associated with the cyclone.
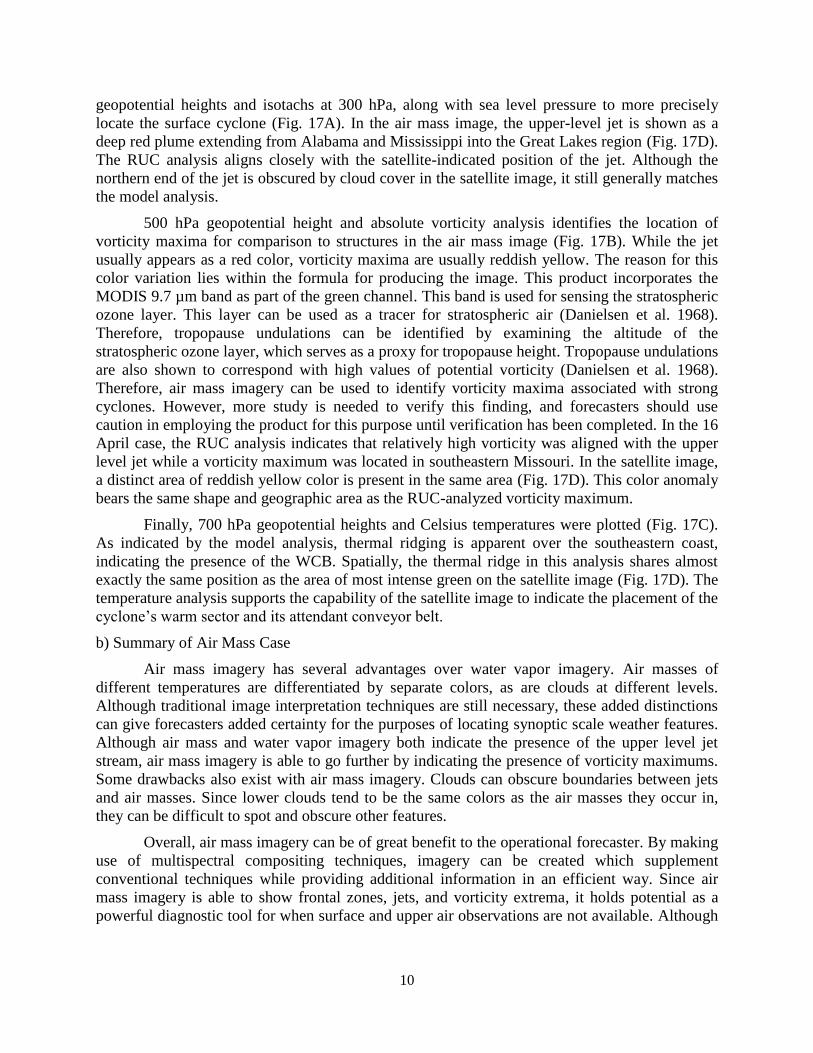
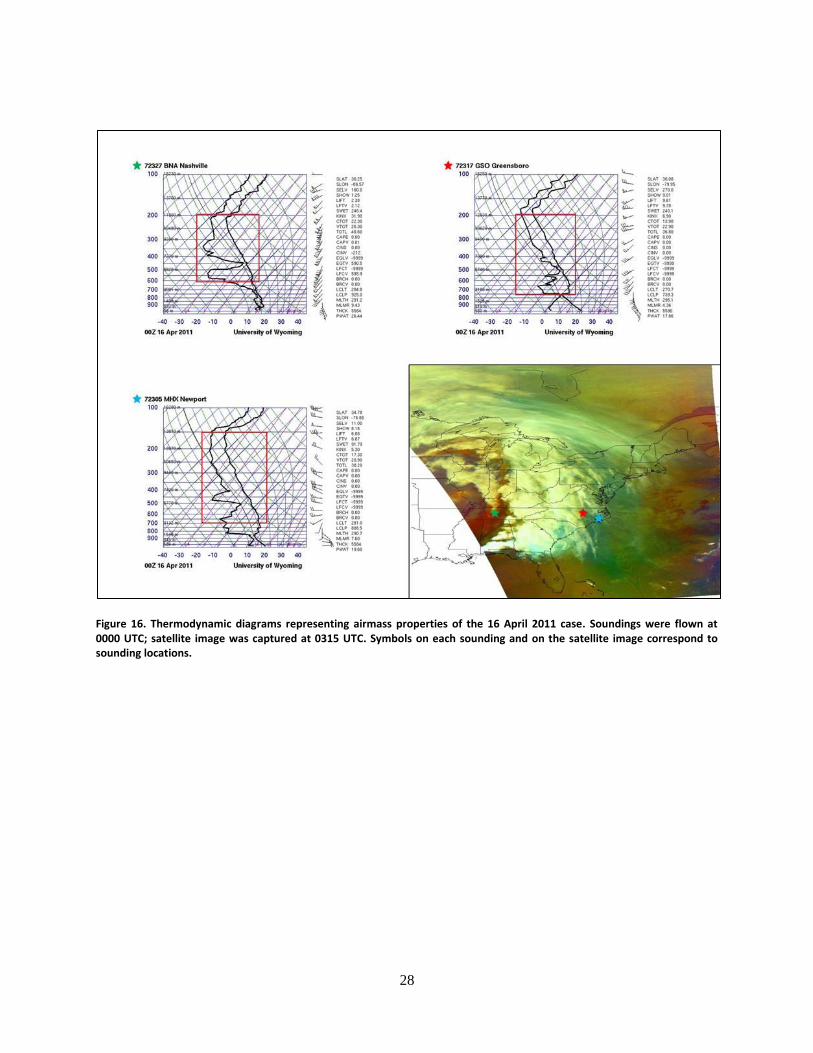
Several soundings from the 16 April 2011 case relate the color characteristics of air mass
imagery to air mass type (Fig. 16). All soundings are 0000 UTC observations on 16 April 2011,
the observation time nearest to the MODIS observations while still representative. The sounding
at Nashville, Tennessee represents post-frontal, mid-level air. Throughout the mid-levels, this
sounding is relatively dry as indicated by a large dew point depression. There is one shallow
moist layer which is nearly saturated at 450 mb, due to clouds present at the sounding time which
are visible over the Nashville area in the MODIS image. Conditions in Greensboro, North
Carolina contrast those in Nashville, Tennessee. The Greensboro sounding captures the
characteristics of warm sector air. Dew point depressions for this sounding are much lower,
indicating higher moisture content throughout the mid-levels. With the exception of a point of
near saturation, the dew point temperature is relatively uniform throughout the profile, as
opposed to layers of rapid decrease in dewpoint in the Nashville sounding. Finally, the Newport,
North Carolina sounding represents a location which is still within the warm sector of the
cyclone, but not yet undergoing the most intense temperature and moisture advection. At this
location, the mid-levels of the atmosphere have higher moisture content than the post frontal
sounding, but do not indicate the amount of moisture shown in the Greensboro sounding. There
are no saturated layers in the Newport sounding, as shown by clear skies in the air mass image.
Distinct atmospheric features can also be identified in satellite imagery for the 16 April
2011 case. As in the water vapor image, convective clouds are distinctly aligned along the cold
frontal boundary. Cirrus clouds are visible to roughly indicate the comma head signature of the
cyclone. However, air mass imagery also shows mid-level clouds. In the 16 April imagery, mid-
level clouds are occurring over Illinois and Wisconsin, giving a better indication as to the
cyclone’s placement and associated weather. A swath of deep red along and behind the cold front
indicates the presence of the upper level jet, as well as a possible vorticity maximum. Finally,
one of the most prominent features of the image is the range of colors present. Along with clouds
and the jet, these colors indicate the presence of thermally varying air masses. A wide swath of
green is present over the east coast and east of the cold front. This feature can be interpreted to
be the warm conveyor belt (WCB) of the cyclone, or more generally, the warm sector. The
presence and source regions of temperature and moisture advections can be inferred from this
signature, as well as the spatial extent of the warm sector. The cold sector is also indicated in the
image. Although partially obscured by cloud cover and the boundaries of the image, dark purple
and blue colors indicating cold air can be seen over Missouri, Iowa, and Illinois. Along with
frontal cloud signatures, the boundaries between color signatures in this imagery can assist
forecasters in determining actual atmospheric fronts or boundaries.
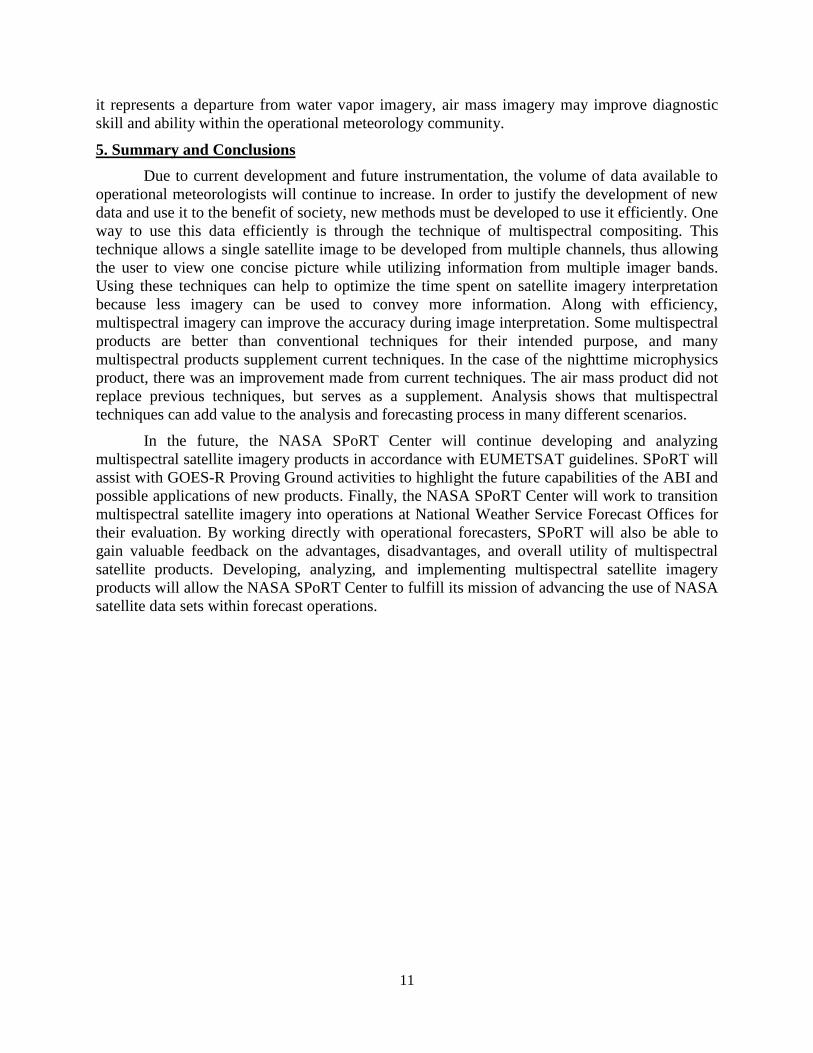
To validate the features seen in the imagery, Rapid Update Cycle (RUC) model analysis
fields for 0300 UTC on 16 April 2011 were generated and compared with the air mass imagery
from the same case (Fig. 17). Upper level features, such as the jet stream, are indicated by
10
geopotential heights and isotachs at 300 hPa, along with sea level pressure to more precisely
locate the surface cyclone (Fig. 17A). In the air mass image, the upper-level jet is shown as a
deep red plume extending from Alabama and Mississippi into the Great Lakes region (Fig. 17D).
The RUC analysis aligns closely with the satellite-indicated position of the jet. Although the
northern end of the jet is obscured by cloud cover in the satellite image, it still generally matches
the model analysis.
500 hPa geopotential height and absolute vorticity analysis identifies the location of
vorticity maxima for comparison to structures in the air mass image (Fig. 17B). While the jet
usually appears as a red color, vorticity maxima are usually reddish yellow. The reason for this
color variation lies within the formula for producing the image. This product incorporates the
MODIS 9.7 µm band as part of the green channel. This band is used for sensing the stratospheric
ozone layer. This layer can be used as a tracer for stratospheric air (Danielsen et al. 1968).
Therefore, tropopause undulations can be identified by examining the altitude of the
stratospheric ozone layer, which serves as a proxy for tropopause height. Tropopause undulations
are also shown to correspond with high values of potential vorticity (Danielsen et al. 1968).
Therefore, air mass imagery can be used to identify vorticity maxima associated with strong
cyclones. However, more study is needed to verify this finding, and forecasters should use
caution in employing the product for this purpose until verification has been completed. In the 16
April case, the RUC analysis indicates that relatively high vorticity was aligned with the upper
level jet while a vorticity maximum was located in southeastern Missouri. In the satellite image,
a distinct area of reddish yellow color is present in the same area (Fig. 17D). This color anomaly
bears the same shape and geographic area as the RUC-analyzed vorticity maximum.
Finally, 700 hPa geopotential heights and Celsius temperatures were plotted (Fig. 17C).
As indicated by the model analysis, thermal ridging is apparent over the southeastern coast,
indicating the presence of the WCB. Spatially, the thermal ridge in this analysis shares almost
exactly the same position as the area of most intense green on the satellite image (Fig. 17D). The
temperature analysis supports the capability of the satellite image to indicate the placement of the
cyclone’s warm sector and its attendant conveyor belt.
b) Summary of Air Mass Case
Air mass imagery has several advantages over water vapor imagery. Air masses of
different temperatures are differentiated by separate colors, as are clouds at different levels.
Although traditional image interpretation techniques are still necessary, these added distinctions
can give forecasters added certainty for the purposes of locating synoptic scale weather features.
Although air mass and water vapor imagery both indicate the presence of the upper level jet
stream, air mass imagery is able to go further by indicating the presence of vorticity maximums.
Some drawbacks also exist with air mass imagery. Clouds can obscure boundaries between jets
and air masses. Since lower clouds tend to be the same colors as the air masses they occur in,
they can be difficult to spot and obscure other features.
Overall, air mass imagery can be of great benefit to the operational forecaster. By making
use of multispectral compositing techniques, imagery can be created which supplement
conventional techniques while providing additional information in an efficient way. Since air
mass imagery is able to show frontal zones, jets, and vorticity extrema, it holds potential as a
powerful diagnostic tool for when surface and upper air observations are not available. Although
11
it represents a departure from water vapor imagery, air mass imagery may improve diagnostic
skill and ability within the operational meteorology community.
5. Summary and Conclusions
Due to current development and future instrumentation, the volume of data available to
operational meteorologists will continue to increase. In order to justify the development of new
data and use it to the benefit of society, new methods must be developed to use it efficiently. One
way to use this data efficiently is through the technique of multispectral compositing. This
technique allows a single satellite image to be developed from multiple channels, thus allowing
the user to view one concise picture while utilizing information from multiple imager bands.
Using these techniques can help to optimize the time spent on satellite imagery interpretation
because less imagery can be used to convey more information. Along with efficiency,
multispectral imagery can improve the accuracy during image interpretation. Some multispectral
products are better than conventional techniques for their intended purpose, and many
multispectral products supplement current techniques. In the case of the nighttime microphysics
product, there was an improvement made from current techniques. The air mass product did not
replace previous techniques, but serves as a supplement. Analysis shows that multispectral
techniques can add value to the analysis and forecasting process in many different scenarios.
In the future, the NASA SPoRT Center will continue developing and analyzing
multispectral satellite imagery products in accordance with EUMETSAT guidelines. SPoRT will
assist with GOES-R Proving Ground activities to highlight the future capabilities of the ABI and
possible applications of new products. Finally, the NASA SPoRT Center will work to transition
multispectral satellite imagery into operations at National Weather Service Forecast Offices for
their evaluation. By working directly with operational forecasters, SPoRT will also be able to
gain valuable feedback on the advantages, disadvantages, and overall utility of multispectral
satellite products. Developing, analyzing, and implementing multispectral satellite imagery
products will allow the NASA SPoRT Center to fulfill its mission of advancing the use of NASA
satellite data sets within forecast operations.
12
6. References
Danielsen, E., R. Bleck, J. Shedlovsky, A. Wartburg, P. Haagenson, and W. Pollock, 1970:
Observed Distribution of Radioactivity, Ozone, and Potential Vorticity Associated with
Tropopause Folding. Journ. Geo. Res. 75, 2353-2361.
EUMETSAT User Service Division: Best practices for RGB compositing of multi-spectral
imagery. 8 pp. Unpublished manuscript.
Schmit, T., M.M. Gunshor, W.P. Menzel, J.J. Gurka, J. Li, and A.S. Bachmeier, 2005:
Introducing the Next-Generation Advanced Baseline Imager on GOES-R.BAMS. 86,
1079, doi: 10.1175/BAMS-86-8-1079.
Underwood, J.S., G.P. Ellrod, and A.L. Kuhnert: 2004: A Multiple-Case Analysis of Nocturnal
Radiation-Fog Development in the Central Valley of California Utilizing the GOES
Nighttime Fog Product. Journ. Of App. Met.43, 297-311.
13
7. Tables and Figures
Figure 1. Surface analysis and weather observations at 1200 UTC on 19 November 2011. Though not reflected at the surface, a weak, low level ridge is present over the Southeast. Moisture advection was enhanced in response to the surface cyclone and low level ridge.
Nighttime Microphysics RGB Color
Plane
Channel/Channel
difference (µm)
MIN
(K)
MAX
(K)
Gamma Notes
R 12.0-10.8 -4 2 1.0
G 10.8-3.9 0 10 1.0 SPoRT Spectral Difference
B 10.8 243 293 1.0 Current IR Table 1. Table adapted from EUMETSAT’s Best practices for RGB compositing of multi-spectral Imagery. The table contains all necessary parameters for enhancement of satellite imagery to create the nighttime microphysics product. The G and B channels of the product are also current stand alone products of SPoRT.
14
Figure 2. Infrared (11 µm) imagery from MODIS at 0755 UTC on 19 November 2011. A red box highlights the area where fog is shown in this image.
15
Figure 3. Spectral difference (11 µm – 3.9 µm) product from MODIS at 0755 UTC on 19 November 2011. The fog bank is shown as a wide yellow swath across the center of the image. High clouds are indicated by blue. A red box highlights the area where fog is shown in this image.
16
Figure 4. Color interpretation for multispectral imagery, based upon based upon a similar figure from EUMETSAT tutorials (EUMETSAT User Service Division).
17
Figure 5. Multispectral nighttime microphysics RGB image acquired from MODIS at 0755 UTC on 19 November 2011. Deep pink and magenta colors indicate high clouds. Yellow or cyan colors show fog and low clouds. Since two channel differences are used to create this product, changes in opacity can be used to distinguish between fog or stratus clouds. A red box highlights the area where fog is shown in this image.
18
Figure 6. Color analysis of pixels taken from 3 by 3 pixel boxes around weather stations shown in Figure 5. A pronounced division is present between land colors (shown in blue box) and fog/cloud colors (shown in the red box). Variations along the infrared (blue) axis capture the range of possible colors for both land and fog in response to thermal variations.
19
Figure 7. Surface weather stations and analysis at 1200 UTC on 24 November 2011. A large cyclone and anticyclone dominate the CONUS, divided along the Mississippi River. Flow associated with both of these features enhanced moisture advection over the Gulf Coast and Southeast.
20
Figure 8. Infrared (11 µm) imagery from MODIS at 0815 UTC on 24 November 2011. The fog bank is shown as a “smear” across the Southeast. Fog is difficult to identify due to an intrusion of warm Gulf air, especially over Louisiana. A red box highlights the area where fog is shown in this image.
21
Figure 9. Spectral difference (11 µm – 3.9 µm) product from MODIS at 0815 UTC on 24 November 2011. The fog bank is shown as a wide yellow swath across the Southeast. High clouds are indicated by blue. A red box highlights the area where fog is shown in this image.
22
Figure 10. Multispectral nighttime microphysics RGB image acquired from MODIS at 0815 UTC on 24 November 2011. Deep pink and magenta colors indicate high clouds. Yellow or cyan colors show fog and low clouds. Since two channel differences are used to create this product, changes in opacity can be used to distinguish between fog or stratus clouds. A red box highlights the area where fog is shown in this image.
23
Figure 11. Color analysis of pixels taken from 3 by 3 pixel boxes around weather stations shown in Figure 6. A pronounced division is present between land colors (shown in blue box) and fog/cloud colors (shown in the red box). Variations along the infrared (blue) axis capture the range of possible colors for both land and fog in response to thermal variations.
24
Figure 12. Surface weather analysis by the NOAA Hydrometeorological Prediction Center surface at 0300 UTC on 16 April 2011. This cyclone spawned a significant severe weather outbreak in the southeastern United States.
Air Mass RGB Color
Plane
Channel/Channel
difference (µm)
MIN
(K)
MAX
(K)
Gamma Notes
R 6.2-7.3 -25 0 1.0
G 9.7-10.8 -40 5 1.0
B 6.2 243 208 1.0 Inverted Table 2: Table adapted from EUMETSAT’s Best practices for RGB compositing of multi-spectral Imagery (EUMETSAT User Service Division). The table contains all necessary parameters for enhancement of satellite imagery to create the airmass product.
25
Figure 13. MODIS 6.8 µm water vapor image captured at 0315 UTC on 16 April 2011. This imagery is qualitatively similar to GOES 6.7 µm water vapor imagery. The cold front and convective clouds are visible over the Southeast, as well as a dry slot indicative of the upper level jet.
26
Figure 14. Color interpretation diagram adapted from EUMETSAT tutorial (EUMETSAT User Service Division). Other color combinations exist beyond what is shown here.
27
Figure15. MODIS air mass image from 0315 UTC on 16 April 2011. The same features are visible in this image as the water vapor image. This image also shows a warm conveyor belt and a vorticity maximum.
28
Figure 16. Thermodynamic diagrams representing airmass properties of the 16 April 2011 case. Soundings were flown at 0000 UTC; satellite image was captured at 0315 UTC. Symbols on each sounding and on the satellite image correspond to sounding locations.
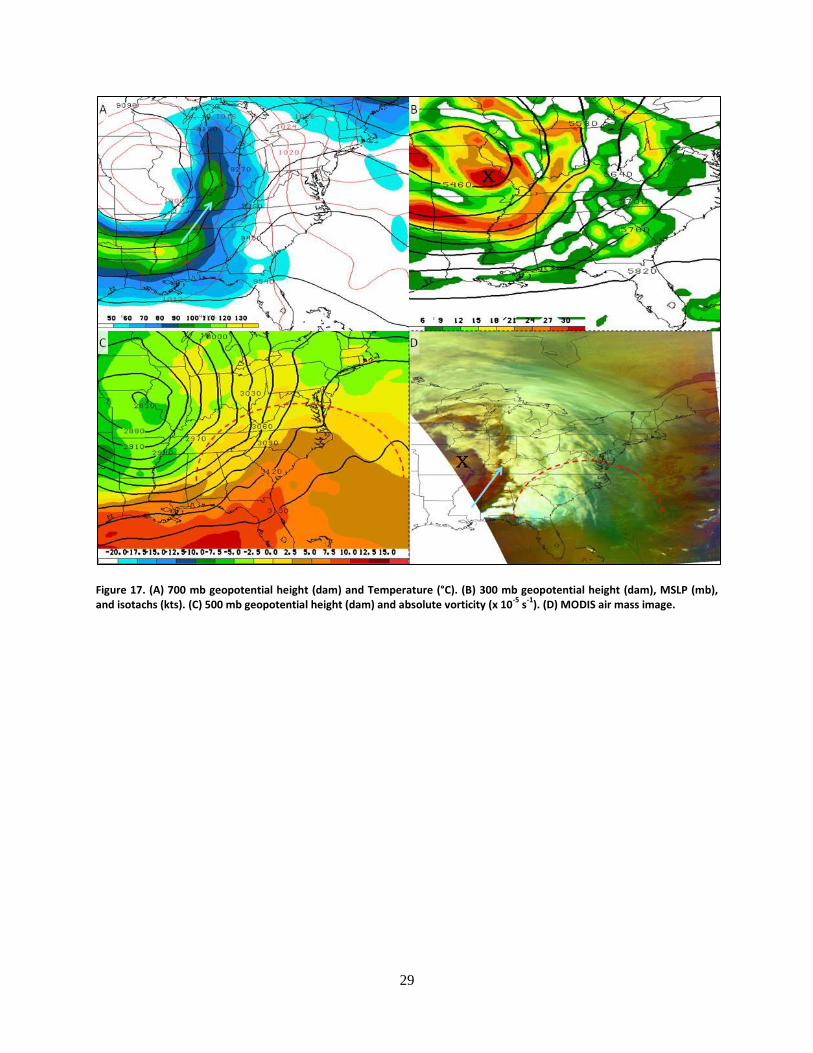
29
Figure 17. (A) 700 mb geopotential height (dam) and Temperature (°C). (B) 300 mb geopotential height (dam), MSLP (mb), and isotachs (kts). (C) 500 mb geopotential height (dam) and absolute vorticity (x 10
-5 s
-1). (D) MODIS air mass image.