Embed Size (px)
Citation preview
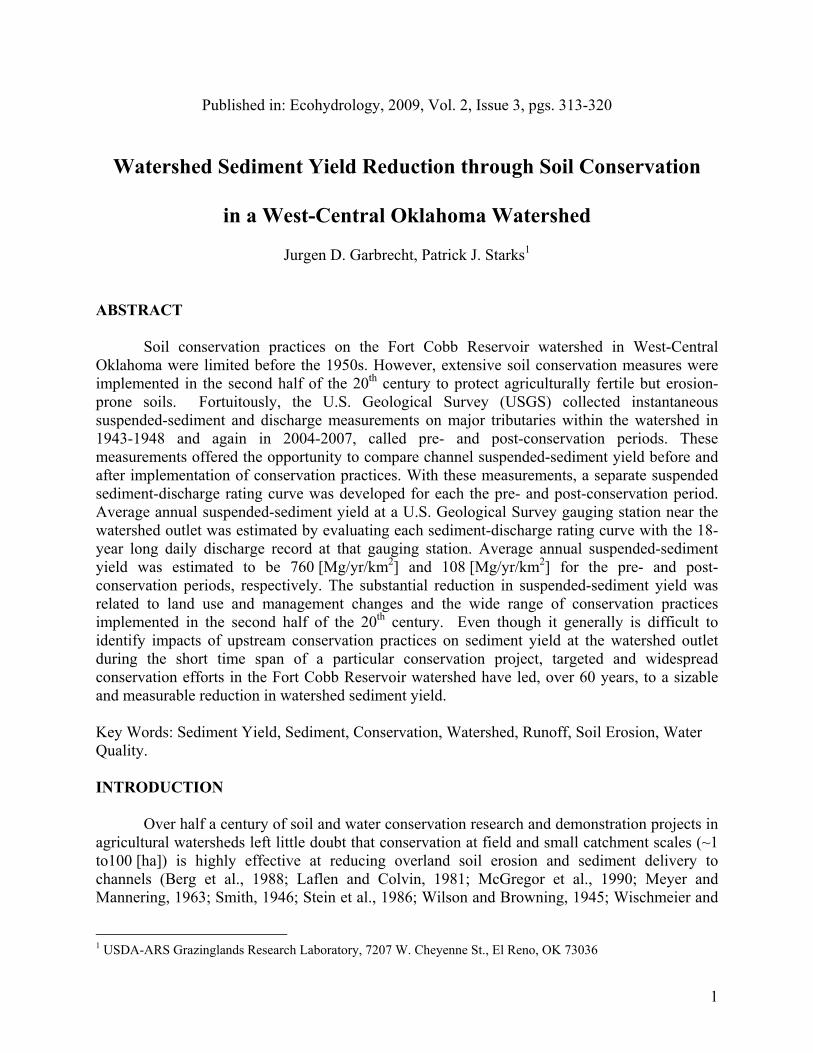
Published in: Ecohydrology, 2009, Vol. 2, Issue 3, pgs. 313-320
Watershed Sediment Yield Reduction through Soil Conservation
in a West-Central Oklahoma Watershed
Jurgen D. Garbrecht, Patrick J. Starks1
ABSTRACT
Soil conservation practices on the Fort Cobb Reservoir watershed in West-Central Oklahoma were limited before the 1950s. However, extensive soil conservation measures were implemented in the second half of the 20th century to protect agriculturally fertile but erosion-prone soils. Fortuitously, the U.S. Geological Survey (USGS) collected instantaneous suspended-sediment and discharge measurements on major tributaries within the watershed in 1943-1948 and again in 2004-2007, called pre- and post-conservation periods. These measurements offered the opportunity to compare channel suspended-sediment yield before and after implementation of conservation practices. With these measurements, a separate suspended sediment-discharge rating curve was developed for each the pre- and post-conservation period. Average annual suspended-sediment yield at a U.S. Geological Survey gauging station near the watershed outlet was estimated by evaluating each sediment-discharge rating curve with the 18-year long daily discharge record at that gauging station. Average annual suspended-sediment yield was estimated to be 760 [Mg/yr/km2] and 108 [Mg/yr/km2] for the pre- and post-conservation periods, respectively. The substantial reduction in suspended-sediment yield was related to land use and management changes and the wide range of conservation practices implemented in the second half of the 20th century. Even though it generally is difficult to identify impacts of upstream conservation practices on sediment yield at the watershed outlet during the short time span of a particular conservation project, targeted and widespread conservation efforts in the Fort Cobb Reservoir watershed have led, over 60 years, to a sizable and measurable reduction in watershed sediment yield. Key Words: Sediment Yield, Sediment, Conservation, Watershed, Runoff, Soil Erosion, Water Quality. INTRODUCTION
Over half a century of soil and water conservation research and demonstration projects in agricultural watersheds left little doubt that conservation at field and small catchment scales (~1 to100 [ha]) is highly effective at reducing overland soil erosion and sediment delivery to channels (Berg et al., 1988; Laflen and Colvin, 1981; McGregor et al., 1990; Meyer and Mannering, 1963; Smith, 1946; Stein et al., 1986; Wilson and Browning, 1945; Wischmeier and
1 USDA-ARS Grazinglands Research Laboratory, 7207 W. Cheyenne St., El Reno, OK 73036
1
Smith, 1978). However, soil conservation and channel stabilization do not always translate into an immediate response of measurable sediment yield reduction at a downstream point on the main channel of a large watershed (> ~10’000 [ha]) (Allen and Welch, 1971; Mead, 1988; Trimble, 1999; Santhi et al., 2005; Shields, 2008a). In this study, plausible reasons for this lag in watershed sediment-yield reduction to upland conservation practices are briefly reviewed, and a unique opportunity to demonstrate measurable conservation impacts on the Fort Cobb Reservoir watershed (~79’000 [ha]) was seized upon by contrasting runoff and suspended-sediment yield measurements with similar measurements taken more than half a century earlier. Suspended-sediment yield reduction over 60 years was estimated and interpreted in terms of land use conversion, soil conservation practices, urban development, and variations in climate. BACKGROUND
The perceived slow, delayed and often limited sediment yield reduction at the outlet of large watersheds as a result of upstream conservation practices can be attributed to several conservation program implementation factors. First, early conservation programs had eligibility criteria that encouraged broad participation and equal access, and did not place enough emphasis on placement or targeting of conservation practices to areas of high erosion potential within a watershed (Cox, 2008). Second, the effects of conservation or best management practices, while highly effective at the application sites, can lead to a minimal response at the watershed outlet if practices are not targeted and applied over a large enough portion of the watershed (Sharpley and Rekolainen, 1997; Santhi et al., 2005). Third, the track record of voluntary farmer participation in conservation programs has proven to be generally modest, depending on farm size, perceived economic advantages of adoption of conservation programs, implementation effort, and other factors (Hoard and Brewer, 2006; Lambert et al., 2006; McLean-Meyinsse, 1994). Last, but not least, funding for conservation programs is administered on an annual basis and spread over several years, leading to a gradual enrollment and corresponding incremental implementation of conservation practices, all adding to the lag time to full realization of conservation goals. These realities of on-the-ground program implementation suggest that it may take several years, even decades, before the extent of treated cropland is large enough for downstream sediment reduction and associated benefits to become noticeable or measurable at the watershed outlet (Allen and Welch, 1967; Shields, 2008b).
Furthermore, identification of conservation effects on watershed-scale sediment yield is often rendered difficult by the large variability of runoff, soil erosion and sediment yield that shroud beneficial impacts of conservation practices. The large variability in hydrologic parameters is brought about by the sporadic and spatially variable nature of runoff-producing storm events, especially when combined with seasonally-changing soil erosion potential due to agronomic activities. As a result of these many sources of variability, watershed runoff and sediment yield typically range over several orders of magnitude, and short-term conservation impacts at the watershed outlet are often hidden by this variability (Park et al., 1994; Staff, 1983; Shields, 2008b). Also, runoff, soil erosion, and sediment yield are known to be sensitive to modest, yet persistent, multi-year precipitation variations often observed in annual precipitation records (Garbrecht, 2008; Garbrecht et al., 2006). Thus, effects of persistently above normal precipitation on runoff and sediment yield can further overshadow beneficial impacts of conservation practices at a watershed outlet (Menzel et al., 1978; Williams et al., 1985), while
2
persistently below normal precipitation may lead to low sediment yield that could erroneously be attributed to benefits of conservation practices.
In addition to difficulties brought about by conservation program implementation and inherent variability of watershed runoff, the link between conservation and watershed sediment yield reduction is also often confounded by sediment storage effects within the watershed. Accelerated soil erosion on cropland areas may have been occurring for decades prior to implementation of conservation practices, with much of the eroded material re-deposited and accumulated in various locations within the watershed system. Conservation practices on cropland will reduce lateral sediment supply to channels, yet watershed runoff system will usually respond by seeking a new regime equilibrium, remobilizing previously deposited sediments, or by eroding channel boundaries, thereby concealing beneficial conservation impacts at the watershed scale by shifting sources of sediment (Allen and Naney, 1991; Meade, 1988; Trimble, 1999; Walling, 1999). It may take some time to flush accumulated and stored sediments before the full effect of upstream soil conservation practices can be seen at the watershed outlet.
In light of these confounding effects (limited participation in conservation programs, protracted implementation, temporal and spatial variability of soil erosion and sediment transport, and watershed sediment storage and flushing effects), sediment yield reductions are difficult to demonstrate at the watershed outlet within customary project durations of a few years. Hydrologic watershed models have been held by some as a way of alleviating these problems. With models, effects of various conservation scenarios on sediment yield reduction can be isolated by intentionally holding all other boundary conditions constant, and pre- and post-conservation treatment periods can be evaluated with identical climate drivers, thereby making results directly comparable with one another. These capabilities make hydrologic watershed models a practical approach to assess potential conservation impacts and benefits at the watershed scale (Santhi et al., 2005; Gassman et al., 2007; Jha et al., 2007). However, models are based on simplifications and assumptions and do not reflect the full range of complexities, intricacies and feedback mechanisms encountered in the real world. Calibration and validation of watershed-scale sediment simulations remain difficult largely because long-term runoff and sediment yield measurements spanning an adequate number of years to demonstrate the impacts of pre- and post-implementation of conservation programs are rarely available. Also, watershed-scale sediment storage effects, conditions for and recurrence of sediment remobilization, the dynamics of shifting sediment sources, and the spatial and temporal propagation of perturbations in sediment budget within the watershed system are all very difficult to quantify, yet they are pertinent to the assessment of sediment yield at the watershed outlet (Meade and Parker, 1985; Meade, 1988; Trimble, 1999; Trimble and Crosson, 2000; Parson et al., 2006; Walling, 1999; Vente et al., 2007). Hence, sediment yield simulations at a watershed scale, while informative and insightful, are rarely verifiable and must be interpreted within the framework of model capabilities, assumptions and limitations.
In this study, conservation impacts on the Fort Cobb Reservoir watershed (~79’000 ha) were investigated by comparing runoff and suspended sediment yield measurements taken by the US Geological Survey (USGS) during 2004-2007 with similar measurements taken in 1943-1948. Suspended sediment yield reduction at the outlet of the Fort Cobb Reservoir watershed over 60 years was estimated and interpreted in terms of land use changes, conservation practices, urban development, and variations in climate. Findings illustrated that cumulative effects of many years of targeted and widespread soil conservation efforts in Central Oklahoma can, given enough time, result in a sizable reduction in sediment yield at the watershed outlet.
3
Watershed Suspended-Sediment and Discharge Data
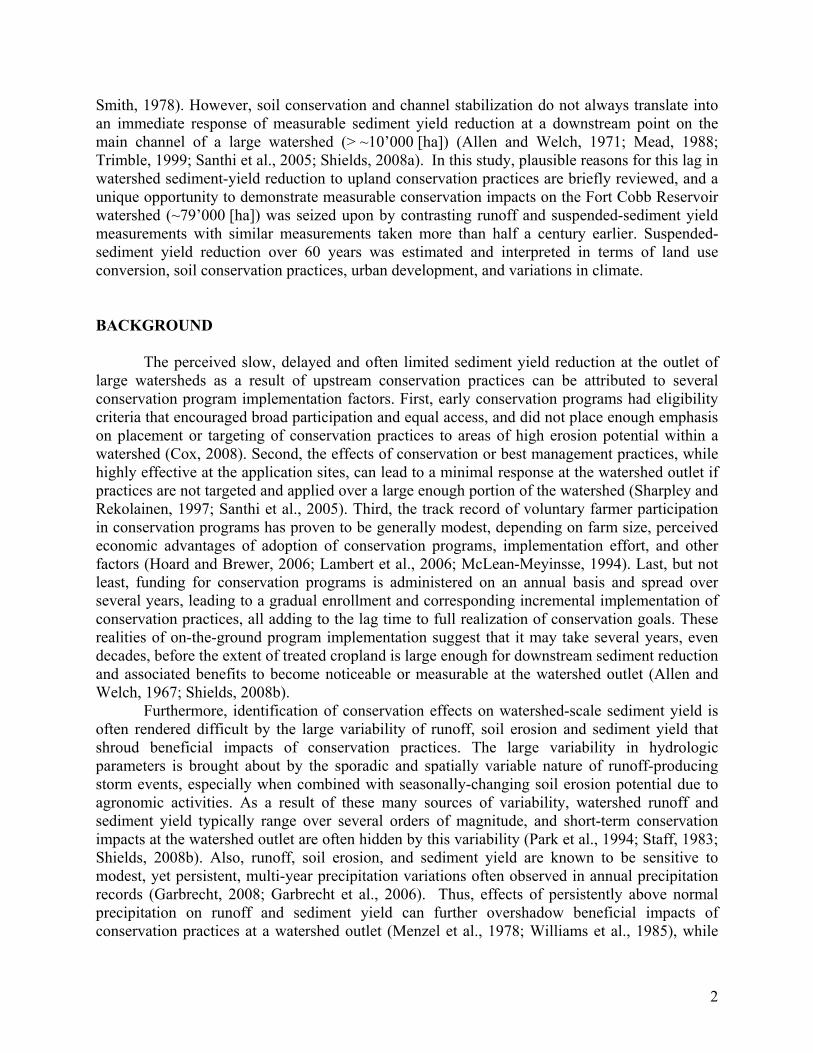
The Fort Cobb Reservoir in Central Oklahoma was constructed in 1959. It is a multipurpose reservoir for flood control, municipal and industrial water supply, and recreation. The reservoir receives inflow from a 787 [km2] agricultural watershed consisting primarily of crop and grass land (see next section). The USGS operated up to five discharge gauging stations on major tributaries, and collected instantaneous suspended-sediment and discharge data on a rainfall-runoff event basis at these stations (Figure 1; Table 1). In particular, 30 instantaneous suspended-sediment and discharge measurements were taken at the Cobb Creek gauging station near Fort Cobb during 1943-1948, and 105 similar measurements were taken at four other gauging stations during 2004-2007. Measured discharges varied by gauging station depending on size of drainage area and covered the range from low to high flow conditions. All discharge and suspended-sediment samples were collected and processed by the USGS using the same standard procedures. Suspended sediment was measured by depth-integrated sampling, a method that was developed by the Federal Inter-Agency Sedimentation Project (FIASP) of the Inter-Agency Committee on Water Resources and has been in use since about 1939 (Edwards and Glysson, 1977). Thus, it is unlikely that a bias was introduced in suspended-sediment measurements due to sampling and sample processing procedures. Also, the seasonal distribution of the number of collected samples is very similar between 1943-1948 and 2004-2007 (Table 2), thus minimizing the possibility of a bias that could have resulted from potential differences in seasonal distributions of sample numbers. The reader is further reminded that this study considers only suspended sediment which is the predominant sediment transport mode in the Fort Cobb watershed, and any reference to sediment yield, sediment load or sediment transport refers to suspended sediment only.
Fig. 1. Fort Cobb Reservoir watershed outline and locations of US Geological Survey discharge and suspended-sediment gauging sites.
4
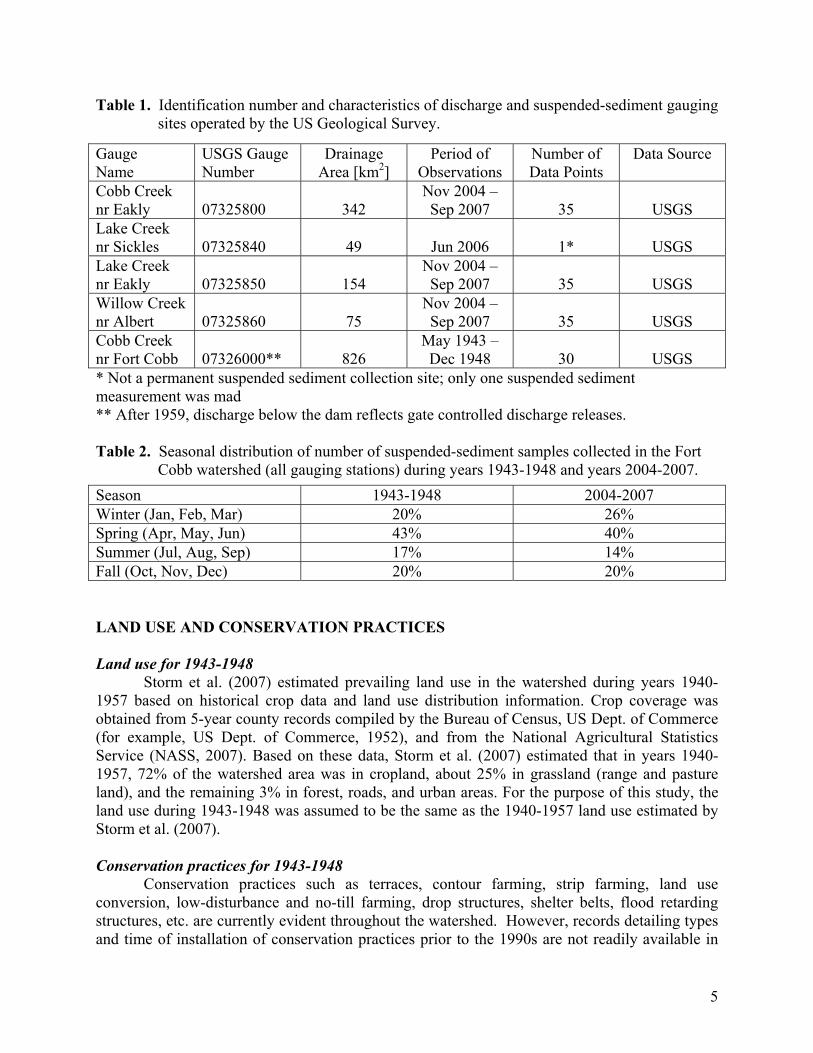
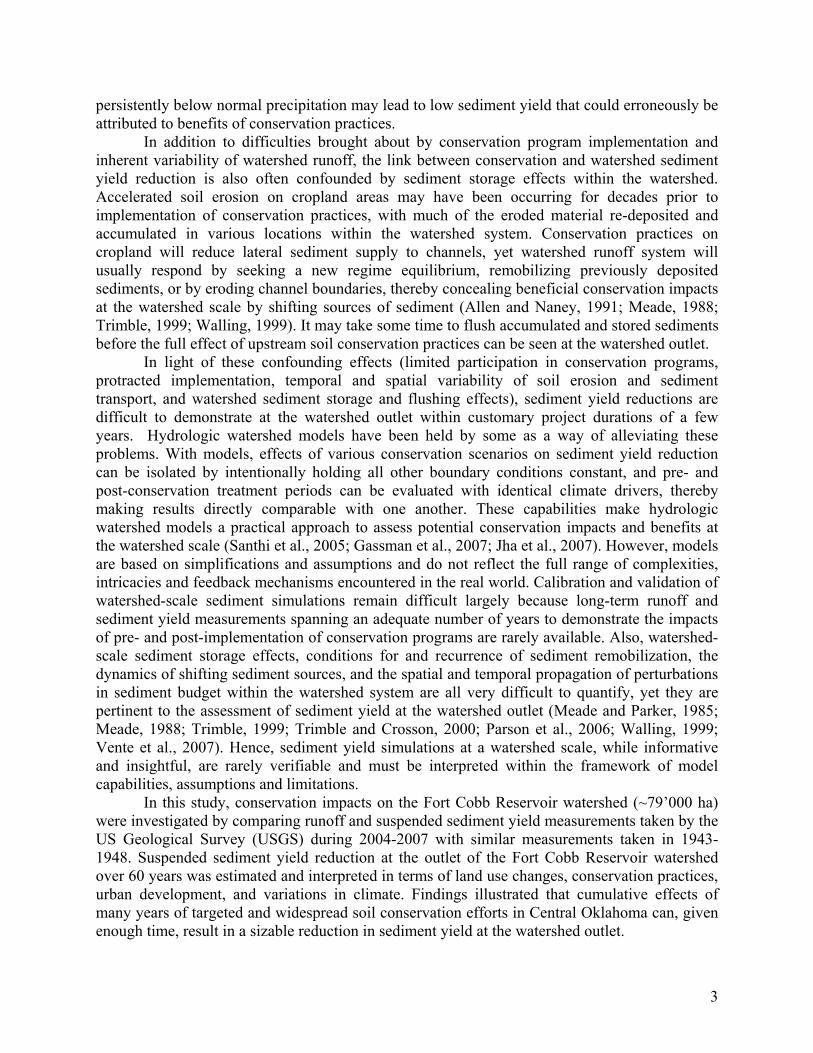
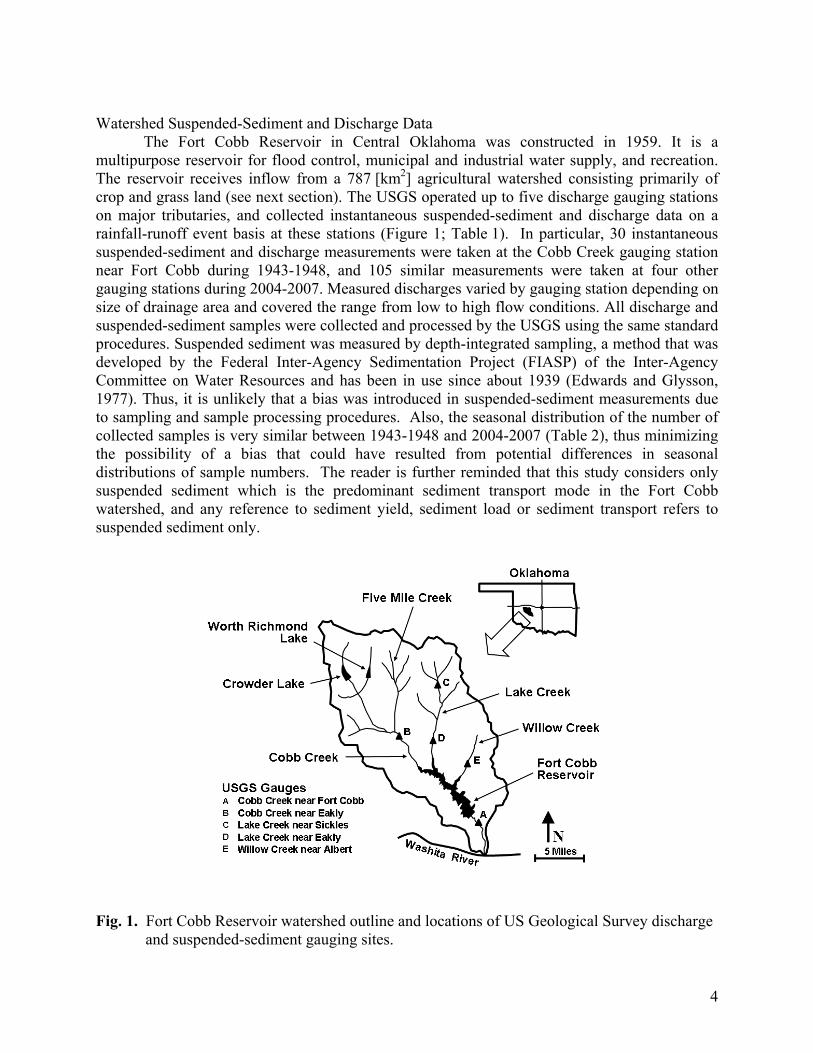
Table 1. Identification number and characteristics of discharge and suspended-sediment gauging sites operated by the US Geological Survey.
* Not a permanent suspended sediment collection site; only one suspended sediment measurement was mad
Gauge Name
USGS Gauge Number
Drainage Area [km2]
Period of Observations
Number of Data Points
Data Source
Cobb Creek nr Eakly
07325800
342
Nov 2004 – Sep 2007
35
USGS
Lake Creek nr Sickles
07325840
49
Jun 2006
1*
USGS
Lake Creek nr Eakly
07325850
154
Nov 2004 – Sep 2007
35
USGS
Willow Creek nr Albert
07325860
75
Nov 2004 – Sep 2007
35
USGS
Cobb Creek nr Fort Cobb
07326000**
826
May 1943 – Dec 1948
30
USGS
** After 1959, discharge below the dam reflects gate controlled discharge releases. Table 2. Seasonal distribution of number of suspended-sediment samples collected in the Fort
Cobb watershed (all gauging stations) during years 1943-1948 and years 2004-2007.
Season 1943-1948 2004-2007 Winter (Jan, Feb, Mar) 20% 26% Spring (Apr, May, Jun) 43% 40% Summer (Jul, Aug, Sep) 17% 14% Fall (Oct, Nov, Dec) 20% 20%
LAND USE AND CONSERVATION PRACTICES Land use for 1943-1948
Storm et al. (2007) estimated prevailing land use in the watershed during years 1940-1957 based on historical crop data and land use distribution information. Crop coverage was obtained from 5-year county records compiled by the Bureau of Census, US Dept. of Commerce (for example, US Dept. of Commerce, 1952), and from the National Agricultural Statistics Service (NASS, 2007). Based on these data, Storm et al. (2007) estimated that in years 1940-1957, 72% of the watershed area was in cropland, about 25% in grassland (range and pasture land), and the remaining 3% in forest, roads, and urban areas. For the purpose of this study, the land use during 1943-1948 was assumed to be the same as the 1940-1957 land use estimated by Storm et al. (2007). Conservation practices for 1943-1948
Conservation practices such as terraces, contour farming, strip farming, land use conversion, low-disturbance and no-till farming, drop structures, shelter belts, flood retarding structures, etc. are currently evident throughout the watershed. However, records detailing types and time of installation of conservation practices prior to the 1990s are not readily available in
5
either the state offices of the Natural Resources Conservation Service (NRCS) (NRCS State Resource Conservationist, personal communication, February 2008) or the local conservation districts (NRCS District Conservationist, Anadarko Field Service Center, personal communication, February 2008). Historical accounts suggest that early conservation work in Oklahoma during the 1930s consisted primarily of widely scattered demonstration projects, and that the height of the demonstration program occurred in 1940 (Phillips and Harrison, 2004). Though conservation districts were formed throughout the State of Oklahoma from the 1930s through the 1950s to foster soil and water conservation, the districts tended to be poorly funded, loosely organized, and in many cases lacked expertise to implement suggested conservation practices (Phillips and Harrison, 2004). With the bombing of Pearl Harbor in 1941 and the onset of World War II, implementation of conservation practices was delayed to meet the need for food and fiber to support the war effort. During the early to mid-1940s, farmers put much of the land into crop production using conventional tillage practices. Thus, the extent of conservation practices in the Fort Cobb Reservoir watershed during the 1940s was rather limited and, for the purpose of this study, assumed to be essentially non-existent. Land use for 2004-2007
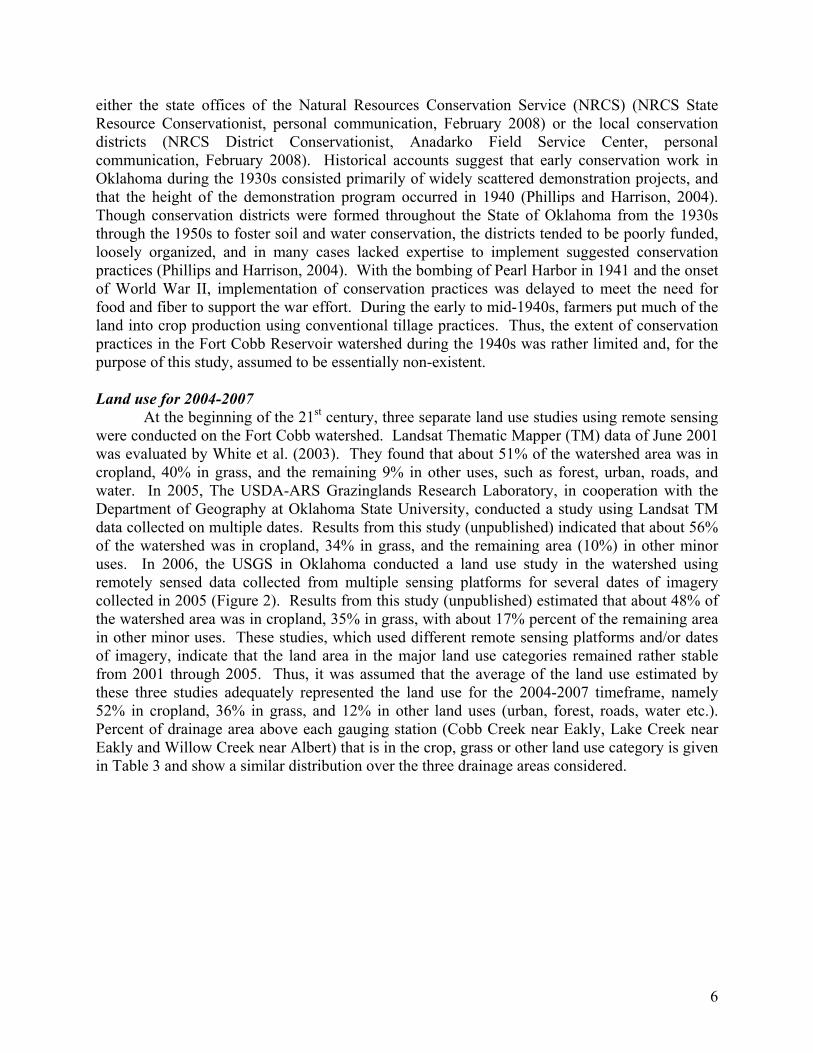
At the beginning of the 21st century, three separate land use studies using remote sensing were conducted on the Fort Cobb watershed. Landsat Thematic Mapper (TM) data of June 2001 was evaluated by White et al. (2003). They found that about 51% of the watershed area was in cropland, 40% in grass, and the remaining 9% in other uses, such as forest, urban, roads, and water. In 2005, The USDA-ARS Grazinglands Research Laboratory, in cooperation with the Department of Geography at Oklahoma State University, conducted a study using Landsat TM data collected on multiple dates. Results from this study (unpublished) indicated that about 56% of the watershed was in cropland, 34% in grass, and the remaining area (10%) in other minor uses. In 2006, the USGS in Oklahoma conducted a land use study in the watershed using remotely sensed data collected from multiple sensing platforms for several dates of imagery collected in 2005 (Figure 2). Results from this study (unpublished) estimated that about 48% of the watershed area was in cropland, 35% in grass, with about 17% percent of the remaining area in other minor uses. These studies, which used different remote sensing platforms and/or dates of imagery, indicate that the land area in the major land use categories remained rather stable from 2001 through 2005. Thus, it was assumed that the average of the land use estimated by these three studies adequately represented the land use for the 2004-2007 timeframe, namely 52% in cropland, 36% in grass, and 12% in other land uses (urban, forest, roads, water etc.). Percent of drainage area above each gauging station (Cobb Creek near Eakly, Lake Creek near Eakly and Willow Creek near Albert) that is in the crop, grass or other land use category is given in Table 3 and show a similar distribution over the three drainage areas considered.
6
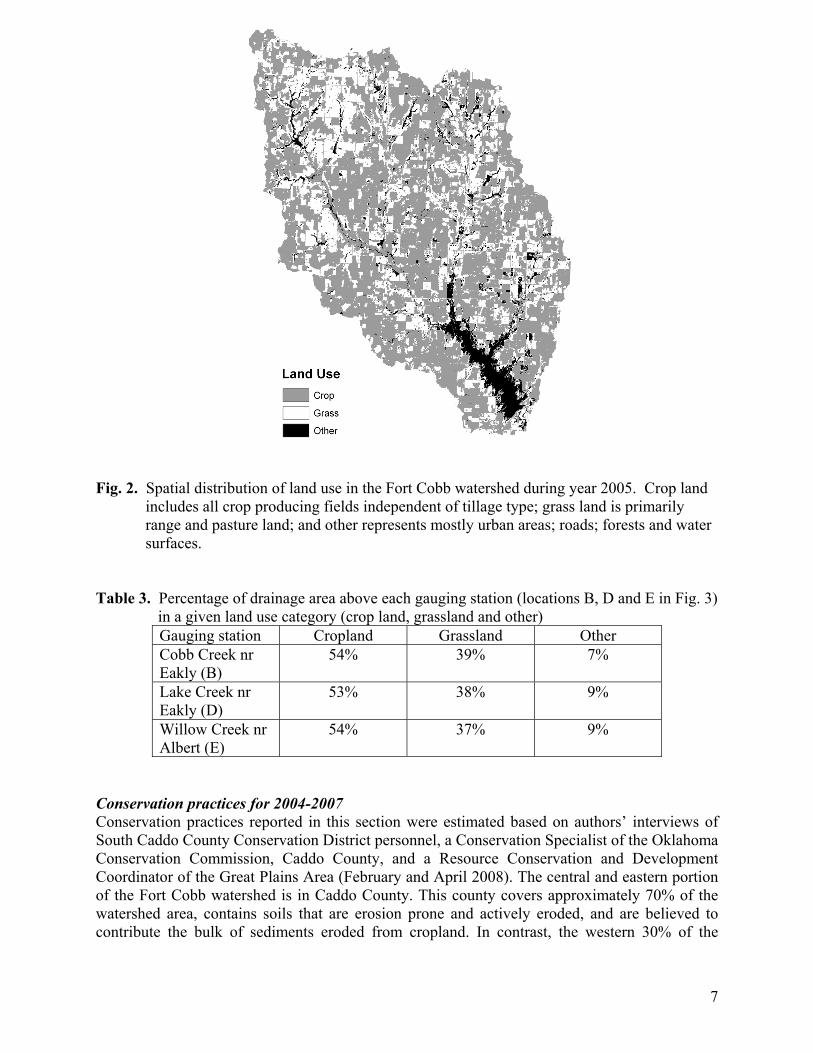
Fig. 2. Spatial distribution of land use in the Fort Cobb watershed during year 2005. Crop land includes all crop producing fields independent of tillage type; grass land is primarily range and pasture land; and other represents mostly urban areas; roads; forests and water surfaces.
Table 3. Percentage of drainage area above each gauging station (locations B, D and E in Fig. 3)
in a given land use category (crop land, grassland and other) Gauging station Cropland Grassland Other Cobb Creek nr Eakly (B)
54% 39% 7%
Lake Creek nr Eakly (D)
53% 38% 9%
Willow Creek nr Albert (E)
54% 37% 9%
Conservation practices for 2004-2007 Conservation practices reported in this section were estimated based on authors’ interviews of South Caddo County Conservation District personnel, a Conservation Specialist of the Oklahoma Conservation Commission, Caddo County, and a Resource Conservation and Development Coordinator of the Great Plains Area (February and April 2008). The central and eastern portion of the Fort Cobb watershed is in Caddo County. This county covers approximately 70% of the watershed area, contains soils that are erosion prone and actively eroded, and are believed to contribute the bulk of sediments eroded from cropland. In contrast, the western 30% of the
7
watershed area is characterized by more stable soils, less cropland, and proportionally more forest and range land. Therefore, land use conversion, agronomic activities, and conservation efforts in Caddo County were the primary focus of this sediment yield investigation.
Interest in soil conservation and applications for conservation funds in Caddo County is high compared to some other counties in Oklahoma. As of spring 2008, the waiting list for conservation funds consists of around 300 applicants, and the waiting time was about 2 to 4 years, depending mostly on availability of limited funding and ranking of individual conservation scores. As a result of this interest in soil conservation, 80% to 90% of cropland that needed terraces has been terraced over the last 50 years, and over the last decade about 50% of the cropland was in conservation tillage or minimum disturbance tillage. Conservation funds assisted with gully reshaping on 6.6 [ha] and installation of 39 grade stabilization structures. Additional soil conservation practices were implemented without cost sharing assistance.
In addition to cropland erosion control, selected channel bank sections were stabilized, small impoundments were constructed, and a number of gravel/dirt roads were paved. It was estimated that about 9 miles of channels have been fenced over the last 5 years to prohibit cattle from destabilizing channel banks and to prevent head cuts into pasture lands. In addition, 30 creek jacks were installed to stabilize a channel bank. Despite these and earlier efforts, several long unstable channel reaches still exist upstream of the reservoir and were identified by a geomorphic assessment conducted in 2007 by the USDA-ARS National Sedimentations Laboratory of Oxford, Mississippi (Simon and Klimetz, 2008). Unstable channel reaches include the entire length of Five Mile Creek, Cobb Creek below gauging station B, the middle and upper reaches of Lake Creek, and the upper reaches of Willow Creek (Figure 1). The stability of channels in the 1940’s could not be established because historic records describing the state of channels in the Fort Cobb watershed did not exist or could not be found. With regard to impoundments, eight Soil Conservation Service (now NRCS) flood retarding structures (including Crowder Lake and Worth Richmond Lake) were constructed in the late 1950s in the north-western portion of the watershed. Total upstream drainage area controlled by these impoundments was about 14% of the watershed area. Not only do these impoundments trap sediments but they also modify runoff hydrology by reducing channel peak flows, thereby indirectly reducing suspended-sediment transport capacity. With regard to roads, a windshield survey of road type and erosion problems determined that about half of the roads in the watershed were paved and the other half were classified as gravel or dirt roads. Dirt roads are particularly prone to erosion and require ongoing maintenance. It is believed that most of the presently paved roads were paved between 1958 and 2004. Despite all these soil conservation efforts, controlling erosion on the fragile soils in Caddo County will continue to be a priority. SUSPENDED SEDIMENT-DISCHARGE RATING CURVES
Thirty instantaneous suspended-sediment and discharge samples were collected during 1943-1948 at the Cobb Creek gauging station near Fort Cobb (location A) (Table 1; Figure 1). Sample values were divided by upstream area (i.e. converted to unit area values) to facilitate data comparison between gauging stations. Discharge values ranged from 0.0007 to 0.33 [m3/s/km2] and sediment values ranged from 0.007 to 44.0 [Mg/d/km2]. These data reflected watershed response under 1943-1948 pre-conservation conditions. The 105 sediment and discharge measurements taken at the four other gauging stations during 2004-2007 (Table 1; Figure 1) were also converted to unit area values. The gauging stations were Lake Creek near Sickles;
8
Lake Creek near Eakly; Willow Creek near Albert; and Cobb Creek near Eakly (Figure 1). Discharge values ranged from 0.0003 to 0.66 [m3/s/km2] and sediment values ranged from 0.002 to 500.0 [Mg/d/km2]. These data reflected watershed response under 2004-2007 post-conservation conditions, that is after a broad range of conservation practices were implemented in the second half of the 20th century.
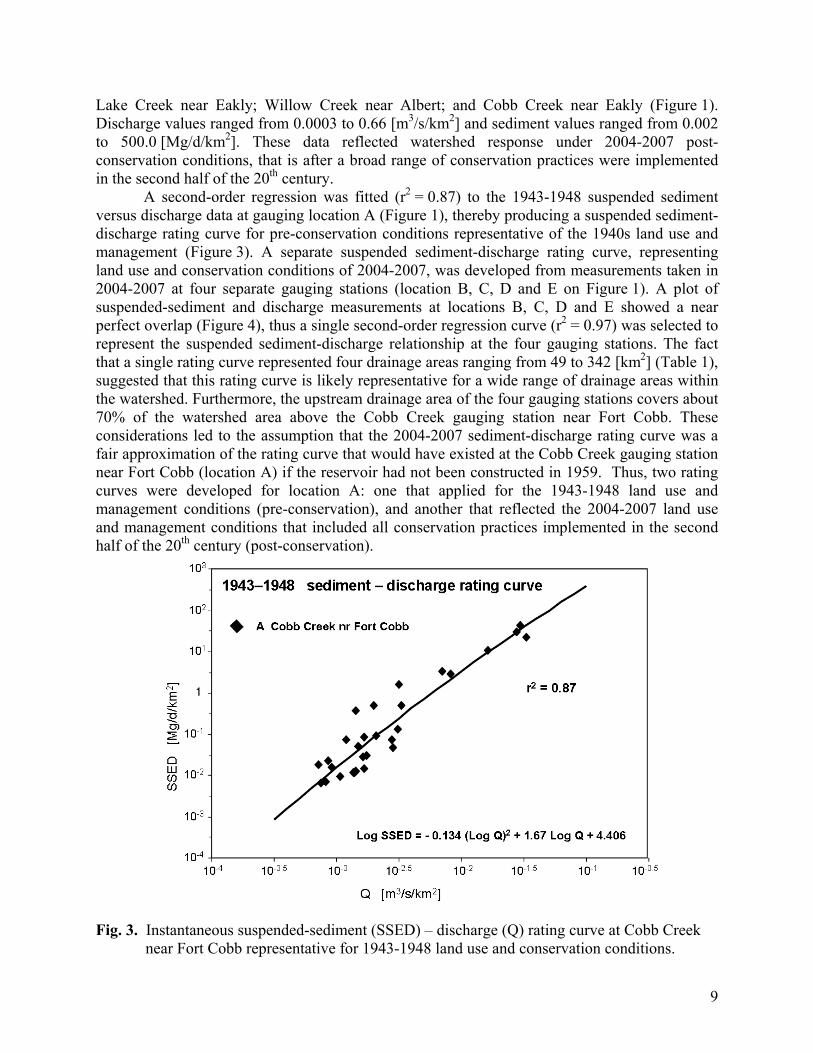
A second-order regression was fitted (r2 = 0.87) to the 1943-1948 suspended sediment versus discharge data at gauging location A (Figure 1), thereby producing a suspended sediment-discharge rating curve for pre-conservation conditions representative of the 1940s land use and management (Figure 3). A separate suspended sediment-discharge rating curve, representing land use and conservation conditions of 2004-2007, was developed from measurements taken in 2004-2007 at four separate gauging stations (location B, C, D and E on Figure 1). A plot of suspended-sediment and discharge measurements at locations B, C, D and E showed a near perfect overlap (Figure 4), thus a single second-order regression curve (r2 = 0.97) was selected to represent the suspended sediment-discharge relationship at the four gauging stations. The fact that a single rating curve represented four drainage areas ranging from 49 to 342 [km2] (Table 1), suggested that this rating curve is likely representative for a wide range of drainage areas within the watershed. Furthermore, the upstream drainage area of the four gauging stations covers about 70% of the watershed area above the Cobb Creek gauging station near Fort Cobb. These considerations led to the assumption that the 2004-2007 sediment-discharge rating curve was a fair approximation of the rating curve that would have existed at the Cobb Creek gauging station near Fort Cobb (location A) if the reservoir had not been constructed in 1959. Thus, two rating curves were developed for location A: one that applied for the 1943-1948 land use and management conditions (pre-conservation), and another that reflected the 2004-2007 land use and management conditions that included all conservation practices implemented in the second half of the 20th century (post-conservation).
Fig. 3. Instantaneous suspended-sediment (SSED) – discharge (Q) rating curve at Cobb Creek
near Fort Cobb representative for 1943-1948 land use and conservation conditions.
9
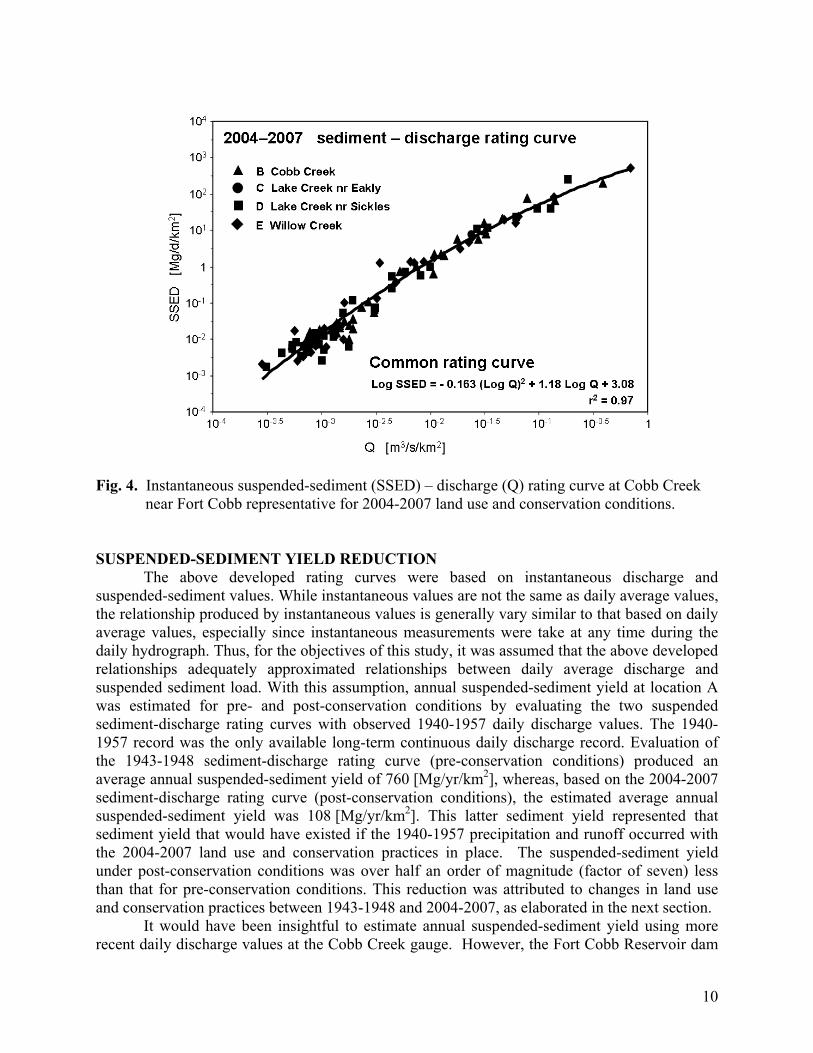
Fig. 4.
SUSPEThe above developed rating curves were based on instantaneous discharge and
spended-sediment values. While instantaneous values are not the same as daily average values, enerally vary similar to that based on daily
average
recent daily discharge values at the Cobb Creek gauge. However, the Fort Cobb Reservoir dam
Instantaneous suspended-sediment (SSED) – discharge (Q) rating curve at Cobb Creek near Fort Cobb representative for 2004-2007 land use and conservation conditions.
NDED-SEDIMENT YIELD REDUCTION
suthe relationship produced by instantaneous values is g
values, especially since instantaneous measurements were take at any time during the daily hydrograph. Thus, for the objectives of this study, it was assumed that the above developed relationships adequately approximated relationships between daily average discharge and suspended sediment load. With this assumption, annual suspended-sediment yield at location A was estimated for pre- and post-conservation conditions by evaluating the two suspended sediment-discharge rating curves with observed 1940-1957 daily discharge values. The 1940-1957 record was the only available long-term continuous daily discharge record. Evaluation of the 1943-1948 sediment-discharge rating curve (pre-conservation conditions) produced an average annual suspended-sediment yield of 760 [Mg/yr/km2], whereas, based on the 2004-2007 sediment-discharge rating curve (post-conservation conditions), the estimated average annual suspended-sediment yield was 108 [Mg/yr/km2]. This latter sediment yield represented that sediment yield that would have existed if the 1940-1957 precipitation and runoff occurred with the 2004-2007 land use and conservation practices in place. The suspended-sediment yield under post-conservation conditions was over half an order of magnitude (factor of seven) less than that for pre-conservation conditions. This reduction was attributed to changes in land use and conservation practices between 1943-1948 and 2004-2007, as elaborated in the next section.
It would have been insightful to estimate annual suspended-sediment yield using more
10
was constructed in 1959 a few miles upstream of the gauging station. Thus, after 1959, observed discharge at this gauging station reflected gate-controlled reservoir releases during high runoff events
onservation practices, stream channel stabilization, urbanization, and/or climate variability, mong the most important factors. With regard to urbanization, there are only two small rural
the watershed, and these have not grown much over time. Thus, urbanization was pro
Indeed, starting in the 1950s and through the beginning of the 21 century, about 20% of eros
and did not represent natural watershed runoff patterns. Hence, the discharge record after 1959 was unsuitable for intended use in this investigation. Nevertheless, it should be recognized that application of the 1940-1957 pre-conservation discharge to the 2004-2007 post-conservation land use and management conditions inherently led to an over-estimation of annual suspended-sediment yield for 2004-2007. This over-estimation is the result of neglecting increased infiltration and reduction in surface runoff volume and peak usually associated with conservation practices. Therefore, the previously calculated reduction in watershed suspended-sediment yield is a conservative estimate, and the reduction would have been larger if beneficial changes in runoff hydrology due to conservation practices were accounted for. Unfortunately, these beneficial changes in runoff hydrology could not be quantified with available observational data. DISCUSSION
Changes in watershed sediment yield are often attributed to land use conversion, cacommunities in
bably not an important factor affecting watershed suspended-sediment yield. The effects of climate variability and any associated change in hydrologic and runoff regime on sediment yield were eliminated by evaluating the two rating curves with identical 1940-1957 daily discharge data. As a result, previously reported persistent multi-year precipitation variations (Garbrecht and Schneider, 2008) were not an issue to contend with because the use of identical daily discharge values for evaluating both rating curves necessarily implied the same weather and climate. Observed suspended-sediment and discharge data underlying the rating curves were also unlikely to be significantly affected by climate variations, because decisions when to sample and how often to sample was not based on storm size or frequency, nor was it based on any climatic considerations. Low-flow samples were taken during a dry period, low channel flow conditions, and at different times and seasons during the year (Table 2). High-flow sampling was initiated whenever a sizable surface-runoff producing storm was forecasted, though in hindsight the forecast storm may not always have produced a sizable surface runoff over the area of interest.
Having ruled out urbanization and climate variations as likely cause for the reduction of watershed suspended-sediment yield, one is invariably led to the conclusion that land use conversion and implementation of conservation practices must have produced the sediment yield reduction. st
ion-prone cropland was converted to grassland. A review of sediment yield data from side-by-side experimental watersheds at the Grazinglands Research Laboratory (GRL) in El Reno (Garbrecht, 2000), located about 30 miles east of the Fort Cobb watershed, showed two orders of magnitude difference in sediment yield from watersheds planted in conventionally tilled winter-wheat and those in native prairie. It follows that sediment yield from grass land is, for most practical purposes, insignificant compared to that from cropland. This was assumed to also apply for the sandy and erodible soils in Caddo County. Thus, as a first approximation and on a unit area basis, soil eroded from cropland represented the bulk of the soil delivered from overland erosion to channels. It follows that conversion of the 20% of most erosion-prone
11
cropland to grass land reduced the overall sediment loading from cropland to channels by more than 20% (because these 20% cropland delivering the most sediment).
Also, over the last decade, conventional tillage has given way to conservation tillage or no-till on about 50% of the cropland. Again, based on data from side-by-side experimental watersheds at the GRL (Garbrecht, 2000), a sediment yield reduction of about a factor of two was observed between conventional tillage and conservation tillage. Thus, implementation of conserv
ed outlet.
ed-sediment yield were vestigated for the Fort Cobb Reservoir watershed. The USGS measured stream suspended-diment and discharge during 1943-1948 and again during 2004-2007, after extensive
e watershed in the second half of the 20th century. A Susp
onservation tillage, terracing of cropland, gully shaping, grade control structur
ation tillage further reduced sediment delivery from cropland to channels. Additional reductions in soil erosion and sediment yield can be attributed to terracing of cropland, gully shaping, grade control structures, channel stabilization efforts, sediment trapping by impoundments and reservoirs, and county road surfacing.
Taking all the above considerations into account, there appears to be little doubt that the cumulative and integrated effects of all conservation practices implemented in the second half of the 20th century reduced soil erosion and, over time and with some delay, led to the 2004-2007 observed suspended sediment yield reduction at the watersh
SUMMARY AND CONCLUSIONS
Effects of conservation practices on watershed suspendinseconservation measures were implemented on th
ended sediment-discharge rating curve was developed with the 1943-1948 measured data which reflected land use conditions prevailing during that time, also called the pre-conservation period. A second suspended sediment-discharge rating curve was developed with the 2004-2007 data which reflected land use and conservation conditions prevailing during that time, called the post-conservation period. Daily watershed suspended-sediment yield was estimated by use of rating curves and 1940-1957 daily discharge records near the watershed outlet. Evaluating both rating curves with the same daily discharge eliminated any effects of changes in runoff characteristics due to differences in climate between the 1940s and the early 21st century. Annual suspended-sediment yield at the watershed outlet, estimated by summing daily suspended-sediment yield, was 760 [Mg/yr/km2] and 108 [Mg/yr/km2] for the pre- and post-conservation period, respectively.
The substantial reduction in annual suspended-sediment yield between 1943-1948 and 2004-2007 was related to land use conversion and implementation of soil conservation practices. Land use conversion was from cropland to range and pasture land, and soil conservation practices included c
es, channel stabilization, sediment trapping by water impoundments, and county road surfacing. The gradual implementation and cumulative effects of this broad range of conservation measures over a 60- to 70-year time span was very likely the primary cause of the estimated reduction in today’s watershed suspended-sediment yield over that from the 1940s. This study demonstrated that while it may be difficult to measure sediment yield reductions due to conservation impacts during the short time span of a conservation project, targeted, widespread and sustained conservation efforts generally will, over time, reduce sediment yield at the watershed outlet, as was the case for the Fort Cobb Reservoir watershed.
12
References Allen, P. B., and N. H. Welch. 1967. Variations of sediment transport in the Washita River. In
roc. of Symposium on River Morphology, General Assembly of the International Union of Geophysics, Bern, Switzerland, Sept. 25 – Oct. 7, 1967, pp.355-366.
llen, P. B. and J. W. Naney. 1991. Hydrology of the Little Washita River Watershed, 90,
l, and
ation, 43(5):407-410.
eds). Woods Institute for the Environment, Stanford University,
hapter III-2, pp. 113-145.
he
iment. Revision of “Field Methods for Measurement of Fluvial ediment”, by H. P. Guy and V. W. Norman, U.S. Geological Survey Techniques of Water
ry,
arbrecht, J. D., and J. M. Schneider. 2008. Case Study of Multiyear Precipitation Variations
arbrecht, J. D., P. J. Starks, and J. L. Steiner. 2006. The under appreciated climate factor in the .
assman, P. W., M. R. Reyes, C. H. Green, and J. G. Arnold. 2007. The soil and water
250.
PGeodesy and Allen, P. B., and N. H. Welch. 1971. Sediment yield reduction on watersheds treated with flood-retarding structures. Trans. ASAE, 14(5):814-817. AOklahoma. U. S. Dept. of Agriculture, Agricultural Research Service, Publication No. ARS-74 pp. Berg, W. A., S. J. Smith, and G. A. Coleman. 1988. Management effects on runoff, soinutrient losses from highly erodible soils in the Southern Plains. Journal of Soil and Water Conserv Cox, C. 2008. U.S. Agricultural Conservation Policy & Programs: History, Trends, and Implications. In U.S. Agricultural Policy and the 2007 Farm Bill (K. Arha, T. Josling, D. A.Sumner, and B. H. Thompson, C Edwards, T. K., and G. D. Glysson. 1999. Techniques of Water-Resources Investigations of tU.S. Geological Survey, Book3: Applications of Hydraulics, Chapter C2: Field Methods for Measurement of Fluvial SedSResources Investigations, Book3, Chapter C2, 1970. U.S. Geological Survey, Reston, Virginia. Garbrecht, J. D. 2000. Runoff and Sediment Data (1976-1999) for the Water Resources and Erosion Watersheds. USDA, Agricultural Research Service, Grazinglands Research LaboratoEl Reno, Oklahoma, GRL 3-00, 46 pp. Garbrecht, J. D. 2008. Multi-year precipitation variations and watershed sediment yield in a CEAP benchmark watershed. Journal of Soil and Water Conservation, 63(2):70-76. Gand the Hydrology of Fort Cobb Reservoir. Journal of Hydrologic Engineering, 13(2):64-70. Gconservation effects assessment project. Journal of Soil and Water Conservation, 61(4):110-112 Gassessment tool: historical development, applications, and future research directions. Transactions of the American Society of Agricultural and Biological Engineers, 50(4):1211-1
13
Hoard, R. J., and M. J. Brewer. 2006. Adoption of pest, nutrient, and conservation vegemanagement using financial incentive provided by a U. S. Department of Agriculture Conservation Program. HortTechnology, 16(2):306-311.
tation
a, M. K., P. W. Gassman, and J. G. Arnold. 2007. Water quality modeling for the Raccoon
aflen, J. M., and T. S. Colvin. 1981. Effect of crop residue on soil loss from continuous row
an. 2006. Conservation-compatible ractices and programs: Who participates? USDA, Economic Research Service, ERR-14, 43 pp.
M. J. M. Roemkens. 1990. Effects of Tillage with ifferent crop residues on runoff and soil loss. Trans. ASAE,33(5):1551-1556.
the Conservation Reserve Program. Journal of Agricultural and Applied Economics,
ead, R. H. 1988. Movement and Storage of Sediment in River Systems. In A. Lerman and M.
eade, R. H., and R. S. Parker. 1985. Sediment in Rivers of the United States. National Water
s, and S. J. Smith. 1978. Variability of annual utrient and sediment discharge in runoff from Oklahoma cropland and rangeland. Journal of
eyer, L. D., and J. V. Mannering. 1963. Crop residue as surface mulches for controlling
atistics Service, United States Department of Agriculture, ebb Site: http://www.nass.usda.gov, accessed May 2006.
on atershed runoff, sediment, and nutrient yields. Water Resources Bulletin, 30(6):1011-1023.
ll. 2006. Is Sediment Delivery a allacy? Earth Surface processes and Landforms, 31:1325-1328.
klahoma in the 20 Century. Oklahoma Association of Conservation Districts in Cooperation
JhRiver watershed using SWAT. Transactions of the American Society of Agricultural and Biological Engineers, 50(2):479-493. Lcropping. Trans. ASAE, 24:605-609. Lambert, D., P. Sullivan, R. Claassen, and L. Foremp McGregor, K. C., C. K. Mutchler, and d McLean-Meyinsse, P. E. 1994. An empirical analysis of Louisiana small farmers’ involvement in26(2):379-385. MMeybeck (eds.), Physical and Chemical Weathering in Geochemical Cycles, p. 165-179, Kluwer Academic Publisher, Dordrecht, Holland. MSummary 1984; U. S. Geological Survey Water-Supply Paper 2275, p. 49-60. Menzel, R. G., E. D. Rhoades, A. E. OlnesnEnvironmental Quality, 7(3):401-406. Merosion on slopping land under intensive cropping. Trans. ASAE, 6(4):322-323,327. NASS. 2007. National Agricultural StW Park, S. W., S. Mostaghimi, R. A. Cooke, and P. W. McClellan. 1994. BMP impacts w Parson, A. J., J. Wainwright, R. E. Brazier, and D. M. PoweF Phillips, F. D., and M. S. Harrison. 2004. Out of the Dust; the History of Conservation in
thO
14
with the Oklahoma Conservation Commission and the USDA Natural Resources ConservatioService, 108 pp.
n
harpley, A. N., and S. Rekolainen. 1997. Phosphorus in Agriculture and its Environmental s.),
hields, F. D. Jr. 2008a. Long-term evaluation of regional erosion control. Journal of Soil and
ed diment yield. Journal of Soil and Water Conservation, 63(2):59-69.
Relative magnitudes and sources of sediment in benchmark atersheds of the conservation effects assessment program (CEAP). Journal of Soil and Water
mith, D. D. 1946. The effect of crop sequence on erosion under individual crops. Soil Sci. Soc.
Watershed Research Laboratory. 1983. Hydrology, erosion, and water uality studies in the Southern Great Plains Research Watershed, Southwestern Oklahoma. 1961-
. E., P. R. Busteed, and M. J. White. 2007. Hydrologic modeling of the Fort Cobb asin, Oklahoma, using SWAT 2005. Final Report to USDA, ARS, Grazinglands Research
,
– Myth and Reality. Science, 89(5477):248-250.
50, Counties and State Economic reas, Oklahoma. Agricultural Division, Vol. 1, Part 25, United States Government Printing
Office.
Santhi, C., R. Srinivasan, J. G. Arnold, and J. R. Williams. 2005. A modeling approach to evaluate the impacts of water quality management plans implemented in a watershed in Texas. Journal of Environmental Modelling and Software, 21(2006):1141-1157. SImplications. pp. 1-54. In: H. Tunney, O. T. Carton, P. C. Brookes, and A. E. Johnston (EdPhosphorus Loss from Soil to Water. CAB International Press, Cambridge, England. SWater Conservation, 63(2):50A. Shields Jr., F. D. 2008b. Effects of a regional channel stabilization project on suspendse Simon, A., and L. Klimetz. 2008.wConservation, in press. SAm. Proc., 11:532-539. Staff, Water Quality andq1978. U. S. Dept. of Agriculture, Agricultural Research Service, Publication No. ARM-S-29, 175 pp. Stein, O. R., W. H. Neibling, T. J. Logan, and W. C. Moldenhauer. 1986. Runoff and soil loss asinfluenced by tillage and residue. Soil Sci. Soc. Am. J., 50(6):1527-1531. Storm, DBLaboratory, April 2, 2008. Biosystems and Agricultural Department, Division of Agricultural Sciences and Natural Resources, Oklahoma State University. Trimble, S. W. 1999. Decreased Rates of Alluvial Sediment Storage in the Coon Creek BasinWisconsin, 1975-1993. Science, 285(5431):1244-1246. Trimble, S. W., and P. Crosson. 2000. U.S. Soil Erosion Rates2 US Dept. of Commerce. 1952. Census of Agriculture:19A
15
Vente, J., J. Poesen, M. Arabkhedri, and G. Verstraeten. 2007. The Sediment Delivery Problem
evisited. Progress in Physical Geography, 31(2):155-178.
ologia, 410:223-240.
servation Commission for the US nvironmental Protection Agency, February6, 2003. Biosystems and Agricultural Department,
illiams, J. R., A. D. Nicks, and J. G. Arnold. Simulator for Water Resources in Rural Basins.
Washington, D.C., USDA, 58 pp.
R Walling, D. E. 1999. Linking Land Use, Erosion and Sediment Yield in River Basins. Hydrobi White, M. J., D. E. Storm, and S. Stoodley. 2003. Fort Cobb Basin – Modeling and Land Cover Classification. Final Report Submitted to the Oklahoma ConEDivision of Agricultural Sciences and Natural Resources, Oklahoma State University. WJournal of Hydraulic Engineering, 111(6):970-986. Wilson, H. A., and G. M. Browning. 1945. Soil aggregation, yields, runoff, and erosion as affected by cropping system. Soil Sci. Soc. Am. Proc., 10:51-57. Wischmeier, W. H., and D. D. Smith. 1978. Predicting rainfall erosion losses – A guide to conservation planning. Agricultural Handbook 537.
16