Embed Size (px)
Citation preview
Int J ThermophysDOI 10.1007/s10765-014-1634-0
Water Triple-Point Comparisons: Plateau Averagingor Peak Value?
P. P. M. Steur · R. Dematteis
Received: 10 June 2013 / Accepted: 17 May 2014© Springer Science+Business Media New York 2014
Abstract With a certain regularity, national metrology institutes conduct comparisonsof water triple-point (WTP) cells. The WTP is the most important fixed point for theInternational Temperature Scale of 1990 (ITS-90). In such comparisons, it is commonpractice to simply average all the single measured temperature points obtained on asingle ice mantle. This practice is quite reasonable whenever the measurements showno time dependence in the results. Ever since the first Supplementary Information forthe International Temperature Scale of 1990, published by the Bureau Internationaldes Poids et Mesures in Sèvres, it was strongly suggested to wait at least 1 day beforetaking measurements (now up to 10 days), in order for a newly created ice mantle tostabilize. This stabilization is accompanied by a change in temperature with time. Arecent improvement in the sensitivity of resistance measurement enabled the IstitutoNazionale di Ricerca Metrologica to detect more clearly the (possible) change intemperature with time of the WTP on a single ice mantle, as for old borosilicatecells. A limited investigation was performed where the temperature of two cells wasmonitored day-by-day, from the moment of mantle creation, where it was found thatwith (old) borosilicate cells it may be counterproductive to wait the usual week beforestarting measurements. The results are presented and discussed, and it is suggested toadapt the standard procedure for comparisons of WTP cells allowing for a differentdata treatment with (old) borosilicate cells, because taking the temperature dependenceinto account will surely reduce the reported differences between cells.
Keywords Comparisons · Data evaluation · Water triple-point
P. P. M. Steur (B) · R. DematteisIstituto Nazionale di Ricerca Metrologica (INRIM), Torino, Italye-mail: [email protected]
123
Int J Thermophys
1 Introduction
In 1999, the Mutual Recognition Arrangement (CIPM-MRA) was signed by thenational metrology institutes (NMIs) of 38 Member States of the BIPM and rep-resentatives of two international organizations, for national measurement standardsand for calibration and measurement certificates issued by NMIs. The CIPM-MRAcalls for regular comparisons of measurement standards among NMIs, so-called KeyComparisons, to be issued under the aegis of each Consultative Committee of theCIPM, the Comité International des Poids et Mesures. During its meeting in 2001,the Consultative Committee for Thermometry decided to start a key comparison ontriple-point-of-water (TPW) cells, identified as CCT-K7 [1]. Since then, it has beencommon practice for any comparison protocol to pool together the temperature differ-ences obtained on any single ice mantle in order to arrive at a average value (weightedor not) with its associated standard deviation. This seems a reasonable approach forthose laboratories not able to distinguish a possible temperature drift during the mea-surements on a single ice mantle. The reason for this may lie with the instrumen-tation (resistance bridge) and/or with insufficient grounding/shielding (high noise).For example, INRIM data for CCT-K7, obtained with an ASL-F181 bridge (standarddeviation of 30 µK, even with dedicated grounding), did not resolve clearly such adependence. When a higher resolution bridge such as the F900 from ASL (see Fig. 4of [2]) was acquired at INRIM, the standard deviation of measurement was 10µKand it became possible to distinguish such a drift over 1 week’s time, at least in thecase of older TPW cells made of borosilicate glass (a drift of the order of 30 µK in5 days) which are known to release with time some of the glass components into thewater [3,4]. Such a drift is commonly attributed to the presence of impurities. Most ofthese impurities are thought to be dissolved from the walls. The presence of impuritiesmay give rise to a gradual depression in temperature with time due to mixing of themeltwater from the pure ice with the surrounding water [5]. On the basis of a detecteddrift, it seems reasonable to adapt the measurement protocol for the recent compar-isons [6–10]. It is suggested to allow fitting a linear time-dependent drift model tothe data and use the fitted values of the model parameters. With these parameters onecan calculate the value for a common moment in time for the ice mantle, in order toimprove the accuracy of the comparisons, for those users that do not want to give uptheir older borosilicate cells in favor of the new fused silica (also referred to, improp-erly, as quartz) cells which are believed to be much less subject to dissolution effects[11].
In the past, many papers have been published on the long-term change with time ofthe temperature of TPW cells. Of the two papers from the 1950s [12,13], foundationpapers for the recommendation of the Supplementary Information to the InternationalTemperature Scale of 1990 [5] (hereafter indicated by SuppInf), the first deals primar-ily with the construction of a TPW cell and the time dependence is limited to 5 daysonly (on a new cell), while the resolution of the second is of the order of 0.1 mK. Inmore recent years, further studies with long(er) time series have appeared [14–22].
1 Reference to any commercial brand in this paper does not imply endorsement or recommendation of anykind by INRIM or by the authors.
123
Int J Thermophys
To a varying degree, they all show a downward temperature drift with time duringthe course of measurement. However, few of these report on old cells from the veryday of mantle creation, as in the present work. Some start measurements only 1 weekafter mantle creation following the SuppInf recommendation; others use recently filledcells, e.g., [14], and still others compare cells presumably all of borosilicate glass, andlasting 1 to 2 weeks, reporting only differences in drift, or various combinations ofthese procedures. The most recent publication by Furukawa et al. [16] corroboratesand extends the work of [13], in terms of behavior of single cells and not as differ-ences between cells, to check the validity of the SuppInf recommendation, but usingapparently all new cells. In addition, he suggested a mechanism for the diffusion ofimpurities, where the freshly melted water at the inside of the ice mantle becomesmore and more polluted by impurities from the other side of the ice mantle diffusingthrough the ice. An alternative explanation would be given by impurities frozen intothe solid by the fast freezing, which would then be released slowly with time, wherethe difference in the two explanations lies in the source of the impurities. One wayof discriminating between the two explanations would be to carefully tip the cell tocause mixing between the water close to the well and the water on the outside ofthe ice mantle. Although potentially useful, such a test was not performed during theexperiments reported here. This mechanism of slowly releasing impurities into thewater near the thermometer well competes with the so-called Gibbs–Thomson effectduring the first few days after freezing, with annealing and growing of the ice crys-tals, accompanied by a rise in temperature. Since this last effect is strongest for rapidfreezing, such as with L-N2, CO2, or the mush method, it would be advisable to usea method with slower freezing, such as obtained with an immersion cooler, or evenusing a L-N2-cooled copper (or brass) rod, to minimize the initial temperature riseand allow temperature determinations as early as possible.
In this paper, examples are given of the (downward) temperature drift during mea-surements on an ice mantle with different TPW cells, showing the improvement inaccuracy that can be obtained by taking the time dependence for each cell into account.However, in order for such a procedure to work, a common point on the curve has to befound such as the maximum, to be compared with a similar point for the other cell(s) ofthe comparison. This aspect has been addressed by long-term measurements made atINRIM, be it on a very limited number of cells, in order to identify a suitable candidatefor such a point, in analogy to common practice for the metal fixed points where themaximum after recalescence is used. Measurement data are given with examples ofa fitting procedure in comparison with the straight through average. In the course ofthese measurements, evidence was obtained showing that old borosilicate cells shouldnot be used for more than 2 weeks since mantle creation, but that they may be usedmore effectively at least during the first week after mantle production.
2 Illustration of the Proposal with Data from a Comparison
2.1 Comparison
At the end of 2011, a new (trilateral) comparison at the water triple-point was started.In the first phase, two of the TPW cells of INRIM (a borosilicate and a fused sil-
123
Int J Thermophys
ica cell) were compared with two cells of the pilot (Cell-1, fused silica, and Cell-2,borosilicate). In a second phase, the two INRIM cells were compared with the othercells of the INRIM National Standard. During all the measurements, a water triple-point maintenance bath (ISOTECH) was used, at a temperature a few millikelvinbelow the TPW. As usual, data were taken on two separate ice mantles, with about tenpoints on each mantle where each point is the average of 16 readings with a standarddeviation of 2 µK. All reported data are corrected for self-heating, immersion, and iso-topic effects. For this comparison, the mantles were prepared using a liquid-nitrogen(L-N2) cooled brass rod, about 7 to 8 days before initiating data taking. Every day themantles were checked for free rotation before measurements. The thermometer wasalways pre-cooled in the water bath before the first measurement of the day. Followingcommon practice, the ice mantles usually occupied about half of the initially availableliquid, corresponding to a melted fraction of about 40 % to 50 %.
2.2 Experimental
Only the wide-well cells of INRIM (HART1015 and HART1322) are equipped witha borosilicate bushing for improved thermal contact. One and the same 100 � stan-dard resistor was used (in its own temperature controlled container) and two standardplatinum resistance thermometers (SPRTs) were employed. Thermometer LN42 is thecheck thermometer at INRIM for the fixed points of mercury, water, and gallium, andnever exposed to temperature excursions beyond this range, while thermometer LN-GTI is the check thermometer for the zinc point. Two measuring currents were used:1.4 mA/1.4
√2 mA with a setting of 2 to 3 on the manual fine-tuning knob with 105
gain, and alternatively 2 mA/2√
2 mA at a setting of 7 to 8 on the manual knob with104 gain. Other bridge settings were: 0.1 s bandwidth, 25 Hz frequency, and 100 �
impedance.
2.3 Some Results from the Comparison and Illustration of the Proposal
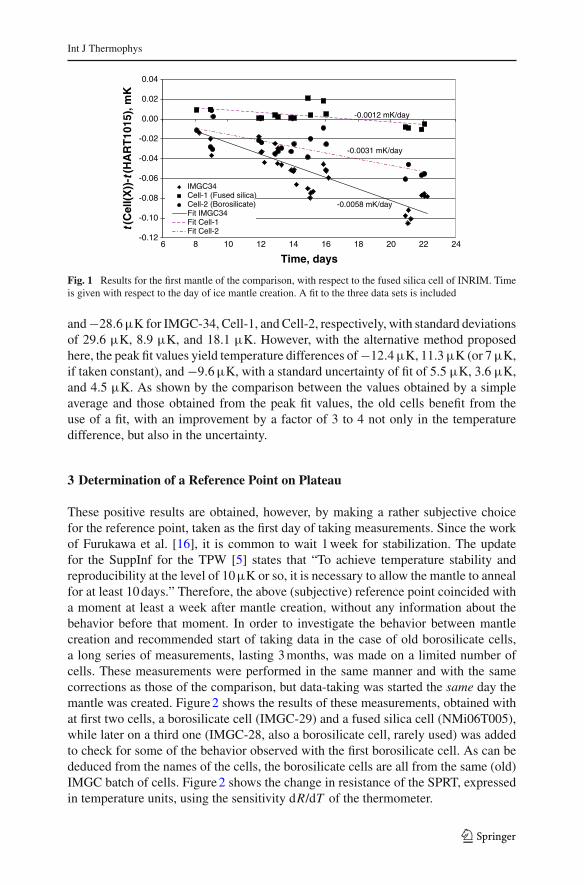
Figure 1 shows the results for the first mantle for each of the three cells during thefirst phase of the comparison, with respect to the fused silica cell of INRIM. Time ismeasured since the ice mantle creation. Clearly, the time dependence of the temperaturedifference can be observed for the two borosilicate cells, while the data for Cell-1could be compatible, within the uncertainty of the data, with a constant difference of(7 ± 6)µK. Also, the effect of the age difference of the borosilicate cells, a likelyexplanation, in terms of impurity accumulation, is visible: cell IMGC-34 is about20 years old, while Cell-2 only about 5 years. A fit was made of these data to a linearmodel of temperature versus time, where time is measured in days from the start ofthe measurements. For each cell, the line of fit is superimposed on the data for eachcell (with respect to HART1015, a fused silica cell). The total uncertainty for thetemperature difference is the same as reported for the Euromet-T.K7 comparison [6],13 µK at k = 1, which with the improved bridge resolution reduces to 10µK.
According to the usual data treatment of taking the simple average over all data fora single cell, the computed differences with cell HART1015 are: −54.5 µK, +2.8µK,
123
Int J Thermophys
-0.12
-0.10
-0.08
-0.06
-0.04
-0.02
0.00
0.02
0.04
6 8 10 12 14 16 18 20 22 24
Time, days
t(C
ell(
X))
- t(H
AR
T10
15),
mK
IMGC34Cell-1 (Fused silica)Cell-2 (Borosilicate)Fit IMGC34Fit Cell-1Fit Cell-2
-0.0058 mK/day
-0.0012 mK/day
-0.0031 mK/day
Fig. 1 Results for the first mantle of the comparison, with respect to the fused silica cell of INRIM. Timeis given with respect to the day of ice mantle creation. A fit to the three data sets is included
and −28.6 µK for IMGC-34, Cell-1, and Cell-2, respectively, with standard deviationsof 29.6 µK, 8.9 µK, and 18.1 µK. However, with the alternative method proposedhere, the peak fit values yield temperature differences of −12.4 µK, 11.3 µK (or 7 µK,if taken constant), and −9.6 µK, with a standard uncertainty of fit of 5.5 µK, 3.6 µK,and 4.5 µK. As shown by the comparison between the values obtained by a simpleaverage and those obtained from the peak fit values, the old cells benefit from theuse of a fit, with an improvement by a factor of 3 to 4 not only in the temperaturedifference, but also in the uncertainty.
3 Determination of a Reference Point on Plateau
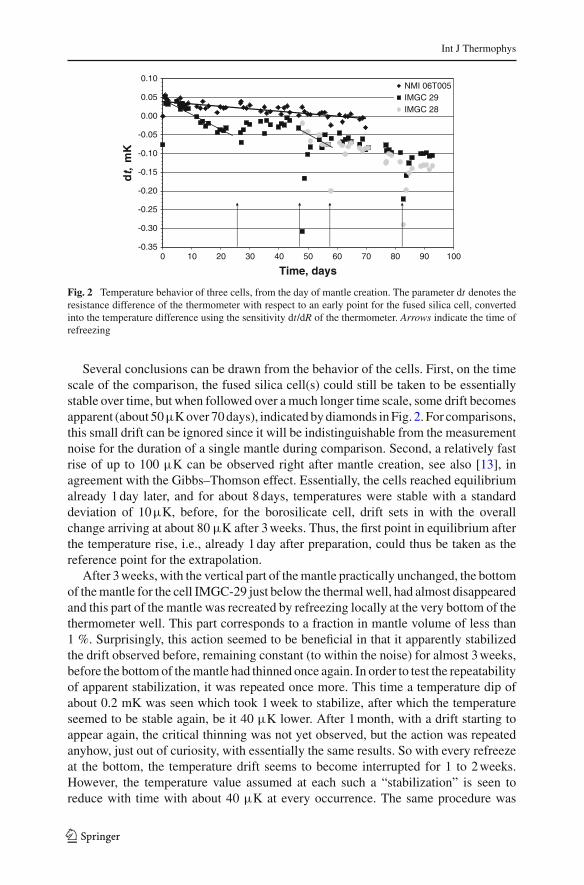
These positive results are obtained, however, by making a rather subjective choicefor the reference point, taken as the first day of taking measurements. Since the workof Furukawa et al. [16], it is common to wait 1 week for stabilization. The updatefor the SuppInf for the TPW [5] states that “To achieve temperature stability andreproducibility at the level of 10µK or so, it is necessary to allow the mantle to annealfor at least 10 days.” Therefore, the above (subjective) reference point coincided witha moment at least a week after mantle creation, without any information about thebehavior before that moment. In order to investigate the behavior between mantlecreation and recommended start of taking data in the case of old borosilicate cells,a long series of measurements, lasting 3 months, was made on a limited number ofcells. These measurements were performed in the same manner and with the samecorrections as those of the comparison, but data-taking was started the same day themantle was created. Figure 2 shows the results of these measurements, obtained withat first two cells, a borosilicate cell (IMGC-29) and a fused silica cell (NMi06T005),while later on a third one (IMGC-28, also a borosilicate cell, rarely used) was addedto check for some of the behavior observed with the first borosilicate cell. As can bededuced from the names of the cells, the borosilicate cells are all from the same (old)IMGC batch of cells. Figure 2 shows the change in resistance of the SPRT, expressedin temperature units, using the sensitivity dR/dT of the thermometer.
123
Int J Thermophys
-0.35
-0.30
-0.25
-0.20
-0.15
-0.10
-0.05
0.00
0.05
0.10
0 10 20 30 40 50 60 70 80 90 100
Time, days
dt,
mK
NMI 06T005IMGC 29IMGC 28
Fig. 2 Temperature behavior of three cells, from the day of mantle creation. The parameter dt denotes theresistance difference of the thermometer with respect to an early point for the fused silica cell, convertedinto the temperature difference using the sensitivity dt/dR of the thermometer. Arrows indicate the time ofrefreezing
Several conclusions can be drawn from the behavior of the cells. First, on the timescale of the comparison, the fused silica cell(s) could still be taken to be essentiallystable over time, but when followed over a much longer time scale, some drift becomesapparent (about 50µK over 70 days), indicated by diamonds in Fig. 2. For comparisons,this small drift can be ignored since it will be indistinguishable from the measurementnoise for the duration of a single mantle during comparison. Second, a relatively fastrise of up to 100 µK can be observed right after mantle creation, see also [13], inagreement with the Gibbs–Thomson effect. Essentially, the cells reached equilibriumalready 1 day later, and for about 8 days, temperatures were stable with a standarddeviation of 10µK, before, for the borosilicate cell, drift sets in with the overallchange arriving at about 80 µK after 3 weeks. Thus, the first point in equilibrium afterthe temperature rise, i.e., already 1 day after preparation, could thus be taken as thereference point for the extrapolation.
After 3 weeks, with the vertical part of the mantle practically unchanged, the bottomof the mantle for the cell IMGC-29 just below the thermal well, had almost disappearedand this part of the mantle was recreated by refreezing locally at the very bottom of thethermometer well. This part corresponds to a fraction in mantle volume of less than1 %. Surprisingly, this action seemed to be beneficial in that it apparently stabilizedthe drift observed before, remaining constant (to within the noise) for almost 3 weeks,before the bottom of the mantle had thinned once again. In order to test the repeatabilityof apparent stabilization, it was repeated once more. This time a temperature dip ofabout 0.2 mK was seen which took 1 week to stabilize, after which the temperatureseemed to be stable again, be it 40 µK lower. After 1 month, with a drift starting toappear again, the critical thinning was not yet observed, but the action was repeatedanyhow, just out of curiosity, with essentially the same results. So with every refreezeat the bottom, the temperature drift seems to become interrupted for 1 to 2 weeks.However, the temperature value assumed at each such a “stabilization” is seen toreduce with time with about 40 µK at every occurrence. The same procedure was
123
Int J Thermophys
used with the fused silica cell, but without any noticeable effects on temperature.Furukawa et al. [16] had already noted that, in the case of mantle creation with aL-N2-cooled rod, a kind of “overshoot” occurred of up to 120 µK requiring at least3 days to subside. Such a time lapse of 3 days was not found for any of the three INRIMcells, but the “stabilization” plateaus of the borosilicate cells where the downward driftseems to become interrupted could be interpreted as the released strain energy fromthe Gibbs–Thomson effect counteracting the drift due to impurity release from the ice,not found by Furukawa et al. [16] since apparently new cells were used. The finding ofsuccessive plateaus at ever lower temperatures could be due to the impurities havingmoved upward where they are not influenced anymore by the renewed freezing.
In order to check if the observed “stabilization” after refreezing the bottom of themantle of cell IMGC-29 is due to some effect strictly related to the cell or if it canbe generalized, during the course of the measurements a third cell, IMGC-28, wasadded, on which the same experiments were performed. Although with less data, alsohere a similar behavior can be observed: an initial drift which, on refreezing, seemsto become interrupted, compatible with the above hypothesis.
4 Conclusion
Experiments have been performed at INRIM on TPW cells, both fused silica andborosilicate, that show the change with time in the temperature of two borosilicatecells. Taking this time dependence into account in a comparison adhering to the CCT-K7 protocol, where normally all the data for a single mantle are pooled together,the temperature differences between cells and their uncertainty would improve. Theexperiments reported here suggest that a suitable reference point for the extrapolationwould be the first moment of stabilization after mantle creation. They also show thatold borosilicate cells may be used more effectively at least during the first weekafter mantle creation, although they should not be relied upon beyond 2 weeks afterformation of the ice mantle. In order to take the most advantage of this, it would bebest to use a slow freezing method. Other NMIs are invited to repeat and or extendthe experiments.
References
1. M. Stock, S. Solve, D. del Campo, V. Chimenti, E. Méndez-Lango, H. Liedberg, P.P.M. Steur, P.Marcarino, R. Dematteis, E. Filipe, I. Lobo, K.H. Kang, K.S. Gam, Y.-G. Kim, E. Renaot, G. Bonnier,M. Valin, R. White, T.D. Dransfield, Y. Duan, Y. Xiaoke, G. Strouse, M. Ballico, D. Sukkar, M. Arai,A. Mans, M. de Groot, O. Kerkhof, R. Rusby, J. Gray, D. Head, K. Hill, E. Tegeler, U. Noatsch, S.Duris, H.Y. Kho, S. Ugur, A. Pokhodun, S.F. Gerasimov, Metrologia (Tech. Suppl.) 43, 03001 (2006)
2. G.F. Strouse, K.D. Hill, in Temperature, Its Measurement and Control in Science and Industry, vol. 7,part 1, ed. by D.C. Ripple (AIP, Melville, NY, 2003), pp. 327–332
3. K.D. Hill, Metrologia 38, 79 (2001)4. D.R. White, C.J. Downes, T.D. Dransfield, R.S. Mason, in Proceedings of TEMPMEKO 2004, 9th
International Symposium on Temperature and Thermal Measurements in Industry and Science, ed. byD. Zvizdic, L.G. Bermanec, T. Veliki, T. Stašic (FSB/LPM, Zagreb, Croatia, 2004), pp. 251–256
5. Bureau International des Poids et Mesures (BIPM), “Supplementary Information for the InternationalTemperature Scale of 1990,” in Mise en Pratique for the definition of the kelvin 2014, August 2013(BIPM, Sèvres, 2013), http://www.bipm.org/utils/common/pdf/its-90/SInf_Section_2_2_2013.pdf
123
Int J Thermophys
6. A. Peruzzi, R. Bosma, O. Kerkhof, R. Peter, M.D. del Campo Maldonado, M. Smid, D. Zvizdic, M.B.Nielsen, M. Anagnostou, E. Grudnewicz, M. Nedea, P.P.M. Steur, E. Filipe, I. Lobo, I. Antonsen, E.Renaot, T. Weckstrom, J. Bojkovski, E. Turzó-András, M. White, E. Tegeler, M. Dobre, J. Ranostaj,A. Kartal Dogan, V. Augevicius, A. Pokhodun, S. Simic, Metrologia (Tech. Suppl.) 46, 03001 (2009)
7. A. Peruzzi, A. Szmyrka Grzebyk, Metrologia (Tech. Suppl.) 49, 03006 (2012)8. A. Peruzzi, E. Grudniewicz, Metrologia (Tech. Suppl.) 49, 03008 (2012)9. T.I. Dikun, P.V. Kozlov, Metrologia (Tech. Suppl.) 49, 03003 (2012)
10. J. Ranostaj, S. Duriš, M. Koval, R. Strnad, M. Šindelár, Metrologia (Tech. Suppl.) 50, 03004 (2012)11. G.F. Strouse, M. Zhao, Int. J. Thermophys. 28, 1913 (2007)12. C.R. Barber, R. Handley, E.F.G. Herington, Br. J. Appl. Phys. 5, 41 (1954)13. R.J. Berry, Can. J. Phys. 37, 1230 (1959)14. G.T. Furukawa, W.R. Bigge, in Temperature: Its Measurement and Control in Science and Industry,
vol. 5, ed. by J.F. Schooley (AIP, Melville, NY, 1982), pp. 291–29715. K.D. Hill, in Proceedings of TEMPBEIJING ’97, ed. by Z. Baoyu, H. Lide, Z. Xiaona (Standards Press
of China, Beijing, 1997), pp. 10–1516. G.T. Furukawa, B.W. Mangum, G.F. Strouse, Metrologia 34, 215 (1997)17. E. Méndez-Lango, in Proceedings of TEMPMEKO 2001, 8th International Symposium on Temperature
and Thermal Measurements in Industry and Science, ed. by B. Fellmuth, J. Seidel, G. Scholz (VDEVerlag, Berlin, 2002), pp. 465–470
18. X. Yan, H. Wu, Y. Wang, Z. Zhang, Y. Feng, P. Qiu, in Proceedings of TEMPMEKO 2004, 9thInternational Symposium on Temperature and Thermal Measurements in Industry and Science, ed. byD. Zvizdic, L.G. Bermanec, T. Veliki, T. Stašic (FSB/LPM, Zagreb, Croatia, 2004), pp. 289–294
19. X.K. Yan, J.T. Zhang, Y.L. Wang, C.F. Ma, Y.N. Duan, Int. J. Thermophys. 29, 104 (2008)20. X.K. Yan, C.F. Ma, Z.M. Zhang, H.L. Wu, P. Qiu, Y.L. Feng, J.T. Zhang, Y.N. Duan, Int. J. Thermophys.
29, 815 (2008)21. M. Dobre, Int. J. Thermophys. 29, 799 (2008)22. K. Kodaira, Int. J. Thermophys. 32, 2261 (2011)
123