Embed Size (px)
DESCRIPTION
Water Scarcity. Demography. Crop Decline. Hunger. Coastal Risks. Recent Conflicts. Major Drivers: Intersection of Climate, Water, Politics. Source: World Resources Institute. Major Drivers: Environmental Upheaval. - PowerPoint PPT Presentation
Citation preview
02MAR10 DIVERSEY CONFIDENTIAL - DO NOT DISTRIBUTE
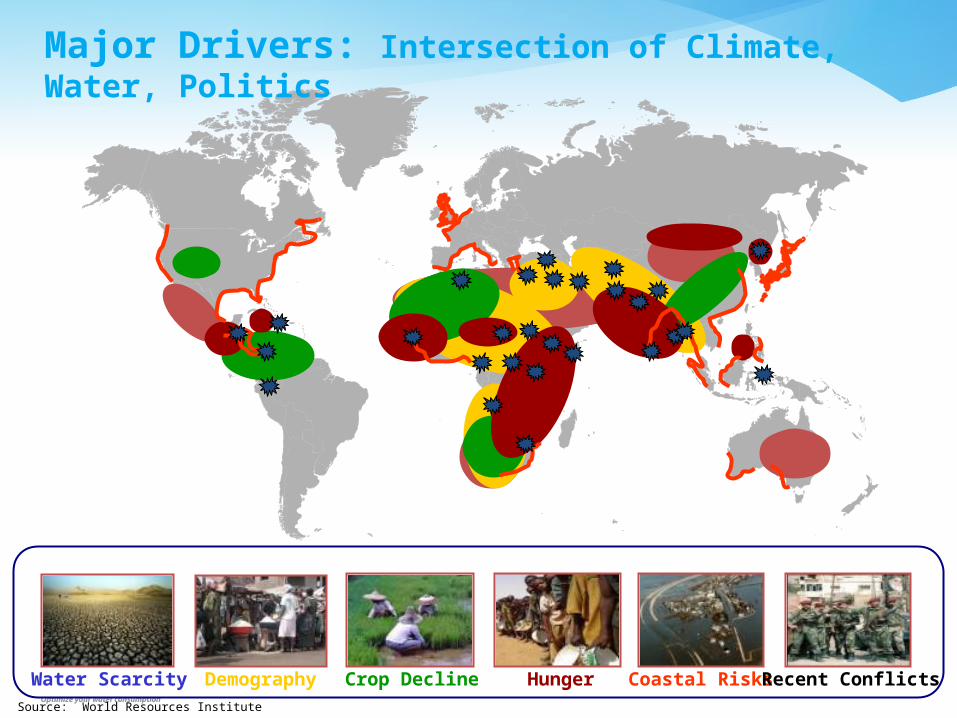
1Water Scarcity Demography Crop Decline Hunger Coastal Risks Recent Conflicts
Major Drivers: Intersection of Climate, Water, Politics
Source: World Resources Institute
DIVERSEY CONFIDENTIAL - DO NOT DISTRIBUTE
2
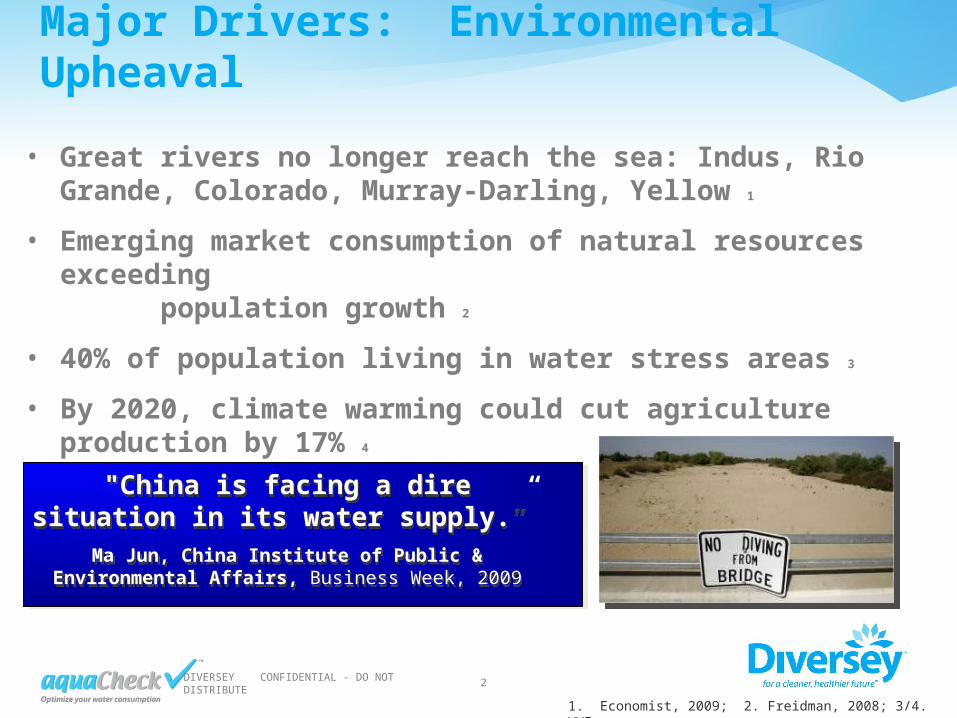
Major Drivers: Environmental Upheaval
• Great rivers no longer reach the sea: Indus, Rio Grande, Colorado, Murray-Darling, Yellow 1
• Emerging market consumption of natural resources exceeding population growth 2
• 40% of population living in water stress areas 3
• By 2020, climate warming could cut agriculture production by 17% 4
1. Economist, 2009; 2. Freidman, 2008; 3/4. WWF
"China is facing a dire situation in its water supply.”
Ma Jun, China Institute of Public & Environmental Affairs, Business Week, 2009
"China is facing a dire situation in its water supply.”
Ma Jun, China Institute of Public & Environmental Affairs, Business Week, 2009

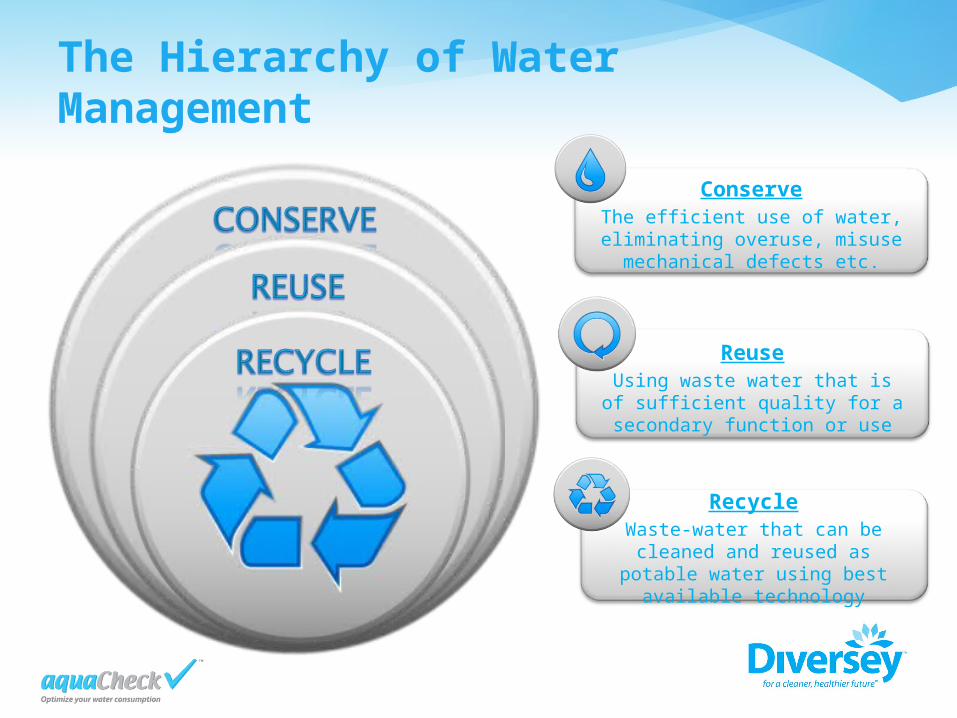
The Hierarchy of Water Management
ReuseUsing waste water that is of
sufficient quality for a secondary function or use
ConserveThe efficient use of water,
eliminating overuse, misuse mechanical defects etc.
RecycleWaste-water that can be
cleaned and reused as potable water using best available
technology
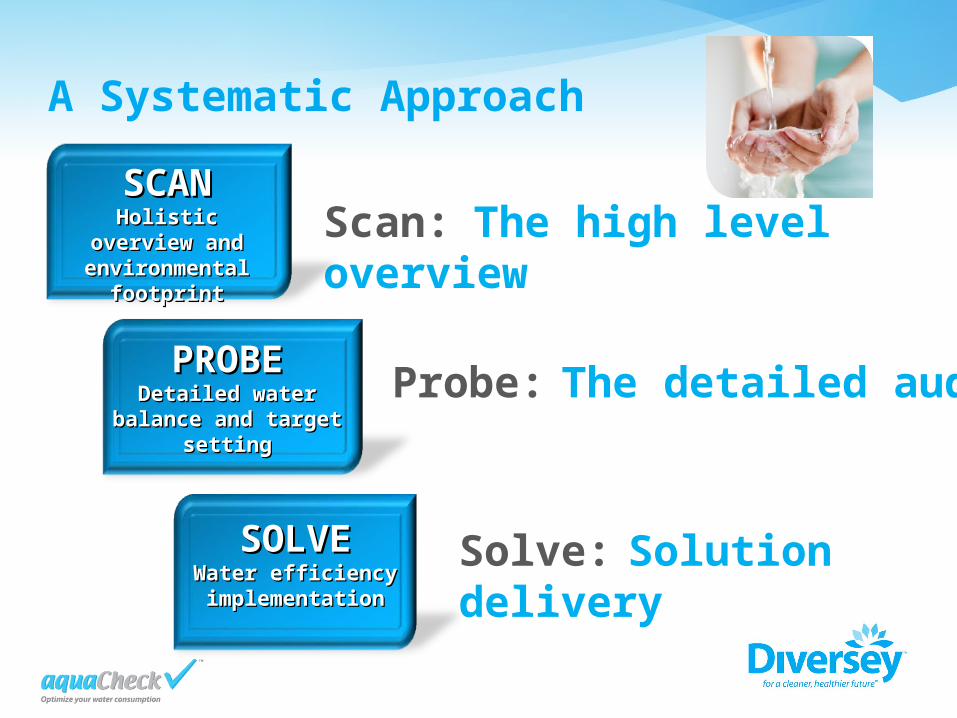
A Systematic Approach
Scan: The high level overview
Probe: The detailed audit
Solve: Solution delivery
SCANSCANHolistic overview and Holistic overview and
environmental footprintenvironmental footprint
PROBEPROBEDetailed water balance Detailed water balance
and target settingand target setting
SOLVESOLVEWater efficiency Water efficiency implementationimplementation
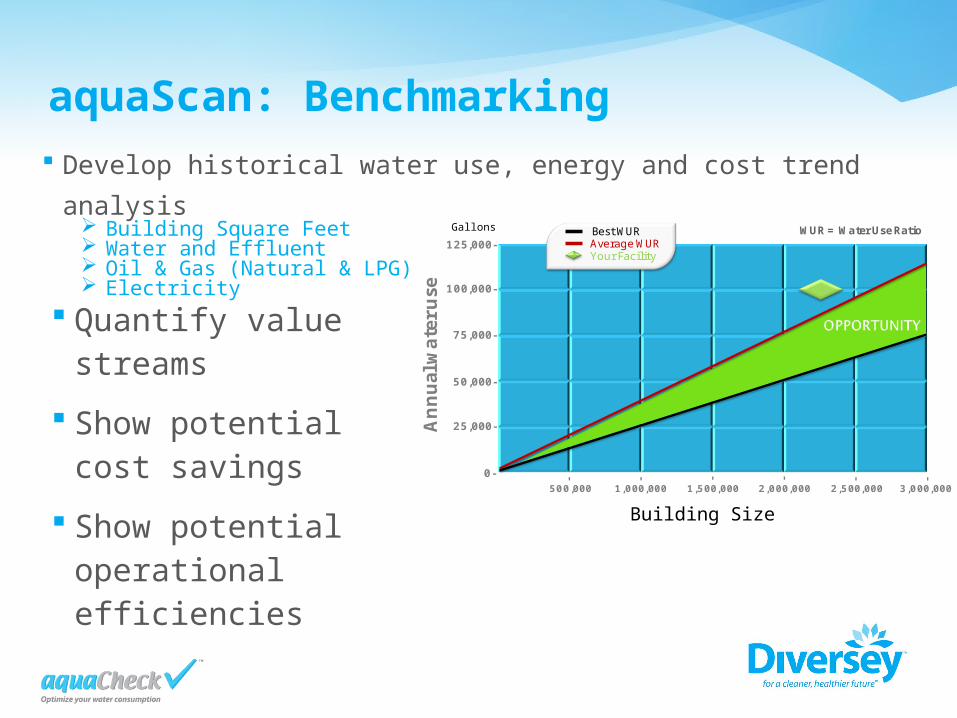
Develop historical water use, energy and cost trend analysis Building Square Feet Water and Effluent Oil & Gas (Natural & LPG) Electricity
aquaScan: Benchmarking
0-
25,000-
50,000-
75,000-
100,000-
125,000-
500,000 1,000,000 1,500,000 2,000,000 2,500,000 3,000,000
Annual
wate
r use
Register Transactions
- - - - - -
Best WURAverage WURYour Facility
WUR = Water Use Ratiogals/sf
Quantify value streams
Show potential cost savings
Show potential operational efficiencies
Gallons
Building Size
13
15
17
19
21
23
25
27
29
31
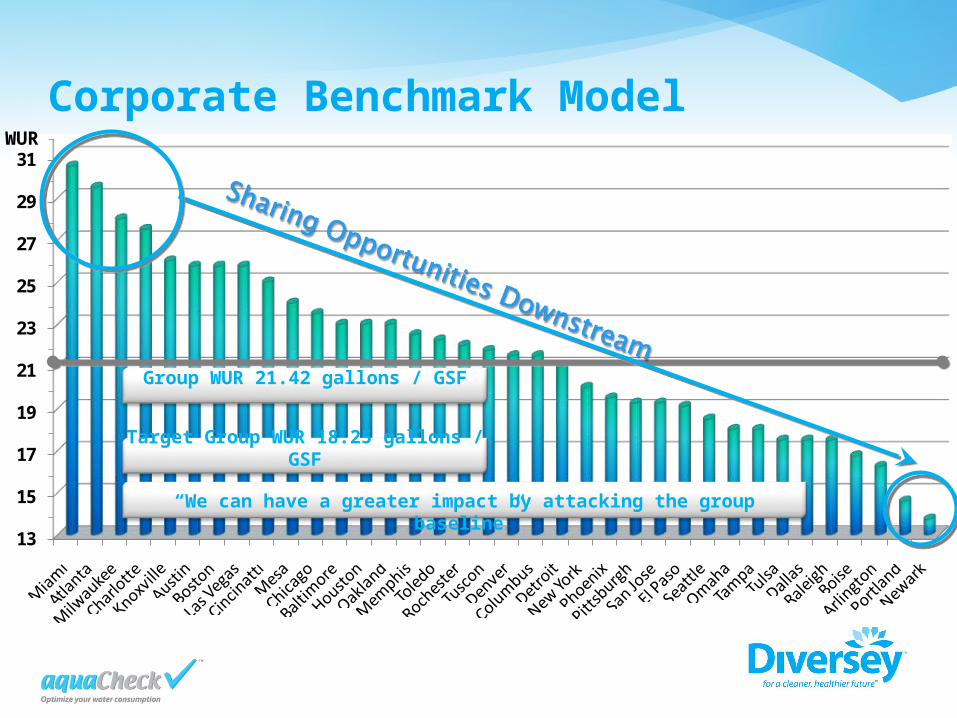
Corporate Benchmark Model
“We can have a greater impact by attacking the group baseline”
Group WUR 21.42 gallons / GSF
Target Group WUR 18.25 gallons / GSF
WUR
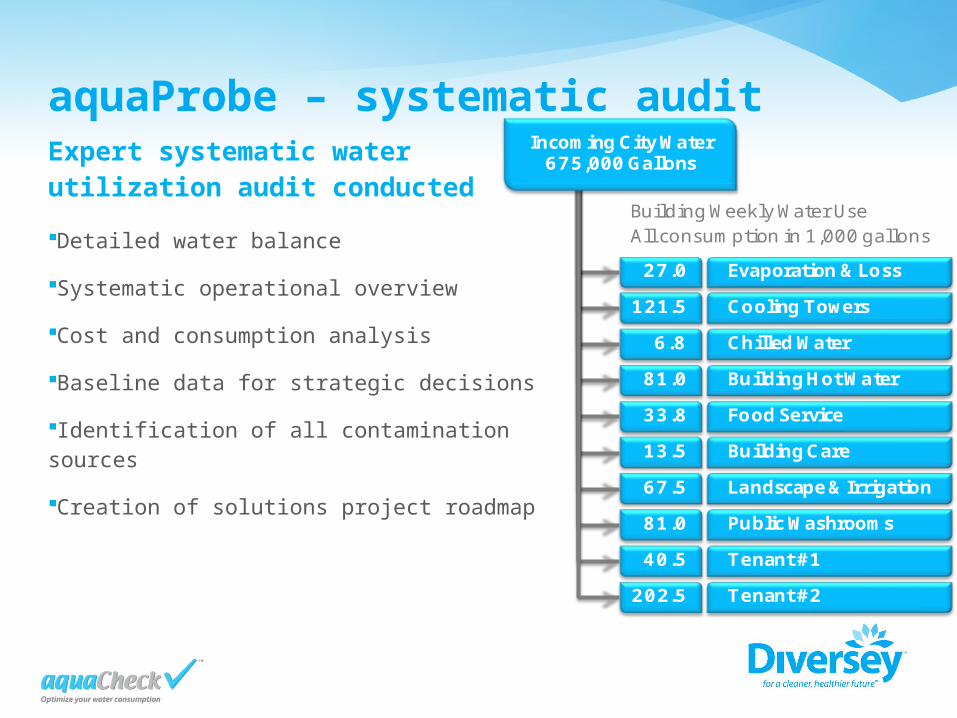
aquaProbe – systematic auditExpert systematic water utilization audit conducted
Detailed water balance
Systematic operational overview
Cost and consumption analysis
Baseline data for strategic decisions
Identification of all contamination sources
Creation of solutions project roadmap
Cooling Towers
Chilled Water
Building Hot Water
Food Service
Building Care
Landscape & Irrigation
Public Washrooms
Tenant #1
121.5
6.8
81.0
33.8
13.5
67.5
81.0
40.5
Evaporation & Loss27.0
202.5 Tenant #2
Building Weekly Water UseAll consumption in 1,000 gallons
Incoming City Water 675,000 Gallons
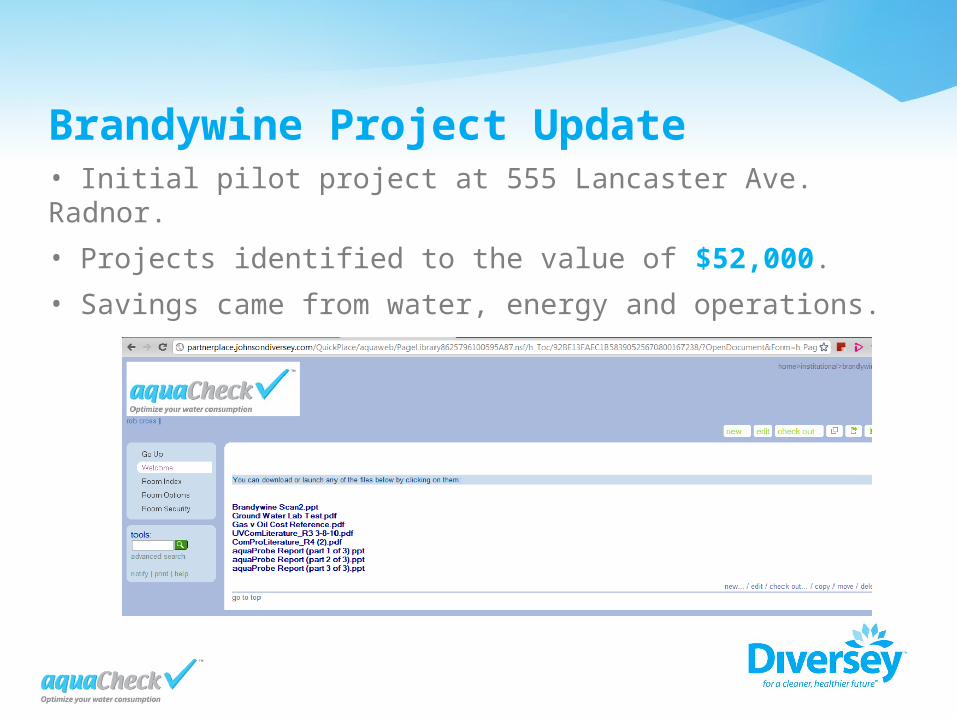
Brandywine Project Update• Initial pilot project at 555 Lancaster Ave. Radnor.
• Projects identified to the value of $52,000.
• Savings came from water, energy and operations.
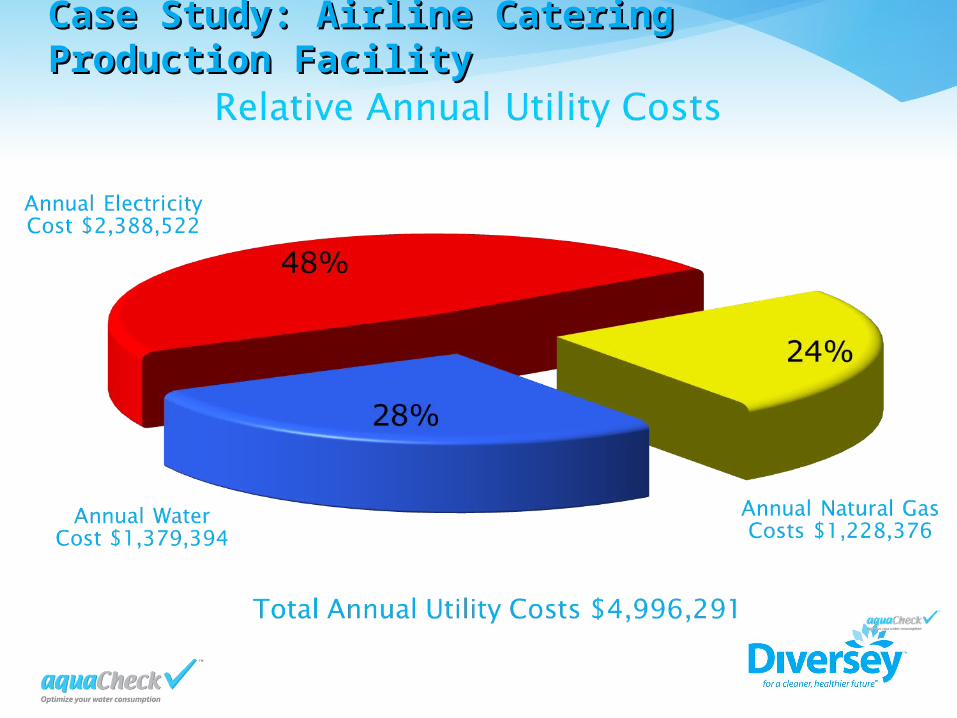
Case Study: Airline Catering Production Case Study: Airline Catering Production FacilityFacility
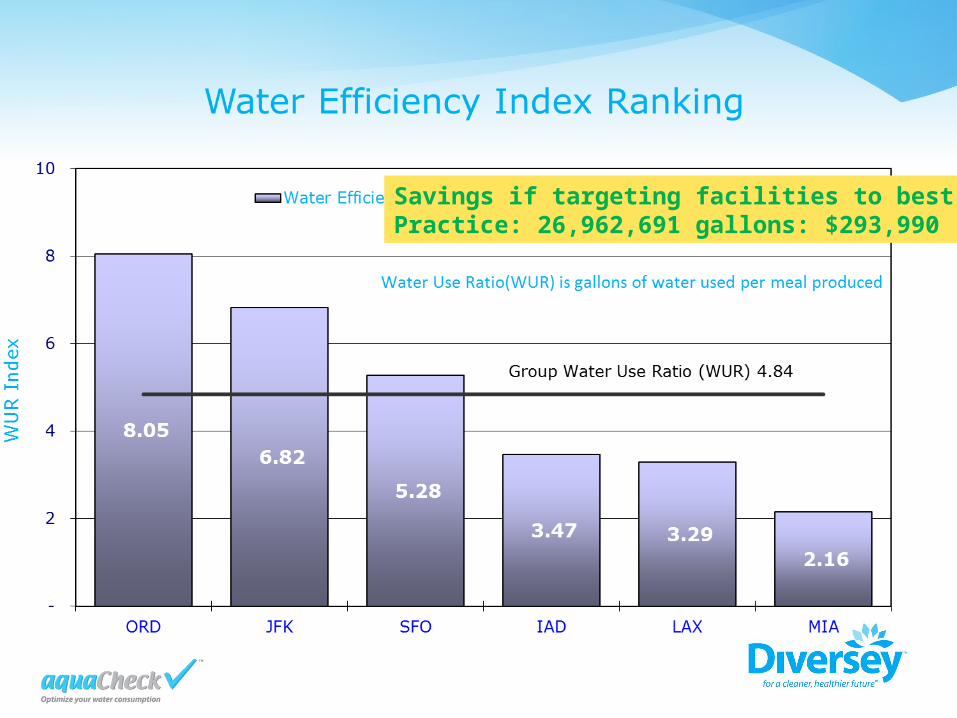
Savings if targeting facilities to best Practice: 26,962,691 gallons: $293,990
Delivering Sustainable Resource Solutions