Embed Size (px)
Citation preview

EVALUATION OF TECHNIQUES FOR MAPPING LAND AND CROPS IRRIGATED BY CENTER PIVOTS
PROM COMPUTER-ENHANCED LANDSAT IMAGERY IN PART OF THE JAMES RIVER BASIN NEAR
HURON, SOUTH DAKOTA
By K. E. Kolm
U.S. GEOLOGICAL SURVEY
Water-Resources Investigations Report 85-4021
Lakewood, Colorado
1985

UNITED STATES DEPARTMENT OF THE INTERIOR
DONALD PAUL BDDEL, Secretary
GEOLOGICAL SURVEY
Dallas L. Peck, Director
For additional information write to:
District Chief U.S. Geological Survey Water Resources Division Room 317 Federal Building 200 4th St. S.W. Huron, SD 57350
Copies of this report can be purchased from:
Open-File Services Section Western Distribution Branch U.S. Geological Survey Box 25425, Federal Center Denver, Colorado 80225 (Telephone: (303) 236-7476)
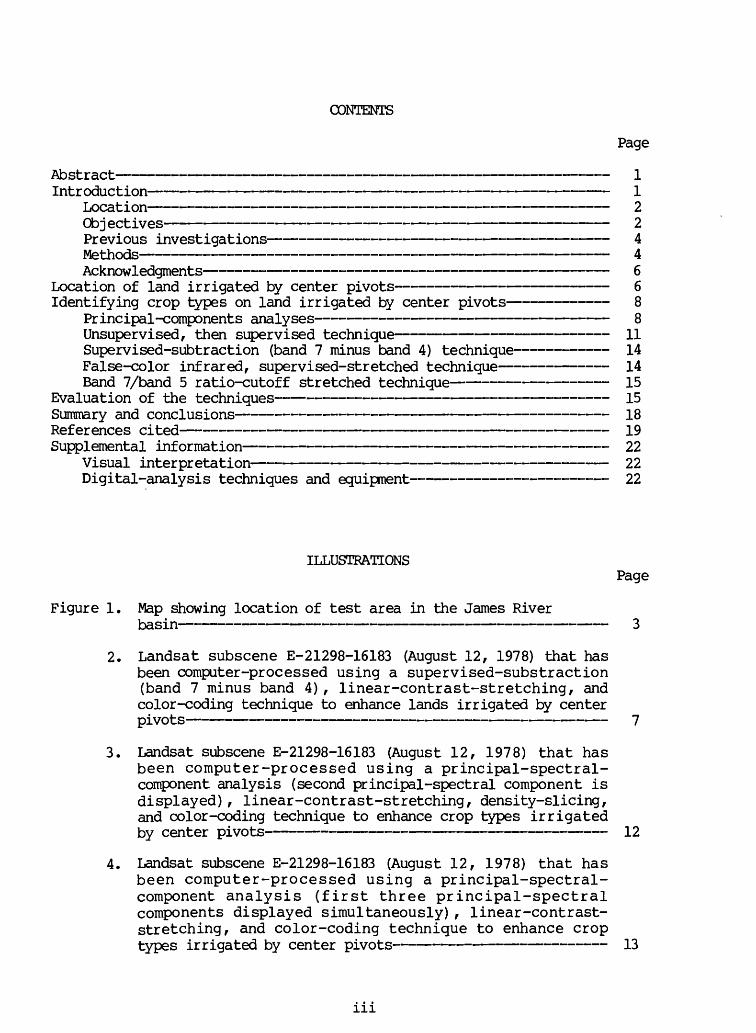
CONTENTS
Page
j-iOca L. i on ff
Previous investigations 4
Location of land irrigated by center pivots 6Identifying crop types on land irrigated by center pivots 8
Principal -components analyses 8Unsupervised, then supervised technique 11Supervised-subtr action (band 7 minus band 4) technique 14False-color infrared, super vised-st retched technique 14Band 7/band 5 ratio-cutoff stretched technique 15
Evaluation of the techniques 15Summary and conclusions 18rcenerences cited .-TIT-..-.- ..-.-.- .-.-. . . ______________ j^ySupplemental information 22
Visual interpretation 22Digital-analysis techniques and equipment 22
ILLUSTRATIONSPage
Figure 1. Map showing location of test area in the James Riverbasin "" ' ~ ~ . . . ^
2. Landsat subscene E-21298-16183 (August 12, 1978) that has been computer-processed using a supervised-substraction (band 7 minus band 4) , linear-contrast-stretching, and color -coding technique to enhance lands irrigated by center
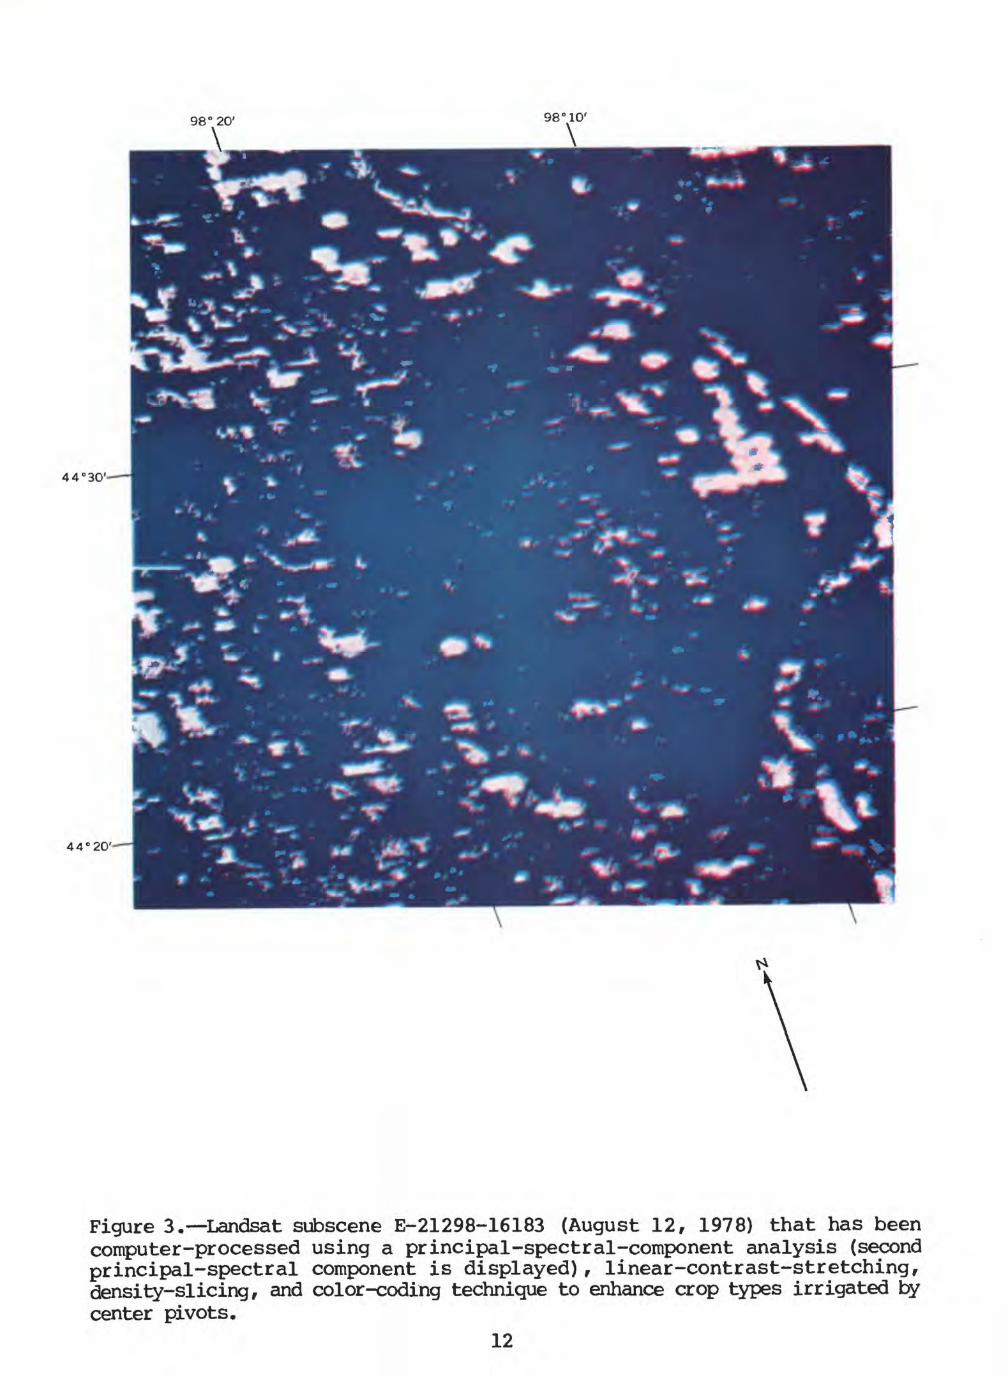
3. Landsat subscene E-21298-16183 (August 12, 1978) that has been computer-processed using a principal-spectral- component analysis (second principal-spectral component is displayed) , linear-contrast-stretching, density-slicing, and color -coding technique to enhance crop types irrigated by center pivots 12
4. Landsat subscene E-21298-16183 (August 12, 1978) that has been computer-processed using a principal-spectral- component analysis (first three principal-spectral components displayed simultaneously) , linear -contrast- stretching, and color-coding technique to enhance crop types irrigated by center pivots 13
111

TABLES
Page
Table 1. Number and percentage of center pivots correctly identified by crop type from visual interpretations of computer- enhanced (supervised-subtraction of band 4 from band 7 technique) Landsat subscene (August 12, 1978) compared to
2. Number of center pivots correctly identified by crop type from visual interpretations of computer-enhanced (five techniques) Landsat subscene (August 12, 1978) compared to ground control 10
3. Number and percentage of center pivots correctly identified by crop type from the best visual-interpretation technique of computer-enhanced (principal-components analyses) Landsat subscene (August 12, 1978) compared to reported
CONVERSION TABLE
Multiply inch-pound units By To obtain metric units
inch 2.54 centimeter (cm)inch 25.40 millimeterfoot 0.3048 meter (m)mile 1.609 kilometeracre 0.4047 hectare (ha)acre-foot 1,233 cubic meter ~square mile 2.590 square kilometer (km )gallon per minute 0.631 liter per second
To convert from degrees Fahrenheit to degrees Celsius, subtract 32 and then divide the result by 1.8.
IV

EVALUATION OF TECHNIQUES FOR MAPPING LAND AND CROPS
IRRIGATED BY CENTER PIVOES FROM COMPUTER-ENHANCED LANDSAT IMAGERY
IN PART OF THE JAMES RIVER BASIN NEAR HURON, SOUTH DAKOTA
By K. E. Kolm
ABSTRACT
The objective of this study was to evaluate remote-sensing techniques for mapping irrigated crop types and acreages in part of the James River basin of South Dakota, using Landsat imagery. The results demonstrated that a supervised-subtraction (band 7 minus band 4) technique was best for identify ing the location of cropland irrigated by ground water. Two separate principal components analyses (analysis of the second principal component and the simultaneous analysis of the first three principal components) were best for identifying the crop type and estimating crop acreages. However, only 50 percent of the irrigated lands could be identified and only 79 percent of these could be classified accurately by crop type. Therefore, a 39 percent overall accuracy was achieved in irrigated crop-type identification.
A comparison of two different study areas, the semiarid High Plains of south-central South Dakota (previously studied) and the subhumid James River basin area near Huron, South Dakota, (this report) indicates that crop calen dar, crop diversity, field size irrigated by a center pivot, soil type, soil moisture, climate, and farming practices may affect the applicability of remote-sensing methods to irrigated-crop studies. The use of computer- processed Landsat data to identify irrigated-crop types and estimate irrigated-crop acreage was least successful in the subhumid James River basin area where croptype is diverse, dryland crop production is substantial, soils are cool and poorly drained, crop calendars overlap greatly, and large field areas commonly are planted in parts and with multiple crop types.
INTRODUCTION
The principal consumptive use of ground water in the James River basin of South Dakota is cropland irrigation (Jones, 1978; South Dakota Water Rights Commission, unpublished data, 1931-79). The quantity of water used for ir rigation can be estimated from crop type and crop acreages using crop consumptive-use formulas (for an example of one method, see Blaney and Criddle, 1962). Crop-irrigation-water requirements in South Dakota have been published by the U.S. Department of Agriculture, Soil Conservation Service (1967, 1976, 1978).
The South Dakota Water Rights Commission maintains complete data available on irrigation-water use. These data consist of records of water^well permits, ownership, and water use. These records include the location and acreage of potentially irrigated land, rate of water used (cubic feet per second), type of water use (municipal, industrial, or irrigation), source of water (surface

or ground water; specific drainages mentioned), and type of irrigation system used (gravity or sprinkler). However, because the actual crop acreage and type of crops planted change each year, and because this information is volun teered by each landowner, crop records generally are accurate but may be incomplete. Therefore, an alternative technique of crop-type and crop-acreage measurement is desirable.
Location
The study area, the James River basin of eastern South Dakota (fig. 1) ,includes about 36,000 km2 (see Conversion Table for abbreviations). However, a smaller, representative test area in Beadle County, including parts of Townships 110, 111, 112, and 113 North and parts of Ranges 60, 61, 62, and 63 West, was used to evaluate and develop most of the remote-sensing, image- processing and analysis techniques. This smaller, representative test area (fig. 1) was chosen because of abundant ground information, cloud-free Landsat data available, and numerous fields irrigated by ground water using center pivots.
The James River basin can be characterized as a low-relief, broad valley. The valley floor consists of glacial-fluvial deposits and modern flood-plain sediments; both deposits are believed to be hydraulically connected in various parts of the study area (Flint, 1955; P. J. Bnmons, U.S. Geological Survey, oral commun., 1983) . The dominant vegetation is prairie grass al though riparian vegetation (such as cottonwood trees) is present in the flood plains and channel bottoms.
Objectives
The objectives of this study were:
1. To evaluate previously developed remote-sensing techniques for identifying crop types irrigated by ground water, and for estimating irrigated-crop acreage (as number of center pivots) in the James River basin of South Dakota, using Landsat imagery.
2. To develop new or modify previously developed remote-sensing techniques for identifying irrigated-crop types and irrigated-crop acreages (center pivots) in the James River basin of South Dakota, using Landsat imagery.
3. If any of the techniques were successful, to estimate the consumptive use of ground water in the James River basin using information derived from analysis of Landsat imagery. These values could then be used in water- budget studies or an aquifer-system model of the study area.

"| W
AL
WO
RT
H
! E
D
iy
i U
N
D
S
. [___
____
____
_ _
Jam
es R
ive
rL.^
/.._
__
B
asin
Bo
un
da
ry-f
/
B u
T T
Z\
E
B
A
C
H
-, ._
_ _
-'I
M
E
A
D
E
S O
r-tU
T
H
),
JE
^/U
L
-
__
__
__
.._..__..
T
JO
N\
| LA
KE
I
I -,-
V- J
1-
J
' I
'°
I '
L______i_
______|_
______,_
______
L
100
150
KIL
OM
ET
ER
S
100
MIL
ES
Fig
ure
1. L
oca
tion o
f te
st a
rea
in t
he
Jam
es R
iver
bas
in.

Previous Investigations
Numerous investigations have been completed on the feasibility of mapping crop types and crop acreages using visual- and computer-interpretation tech niques applied to Landsat multispectral data (Driscoll and Francis, 1970; Swain, 1972; Phillips, 1973; Draeger, 1977; Bauer and others, 1978; Bauer and others, 1979; Draeger, 1979; Johnson and Loveland, 1979; Poracsky and Williams, 1979; and Wall 1979). Other investigators determined the types of irrigation systems used and estimated the quantity of water used by crops from Landsat-image interpretations (Eucker and others, 1974; Hoffman and others, 1974; and Hoffman, 1979). The U.S. Geological Survey recently developed tech niques to estimate irrigation-water use by mapping irrigated cropland, using Landsat imagery (Heimes and Thelin, 1979; Thelin and others, 1979; and Kolm and Case, 1984) . Most of the methods used in these studies include digital and manual mapping, multitemporal and multispectral analyses, and supervised or unsupervised classification or both.
Methods
The principal crops irrigated by ground water in the James River basin (based on 1978 planting records) are alfalfa (52 percent), corn (27 percent), wheat (14 percent) , and soybeans, milo, and hay combined (7 percent) (South Dakota Water Rights Commission, unpublished data, 1931-79; Jones, 1978). These irrigated crops are grown generally in the flood plain of, or along lowland areas near, the James River or its tributaries.
Nonirrigated corn, alfalfa, wheat, soybeans, milo, and hay also are grown in the uplands and lowlands in the James River basin. However, this study focused on identifying crop types and estimating crop acreages that are ir rigated by ground water. Fortunately, center-pivot irrigation is the method used for more than 95 percent of the crops irrigated in bottomland areas of the central James River basin (South Dakota Water Rights Commission, un published data, 1931-79; Jones, 1978) . Therefore, only the bottomland crops irrigated by center pivots were classified by crop type and evaluated for crop acreage in this study.
Cropland can be differentiated from rangeland on Landsat images by cul tivation patterns and spectral reflectances of plants. Most cropland is identified by square, rectangular, or circular fields; circular fields, which were the subject of this study, are characteristic of center-pivot irrigation systems.
Crop-type identification and mapping, using Landsat imagery, can be ac complished best through the evaluation of seasonal variations in plant growth and vigor, and plant reflectance. Crop calendars, determined by the U.S. Department of Agriculture (1967, 1976, 1978) are essential in determining crop history (planting through harvest).
Bauer and others (1979), Poracsky and Williams (1979) , and Kolm and Case (1984) noted that corn and soybeans in the midwestern United States are most accurately identified on Landsat imagery taken during August and early September, and that wheat and alfalfa are most easily identified during May. They concluded that Landsat imagery needs to be analyzed for a minimum of two

dates in order to identify these crop types accurately. Eucker and others (1974) and Hoffman (1979) concluded that additional imagery collected in June, July, and September can increase the accuracy of this identification by 10 to 15 percent. The desire for accuracy needs to be balanced against the costs associated with the purchase and processing of each additional Landsat scene. Also, suitable additional scenes may not be available (due to the lack of cloud-free data for example).
For purposes of this study, two 1978 Landsat scenes (E-21208-16141 taken on May 14, 1978; E-21298-16183 taken on August 12, 1978) were initially chosen for image analysis and interpretation. Both scenes contain well-delineated cloud-free data. The advantages of using Landsat data for irrigated acreage determination include multitemporal coverage (to monitor changes in vegetation patterns) , multispectral-data format (four bands to monitor changes in vegeta tion vigor and stage, and to perform a multi spectral-data analysis) , digital and photographic data, regional scale (large areas can be classified on a single image), and reasonable cost. The general disadvantage of using Landsat data is the limited spatial resolution (80 m).
Computer-compatible tapes were purchased for each of the two Landsat scenes. Data on each computer-compatible tape were entered into a minicom puter, processed (enhancements, classifications, and so forth) using predeveloped computer programs, and displayed on a video screen. The resul tant, enhanced or classified or both data sets were transmitted to a printer/plotter (black-and-white film products) or a film writer (color-film products) and film-negative products were made. These photographic productswere processed, and positive enlargements (3X for this study) were produced
2 for visual interpretations. A 1,152-km test area in Beadle County, SouthDakota (fig. 1) , was selected for analysis because of availability of ground information and seasonal Landsat coverage.
Two techniques described and used previously by Kolm and Case (1984) in the High Plains of South Dakota were evaluated for locating land irrigated by center pivots and identifying irrigated crop types in the James River basin test sites: (1) visual interpretations of ratio-cutoff classifications of logarithmically stretched images based on the band 7/band 5 ratio; and (2) visual interpretations of unsupervised, then supervised classification of multiple-band images. Three new techniques also were evaluated for locating center pivots and identifying irrigated crop types in the test site: (1) supervised-subtraction (band 7 minus band 4); (2) principal-components analyses (individual components and multiple components evaluated simultaneously) ; and (3) false-color infrared, supervised-stretched classification.
Three steps were necessary for applying the analysis techniques to meet the objectives. The initial step was to locate center pivots in the bottom lands of the James River basin using enhanced or classified imagery or both. These center pivots are indicative of cropland that is irrigated using ground water. The August imagery was to be used initially and additional center pivots were to be located (and other center pivots confirmed) using the May imagery.

The second step was to identify the crop types irrigated by center-pivots using ratio, classification, subtraction, principal components, linear contrast-stretching, and color-coding techniques. Corn, soybeans, and alfalfa were to be identified using the August imagery, and alfalfa and wheat were to be identified (or confirmed) using the early May imagery. The location and the crops grown in these irrigated fields were correlated with data collected by the South Dakota Water Rights Commission.
Because the accuracy of all techniques used was less than 80 percent, crop-acreage and consumptive-use estimates were not determined (as originally planned) . Therefore, the results and accuracy evaluations have been calcu lated in terms of center pivots.
The third step was to calculate, using the number of center pivots, the crop acreage for each field. Then, an evaluation of and a comparison between the five techniques was made. Each technique was evaluated for accuracy of crop-type identification (known center pivots versus classified center pivots) . If the accuracy was less than 80 percent, the technique used was considered inadequate.
Acknowledgments
The author wishes to thank Dr. Ronald W. Marrs and Janet E. Marks of the Remote Sensing Laboratory, Department of Geology and Geophysics, University of Wyoming, Laramie, Wyoming, for providing access to the Remote Sensing Laboratory facilities at a reasonable cost, and for assisting with the image processing and anaylsis completed in this study.
LOCATION OF LAND IRRIGATED BY CENTER PIVOTS
All five techniques (discussed in detail in a later section of this report) were evaluated for locating land irrigated by center pivots. Of these, the best technique for locating center-pivot irrigation lands in the James River basin was the supervised-subtraction technique. This technique consisted of three steps:
1. Bands 4 and 7 for the August Landsat scene were registered spatially by the computer, and the visible (green) spectrum (band 4) was subtracted from the infrared spectrum (band 7) on a pixel-by-pixel basis.
2. The positive difference, which represents vegetated areas, was linearly contrast-stretched and displayed (color-coded) in shades of red; the most vigorous vegetation was displayed in a bright red-orange (fig. 2).
3. The location of center pivots was visually interpreted using color prints. The main criteria consisted of mapping circular areas that were bright orange or yellow-orange.
The final step normally undertaken (Kolm and Case, 1984) is to analyze spring imagery to locate land irrigated by center pivots that is planted with crops that become vigorous early in the season (for example, alfalfa) and to confirm the location of some other center-pivot irrigated lands. The study by

98' 20' 98-10'
44'20'
Figure 2. Landsat subscene E-21298-16183 (August 12, 1978) that has been computer-processed using a supervised-substraction (band 7 minus band 4), linear-contrast-stretching, and color-coding technique to enhance lands ir rigated by center pivots.
7

Kolm and Case (1984) showed that in the High Plains of South Dakota, May im agery needs to be used to most successfully accomplish this task. However, the enhanced May 14, 1978, scene yielded no positive results regarding center- pivot location and crop-type identification. As a result, a third Landsat scene (E-3 0115-163 80) taken on June 28, 1978, was chosen for image analysis. Unlike the High Plains region of South Dakota, where the spring crops are vigorous in early May (Kolm and Case, 1984) , similar plant growth is delayed by about 3 to 4 weeks in the James River basin due to a cooler climate and cold soils (U.S. Department of Commerce, 1977) .
Subsequently, the analysis of June imagery also was unsuccessful. Hip new lands irrigated by center pivots could be mapped, and most lands mapped using the August imagery were not distinguishable on the June imagery. Therefore, utilizing spring imagery was ineffective in this study.
Twenty-seven fields possibly irrigated by center pivots were identified using the supervised-subtraction technique on the August Landsat image; 19 fields were correctly identified and 8 fields were incorrectly identified (table 1) . In this test area, 80 circular fields irrigated by center pivots were on record with the South Dakota Water Rights Commission (unpublished data, 1931-79). Of the 80 fields, only 38 (47.5 percent) fields were reported as planted in 1978; 19 (50 percent) of those reported fields were mapped using the August Landsat scene. In summary, only 47 to 50 percent of those lands irrigated by center pivots were distinctly identified by the best tech nique, which was the supervised-subtraction technique, and only 24 percent of the total recorded irrigation lands could be accounted for.
The results of the other four techniques were considerably less accurate. Therefore, the presentation of results (table 1) is limited to the supervised- subtraction technique.
IDENTIFYING CROP TYPES ON LAND IRRIGATED BY CENTER PIVOTS
The results of the five techniques used for identifying crop type on land irrigated by center pivots are summarized in table 2. There were 19 fields used as ground control (about 24 percent of the total, reported fields); these 19 fields were mapped using the supervised-subtraction technique pre viously described.
Analses
Principal-components analyses, when applied to multi spectral data, linearly transforms the spectral values of the original data into a new set of spectral values that represent the maximum degree of variability within the original data. This new data set preserves the same useful information of the original data set, but the spectral information that accounts for the minimum variability of the original data has been removed. This commonly allows the interpreter to better analyze the spectral data for various applications (Johannsen and Sanders, 1982) .
Two kinds of principal-components analyses used were: (1) Analysis of three principal components simultaneously, and (2) analysis of the first and

Table 1. Nuirber and percentage of center pivots correctly identified by crop type from visual interpretations of computer-enhanced (Supervised-subtraction of band 4 from band 7 technique) Landsat subscene (August 12, 1978) compared to reported data.
Crop type
Corn
Alfalfa
Wheat
Soybeans
Milo
Hay
Total
Reported nuirber of center pivots
19 1/2
10
5 1/4
1 1/4
1
1
38
Percentage of total reported center pivots
51
26
14
3
3
3
100
Nuirber of center -pivots
correctly identified
11 1/2
5
2 1/4
1/4
0
0
19
Percentage of total reported center pivots
correctly identified
31
13
6
<1
0
0
50
(1978).

Table
2. N
uirb
er o
f center p
ivots
corr
ectl
y id
enti
fied
by crop type
from visual
inte
rpre
tati
ons
of c
omputer-
enha
nced
(five techniques)
Landsat
subscenes
(August
12,
1978), co
mpar
ed t
o ground c
ontr
ol.
Crop
type
Corn
Alfalfa
Wheat
Soyb
eans
Milo
Hay Total
Ground
cont
rol
11 1/2
5 2 1/4
1/4
0 0 19
Pr inc ipa
l-co
mpon
ent s
analyses
second
prin
cipa
lco
mpon
ent
only
10 1
/2
4 1/2
0 0 0 0 15
first
three
principal
components
10 1
/2
4 1/2
0 0 0 0 15
Unsupervised,
then
supe
rvis
edte
chni
que
9 1/2
5 0 0 0 0 14 1/2
Supervised-
subtraction
technique
10 3
/4
3 1/2
0 0 0 0 14 1/
4
False-color
infrared,
supe
rvis
edstretched
technique
10 1
/2
2 1/2
0 0 0 0 13
Band 7
/band
5 ratio-cutoff,
stre
tche
dte
chni
que
4 3 0 0 0 0 7
South Dakota Water R
ights
Comm
issi
on (unpublished d
ata, 1931-79);
Jone
s (1
978)

second principal components separately. Four bands of data, each equivalent to a principal component, were entered into the computer and analyzed for variance (for a discussion of principal components, see International Imaging Systems, 1981). At this point, two techniques can be used:
1. The computer can print out the first three principal components and assign a color to each component. The printout will resemble a color composite.
2. The computer will print out single components separately in shades of gray which can be linearly stretched, density-sliced, and color-coded.
In both cases, color prints are generated for manual interpretation. The criteria for visual interpretation include: (1) Location of center pivots using the map generated by the supervised-subtraction technique and (2) separation of crop type by color while referring to areas of ground truth.
The most successful technique used to determine crop type involved principal components. The analysis of the second principal component (fig. 3) and the simultaneous analysis of the first three principal spectral components (fig. 4) were used to correctly identify 10 1/2 or 91 percent of the corn fields irrigated by center pivots and 4 1/2 or 90 percent of the alfalfa fields irrigated by center pivots, and 15 or 79 percent of all the Landsat- mapped fields irrigated by center pivots in the test area (table 2).
Itlgupctvised f Then Sujjervised Techni.jue
The unsupervised, then supervised classification technique can be sum marized as follows:
1. Perform an unsupervised classification on May and August digital Landsat data; this enables the computer to statistically determine distinct spectral classes from the total data base.
2. Assign a crop type to each class by simultaneously programming the com puter using data subsets and referring to areas of ground truth.
3. Compute weighted-divergence statistics for each spectral class. Spectral classes that have small divergence values and are the same crop type can be combined. The combined spectral classes need to have been assigned to the same crop type by step 2.
4. Perform a maximum-likelihood classification of the entire study area, using the spectral statistics determined in steps 2 and 3.
5. If some crop types, like soybeans, are difficult to separate from other categories, remove the questionable classes from the main data base and recluster them using unsupervised-classification functions. The new classes need to be checked using ground information and then re-entered into the main data base.
6. If step 5 was necessary, repeat step 4.
11
98° 20' 98° 10'
44°30'
44"20'
Figure 3. Landsat subscene E-21298-16183 (August 12, 1978) that has been computer-processed using a principal-spectral-component analysis (second principal-spectral component is displayed) , linear-contrast-stretching, density-slicing, and color-coding technique to enhance crop types irrigated by center pivots.
12

98°,20 98°,10'
44°30'
44°20'
Figure 4. Landsat subscene E-21298-16183 (August 12, 1978) that has been computer-processed using a principal-spectral-component analysis (first three principal-spectral components displayed simultaneously) , linear-contrast- stretching, and color-coding technique to enhance crop types irrigated by center pivots.
13

7. Perform a smoothing function on the classified data to decrease the number of mixed-class pixels; assign a color to each smoothed class.
8. Print the classified image as a color-negative photograph.
9. Generate an enlarged color-positive print to be used for visual interpretation; determine irrigated crop types and acreages from this color print.
This technique produced generally inadequate results (14 1/2 center pivots or 76-percent accuracy). Wheat, soybeans, milo, and hay were either misclas- sified (as corn or alfalfa) or unidentified (table 2).
Supervised-Subtraction (Band 7 Minus Band 4) Technique
The supervised-subtraction (band 7 minus band 4) technique (International Imagery System, 1981) is as follows:
1. Subtract the visible (green) spectrum (band 4) from the infrared spectrum (band 7) on a pixel-by-pixel basis. The pixel that displays a positive reflectance difference will represent vegetated areas; these are the pixels that will be analyzed for crop-type information.
2. Perform a linear contrast-stretch on the resulting data base to enhance differences in vegetation types.
3. Level-slice (categorize all facets of the modified spectrum into groups) and color-code the results to further enhance vegetation types.
4. Generate a color print for manual interpretation; manual interpretation allows for a better discrimination of irrigated and non-irrigated vegeta tion types on the basis of color differences and circular field shape.
Although this technique was the best method for locating center pivots, only 14 1/4 or 75 percent of the center pivots were correctly identified by crop type (table 2). Corn was best mapped using this technique (about 93 per cent accuracy).
FaJ.se-cplor Infrared Supervised-Stretched Technique
The false-color infrared, supervised-stretched classification technique is as follows:
1. Generate a false-color infrared composite image using Landsat bands 4, 5, and 7. Visually interpret this image to see if further enhancement is necessary to identify crops. This step needs to be completed and the resulting image evaluated before any other enhancements or analysis tech niques are attempted; this simple technique is potentially the most cost- effective. If step 1 alone is inadequate, proceed with steps 2 through 4.
2. Assign a cover type to each crop class by simultaneously programming the computer using data subsets and referring to areas of ground truth.
14

3. Perform a maximum-likelihood classification of the entire study area, using the spectral statistics determined in step 2.
4. Print the classified image as a color-positive print to be used for visual interpretation. Circular shape and color discrimination are used as the basis for visual interpretation.
The results of this method were unacceptable (less than 80 percent accuracy). Steps 2 through 4 were necessary in order to increase the accuracy of visual interpretation. Only 13 or (68 percent) of the center pivots were correctly identified by crop type. In addition, wheat, soybeans, milo, and hay were misclassified (as corn or alfalfa) or unclassified.
Band 7/Band 5 Ratio-Cutoff Stretched Technique
The band 7/band 5 ratio-cutoff stretched technique can be summarized as follows:
1. Determine a band 7/band 5 ratio on the May and August digital Landsat data.
2. Apply a logarithmic stretch to the resulting image to increase contrast and enhance the desired features.
3. Interactively determine the specific ratioed pixel values (displayed as a histogram) that correspond to each crop type.
4. Print the logarithmically-stretched image as a color negative photograph (level slicing and color coding are used).
5. Generate an enlarged, color positive print for visual interpretation. Visually determine irrigated crop types and acreages from the prints.
This technique was least successful in identifying crop types (7 center pivots or 37 percent; table 2).
EVALUATION OF THE TECHNIQUES
The crops irrigated by center pivots as reported by the South Dakota Water Rights Commission (unpublished data, 1931-79) and Jones (1978) were compared to those determined from visual interpretation of the best computer-enhanced August Landsat subscenes (principal-components analyses) (table 3) . Only 15 or 39 percent of the reported number of center pivots were correctly identified. In general, none of the methods worked well in the test area.
Image processing and analysis of the June Landsat images for crop types irrigated by center-pivots resulted in a complete lack of success. Unlike the results of Kolm and Case (1984) in the High Plains of South Dakota, few fields irrigated by center pivots were identified, and crop-type discrimination (noteably wheat and alfalfa) was unsuccessful. The multitemporal approach was not workable in the James River basin. Consequently, crop-acreage and
15

Table 3. Number and percentage of center pivots correctly identified by crop type using principal-components analysis of computer-enhanced Landsat subscene (August 12 f 1978) compared to reported data.
Croptype
Corn
Alfalfa
Wheat
Soybeans
Milo
Hay
Total
,Reportednumber ofcenterpivots
19 1/2
10
5 1/4
1 1/4
1
1
38
Numberpivots
of centercorrectly
identified Principal-componentsanalysis(second
principalcomponent
only)
10 1/2
4 1/2
0
0
0
0
15
Principal-componentsanalysis
(first threeprincipalcomponents)
10 1/2
4 1/2
0
0
0
0
15
Percentage of centerpivots correctly
identified Principal-componentsanalysis(second
principalcomponent
only)
54
45
0
0
0
0
39
Principal-componentsanalysis
(first threeprincipalcomponents)
54
45
0
0
0
0
39
South Dakota Water Rights Commission (unpublished data, 1931-79); Jones (1978)
16

consumptive-use estimates could not be made for the James River basin using the methods described here.
Crop calendar, crop diversity, field size irrigated by center pivots, soil type and moisture, climate, and farming practices are some of the vari ables that may have affected the results of this study. A brief comparison between two different study sites, the High Plains in south-central South Dakota and the James River basin near Huron, South Dakota, demonstrates that a series of methods that are proven to be successful in one location (Kolm and Case, 1984) may not be successful in a different area.
The High Plains area is semiarid; 38 to 43 cm is the normal annual precipitation recorded for the region (U.S. Department of Commerce, 1977). Due to this aridity, nonirrigated farming is restricted mostly to wheat, and vast acreages are used for grazing or rangeland. Rangeland and dryland wheat production are easily separated from irrigated land (Kolm and Case, 1984). By comparison, the James River basin is subhumid; 48 to 51 cm of annual precipitation is normal (U.S. Department of Commerce, 1977) . As a result, most farming traditionally has been dryland and crop diversity is considerably greater (corn, alfalfa, soybeans, wheat, milo, barley, and others). The separation of irrigated and nonirrigated cropland, and the identification of crop type using remote-sensing techniques is, therefore, more difficult.
The soils in the High Plains and James River basin vary in temperature and moisture properties. The soils of the South Dakota High Plains generally are sandy, sandy loam, or loam (Kolm and Case, 1983); the soils tend to be well drained and warm. As a result, irrigated crops that begin to grow early in the spring, such as alfalfa, will appear vigorous as early as mid-to-late May. These crops can be easily identified and mapped using Landsat imagery (Kolm and Case, 1984). By comparison, the soils of the James River basin generally are alluvial or fluvial-glacial materials derived from fine-grained sedimen tary rocks; these predominately clay soils tend to be poorly drained and cold (Heil, 1979). As a result, irrigated spring crops will appear vigorous later in the growing season (early-to-mid-June) and will not be separated easily, using Landsat imagery, from the nearby, nonirrigated crops which also will ap pear vigorous during early June.
Farming practices are different in the two areas. Farmers (or ranchers) in the High Plains usually plant an irrigated field with a single crop. The circular field, typically about 57 ha, is planted entirely at the beginning of the growing season. These irrigated, circular fields are easily identified as to crop type, and acreages are easily determined by histogram count or by planimeter measurement from Landsat imagery (Kolm and Case, 1984). By com parison, farmers in the James River basin usually plant an irrigated field with two or three different crops; frequently the planting of each crop will be at different times. As a result, land irrigated by center pivots may not look circular in shape, and parts of various fields planted with a specific crop may be too small to resolve accurately. In addition, the sizes of fields irrigated by center pivots may vary considerably from 48 to 65 ha (South Dakota Water Rights Commission, unpublished data, 1931-79); and, commonly, many parts of the circular areas are left implanted. Due to these factors, identifying crop types and estimating crop acreages from Landsat imagery are very difficult in the James River basin.
17

SUMMARY AND CONCLUSIONS
In summary, determining crop type and crop acreages in the James River basin was less than satisfactory. Previously developed techniques of Kolm and Case (1984) were tested and new techniques, including principal-components analyses, supervised subtraction, and false-color infrared, supervised stretched were evaluated.
The supervised-subtraction (band 7 minus band 4) technique was best for identifying the location of land irrigated by center pivots; the August image provided the maximum information. By comparison, land irrigated by center pivots was almost completely indistinguishable on May and June Landsat imagery. Using the supervised-subtraction technique on August imagery, about 50 percent of those lands irrigated by center pivots was identified.
Principal-components analyses (analysis of the second principal component and the simultaneous analysis of the first three principal components) were most successful in identifying irrigated crop types (about 79-percent accuracy) . Two other techniques: unsupervised, then supervised classifica tion and supervised subtraction also were used to identify irrigated crop types to within 76-percent and 75-percent accuracy, respectively. None of the methods used could accurately separate wheat, soybeans, milo, and hay, from corn and alfalfa. Furthermore, the processing and analysis of May and June Landsat data was totally unsuccessful. A comparison between interpreted and total (1978 reported) center pivots correctly identified by crop type had an accuracy of 39 percent.
A comparison of two different study areas, the High Plains of south- central South Dakota and the James River basin near Huron, South Dakota, shows that crop calendar, crop diversity, field size irrigated by center pivots, soil type and moisture, climate, and farming practices may affect the ap plicability of remote-sensing methods to irrigated-crop studies. The use of computer-processed Landsat data to identify irrigated crop types and estimate crop acreage was most successful in the semiarid High Plains where crop diver sity is minimal, dryland crop production is minimal, soils are warm and well drained, crop calendars are more diverse temporally, and fields are planted entirely and with one crop type. For the opposite reasons, using computer- processed Landsat data to identify irrigated crop type and estimate crop acreage in the more humid James River basin was least successful. As a result, consumptive use of ground water can be better estimated for subhumid and humid areas using other techniques. Applying remote-sensing techniques appears better suited for semiarid and arid lands.
18

REFERENCES CITED
Bauer, M. E., Hixson, M. M., Davis, B. J., and Etheridge, J. B., 1978, Areaestimation of crops by digital analysis of Landsat data: PhotogrammetricEngineering and Remote Sensing, v. XLIV, no. 8. p. 1033-1043.
Bauer, M. E., Cipra, J. E., Anuta, P. E., and Etheridge, J. B., 1979, Identification and area estimation of agricultural crops by computer clas sification of Landsat MMS data: Remote Sensing of Environment, v. 8, no. 1, p. 77-92.
Blaney, H. F., and Griddle, W. D., 1962, Determining consumptive use and ir rigation water requirement: U.S. Agricultural Research Service Technical Bulletin 1275, 59 p.
Draeger, W. C., 1977, Monitoring irrigated land acreage using Landsat imagery- -An application example, in Proceedings of the eleventh international symposium on remote sensing of environment: Ann Arbor, Michigan, Environmental Research Institute of Michigan, p. 515-524.
___1979, Monitoring irrigated land acreage in the Klamath River basin of Oregon using Landsat imagery, in Proceedings of identifying irrigated lands using remote sensing techniques State-of-the-art symposium: Sioux Falls, South Dakota, U.S. Geological Survey-ERDS Data Center, p. 64-70.
Driscoll, R. S., and Francis, R. E., 1970, Multistage, multiseasonal, and mul- tiband imagery to identify and quantify non-forest vegetation resources: Annual Progress Report for Earth Resources, Survey Progress OSSA/NASA, 34 P-
Eucker, C. C., Hoffman, R. 0., Edwards, D. M., and Wallin, G. P., 1974, Application of remote sensing to crop identification and water use, in Proceedings of the international seminar and exposition on water resources instrumentation, Volume 1 Measurement and sensing methods: Chicago, Illinois, International Water Resources Association, p. 303-311.
Flint, R. F., 1955, Pleistocene geology of eastern South Dakota: U.S. Geological Survey Professional Paper 262, 173 p.
Heil, D. N., 1979, Soils survey of Beadle County, South Dakota: U.S. Department of Agriculture, Soil Conversation Service, 169 p.
Heimes, F. J., and Thelin, G. P., 1979, Development and application of Landsat-derived irrigation cropland maps for water-use determination in the High Plains, in Proceedings of identifying irrigated lands using remote sensing techniques State-of-the-art symposium: Sioux Falls, South Dakota, U.S. Geological Survey-EROS Data Center, p. 76-77.
Hoffman, R. 0., 1979, Identifying and locating land irrigated by center-pivot irrigation systems using satellite imagery, in Proceedings of identifying irrigated lands using remote sensing techniques State-of-the-art symposium: Sioux Falls, South Dakota, U.S. Geological Survey-ERDS Data Center, p. 31-36.
19

Hoffman, R. 0., Edwards, D. M., Wallin, G., and Burton, T., 1974, Remote sens ing instrumentation and methods used for identifying center pivot sprinkler irrigation systems and estimated crop water use, in Proceedings of the international seminar and exposition on water resources instrumen tation, Volume 1 Measurement and sensing methods: Chicago, Illinois, International Water Resources Association, p. 312-317.
International Imaging Systems, 1981, User's manual, system 500, digital image processing system (version 2.3): Milpitas, California, 192 p. plus appendices.
Johannsen, C. J., and Sanders, J. L., 1982, Remote sensing for resource management: Ankeny, Iowa, Soil Conservation Society of America, p. 105- 106.
Johnson, G. E., and Loveland, T. R., 1979, The Columbia River and tributaries irrigation withdrawals analysis project Feasibility analysis and future plans, in Proceedings of identifying irrigated lands using remote sensing techniques State-of-the-art symposium: Sioux Falls, South Dakota, U.S. Geological Survey-EROS Data Center, p. 37-47.
Jones, B. F., 1978, Surface and ground water sources and irrigation develop ment map: South Dakota Water Rights Commission, scale 1:127,000, 1 sheet.
Kolm, K. E., and Case, III, H. L., 1983, A two-dimensional, finite-difference model of the High Plains aquifer in southern South Dakota: U.S. Geological Survey Water-Resources Investigations Report 83-4175, 34 p.
Kolm, K. E., and Case, III, H. L., 1984, The identification of irrigated crop types and estimation of acreages from Landsat imagery: Photogrammetric Engineering and Remote Sensing, v. 50, no. 10, p. 1479-1490.
Phillips, T. L., ed., 1973, LARSYS user's manual: West Lafayette, Indiana, Purdue University, Laboratory for Applications of Remote Sensing, 958 p.
Poracsky, J., and Williams, T. H., 1979, Irrigation mapping in western Kansas using Landsat Part I, Key parameters; Part II, Practices and problems, in Proceedings of identifying irrigated lands using remote sensing techniques State-of-the-art symposium: Sioux Falls, South Dakota, U.S. Geological Survey-EROS Data Center, p. 48-63.
Swain, P. H., 1972, Pattern recognition A basis for remote sensing data analysis: West Lafayette, Indiana, Purdue University, Laboratory for Applications of Remote Sensing, Information Note 111572, 41 p.
Thelin, G. P., Johnson, T. L., and Johnson, R. A., 1981, Mapping irrigated cropland on the High Plains using Landsat, in. Deutsch, Morris, Wiesnet D. R., and Rango, Albert, eds., Satellite hydrology, Proceedings of the fifth annual William T. Pecora memorial symposium on remote sensing: Minneapolis, Minnesota, American Water Resources Association, p. 715-722.
U.S. Department of Agriculture, 1967, Irrigation water requirements: Soil Conservation Service, Engineering Division, Technical Release 21, 88 p.
20

_1976, Crop consumptive irrigation requirements and irrigation efficiency coefficients for the United States: Soil Conservation Service, Special Projects Division, 117 p.
.978, Irrigation guide for South Dakota: Conservation Service, 113 p.
Huron, South Dakota, Soil
U. S. Department of Commerce, 1977, Climatic atlas of the United States: Environmental Science Services Administration, 80 p.
Wall, S. L., 1979, California's irrigated lands Landsat-based estimation and mapping, in Proceedings of identifying irrigated lands using remote sens ing techniques State-of-the-art symposium: Sioux Falls, South Dakota, U.S. Geological Survey-EROS Data Center, p. 71-75.
21

SUPPLEMENTAL INFORMATION
Visual Interpretation
Visual interpretation, generally defined for this study, is the iden tification of surficial features from photographs and the determination of their meaning or significance. Surficial features are identified from photographs by characteristic clues, such as shape, size, tone, pattern, shadow, and texture. The combination of the human eye and the brain allow the integration of the above clues for interpretation of features. Both subjec tive judgments and deductive reasoning are used by the experienced photointerpreter in the interpretation process. The primary advantage of photographic interpretation techniques is that they do not require the use of computer systems to complete an analysis. The equipment required can be as little as a photograph and an individual with experience in interpretation techniques. Therefore, materials required for this approach generally are considerably less costly than those required for digital analysis of images.
Digital-Analysis Techniques and Equipment
Digital-data processing, as applied in this study, refers to computer processing and classification of digitally formated images. Advantages and disadvantages of using this approach are listed below.
Advantages:
1. When the images are in digital form, large volumes of data can be processed and classified more easily and rapidly than can be classified by photographic-interpretation techniques.
2. A digital format is easily adaptable to transformations that may enhance the original image for specific applications.
3. A digital format readily allows overlay and registration of diverse data types for example, maps superimposed on images or overlay of images from the same location but for different dates.
4. Digital analysis facilitates the establishment and location of sampling units and the statistical analysis of both original and classified data. It also allows rapid computation and display of areal extent of data classes.
5. Digital data can be produced in a variety of formats and scales.
Disadvantages:
1. Computer-compatible digital tapes of images generally are more expensive than photographic renditions.
22

2. Analysis requires access to a computer system suitable for digital processing.
3. Digital-image processing generally cannot compare to the human eye and brain for integration of spectral and spatial characteristics contained in an image. Therefore, classification of data by most digital-image- processing systems uses only spectral information. This disadvantage is lessened somewhat when an interactive image-processing system with a color-display monitor is used so that photographic-interpretation tech niques can be incorporated with digital processing.
Two basic types of classification functions were used in digital analysis of data for this study supervised and unsupervised. The supervised clas sification technique has two options use of a maximum-likelihood classifier or the parallelepiped-decision function without the maximum-likelihood classifier. The unsupervised (clustering) technique used in this study divides the pixels (picture elements) contained in a defined area into a preselected number of spectral classes. Pixels are separated into the desired number of groups (classes) based solely on the spectral distribution within the data set. Data with similar spectral responses or spectral signatures are clustered together in groups. These spectral groups are not necessarily rep resentative of resource classes being mapped, but they do ideally represent the spectral variability within the defined area of the image.
Supervised-classification techniques use training sets to define the spectral signatures of a group or class. A group of pixels (area on the image) which is considered to be representative of a class (for example, a land-use type) is selected as a training set. The range and distribution of pixel values for a given training set define the spectral signature of the class that the pixels represent. In the classification process, each pixel of interest is evaluated and then grouped into the class which has the same or a similar spectral signature, as defined by the training set representing the class.
The parallelepiped-decision function is included in some image-processing systems, thus allowing extremely fast classification. This decision function calculates the minimum and maximum pixel values in each spectral band for the pixels contained in a given training set. Using this function, a given pixel is assigned to the class represented by a training set if the pixel value for each of the spectral bands falls within the minimum and maximum values calcu lated for that training set. The design of this function may result in some pixels not being classified because they do not fit the range of values for any of the training sets. Conversely, if a given pixel value meets the criteria defined by more than one training set, it will be included in more than one class.
Maximum-likelihood classifiers provide one solution to the problem of overlap or exclusion of pixels resulting from the use of the parallelepiped- decision function. The maximum-likelihood technique uses the same approach as the parallelepiped-decision function for selecting training sets to define the spectral characteristics of selected classes. However, using the maximum- likelihood classifier if a pixel to be classified does not fit directly into one class, or if it fits more than one class, the classifier assigns the pixel to the single class to which it has the greatest probability of belonging.
23

The probabilities are calculated by comparing the mean, variance, and covariance between spectral bands for each class (training set) with the value of the pixel to be classified. Maximum-likelihood classifiers require more processing time than the parallelepiped-decision function, but they generally provide more accurate results for a detailed classification.
24