Embed Size (px)
Citation preview
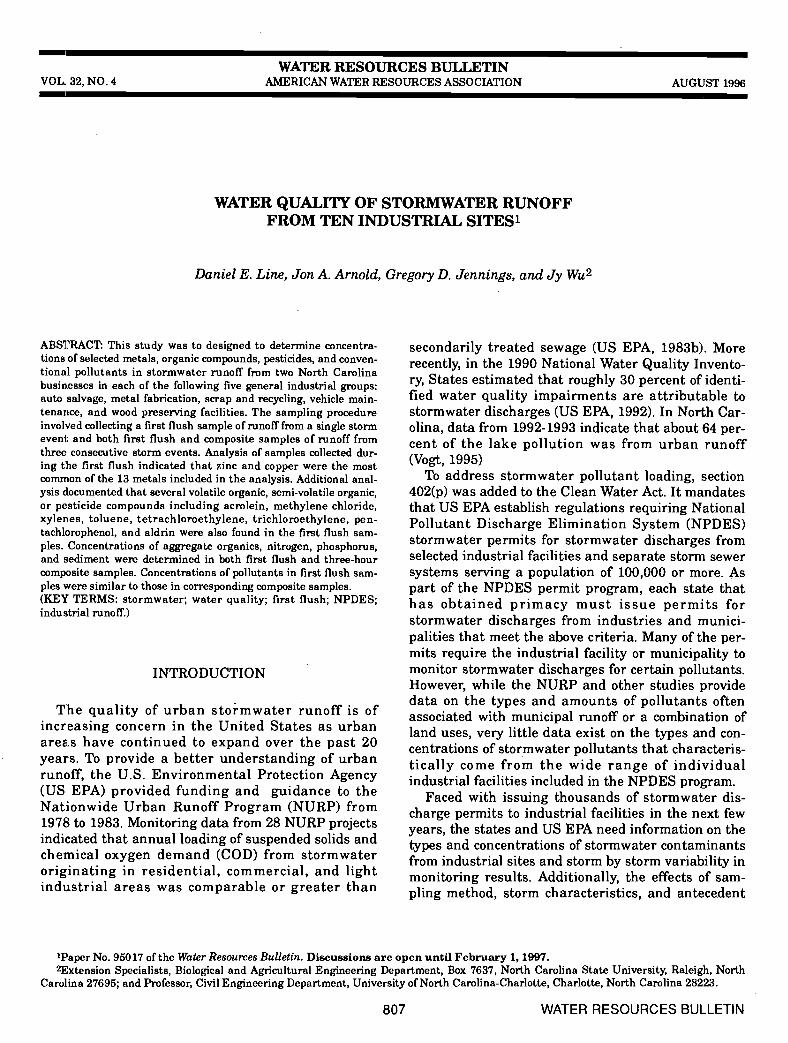
WATER RESOURCES BULLETINVOL. 32, NO.4 AMERICAN WATER RESOURCES ASSOCIATION AUGUST 1996
WATER QUALITY OF STORMWATER RUNOFFFROM TEN INDUSTRIAL SITES'
Daniel E. Line, Jon A. Arnold, Gregory D. Jennings, and Jy Wu2
ABSTRACT: This study was to designed to determine concentra-tions of selected metals, organic compounds, pesticides, and conven-tional pollutants in stormwater runoff from two North Carolinabusinesses in each of the following five general industrial groups:auto salvage, metal fabrication, scrap and recycling, vehicle main-tenance, and wood preserving facilities. The sampling procedureinvolved collecting a first flush sample of runoff from a single stormevent and both first flush and composite samples of runoff fromthree consecutive storm events. Analysis of samples collected dur-ing the first flush indicated that zinc and copper were the mostcommon of the 13 metals included in the analysis. Additional anal-ysis documented that several volatile organic, semi-volatile organic,or pesticide compounds including acrolein, methylene chloride,xylenes, toluene, tetrachioroethylene, trichloroethylene, pen-tachlorophenol, and aldrin were also found in the first flush sam-ples. Concentrations of aggregate organics, nitrogen, phosphorus,and sediment were determined in both first flush and three-hourcomposite samples. Concentrations of pollutants in first flush sam-ples were similar to those in corresponding composite samples.(KEY TERMS: stormwater; water quality; first flush; NPDES;industrial runoff.)
INTRODUCTION
The quality of urban stormwater runoff is ofincreasing concern in the United States as urbanareas have continued to expand over the past 20years. To provide a better understanding of urbanrunoff, the U.S. Environmental Protection Agency(US EPA) provided funding and guidance to theNationwide Urban Runoff Program (NURP) from1978 to 1983. Monitoring data from 28 NURP projectsindicated that annual loading of suspended solids andchemical oxygen demand (COD) from stormwateroriginating in residential, commercial, and lightindustrial areas was comparable or greater than
secondarily treated sewage (US EPA, 1983b). Morerecently, in the 1990 National Water Quality Invento-ry, States estimated that roughly 30 percent of identi-fied water quality impairments are attributable tostormwater discharges (US EPA, 1992). In North Car-olina, data from 1992-1993 indicate that about 64 per-cent of the lake pollution was from urban runoff(Vogt, 1995)
To address stormwater pollutant loading, section402(p) was added to the Clean Water Act. It mandatesthat US EPA establish regulations requiring NationalPollutant Discharge Elimination System (NPDES)stormwater permits for stormwater discharges fromselected industrial facilities and separate storm sewersystems serving a population of 100,000 or more. Aspart of the NPDES permit program, each state thathas obtained primacy must issue permits forstormwater discharges from industries and munici-palities that meet the above criteria. Many of the per-mits require the industrial facility or municipality tomonitor stormwater discharges for certain pollutants.However, while the NURP and other studies providedata on the types and amounts of pollutants oftenassociated with municipal runoff or a combination ofland uses, very little data exist on the types and con-centrations of stormwater pollutants that characteris-tically come from the wide range of individualindustrial facilities included in the NPDES program.
Faced with issuing thousands of stormwater dis-charge permits to industrial facilities in the next fewyears, the states and US EPA need information on thetypes and concentrations of stormwater contaminantsfrom industrial sites and storm by storm variability inmonitoring results. Additionally, the effects of sam-pling method, storm characteristics, and antecedent
1Paper No. 95017 of the Water Resources Bulletin. Discussions are open until February 1, 1997.2Extension Specialists, Biological and Agricultural Engineering Department, Box 7637, North Carolina State University, Raleigh, North
Carolina 27695; and Professor, Civil Engineering Department, University of North Carolina-Charlotte, Charlotte, North Carolina 28223.
807 WATER RESOURCES BULLETIN
Line, Arnold, Jennings, and Wu
dry period on monitoring re suits should be investigat-ed to facilitate interpretation of permit samplingdata. Results of this study will provide some of thebackground data on types and relative concentrationsof contaminants needed in issuing permits forstormwater discharges from individual industrialsites. These data may also serve as a comparison tosampling results submitted by industries as part oftheir stormwater permit requirements.
METHODS
Five groups representi:ng common industries inNorth Carolina — auto salvage (ÀY), metal fabrication(MF), scrap and recycling (SR), vehicle maintenance(VM), and wood preserving (WP) — were chosen forthis study. After obtaining permission from theresponsible parties, two businesses from each of thefive groups were selected for inclusion in this study.Selection criteria included willingness to participate,representativeness of the plant/site for the industrialgroup, availability of suitable sampling locations, andhydrology of the site. While the two sites in eachindustrial group were generally similar in their activ-ities, replication was not a criterion.
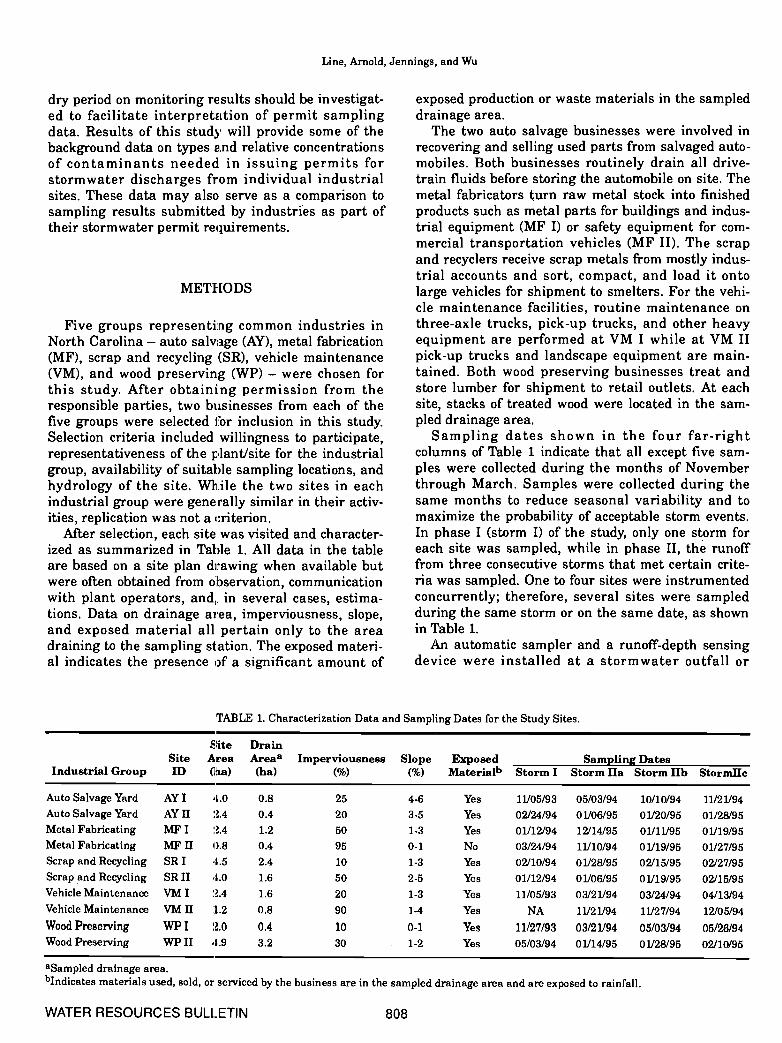
After selection, each site was visited and character-ized as summarized in Table 1. All data in the tableare based on a site plan drawing when available butwere often obtained from observation, communicationwith plant operators, and,, in several cases, estima-tions. Data on drainage area, imperviousness, slope,and exposed material all pertain only to the areadraining to the sampling station. The exposed materi-al indicates the presence of a significant amount of
exposed production or waste materials in the sampleddrainage area.
The two auto salvage businesses were involved inrecovering and selling used parts from salvaged auto-mobiles. Both businesses routinely drain all drive-train fluids before storing the automobile on site. Themetal fabricators turn raw metal stock into finishedproducts such as metal parts for buildings and indus-trial equipment (MF I) or safety equipment for com-mercial transportation vehicles (MF II). The scrapand recyclers receive scrap metals from mostly indus-trial accounts and sort, compact, and load it ontolarge vehicles for shipment to smelters. For the vehi-cle maintenance facilities, routine maintenance onthree-axle trucks, pick-up trucks, and other heavyequipment are performed at VM I while at VM IIpick-up trucks and landscape equipment are main-tained. Both wood preserving businesses treat andstore lumber for shipment to retail outlets. At eachsite, stacks of treated wood were located in the sam-pled drainage area.
Sampling dates shown in the four far-rightcolumns of Table 1 indicate that all except five sam-ples were collected during the months of Novemberthrough March. Samples were collected during thesame months to reduce seasonal variability and tomaximize the probability of acceptable storm events.In phase I (storm I) of the study, only one storm foreach site was sampled, while in phase II, the runofffrom three consecutive storms that met certain crite-ria was sampled. One to four sites were instrumentedconcurrently; therefore, several sites were sampledduring the same storm or on the same date, as shownin Table 1.
An automatic sampler and a runoff-depth sensingdevice were installed at a stormwater outfall or
TABLE 1. Characterization Data and Sampling Dates for the Study Sites.
Industrial GroupSiteID
SiteArea(ha)
DramAreaa(ha)
Imperviousness(%)
Slope(%)
ExposedMaterialb
Sampling DatesStorm I Storm ila Storm lIb Stormllc
Auto Salvage Yard AY I 4.0 0.8 25 4-6 Yes 11105/93 05/03/94 10/10/94 11/21194Auto Salvage Yard AY II 2.4 0.4 20 3-5 Yes 02/24/94 01106/95 01120/95 01/28/95Metal Fabricating MF I 2.4 1.2 50 1-3 Yes 01/12/94 12114/95 01/11195 01/19/95Metal Fabricating MF II 0.8 0.4 95 0-1 No 03/24/94 11)10/94 01)19/95 01/27/95Scrap and Recycling SR I 4.5 2.4 10 1-3 Yes 02/10/94 01128/95 02/15/95 02/27/95
Scrap and Recycling SR II 4.0 1.6 50 2-5 Yes 0 1/12/94 0 1106/95 0 1119/95 02/15/95Vehicle Maintenance VM I 2.4 1.6 20 1-3 Yes 11/05/93 03/21)94 03/24/94 04/13/94Vehicle Maintenance VM II :L.2 0.8 90 1-4 Yes NA 1112 1/94 11./27/94 12/05/94
Wood Preserving WP I 2.0 0.4 10 0-1 Yes 11/27/93 03/21194 05/03/94 05/26/94Wood Preserving WP II 4.9 3.2 30 1-2 Yes 05/03/94 01114/95 01128/95 02110/95
aSampled drainage area.blndjcates materials used, sold, or serviced by the business are in the sampled drainage area and are exposed to rainfall.
WATER RESOURCES BULLETIN 808
Water Quality of Stormwater Runoff from Ten Industrial Sites
conveyance channel on each site. When sites hadmore than one outfall, the sampling station was locat-ed so that activities most representative of the busi-ness occurred within the sampled drainage area, ifpossible. Sampling locations were always upslope ofstormwater best management practices or measures.The sampler was programmed to collect a grab sam-ple within 30 minutes after being actuated by a flowmeter or flow actuator and a three-hour time compos-ite runoff sample. The first flush grab and three-hourcomposite samples are similar to sampling require-ments for many NPDES stormwater permit applica-tions. When possible, manual grab and compositesamples were collected in place of, or in addition to,the automatic samples; however, because of theunpredictability of runoff, only VM I, storm I wassampled totally by hand.
Only first flush and composite samples collectedfrom storm events that met the US EPA, NPDESstormwater permit sampling criterion of rainfall accu-mulation greater than 2.54 mm after a 72-hour dryperiod were analyzed. When feasible, events with aduration and depth of rainfall plus or minus 50 per-cent of the mid-Atlantic rain zone's average accumu-lation (16.3 mm) and duration (10.1 hours) weresampled (US EPA, 1992). Because several relativelypervious sites in this study required more than plus50 percent of the average rainfall accumulation toproduce enough runoff to sample, storms producingmore rainfall were sampled. These storms were oftenlonger in duration than the average storm, but sincethey were of moderate intensity, their duration shouldnot significantly effect the results.
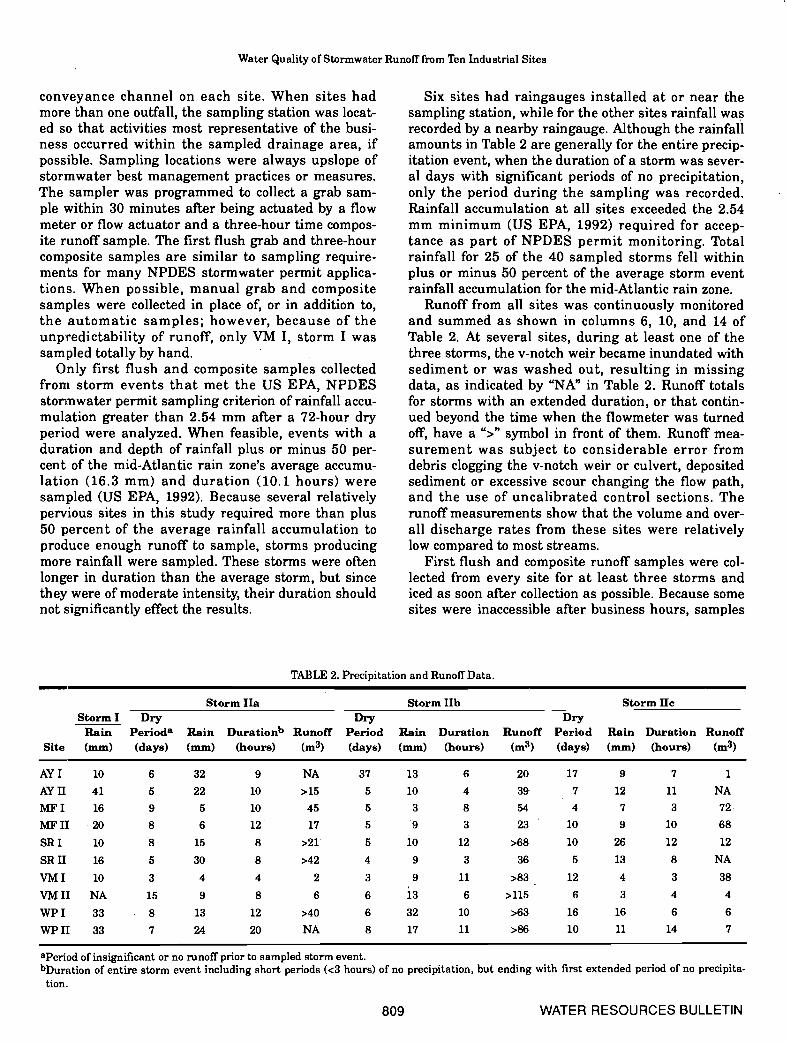
Six sites had raingauges installed at or near thesampling station, while for the other sites rainfall wasrecorded by a nearby raingauge. Although the rainfallamounts in Table 2 are generally for the entire precip-itation event, when the duration of a storm was sever-al days with significant periods of no precipitation,only the period during the sampling was recorded.Rainfall accumulation at all sites exceeded the 2.54mm minimum (US EPA, 1992) required for accep-tance as part of NPDES permit monitoring. Totalrainfall for 25 of the 40 sampled storms fell withinplus or minus 50 percent of the average storm eventrainfall accumulation for the mid-Atlantic rain zone.
Runoff from all sites was continuously monitoredand summed as shown in columns 6, 10, and 14 ofTable 2. At several sites, during at least one of thethree storms, the v-notch weir became inundated withsediment or was washed out, resulting in missingdata, as indicated by "NA" in Table 2. Runoff totalsfor storms with an extended duration, or that contin-ued beyond the time when the fiowmeter was turnedoff, have a ">" symbol in front of them. Runoff mea-surement was subject to considerable error fromdebris clogging the v-notch weir or culvert, depositedsediment or excessive scour changing the flow path,and the use of uncalibrated control sections. Therunoff measurements show that the volume and over-all discharge rates from these sites were relativelylow compared to most streams.
First flush and composite runoff samples were col-lected from every site for at least three storms andiced as soon after collection as possible. Because somesites were inaccessible after business hours, samples
TABLE 2. Precipitation and Runoff Data.
Storm ha StormhIb Storm UcStorm I Dry Dry DryRain Periods Rain Durationb Runoff Period Rain Duration Runoff Period Rain Duration Runoff
Site (mm) (days) (mm) (hours) (m3) (days) (mm) (hours) (m3) (days) (mm) (hours) (m3)
AYI 10 6 32 9 NA 37 13 6 20 17 9 7 1AYII 41 5 22 10 >15 5 10 4 39 7 12 11 NA
MFI 16 9 5 10 45 5 3 8 54 4 7 3 72MPh 20 8 6 12 17 5 9 3 23 10 9 10 68
SRI 10 8 15 8 >21 5 10 12 >68 10 26 12 12
SR II 16 5 30 8 >42 4 9 3 36 5 13 8 NA
VM I 10 3 4 4 2 3 9 11 >83 12 4 3 38
VMII NA 15 9 8 6 6 13 6 >115 6 3 4 4
WPI 33 8 13 12 >40 6 32 10 >63 16 16 6 6
wpri: 33 7 24 20 NA 8 17 11 >86 10 11 14 7
apenod of insignificant or no runoff prior to sampled storm event.bDuration of entire storm event including short periods (<3 hours) of no precipitation, but ending with first extended period of no precipita-tion.
809 WATER RESOURCES BULLETIN
Line, Arnold, Jennings, and Wu
remained in the sampler for several hours beforebeing iced; however, since most of the sampling wasconducted during the winte:r months, samples remain-ing in the sampler until being picked up the followingmorning were cooled by the surrounding air. Sampleswere then transported to a U.S. EPA certified labora-tory on ice and preserved and analyzed using stan-dard, U.S. EPA-approved procedures for stormwateranalysis (40 CFR, Part 136; U.S. EPA, 1983a; APHAet al., 1989). Samples were analyzed for many of theconventional pollutants and all but two (p-Chloro-M-Cresol and 1,2-Diphenylhydrazine) of the 112 toxicpollutants listed in the NPDES stormwater samplingguidance document (U.S. EPA, 1992). Most samplescollected during phase Ii[ were also analyzed formethyl tertiary butyl ether (MTBE). Laboratory anal-ysis reproducibility and accuracy exceeded the USEPA method requirements for all analytes. Theserequirements are specific to each parameter and weredocumented for each sample (Line et al., 1995).
The use of automatic samplers may have had someeffect on the water quality data. At least part of thetotal sample(s) was collected by automatic samplersat all sites and storms except the second storm at VMI, which was sampled manually. Collecting samples innatural channels and ditches during low flow is diffi-cult because runoff is oftei.i not deep enough to sub-merge the one-inch diameter sampler intake;therefore, it was often necessary to obstruct the flow.However, if relatively high flows occur, the water ismuch deeper than the sampler intake and pollutantssuch as oil and grease that tend to be transportednear the air water interface may not be collected inrepresentative amounts. Also, channel obstructionssuch as weirs tend to cau;e excess sediment deposi-tion. This was particularly the case at sites with erod-ing ditches and land such as JY I, JY II, WP II, andSR II. At these sites, it was; almost impossible to mea-sure discharge or guarantee a first flush sample with-out obstructing the flov. With the obstructioninstalled, excess sediment deposition at the samplerintake was observed. The channel obstruction is alsonecessary for manual sampling because it is difficultto fill a sampling container in natural ditches withoutdisturbing the channel bed. In addition, other sourcesof variability such as vaporization of volatile organicsfrom the open sampler containers before the samplewas put into sealed contaiiners were possible. Theseconditions were minimized by temporarily alteringthe sampled channel, programming the sampler tobegin at the minimum depth, and capping the sam-pler jars as soon as possible.
To investigate the possibility of cross-contamina-tion between sites, distilled water was obtained andpumped through the sampler into a set of 12clean sample jars. These sampler blanks were then
WATER RESOURCES BULLETIN 810
prepared and delivered to the lab for analysis. Analy-sis of the blanks did not include pesticides and PCBsbecause these compounds were not detected in any ofthe samples collected during phase II sampling. Thefirst blank, collected after completing sampling of VMII, contained detectable concentrations of only totalphosphorus (0.06 mg/I) and filterable residue (13mg/i), which resulted from a small amount of floatingorganic matter that washed off the sampler intakestrainer. The intake strainer was rinsed before instal-lation at the next site. The second blank, obtainedfrom another sampler after completing SR I, con-tained no detectable levels of any compound in the listof analytes. These blanks indicated that cross-con-tamination between sites as well as contaminationdue to inadequate cleaning, handling, and transporta-tion was negligible.
RESULTS AND DISCUSSION
As stated previously, all sampling stations werelocated upstream of stormwater best managementpractices or measures; therefore, the results reflectthe quality of runoff directly from the pollutantsources. Several sites, including SR I and SR II, hadwet detention ponds constructed on the site down-stream of the sampling point. Also, at most sites theworst-looking of all outfalls was sampled. Theseobservations are included to emphasize that most ofthe businesses in this study are concerned about thequality of runoff and have taken steps to reduce pollu-tant export, a fact that is often not reflected in thedata presented in this paper.
Concentrations of Metals
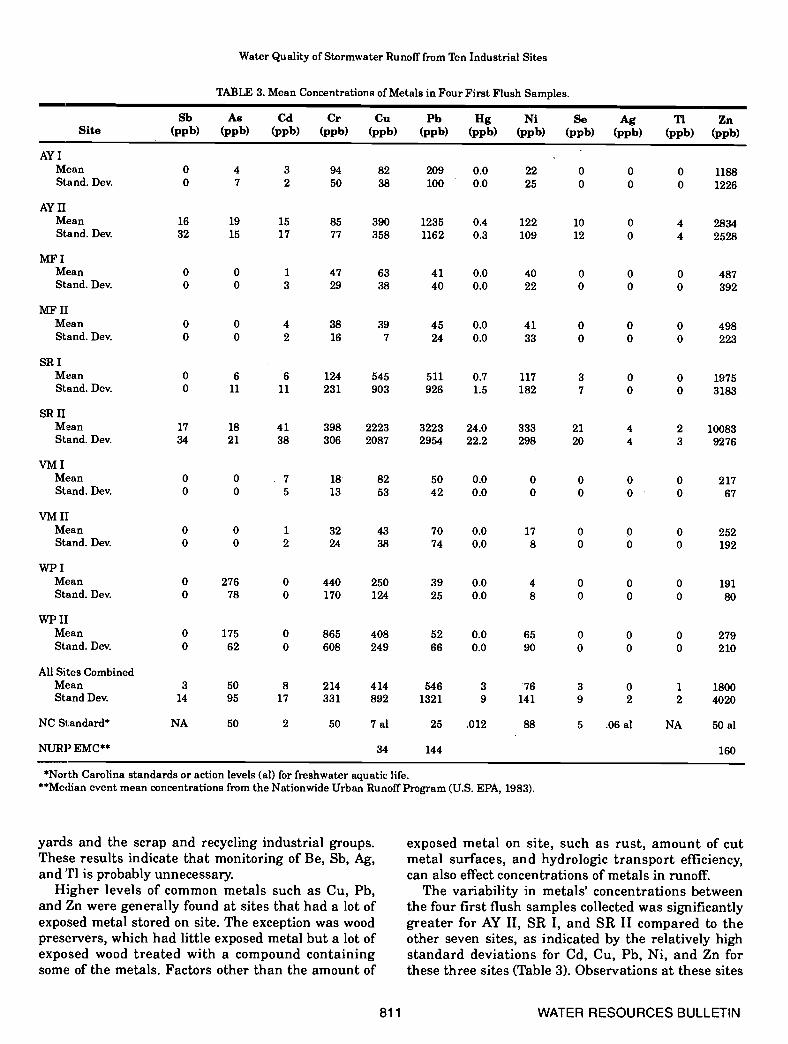
Mean concentrations of the metals antimony (Sb),arsenic (As), cadmium (Cd), chromium (Cr), copper(Cu), lead (Pb), mercury (Hg), nickel (Ni), selenium(Se), silver (Ag), thallium (TI), and zinc (Zn) found inthe four first flush runoff samples collected from eachof the 10 study sites are shown in Table 3. Sampleswere also analyzed for beryllium (Be), but none wasfound. All analyses were for total metals concentra-tions. Zn and Cu were the most prevalent, beingfound in the runoff from every site for every stormsampled, while Ag was the least prevalent. Concen-trations of Zn in the runoff were greater than theother 12 metals for every industrial group exceptwood preservers, for which Cr concentrations weregreatest. Relatively rare metals, including Se, Ag, andTl, were found in runoff from only the auto salvage
Water Quality of Stormwater Runoff from Ten Industrial Sites
Sb As Cd Cr Cu Pb Hg Ni So Ag Ti ZnSite (ppb) (ppb) (ppb) (ppb) (ppb) (ppb) (ppb) (ppb) (ppb) (ppb) (ppb) (ppb)
AYI .
o 4 3 94 82 209 0.0 22 0 0 0 11880 7 2 50 38 100 0.0 25 0 0 0 1226
16 19 15 85 390 1235 0.4 122 10 0 4 283432 15 17 77 358 1162 0.3 109 12 0 4 2528
0 0 1 47 63 41 0.0 40 0 0 0 4870 0 3 29 38 40 0.0 22 0 0 0 392
0 0 4 38 39 45 0.0 41 0 0 0 4980 0 2 16 7 24 0.0 33 0 0 0 223
0 6 6 124 545 511 0.7 117 3 0 0 19750 11 11 231 903 926 1.5 182 7 0 0 3183
SR IIMeanStand. Dcv.
VMI
17 18 41 398 2223 3223 24.0 33334 21 38 306 2087 2954 22.2 298
21 4 2 1008320 4 3 9276
wP IIMeanStand. Dcv.
0 0 7 18 82 50 0.0 0 0 0 0 2170 0 5 13 53 42 0.0 0 0 0 0 67
0 0 1 32 43 70 0.0 17 0 0 0 2520 0 2 24 38 74 0.0 8 0 0 0 192
0 175 0 865 4080 62 0 608 249
39 0.0 4 0 0 0 19125 0.0 8 0 0 0 80
52 0.0 65 0 0 0 27966 0.0 90 0 0 0 210
All Sites CombinedMeanStand Dcv.
NC Standard*
3 50 8 214 414 546 3 76 3 0 1 180014 95 17 331 892 1321 9 141 9 2 2 4020
NA 50 2 50 7 al 25 .012 88 5 .06 al NA 50 a!
NURP EMC** 34 144
*North Carolina standards or action levels (al) for freshwater aquatic life.**Me(lian event mean concentrations from the Nationwide Urban Runoff Program (U.S. EPA, 1983).
yards and the scrap and recycling industrial groups.These results indicate that monitoring of Be, Sb, Ag,and TI is probably unnecessary.
Higher levels of common metals such as Cu, Pb,and Zn were generally found at sites that had a lot ofexposed metal stored on site. The exception was woodpreservers, which had little exposed metal but a lot ofexposed wood treated with a compound containingsome of the metals. Factors other than the amount of
exposed metal on site, such as rust, amount of cutmetal surfaces, and hydrologic transport efficiency,can also effect concentrations of metals in runoff.
The variability in metals' concentrations betweenthe four first flush samples collected was significantlygreater for AY II, SR I, and SR II compared to theother seven sites, as indicated by the relatively highstandard deviations for Cd, Cu, Pb, Ni, and Zn forthese three sites (Table 3). Observations at these sites
811 WATER RESOURCES BULLETIN
TABLE 3. Mean Concentrations of Metals in Four First Flush Samples.
MeanStand. Dev.
AY IIMeanStand. Dcv.
IvIFIMeanStand. Dev.
MFIIMeanStand. Dcv.
SR IMeanStand. Dcv.
MeanStand. Dcv.
VM I][MeanStand. Dcv.
WPIMeanStand. Dcv.
o 2760 78
0 440 2500 170 124
160
Line, Arnold, Jennings, and Wu
indicated that the large differences in metals' concen-trations were generally associated with increased sed-iment or particulate metals transported to anddeposited at the sampling point. For example, intenserainfall and the installation of a v-notch weir at AY IIfor the second and third st;orms sampled resulted inconsiderably more sediment observed in the samplesand significantly higher concentrations of metals ascompared to the other two storms. These data indi-cate that controlling sediment or particulate move-ment should control much of the metals in runoff.
A one-way classification analysis of variance(ANOV) was conducted for each of the seven mostcommon metals using the sites as treatments. Resultsshowed that for Cu, Pb, Zn, Ni, and Cd, only site SRII had concentrations significantly different from allother sites, according to the least significant differ-ence test (Steel and Torrie,, 1980) at the 0.05 level ofsignificance. For As and Cr, both WP I and WP IIwere significantly different from all other sites.Grouping the sites by industry type did not improvestatistical significance. ThEse results suggest that formost metals in runoff, the type of industry was notsignificant, the exceptions being As and Cr from woodpreservers.
Similar to the results of this study, Zn and Cu werealso found to be prevalent in NPDES permit samplingfrom textile and food sector facilities nationwide.Amick (1994) analyzed stormwater monitoring permitdata for more than 110 facilities in the textile andfood sectors and found that 38 and 31 percent of therunoff samples submitted by textile facilities con-tained Zn and Cu in concentrations greater than thedetection limit. Cr was als) prevalent, being detectedin 22 percent of the textile sector's samples reportedby Amick (1994) and 38 out of 40 samples collectedduring this study.
To lend additional perspective to the Cu, Pb, andZn data, consider that the median event mean concen-trations (EMC) for urban runoff in the NURP studywere 34, 144, and 160 ppb for Cu, Pb, and Zn, respec-tively (U.S. EPA, 1983b). Therefore, mean first flushconcentrations in runoff from all sites for Cu and Znand four sites for Pb were greater than EMCs for theNURP study sites. While first flush samples usuallyhave higher concentrations of contaminants thanEMCs, the NURP data provide a benchmark for sim-ple comparison purposes. Also, Makepeace et al.(1995) conducted an extensive review of internationalliterature on urban stormwater quality publishedduring the past 25 years and reported ranges of con-centrations documented by monitoring. Average con-centrations of two metals from two sites exceeded thereported ranges. These were the As concentrationfrom WP I, which exceeded the reported range of 1.0to 210 ppb and the Cu concentration from SR II,
WATER RESOURCES BULLETIN 812
which exceeded the range of 0.06 to 1410 ppb. Allother average metals concentrations were within theranges reported for urban stormwater.
Currently, no standards or action levels exist forstormwater runoff from industrial or urban area dueprimarily to the lack of reliable data; however, NorthCarolina has standards for receiving waters, as shownat the bottom of Table 3. Concentrations of metals inrunoff from individual sites exceeded many of thestate standards, and the mean for all sites exceededsix of the state standards. While the data indicatethat industrial sites are significant sources of metalsto surface waters, because the drainage areas of thesites were relatively small, the mass loadings of met-als are generally relatively low.
Concentrations of Conventional Pollutants
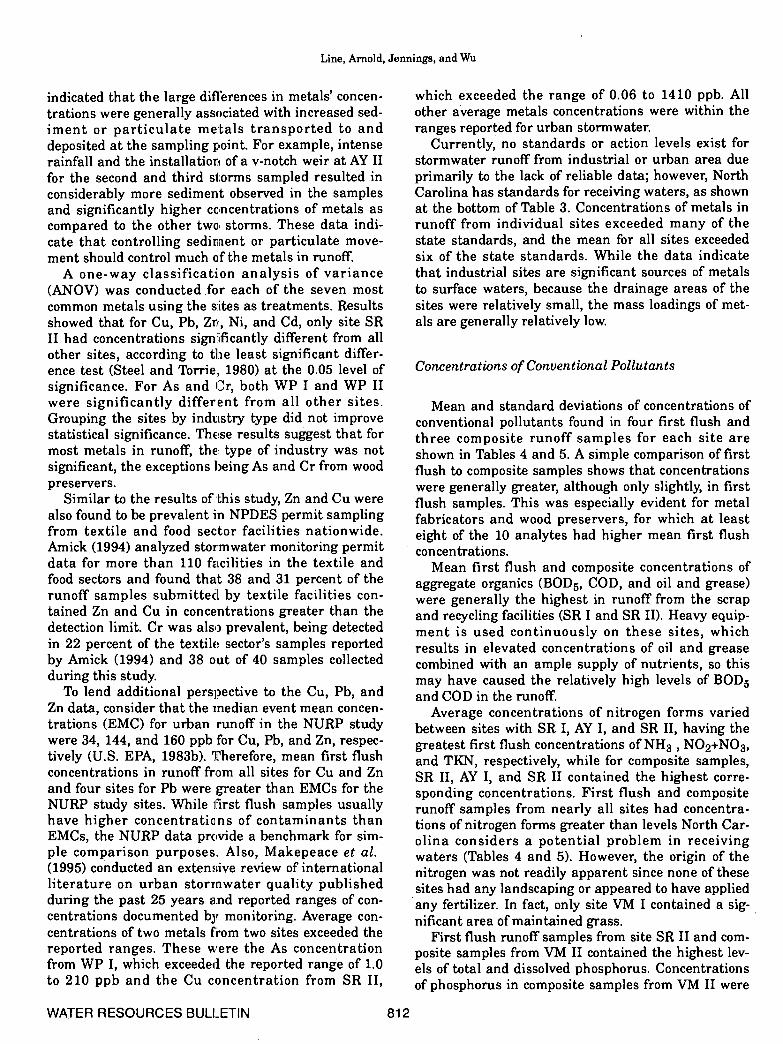
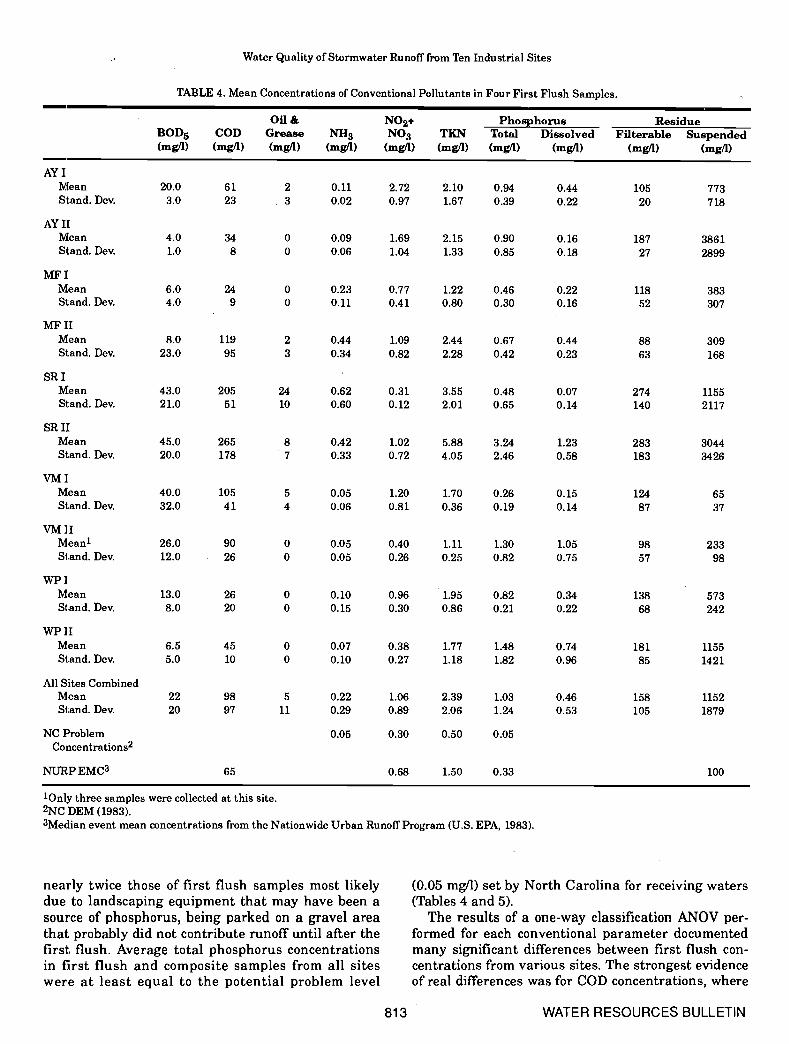
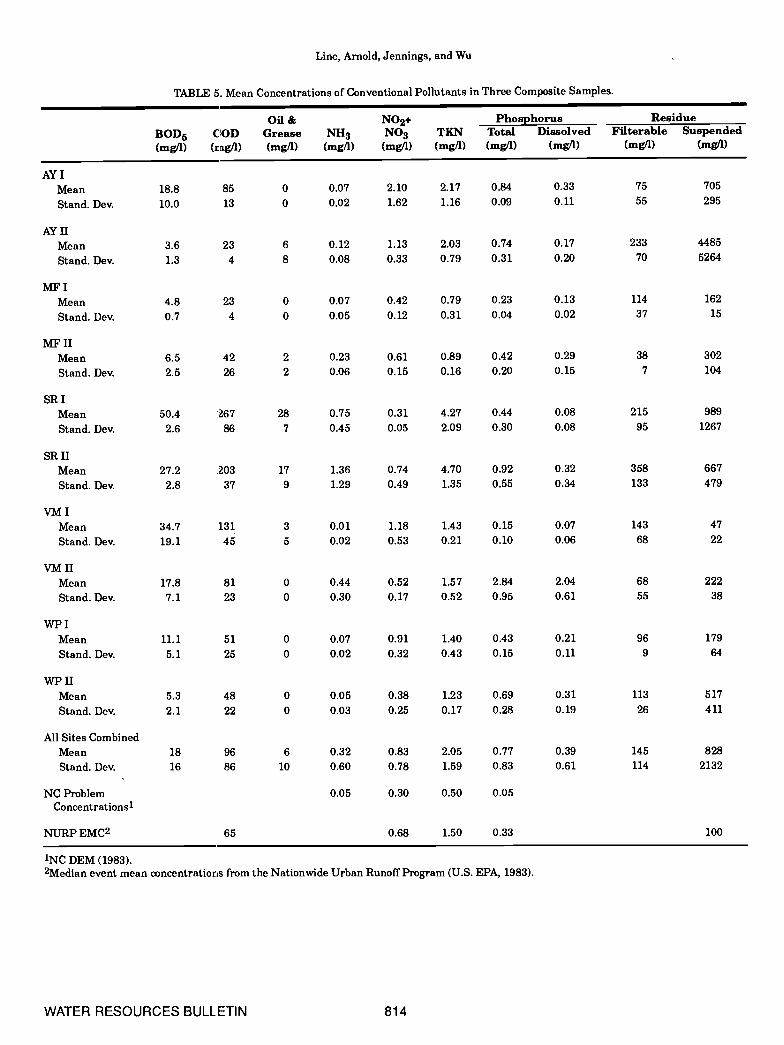
Mean and standard deviations of concentrations ofconventional pollutants found in four first flush andthree composite runoff samples for each site areshown in Tables 4 and 5. A simple comparison of firstflush to composite samples shows that concentrationswere generally greater, although only slightly, in firstflush samples. This was especially evident for metalfabricators and wood preservers, for which at leasteight of the 10 analytes had higher mean first flushconcentrations.
Mean first flush and composite concentrations ofaggregate organics (BOD5, COD, and oil and grease)were generally the highest in runoff from the scrapand recycling facilities (SR I and SR II). Heavy equip-ment is used continuously on these sites, whichresults in elevated concentrations of oil and greasecombined with an ample supply of nutrients, so thismay have caused the relatively high levels of BOD5and COD in the runoff.
Average concentrations of nitrogen forms variedbetween sites with SR I, AY I, and SR II, having thegreatest first flush concentrations of NH3 , N02+N03,and TKN, respectively, while for composite samples,SR II, AY I, and SR II contained the highest corre-sponding concentrations. First flush and compositerunoff samples from nearly all sites had concentra-tions of nitrogen forms greater than levels North Car-olina considers a potential problem in receivingwaters (Tables 4 and 5). However, the origin of thenitrogen was not readily apparent since none of thesesites had any landscaping or appeared to have appliedany fertilizer. In fact, only site VM I contained a sig-nificant area of maintained grass.
First flush runoff samples from site SR II and com-posite samples from VM II contained the highest lev-els of total and dissolved phosphorus. Concentrationsof phosphorus in composite samples from VM II were
Water Quality of Stormwater Runoff from Ten Industrial Sites
TABLE 4. Mean Concentrations of Conventional Pollutants in Four First Flush Samples.
.
BOD5 CODOil &
Grease NH3N02+NO3 TKN
Phosphorus ResidueTotal Dissolved Filterable Suspended
(mg/i) (mg/i) (mg/i) (mg/i) (mg/i) (mg/i) (mg/i) (mg/i) (mg/i) (mg/i)
SR IMeanStand. Dev.
SR IIMeanStand. Dcv.
VMIM:eanStand. Dev.
VM 1:1Mean1Stand. Dev.
WP I
NC ProblemConcentrations2
NURP EMC3
4.0 34 0 0.09 1.69 2.15 0.901.0 8 0 0.06 1.04 1.33 0.85
6.0 24 0 0.23 0.77 1.22 0.464.0 9 0 0.11 0.41 0.80 0.30
119 2 0.44 1.09 2.44 0.6795 3 0.34 0.82 2.28 0.42
24 0.62 0.31 3.55 0.4810 0.60 0.12 2.01 0.65
8 0.42 1.02 5.88 3.247 0.33 0.72 4.05 2.46
5 0.05 1.20 1.70 0.264 0.06 0.81 0.36 0.19
0 0.05 0.40 1.11 1.300 0.05 0.26 0.25 0.82
26 0 0.10 0.96 1.95 0.8220 0 0.15 0.30 0.86 0.21
6.5 45 0 0.07 0.38 1.77 1.485.0 10 0 0.10 0.27 1.18 1.82
22 98 5 0.22 1.06 2.39 1.0320 97 11 0.29 0.89 2.06 1.24
65
0.05 0.30 0.50 0.05
0.68 1.50 0.33 100
1Only three samples were collected at this site.2NC DEM (1983).3Median event mean concentrations from the Nationwide Urban Runoff Program (U.S. EPA, 1983).
nearly twice those of first flush samples most likelydue to landscaping equipment that may have been asource of phosphorus, being parked on a gravel areathat probably did not contribute runoff until after thefirst flush. Average total phosphorus concentrationsin first flush and composite samples from all siteswere at least equal to the potential problem level
(0.05 mg/I) set by North Carolina for receiving waters(Tables 4 and 5).
The results of a one-way classification ANOV per-formed for each conventional parameter documentedmany significant differences between first flush con-centrations from various sites. The strongest evidenceof real differences was for COD concentrations, where
813 WATER RESOURCES BULLETIN
20.03.0
AY IMeanStand. Dev.
AY lEMeanStand. Dev.
MFIMeanStand. Dcv.
MF IIMeanStand. Dev.
61 2 0.11 2.72 2.10 0.9423 3 0.02 0.97 1.67 0.39
8.023.0
43.021.0
20551
45.0 26520.0 178
10541
9026
40.032.0
26.012.0
13.08.0
0.44 105 7730.22 20 718
0.16 187 38610.18 27 2899
0.22 118 3830.16 52 307
0.44 88 3090.23 63 168
0.07 274 11550.14 140 2117
1.23 283 30440.58 183 3426
0.15 124 650.14 87 37
1.05 98 2330.75 57 98
0.34 138 5730.22 68 242
0.74 181 11550.96 85 1421
0.46 158 11520.53 105 1879
MeanStand. Dcv.
WP1IMeanStand. Dcv.
All Sites CombinedMeanStand. Dcv.
Line, Arnold, Jennings, and Wu
TABLE 5. Mean Concentrations of Conventiona' Pollutants in Three Composite Samples.
BOD5 CODOil &
Grease NI!3N02+NO3 TKN
Phosphorus ResidueTotal Dissolved Filterable Suspended
(mg/i) (rag/i) (mg/i) (mg/I) (mg/i) (mg/i) (mg/i) (mg/i) (mg/i) (mg/i)
AY IMean 18.8 85 0 0.07 2.10 2.17 0.84 0.33 75 705
Stand. Dev. 10.0 13 0 0.02 1.62 1.16 0.09 0.11 55 295
AY IIMean 3.6 23 6 0.12 1.13 2.03 0.74 0.17 233 4485
Stand. Dev. 1.3 4 8 0.08 0.33 0.79 0.31 0.20 70 5264
MFIMean 4.8 23 0 0.07 0.42 0.79 0.23 0.13 114 162
Stand. Dev. 0.7 4 0 0.05 0.12 0.31 0.04 0.02 37 15
MFIIMean 6.5 42 2 0.23 0.61 0.89 0.42 0.29 38 302
Stand. Dev. 2.5 26 2 0.06 0.15 0.16 0.20 0.15 7 104
SR IMean 50.4 267 28 0.75 0.31 4.27 0.44 0.08 215 989
Stand. Dev. 2.6 86 7 0.45 0.05 2.09 0.30 0.08 95 1267
SR IIMean 27.2 203 17 1.36 0.74 4.70 0.92 0.32 358 667
Stand. Dev. 2.8 37 9 1.29 0.49 1.35 0.55 0.34 133 479
VMIMean 34.7 131 3 0.01 1.18 1.43 0.15 0.07 143 47
Stand. Dev. 19.1 45 5 0.02 0.53 0.21 0.10 0.06 68 22
VMIIMean 17.8 81 0 0.44 0.52 1.57 2.84 2.04 68 222
Stand. Dev. 7.1 23 0 0.30 0.17 0.52 0.95 0.61 55 38
WPIMean 11.1 51 0 0.07 0.91 1.40 0.43 0.21 96 179
Stand. Dev. 5.1 25 0 0.02 0.32 0.43 0.15 0.11 9 64
wPIIMean 5.3 48 0 0.05 0.38 1.23 0.69 0.31 113 517
Stand. Dev. 2.1 22 0 0.03 0.25 0.17 0.28 0.19 26 411
All Sites CombinedMean 18 96 6 0.32 0.83 2.05 0.77 0.39 145 828
Stand. Dev. 16 86 10 0.60 0.78 1.59 0.83 0.61 114 2132
NC Problem 0.05 0.30 0.50 0.05Concentrations1
NURPEMC2 65 0.68 1.50 0.33 100
'NC DEM (1983).2Median event mean eencentratioris from the Nationwide Urban Runoff Program (U.S. EPA, 1983).
WATER RESOURCES BULLETIN 814
Water Quality of Stormwater Runoff from Ten Industrial Sites
SR I and SR II were significantly greater than allsites except MF II. For composite samples, no realdifferences were suggested, probably because concen-trations varied less between sites and there were onlythree composite samples collected from each site.
Concentrations of Semi-Volatile and VolatileOrganics, Pesticides, and PCBs
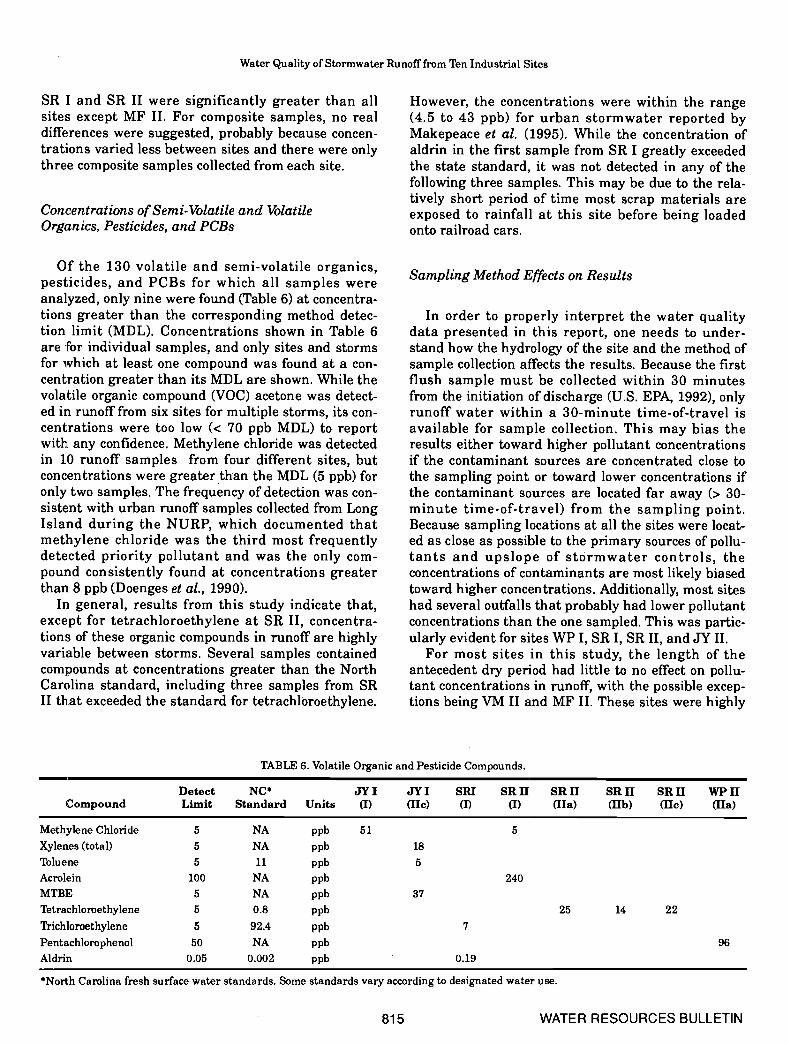
Of the 130 volatile and semi-volatile organics,pesticides, and PCBs for which all samples wereanalyzed, only nine were found (Table 6) at concentra-tions greater than the corresponding method detec-tion limit (MDL). Concentrations shown in Table 6are for individual samples, and only sites and stormsfor which at least one compound was found at a con-centration greater than its MDL are shown. While thevolatile organic compound (VOC) acetone was detect-ed in runoff from six sites for multiple storms, its con-centrations were too low (< 70 ppb MDL) to reportwith any confidence. Methylene chloride was detectedin 10 runoff samples from four different sites, butconcentrations were greater than the MDL (5 ppb) foronly two samples. The frequency of detection was con-sistent with urban runoff samples collected from LongIsland during the NURP, which documented thatmethylene chloride was the third most frequentlydetected priority pollutant and was the only com-pound consistently found at concentrations greaterthan 8 ppb (Doenges et al., 1990).
In general, results from this study indicate that,except for tetrachioroethylene at SR II, concentra-tions of these organic compounds in runoff are highlyvariable between storms. Several samples containedcompounds at concentrations greater than the NorthCarolina standard, including three samples from SRII that exceeded the standard for tetrachloroethylene.
However, the concentrations were within the range(4.5 to 43 ppb) for urban stormwater reported byMakepeace et al. (1995). While the concentration ofaldrin in the first sample from SR I greatly exceededthe state standard, it was not detected in any of thefollowing three samples. This may be due to the rela-tively short period of time most scrap materials areexposed to rainfall at this site before being loadedonto railroad cars.
Sampling Method Effects on Results
In order to properly interpret the water qualitydata presented in this report, one needs to under-stand how the hydrology of the site and the method ofsample collection affects the results. Because the firstflush sample must be collected within 30 minutesfrom the initiation of discharge (U.S. EPA, 1992), onlyrunoff water within a 30-minute time-of-travel isavailable for sample collection. This may bias theresults either toward higher pollutant concentrationsif the contaminant sources are concentrated close tothe sampling point or toward lower concentrations ifthe contaminant sources are located far away (> 30-minute time-of-travel) from the sampling point.Because sampling locations at all the sites were locat-ed as close as possible to the primary sources of pollu-tants and upslope of stôrmwater controls, theconcentrations of contaminants are most likely biasedtoward higher concentrations. Additionally, most siteshad several outfalls that probably had lower pollutantconcentrations than the one sampled. This was partic-ularly evident for sites WP I, SR I, SR II, and JY II.
For most sites in this study, the length of theantecedent dry period had little to no effect on pollu-tant concentrations in runoff, with the possible excep-tions being VM II and MF II. These sites were highly
TABLE 6. Volatile Organic and Pesticide Compounds.
CompoundDetectLimit
NC5Standard Units
JY I(I)
JY I(He)
SRI(I)
SR II(I)
SR II(Ha)
SR II(Hb)
SR II(Hc)
WP II(Ha)
Methylene Chloride 5 NA ppb 51 5
Xylenes (total) 5 NA ppb 18
Toluene 5 11 ppb 5Acrolein 100 NA ppb 240MTBE 5 NA ppb 37
Tetrachloroethylene 5 0.8 ppb 25 14 22
Trichloroethylene 5 92.4 ppb 7
Pentachlorophenol 50 NA ppb 96Aldrin 0.05 0.002 ppb 0.19
5Noi.th Carolina fresh surface water standards. Some standards vary according to designated water use.
815 WATER RESOURCES BULLETIN
Line, Arnold, Jennings, and Wu
impervious (Table 1) and had much vehicle traffic inthe sampled drainage area. The third storm (JIb) atsite VM II occurred after a dTy period of 15 days. Firstflush runoff from this storm had higher concentra-tions of all metals and suspended residue than sam-ples from the other storms that were obtained afteronly a six-day dry period (Table 2). Conversely, firstflush runoff from storm JIb fcr site AY I, which had anantecedent dry period of 37 days compared to 6 and17 for the other storms, contained lower concentra-tions of metals and solids than runoff from at leastone of the other storms. Frcm observation and sam-pling results, it seems that for relatively pervioussites and sites with a lot of e,cposed pollutant sources,the antecedent dry period was not significant.
SUMMARY
A first flush runoff (< 30 minutes) sample was col-lected during four storm vents from each of tenindustrial sites located in North Carolina. Sampleanalysis results showed that zinc and copper were themost common metals found in runoff. These two met-als were found in all 40 runoff samples at concentra-tions ranging from 5 to 21,400 ppb. In addition,concentrations of common nietals in first flush runoffwere not significantly different between most sitesand industrial groups. Sample analysis data and visu-al observations of the sampling sites indicated thatsediment deposition at the sampler intake seems todirectly affect the concentration of metals in therunoff sample. Volatile and emi-volati1e organics andpesticides were found in the runoff from four sites,with methylene chloride being the only compounddetected at more than one site.
Concentrations of conventional pollutants weremore closely related to inditvidual site maintenancethan business activity, except for oil and grease. Anal-ysis results from three-hour composite samples indi-cated no significant differences between sites for anyof the ten parameters. In general, the results showpotential for metals and conventional pollutantscontamination of stormwater runoff from industrialsites; however, contamination by organic compoundsis much less certain.
ACKNOWLEI)GMENTS
This study was funded, in part, by the North Carolina Depart.ment of Environment, Health, and Natural Resources, Division ofEnvironmental Management. The authors greatly appreciate thehelp of William Harman, Eric Dunlap, the Mecklenburg Environ-mental Protection Laboratory, and participating businesses.
LITERATURE CITED
Amick, J. P., 1994. Coping With EPA's Agricultural Industry StormWater Permit. ASAE Paper No. 942088, American Society ofAgricultural Engineers, St. Joseph, Michigan, 6 pp.
APHA, AWWA, and WPCF, 1989. Standard Methods for the Exami-nation of Water and Wastewater, 17th Edition.
Congressional Federal Register Vol. 40, Part 136, 1990.Doenges, J. M., C. P. Allen, R. J. Jontos, and C. A. Liebler, 1990.
Carrying Capacity of Public Water Supplies: A LiteratureReview of Impacts of Water Quality from Residential Develop-ment. Connecticut Department of Environmental Protection.DEP Bulletin 11, 130 pp.
Line, D. E., J. A. Arnold, G. D. Jennings, A. R. Rubin, and J. Wu,1995. Industrial Stormwater Discharge Pilot Sampling Project:Final Report. North Carolina Cooperative Extension Service,North Carolina State University, Raleigh, North Carolina,30 pp.
Makepeace, D. K., D. W. Smith, and S. J. Stanley, 1995. UrbanStormwater Quality: Summary of Contaminant Data. CriticalReviews in Environmental Science and Technology 25(2): 93.139.
NC DEM, 1983. Water Quality Discussions of Falls of the Neuseand B. Everett Jordan Lakes. North Carolina Division of Envi-ronmental Management, Report No. 83-06.
Steele, R. G. D. and J. H. Torrie, 1980. Principals and Procedures ofStatistics: A Biometric Approach. McGraw-Hill, Inc. New York,New York. 633 pp.
U.S. EPA, 1983a. Methods for Chemical Analysis of Water andWaste. EPA-600/4-79-020, U.S. Environmental Protection Agen-cy, Cincinnati, Ohio, 521 pp.
U.S. EPA, 1983b. Results of the Nationwide Urban Runoff Pro-gram: Volume 1-Final Report. Water Planning Division WII-554,U.S. Environmental Protection Agency, Washington, D.C.
U.S. EPA, 1992. NPDES Storm Water Sampling Guidance Docu-ment. U.S. Environmental Protection Agency, Office of Water,Washington, D.C., EPA 833-B-92-001, 123 pp.
Vogt, D., 1995. North Carolina Environmental Indicators. NorthCarolina Department of Environment, Health, and NaturalResources, Raleigh, North Carolina.
WATER RESOURCES BULLETIN 816