Embed Size (px)
Citation preview
Water Quality Monitoring in Water Quality Monitoring in the Distribution Systemthe Distribution System
9191stst Annual Annual Water & Wastewater Operators SchoolWater & Wastewater Operators School
August 4, 2010August 4, 2010

Why Monitor?Why Monitor?
•• KDHE regulationsKDHE regulations•• Build a Build a ““fingerprintfingerprint”” of the systemof the system•• Maintain quality of drinking waterMaintain quality of drinking water•• Determine problems and find solutions Determine problems and find solutions
quicklyquickly•• Ensure water safety for consumersEnsure water safety for consumers

Sampling RequirementsSampling Requirements
•• Population based Population based •• Sites are representative of the distribution Sites are representative of the distribution
systemsystem•• Sample commercial and residentialSample commercial and residential

Monitoring the distribution system allows us to Monitoring the distribution system allows us to determine if the finished water meets standard, or determine if the finished water meets standard, or has been compromised.has been compromised.
Tests include:Tests include:--pHpH--TurbidityTurbidity--Total Residual ChlorineTotal Residual Chlorine--AmmoniaAmmonia--TOCTOC--IC ScanIC Scan--MetalsMetals--Total Total ColiformColiform / Ecoli/ Ecoli

Sample CollectionSample Collection
One of the most common causes of error in One of the most common causes of error in water quality analysis is improper sampling.water quality analysis is improper sampling.
Accurate SamplingAccurate Sampling
•• Collect samples that accurately represent Collect samples that accurately represent the water quality.the water quality.
•• Analysis results only show what is present Analysis results only show what is present in the sample.in the sample.
•• Useful results come from useful samples.Useful results come from useful samples.

Unacceptable Sampling Unacceptable Sampling ContainersContainers

Acceptable Sampling ContainersAcceptable Sampling Containers

Sampling ProcedureSampling Procedure
•• Remove aerator if present and are able to do soRemove aerator if present and are able to do so•• Turn COLD water on full streamTurn COLD water on full stream•• Allow water to run 3Allow water to run 3--5 minutes to flush the line5 minutes to flush the line•• Open labeled sampling containers carefully so no Open labeled sampling containers carefully so no
contamination is introducedcontamination is introduced•• After specified time, turn flow down and fill labeled After specified time, turn flow down and fill labeled
sample containerssample containers•• Seal containersSeal containers•• Record time, date and location of sampleRecord time, date and location of sample•• Transport to the lab within a coolerTransport to the lab within a cooler
Field TestingField Testing
•• pHpH•• TurbidityTurbidity•• ChlorineChlorine

TransportationTransportation
•• Samples must be Samples must be chilled to 4.0chilled to 4.0°°CC
•• Samples must be Samples must be transported on icetransported on ice

Transport TimeTransport Time
•• Samples must be Samples must be transported within 30 transported within 30 minutes to minimize minutes to minimize sample degradationsample degradation
•• Some sample holding Some sample holding times are very short!times are very short!
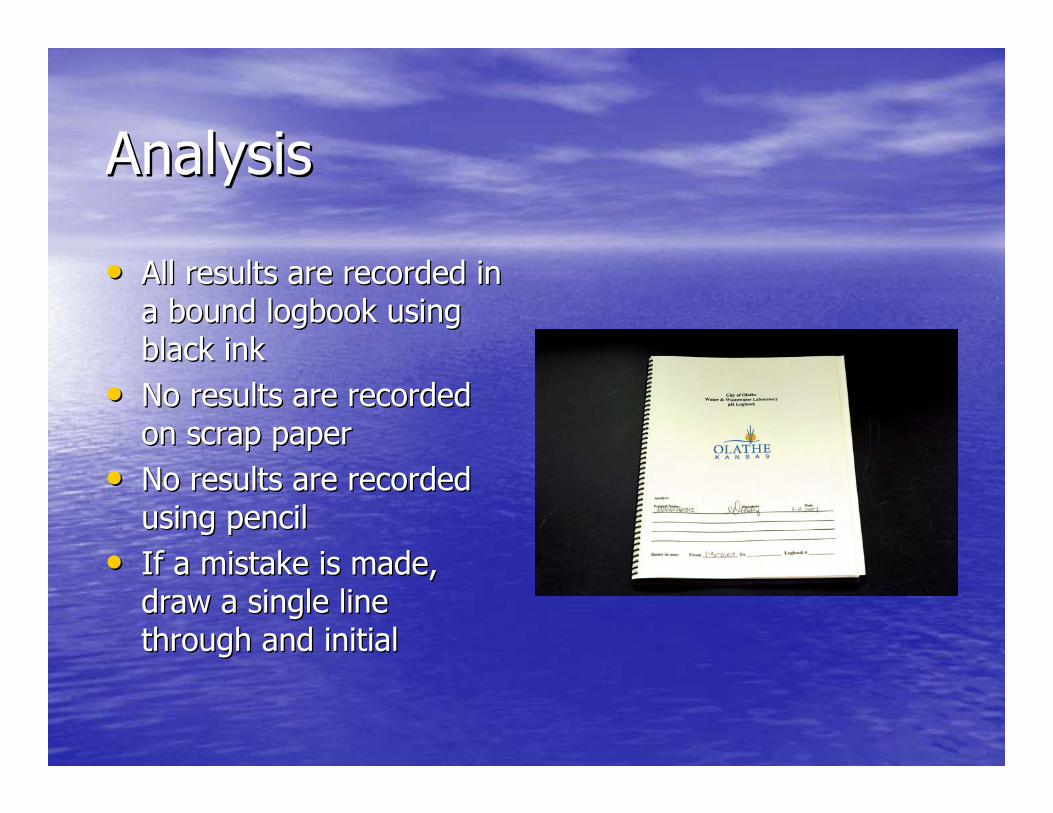
AnalysisAnalysis
•• All results are recorded in All results are recorded in a bound logbook using a bound logbook using black inkblack ink
•• No results are recorded No results are recorded on scrap paperon scrap paper
•• No results are recorded No results are recorded using pencilusing pencil
•• If a mistake is made, If a mistake is made, draw a single line draw a single line through and initialthrough and initial

Data generated must be able to be reData generated must be able to be re--created and legally defensiblecreated and legally defensible

What to Look at and WhyWhat to Look at and Why……

What is pHWhat is pH
In In chemistrychemistry, , pHpH is a measure of the is a measure of the acidityacidity or or basicitybasicity of a of a solutionsolution. It approximates but is not . It approximates but is not equal to equal to p[Hp[H]], the negative , the negative logarithmlogarithm (base 10) (base 10)
of the of the molarmolar concentration of dissolved concentration of dissolved hydroniumhydronium ionsions (H(H33OO++); a low pH indicates a high ); a low pH indicates a high concentration of concentration of hydroniumhydronium ions, while a high pH ions, while a high pH
indicates a low concentration. indicates a low concentration.

Why pH?Why pH?
•• Determines efficiency of treatment Determines efficiency of treatment process process
•• Indicates changes in water qualityIndicates changes in water quality•• Part of USEPA Lead and Copper RulePart of USEPA Lead and Copper Rule•• Helps determine if water is corrosive Helps determine if water is corrosive
(stability)(stability)

What is TurbidityWhat is Turbidity
TurbidityTurbidity is the cloudiness or is the cloudiness or hazinesshaziness of a of a fluidfluid caused by individual caused by individual particlesparticles
((suspended solidssuspended solids) that are generally ) that are generally invisible to the invisible to the naked eyenaked eye. The . The
measurement of turbidity is a key test of measurement of turbidity is a key test of water qualitywater quality..
Why Turbidity?Why Turbidity?
•• High turbidity is health hazardHigh turbidity is health hazard•• Consumers distrust turbid waterConsumers distrust turbid water•• Monitor quality for compliance with Monitor quality for compliance with
drinking water standardsdrinking water standards•• Turbid samples can be carriers for Turbid samples can be carriers for
contaminants or biological speciescontaminants or biological species

What is ChlorineWhat is Chlorine
ChlorineChlorine (pronounced (pronounced KLORKLOR--eeneen, from the , from the GreekGreek word word ''χλωρχλωρóóςς' (' (khlôroskhlôros, meaning 'pale green'), is the , meaning 'pale green'), is the chemical chemical elementelement with with atomic numberatomic number 17 and symbol 17 and symbol ClCl. It is a . It is a
halogenhalogen, found in the , found in the periodic tableperiodic table in in group 17group 17. As the . As the chloridechloride ion, which is part of ion, which is part of common saltcommon salt and other and other
compounds, it is abundant in nature and necessary to most compounds, it is abundant in nature and necessary to most forms of life, including forms of life, including humanshumans. In its elemental form (Cl. In its elemental form (Cl22 or or
""dichlorinedichlorine") under ") under standard conditionsstandard conditions, chlorine is a , chlorine is a powerful powerful oxidantoxidant and is used in and is used in bleachingbleaching and disinfectants, and disinfectants, as well as an essential reagent in the chemical industry. As a as well as an essential reagent in the chemical industry. As a
common disinfectant, chlorine compounds are used in common disinfectant, chlorine compounds are used in swimming poolsswimming pools to keep them clean and to keep them clean and sanitarysanitary
Why Total Residual Chlorine?Why Total Residual Chlorine?
•• Ensure continued disinfection of water in Ensure continued disinfection of water in the distribution systemthe distribution system
•• Ensure chlorine doses are not excessiveEnsure chlorine doses are not excessive
What is AmmoniaWhat is Ammonia
ChloramineChloramine ((monochloraminemonochloramine) is an ) is an inorganic inorganic compoundcompound with the with the formulaformula NHNH22Cl. It is a Cl. It is a colourlesscolourless
liquid at room temperature, but it is usually handled as liquid at room temperature, but it is usually handled as a dilute solution where it is used as a a dilute solution where it is used as a disinfectantdisinfectant. The . The
term chloramine also refers to a family of term chloramine also refers to a family of organic organic compoundscompounds with the formulas Rwith the formulas R22NCl and RNClNCl and RNCl22 (R is an (R is an
organic group). organic group). DichloramineDichloramine, NHCl, NHCl22, and , and nitrogen nitrogen trichloridetrichloride, NCl, NCl33, are also well known. , are also well known.

Why Ammonia?Why Ammonia?
•• Chloraminate waterChloraminate water•• Disinfection parameterDisinfection parameter
TOC AnalysisTOC Analysis
•• Determines Total Organic CarbonDetermines Total Organic Carbon•• Spikes in results can show if organic Spikes in results can show if organic
material was dumpedmaterial was dumped•• Regulatory compliance for TOC removalRegulatory compliance for TOC removal

What is TOCWhat is TOC
Total organic carbon (TOC)Total organic carbon (TOC) is the amount of is the amount of carboncarbon bound in an bound in an organic compoundorganic compound and is often used as a nonand is often used as a non--specific indicator of specific indicator of
water qualitywater quality or cleanliness of pharmaceutical manufacturing or cleanliness of pharmaceutical manufacturing equipment.equipment.
A typical analysis for TOC measures both the total carbon presenA typical analysis for TOC measures both the total carbon present as t as well as the so called "inorganic carbon" (IC), the latter represwell as the so called "inorganic carbon" (IC), the latter representing enting
the content of dissolved carbon dioxide and carbonic acid salts.the content of dissolved carbon dioxide and carbonic acid salts.Subtracting the inorganic carbon from the total carbon yields TOSubtracting the inorganic carbon from the total carbon yields TOC. C. Another common variant of TOC analysis involves removing the IC Another common variant of TOC analysis involves removing the IC portion first and then measuring the leftover carbon. This methoportion first and then measuring the leftover carbon. This method d
involves purging an involves purging an acidifiedacidified sample with carbonsample with carbon--free air or free air or nitrogennitrogenprior to measurement, and so is more accurately called nonprior to measurement, and so is more accurately called non--
purgeablepurgeable organic carbon (NPOC).organic carbon (NPOC).
Ion ChromatographyIon Chromatography
•• Test for Fluoride, Chlorite, Chloride, Test for Fluoride, Chlorite, Chloride, Nitrite, Nitrate, oNitrite, Nitrate, o--Phosphate, SulfatePhosphate, Sulfate
•• Monitors fluoride levels within the Monitors fluoride levels within the distribution systemdistribution system
•• Determines if nitrification is occurring in Determines if nitrification is occurring in the systemthe system
•• Used as a fingerprintUsed as a fingerprint
ICPICP
•• Scan for metals in the sampleScan for metals in the sample•• Determine hardness (Calcium, Determine hardness (Calcium,
Magnesium)Magnesium)•• Determine IronDetermine Iron•• Determine ManganeseDetermine Manganese•• Fingerprint of systemFingerprint of system•• Comply with USEPA Lead and Copper RuleComply with USEPA Lead and Copper Rule

Total ColiformTotal Coliform

Why Total Coliform?Why Total Coliform?
•• Ensure proper disinfectionEnsure proper disinfection•• Ensure no biological growthEnsure no biological growth•• Compliance with Total Coliform RuleCompliance with Total Coliform Rule

What is Total What is Total ColiformColiform
ColiformColiform is the name of a test adopted in 1914 by the Public Health Servis the name of a test adopted in 1914 by the Public Health Service for ice for the the EnterobacteriaceaeEnterobacteriaceae family. It is the commonlyfamily. It is the commonly--used used bacterial indicatorbacterial indicator of of
sanitary quality of foods and water. They are defined as rodsanitary quality of foods and water. They are defined as rod--shaped shaped GramGram--negativenegative nonnon--spore forming organisms. Some spore forming organisms. Some enteronenteron forms can forms can fermentferment lactoselactose
with the production of with the production of acidacid and and gasgas when incubated at 35when incubated at 35--3737°°C. C. ColiformsColiforms are are abundant in the abundant in the fecesfeces of warmof warm--blooded animals, but can also be found in the blooded animals, but can also be found in the aquatic environment, in soil and on vegetation. In most instanceaquatic environment, in soil and on vegetation. In most instances, s, coliformscoliforms
themselves are the cause of many themselves are the cause of many nosocomialnosocomial illnesses, they are easy to culture illnesses, they are easy to culture and their presence is used to indicate that other pathogenic organd their presence is used to indicate that other pathogenic organisms of fecal anisms of fecal
origin may be present. Fecal pathogens include origin may be present. Fecal pathogens include bacteriabacteria, , virusesviruses,or,or protozoaprotozoa and and many many multicellularmulticellular parasitesparasites

What is EcoliWhat is Ecoli
Escherichia coli (commonly abbreviated E. coli; pronounced /�ɛʃɨˈ rɪkiә�koʊlaɪ/, named after Theodor Escherich) is a Gram negative rod-shapedbacterium that is commonly found in the lower intestine of warm-blooded
organisms (endotherms). Most E. coli strains are harmless, but some, such as serotype O157:H7, can cause serious food poisoning in humans, and are
occasionally responsible for product recalls. The harmless strains are part of the normal flora of the gut, and can benefit their hosts by producing vitamin K2, and
by preventing the establishment of pathogenic bacteria within the intestine.E. coli are not always confined to the intestine, and their ability to survive for brief periods outside the body makes them an ideal indicator organism to test
environmental samples for fecal contamination. The bacteria can also be grown easily and its genetics are comparatively simple and easily manipulated or
duplicated through a process of metagenics, making it one of the best-studied prokaryotic model organisms, and an important species in biotechnology and
microbiology.E. coli was discovered by German pediatrician and bacteriologist Theodor
Escherich in 1885 and is now classified as part of the Enterobacteriaceae family of gamma-proteobacteria
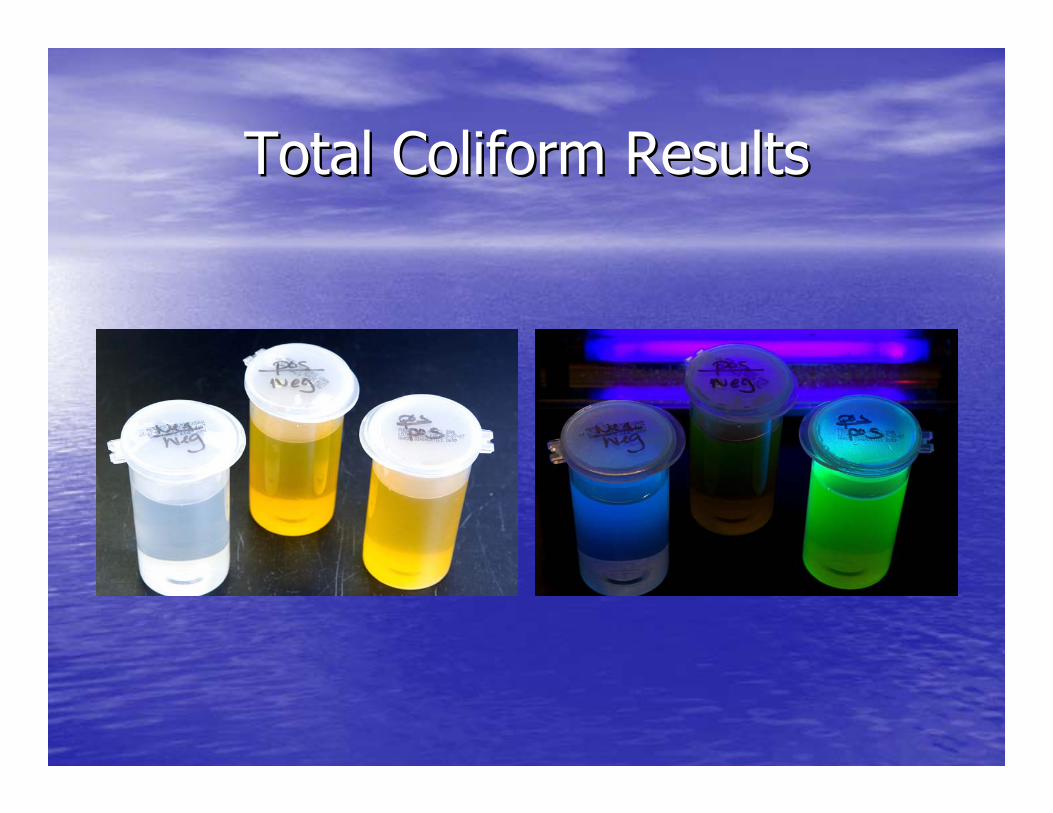
Total Coliform ResultsTotal Coliform Results

Improving Water QualityImproving Water Quality
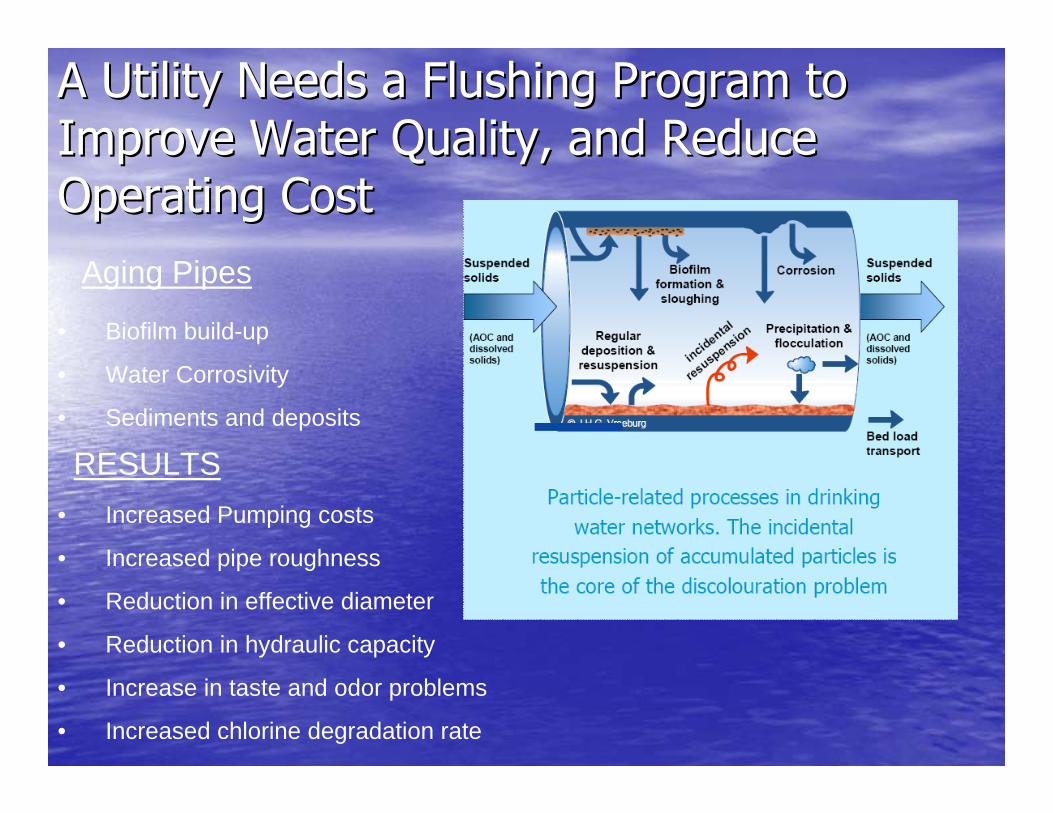
A Utility Needs a Flushing Program to A Utility Needs a Flushing Program to Improve Water Quality, and Reduce Improve Water Quality, and Reduce Operating CostOperating Cost
• Biofilm build-up
• Water Corrosivity
• Sediments and deposits
RESULTS
Aging Pipes
• Increased Pumping costs
• Increased pipe roughness
• Reduction in effective diameter
• Reduction in hydraulic capacity
• Increase in taste and odor problems
• Increased chlorine degradation rate
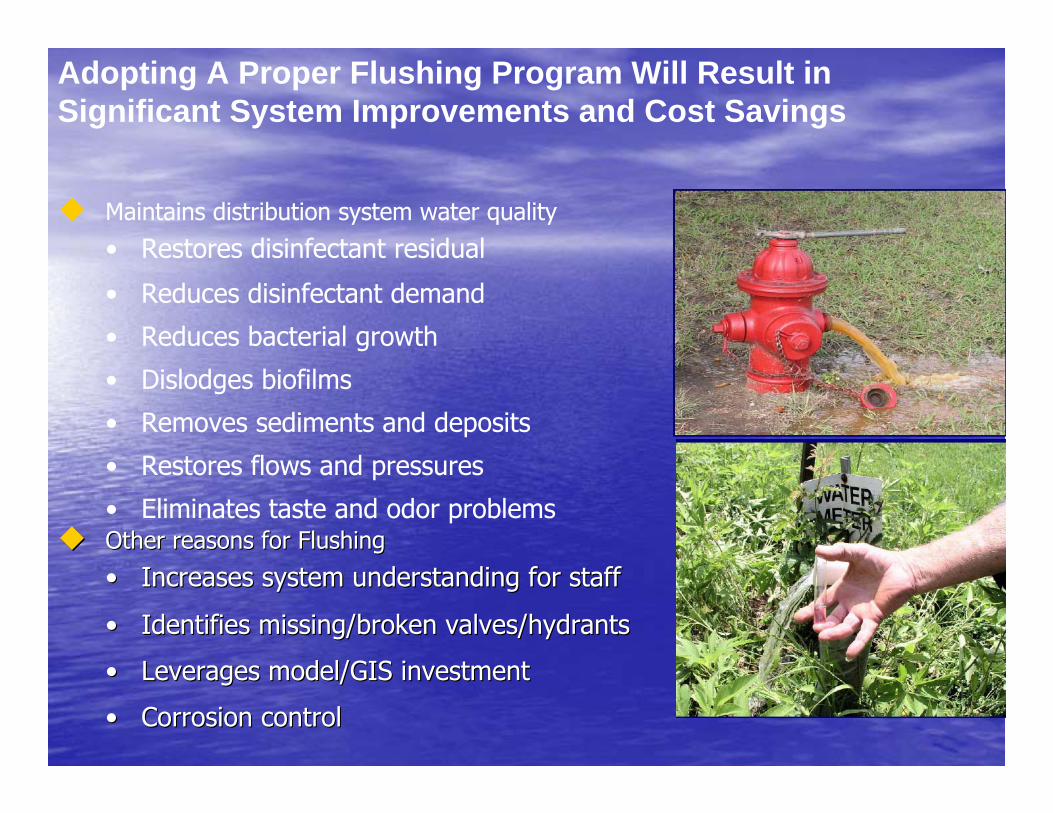
Adopting A Proper Flushing Program Will Result in Significant System Improvements and Cost Savings
Maintains distribution system water quality
• Restores disinfectant residual
• Reduces disinfectant demand
• Reduces bacterial growth
• Dislodges biofilms
• Removes sediments and deposits
• Restores flows and pressures
• Eliminates taste and odor problemsOther reasons for FlushingOther reasons for Flushing
•• Increases system understanding for staff Increases system understanding for staff
•• Identifies missing/broken valves/hydrantsIdentifies missing/broken valves/hydrants
•• Leverages model/GIS investmentLeverages model/GIS investment
•• Corrosion controlCorrosion control
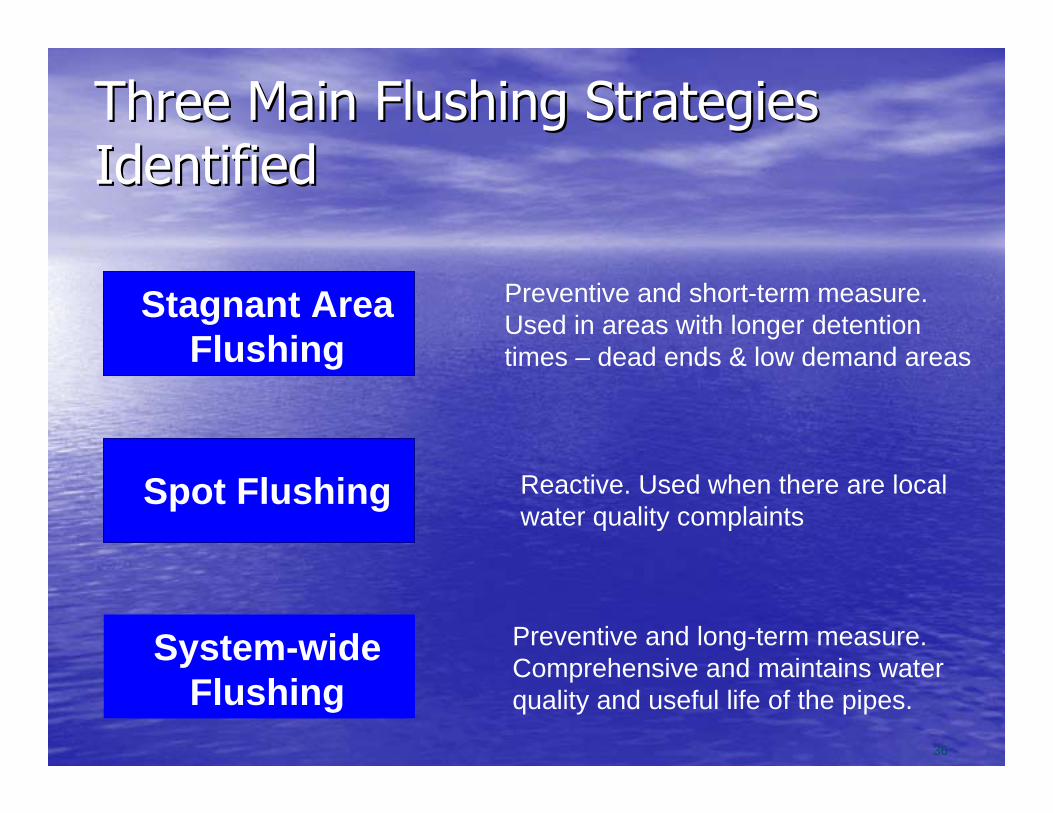
Three Main Flushing Strategies Three Main Flushing Strategies IdentifiedIdentified
36
Stagnant Area Flushing
Spot Flushing
System-wide Flushing
Preventive and short-term measure. Used in areas with longer detention times – dead ends & low demand areas
Reactive. Used when there are local water quality complaints
Preventive and long-term measure. Comprehensive and maintains water quality and useful life of the pipes.

Unidirectional Flushing is the Most Unidirectional Flushing is the Most Comprehensive Form of FlushingComprehensive Form of Flushing
37
• Conventional Flushing
• Continuous Blow-off
• Unidirectional Flushing - UDF
For Success flushing velocity must be adequate ! ! ! ! ! !
Types of Flushing
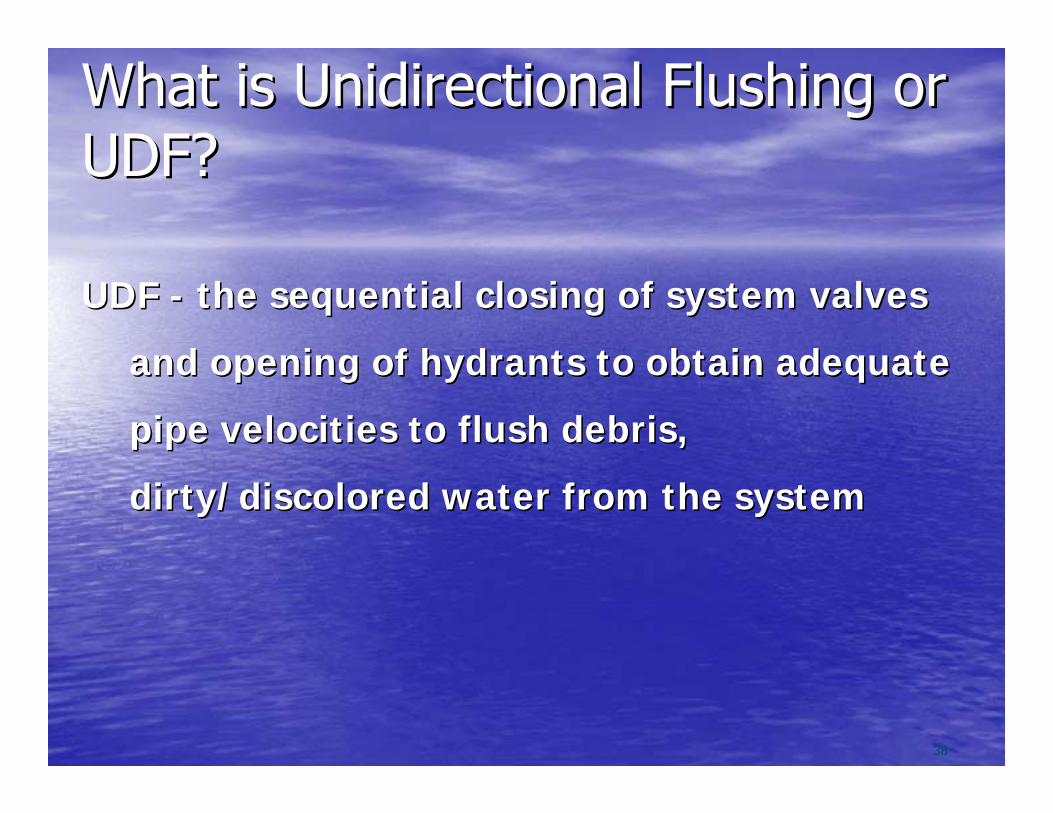
What is Unidirectional Flushing or What is Unidirectional Flushing or UDF?UDF?
UDF UDF -- the sequential closing of system valves the sequential closing of system valves
and opening of hydrants to obtain adequate and opening of hydrants to obtain adequate
pipe velocities to flush debris, pipe velocities to flush debris,
dirty/discolored water from the systemdirty/discolored water from the system
38

UDF Uses up to 40% Less Water than conventional Flushing, and Allows for a Better Response to Localized Water Quality Complaints
Can result in dirty water flushed to clean areas!
Uses up to 40% less water!
Conventional Flushing Unidirectional Flushing
• Water from all directions
• Low flow velocities
• Less scouring
• Don’t control flushing directions
• Water channeled
• Higher flow velocities
• More scouring and better cleaning
• Systematic valve operation

Before After4 304 627 180 269 75 13
11 179 912 213 1014 276 1018 172 21
Color (mg/L Pt-Co)Sequence
79.685.682.795.095.396.487.8
Reduction (%)Before After
6241 18921926 2961053 1244120 943790 738649 1244744 331
Iron (ug/L)
69.784.688.297.798.198.693.0
Reduction (%)Before After
19.40 4.9714.80 5.1614.60 2.6836.00 1.0339.60 0.5756.60 0.4942.30 4.25
Turbidity (NTU)
74.465.181.697.198.699.190.0
Reduction (%)
UDF Results SummaryUDF Results Summary

Water Quality SamplingWater Quality Sampling•• Each hydrant was sampled Each hydrant was sampled
at the start and finish of at the start and finish of each flushing sequenceeach flushing sequence
•• The CityThe City’’s Laboratory s Laboratory performed all the water performed all the water quality analysisquality analysis
CalciumCalcium
MagnesiumMagnesium
TurbidityTurbidity
Total ChlorineTotal Chlorine
pHpH
IronIron
ColorColor

0
50
100
150
200
250
300
350
0 1 2 3 4 5 6 7 8 9 10 11 12 13 14 15 16 17 18 19 20 21 22
Flushing Sequence
Col
or (m
g/L
Pt-C
o)
Color - Initial Average Color - Initial Color - Finished Average Color - Finished
On the Average UDF Reduced Color by On the Average UDF Reduced Color by 73 Percent73 Percent Min Reduction = 36.4%
Average Reduction = 73.2% Maximum Reduction = 96.4%

0
10
20
30
40
50
60
0 1 2 3 4 5 6 7 8 9 10 11 12 13 14 15 16 17 18 19 20 21 22
Flushing Sequence
Turb
idity
(NTU
)
Turbidity - Initial Average Turbidity - InitialTurbidity - Finished Average Turbidity - Finished
On the Average UDF Reduced On the Average UDF Reduced Turbidity by 79 PercentTurbidity by 79 Percent Min Reduction = 15.5%
Average Reduction = 79.1% Maximum Reduction = 99.1%
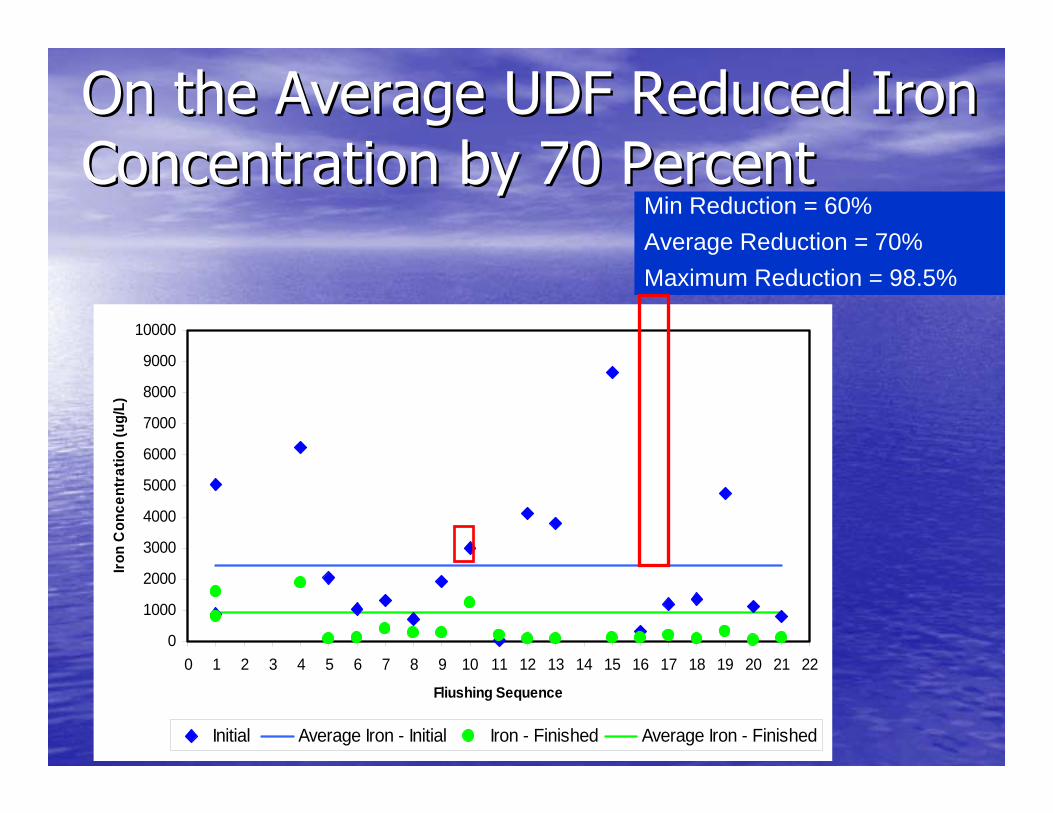
On the Average UDF Reduced Iron On the Average UDF Reduced Iron Concentration by 70 PercentConcentration by 70 Percent
0
1000
2000
3000
4000
5000
6000
7000
8000
9000
10000
0 1 2 3 4 5 6 7 8 9 10 11 12 13 14 15 16 17 18 19 20 21 22
Fliushing Sequence
Iron
Con
cent
ratio
n (u
g/L)
Initial Average Iron - Initial Iron - Finished Average Iron - Finished
Min Reduction = 60%Average Reduction = 70% Maximum Reduction = 98.5%

QUESTIONS?QUESTIONS?

Contact InformationContact Information
•• DeWayne McAllister, Laboratory Manager DeWayne McAllister, Laboratory Manager 913913--971971--5233 5233 [email protected]@olatheks.org