Embed Size (px)
Citation preview

Water – energy nexus in biofuels production
and renewable based power
Mariano Martína1, Ignacio E. Grossmannb
aDepartment of Chemical Engineering, University of Salamanca. Plz Caídos 1-5 37008. Salamanca
bDepartment of Chemical Engineering, Carnegie Mellon University, Pittsburgh PA 15213
Abstract
In this paper, the water–energy nexus for renewable based processes is evaluated. Process
synthesis and integration techniques are used to synthesize the processes and integrate the energy and
water, optimizing the consumption of both natural resources. In the analysis of water consumption, it was
found that cooling needs and water using technologies are major drivers. Currently, contaminated water is
fairly well treated for further use. Therefore, the more the energy is integrated, the lower the cooling needs are
reducing the water consumed accordingly. In terms of efficient processes in water–energy consumption, the
best one is the FT-fuels, with other options being second generation bioethanol via gasification and catalytic
synthesis, biodiesel production from cooking oil and the integrated process that produces biodiesel and
glycerol ethers, as long as the rainfall water is not included in the analysis. Otherwise, solar based fuels are
more efficient.
Keywords: Energy, Alternative fuels, Water, Water-Energy nexus.
1 Corresponding author. Tel.: +34 923294479 Email address: [email protected]
1

1. Introduction
Water and energy are two interrelated natural resources (Azapagic and Perdan, 2014). Typically, not much
attention has been paid to the consumption of water due to its low price and relative availability. However,
generally the production of energy, requires a considerable amount of water. For instance, the production of
power in thermal plants requires around 1.8 L/kWh (Torcellini et al., 2003). In this particular case the water
consumed is mostly the one lost by evaporation in the cooling tower. In the production of petrol or diesel, there
is a certain amount of water injected to extract the crude, around 2.5 L/L (Wu et al., 2009). These two
examples show that, although there is a strong link between both resources, each product and process
determine the actual value, and most importantly, where it is possible to implement further water and energy
saving technologies. The renewable sources of energy, i.e. solar, wind, biomass, to mention the three most
important ones, can be processed in a number of ways to obtain power and fuels. Furthermore, the production
of biomass itself requires special consideration. If the biomass is not native to a certain region and there is no
enough natural irrigation, there is a large amount of water needed to grow the biomass (Wu et al., 2009).
Although this point is controversial, sugar cane in Brazil grows with no artificial irrigation, whereas in many
cases there is need for a supply of water to produce the biomass, the raw material of the biofuels.
While on the one hand, energy production (or fuels) requires energy, on the other hand, energy is
required to treat and transport water. The water used in any process comes out with increased levels of
chemicals, particles, etc. This water needs to be reintegrated in the system, and for that the levels of
contaminants must be reduced to levels established by environmental regulations.
In this work, we analyze different primary renewable sources of energy such as biomass, solar and
wind and a number of processes that transform them into power and a number of common fuels, not restricted
to bioethanol and biodiesel, discussing the sinks and sources of water and energy for each case, and how
process design and integration help to reduce energy and water consumption. We present results on the
operation of such processes and the efficiency in water used per MJ energy produced.
2

2. Methodology
The optimization of water and energy is a well studied area within the process engineering
community. The seminal papers on energy integration for process design deal with the development of pinch
technology (Linhoff and Hindmarsh, 1983), the use of mathematical optimization techniques for the
simultaneous optimization and heat integration (Duran & Grossmann, 1986), or the design of heat exchanger
networks (Yee & Grossmann, 1990). With regards to water consumption, major works include Takama et al
paper in 1980 formulating the first water network, to the heuristics presented by Wang & Smith (1994)
developing the water pinch, and the novel formulations and solution procedures for the water network as in
Galán & Grossmann (1998), Karuppiah and Grossmann (2006), Ahmetovic and Grossmann (2011).
Traditionally, previous studies have considered each resource, water and energy, independently. One reason
for this is that the problems by themselves are quite difficult. Water networks (WN) and heat exchanger
networks (HEN) lead to non-convex mixed-integer nonlinear programming problems for which global optimal
solutions are hard to obtain. Furthermore, large mixed-integer nonlinear programming models arise when a
number of alternative technologies is considered for the processing of a certain raw material into a desired
product (i.e. Martín & Grossmann 2011).
Except for few integrated approaches or targeting methods (Yang and Grossmann, 2013), the optimal
design of renewable based fuels and power production is carried out using a sequential approach for
optimizing first the topology and energy, and in a second step, optimizing the water consumption (Grossmann
and Martín, 2010). In the first stage the process is designed, including simultaneous optimization and heat
integration in those cases where models for the reactor conversions are available. Once the topology of the
process is fixed and the optimal operating conditions are determined, models such as the one by Yee and
Grossmann (1990) are used to develop a heat exchanger network, minimizing simultaneously the utilities and
the investment cost. Finally, water is integrated by designing a water network by using the model developed by
Ahmetovic and Grossmann (2011). We need to bear in mind that process decisions and flowsheet topology
3

could incorporate water optimization within the first stage. In the next subsections we describe such an
approach.
2.1.-Process synthesis and energy optimization
A superstructure optimization approach is a powerful tool to evaluate a large number of alternatives in
a systematic way. First, each of the units must be modeled. There is a trade-off between accuracy and
simplicity. For optimization purposes, the large problem size when the complete superstructure is formulated
suggests the use of simple models based on mass and energy balances, rules of thumb, thermodynamic
principles (kinetics and species equilibrium) and experimental results and trends (Martín & Grossmann, 2012).
Once the units are modeled, the superstructure optimization model is put together. Furthermore, we
can incorporate Duran & Grossmann’s (1986) formulation for simultaneous optimization and heat integration.
The formulation is based on a search of the pinch point among candidates from each of the streams involved
in the process. Compared to the sequential approach, the overall conversion can increase as well as the profit
if simultaneous integration is considered in together with the design. In terms of heat integration, Figure 1
shows the comparison between the composite curves in using a sequential approach (a), and the
simultaneous approach (b) by the formulation. As can be seen, a significant reduction in the energy required to
for the process is achieved.
200
300
500
700
10,000 20,000 30,000 40,000 H (kW)5,0002,000
T (K)
Q = 8, 622H
DTmin = 15 K
HOT
COLD
pinch (363.1, 348.1)
inlet H2
Qc = 9, 753
SEQUENTIAL
(Total Heat exchanged = 28, 720 kW)
200
300
500
700
10,000 20,000 30,000 40,000 H (kW)5,0002,000
T (K)
Q = 1, 684H
DTmin = 15 K
inlet H1
HOT
COLDpinch
(502.7, 487.7)
pinch (383.7, 368.7)
inlet C2Qc = 10, 632
SIMULTANEOUS
(Total Heat exchanged = 31, 962 kW)
a) Sequential approach b) Simultaneous approach
Figure 1.- Compasiron of the use of simultaneous optimization and heat integration
4

At this point, the optimal topology and operating conditions result from solving a large MINLP. The
second step is to use the Yee and Grossmann (1990) model for the streams computed in the process
flowsheet optimization to design the heat exchanger network and minimize the utilities. Figure 2 shows a two
stage superstructure for the synthesis of a heat exchanger network (HEN) for two hot streams and two cold
streams.
Figure 2.- Superstructure for heat exchanger network.
2.2. Water network superstructure and model
Once the superstructure has been optimized simultaneously with heat integration and the HEN
obtained, the next step is to synthesize the water network to minimize the freshwater consumption. For this
purpose, a superstructure is postulated that consists of one or multiple sources of water of different quality,
water-using processes, and wastewater treatment operations. All possible interconnections are considered
and incorporate process units, treatment unites as well as sources and sinks of water. Figure 3 presents a
scheme of the superstructure. The model for the superstructure is a nonconvex nonlinear programming (NLP)
which can be solved to global optimality (Ahmetovic and Grossmann, 2011). The objective function is to
minimize the total network cost consisting of the cost of freshwater, the investment cost on treatment units and
5

the operating cost for the treatment units subject to splitter mass balances, mixer mass balances (bilinear),
process units mass balances and treatment unit mass balances.
Figure 3. Generalized superstructure for the design of integrated water networks. Ahmetović and Grossmann 68
PU: Process Unit; DU: Demand Unit; SU: Source Unit; TU: Treatment Unit.
To synthesize the optimal water network for a production facility, the interconnections of the process
and treatment units, and their corresponding flowrates must be identified. Three main contaminants are
considered: total suspended solids (TSS), total dissolved solids (TDS) and organics (BOD and COD) which
are known to be the most important ones. Below we describe the main units involved in the WN.
2.2.1.- Treatment Units.
-Solids removal: Suspended solids such as straw or sand are typically removed using screens.
6
-Organics removal: Biochemical processes involve large amounts of water, that once the main product is
recovered, it still contains a number of organic species. For instance, the water from the distillation columns
requires a system of anaerobic and aerobic treatment to remove the traces of glycerol, organic acids and
ethanol that has not been recovered.
-Total dissolved solids removal: One of the most important contaminants in the operation of boilers and
cooling towers are the total dissolved solids (TDS) since they do not allow the complete recirculation on the
blowdowns due to the build-up of salts. In order to partially remove the total dissolved solids, a reverse
osmosis is commonly used. The literature reports removal ratios of 90% at the most, better than ion exchange
or nanofiltration.
2.2.2.-Utility units: Demand and sinks.
-Cooling tower: The use of the cooling tower depends on the actual process, either cooling down the water
used as cooling agent or to condense the extraction of the lower pressure turbine in power plants. The flowrate
treated by the tower and the cooling needed, ∆T, determine the losses by evaporation (Perry and Green,
1997). The amount of water lost by drift, which is the liquid water in the tower discharge vapors, typically,
varies between 0.1 and 0.2 percent of the water supplied to the tower. Therefore, the makeup requirements for
the cooling tower consist of the evaporation loss, drift loss, and blowdown. The cycles of concentration (COC)
are the ratio of the concentration of salts or dissolved solids in the circulating water/blowdown to that in the
makeup water. In industrial practice, the cycles of concentration normally range from three to seven. We need
to maintain the concentration of pollutants within some limits that are reported in the literature, which
determines the actual fresh water fed. The total suspended solids (TSS) in the outlet stream of the cooling
tower is typically 50 ppm, while the TDS are 2500ppm (APHA , 1989) The regulations require that the
concentration of TDS in the effluent not to exceed 500 ppm (Patoczka, 2007).
-Boiler: The steam generated in the boiler is used to supply heat in the heat exchanger network, while the
steam condensate is returned to the boiler. In the case that there is no steam consumption in the process or
loss in the heat exchanger network, the flowrate of the generated steam in the boiler and returned steam
7

condensate is the same. In addition, makeup requirements for the boiler system will be equal to the discharged
blowdown. The American Boiler Manufacturers Association specifies that the concentration of TSS in the
blowdown water from boilers is typically 10ppm, while the TDS will be 500ppm (ABMA, 2015)
3.-Processes
In this section we describe several process technologies for the production of promising biofuels and
power using renewable sources of energy. We divide the section into bioethanol, FT-liquids, biodiesel,
integrated processes based on algae and solar and wind based processes.
3.1.-Bioethanol
-Bioethanol from corn: The first section of the process involves the pretreatment of the corn grain to
break its physical and chemical structure. In this stage water in the form of steam is added to the process. The
process units are grinding, direct contact with steam, saccharification and liquefaction. Next, the sugars are
exposed for fermentation. The second section is the fermentation of the sugars, mainly glucose, into ethanol.
Water and starch are fed to the reactor. The amount of water required is such that the concentration of ethanol
at the end of the fermentation is below the toxic levels for the yeast, 15% of ethanol in water. CO2 is also
generated in the fermentation. One of the challenges when it comes to energy integration is the low operating
temperature of the fermentors, 32-38ºC. Although the reaction is exothermic, that energy cannot be further
used, requiring cooling water. After fermentation, a beer column followed by the use on rectification, adsoprtion
in corn grits and molecular sieves are used in parallel. Ethanol dehydration is an energy intense step.
Furthermore, together with steam, cooling is also required. Multieffect columns are a useful technology to
reduce energy and cooling needs. The complete flow is treated at the molecular sieves to reach fuel grade
ethanol. Both distillation columns discharge water with organics. After proper treatment, water can be reused
within the process, reducing the freshwater needed (Karuppiah et al 2008), see Figure 4. In Table 1 we
summarize the main operating parameters of this process.
8

Figure 4.- Block diagram for the corn based ethanol
-Bioethanol from switchgrass via hydrolysis: The switchgrass is pretreated to expose the sugar
polymers using dilute acid pretreatment. This treatment requires a certain amount of steam and operates at
moderate temperature, 140-180ºC. However, part of the steam can be recovered in a flash after the breakage
of the biomass and can be reused, reducing the water needs of the process. Next, the mixture is hydrolyzed to
breakdown the polymers into sugar monomers which are fermented into ethanol. The inhibition of the
production of ethanol due to its presence in the liquid phase results in the need for a large amount of water in
the fermentor. Ethanol cannot exceed 8%. Finally, the ethanol is dewatered using a multieffect beer column
followed by molecular sieves. The dilute mixture to be separated increases the energy consumption of the
process, since we evaporate water with steam (Martín & Grossmann, 2012a). In terms of water consumption, it
is assumed, based on literature results (Wu et al., 2009), that if the switchgrass grows in native regions there
is no need for irrigation. See Figure 5 for a block diagram of the process. Table 1 reports the water and
energy consumptions as well as economic information on the process.
Figure 5.- Block diagram for biochemical based second generation bioethanol
-Bioethanol from switchgrass via Gasification: The switchgrass is pretreated to break the solids
into fine particles that are gasified into raw syngas using direct gasification, which requires a large amount of
steam and pure oxygen. Next, the gas is reformed with steam to eliminate hydrocarbons. Subsequently, the
gas composition is adjusted by removing the excess of hydrogen using a membrane-PSA system. At this
point, sour gases are removed using a PSA system to eliminate the majority of the CO2 followed by the use of
ethanolamines (MEA) to remove the last traces of it as well as the H2S by absorption. In this way, energy is
saved in the recovery of the ethanolamines since it is an expensive distillation that is required to be able to
9
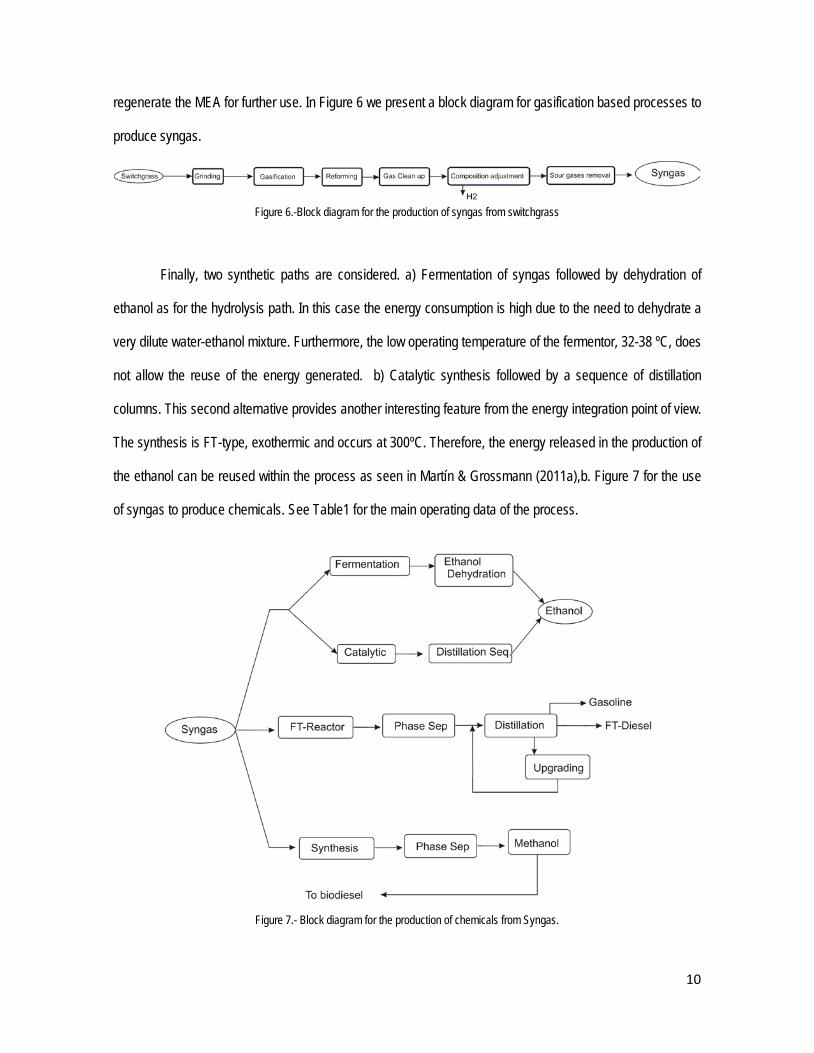
regenerate the MEA for further use. In Figure 6 we present a block diagram for gasification based processes to
produce syngas.
Figure 6.-Block diagram for the production of syngas from switchgrass
Finally, two synthetic paths are considered. a) Fermentation of syngas followed by dehydration of
ethanol as for the hydrolysis path. In this case the energy consumption is high due to the need to dehydrate a
very dilute water-ethanol mixture. Furthermore, the low operating temperature of the fermentor, 32-38 ºC, does
not allow the reuse of the energy generated. b) Catalytic synthesis followed by a sequence of distillation
columns. This second alternative provides another interesting feature from the energy integration point of view.
The synthesis is FT-type, exothermic and occurs at 300ºC. Therefore, the energy released in the production of
the ethanol can be reused within the process as seen in Martín & Grossmann (2011a),b. Figure 7 for the use
of syngas to produce chemicals. See Table1 for the main operating data of the process.
Figure 7.- Block diagram for the production of chemicals from Syngas.
10

3.2.-Synthetic fuels from switchgrass.
-FT-fuels from lignocellulosic switchgrass. Similar to the previous case until the syngas is obtained
and purified, its composition and temperature is adjusted for the optimal production of FT-diesel. As in the
catalytic synthesis of ethanol, the reactor is exothermic and operates at moderate temperature, which allows
heat integration. Furthermore, a certain amount of water is produced in the reaction. Next, the gas and liquid
products are separated and the liquid phase distilled. Liquid–liquid separation between the hydrocarbons and
the water allows a source of water within the process. The bottoms are upgraded, hydrotreated, to increase
the yield towards FT-gasoline and diesel (Martín & Grossmann, 2011c). See Figures 6 and 7 for the block
diagram of the process. In Table 1 we report the energy and water consumption of the process as well as
economic data.
3.3.-Biodiesel production
-Biodiesel from algae. The algae are grown in a pond. Water consumption depends on the source of
the water used in the pond. While the use of freshwater was the first option, lately and with the aim of reducing
water consumption, waste water has been evaluated with good results. Water is also lost by evaporation from
the ponds. Again, the source of that water determines the impact of this loss on freshwater consumption. Next,
the algae are harvested. Subsequently, the oil is extracted using an organic solvent and mechanical action
The oil is next transesterified. Out of the five catalysts evaluated, alkali catalyst gave the best results. After the
transesterification, the methanol is recovered by distillation, where most of the energy of the process is used.
However, the lower operating temperature of the column to avoid glycerol decomposition, allows certain
integration. Note, that in biodiesel production the reaction is in equilibrium. Apart from the catalyst load, the
temperature and the excess of methanol are used to drive the equilibrium to products. Next, the biodiesel is
separated from the glycerol using gravity separation. Subsequently, the removal of the catalyst is carried out
using a washing step. The water used here must be treated to be reused. Finally, the glycerol and the
biodiesel are purified by distillation. The high operating temperatures results in the need for high temperature
sources of energy, and therefore reduces the possibility of energy integration (Martín & Grossmann, 2012b).
Table 1 summarizes the energy and water consumption of the process.
11
-Biodiesel from cooking oil. Similar to the previous process, in this case we have to determine the
effect of the impurities accompanying the oil on the reaction removing them if necessary. The optimization
performed suggests the use of heterogeneous catalysts, since they are not so vulnerable to impurities in the
feedstock, and simplifies the methanol recovery and biodiesel purification, reducing the investment cost of the
plant and the energy consumption (Martín & Grossmann, 2012). The advantage is that no washing step is
needed, reducing the water needed in the process. Table 1 presents the data with a clear advantage in water
consumption compared to the process that uses algae.
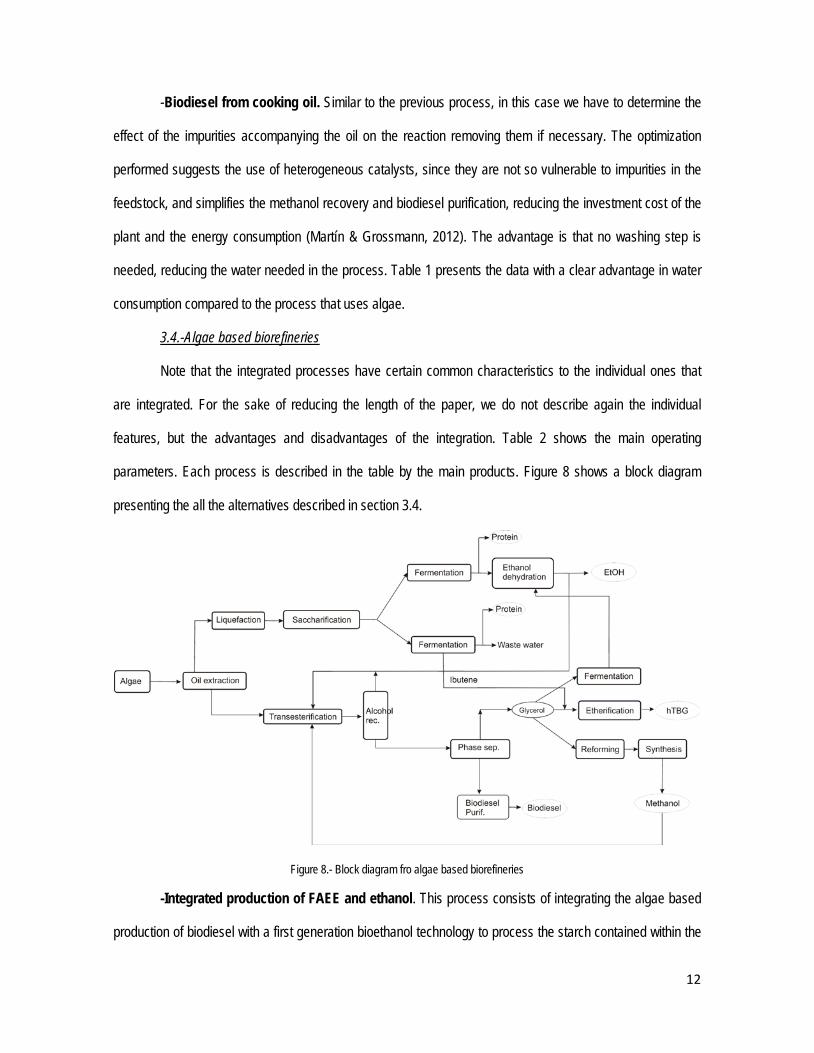
3.4.-Algae based biorefineries
Note that the integrated processes have certain common characteristics to the individual ones that
are integrated. For the sake of reducing the length of the paper, we do not describe again the individual
features, but the advantages and disadvantages of the integration. Table 2 shows the main operating
parameters. Each process is described in the table by the main products. Figure 8 shows a block diagram
presenting the all the alternatives described in section 3.4.
Figure 8.- Block diagram fro algae based biorefineries
-Integrated production of FAEE and ethanol. This process consists of integrating the algae based
production of biodiesel with a first generation bioethanol technology to process the starch contained within the
12

algae. Thus, algae are grown in ponds. Next, by using an organic solvent in an almost closed cycle and
mechanical action, the oil is extracted and the starch is separated. The starch is broken down into glucose via
liquefaction and saccharification. Subsequently the glucose is fermented into ethanol. Finally, the ethanol is
dehydrated. In parallel, the oil is transesterified using the dehydrated ethanol. The use of homogeneous
catalysts implies the need of a washing step. Heterogeneous catalysts, although typically require larger excess
of alcohol to reach the same conversion, with the corresponding consumption of energy to recover it, simplifies
the purification of the product. The ethanol is recovered, recycled and mixed with part of the ethanol produced
from the starch. The glycerol is separated from the biodiesel and sold as byproduct (Martín & Grossmann,
2013a). See Table 2. Figure 8 shows the block diagram for algae based processes including all the
alternatives evaluated.
-Use of glycerol to produce methanol. Although the use of methanol is widespread due to its lower cost and
faster reaction times compared to other alcohols, its source is typically not sustainable. Methanol is mainly
produced from coal or natural gas steam reforming consuming energy (steam reforming is endothermic) and
water. However, the production of glycerol together with biodiesel, is potentially promising to reduce the need
for fossil based methanol. Based on the facility that produces biodiesel from cooking oil, it is possible to
consider glycerol reforming to produce syngas and with it methanol. Reforming can be endothermic, steam
reforming, or adiabatic, autoreforming, which reduces the energy needs but consumes pure oxygen. Once the
syngas is produced, it has to be cleaned from hydrocarbons, but mainly CO2. A concentration of around 8% of
CO2 is needed for the catalysis to be efficient. We use PSA based on the studies in bioethanol production to
reduce the energy needs of the process. The production of methanol is an equilibrium reaction controlled by
the ratio H2 to CO and the temperature. The reaction is exothermic and the moderate operating temperature
allows heat integration. Furthermore, water can be generated, and then after treatment, reused within the
process. By using glycerol as a source of methanol, the fossil based methanol is reduced by almost half
(Martín & Grossmann, 2013b). See Table 2 and Figure 8 for the block diagram
-High ethers production. Starting with the same basic process as before, we can increase the
production of diesel substitutives by glycerol etherification. The glycerol is etherified with ibutene for the
13
production of hTGB, high glycerol ethers. Energy is consumed in the purification steps since, after a liquid-
liquid separation, two distillation columns are used to recover the ibutene and the hTGB’s, while recycling the
monoethers and the glycerol. The low operating pressures at these columns reduce the operating
temperatures allowing energy integration (Martín & Grossmann, 2014b). In Table 2 the main operating
parameters are presented and in Figure 8 the block diagram is shown
-Integrated production of FAEE and ethanol using glycerol to enhance ethanol production. The basic
process corresponds to the simultaneous production of biodiesel and bioethanol. The glycerol produced can
also be fermented to ethanol, and thus increasing the production of ethanol. We consider the integrated
process that produces biodiesel and ethanol from algae. The glycerol is then further processed to ethanol. The
dehydration steps are already needed since we obtain ethanol from sugar fermentation. Therefore, although
the energy consumption due to the dehydration of a larger stream increases, so does the yield from algae to
biofuels (Martín & Grossmann, 2014a). The other advantage is the economies of scale due to the common
section for ethanol dehydration. See Table 2 and Figure 8 for the block diagram
3.5-Wind and Solar based processes.
While wind and solar energy has been devoted to the production of power, the main challenge so far
is the storage. The availability of solar and wind energy results in volatile power production with time. However,
we can store that power as chemical energy by synthesizing chemicals. i.e. methane, using CO2 as carbon
source. In this section we describe the production of power from concentrated solar power facilities and the
production of methane from wind and solar energy. See Table 3 for the summary of the results
-Concentrated solar power facilities (CSP). Concentrated solar power facilities consist of three
sections: The heliostat field, including the tower collector and the molten salts storage tanks, a regenerative
Rankine cycle, that includes the steam turbine, and the cooling system. A fraction of the flow of salts is used to
superheat the steam before it is fed to the first stage of the turbine. The rest is used to reheat the steam before
it is fed to the second stage. In the second stage of the turbine, a fraction of the steam is extracted at medium
pressure and it is used to heat up the condensate. Finally, the rest of the steam is expanded to an exhaust
pressure, condensed and recycled. In order to condense the exhaust, wet or dry facilities can be used. The
14

consumption of water is clearly dependent on the technology selected. The use of a cooling tower results in
the losses of water mentioned above due to evaporation and drift (Martín & Martín, 2013). While the
consumption of water in thermal plants is a concern, when solar thermal plants are considered, it all becomes
more important since these facilities are typically located in regions where the solar incidence is high, and by
default, the water availability is low. Therefore, the use of dry cooling (Martín, 2015 submitted) is an interesting
option to reduce water consumption in energy production. We need to bear in mind that there is a small
amount of water that it is typically used to clean the mirrors, but it is nothing compared to the losses by
evaporation. See Figure 9 for a block diagram.
Figure 9.- Block diagram for CSP facilities.
Apart from the production of power, we can use that power to produce hydrogen through electrolysis
and with it methane, a drop-in fuel.
-Methane production using CO2 and hydrolytic H2. Either a solar field (Davis & Martín, 2014b) or a
wind farm (Davis & Martín, 2014a) can be used to provide the electricity needed for the electrolysis of water.
In this process water is the raw material, and thus it is consumed as such. Out of its breakage, oxygen and
hydrogen are produced. The oxygen is compressed and dehydrated. The hydrogen stream is purified to
remove the traces of oxygen and next dehydrated. Subsequently, CO2 is fed to the system generating
15
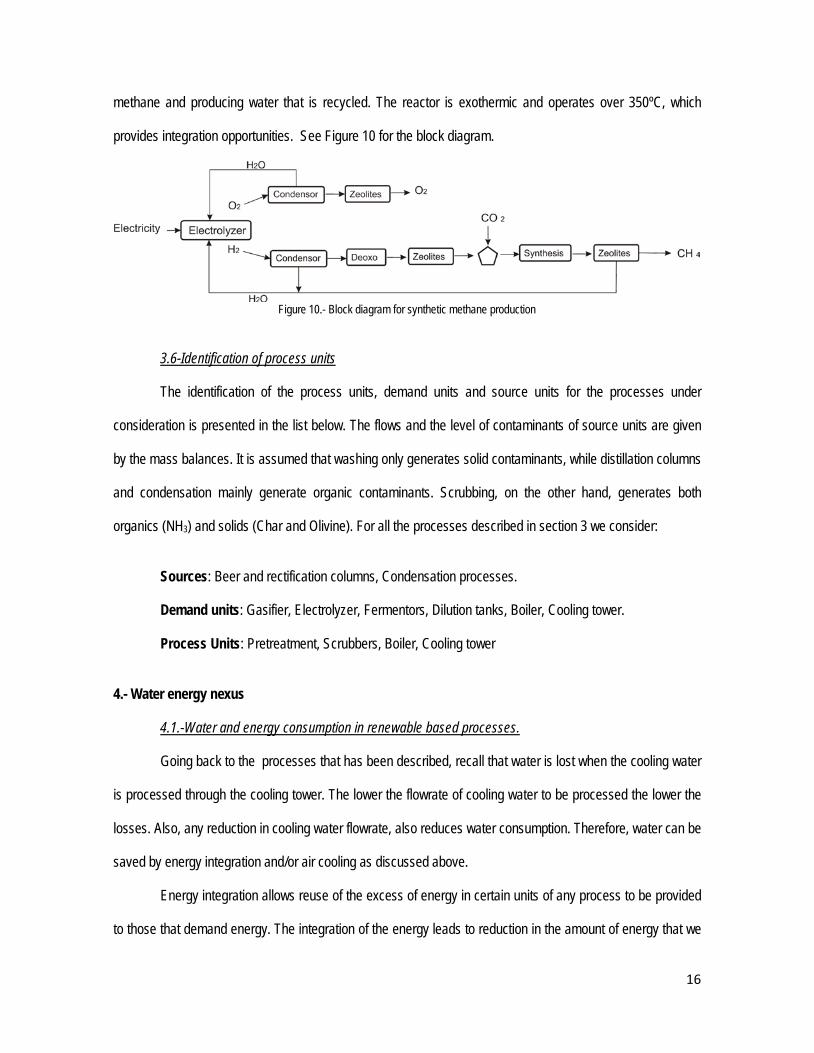
methane and producing water that is recycled. The reactor is exothermic and operates over 350ºC, which
provides integration opportunities. See Figure 10 for the block diagram.
Figure 10.- Block diagram for synthetic methane production
3.6-Identification of process units
The identification of the process units, demand units and source units for the processes under
consideration is presented in the list below. The flows and the level of contaminants of source units are given
by the mass balances. It is assumed that washing only generates solid contaminants, while distillation columns
and condensation mainly generate organic contaminants. Scrubbing, on the other hand, generates both
organics (NH3) and solids (Char and Olivine). For all the processes described in section 3 we consider:
Sources: Beer and rectification columns, Condensation processes.
Demand units: Gasifier, Electrolyzer, Fermentors, Dilution tanks, Boiler, Cooling tower.
Process Units: Pretreatment, Scrubbers, Boiler, Cooling tower
4.- Water energy nexus
4.1.-Water and energy consumption in renewable based processes. Going back to the processes that has been described, recall that water is lost when the cooling water
is processed through the cooling tower. The lower the flowrate of cooling water to be processed the lower the
losses. Also, any reduction in cooling water flowrate, also reduces water consumption. Therefore, water can be
saved by energy integration and/or air cooling as discussed above.
Energy integration allows reuse of the excess of energy in certain units of any process to be provided
to those that demand energy. The integration of the energy leads to reduction in the amount of energy that we
16

need to remove from the process using cooling utilities. Furthermore, the waste energy remaining is already at
low temperature. An example of this direct link and the implication of water consumption were presented by
Ahmetovic et al. (2010). The authors reported the improvement in energy consumption when mathematical
optimization techniques were applied to the optimization of first generation corn-based ethanol. They first
performed the superstructure optimization, followed by the synthesis of the HEN, and finally the substitution of
the distillation columns by multieffect columns. Following this scheme, the energy consumption was reduced
form 79 MW to 35.9 MW; i.e. almost half the energy consumption was reduced. In parallel to this, because of
the reuse of the energy available within the process, the cooling needs of the process decreased from 59 MW
to 21.5 MW, see Figure 11 for the relationship. As a result, the flow of water to be treated in the cooling tower
decreased by two thirds, resulting in a decrease in the water consumption from around 4.1 gal/gal to 1.5
gal/gal. In Figure 12 shows the direct relationship between the energy consumed and the water consumed in
the production process for bioethanol production from corn,
Figure 11.- Energy vs cooling needs in the corn ethanol process Figure 12.- Energy – water link in the corn ethanol process.
The second option corresponds to the use of air cooling. In this case Martín et al. (2010) for the
second generation bioethanol production discussed the advantages of using air cooling to reduce the use of
water as a cooling agent. Air cooling could be used for thermal based processes to a larger extent due to the
higher operating temperatures across the flowsheet. In those cases, water savings of 10-50 % were obtained
by replacing water by air. More significant were the savings in power production. Concentrated Solar Power
technologies using cooling towers require 2.1 L/kWh for cooling (Martín & Martín, 2013). However, If dry
17

technologies are used, instead of using cooling water, 5-10 % of the power produced was used by the fans of
the air cooler for the condensation of the steam (Martín, 2015).
The similar analysis was conducted for all the processes presented in section 3, and Tables 1-4
summarize the operating data. Table 1 summarizes the information related to each of the individual processes,
those which produce one main product such as ethanol, biodiesel. FT diesel, using different raw materials. We
see that only second generation bioethanol or FT diesel report negative consumptions of energy. In terms of
water consumption, good energy integration is possible in thermal based processes, since they operates at
high pressures and temperatures, thereby reducing the water needs. Thus, ethanol production from
gasification of switchgrass and FT-diesel production show reduced water consumption values. Only slightly
above, is the water consumption for the production of biodiesel from cooking oil. It is important to note that the
simultaneous optimization and heat integration used in the biodiesel process design, resulted in operating
conditions at the reactors that were different than the ones reported in the literature. Actually the reason was
that the reactor was optimized alone targeting the highest conversion, without taking into consideration the
energy consumption to recover the excess of alcohol used to drive the equilibrium to products (Martín &
Grossmann, 2012). Table 2 shows the comparison for the alkali and acid homogeneous catalyst. Note that for
the integrated process KOH was used, to improve the removal of the catalysis by precipitation by forming
K2PO4. This was not considered in previous work either.
Table 1.- Summary of the main features of the optimized processes Ethanol (Corn) Ethanol Ethanol Ethanol FT-Diesel Biodiesel Biodiesel (Hydrolysis) (Gasification &
Catalysis) (Gasification & Fermentation)
(Cooking) (Algae)
Investment ($MM) 90 169 335 260 216 17 110 Capacity(MMgal/yr) 60 60 60 60 60 72 69 Production cost ($/gal) 1.24 0.80 0.41 0.81 0.72 0.66 0.42 Water consumption(gal/gal) 1.5 1.66 0.36 1.59 0.15 0.33 0.60 Energy consump. (MJ/gal) 11.5 -10.2 -9.5 27.2 -62.0 1.94 1.94
18

Table 2.- Comparison of operating conditions at the reactor: simulation vs simultaneous optimization and heat integration Simulation Optimization Alkali [a,b] Acid([a,b] Alkali Acid
(Algae / Cooking Oil) H2SO4 */NaOH H2SO4/KOH Temperature(ºC) 70*/60 80 45/45 (64.6)* 47.5/47.5 Pressure (bar) 4*/4 4 4/4(4)f 4f
Alcohol : oil ratio(mol/mol) 6:1*/6:1 50:1 6.6/6.6(1)* 20/20 Residence time(h) 1* / 4 4 2/2(2.45)* 48 Catalyst 1*/1(%w/w) 1.3:1 molar to oil 1.06/1.063(0.4)* 2/2
(Zhan et al 2003, West et al 2008) (*) Pretreatment (f) fixed
Table 3 summarizes the information of the integrated processes where either glycerol is further used
to produce methanol, ethanol or ethers or the raw material, algae, are used to simultaneously produce ethanol
and biodiesel. We see that in most of the cases the water consumption remains within a small range. The main
product is biodiesel, and therefore, all the processes share a large portion of the flowsheet. Only when oil is
used as raw material for the production of FAEE and glycerol ethers, and not considering the water used for
ethanol production, good heat integration results in lower water consumption. In terms of energy consumption,
the use of homogeneous alkali catalysts for oil transesterification show higher consumptions. In spite of the
lack of energy sources within algae based biorefineries, the advantage is that they have good energy
integration.
Table 3.- Summary of alage based integrated processes EtOH+FAEE+
Gly EtOH+FAEE+
Gly EtOH+ FAEE
EtOH+ FAEE
FAME+MetOH FAME+MetOH EtOH+FAEE+ hTBG
FAEE+ hTBG
FAME+ hTBG
(Alkali) (Enzymes) (Enzymes) (Alkali) Autoref Steam Ref
Investment ($MM) 175 180 211 198 118 121 167 27.2 30 Capacity(MMgal/yr) 91 90 94 (13
EtOH) 96 (13 EtOH)
69 69 105 (9 EtOH) 81 84
Production cost ($/gal) 0.32 0.35 0.45 0.38 0.66 0.69 1.00 1.33 1.26 Water
consumption(gal/gal) 0.77 0.59 0.59 0.84 0.79 0.79 0.59 0.29 0.65
Energy consump. (MJ/gal)
6.72 4.00 4.20 7.65 3.65 3.71 3.36 2.54 1.71
Finally, Table 4 shows the main operating parameters for solar and wind based power and chemicals
production. We present one case where no water is used, CSP using dry cooling. Even though water for mirror
cleaning is reported, it is neither process water nor water to produce the raw material. The wet cooling CSP
process, as thermal plants, consumes water due to the evaporative losses in the cooling tower and the value,
2.1 L/kWH, is very similar to the one reported for coal based thermal plants (Torcellini et al., 2003). Apart from
19

that, we see the relative large water consumption for the production of methane. Even though water is
produced together with the methane and recycled, cooling needs for the electrolyzer and for the rest of the
process, increase water consumption. Furthermore, in this case water is also a raw material for the production
of hydrogen.
Table 4 Summary of the main operating parameters of the solar and wind based processes.
CSP (wet) CSP (Dry) Solar CH4 Wind CH4
Investment ($MM) 260 265 240 375 Capacity See Energy See Energy 33.7 M m3 CH4
111 Mkg O2 33.7 M m3 CH4
111 Mkg O2 Production cost (€kWh) 0.15 0.16 0.33 0.48 (€/m3)
Water consumption(L/kWh) 2.1 0 13.5 13.5 kg/m3 Energy(GWh) 117 111 0 0
4.2.-Water- Energy link in renewable based processes
For a number of fuels and sources of power we evaluate the link between the energy, the net energy
including that needed in the process, and the one obtained when we burn the fuel, and the water consumed to
evaluate the more efficient fuel and process among those studied. See Figure 13 for the summary of the
results. Bear in mind that the use of CSP with dry cooling does not require process water, and thus the ratio
presented should be infinite. Among the other processes, we see that FT is the most efficient. As seen in
Table 1, this process produces a large amount of energy. Part of the energy is due to the production of flue
gas, and the rest because of the high operating temperatures and exothermic reactions. Furthermore, the yield
to fuels is medium to high among the alternatives. If we evaluate the bioethanol production processes, the
most efficient is the one that follows the thermo-catalytic path. In this case, apart from producing energy from
ethanol, we can produce it from hydrogen. Furthermore, the process has a net energy balance itself as in
Table 1. The cooling can be carried out with the use of air as cooling agent to reduce water consumption as
presented by Martín et al (2010).
20
The production of ethanol from corn, or using other technologies to process the switchgrass, results in
very similar efficiencies in water consumed per MJ produced. In the case of the corn-based ethanol, we do not
include the irrigation water for corn. The process itself requires energy, but the ethanol produced and the
reduced water consumption due to proper energy integration and WN design, results in competitive
efficiencies compared to the production of bioethanol via hydrolysis of switchgrass. In this particular case,
although the process is in itself quite similar to the corn based one, the operating temperatures in the
pretreatment are higher and so is the steam consumption for breaking up the biomass structure. Switchgrass,
and in general lignocellulosic biomasses, are more robust than corn grain, which requires more energy to
expose the sugars. Furthermore, the fermentation allows lower concentration of ethanol in the reactor
compared to the first generation one as presented before, which result in larger energy consumption for
dehydration. The advantage is the presence of lignin that can provide energy for the process, resulting in a
positive net energy balance. On the contrary, if the thermal-biochemical path is selected, the energy balance of
the process is not positive as seen in Table 1. The concentration of ethanol in the syngas fermentor is typically
lower than 5%. Therefore, the water-ethanol mixture is rather dilute, requiring a large amount of energy for the
separation. Although the biomass gasification section has several streams that can provide energy to the
system because of the high temperature, there is not enough energy available in the process. Furthermore,
the exothermic reactor operating as in all other fermentations around 32-38ºC, results in the need for a certain
amount of water for cooling. In summary, the water efficiency of this process is similar to corn-ethanol and
biochemical switchgrass based ethanol, but not competitive with the use of the thermo-catalytic path.
As efficient in terms of water consumption as second generation bioethanol via thermo-chemical
path, is the production of diesel from waste cooking oil and the production of biodiesel, bioethanol and high
glycerol ethers. In the first case, we use a residue, cooking oil. Note that we do not consider the water
consumption in the production of the waste. This process requires little energy, only in the recovery of the
methanol and the purification of the products, but the yield to biodiesel is high and the water consumption is
reduced, 0.33 gal/gal. The use of algae as raw material decreases the water efficiency by half. There are a
number of reasons. First, the catalyst used is homogeneous, and therefore washing is required to remove the
21
ions increasing the water consumption. Furthermore, the process requires cooling for a distillation column that
recovers the solvent used in the extraction of the oil form the algae. As a result, the water consumption is twice
that when cooking oil is used, and the yield to products does not change. Most of the other processes that
have algae as raw material, have as upper bound this as water efficiency. For instance, the use of glycerol to
produce methanol. Even though it reduces the dependency on fossil fuel, it does not increase the yield to
biofuels resulting in water efficiencies in the level of not using the glycerol at all. The simultaneous production
of ethanol and biodiesel and the further use of glycerol to increase the production of ethanol also present
similar values in terms of water efficiency. In this case, we increase the yield form algae to fuels, since not only
biodiesel but also ethanol is produced. On the other hand, the production of ethanol increases the energy
consumption in the dehydration step. Finally, the production of glycerol ethers shows an interesting result.
When we use cooking oil as raw material, ethanol as transesterifying agent and later the glycerol is etherified
to produce glycerol ethers, the energy integration is efficient and the water consumption of the process is low
resulting in high water efficiency. In other alternatives such as starting from algae and producing ethanol,
biodiesel and glycerol ethers or from cooking oil but using methanol instead of ethanol as transesterifying
agent, the water efficiency is around 50 MJ/L. We need to bear in mind that when methanol, ibutene or another
raw material is included, the water consumed in the production of this raw material is not included in the study,
and therefore the overall efficiency can be lower. Furthermore, in this analysis we have not included the water
needed in case switchgrass requires irrigation, assuming it Is native to the regions where it grows (Wu et al
2009), or if freshwater was used in the ponds. In the end, even if no irrigation is needed, water from rainfall has
actually being consumed.
Finally, we see that the solar and wind based processes are not that efficient compared to biomass
based processes. Actually no more that 6 MJ are produced per L of water used in the process but in the case
of the dry cooling CSP facility in which case we could claim almost infinity water efficiency. However, no
additional water is actually needed for “producing” the raw material, contrary to the case for the biomass based
fuels where even if it is waste water or rainfall, more water is involved in the process.
22

We now add the consumption of water in irrigation for corn, 7-14 gal/gal (Wu et al , 2009). We
assume 7 gal/gal since it is an old range and agricultural methods have improved, while for algae it is reported
that from 3.15 to 3650 gal/gal are needed (NSC, 2009). We consider the average. The production of
switchgass does not require irrigation as it is native. Therefore, no change in the efficiency is expected. Figure
14 updates Figure 13 accounting for irrigation. We can see that the water efficieny of algae based processes
and corn ethanol are really low compared to lignocellulosic based fuels or even solar and wild based ones.
Figure 13- Water-energy nexus at the process level in renewable based processes
23

Figure 14- Water-energy nexus in renewable based processes: Process level and Irrigation
Accounting for rainfall is challenging. Actually even if we do not use freshwater in growing crops, that
does not mean that no water has been consumed to produce the raw material. 1mm of rain represents 1L per
m2. In the native regions of the US where switchgrass is produced, around 1.27 m of rain per year are
collected (Linacre and Geerts, 1998). With a typicall 10-18 t/hectare of swichgrass and the current yield from
the biomass to ethanol, we can assume about 5119 L of rain fall per L of ethanol produced and 3065 L of rain
per L of FT fuel produced. In terms of corn, the typicall rain fall is about 75 mm average raining in the cornwall
of the US (www.holiday –weather.com) with an average yield of 8 t/hectare, 245 L of rain per L of ethanol. With
these rough estimations we complete Figure 15 where all the water involved in the production of each fuel is
accounted for. We see that there are no longer large differences, since rainfall, even if it is free, is water
consumed to produce the biomass. From Figure 16 we can conclude that CSP dry is the more efficienct since
no water is used for the production of power. Among the other proceses, the use of cooking oil does not
require that much water either. Apart from these two exceptions where the raw material or the process does
not use water at all, most of the processes are similar in the water efficiency, FT and all the algae based ones,
24

see the detail in Figure 16. Second generation ethanol is not much more efficient. The only advantage is that
nature provides for that water and not human such in the case of algae or corn.
Figure 15- Water-energynexus in renewable based processes: Irrigation water and rainfall
Figure 16- A detail of the Water-energynexus in renewable based processes: Irrigation water and rainfall
25

5.- Conclusions In this work, the water – energy nexus for the production of renewable based power and fuels has
been evaluated. A number of different processes from various raw materials to obtain bioethanol biodiesel, FT
fuels, among others have been described in terms of their energy and water consumption.
There is a strong link based on the losses of water by evaporation in the cooling tower. The smaller
the cooling needs requiring water, the lower the water consumption of the process. Air cooling and energy
integration are both technologies for reducing the water consumption.
Among the number of processes evaluated we have considered the energy consumed by the process
and that obtained, either as power or thermal energy, and if the fuel produced is burned. We see that only four
processes produced over 100 MJ per L of water consumed, FT fuels being the most efficient because of a
number of reasons such as the fact that the synthesis produced water itself, that there is a large excess of
energy within the process and the FT fuels are produced with high yield from the biomass.
Finally, when rain fall is accounted for in the water consumption for the production of fuels, no large
differences among raw materials or products are found. Water efficiency is low in general, and avoiding water
for raw material production improves the overall water efficiency of the particular fuel.
Acknowledgments
The authors gratefully acknowledge the funding from the NSF Grant CBET0966524 and the Center for Advanced Process Decision-making at Carnegie Mellon University. 6. References. Ahmetovic, E. and Grossmann, I.E., 2011. Global superstructure optimization for the design of integrated process water networks. AIChE. J. 57(2), 434–457. Ahmetović, E., Martin, M., Grossmann, I. E., 2010. Optimization of Energy and Water Consumption in Corn–based Ethanol Plants. Ind. Eng. Chem. Res. 49 (17), 7972-7982 American Boiler Manufactures Association (2015). http://www.abma.com/ APHA, 1989. American Public Health Association Standard methods for the examination of water and wastewater, American Public Health Association, 17th ed. Davis, W., Martín, M., 2014. Optimal year-round operation for methane production from CO2 and Water using wind energy. Energy 69, 497-505
26

Davis, W., Martín, M., 2014 Optimal year-round operation for methane production from CO2 and Water using wind and/or Solar energy. J. Cleaner Prod. 80 , 252-261. Duran, M.A.,Grossmann, I.E., 1986. Simultaneous optimization and heat integration of chemical processes. AIChE J. 32, 123–138. Galan, B., Grossmann, I.E., 1998. Optimal design of distributed wastewater treatment networks. Ind. Eng. Chem. Res. 37, 4036–4048. Karuppiah, R., Grossmann, I.E., 2006 Global Optimization for the Synthesis of Integrated Water Systems in Chemical Processes. Comp. Chem. Eng., 30, 650-673 Karrupiah, R., Peschel, A., Grossmann, I.E., Martín, M., Martinson, W., Zullo, L ., 2008 Energy optimization of an Ethanol Plant. AICHE J.. 54, 6, 1499-1525. Linacre, E., Geerts, B., 2008. Rainfall and rain fall changes in the USA: http://www-das.uwyo.edu/~geerts/cwx/notes/chap17/rain_usa.html Linnhoff, B., Hindmarsh, E., 1983. The pinch design method for heat exchanger networks. Chem. Eng. Sci. 38, 745–763. Martín, M.., Grossmann, I.E.., 2011a. Energy optimization of lignocellulosic bioethanol production via gasification. AIChE J. 57(12), 3408–3428. Martín, M., Grossmann, I.E.., 2012. BIOptPACK: A Library of models for Optimization of Biofuel Production Processes. Computer Aid. Chem. Eng. 30, 16-20 Martín, M., Ahmetovic, E., Grossmann, I.E., 2011. Optimization of Water Consumption in Second Generation bio-Ethanol Plants. Ind. Eng. Chem. Res. 50 (7), 3705–3721 Martín, M., Grossmann, I.E., 2011b. Energy optimization of Hydrogen production from biomass. Comp. Chem. Eng. 35(9), 1798-1806 Martín, M., Grossmann, I.E., 2012a. Energy optimization of lignocellulosic bioethanol production via Hydrolysis of Switchgrass. AIChE J. 58 (5), 1538-1549 Martín, M., Grossmann, I.E., 2011c Process optimization of FT- Diesel production from biomass. Accepted Ind. Eng. Chem. Res. 50 (23),13485–13499 Martín, M., Grossmann, I.E., 2012b. Simultaneous optimization and heat integration for biodiesel production from cooking oil and algae. Ind. Eng. Chem. Res. 51 (23), 7998–8014 Martín, M., Grossmann, I.E., 2013a. Optimal engineered algae composition for the integrated simultaneous production of bioethanol and biodiesel. AIChE J. 59 (8), 2872–2883 Martín, L., Martín, M., 2013. Optimal year-round operation of a Concentrated Solar Energy Plant in the South of Europe App.. Thermal Eng. 59, 627-633. Martín, M.; Grossmann, I.E. 2013b. ASI: Toward the Optimal Integrated Production of Biodiesel with Internal Recycling of Methanol Produced from Glycerol. Environ. Prog. Sust. Energ. 32(4), 791-801
27

Martín, M., Grossmann, I.E., 2014a Simultaneous dynamic optimization and heat integration for the co-production of diesel substitutes: Biodiesel (FAME & FAEE) and glycerol ethers from algae oil. Ind. Eng. Chem. Res.. 53, 11371-11383 Martín, M., Grossmann, I.E. , 2014b. Design of an optimal process for enhanced production of bioethanol and biodiesel from algae oil via glycerol fermentationApplied. Energy. 10.1016/j.apenergy.2014.08.054 135, 108-114 Martin M., Grossmann I.E., 2015. Optimal production of biodiesel (FAEE) and bioethanol from switchgrass DOI: 10.1021/ie5038648 Martín, M. (2015) Optimal year-round operation of a Concentrated Solar Energy Plant with dry cooling in the South of Europe Energy. Revision submitted. NSC. 2009. Sustainable development of algal biofuels in the United States. Washington, DC: The National Academies Press. Patoczka, J., Impact of chemicals addition in water / wastewater treatment on TDS concentration and sludge generation. 2007 http://www.patoczka.net/Jurek%20Pages/Papers/Florida%2007%20Paper.pdf
Perry, R. H, & Green, D. W., 1997. Perry's Chemical Engineer's Handbook, New York: McGraw-Hill.
Takama, N., Kuriyama, T., Shiroko, K., Umeda, T., 1980, Optimal water allocation in a petroleum refinery, Comp.Chem.Eng. 4, 251-258 Torcellini, P., Long, N., Judkoff, R., 2003. Consumptive Water Use for U.S. Power Production. NREL/TP-550-33905, www.nrel.gov/docs/fy04osti/33905.pdf (last accessed January 2013) Yang, L.., Grossmann, I.E., 2013. Water targeting models for simultaneous flowsheet optimization. Ind. Eng. Chem. Res. 52, 3209–3224. Yee, T.F., Grossmann, I.E., 1990. Simultaneous optimization models for heat integration. II. Heat exchanger network synthesis. Comput. Chem. Eng. 14, 1165–1184. Wang, Y.P. and Smith, R. 1994. Wastewater minimization. Chem. Eng. Sci. 49, 981–1006. West, A.H., Posarac, D., Ellis, N., 2008. Assessment of four biodiesel production processes using HYSYS.Plant. Bioresour. Technol. 99, 6587. Wu, M., Mintz, M., Wang., M., Arora, S., 2009 Water Consumption in the Production of Ethanol and Petroleum Gasoline Environ. Manag. 44:981–997 Zhang, Y.; Dube, M. A.; McLean, D. D.; Kates, M., 2003. Biodiesel Production from Waste Cooking Oil: 1. Process Design and Technological Assessment. Bioresour. Technol., 89, 1-16 http://www.holiday-weather.com/cornwall/averages/ last accessed Feb 2015 http://www.earth-policy.org/books/fpep/fpepch7 last accessed Feb 2015
28