Embed Size (px)
Citation preview
Water, Climate, Food, and Environment in the Sacramento Basin1
Annette Huber-Lee, David Yates, David Purkey, Winston Yu, and Benjamin Runkle Contribution to ADAPT: Adaptation strategies to changing environments
1 This project is also supported by t he U.S. EPA Global Change Research Program, Office of Research and Development
Water, Climate, Food, and Environment in Sacramento Basin 2 Contribution to ADAPT: Adaptation strategies to changing environments
Contents 1. Introduction ......................................................................................................3 2. Background........................................................................................................ 4
2.1. Natural Resources............................................................................................. 6 2.1.1. Climate......................................................................................................... 6 2.1.2. Topography .................................................................................................. 9 2.1.3. Land use .....................................................................................................10 2.1.4. Surface Water Resources..............................................................................12 2.1.5. Groundwater Resources................................................................................17 2.1.6. Soils............................................................................................................18 2.1.7. Water Quality ..............................................................................................21 2.1.8. Ecosystems..................................................................................................21
2.2. Socio-Economic Characteristics .........................................................................25 2.3. Institutional Arrangements...............................................................................25
3. Projections for future......................................................................................27 3.1. Socio-economic and Land Use Drivers and Pressures..........................................27 3.2. Climate change ................................................................................................28
4. Modeling activities..........................................................................................33 4.1. Field scale .......................................................................................................33
4.1.1. SWAP model................................................................................................33 4.1.2. Data............................................................................................................33 Meteorological .......................................................................................................33 4.1.3. Field Scale Results.......................................................................................34
4.2. Basin scale ......................................................................................................34 4.2.1. WEAP model................................................................................................34
5. Impacts............................................................................................................36 5.1. Indicators ........................................................................................................36 5.2. Impacts with No Climate Change ......................................................................37 5.3. Impacts with Climate Change ...........................................................................38
5.3.1. Hydrology....................................................................................................38 5.3.2. Food Security...............................................................................................38 5.3.3. Environmental Security.................................................................................41
6. Adaptation Strategies .....................................................................................43 6.1. Historical Adaptations to Climate Variability .......................................................43 6.2. Food Security Adaptations................................................................................44 6.3. Environmental Security Adaptations ..................................................................44 6.4. Integrated Adaptations.....................................................................................45
7. Evaluation of Adaptation Strategies..............................................................47 7.1. Food Security...................................................................................................47 7.2. Environmental Security.....................................................................................48
7.2.1. Instream Flow Requirements for Salmon and the Estuary ...............................48 7.2.2. Wetlands .....................................................................................................50 7.2.3. Domestic Water Supply Sector ......................................................................52 7.2.4. Groundwater Storage ...................................................................................52
7.3. Integration ......................................................................................................53 8. Conclusions......................................................................................................54 References...................................................................................................................57
Water, Climate, Food, and Environment in Sacramento Basin 3 Contribution to ADAPT: Adaptation strategies to changing environments
1. Introduction The scale of water development in California is among the most substantial in the world, with water often being shifted from one basin to another over distances of hundreds of kilometers in order to satisfy water demands. Most water management issues relate to ever increasing urban demands competing with agriculture and environmental needs. Primary among the sources of water available in California is the Sacramento River, which not only supplies the critical agricultural area of the Central Valley, but also supplies municipal and industrial demands on the Southern California Coastal Plain between Los Angeles and San Diego. As such, the water resource situation in the Sacramento Basin cannot be discussed in isolation from the situation statewide. It is anticipated that metropolitan regions in the Central Valley, such as Sacramento, will grow dramatically in the future as the large coastal metropolitan areas, such as the San Francisco Bay Area and Los Angeles, become increasingly crowded. This urban expansion is taking place beside large scale agriculture. Not surprisingly, the development of irrigated agriculture has dramatically changed the natural landscape in the basin. Today only 5 percent of historic wetlands in the Sacramento Basin remain, and these are contained largely within the 13,000 hectares of the Sacramento National Wildlife Refuge Complex. In addition, only 5 percent of the original 200,000 hectares of riparian forest along the river and its tributaries remains. While the Sacramento River and its tributaries continue to support some of the southern -most runs of Pacific salmonids, the continued viability of these runs is threatened by water development. Currently, there are three distinct perspectives on the state of water management in the Sacramento Basin. The first is that the balance between water for food and water for the environment has been destructively tipped in favor of irrigated agriculture and that the only possible future is one based on constant efforts to roll back the irrigated area in the basin. The second is that the Sacramento Basin is too valuable as an agricultural resource to be constrained by environmental considerations and that issues of wat er for the environment should be dealt with in other, less valuable, areas. Both these views are increasingly giving way to a third perspective that seeks to balance the complex tradeoffs and interactions between water for food and water for the environment in the basin. Establishing this balance is a work in progress, and the prospect of climate change offers the real possibility that the emerging balance will be upset and that further adaptation will be required. Climate change and increased climate variability may have a profound impact on the availability of water resources in the Sacramento basin and will consequently affect the use of water for domestic use, the environment, and irrigation purposes. The importance of understanding the tradeoffs and interactions among competing water uses will only increase with the added potential of climate change. Relevant to the Sacramento Basin, GCM projections estimate that (1) average temperatures could increase by as much as 5? C and that (2) mean annual precipitation may decrease over the period 1990 to 2100. As part of the Dutch funded ADAPT project (Aerts and Droogers, 2002), river basins in several parts of the world have been selected to analyze and compare adaptation strategies in terms of water resources to climate change. The seven basins selected are:
? Mekong, South-East Asia ? Rhine, Western Europe ? Sacramento, USA ? Syr Darya, Central Asia ? Volta, Ghana ? Walawe, Sri Lanka ? Zayandeh, Iran
Water, Climate, Food, and Environment in Sacramento Basin 4 Contribution to ADAPT: Adaptation strategies to changing environments
This report first provides an overview of the Sacramento Basin, both the natural resources and the most important water related issues and problems in the Sacramento basin. This is followed by a description of possible projections for the future of the region, including climate change. These projections are quantitatively modeled both at the field and basin scale, and impacts are assessed both with and without climate change, particularly from the perspective of food and environmental security. The final chapters deal with how to cope with these impacts by developing and evalu ating regional adaptation strategies for water managers. The report concludes with a summary of potential impacts and some thoughts about the choices facing the region, both for Sacramento and the State of California as a whole.
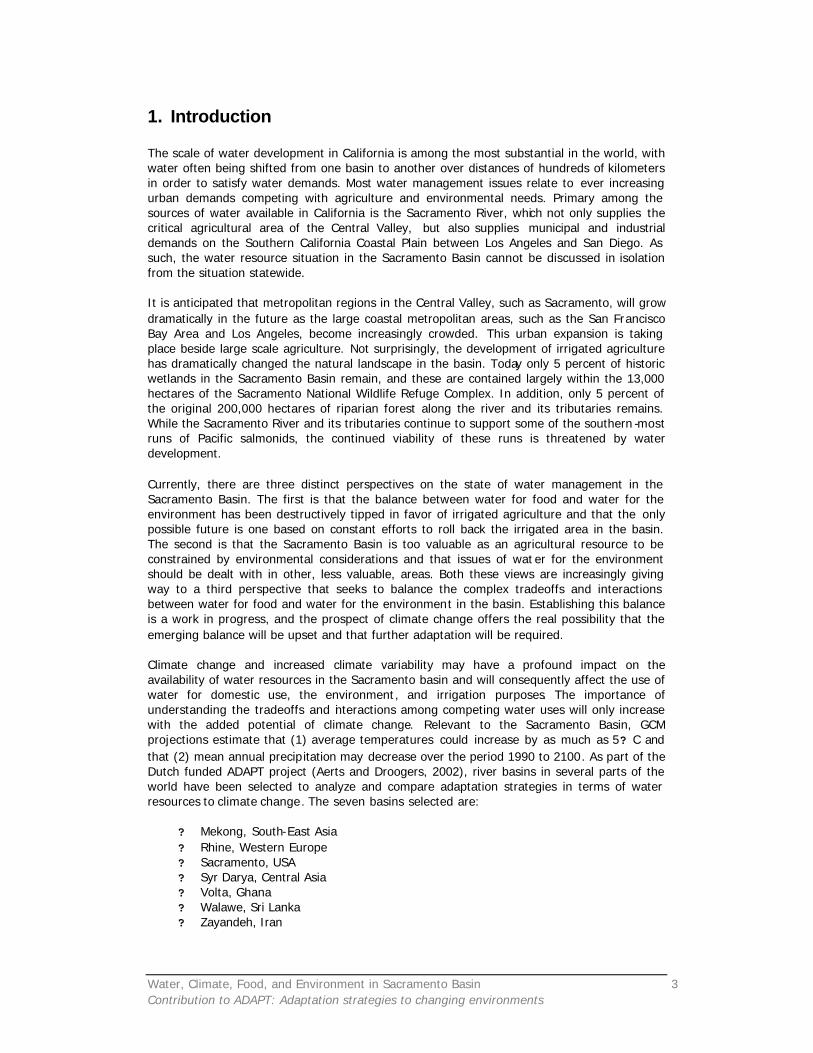
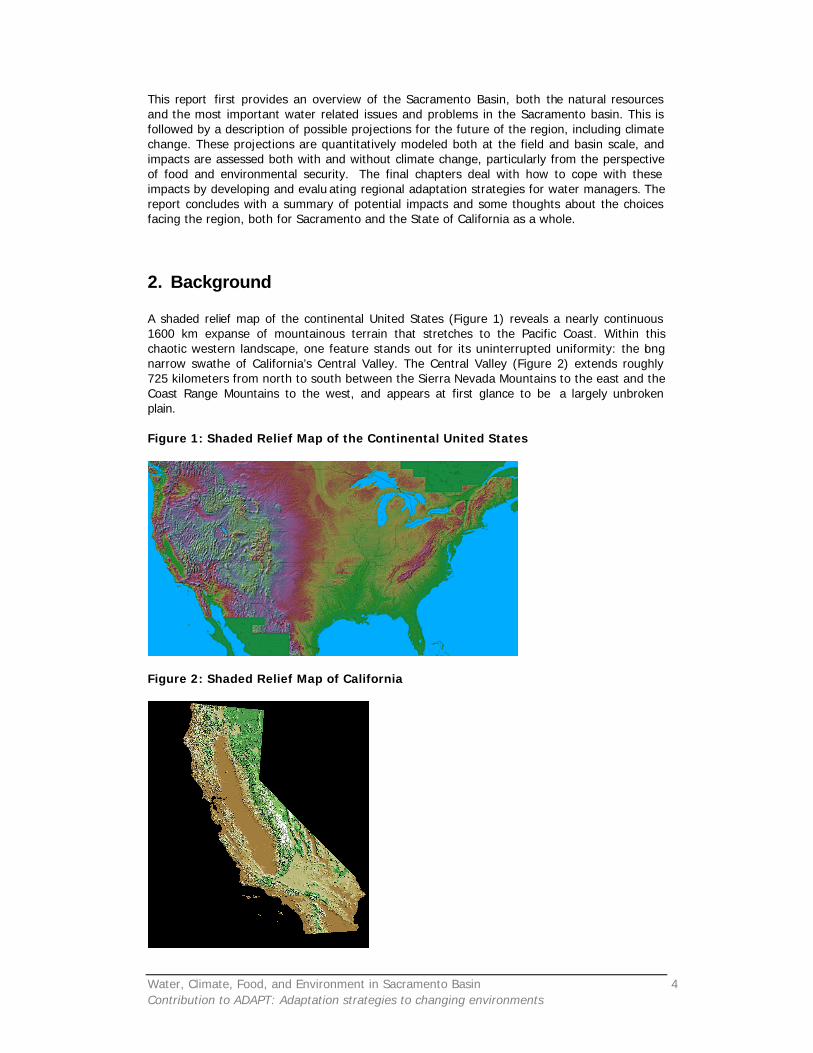
2. Background A shaded relief map of the continental United States (Figure 1) reveals a nearly continuous 1600 km expanse of mountainous terrain that stretches to the Pacific Coast. Within this chaotic western landscape, one feature stands out for its uninterrupted uniformity: the long narrow swathe of California’s Central Valley. The Central Valley (Figure 2) extends roughly 725 kilometers from north to south between the Sierra Nevada Mountains to the east and the Coast Range Mountains to the west, and appears at first glance to be a largely unbroken plain. Figure 1: Shaded Relief Map of the Continental United States
Figure 2: Shaded Relief Map of California
Water, Climate, Food, and Environment in Sacramento Basin 5 Contribution to ADAPT: Adaptation strategies to changing environments
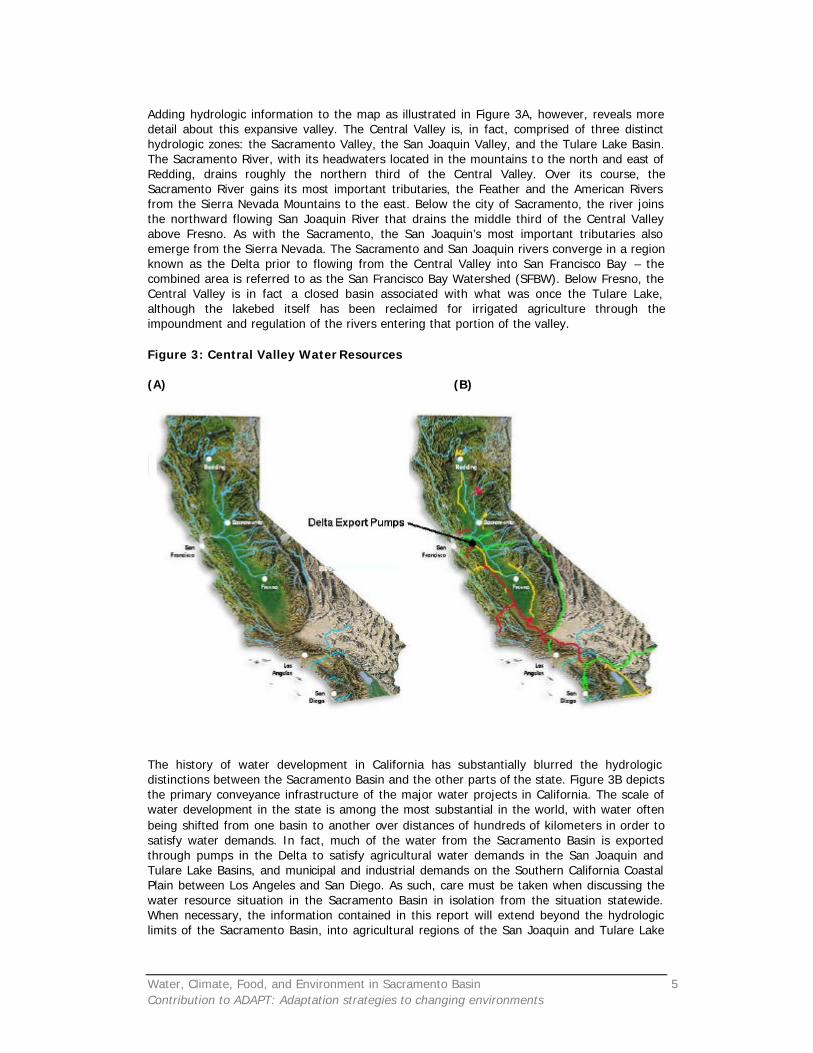
Adding hydrologic information to the map as illustrated in Figure 3A, however, reveals more detail about this expansive valley. The Central Valley is, in fact, comprised of three distinct hydrologic zones: the Sacramento Valley, the San Joaquin Valley, and the Tulare Lake Basin. The Sacramento River, with its headwaters located in the mountains to the north and east of Redding, drains roughly the northern third of the Central Valley. Over its course, the Sacramento River gains its most important tributaries, the Feather and the American Rivers from the Sierra Nevada Mountains to the east. Below the city of Sacramento, the river joins the northward flowing San Joaquin River that drains the middle third of the Central Valley above Fresno. As with the Sacramento, the San Joaquin’s most important tributaries also emerge from the Sierra Nevada. The Sacramento and San Joaquin rivers converge in a region known as the Delta prior to flowing from the Central Valley into San Francisco Bay – the combined area is referred to as the San Francisco Bay Watershed (SFBW). Below Fresno, the Central Valley is in fact a closed basin associated with what was once the Tulare Lake, although the lakebed itself has been reclaimed for irrigated agriculture through the impoundment and regulation of the rivers entering that portion of the valley.
Figure 3: Central Valley Water Resources (A) (B)
The history of water development in California has substantially blurred the hydrologic distinctions between the Sacramento Basin and the other parts of the state. Figure 3B depicts the primary conveyance infrastructure of the major water projects in California. The scale of water development in the state is among the most substantial in the world, with water often being shifted from one basin to another over distances of hundreds of kilometers in order to satisfy water demands. In fact, much of the water from the Sacramento Basin is exported through pumps in the Delta to satisfy agricultural water demands in the San Joaquin and Tulare Lake Basins, and municipal and industrial demands on the Southern California Coastal Plain between Los Angeles and San Diego. As such, care must be taken when discussing the water resource situation in the Sacramento Basin in isolation from the situation statewide. When necessary, the information contained in this report will extend beyond the hydrologic limits of the Sacramento Basin, into agricultural regions of the San Joaquin and Tulare Lake
Water, Climate, Food, and Environment in Sacramento Basin 6 Contribution to ADAPT: Adaptation strategies to changing environments
Basins and the cities of Southern California, in order to place the basin in its proper water management context. With that caveat, what then are the key distinguishing characteristics of the Sacramento Basin? Approximately 2.9 million of California’s 32.7 million inhabitants live in the counties that are either wholly or partially contained within the basin, with the overwhelming majority living in the Sacramento Metropolitan Region. It is anticipated that metropolitan regions in the Central Valley, such as Sacramento, will grow dramatically in the future as the large coastal metropolitan areas, such as the San Francisco Bay Area and Los Angeles, become increasingly crowded. The Sacramento River and its tributaries convey 31 percent of California’s average annual runoff, a water resource that has supported the development of over 850 thousand hectares of irrigated agriculture in the basin, as well as expansive irrigation development in other parts of the state. The principal crops grown in the Sacramento Basin include rice, olives, orchard fruits and nuts, corn, alfalfa, tomatoes, and vegetables, and for many of these commodities, the basin is a globally important production center. Not surprisingly, the development of irrigated agriculture has dramatically changed the natural landscape in the basin. As discussed above, only 5 percent of historic wetlands in the Sacramento Basin remain, and only 5 percent of the original riparian forest along the river and its tributaries remains. The health of the aquatic ecosystems throughout the Sacramento and its tributaries is in jeopardy.
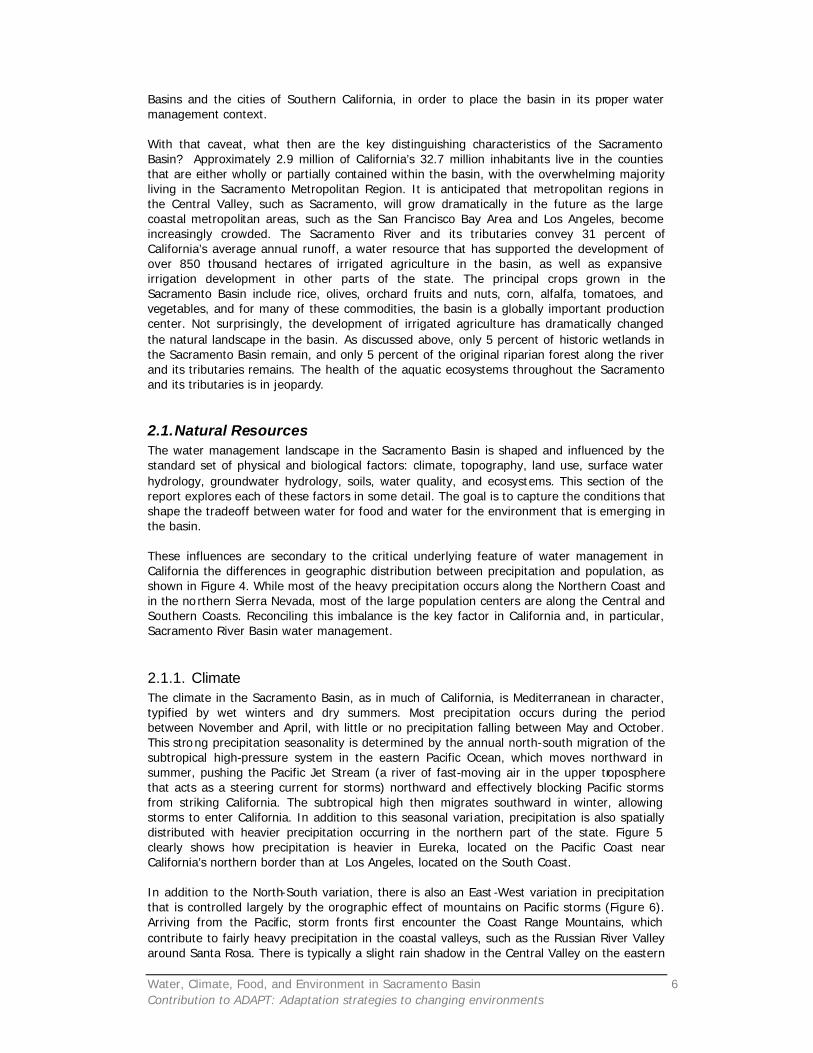
2.1. Natural Resources The water management landscape in the Sacramento Basin is shaped and influenced by the standard set of physical and biological factors: climate, topography, land use, surface water hydrology, groundwater hydrology, soils, water quality, and ecosystems. This section of the report explores each of these factors in some detail. The goal is to capture the conditions that shape the tradeoff between water for food and water for the environment that is emerging in the basin. These influences are secondary to the critical underlying feature of water management in California the differences in geographic distribution between precipitation and population, as shown in Figure 4. While most of the heavy precipitation occurs along the Northern Coast and in the no rthern Sierra Nevada, most of the large population centers are along the Central and Southern Coasts. Reconciling this imbalance is the key factor in California and, in particular, Sacramento River Basin water management.
2.1.1. Climate The climate in the Sacramento Basin, as in much of California, is Mediterranean in character, typified by wet winters and dry summers. Most precipitation occurs during the period between November and April, with little or no precipitation falling between May and October. This strong precipitation seasonality is determined by the annual north-south migration of the subtropical high-pressure system in the eastern Pacific Ocean, which moves northward in summer, pushing the Pacific Jet Stream (a river of fast-moving air in the upper troposphere that acts as a steering current for storms) northward and effectively blocking Pacific storms from striking California. The subtropical high then migrates southward in winter, allowing storms to enter California. In addition to this seasonal variation, precipitation is also spatially distributed with heavier precipitation occurring in the northern part of the state. Figure 5 clearly shows how precipitation is heavier in Eureka, located on the Pacific Coast near California’s northern border than at Los Angeles, located on the South Coast. In addition to the North-South variation, there is also an East -West variation in precipitation that is controlled largely by the orographic effect of mountains on Pacific storms (Figure 6). Arriving from the Pacific, storm fronts first encounter the Coast Range Mountains, which contribute to fairly heavy precipitation in the coastal valleys, such as the Russian River Valley around Santa Rosa. There is typically a slight rain shadow in the Central Valley on the eastern
Water, Climate, Food, and Environment in Sacramento Basin 7 Contribution to ADAPT: Adaptation strategies to changing environments
side of the Coast Range, as typified by precipitation patterns at Sacramento. As advancing weather fronts encounter the higher Sierra Nevada Mountain range precipitation increases dramatically. For, for example at Blue Canyon, with an elevation of 1610 m, the annual rainfall is approximately 1000 mm, while Sacramento receives 500 mm. At higher elevations, much of the precipitation falls as snow which remains on the ground until the spring thaw. Figure 4: Precipitation and Population Distribution in California
Figure 5: North-South Variation in Monthly Precipitation
0
20
40
60
80
100
120
140
160
180
OCT NOV DEC JAN FEB MAR APR MAY JUN JUL AUG SEP
month
aver
age
mon
thly
pre
cipi
tatio
n (m
m)
Eureka Los Angeles
Water, Climate, Food, and Environment in Sacramento Basin 8 Contribution to ADAPT: Adaptation strategies to changing environments
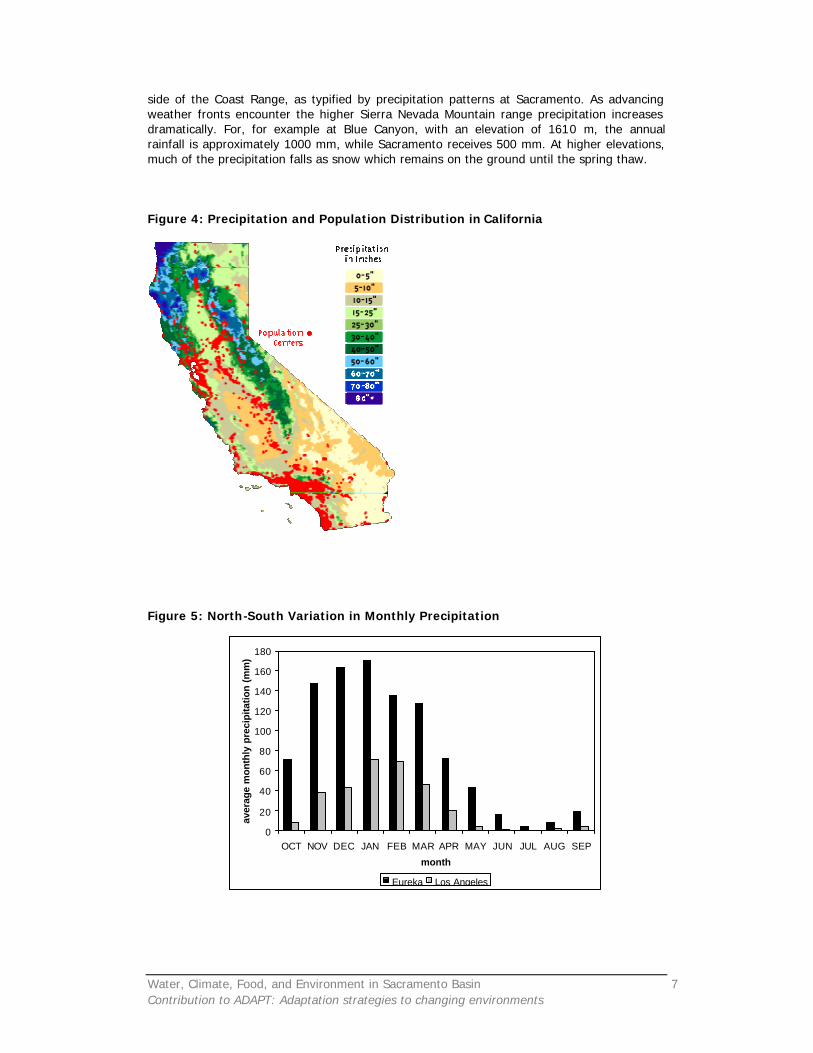
Figure 6: West -East Variation in Monthly Precipitation
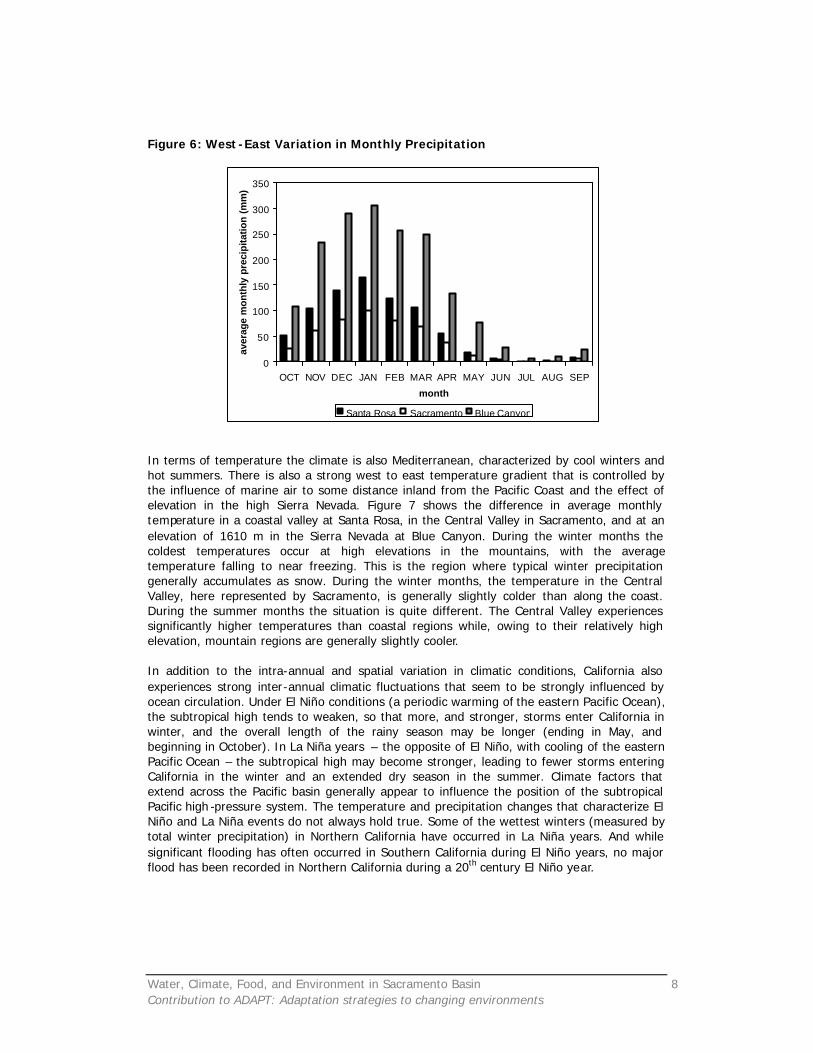
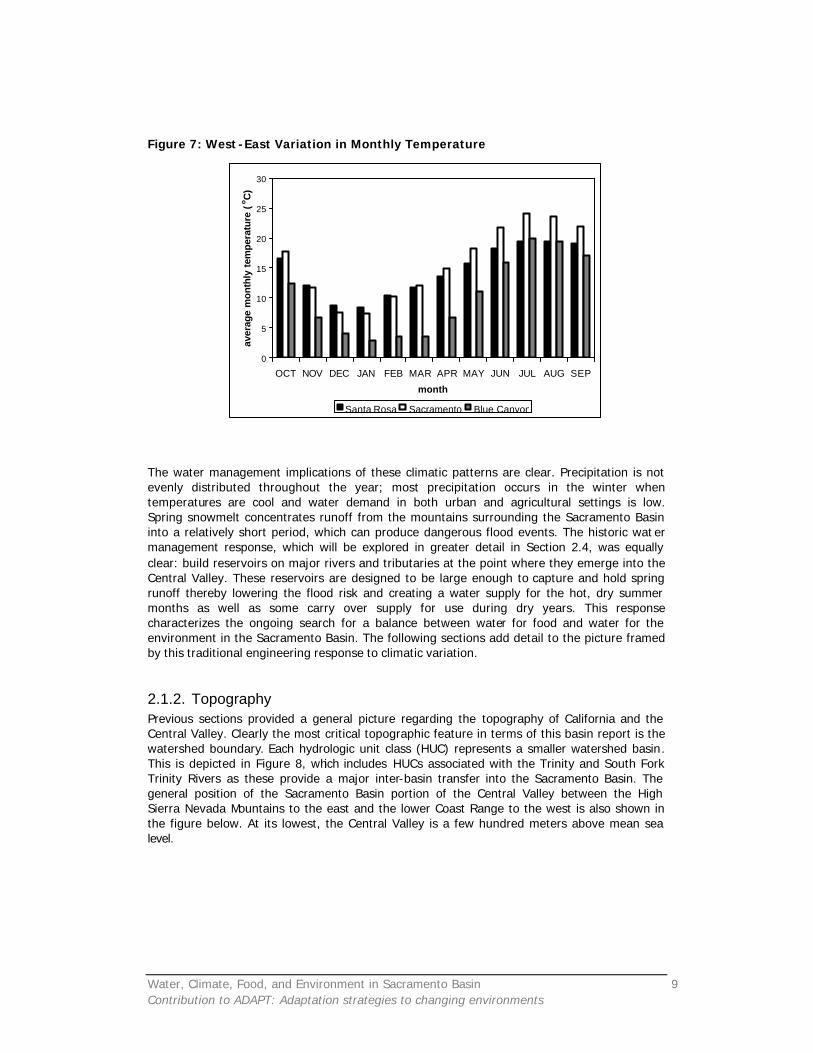
In terms of temperature the climate is also Mediterranean, characterized by cool winters and hot summers. There is also a strong west to east temperature gradient that is controlled by the influence of marine air to some distance inland from the Pacific Coast and the effect of elevation in the high Sierra Nevada. Figure 7 shows the difference in average monthly temperature in a coastal valley at Santa Rosa, in the Central Valley in Sacramento, and at an elevation of 1610 m in the Sierra Nevada at Blue Canyon. During the winter months the coldest temperatures occur at high elevations in the mountains, with the average temperature falling to near freezing. This is the region where typical winter precipitation generally accumulates as snow. During the winter months, the temperature in the Central Valley, here represented by Sacramento, is generally slightly colder than along the coast. During the summer months the situation is quite different. The Central Valley experiences significantly higher temperatures than coastal regions while, owing to their relatively high elevation, mountain regions are generally slightly cooler. In addition to the intra-annual and spatial variation in climatic conditions, California also experiences strong inter-annual climatic fluctuations that seem to be strongly influenced by ocean circulation. Under El Niño conditions (a periodic warming of the eastern Pacific Ocean), the subtropical high tends to weaken, so that more, and stronger, storms enter California in winter, and the overall length of the rainy season may be longer (ending in May, and beginning in October). In La Niña years – the opposite of El Niño, with cooling of the eastern Pacific Ocean – the subtropical high may become stronger, leading to fewer storms entering California in the winter and an extended dry season in the summer. Climate factors that extend across the Pacific basin generally appear to influence the position of the subtropical Pacific high -pressure system. The temperature and precipitation changes that characterize El Niño and La Niña events do not always hold true. Some of the wettest winters (measured by total winter precipitation) in Northern California have occurred in La Niña years. And while significant flooding has often occurred in Southern California during El Niño years, no major flood has been recorded in Northern California during a 20th century El Niño year.
0
50
100
150
200
250
300
350
OCT NOV DEC JAN FEB MAR APR MAY JUN JUL AUG SEP
month
aver
age
mon
thly
pre
cipi
tatio
n (m
m)
Santa Rosa Sacramento Blue Canyon
Water, Climate, Food, and Environment in Sacramento Basin 9 Contribution to ADAPT: Adaptation strategies to changing environments
Figure 7: West -East Variation in Monthly Temperature
The water management implications of these climatic patterns are clear. Precipitation is not evenly distributed throughout the year; most precipitation occurs in the winter when temperatures are cool and water demand in both urban and agricultural settings is low. Spring snowmelt concentrates runoff from the mountains surrounding the Sacramento Basin into a relatively short period, which can produce dangerous flood events. The historic wat er management response, which will be explored in greater detail in Section 2.4, was equally clear: build reservoirs on major rivers and tributaries at the point where they emerge into the Central Valley. These reservoirs are designed to be large enough to capture and hold spring runoff thereby lowering the flood risk and creating a water supply for the hot, dry summer months as well as some carry over supply for use during dry years. This response characterizes the ongoing search for a balance between water for food and water for the environment in the Sacramento Basin. The following sections add detail to the picture framed by this traditional engineering response to climatic variation.
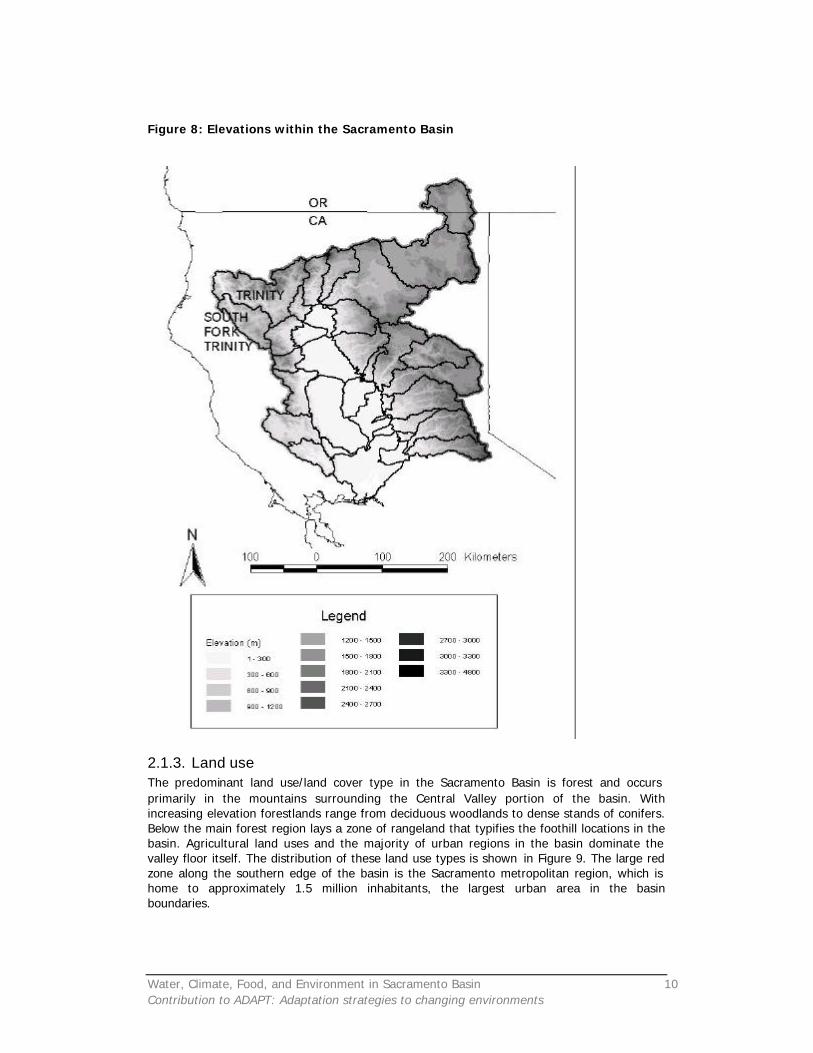
2.1.2. Topography Previous sections provided a general picture regarding the topography of California and the Central Valley. Clearly the most critical topographic feature in terms of this basin report is the watershed boundary. Each hydrologic unit class (HUC) represents a smaller watershed basin. This is depicted in Figure 8, which includes HUCs associated with the Trinity and South Fork Trinity Rivers as these provide a major inter-basin transfer into the Sacramento Basin. The general position of the Sacramento Basin portion of the Central Valley between the High Sierra Nevada Mountains to the east and the lower Coast Range to the west is also shown in the figure below. At its lowest, the Central Valley is a few hundred meters above mean sea level.
0
5
10
15
20
25
30
OCT NOV DEC JAN FEB MAR APR MAY JUN JUL AUG SEP
month
aver
age
mon
thly
tem
pera
ture
(oC
)
Santa Rosa Sacramento Blue Canyon
Water, Climate, Food, and Environment in Sacramento Basin 10 Contribution to ADAPT: Adaptation strategies to changing environments
Figure 8: Elevations within the Sacramento Basin
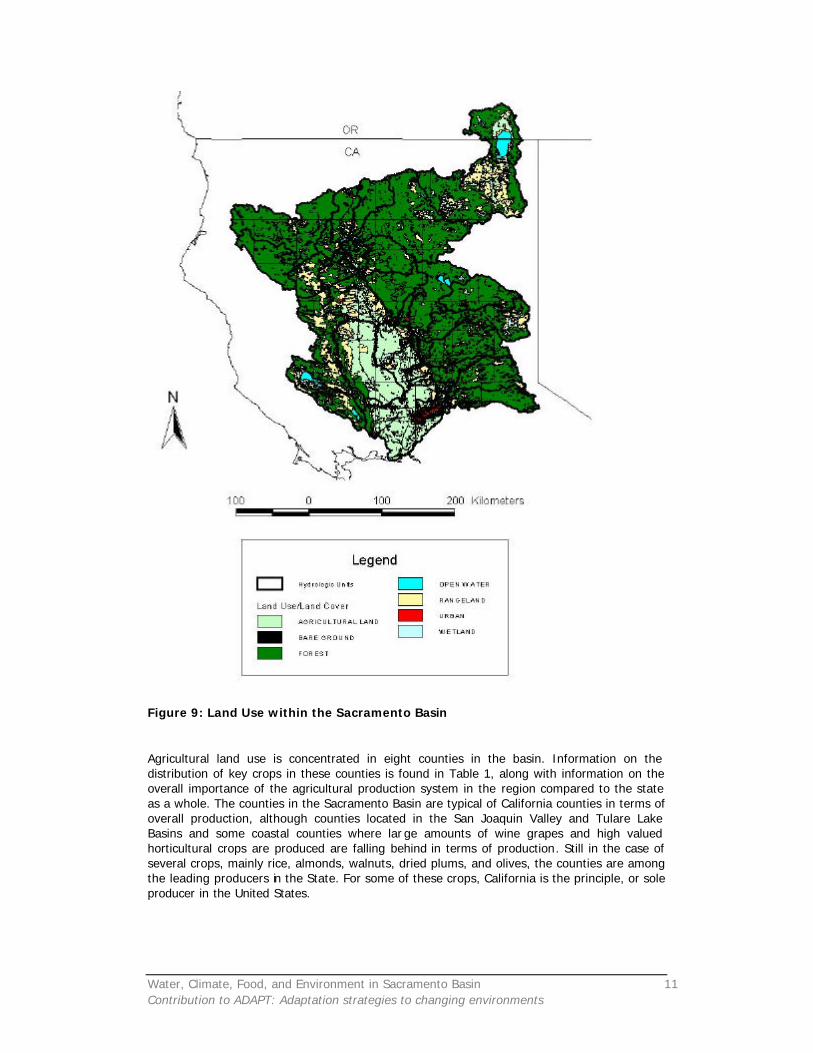
2.1.3. Land use The predominant land use/land cover type in the Sacramento Basin is forest and occurs primarily in the mountains surrounding the Central Valley portion of the basin. With increasing elevation forestlands range from deciduous woodlands to dense stands of conifers. Below the main forest region lays a zone of rangeland that typifies the foothill locations in the basin. Agricultural land uses and the majority of urban regions in the basin dominate the valley floor itself. The distribution of these land use types is shown in Figure 9. The large red zone along the southern edge of the basin is the Sacramento metropolitan region, which is home to approximately 1.5 million inhabitants, the largest urban area in the basin boundaries.
Water, Climate, Food, and Environment in Sacramento Basin 11 Contribution to ADAPT: Adaptation strategies to changing environments
Figure 9: Land Use within the Sacramento Basin Agricultural land use is concentrated in eight counties in the basin. Information on the distribution of key crops in these counties is found in Table 1, along with information on the overall importance of the agricultural production system in the region compared to the state as a whole. The counties in the Sacramento Basin are typical of California counties in terms of overall production, although counties located in the San Joaquin Valley and Tulare Lake Basins and some coastal counties where lar ge amounts of wine grapes and high valued horticultural crops are produced are falling behind in terms of production. Still in the case of several crops, mainly rice, almonds, walnuts, dried plums, and olives, the counties are among the leading producers in the State. For some of these crops, California is the principle, or sole producer in the United States.
Water, Climate, Food, and Environment in Sacramento Basin 12 Contribution to ADAPT: Adaptation strategies to changing environments
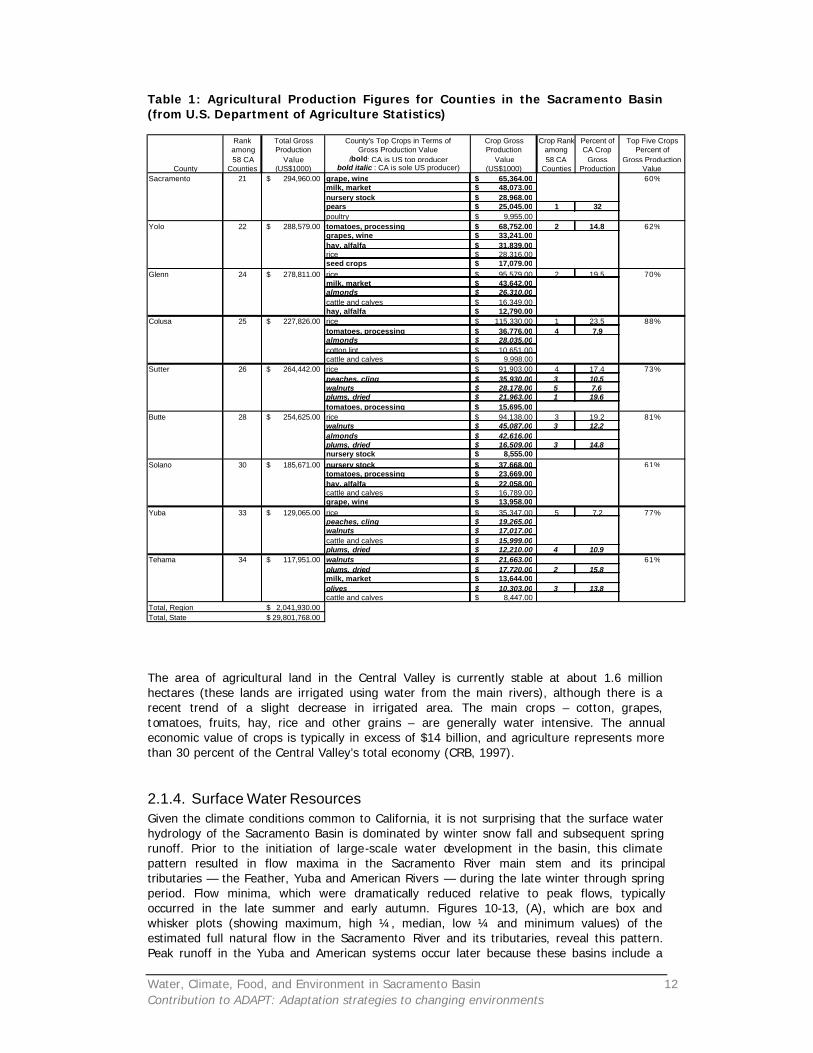
Table 1: Agricultural Production Figures for Counties in the Sacramento Basin (from U.S. Department of Agriculture Statistics)
The area of agricultural land in the Central Valley is currently stable at about 1.6 million hectares (these lands are irrigated using water from the main rivers), although there is a recent trend of a slight decrease in irrigated area. The main crops – cotton, grapes, tomatoes, fruits, hay, rice and other grains – are generally water intensive. The annual economic value of crops is typically in excess of $14 billion, and agriculture represents more than 30 percent of the Central Valley’s total economy (CRB, 1997).
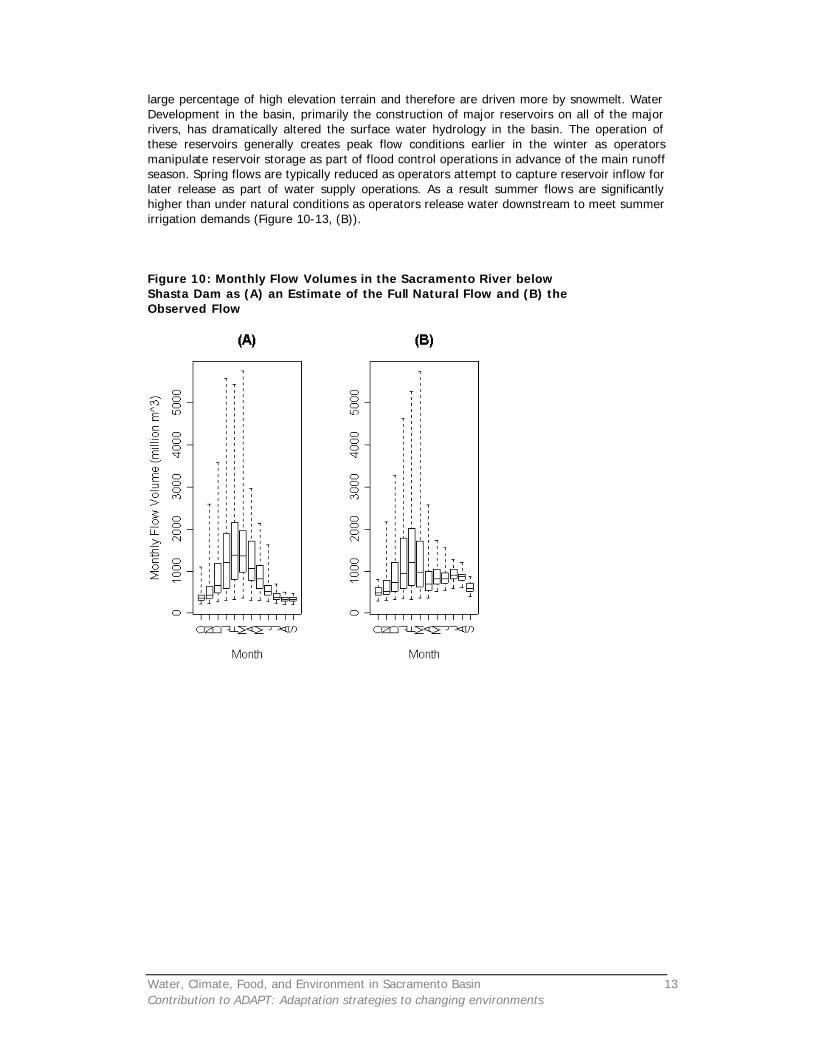
2.1.4. Surface Water Resources Given the climate conditions common to California, it is not surprising that the surface water hydrology of the Sacramento Basin is dominated by winter snow fall and subsequent spring runoff. Prior to the initiation of large-scale water development in the basin, this climate pattern resulted in flow maxima in the Sacramento River main stem and its principal tributaries — the Feather, Yuba and American Rivers — during the late winter through spring period. Flow minima, which were dramatically reduced relative to peak flows, typically occurred in the late summer and early autumn. Figures 10-13, (A), which are box and whisker plots (showing maximum, high ¼, median, low ¼ and minimum values) of the estimated full natural flow in the Sacramento River and its tributaries, reveal this pattern. Peak runoff in the Yuba and American systems occur later because these basins include a
Rank Total Gross County's Top Crops in Terms of Crop Gross Crop Rank Percent of Top Five Cropsamong Production Gross Production Value Production among CA Crop Percent of58 CA Value (bold: CA is US top producer Value 58 CA Gross Gross Production
County Counties (US$1000) bold italic : CA is sole US producer) (US$1000) Counties Production ValueSacramento 21 294,960.00$ grape, wine 65,364.00$ 60%
milk, market 48,073.00$ nursery stock 28,968.00$ pears 25,045.00$ 1 32poultry 9,955.00$
Yolo 22 288,579.00$ tomatoes, processing 68,752.00$ 2 14.8 62%grapes, wine 33,241.00$ hay, alfalfa 31,839.00$ rice 28,316.00$ seed crops 17,079.00$
Glenn 24 278,811.00$ rice 95,579.00$ 2 19.5 70%milk, market 43,642.00$ almonds 26,310.00$ cattle and calves 16,349.00$ hay, alfalfa 12,790.00$
Colusa 25 227,826.00$ rice 115,330.00$ 1 23.5 88%tomatoes, processing 36,776.00$ 4 7.9almonds 28,035.00$ cotton lint 10,651.00$ cattle and calves 9,998.00$
Sutter 26 264,442.00$ rice 91,903.00$ 4 17.4 73%peaches, cling 35,930.00$ 3 10.5walnuts 28,178.00$ 5 7.6plums, dried 21,963.00$ 1 19.6tomatoes, processing 15,695.00$
Butte 28 254,625.00$ rice 94,138.00$ 3 19.2 81%walnuts 45,087.00$ 3 12.2almonds 42,616.00$ plums, dried 16,509.00$ 3 14.8nursery stock 8,555.00$
Solano 30 185,671.00$ nursery stock 37,668.00$ 61%tomatoes, processing 23,669.00$ hay, alfalfa 22,058.00$ cattle and calves 16,789.00$ grape, wine 13,958.00$
Yuba 33 129,065.00$ rice 35,347.00$ 5 7.2 77%peaches, cling 19,265.00$ walnuts 17,017.00$ cattle and calves 15,999.00$ plums, dried 12,210.00$ 4 10.9
Tehama 34 117,951.00$ walnuts 21,663.00$ 61%plums, dried 17,720.00$ 2 15.8milk, market 13,644.00$ olives 10,303.00$ 3 13.8cattle and calves 8,447.00$
Total, Region 2,041,930.00$ Total, State 29,801,768.00$
Water, Climate, Food, and Environment in Sacramento Basin 13 Contribution to ADAPT: Adaptation strategies to changing environments
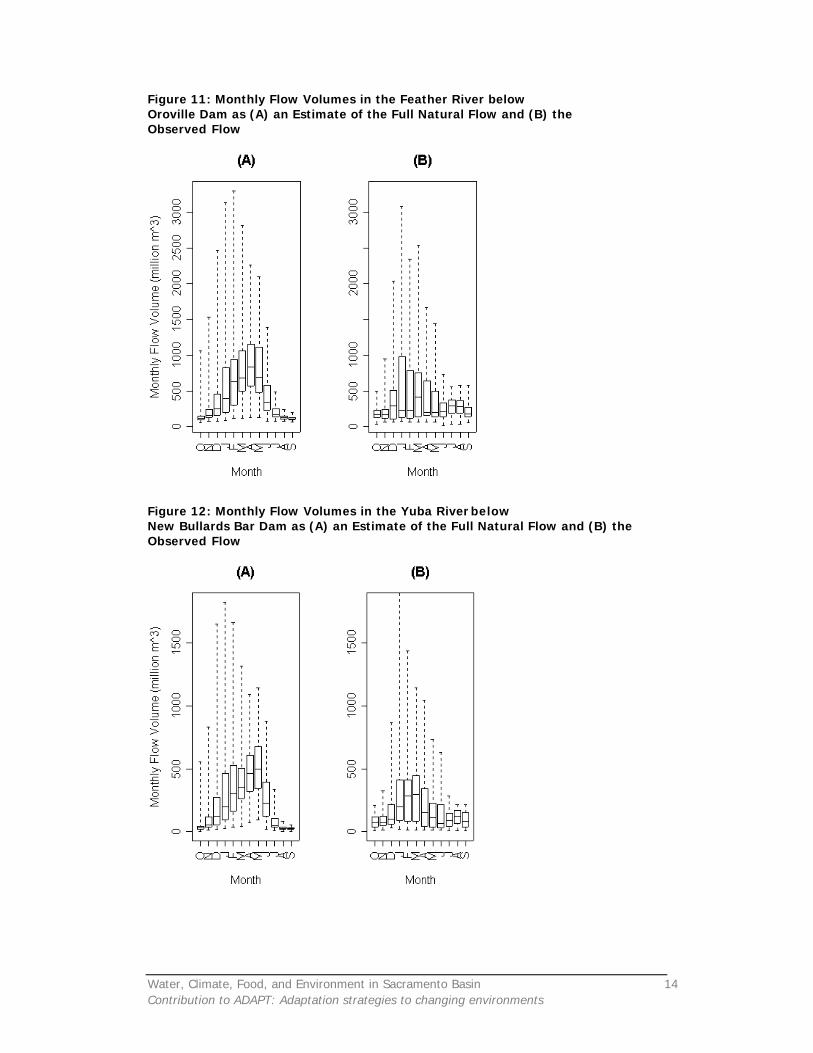
large percentage of high elevation terrain and therefore are driven more by snowmelt. Water Development in the basin, primarily the construction of major reservoirs on all of the major rivers, has dramatically altered the surface water hydrology in the basin. The operation of these reservoirs generally creates peak flow conditions earlier in the winter as operators manipulate reservoir storage as part of flood control operations in advance of the main runoff season. Spring flows are typically reduced as operators attempt to capture reservoir inflow for later release as part of water supply operations. As a result summer flows are significantly higher than under natural conditions as operators release water downstream to meet summer irrigation demands (Figure 10-13, (B)). Figure 10: Monthly Flow Volumes in the Sacramento River below Shasta Dam as (A) an Estimate of the Full Natural Flow and (B) the Observed Flow
Water, Climate, Food, and Environment in Sacramento Basin 14 Contribution to ADAPT: Adaptation strategies to changing environments
Figure 11: Monthly Flow Volumes in the Feather River below Oroville Dam as (A) an Estimate of the Full Natural Flow and (B) the Observed Flow
Figure 12: Monthly Flow Volumes in the Yuba River below New Bullards Bar Dam as (A) an Estimate of the Full Natural Flow and (B) the Observed Flow
Water, Climate, Food, and Environment in Sacramento Basin 15 Contribution to ADAPT: Adaptation strategies to changing environments
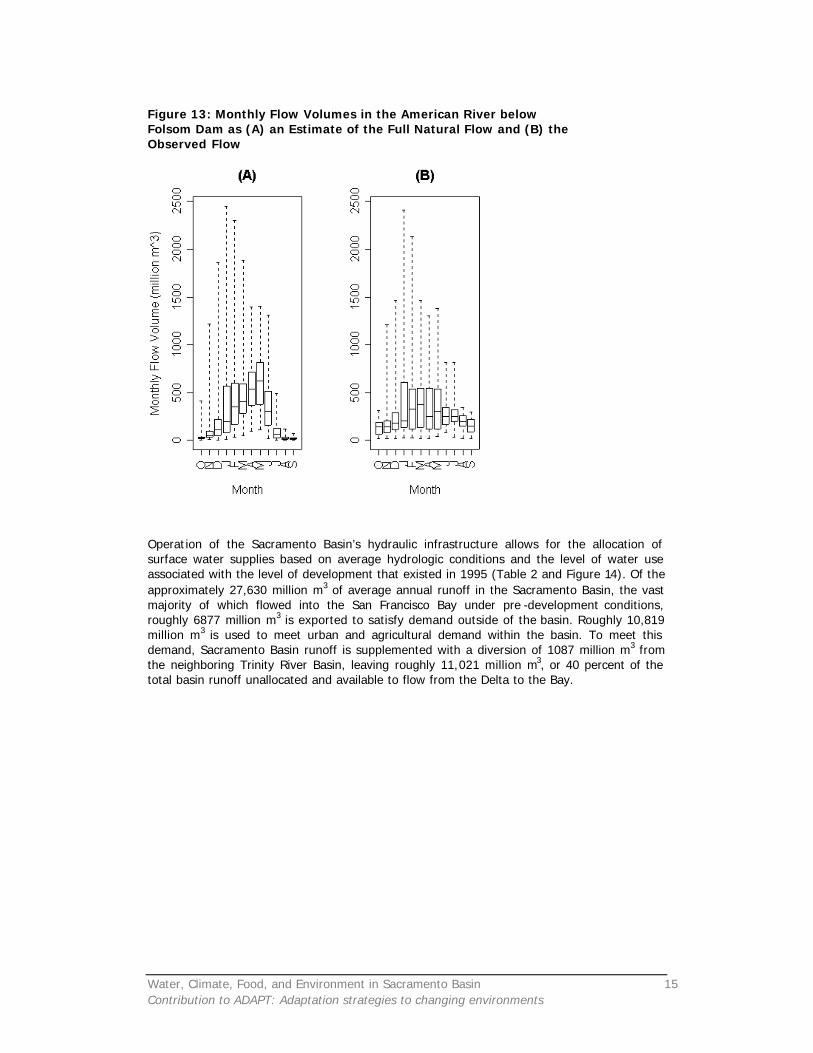
Figure 13: Monthly Flow Volumes in the American River below Folsom Dam as (A) an Estimate of the Full Natural Flow and (B) the Observed Flow
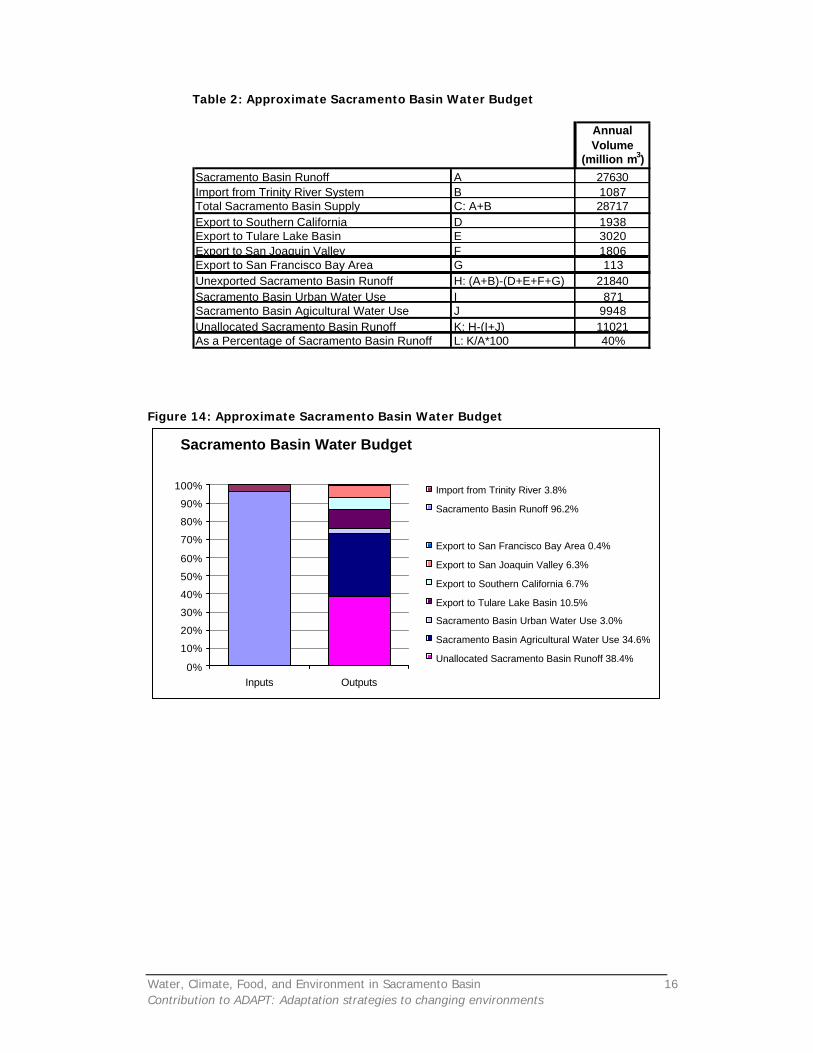
Operation of the Sacramento Basin’s hydraulic infrastructure allows for the allocation of surface water supplies based on average hydrologic conditions and the level of water use associated with the level of development that existed in 1995 (Table 2 and Figure 14). Of the approximately 27,630 million m3 of average annual runoff in the Sacramento Basin, the vast majority of which flowed into the San Francisco Bay under pre -development conditions, roughly 6877 million m3 is exported to satisfy demand outside of the basin. Roughly 10,819 million m3 is used to meet urban and agricultural demand within the basin. To meet this demand, Sacramento Basin runoff is supplemented with a diversion of 1087 million m3 from the neighboring Trinity River Basin, leaving roughly 11,021 million m3, or 40 percent of the total basin runoff unallocated and available to flow from the Delta to the Bay.
Water, Climate, Food, and Environment in Sacramento Basin 16 Contribution to ADAPT: Adaptation strategies to changing environments
Table 2: Approximate Sacramento Basin Water Budget
AnnualVolume
(million m3)
Sacramento Basin Runoff A 27630Import from Trinity River System B 1087Total Sacramento Basin Supply C: A+B 28717Export to Southern California D 1938Export to Tulare Lake Basin E 3020Export to San Joaquin Valley F 1806Export to San Francisco Bay Area G 113Unexported Sacramento Basin Runoff H: (A+B)-(D+E+F+G) 21840Sacramento Basin Urban Water Use I 871Sacramento Basin Agicultural Water Use J 9948Unallocated Sacramento Basin Runoff K: H-(I+J) 11021As a Percentage of Sacramento Basin Runoff L: K/A*100 40%
Figure 14: Approximate Sacramento Basin Water Budget
Sacramento Basin Water Budget
0%
10%
20%
30%
40%
50%
60%
70%
80%
90%
100%
Inputs Outputs
Import from Trinity River 3.8%
Sacramento Basin Runoff 96.2%
Export to San Francisco Bay Area 0.4%
Export to San Joaquin Valley 6.3%
Export to Southern California 6.7%
Export to Tulare Lake Basin 10.5%
Sacramento Basin Urban Water Use 3.0%
Sacramento Basin Agricultural Water Use 34.6%
Unallocated Sacramento Basin Runoff 38.4%
Water, Climate, Food, and Environment in Sacramento Basin 17 Contribution to ADAPT: Adaptation strategies to changing environments
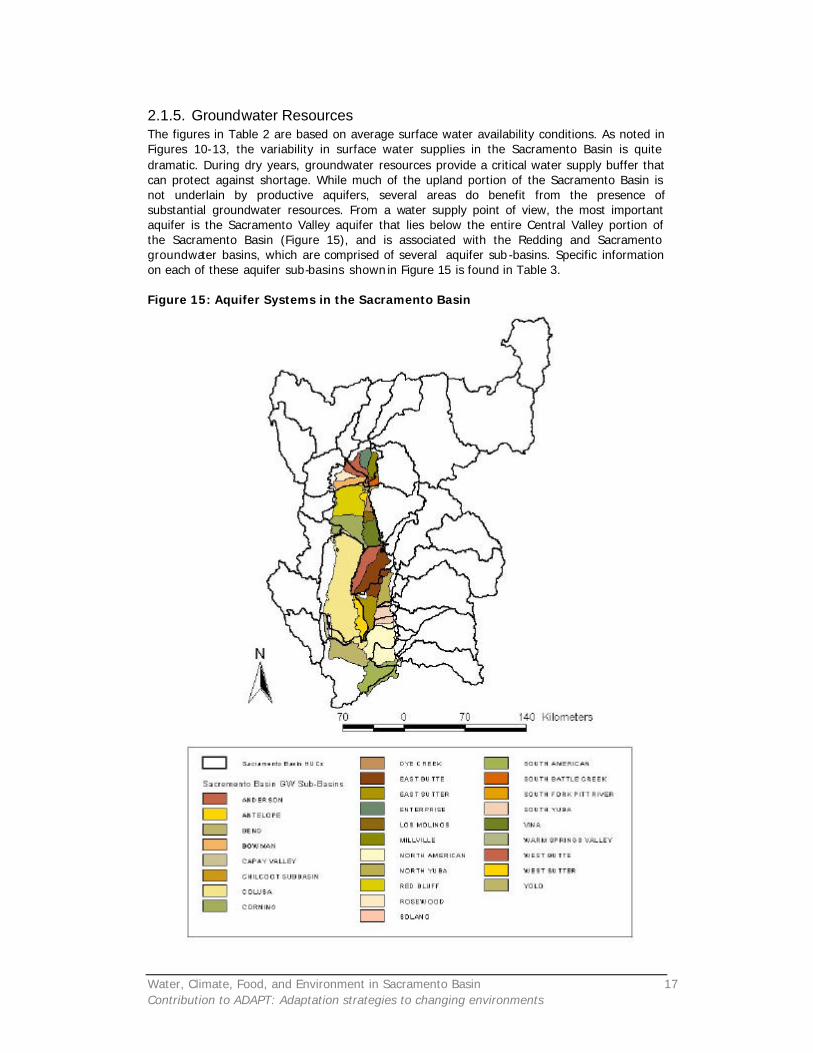
2.1.5. Groundwater Resources The figures in Table 2 are based on average surface water availability conditions. As noted in Figures 10-13, the variability in surface water supplies in the Sacramento Basin is quite dramatic. During dry years, groundwater resources provide a critical water supply buffer that can protect against shortage. While much of the upland portion of the Sacramento Basin is not underlain by productive aquifers, several areas do benefit from the presence of substantial groundwater resources. From a water supply point of view, the most important aquifer is the Sacramento Valley aquifer that lies below the entire Central Valley portion of the Sacramento Basin (Figure 15), and is associated with the Redding and Sacramento groundwater basins, which are comprised of several aquifer sub -basins. Specific information on each of these aquifer sub-basins shown in Figure 15 is found in Table 3. Figure 15: Aquifer Systems in the Sacramento Basin
Water, Climate, Food, and Environment in Sacramento Basin 18 Contribution to ADAPT: Adaptation strategies to changing environments
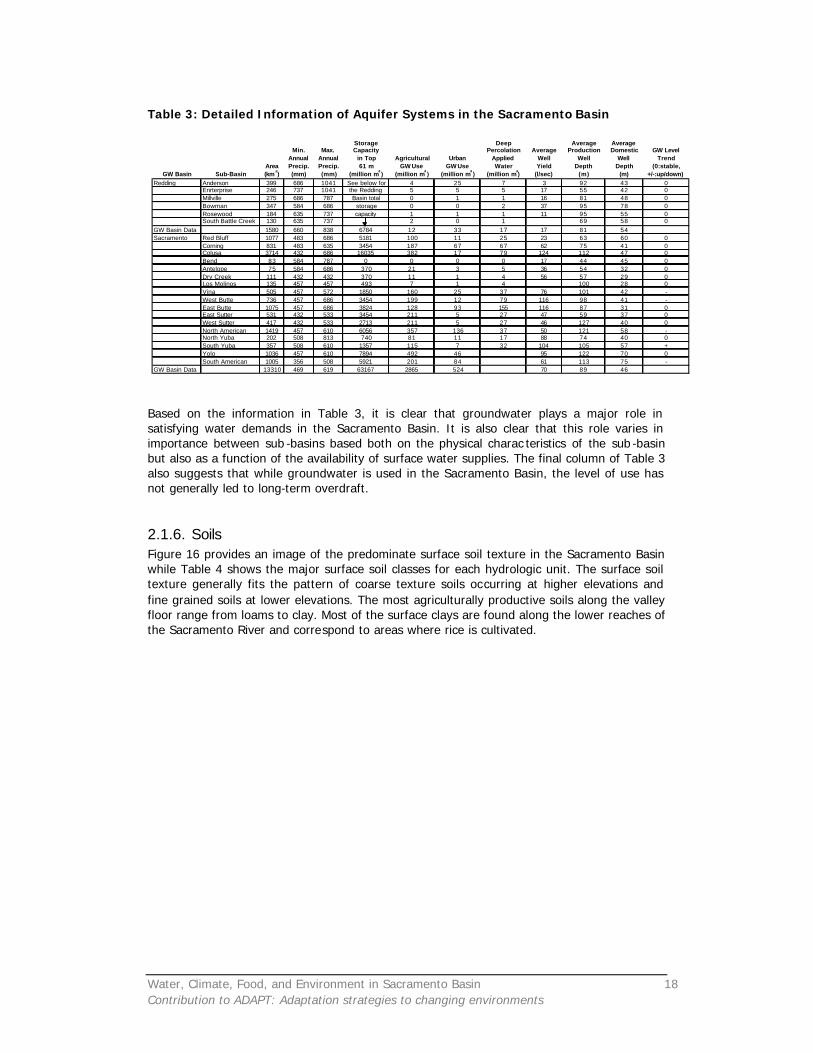
Table 3: Detailed Information of Aquifer Systems in the Sacramento Basin
Based on the information in Table 3, it is clear that groundwater plays a major role in satisfying water demands in the Sacramento Basin. It is also clear that this role varies in importance between sub -basins based both on the physical charac teristics of the sub -basin but also as a function of the availability of surface water supplies. The final column of Table 3 also suggests that while groundwater is used in the Sacramento Basin, the level of use has not generally led to long-term overdraft.
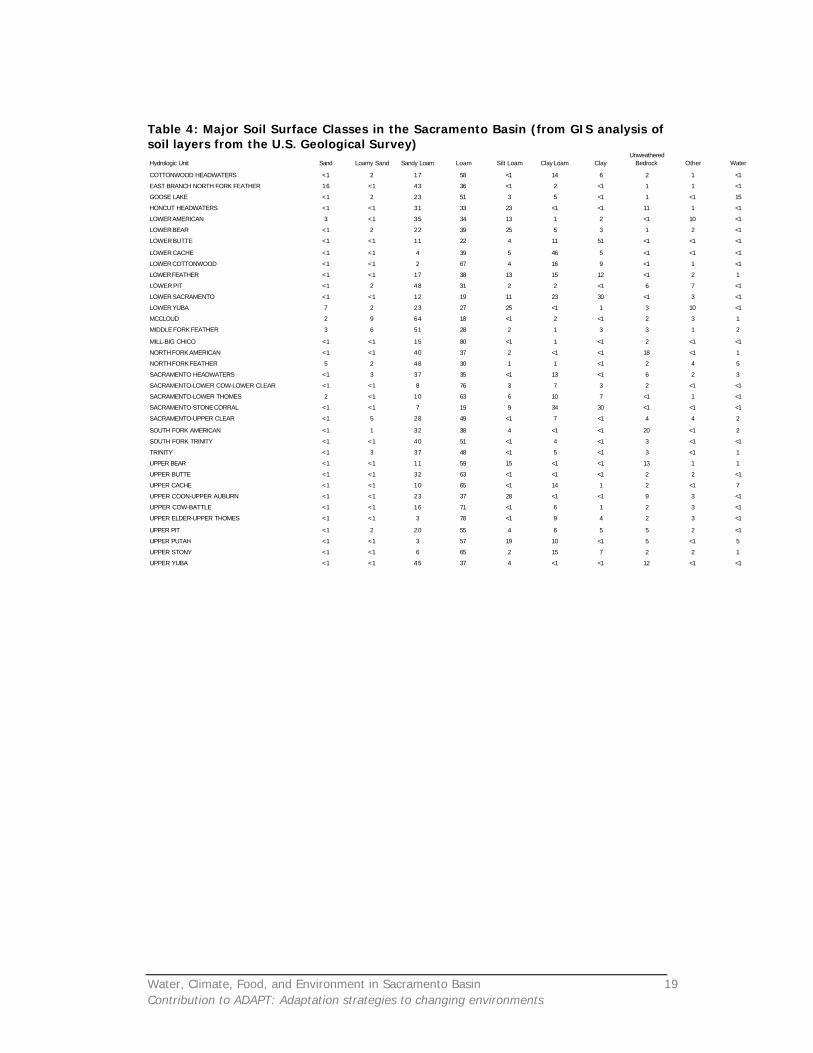
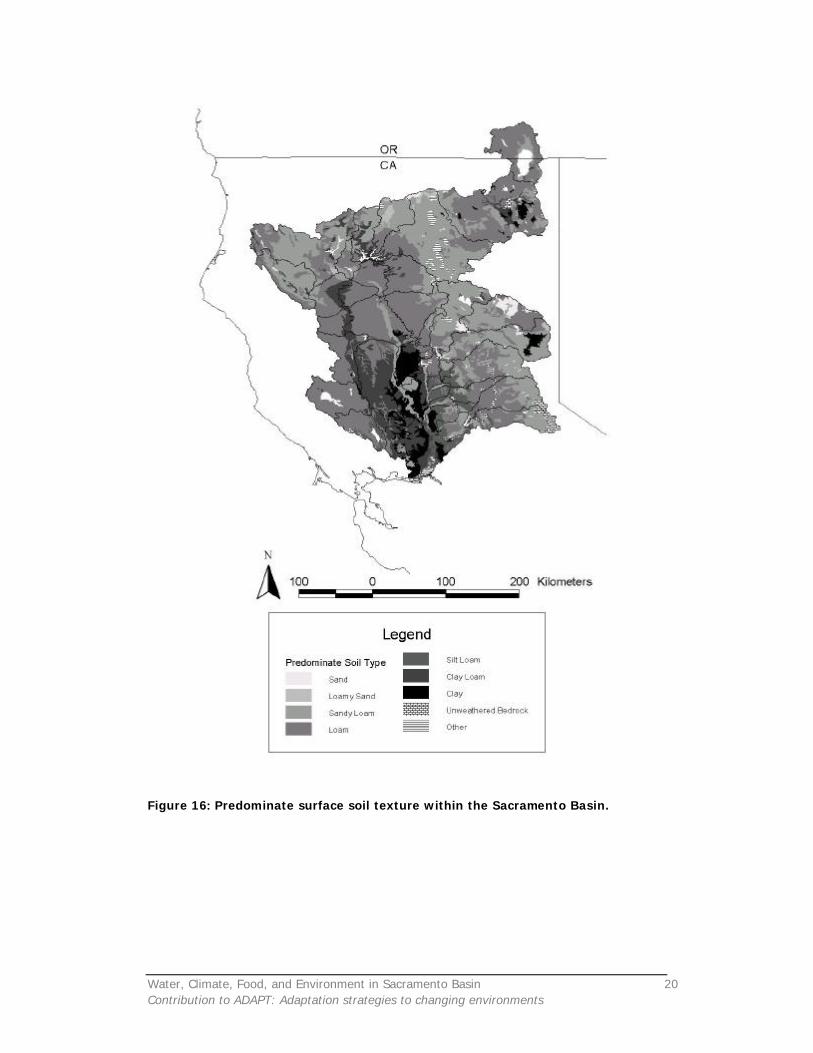
2.1.6. Soils Figure 16 provides an image of the predominate surface soil texture in the Sacramento Basin while Table 4 shows the major surface soil classes for each hydrologic unit. The surface soil texture generally fits the pattern of coarse texture soils occurring at higher elevations and fine grained soils at lower elevations. The most agriculturally productive soils along the valley floor range from loams to clay. Most of the surface clays are found along the lower reaches of the Sacramento River and correspond to areas where rice is cultivated.
Storage Deep Average AverageMin. Max. Capacity Percolation Average Production Domestic GW Level
Annual Annual in Top Agricultural Urban Applied Well Well Well TrendArea Precip. Precip. 61 m GW Use GW Use Water Yield Depth Depth (0:stable,
GW Basin Sub-Basin (km2) (mm) (mm) (million m
3) (million m
3) (million m
3) (million m
3) (l/sec) (m) (m) +/-:up/down)
Redding Anderson 399 686 1041 See below for 4 25 7 3 92 43 0Enrterprise 246 737 1041 the Redding 5 5 5 17 55 42 0Millville 275 686 787 Basin total 0 1 1 16 81 48 0Bowman 347 584 686 storage 0 0 2 37 95 78 0Rosewood 184 635 737 capacity 1 1 1 11 95 55 0South Battle Creek 130 635 737 2 0 1 69 58 0
GW Basin Data 1580 660 838 6784 12 33 17 17 81 54Sacramento Red Bluff 1077 483 686 5181 100 11 25 23 63 60 0
Corning 831 483 635 3454 187 67 67 62 75 41 0Colusa 3714 432 686 16035 382 17 79 124 112 47 0Bend 83 584 787 0 0 0 0 17 44 45 0Antelope 75 584 686 370 21 3 5 36 54 32 0Dry Creek 111 432 432 370 11 1 4 56 57 29 0Los Molinos 135 457 457 493 7 1 4 100 28 0Vina 505 457 572 1850 160 25 37 76 101 42 -West Butte 736 457 686 3454 199 12 79 116 98 41 -East Butte 1075 457 686 3824 128 93 155 116 87 31 0East Sutter 531 432 533 3454 211 5 27 47 59 37 0West Sutter 417 432 533 2713 211 5 27 46 127 40 0North American 1419 457 610 6056 357 136 37 50 121 58 -North Yuba 202 508 813 740 81 11 17 88 74 40 0South Yuba 357 508 610 1357 115 7 32 104 105 57 +Yolo 1036 457 610 7894 492 46 95 122 70 0South American 1005 356 508 5921 201 84 61 113 75 -
GW Basin Data 13310 469 619 63167 2865 524 70 89 46
Water, Climate, Food, and Environment in Sacramento Basin 19 Contribution to ADAPT: Adaptation strategies to changing environments
Table 4: Major Soil Surface Classes in the Sacramento Basin (from GIS analysis of soil layers from the U.S. Geological Survey) Hydrologic Unit Sand Loamy Sand Sandy Loam Loam Silt Loam Clay Loam Clay
Unweathered Bedrock Other Water
COTTONWOOD HEADWATERS <1 2 17 58 <1 14 6 2 1 <1
EAST BRANCH NORTH FORK FEATHER 16 <1 43 36 <1 2 <1 1 1 <1
GOOSE LAKE <1 2 23 51 3 5 <1 1 <1 15
HONCUT HEADWATERS <1 <1 31 33 23 <1 <1 11 1 <1
LOWER AMERICAN 3 <1 35 34 13 1 2 <1 10 <1
LOWER BEAR <1 2 22 39 25 5 3 1 2 <1
LOWER BUTTE <1 <1 11 22 4 11 51 <1 <1 <1
LOWER CACHE <1 <1 4 39 5 46 5 <1 <1 <1
LOWER COTTONWOOD <1 <1 2 67 4 16 9 <1 1 <1
LOWER FEATHER <1 <1 17 38 13 15 12 <1 2 1
LOWER PIT <1 2 48 31 2 2 <1 6 7 <1
LOWER SACRAMENTO <1 <1 12 19 11 23 30 <1 3 <1
LOWER YUBA 7 2 23 27 25 <1 1 3 10 <1
MCCLOUD 2 9 64 18 <1 2 <1 2 3 1
MIDDLE FORK FEATHER 3 6 51 28 2 1 3 3 1 2
MILL-BIG CHICO <1 <1 15 80 <1 1 <1 2 <1 <1
NORTH FORK AMERICAN <1 <1 40 37 2 <1 <1 18 <1 1
NORTH FORK FEATHER 5 2 48 30 1 1 <1 2 4 5
SACRAMENTO HEADWATERS <1 3 37 35 <1 13 <1 6 2 3
SACRAMENTO-LOWER COW-LOWER CLEAR <1 <1 8 76 3 7 3 2 <1 <1
SACRAMENTO-LOWER THOMES 2 <1 10 63 6 10 7 <1 1 <1
SACRAMENTO-STONE CORRAL <1 <1 7 19 9 34 30 <1 <1 <1
SACRAMENTO-UPPER CLEAR <1 5 28 49 <1 7 <1 4 4 2
SOUTH FORK AMERICAN <1 1 32 38 4 <1 <1 20 <1 2
SOUTH FORK TRINITY <1 <1 40 51 <1 4 <1 3 <1 <1
TRINITY <1 3 37 48 <1 5 <1 3 <1 1
UPPER BEAR <1 <1 11 59 15 <1 <1 13 1 1
UPPER BUTTE <1 <1 32 63 <1 <1 <1 2 2 <1
UPPER CACHE <1 <1 10 65 <1 14 1 2 <1 7
UPPER COON-UPPER AUBURN <1 <1 23 37 28 <1 <1 9 3 <1
UPPER COW-BATTLE <1 <1 16 71 <1 6 1 2 3 <1
UPPER ELDER-UPPER THOMES <1 <1 3 78 <1 9 4 2 3 <1
UPPER PIT <1 2 20 55 4 6 5 5 2 <1
UPPER PUTAH <1 <1 3 57 19 10 <1 5 <1 5
UPPER STONY <1 <1 6 65 2 15 7 2 2 1
UPPER YUBA <1 <1 45 37 4 <1 <1 12 <1 <1
Water, Climate, Food, and Environment in Sacramento Basin 20 Contribution to ADAPT: Adaptation strategies to changing environments
Figure 16: Predominate surface soil texture within the Sacramento Basin.
Water, Climate, Food, and Environment in Sacramento Basin 21 Contribution to ADAPT: Adaptation strategies to changing environments
2.1.7. Water Quality Prior to the 1960’s the main contaminant problems in the freshwater ecosystems of the Sacramento Basin were caused by untreated sewage releases. This resulted in low oxygen concentration and high bacterial concentrations, with subsequent adverse effects on biota. Beginning in the 1950’s, however, primary and secondary sewage treatment facilities were installed. Now, despite a five-fold increase in the population of the basin, problems associated with untreated wastes are rare. Currently, the main contaminants of concern are associated with agriculture: organic pesticides and metals have caused impacts on biota. The most notorious instance is that of selenium poisoning of wildlife during the 1980s in the San Joaquin Valley. Agricultural irrigation concentrated naturally occurring selenium from the soil and inserted it into wetland food webs. The result was reproductive failure and increased mortality among a number of bird species (Heinz, 1996).
2.1.8. Ecosystems In addition to urban and agricultural use, the waters of the Sacramento Basin also support several important ecosystems. Three are of particular note and are presented here, although many other ecosystem services are provided. The first ecosystem component of note is the anadromous fishery, and most notably the Chinook salmon fishery that spends a portion of its life cycle in the Sacramento Basin. The second is the waterfowl migrating along the Pacific Flyway that relies upon wetlands in the Sacramento Basin during their north-south migration. The final ecosystem component of note is the riparian cottonwood and willow forests that shelter many birds and mammals in the Sacramento Basin. Along the Pacific Coast of the United States, salmon have become the single most important focal point in disputes over water allocation. Prior to their development and regulation, the major rivers in the region literally teemed with fish during the spawning season. Indigenous peoples in the region built both their diets and their cultures large ly on the harvest of the silvery fish that can reach weights of up to 20kg. With the arrival of European and American immigrants, fishing communities along the coast quickly emerged to harvest salmon in ocean waters. With the construction of dams that blocked their passage and changes in the flow regime that disrupted the signals fish use to initiate migration from their spawning and rearing grounds in the rivers to the ocean, and back again, the numbers of fish have dramatically declined. While the tradeoff between water development and salmon survival was understood by the planners of the early dam projects, contributing partly to the investment made to construct fish hatcheries in the region, agricultural development was deemed a higher social good.
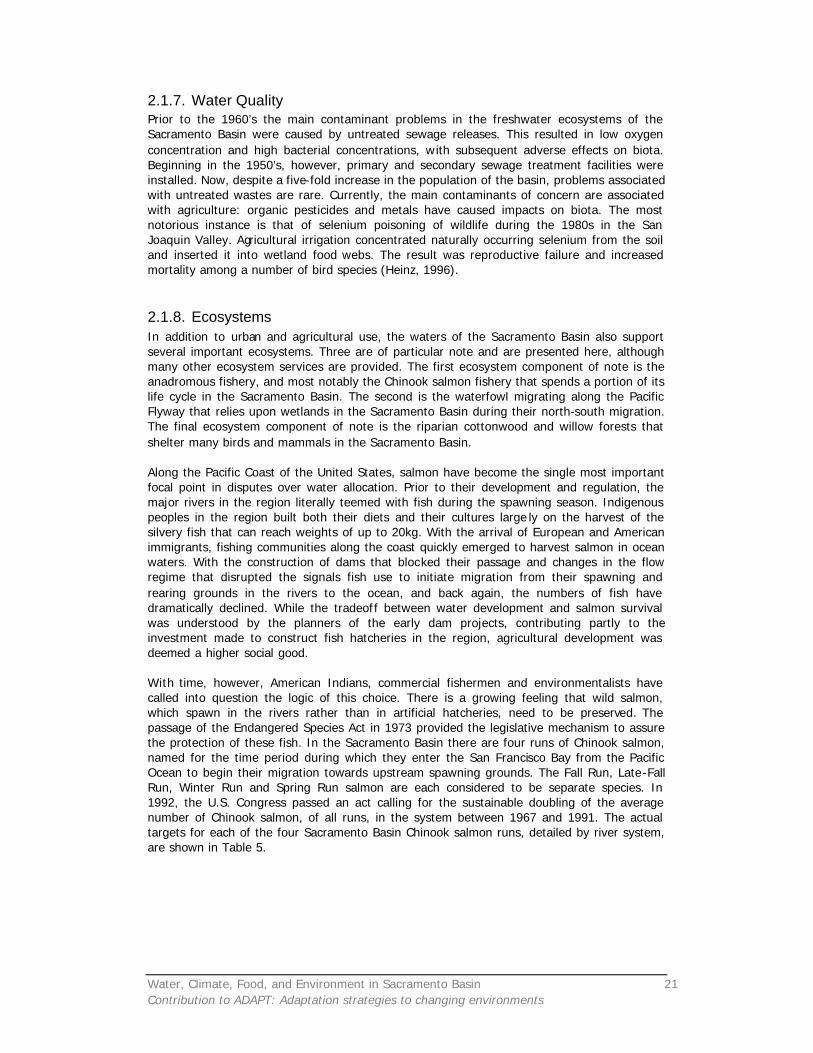
With time, however, American Indians, commercial fishermen and environmentalists have called into question the logic of this choice. There is a growing feeling that wild salmon, which spawn in the rivers rather than in artificial hatcheries, need to be preserved. The passage of the Endangered Species Act in 1973 provided the legislative mechanism to assure the protection of these fish. In the Sacramento Basin there are four runs of Chinook salmon, named for the time period during which they enter the San Francisco Bay from the Pacific Ocean to begin their migration towards upstream spawning grounds. The Fall Run, Late-Fall Run, Winter Run and Spring Run salmon are each considered to be separate species. In 1992, the U.S. Congress passed an act calling for the sustainable doubling of the average number of Chinook salmon, of all runs, in the system between 1967 and 1991. The actual targets for each of the four Sacramento Basin Chinook salmon runs, detailed by river system, are shown in Table 5.
Water, Climate, Food, and Environment in Sacramento Basin 22 Contribution to ADAPT: Adaptation strategies to changing environments
Table 5: Chinook salmon Restoration Target Numbers by Run and River System
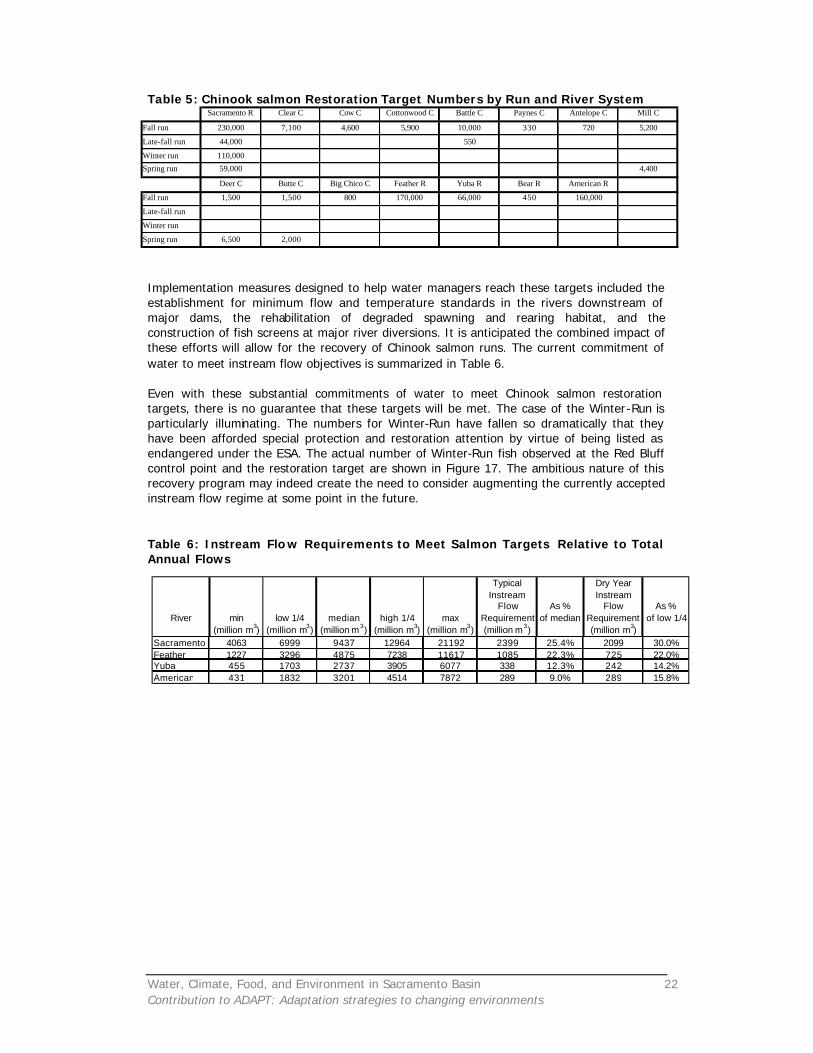
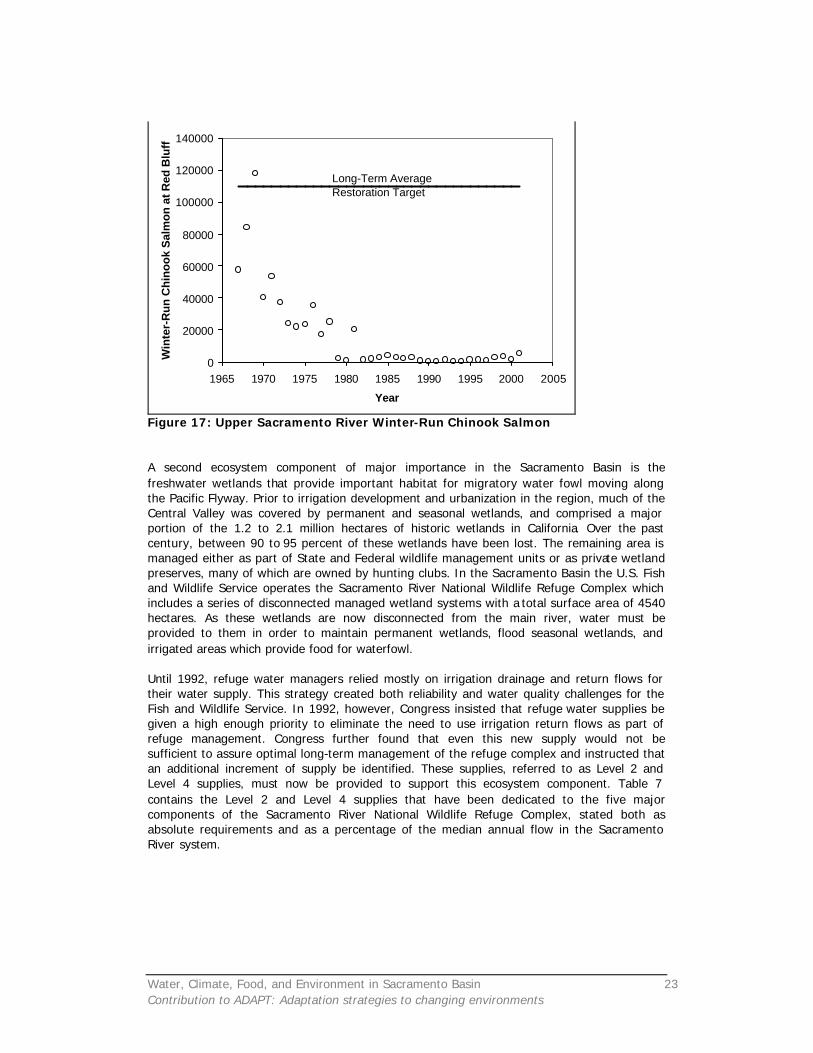
Implementation measures designed to help water managers reach these targets included the establishment for minimum flow and temperature standards in the rivers downstream of major dams, the rehabilitation of degraded spawning and rearing habitat, and the construction of fish screens at major river diversions. It is anticipated the combined impact of these efforts will allow for the recovery of Chinook salmon runs. The current commitment of water to meet instream flow objectives is summarized in Table 6. Even with these substantial commitments of water to meet Chinook salmon restoration targets, there is no guarantee that these targets will be met. The case of the Winter-Run is particularly illuminating. The numbers for Winter-Run have fallen so dramatically that they have been afforded special protection and restoration attention by virtue of being listed as endangered under the ESA. The actual number of Winter-Run fish observed at the Red Bluff control point and the restoration target are shown in Figure 17. The ambitious nature of this recovery program may indeed create the need to consider augmenting the currently accepted instream flow regime at some point in the future. Table 6: Instream Flo w Requirements to Meet Salmon Targets Relative to Total Annual Flows
Sacramento R Clear C Cow C Cottonwood C Battle C Paynes C Antelope C Mill C
Fall run 230,000 7,100 4,600 5,900 10,000 330 720 5,200
Late-fall run 44,000 550
Winter run 110,000
Spring run 59,000 4,400
Deer C Butte C Big Chico C Feather R Yuba R Bear R American R
Fall run 1,500 1,500 800 170,000 66,000 450 160,000
Late-fall run
Winter run
Spring run 6,500 2,000
Typical Dry YearInstream Instream
Flow As % Flow As %River min low 1/4 median high 1/4 max Requirement of median Requirement of low 1/4
(million m3) (million m3) (million m3) (million m3) (million m3) (million m3) (million m3)Sacramento 4063 6999 9437 12964 21192 2399 25.4% 2099 30.0%Feather 1227 3296 4875 7238 11617 1085 22.3% 725 22.0%Yuba 455 1703 2737 3905 6077 338 12.3% 242 14.2%American 431 1832 3201 4514 7872 289 9.0% 289 15.8%
Water, Climate, Food, and Environment in Sacramento Basin 23 Contribution to ADAPT: Adaptation strategies to changing environments
0
20000
40000
60000
80000
100000
120000
140000
1965 1970 1975 1980 1985 1990 1995 2000 2005
Year
Win
ter-
Ru
n C
hin
oo
k S
alm
on
at R
ed B
luff
Long-Term Average Restoration Target
Figure 17: Upper Sacramento River Winter-Run Chinook Salmon A second ecosystem component of major importance in the Sacramento Basin is the freshwater wetlands that provide important habitat for migratory water fowl moving along the Pacific Flyway. Prior to irrigation development and urbanization in the region, much of the Central Valley was covered by permanent and seasonal wetlands, and comprised a major portion of the 1.2 to 2.1 million hectares of historic wetlands in California. Over the past century, between 90 to 95 percent of these wetlands have been lost. The remaining area is managed either as part of State and Federal wildlife management units or as private wetland preserves, many of which are owned by hunting clubs. In the Sacramento Basin the U.S. Fish and Wildlife Service operates the Sacramento River National Wildlife Refuge Complex which includes a series of disconnected managed wetland systems with a total surface area of 4540 hectares. As these wetlands are now disconnected from the main river, water must be provided to them in order to maintain permanent wetlands, flood seasonal wetlands, and irrigated areas which provide food for waterfowl.
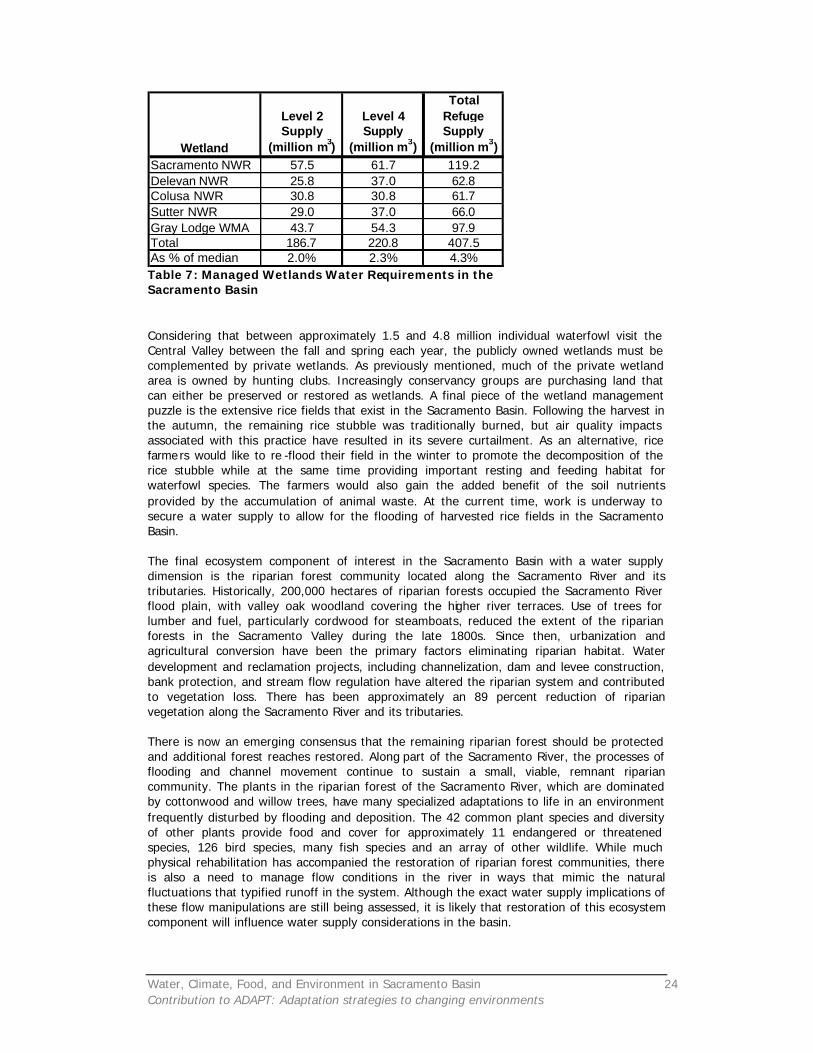
Until 1992, refuge water managers relied mostly on irrigation drainage and return flows for their water supply. This strategy created both reliability and water quality challenges for the Fish and Wildlife Service. In 1992, however, Congress insisted that refuge water supplies be given a high enough priority to eliminate the need to use irrigation return flows as part of refuge management. Congress further found that even this new supply would not be sufficient to assure optimal long-term management of the refuge complex and instructed that an additional increment of supply be identified. These supplies, referred to as Level 2 and Level 4 supplies, must now be provided to support this ecosystem component. Table 7 contains the Level 2 and Level 4 supplies that have been dedicated to the five major components of the Sacramento River National Wildlife Refuge Complex, stated both as absolute requirements and as a percentage of the median annual flow in the Sacramento River system.
Water, Climate, Food, and Environment in Sacramento Basin 24 Contribution to ADAPT: Adaptation strategies to changing environments
TotalLevel 2 Level 4 RefugeSupply Supply Supply
Wetland (million m3) (million m3) (million m3)Sacramento NWR 57.5 61.7 119.2Delevan NWR 25.8 37.0 62.8Colusa NWR 30.8 30.8 61.7Sutter NWR 29.0 37.0 66.0Gray Lodge WMA 43.7 54.3 97.9Total 186.7 220.8 407.5As % of median 2.0% 2.3% 4.3% Table 7: Managed Wetlands Water Requirements in the Sacramento Basin
Considering that between approximately 1.5 and 4.8 million individual waterfowl visit the Central Valley between the fall and spring each year, the publicly owned wetlands must be complemented by private wetlands. As previously mentioned, much of the private wetland area is owned by hunting clubs. Increasingly conservancy groups are purchasing land that can either be preserved or restored as wetlands. A final piece of the wetland management puzzle is the extensive rice fields that exist in the Sacramento Basin. Following the harvest in the autumn, the remaining rice stubble was traditionally burned, but air quality impacts associated with this practice have resulted in its severe curtailment. As an alternative, rice farme rs would like to re -flood their field in the winter to promote the decomposition of the rice stubble while at the same time providing important resting and feeding habitat for waterfowl species. The farmers would also gain the added benefit of the soil nutrients provided by the accumulation of animal waste. At the current time, work is underway to secure a water supply to allow for the flooding of harvested rice fields in the Sacramento Basin. The final ecosystem component of interest in the Sacramento Basin with a water supply dimension is the riparian forest community located along the Sacramento River and its tributaries. Historically, 200,000 hectares of riparian forests occupied the Sacramento River flood plain, with valley oak woodland covering the higher river terraces. Use of trees for lumber and fuel, particularly cordwood for steamboats, reduced the extent of the riparian forests in the Sacramento Valley during the late 1800s. Since then, urbanization and agricultural conversion have been the primary factors eliminating riparian habitat. Water development and reclamation projects, including channelization, dam and levee construction, bank protection, and stream flow regulation have altered the riparian system and contributed to vegetation loss. There has been approximately an 89 percent reduction of riparian vegetation along the Sacramento River and its tributaries.
There is now an emerging consensus that the remaining riparian forest should be protected and additional forest reaches restored. Along part of the Sacramento River, the processes of flooding and channel movement continue to sustain a small, viable, remnant riparian community. The plants in the riparian forest of the Sacramento River, which are dominated by cottonwood and willow trees, have many specialized adaptations to life in an environment frequently disturbed by flooding and deposition. The 42 common plant species and diversity of other plants provide food and cover for approximately 11 endangered or threatened species, 126 bird species, many fish species and an array of other wildlife. While much physical rehabilitation has accompanied the restoration of riparian forest communities, there is also a need to manage flow conditions in the river in ways that mimic the natural fluctuations that typified runoff in the system. Although the exact water supply implications of these flow manipulations are still being assessed, it is likely that restoration of this ecosystem component will influence water supply considerations in the basin.
Water, Climate, Food, and Environment in Sacramento Basin 25 Contribution to ADAPT: Adaptation strategies to changing environments
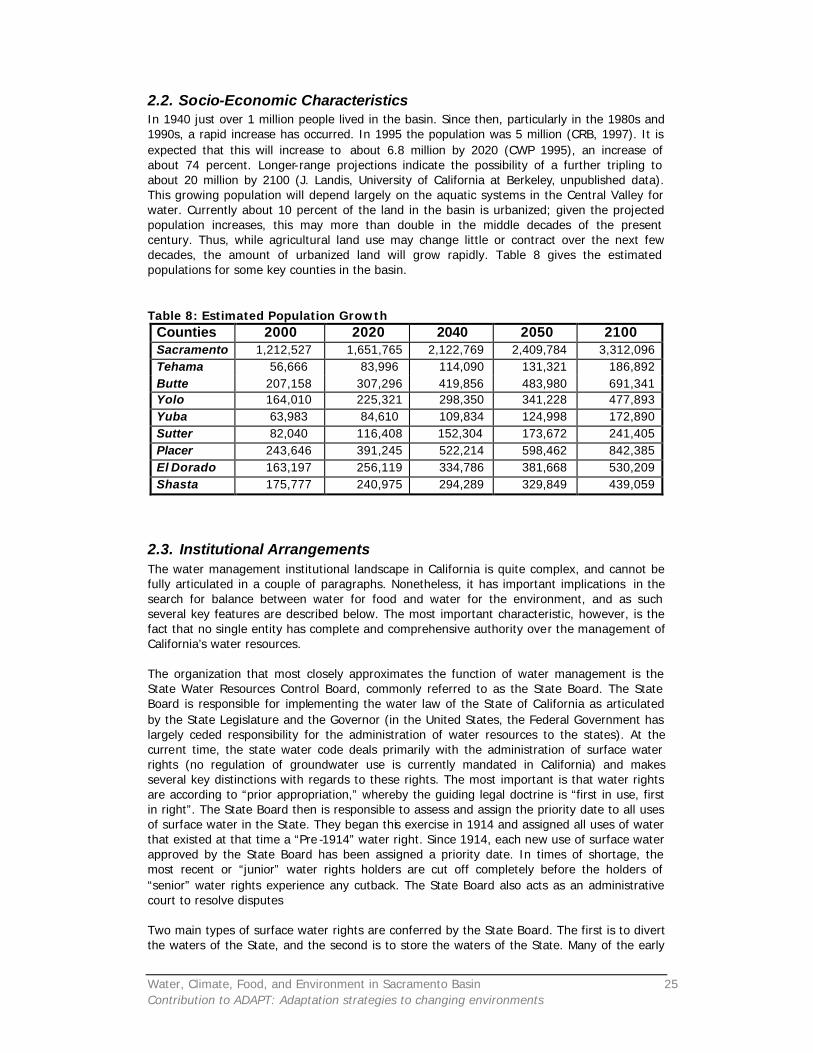
2.2. Socio-Economic Characteristics In 1940 just over 1 million people lived in the basin. Since then, particularly in the 1980s and 1990s, a rapid increase has occurred. In 1995 the population was 5 million (CRB, 1997). It is expected that this will increase to about 6.8 million by 2020 (CWP 1995), an increase of about 74 percent. Longer-range projections indicate the possibility of a further tripling to about 20 million by 2100 (J. Landis, University of California at Berkeley, unpublished data). This growing population will depend largely on the aquatic systems in the Central Valley for water. Currently about 10 percent of the land in the basin is urbanized; given the projected population increases, this may more than double in the middle decades of the present century. Thus, while agricultural land use may change little or contract over the next few decades, the amount of urbanized land will grow rapidly. Table 8 gives the estimated populations for some key counties in the basin. Table 8: Estimated Population Growth
Counties 2000 2020 2040 2050 2100 Sacramento 1,212,527 1,651,765 2,122,769 2,409,784 3,312,096 Tehama 56,666 83,996 114,090 131,321 186,892 Butte 207,158 307,296 419,856 483,980 691,341 Yolo 164,010 225,321 298,350 341,228 477,893 Yuba 63,983 84,610 109,834 124,998 172,890 Sutter 82,040 116,408 152,304 173,672 241,405 Placer 243,646 391,245 522,214 598,462 842,385 El Dorado 163,197 256,119 334,786 381,668 530,209 Shasta 175,777 240,975 294,289 329,849 439,059
2.3. Institutional Arrangements The water management institutional landscape in California is quite complex, and cannot be fully articulated in a couple of paragraphs. Nonetheless, it has important implications in the search for balance between water for food and water for the environment, and as such several key features are described below. The most important characteristic, however, is the fact that no single entity has complete and comprehensive authority over the management of California’s water resources. The organization that most closely approximates the function of water management is the State Water Resources Control Board, commonly referred to as the State Board. The State Board is responsible for implementing the water law of the State of California as articulated by the State Legislature and the Governor (in the United States, the Federal Government has largely ceded responsibility for the administration of water resources to the states). At the current time, the state water code deals primarily with the administration of surface water rights (no regulation of groundwater use is currently mandated in California) and makes several key distinctions with regards to these rights. The most important is that water rights are according to “prior appropriation,” whereby the guiding legal doctrine is “first in use, first in right”. The State Board then is responsible to assess and assign the priority date to all uses of surface water in the State. They began this exercise in 1914 and assigned all uses of water that existed at that time a “Pre -1914” water right. Since 1914, each new use of surface water approved by the State Board has been assigned a priority date. In times of shortage, the most recent or “junior” water rights holders are cut off completely before the holders of “senior” water rights experience any cutback. The State Board also acts as an administrative court to resolve disputes Two main types of surface water rights are conferred by the State Board. The first is to divert the waters of the State, and the second is to store the waters of the State. Many of the early
Water, Climate, Food, and Environment in Sacramento Basin 26 Contribution to ADAPT: Adaptation strategies to changing environments
water rights cover the right to divert. With the development of dam construction technology, storage rights were also established. Individuals initially established early water rights, but the most important rights were later established by local government entities that formed to improve water management. For example the Glenn -Colusa Irrigation District has a pre -1914 water right to divert a substantial amount of water from the Sacramento River because this entity very early on built a diversion structure and canal to convey water to irrigated fields. The Modesto Irrigation District has a pre -1914 storage right because in the early 20 t h century they built a low dam to store the water of the Tuolumne River, a San Joaquin tributary. There are literally hundreds of local public water management organizations similar to these that have been established across California. In the second half of the 20t h Century, the scale of the river diversion and reservoir storage projects undertaken generally exceeded the capacity of local government entities to execute the projects. At this point the Federal Government, through the activity of the United St ates Bureau of Reclamation and the State of California Department of Water Resources, began to execute large storage and delivery projects. In the Sacramento Basin, the Federal Central Valley Project (CVP) includes Shasta Reservoir on the Sacramento River north of Redding and Folsom Reservoir on the American River upstream of Sacramento. Water from these facilities is used to provide water for irrigation in the Sacramento Basin and for exports from the Delta. The State Water Project (SWP) includes Oroville Reservoir on the Feather River that is used to provide water for export from the Delta. Both projects have been allocated a water right from the State Board to operate their facilities and generally contract with local water management entities to deliver the water to end users. The role of the Department of Water Resources is complicated because in addition to operating the SWP facilities for the benefit of a limited number of contracting local government entities, DWR is also the primary water planning institution in the State. The California legislature has instructed DWR to issue an updated version of the California Water Plan (Bulletin 160) every five years. This plan is intended to inventory the water supply and demand balance in the State over the coming 20 -30 years and to propose any necessary remedial actions should the systems become imbalanced. Obviously the results of this analysis have potential implications in terms of the operation of the SWP. Superimposed on these complex water rights, water management, and water planning systems are a series of State and Federal laws that can influence the management of water resources. Among these are laws related to the assurance of clean water supplies, the preservation of remaining wetlands, the protection of threatened and endangered species and the designation of important natural features. Historically water interests in the state have sought redress in the courts to resolve water management disputes, often invoking one or several of these legal constructs. These embroilments often created several decades of contentious litigation on a number of fronts, which ultimately convinced all of the water stakeholder communities that the search for consensus would prove more fruitful then continued legal maneuve rings. The outgrowth of this realization was the CALFED Bay-Delta Program. CALFED is a joint state-federal process to develop long -term solutions to problems in the Bay -Delta Estuary related to fish and wildlife, water supply reliability, natural disasters, and water quality. The intent is to develop a comprehensive and balanced plan that addresses all of the resource problems. The public has a central role in the development of a long -term solution. A group of more than 30 citizen -advisors selected from California's agriculture, environmental, urban, business, fishing, and other interests with a stake in finding long-term solutions for the problems of the Bay -Delta Estuary have been chartered under the Federal Advisory Committee Act as the Bay-Delta Advisory Council (BDAC). BDAC advises the CALFED Program on its mission and objectives, the problems to be addressed and proposed actions. BDAC also provides a forum for public participation, and reviews reports and other materials prepared by CALFED staff. The Program is engaged in a three-phase process to achieve broad agreement on long -term solutions.
Water, Climate, Food, and Environment in Sacramento Basin 27 Contribution to ADAPT: Adaptation strategies to changing environments
In the first phase, the CALFED Program developed a range of alternatives consisting of hundreds of actions. The Program conducted meetings and workshops to obtain public input, concluding in September 1996 with the development of a range of alternatives for achieving long-term solutions to the problems of the Bay-Delta estuary. Phase II involved a comprehensive programmatic environmental review process that lead to the identification of three draft alternatives and program plans. These were first released on March 16, 1998, and after lengthy public comment, the final programmatic EIS/EIR was released on July 21, 2000, followed by the Record of Decision (ROD) on August 28, 2000. CALFED is now in Phase III - implementation of the preferred alternative. The first seven years of this phase, referred to as Stage 1, will lay the foundation for the following years. Site-specific, detailed environmental review will occur during this phase prior to the implementation of each proposed action. Implementation of the CALFED Bay-Delta solution is expected to take 30 years. CALFED is a tenuous institution, in which parties participate voluntarily and from which they can withdraw. Like all consensus-building processes it involves compromises, which are beginning to shape the emerging balance between water for food, water for the environment, and water for urban areas. To date, all parties have determined that this emerging balance is preferable to a return to litigious confrontation, although this sentiment is increasingly tested as CALFED moves from evaluating alternatives to implementing projects. An interesting issue for the ADAPT project is whether this emerging balance can wit hstand the influence of climate change, or whether additional adaptations will be required in the future.
3. Projections for future
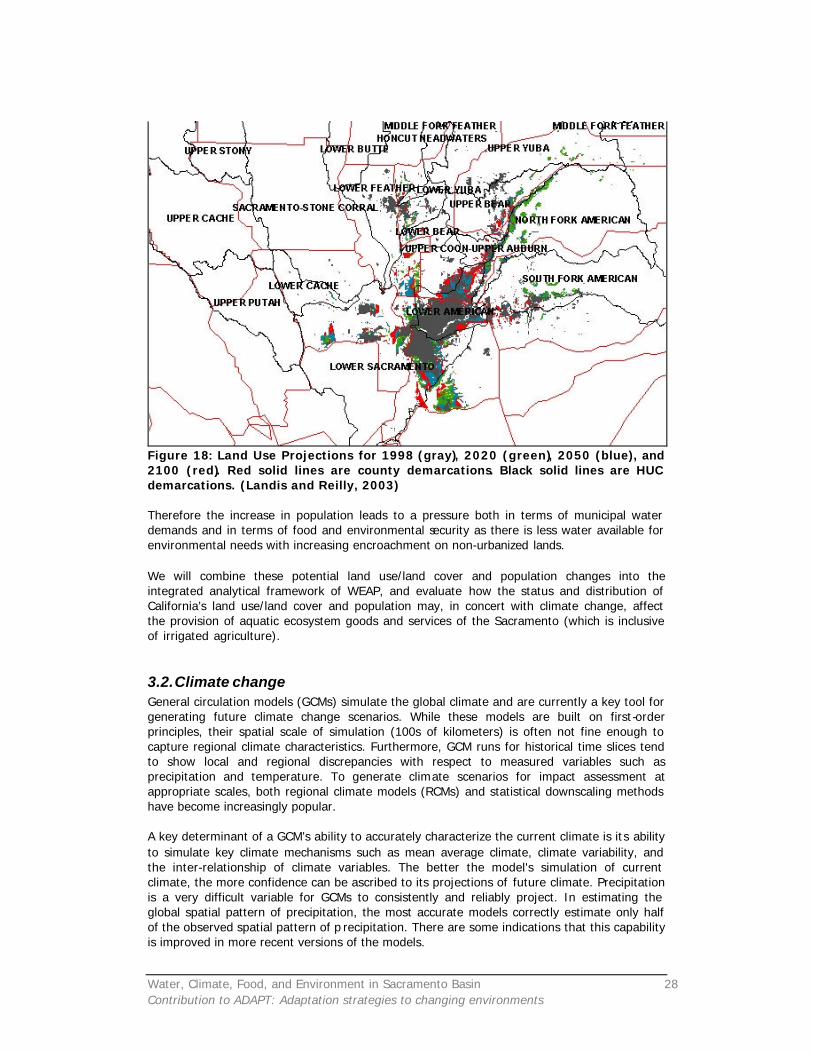
3.1. Socio-economic and Land Use Drivers and Pressures There are two very strong trends that will directly affect the demand for and the availability of water in the Sacramento River Basin. The first driver is the steady growth in population, particularly around existing urban areas and transportation corridors. It is projected, for instance, that in Sacramento County the population will increase from a present (2000) 1.2 million people to 3.3 million by 2100. The second driver is changing land use, which relates to population growth, as that growth has led to the extension of urban area into other land use types. Projections of future land use patterns based on assessments of current patterns of land development and modification in California have been developed by Professor John Landis of U.C. Berkeley (Landis and Reilly, 2003). This project implements these scenarios within the WEAP modeling framework (discussed in Section 4). Projections are based on a spatial-statistical model of development patterns based on a number of factors inc luding physical site, economic, and neighborhood characteristics. Projected spatial land use changes for 2020, 2050, and 2100 are shown in Figure 18 and demonstrate that by 2100 over 100,000 ha, almost double, will convert to urban use. For the purposes of this project, we assume in total that most of the converted land was originally agricultural land. The uncertainties associated with these projections depend on the extent to which population and employment growth trends and urban settlements can be extended far into the future. Other examples of land use/land cover projections come from the California Water Plan published by the California State Department of Water Resources Bulletin 160-93, which projects that irrigated area in the Sacramento River, San Joaquin River, and San Francisco Bay regions will decrease from the current 1.66 million hectares to 1.63 by the year 2020, a reduction of 30,000 hectares, most likely in favor of urban growth. In an average flow year, this corresponds to a reduction of 860 MCM of app lied agricultural water (940 MCM in a drought year). This reduction in cultivated area is driven by salinity problems and land retirement, increased irrigation efficiency and recycling, more competitive world markets, and agricultural land being urbanized.
Water, Climate, Food, and Environment in Sacramento Basin 28 Contribution to ADAPT: Adaptation strategies to changing environments
Figure 18: Land Use Projections for 1998 (gray), 2020 (green), 2050 (blue), and 2100 (red). Red solid lines are county demarcations. Black solid lines are HUC demarcations. (Landis and Reilly, 2003) Therefore the increase in population leads to a pressure both in terms of municipal water demands and in terms of food and environmental security as there is less water available for environmental needs with increasing encroachment on non-urbanized lands. We will combine these potential land use/land cover and population changes into the integrated analytical framework of WEAP, and evaluate how the status and distribution of California’s land use/land cover and population may, in concert with climate change, affect the provision of aquatic ecosystem goods and services of the Sacramento (which is inclusive of irrigated agriculture).
3.2. Climate change General circulation models (GCMs) simulate the global climate and are currently a key tool for generating future climate change scenarios. While these models are built on first-order principles, their spatial scale of simulation (100s of kilometers) is often not fine enough to capture regional climate characteristics. Furthermore, GCM runs for historical time slices tend to show local and regional discrepancies with respect to measured variables such as precipitation and temperature. To generate climate scenarios for impact assessment at appropriate scales, both regional climate models (RCMs) and statistical downscaling methods have become increasingly popular. A key determinant of a GCM’s ability to accurately characterize the current climate is its ability to simulate key climate mechanisms such as mean average climate, climate variability, and the inter-relationship of climate variables. The better the model's simulation of current climate, the more confidence can be ascribed to its projections of future climate. Precipitation is a very difficult variable for GCMs to consistently and reliably project. In estimating the global spatial pattern of precipitation, the most accurate models correctly estimate only half of the observed spatial pattern of p recipitation. There are some indications that this capability is improved in more recent versions of the models.
Water, Climate, Food, and Environment in Sacramento Basin 29 Contribution to ADAPT: Adaptation strategies to changing environments
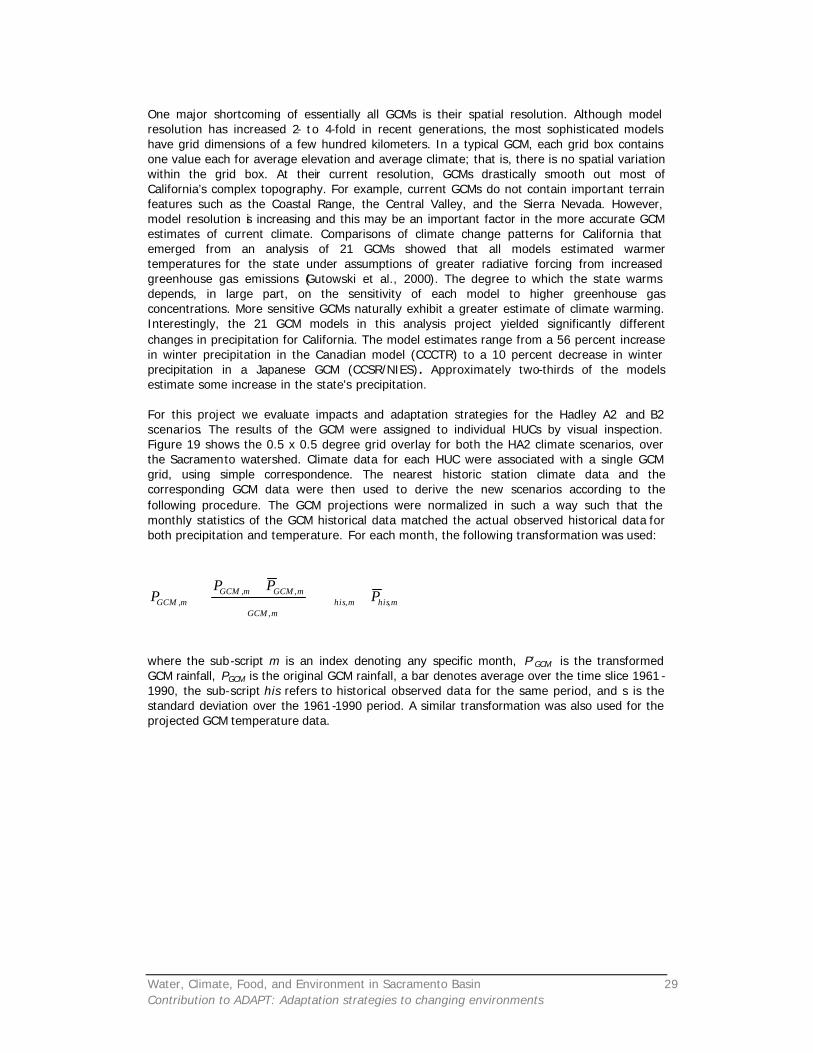
One major shortcoming of essentially all GCMs is their spatial resolution. Although model resolution has increased 2- to 4-fold in recent generations, the most sophisticated models have grid dimensions of a few hundred kilometers. In a typical GCM, each grid box contains one value each for average elevation and average climate; that is, there is no spatial variation within the grid box. At their current resolution, GCMs drastically smooth out most of California’s complex topography. For example, current GCMs do not contain important terrain features such as the Coastal Range, the Central Valley, and the Sierra Nevada. However, model resolution is increasing and this may be an important factor in the more accurate GCM estimates of current climate. Comparisons of climate change patterns for California that emerged from an analysis of 21 GCMs showed that all models estimated warmer temperatures for the state under assumptions of greater radiative forcing from increased greenhouse gas emissions (Gutowski et al., 2000). The degree to which the state warms depends, in large part, on the sensitivity of each model to higher greenhouse gas concentrations. More sensitive GCMs naturally exhibit a greater estimate of climate warming. Interestingly, the 21 GCM models in this analysis project yielded significantly different changes in precipitation for California. The model estimates range from a 56 percent increase in winter precipitation in the Canadian model (CCCTR) to a 10 percent decrease in winter precipitation in a Japanese GCM (CCSR/NIES). Approximately two-thirds of the models estimate some increase in the state's precipitation. For this project we evaluate impacts and adaptation strategies for the Hadley A2 and B2 scenarios. The results of the GCM were assigned to individual HUCs by visual inspection. Figure 19 shows the 0.5 x 0.5 degree grid overlay for both the HA2 climate scenarios, over the Sacramento watershed. Climate data for each HUC were associated with a single GCM grid, using simple correspondence. The nearest historic station climate data and the corresponding GCM data were then used to derive the new scenarios according to the following procedure. The GCM projections were normalized in such a way such that the monthly statistics of the GCM historical data matched the actual observed historical data for both precipitation and temperature. For each month, the following transformation was used:
mhismhismGCM
mGCMmGCMmGCM P
PPP ,,
,
,,,
where the sub-script m is an index denoting any specific month, P’GCM is the transformed GCM rainfall, PGCM is the original GCM rainfall, a bar denotes average over the time slice 1961 -1990, the sub-script his refers to historical observed data for the same period, and s is the standard deviation over the 1961 -1990 period. A similar transformation was also used for the projected GCM temperature data.
Water, Climate, Food, and Environment in Sacramento Basin 30 Contribution to ADAPT: Adaptation strategies to changing environments
Figure 19: GCM grid overlay over the Sacramento Watershed
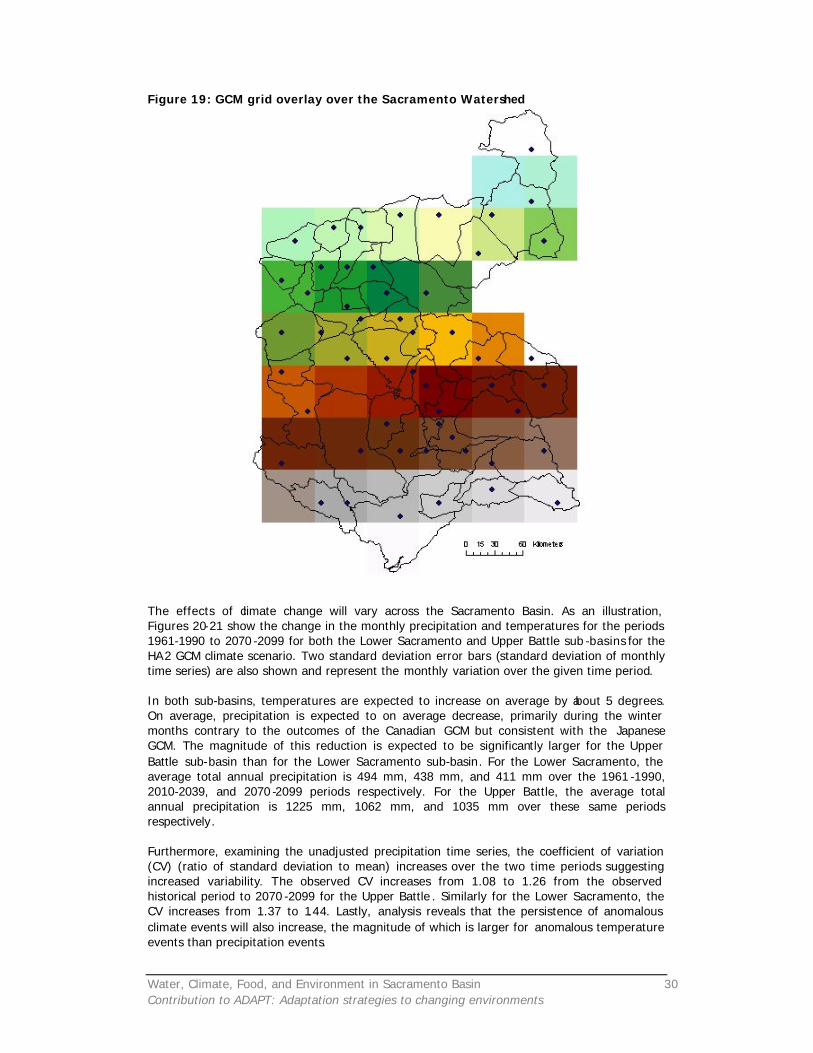
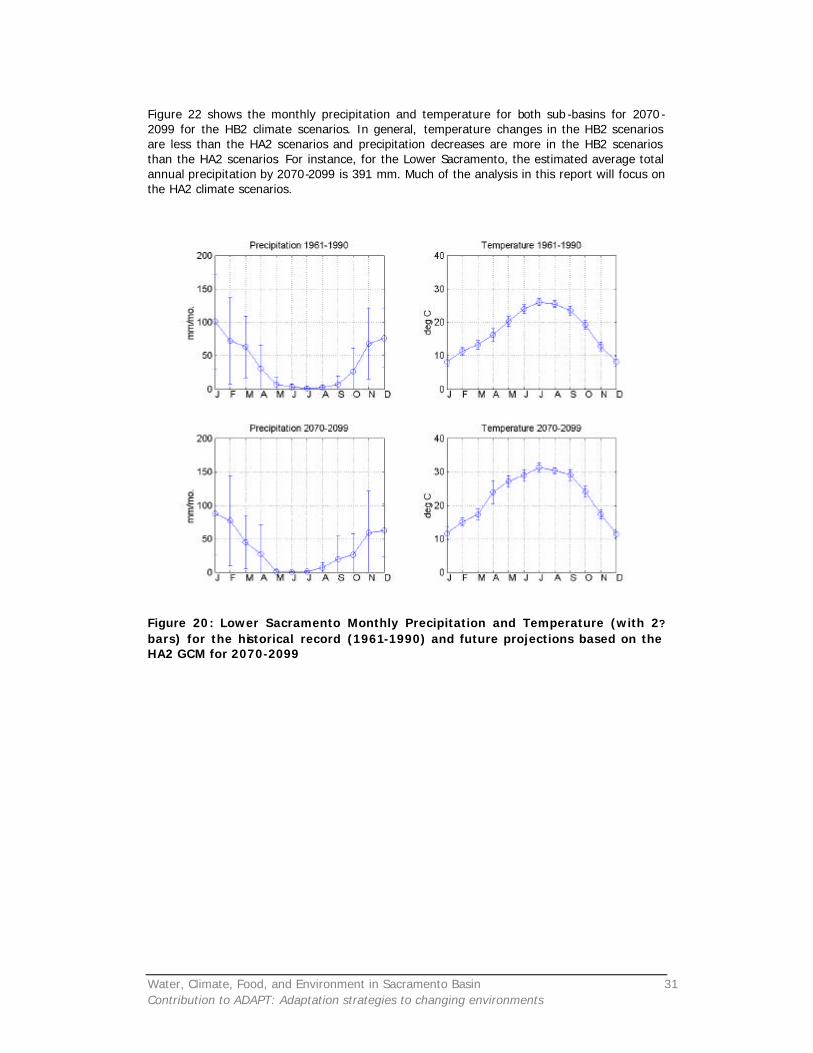
The effects of climate change will vary across the Sacramento Basin. As an illustration, Figures 20-21 show the change in the monthly precipitation and temperatures for the periods 1961-1990 to 2070 -2099 for both the Lower Sacramento and Upper Battle sub -basins for the HA2 GCM climate scenario. Two standard deviation error bars (standard deviation of monthly time series) are also shown and represent the monthly variation over the given time period. In both sub-basins, temperatures are expected to increase on average by about 5 degrees. On average, precipitation is expected to on average decrease, primarily during the winter months contrary to the outcomes of the Canadian GCM but consistent with the Japanese GCM. The magnitude of this reduction is expected to be significantly larger for the Upper Battle sub-basin than for the Lower Sacramento sub-basin. For the Lower Sacramento, the average total annual precipitation is 494 mm, 438 mm, and 411 mm over the 1961 -1990, 2010-2039, and 2070 -2099 periods respectively. For the Upper Battle, the average total annual precipitation is 1225 mm, 1062 mm, and 1035 mm over these same periods respectively. Furthermore, examining the unadjusted precipitation time series, the coefficient of variation (CV) (ratio of standard deviation to mean) increases over the two time periods suggesting increased variability. The observed CV increases from 1.08 to 1.26 from the observed historical period to 2070 -2099 for the Upper Battle . Similarly for the Lower Sacramento, the CV increases from 1.37 to 1.44. Lastly, analysis reveals that the persistence of anomalous climate events will also increase, the magnitude of which is larger for anomalous temperature events than precipitation events.
Water, Climate, Food, and Environment in Sacramento Basin 31 Contribution to ADAPT: Adaptation strategies to changing environments
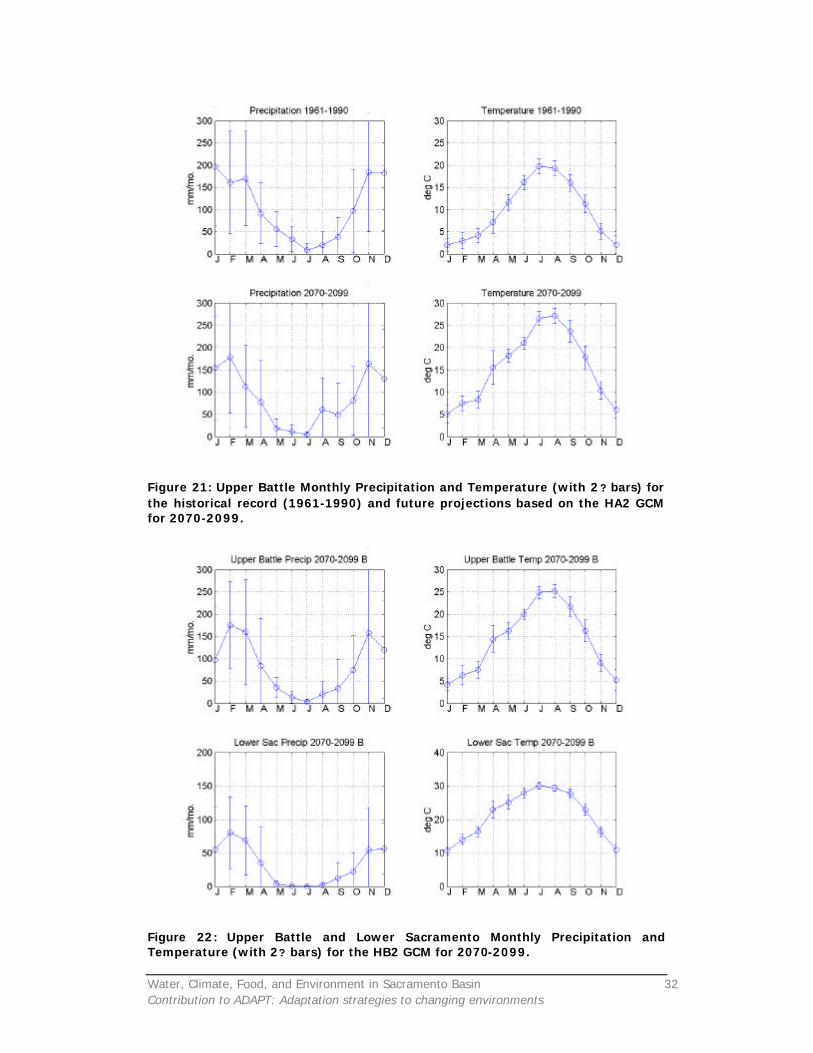
Figure 22 shows the monthly precipitation and temperature for both sub -basins for 2070 -2099 for the HB2 climate scenarios. In general, temperature changes in the HB2 scenarios are less than the HA2 scenarios and precipitation decreases are more in the HB2 scenarios than the HA2 scenarios. For instance, for the Lower Sacramento, the estimated average total annual precipitation by 2070-2099 is 391 mm. Much of the analysis in this report will focus on the HA2 climate scenarios.
Figure 20: Lower Sacramento Monthly Precipitation and Temperature (with 2? bars) for the historical record (1961-1990) and future projections based on the HA2 GCM for 2070-2099
Water, Climate, Food, and Environment in Sacramento Basin 32 Contribution to ADAPT: Adaptation strategies to changing environments
Figure 21: Upper Battle Monthly Precipitation and Temperature (with 2? bars) for the historical record (1961-1990) and future projections based on the HA2 GCM for 2070-2099.
Figure 22: Upper Battle and Lower Sacramento Monthly Precipitation and Temperature (with 2? bars) for the HB2 GCM for 2070-2099.
Water, Climate, Food, and Environment in Sacramento Basin 33 Contribution to ADAPT: Adaptation strategies to changing environments
For the scenarios that will be examined in this project , we use one realization from each climate scenario, HA2 and HB2, from each time period, 2010-2039 and 2070-2099. Future work will examine the robustness of adaptation strategies by considering true ensemble s of climate realizations.
4. Modeling activities The field scale model SWAP (van Dam et al., 1997) and the basin scale model WEAP (WEAP, 2002) have been setup for the Sacramento basin to analyze and understand current water resources issues. In the next phase of the project these models will be used as tools to evaluate mechanisms designed to cope with expected internal and external changes in the water resources system.
4.1. Field scale 4.1.1. SWAP model The agro -hydrological analysis at the field scale is performed using the SWAP 2.0 model (van Dam et al., 1997). SWAP is a one -dimensional physically based model for water, heat and solute transport in the saturated and unsaturated zones, and also includes modules for simulating irrigation practices and crop growth. For this specific case, only the water transport and crop growth modules are used. The water transport module in SWAP is based on the well-known Richards’ equation, which is a combination of Darcy’s law and the continuity equation. A finite difference solution scheme is used to solve Richards’ equation. Crop yields can be computed using a simple crop growth algorithm based on Doorenbos and Kassam (1979) or by using a detailed crop growth simulation module that partitions the carbohydrates produced between the different parts of the plant, as a function of the different phenological stages of the plant (van Diepen et al., 1989). Potential evapotranspiration is partitioned into potential soil evaporation and crop transpiration using the leaf area index. Actual transpiration and evaporation are obtained as a function of the available soil water in the top layer or the ro ot zone for, respectively, evaporation and transpiration. Finally irrigation can be prescribed at fixed times, scheduled according to different criteria, or by using a combination of both. A detailed description of the model and all its components is beyond the scope of this paper, but can be found in Van Dam et al. (1997).
4.1.2. Data Meteorological SWAP requires the following daily meteorological data: rainfall, temperature, humidity, wind speed, sunshine hours, and radiation.
Soil Data
The most important soil data for the SWAP model are the soil hydraulic functions: water retention and hydraulic conductivity curves. In order to ensure a universal approach to field scale analyses across the seven basins included in ADAPT, soil hydraulic functions have been generated using the FAO soil map of the world as a base and applying pedo -transfer functions (Wösten et al., 1998). A detailed description of this approach can be found elsewhere (Droogers, 2002).
Groundwater
Groundwater depths in the agricultural areas vary between 3 to 5 meters and are spatially as well as temporal ly variable and to a great extent a function of irrigation related factors.
Water, Climate, Food, and Environment in Sacramento Basin 34 Contribution to ADAPT: Adaptation strategies to changing environments
4.1.3. Field Scale Results Using the SWAP model described, Droogers and van Dam (2003) determine that rice yields are expected to increase by almost 50% for the A2 climate scenario and 20% for the B2 scenario. These increases are primarily a result of enhanced CO 2 levels in the atmosphere . To maintain these levels of yields, irrigation requirements will need to increase from 900 mm/yr to 1000 mm/yr for the 2010 -2039 period and 1150 mm/yr for the 2070 -2099 period. Droogers and van Dam also examine two adaption strategies: (1) reduction in irrigation by about 10% and (2) restrict irrigation to 900 mm/yr. These restrictions have dramatic impacts on the yield and water productivity. It is clear that such adaptations may result in some rice areas being taken out of production. For instance, a 10% reduction in rice irrigaiton will results in about a 30% reduction in rice production. Of all the cases considered, tomato production (which could increase by as much as 20%) provides the highest water productivity, defined in terms of gross production. The variation in yield reduces over time, even for an increased irrigation strategy, but remains high in comparison to the rice crop. Lastly, increasing irrigation does not substantially boost production. Stopping irrigation completely, although has little impact on the baseline, does indeed have dramatic effects in the future.
4.2. Basin scale 4.2.1. WEAP model Basin scale models can be grouped in different ways depending on the spatial scale they cover or the amount of physics built in. The WEAP model (Water Evaluation and Planning System) is a water allocation model at river basin scale with limited physical processes included, but a very strong focus on scenario analyses. WEAP has been developed by the Boston Center of the Stockholm Environment Institute in the USA. The following sections are excerpted from the WEAP21 manual (WEAP, 2002).
Background
The Water Evaluation and Planning System (WEAP) is distinguished by its integrated approach to simulating water systems and by its policy orientation. WEAP places the demand side of the equation – water use patterns, equipment efficiencies, re -use, prices and allocation – on an equal footing with the supply side – streamflow, groundwater, reservoirs and water transfers. WEAP is a laboratory for examining alternative water development and management strategies. WEAP is comprehensive, straightforward and easy-to-use, and attempts to assist rather than substitute for the skilled planner. As a database, WEAP provides a system for maintaining water demand and supply information. As a forecasting tool, WEAP simulates water demand, supply, flows, and storage, and pollut ion generation, treatment and discharge. As a policy analysis tool, WEAP evaluates a full range of water development and management options, and takes account of multiple and competing uses of water systems.
Overview
Operating on the basic principle of water balance accounting, WEAP is applicable to municipal and agricultural systems, single sub-basins or complex river systems. Moreover, WEAP can address a wide range of issues, e.g., sectoral demand analyses, water conservation, water rights and allocation priorities, groundwater and streamflow simulations, reservoir operations, hydropower generation, pollution tracking, ecosystem requirements, and project benefit-cost analyses. The analyst represents the system in terms of its various supply sources (e.g., rivers, creeks, groundwater, reservoirs); withdrawal, transmission and wastewater treatment facilities;
Water, Climate, Food, and Environment in Sacramento Basin 35 Contribution to ADAPT: Adaptation strategies to changing environments
ecosystem requirements, water demands and pollution generation. The data structure and level of detail may be customized to meet the requirements of a particular analysis, and to reflect the limits imposed by restricted data. WEAP applications generally include several steps. The study definition sets up the time frame, spatial boundary, system components and configuration of the problem. The Current Accounts portion of the model provides a snapshot of actual water demand, pollution loads, resources and supplies for the system. Alternative sets of future assumptions are based on policies, costs, technological development and other factors that affect demand, pollution, supply and hydrology. Scenarios are constructed consisting of alternative sets of assumptions or policies. Finally, the scenarios are evaluated with regard to water sufficiency, costs and benefits, compatibility with environmental targets, and sensitivity to uncertainty in key variables.
Approach
WEAP’s approach is to build a straightforward and flexible tool to assist, but not substitute for, the user of the model. WEAP represents a new generation of water planning software that utilizes the powerful capability of today's personal computers to give water professionals everywhere access to appropriate tools. The design of WEAP is guided by a number of methodological considerations within an integrated and comprehensive planning framework [this first consideration actually isn’t discussed in turn below]: use of scenario analyses in understanding the effects of different development choices; demand-management capability; environmental assessment capability; and ease -of-use. These considerations are discussed in turn below:
Scenario Analysis
Within WEAP, the so -called Current Accounts of the water system under study should be created first. Then, based on a variety of economic, demographic, hydrological, and technological trends, a “reference” or “business-as-usual” scenario projection is established. One can then develop any number of policy scenarios with alternative assumptions about future developments. The scenarios can address a broad range of “what if” questions, such as: What if population growth and economic development patterns change? What if reservoir operating rules are altered? What if groundwater is more fully exploited? What if water conservation is introduced? What if ecosystem requirements are tightened? What if new sources of water pollution are added? What if a water-recycling program is implemented? What if a more efficient irrigation technique is implemented? What if the mix of agricultural crops changes? What if climate change alters the hydrology? These scenarios may be viewed simultaneously in the results for easy comparison of their effects on the water system.
Demand Management Capability
WEAP is unique is its capability of representing the effects of demand management on water systems. Water requirements may be derived from a detailed set of final uses, or “water services” in different economic sectors. For example, the agricultural sector could be disaggregated by crop types, irrigation districts and irrigation techniques. An urban sector could be organized by county, cit y, and water district. Industrial demand can be broken down by industrial sub -sector and further into process water and cooling water. This approach places development objectives – providing end -use goods and services – at the foundation of water analysis, and allows an evaluation of effects of improved technologies on these uses, as well as effects of changing prices on quantities of water demanded. In addition, priorities for allocating water for particular demands or from particular sources may be specif ied by the user.
Water, Climate, Food, and Environment in Sacramento Basin 36 Contribution to ADAPT: Adaptation strategies to changing environments
Environmental Effects WEAP scenario analyses can account for the requirements of aquatic ecosystems. They also can provide a summary of the pollution pressure different water uses impose on the overall system. Pollution is tracked from generation through treatment and outflow into surface and underground bodies of water.
Ease of Use
An intuitive graphical interface provides a simple yet powerful means for constructing, viewing and modifying the system and its data. The main functions--loading data, calculating and reviewing results--are handled through an interactive screen structure that prompts the user, catches errors and provides on-screen guidance. The expandable and adaptable data structures of WEAP accommodate the evolving needs of water analysts as better information becomes available and planning issues change. In addition, WEAP allows users to develop their own set of variables and equations to further refine and/or adapt the analysis to local constraints and conditions.
Hydrology
In the current version of WEAP, the hydrologic system is mainly based on flows in rivers and canals (blue water), while water used to sustain crop growth (or forests etc.) is ignored and is defined as one single demand term. In order to account for this gre en water WEAP has been modified to do simplified groundwater and surface water hydrology. A description of these modifications can be obtained from the authors.
5. Impacts
5.1. Indicators The Sacramento case study follows a generic methodology that allows for quantifying food and environmental security (while industrial security is relevant for some of the ADAPT basins, it is not currently treated in this discussion of the Sacramento). This methodology allows stakeholders to develop and evaluate different adaptation strategies to alleviate negative impacts of climate change, which is critical in implementing successful policies. In order to quantify impacts, it is import to define a representative set of state indicators, where we define representative as reflecting the value over time of the water resources system for preserving food security and environmental quality. Hence, impacts are here defined as the change in the values of state indicators. A state indicator has to meet several criteria, in order to make it operational. (1) An indicator has to be representative with respect to the goal it represents. In this study, the goals are to preserve both food security and environmental quality. (2) Indicators must be understandable for all stakeholders and users involved. And (3), data needed to measure an indicator must be accessible and available (Cole, 1998). A set of six state indicators for the Sacramento basin have been defined that best highlight the impacts of climate change on food production and ecosystem health, as well as provide measures of the aforementioned goals of food and environmental security. Preserving food security is represented by changes in two indicators:
? Agricultural production ? Variation in annual agricultural production.
Note that for the purposes of this report we will assume that agricultural production is a linear function of the crop water requirements. Therefore, we will use unmet agricultural
Water, Climate, Food, and Environment in Sacramento Basin 37 Contribution to ADAPT: Adaptation strategies to changing environments
demands as a surrogate for changes in agricultural production. Variation in annual agricultural production will be defined as the standard deviation of the unmet agricultural demands over the time period of interest. Environmental security is related to both impacts on human health and well being and impacts on natural ecosystems and is represented by changes in four indicators:
? Salmon population, as a surrogate for fish and aquatic life ? Wetland area, including area of rice flooded in the winter season, as a surrogate for
wildlife habitat ? Availability of water for domestic purposes ? Aquifer storage, as a measure of sustainability
Salmon population is a measure of overall instream aquatic health. We use as a proxy for changes in salmon population the change in frequency of unmet instream flow requirements designed to support salmon habitat . Wetland area is a measure of riparian habitat, as well as a unique ecosystem important for many wildlife species as well as providing water purification. Water for domestic consumption has direct bearing on human health and well-being. Finally aquifer storage gives an indication of the overall sustainability of the system. Socio-economic indicators that we have not included here are farmer income and hydropower generation. These will be assessed in the second phase of the ADAPT project. This project will examine how various adaptation strategies, including a “business as usual” strategy, will change the above indicators.
5.2. Impacts with No Climate Change Even without climate change, an increase in population and consequent increase in domestic demand and changes in land use (increased urbanization) will increase pressures on water resources in the Sacramento watershed. Population changes described in section 2.2 and land use changes described in section 3.1 are used throughout the analyses. We assume that the increase in urban land use is at the expense of all other land types equally. There is already concern about meeting water requirements in 2020 without climate change. Bulletin 160-98 of the California Water Plan Update estimates that, at 1995 levels of development, water shortages already exist and are on the order of 2,000 million cubic meters (MCM) in average water years for the entire state. In drought years the shortage nearly triples to 7,000 MCM. By 2020, due to population -driven demand grow th, it is estimated that the shortages will be 3000 MCM in an average water year and 8,000 MCM in drought years for the state of California, and 105 MCM and 1220 MCM for the Sacramento watershed, average and drought years respectively (Department of Water Resources, 1998). The Sacramento is in part vulnerable to water shortages as substantial supplies are exported to meet demands in other parts of the state. An aspect of the future that has not been so explicitly explored in the state is the impact of land use changes on the hydrology of the system, and in particular a shift of land use from agriculture to urban areas. Model results are much higher than these Sacramento projections of deficit for an average year without climate change – at 505 MCM. One possible explanation is that the Department of Water Resources water budget did not consider exports from the Sacramento region to other parts of the state. The export from the Sacramento delta to the San Joaquin Valley and Los Angeles are currently modeled as major demands (combined urban and agricultural demand of approximately 7,400 MCM). Another possible explanation for this is that the California state projections do not account for the impact of land use change as predicted by Landis and Reilly (2003) (described in section 3.1) on the basin hydrology, which is likely negatively impacted.
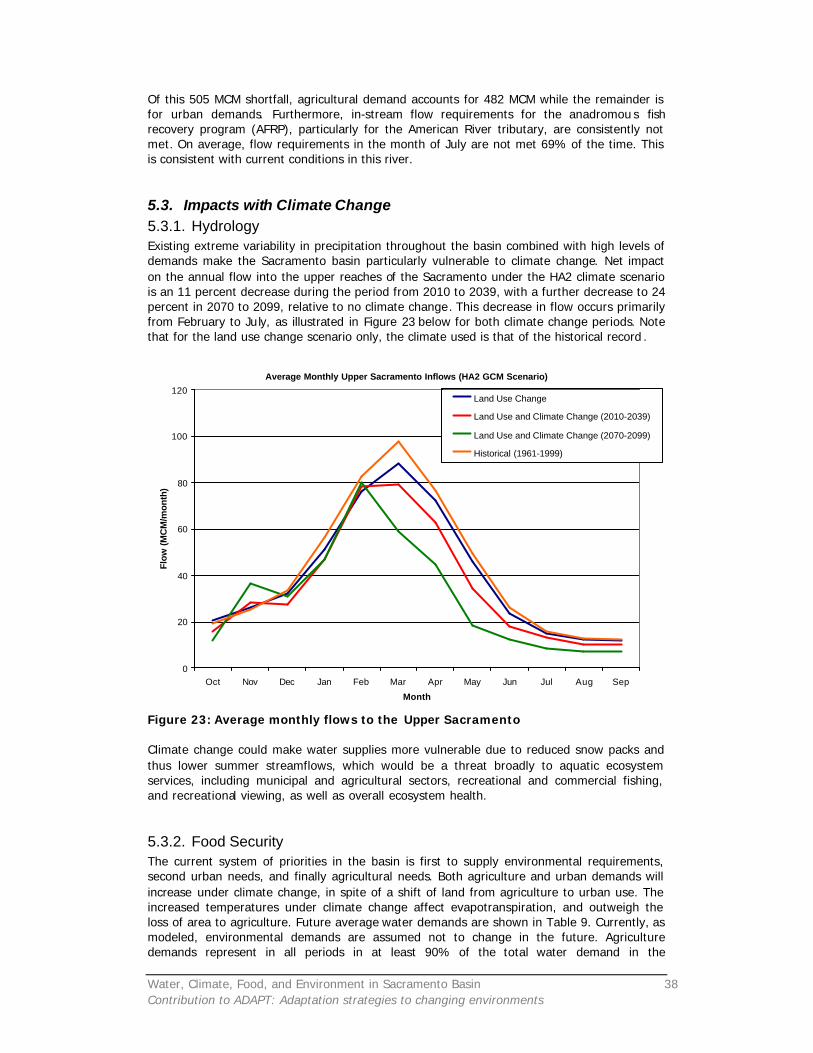
Water, Climate, Food, and Environment in Sacramento Basin 38 Contribution to ADAPT: Adaptation strategies to changing environments
Of this 505 MCM shortfall, agricultural demand accounts for 482 MCM while the remainder is for urban demands. Furthermore, in-stream flow requirements for the anadromou s fish recovery program (AFRP), particularly for the American River tributary, are consistently not met. On average, flow requirements in the month of July are not met 69% of the time. This is consistent with current conditions in this river.
5.3. Impacts with Climate Change 5.3.1. Hydrology Existing extreme variability in precipitation throughout the basin combined with high levels of demands make the Sacramento basin particularly vulnerable to climate change. Net impact on the annual flow into the upper reaches of the Sacramento under the HA2 climate scenario is an 11 percent decrease during the period from 2010 to 2039, with a further decrease to 24 percent in 2070 to 2099, relative to no climate change. This decrease in flow occurs primarily from February to July, as illustrated in Figure 23 below for both climate change periods. Note that for the land use change scenario only, the climate used is that of the historical record .
Average Monthly Upper Sacramento Inflows (HA2 GCM Scenario)
0
20
40
60
80
100
120
Oct Nov Dec Jan Feb Mar Apr May Jun Jul Aug Sep
Month
Flow
(M
CM
/mon
th)
Land Use Change
Land Use and Climate Change (2010-2039)
Land Use and Climate Change (2070-2099)
Historical (1961-1999)
Figure 23: Average monthly flows to the Upper Sacramento Climate change could make water supplies more vulnerable due to reduced snow packs and thus lower summer streamflows, which would be a threat broadly to aquatic ecosystem services, including municipal and agricultural sectors, recreational and commercial fishing, and recreational viewing, as well as overall ecosystem health.
5.3.2. Food Security The current system of priorities in the basin is first to supply environmental requirements, second urban needs, and finally agricultural needs. Both agriculture and urban demands will increase under climate change, in spite of a shift of land from agriculture to urban use. The increased temperatures under climate change affect evapotranspiration, and outweigh the loss of area to agriculture. Future average water demands are shown in Table 9. Currently, as modeled, environmental demands are assumed not to change in the future. Agriculture demands represent in all periods in at least 90% of the total water demand in the
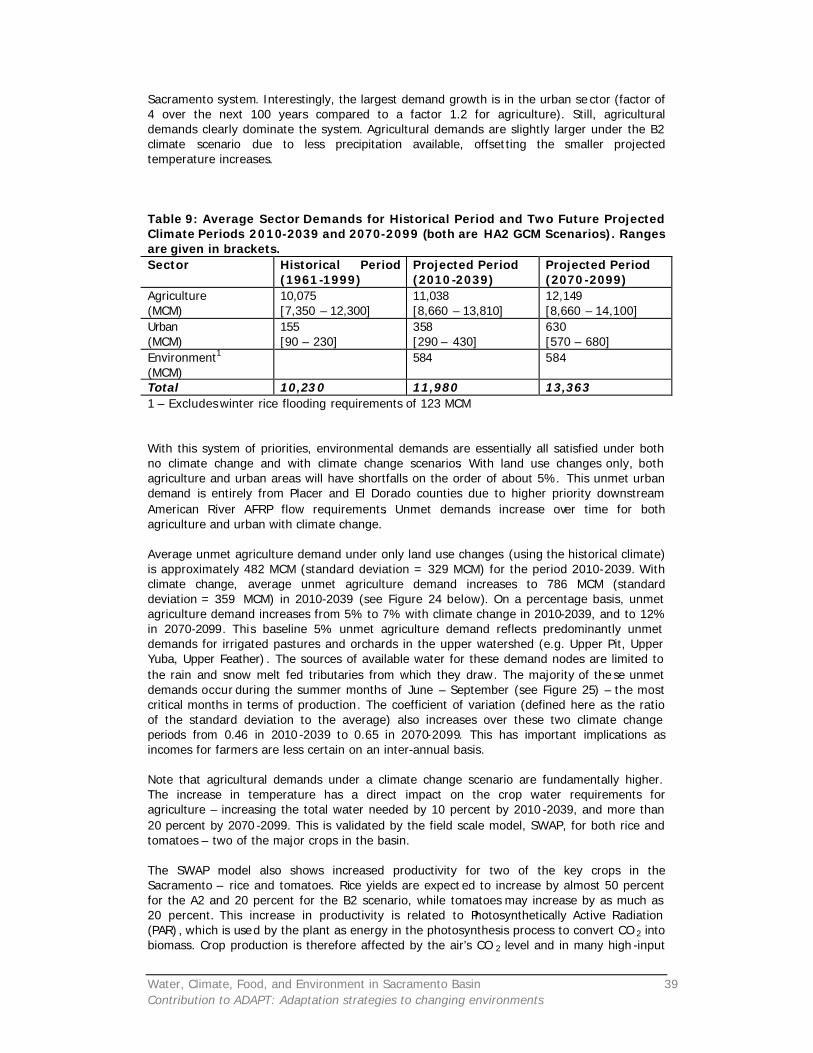
Water, Climate, Food, and Environment in Sacramento Basin 39 Contribution to ADAPT: Adaptation strategies to changing environments
Sacramento system. Interestingly, the largest demand growth is in the urban se ctor (factor of 4 over the next 100 years compared to a factor 1.2 for agriculture). Still, agricultural demands clearly dominate the system. Agricultural demands are slightly larger under the B2 climate scenario due to less precipitation available, offsetting the smaller projected temperature increases. Table 9: Average Sector Demands for Historical Period and Two Future Projected Climate Periods 2010-2039 and 2070-2099 (both are HA2 GCM Scenarios). Ranges are given in brackets. Sector Historical Period
(1961-1999) Projected Period (2010-2039)
Projected Period (2070-2099)
Agriculture (MCM)
10,075 [7,350 – 12,300]
11,038 [8,660 – 13,810]
12,149 [8,660 – 14,100]
Urban (MCM)
155 [90 – 230]
358 [290 – 430]
630 [570 – 680]
Environment1 (MCM)
584
584
Total 10,230 11,980 13,363 1 – Excludes winter rice flooding requirements of 123 MCM With this system of priorities, environmental demands are essentially all satisfied under both no climate change and with climate change scenarios. With land use changes only, both agriculture and urban areas will have shortfalls on the order of about 5%. This unmet urban demand is entirely from Placer and El Dorado counties due to higher priority downstream American River AFRP flow requirements. Unmet demands increase over time for both agriculture and urban with climate change. Average unmet agriculture demand under only land use changes (using the historical climate) is approximately 482 MCM (standard deviation = 329 MCM) for the period 2010-2039. With climate change, average unmet agriculture demand increases to 786 MCM (standard deviation = 359 MCM) in 2010-2039 (see Figure 24 below). On a percentage basis, unmet agriculture demand increases from 5% to 7% with climate change in 2010-2039, and to 12% in 2070-2099. This baseline 5% unmet agriculture demand reflects predominantly unmet demands for irrigated pastures and orchards in the upper watershed (e.g. Upper Pit, Upper Yuba, Upper Feather) . The sources of available water for these demand nodes are limited to the rain and snow melt fed tributaries from which they draw. The majority of the se unmet demands occur during the summer months of June – September (see Figure 25) – the most critical months in terms of production. The coefficient of variation (defined here as the ratio of the standard deviation to the average) also increases over these two climate change periods from 0.46 in 2010 -2039 to 0.65 in 2070-2099. This has important implications as incomes for farmers are less certain on an inter-annual basis. Note that agricultural demands under a climate change scenario are fundamentally higher. The increase in temperature has a direct impact on the crop water requirements for agriculture – increasing the total water needed by 10 percent by 2010 -2039, and more than 20 percent by 2070 -2099. This is validated by the field scale model, SWAP, for both rice and tomatoes – two of the major crops in the basin. The SWAP model also shows increased productivity for two of the key crops in the Sacramento – rice and tomatoes. Rice yields are expect ed to increase by almost 50 percent for the A2 and 20 percent for the B2 scenario, while tomatoes may increase by as much as 20 percent. This increase in productivity is related to Photosynthetically Active Radiation (PAR) , which is used by the plant as energy in the photosynthesis process to convert CO 2 into biomass. Crop production is therefore affected by the air’s CO 2 level and in many high -input
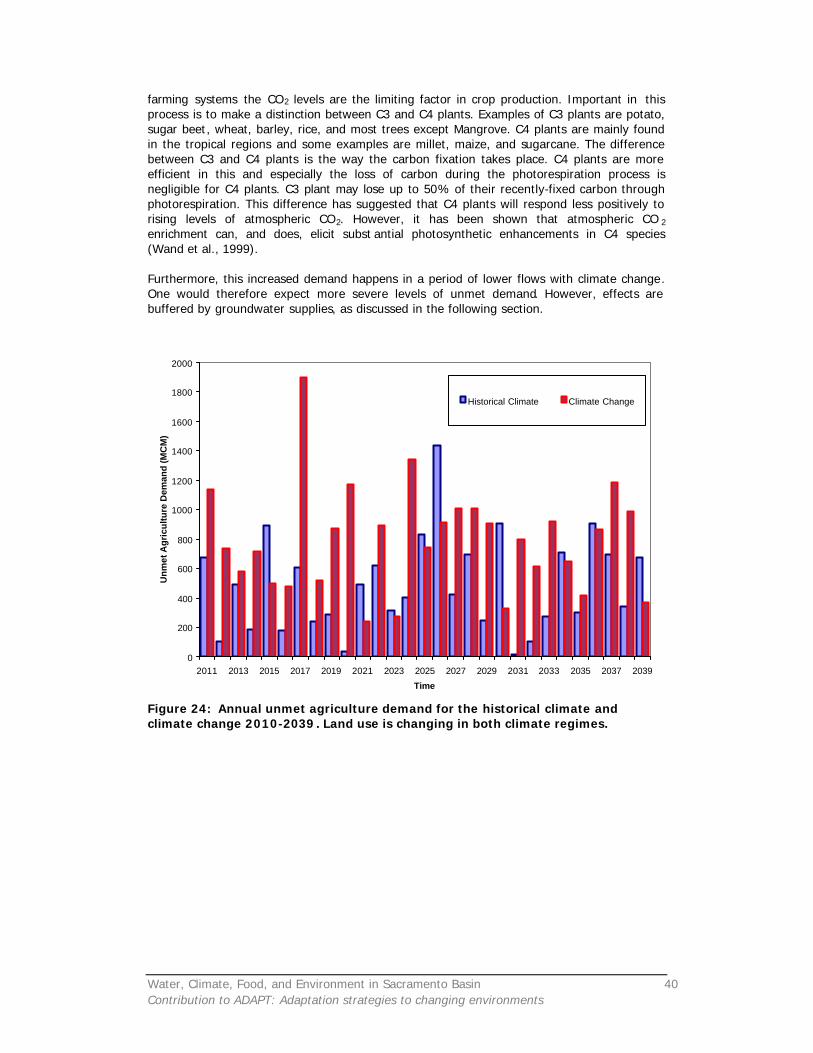
Water, Climate, Food, and Environment in Sacramento Basin 40 Contribution to ADAPT: Adaptation strategies to changing environments
farming systems the CO2 levels are the limiting factor in crop production. Important in this process is to make a distinction between C3 and C4 plants. Examples of C3 plants are potato, sugar beet, wheat, barley, rice, and most trees except Mangrove. C4 plants are mainly found in the tropical regions and some examples are millet, maize, and sugarcane. The difference between C3 and C4 plants is the way the carbon fixation takes place. C4 plants are more efficient in this and especially the loss of carbon during the photorespiration process is negligible for C4 plants. C3 plant may lose up to 50% of their recently-fixed carbon through photorespiration. This difference has suggested that C4 plants will respond less positively to rising levels of atmospheric CO2. However, it has been shown that atmospheric CO 2 enrichment can, and does, elicit subst antial photosynthetic enhancements in C4 species (Wand et al., 1999). Furthermore, this increased demand happens in a period of lower flows with climate change. One would therefore expect more severe levels of unmet demand. However, effects are buffered by groundwater supplies, as discussed in the following section.
0
200
400
600
800
1000
1200
1400
1600
1800
2000
2011 2013 2015 2017 2019 2021 2023 2025 2027 2029 2031 2033 2035 2037 2039
Time
Un
met
Ag
ricu
ltu
re D
eman
d (M
CM
)
Historical Climate Climate Change
Figure 24: Annual unmet agriculture demand for the historical climate and climate change 2010-2039 . Land use is changing in both climate regimes.
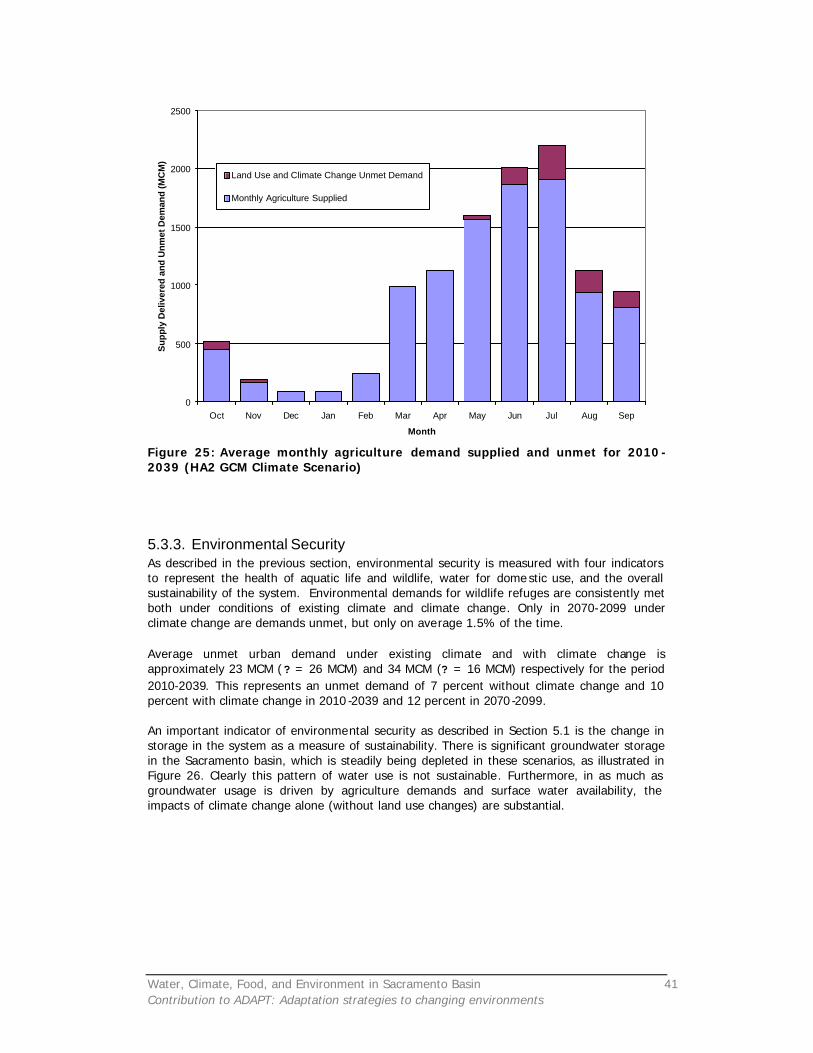
Water, Climate, Food, and Environment in Sacramento Basin 41 Contribution to ADAPT: Adaptation strategies to changing environments
0
500
1000
1500
2000
2500
Oct Nov Dec Jan Feb Mar Apr May Jun Jul Aug Sep
Month
Su
pp
ly D
eliv
ered
an
d U
nm
et D
eman
d (M
CM
)
Land Use and Climate Change Unmet Demand
Monthly Agriculture Supplied
Figure 25: Average monthly agriculture demand supplied and unmet for 2010 -2039 (HA2 GCM Climate Scenario)
5.3.3. Environmental Security As described in the previous section, environmental security is measured with four indicators to represent the health of aquatic life and wildlife, water for dome stic use, and the overall sustainability of the system. Environmental demands for wildlife refuges are consistently met both under conditions of existing climate and climate change. Only in 2070-2099 under climate change are demands unmet, but only on average 1.5% of the time. Average unmet urban demand under existing climate and with climate change is approximately 23 MCM (? = 26 MCM) and 34 MCM (? = 16 MCM) respectively for the period 2010-2039. This represents an unmet demand of 7 percent without climate change and 10 percent with climate change in 2010 -2039 and 12 percent in 2070 -2099. An important indicator of environmental security as described in Section 5.1 is the change in storage in the system as a measure of sustainability. There is significant groundwater storage in the Sacramento basin, which is steadily being depleted in these scenarios, as illustrated in Figure 26. Clearly this pattern of water use is not sustainable. Furthermore, in as much as groundwater usage is driven by agriculture demands and surface water availability, the impacts of climate change alone (without land use changes) are substantial.
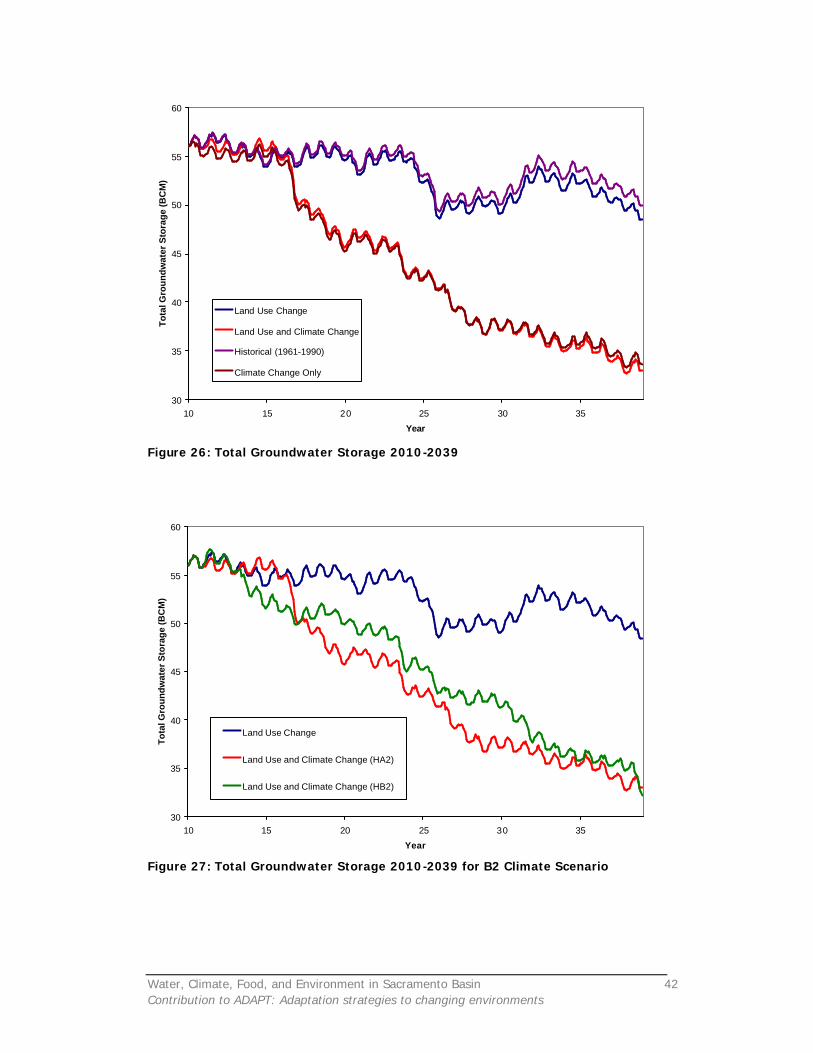
Water, Climate, Food, and Environment in Sacramento Basin 42 Contribution to ADAPT: Adaptation strategies to changing environments
30
35
40
45
50
55
60
10 15 20 25 30 35
Year
To
tal G
rou
nd
wat
er S
tora
ge
(BC
M)
Land Use Change
Land Use and Climate Change
Historical (1961-1990)
Climate Change Only
Figure 26: Total Groundwater Storage 2010-2039
30
35
40
45
50
55
60
10 15 20 25 30 35
Year
To
tal G
rou
nd
wat
er S
tora
ge
(BC
M)
Land Use Change
Land Use and Climate Change (HA2)
Land Use and Climate Change (HB2)
Figure 27: Total Groundwater Storage 2010-2039 for B2 Climate Scenario
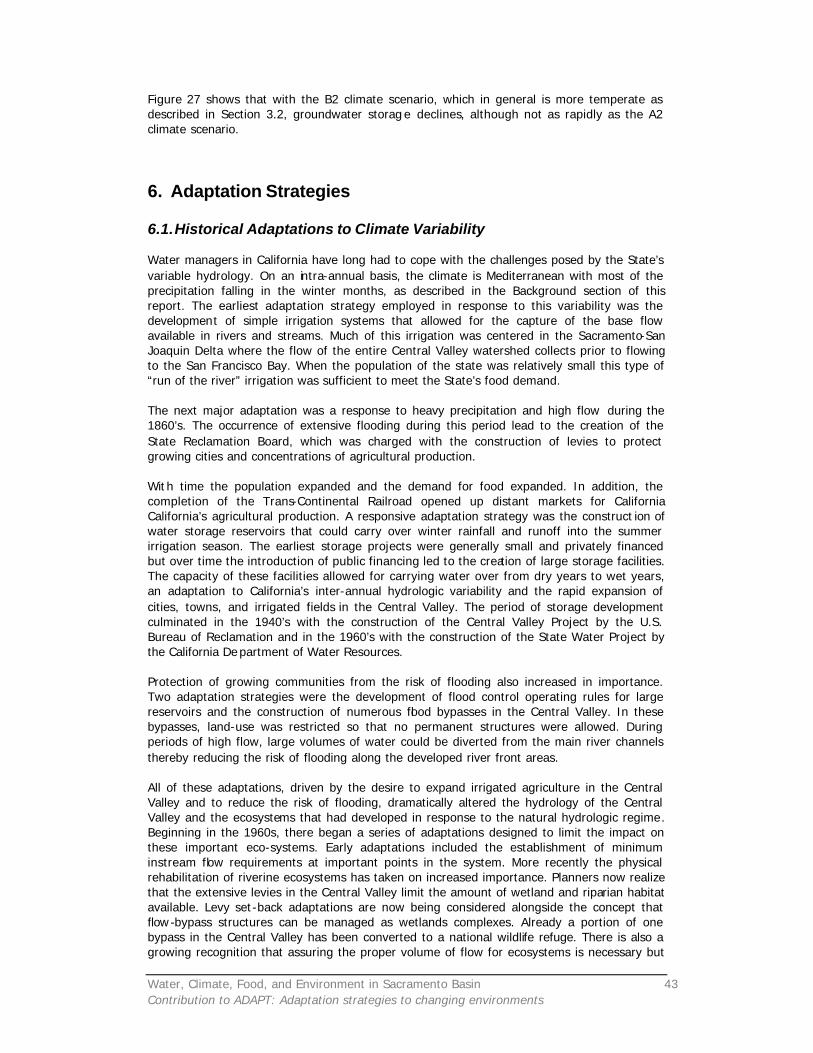
Water, Climate, Food, and Environment in Sacramento Basin 43 Contribution to ADAPT: Adaptation strategies to changing environments
Figure 27 shows that with the B2 climate scenario, which in general is more temperate as described in Section 3.2, groundwater storag e declines, although not as rapidly as the A2 climate scenario.
6. Adaptation Strategies
6.1. Historical Adaptations to Climate Variability Water managers in California have long had to cope with the challenges posed by the State’s variable hydrology. On an intra-annual basis, the climate is Mediterranean with most of the precipitation falling in the winter months, as described in the Background section of this report. The earliest adaptation strategy employed in response to this variability was the development of simple irrigation systems that allowed for the capture of the base flow available in rivers and streams. Much of this irrigation was centered in the Sacramento-San Joaquin Delta where the flow of the entire Central Valley watershed collects prior to flowing to the San Francisco Bay. When the population of the state was relatively small this type of “run of the river” irrigation was sufficient to meet the State’s food demand. The next major adaptation was a response to heavy precipitation and high flow during the 1860’s. The occurrence of extensive flooding during this period lead to the creation of the State Reclamation Board, which was charged with the construction of levies to protect growing cities and concentrations of agricultural production. Wit h time the population expanded and the demand for food expanded. In addition, the completion of the Trans-Continental Railroad opened up distant markets for California California’s agricultural production. A responsive adaptation strategy was the construct ion of water storage reservoirs that could carry over winter rainfall and runoff into the summer irrigation season. The earliest storage projects were generally small and privately financed but over time the introduction of public financing led to the creation of large storage facilities. The capacity of these facilities allowed for carrying water over from dry years to wet years, an adaptation to California’s inter-annual hydrologic variability and the rapid expansion of cities, towns, and irrigated fields in the Central Valley. The period of storage development culminated in the 1940’s with the construction of the Central Valley Project by the U.S. Bureau of Reclamation and in the 1960’s with the construction of the State Water Project by the California De partment of Water Resources. Protection of growing communities from the risk of flooding also increased in importance. Two adaptation strategies were the development of flood control operating rules for large reservoirs and the construction of numerous flood bypasses in the Central Valley. In these bypasses, land-use was restricted so that no permanent structures were allowed. During periods of high flow, large volumes of water could be diverted from the main river channels thereby reducing the risk of flooding along the developed river front areas. All of these adaptations, driven by the desire to expand irrigated agriculture in the Central Valley and to reduce the risk of flooding, dramatically altered the hydrology of the Central Valley and the ecosystems that had developed in response to the natural hydrologic regime. Beginning in the 1960s, there began a series of adaptations designed to limit the impact on these important eco-systems. Early adaptations included the establishment of minimum instream flow requirements at important points in the system. More recently the physical rehabilitation of riverine ecosystems has taken on increased importance. Planners now realize that the extensive levies in the Central Valley limit the amount of wetland and riparian habitat available. Levy set-back adaptations are now being considered alongside the concept that flow-bypass structures can be managed as wetlands complexes. Already a portion of one bypass in the Central Valley has been converted to a national wildlife refuge. There is also a growing recognition that assuring the proper volume of flow for ecosystems is necessary but
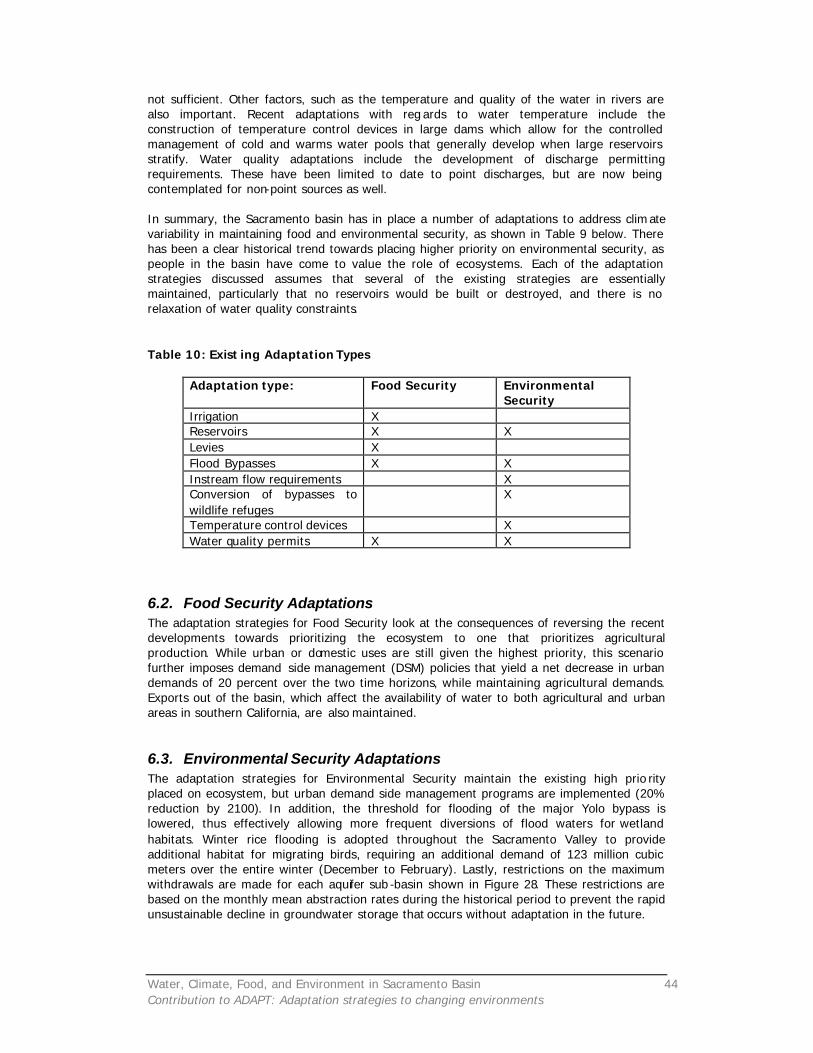
Water, Climate, Food, and Environment in Sacramento Basin 44 Contribution to ADAPT: Adaptation strategies to changing environments
not sufficient. Other factors, such as the temperature and quality of the water in rivers are also important. Recent adaptations with reg ards to water temperature include the construction of temperature control devices in large dams which allow for the controlled management of cold and warms water pools that generally develop when large reservoirs stratify. Water quality adaptations include the development of discharge permitting requirements. These have been limited to date to point discharges, but are now being contemplated for non-point sources as well. In summary, the Sacramento basin has in place a number of adaptations to address clim ate variability in maintaining food and environmental security, as shown in Table 9 below. There has been a clear historical trend towards placing higher priority on environmental security, as people in the basin have come to value the role of ecosystems. Each of the adaptation strategies discussed assumes that several of the existing strategies are essentially maintained, particularly that no reservoirs would be built or destroyed, and there is no relaxation of water quality constraints. Table 10: Exist ing Adaptation Types
Adaptation type: Food Security Environmental Security
Irrigation X Reservoirs X X Levies X Flood Bypasses X X Instream flow requirements X Conversion of bypasses to wildlife refuges
X
Temperature control devices X Water quality permits X X
6.2. Food Security Adaptations The adaptation strategies for Food Security look at the consequences of reversing the recent developments towards prioritizing the ecosystem to one that prioritizes agricultural production. While urban or domestic uses are still given the highest priority, this scenario further imposes demand side management (DSM) policies that yield a net decrease in urban demands of 20 percent over the two time horizons, while maintaining agricultural demands. Exports out of the basin, which affect the availability of water to both agricultural and urban areas in southern California, are also maintained.
6.3. Environmental Security Adaptations The adaptation strategies for Environmental Security maintain the existing high prio rity placed on ecosystem, but urban demand side management programs are implemented (20% reduction by 2100). In addition, the threshold for flooding of the major Yolo bypass is lowered, thus effectively allowing more frequent diversions of flood waters for wetland habitats. Winter rice flooding is adopted throughout the Sacramento Valley to provide additional habitat for migrating birds, requiring an additional demand of 123 million cubic meters over the entire winter (December to February). Lastly, restrictions on the maximum withdrawals are made for each aquifer sub -basin shown in Figure 28. These restrictions are based on the monthly mean abstraction rates during the historical period to prevent the rapid unsustainable decline in groundwater storage that occurs without adaptation in the future.
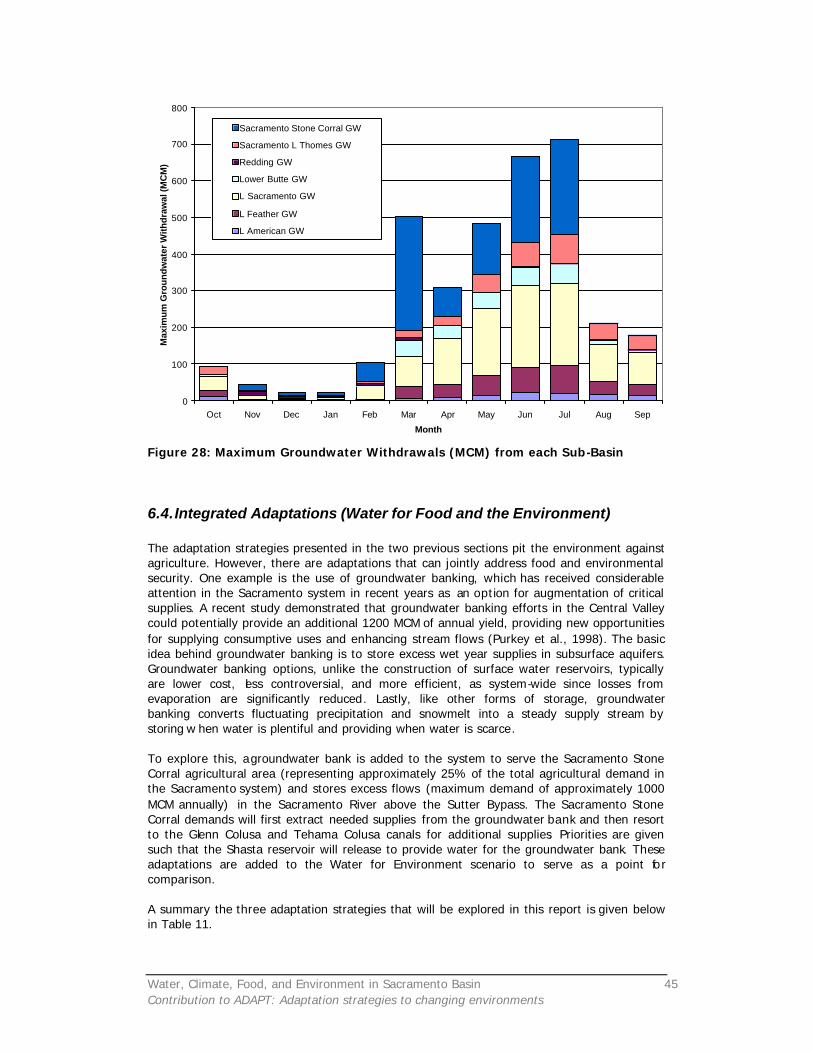
Water, Climate, Food, and Environment in Sacramento Basin 45 Contribution to ADAPT: Adaptation strategies to changing environments
0
100
200
300
400
500
600
700
800
Oct Nov Dec Jan Feb Mar Apr May Jun Jul Aug Sep
Month
Max
imu
m G
rou
nd
wat
er W
ith
dra
wal
(MC
M)
Sacramento Stone Corral GW
Sacramento L Thomes GW
Redding GW
Lower Butte GW
L Sacramento GW
L Feather GW
L American GW
Figure 28: Maximum Groundwater Withdrawals (MCM) from each Sub-Basin
6.4. Integrated Adaptations (Water for Food and the Environment) The adaptation strategies presented in the two previous sections pit the environment against agriculture. However, there are adaptations that can jointly address food and environmental security. One example is the use of groundwater banking, which has received considerable attention in the Sacramento system in recent years as an option for augmentation of critical supplies. A recent study demonstrated that groundwater banking efforts in the Central Valley could potentially provide an additional 1200 MCM of annual yield, providing new opportunities for supplying consumptive uses and enhancing stream flows (Purkey et al., 1998). The basic idea behind groundwater banking is to store excess wet year supplies in subsurface aquifers. Groundwater banking options, unlike the construction of surface water reservoirs, typically are lower cost, less controversial, and more efficient, as system-wide since losses from evaporation are significantly reduced. Lastly, like other forms of storage, groundwater banking converts fluctuating precipitation and snowmelt into a steady supply stream by storing w hen water is plentiful and providing when water is scarce. To explore this, a groundwater bank is added to the system to serve the Sacramento Stone Corral agricultural area (representing approximately 25% of the total agricultural demand in the Sacramento system) and stores excess flows (maximum demand of approximately 1000 MCM annually) in the Sacramento River above the Sutter Bypass. The Sacramento Stone Corral demands will first extract needed supplies from the groundwater bank and then resort to the Glenn Colusa and Tehama Colusa canals for additional supplies. Priorities are given such that the Shasta reservoir will release to provide water for the groundwater bank. These adaptations are added to the Water for Environment scenario to serve as a point fo r comparison. A summary the three adaptation strategies that will be explored in this report is given below in Table 11.
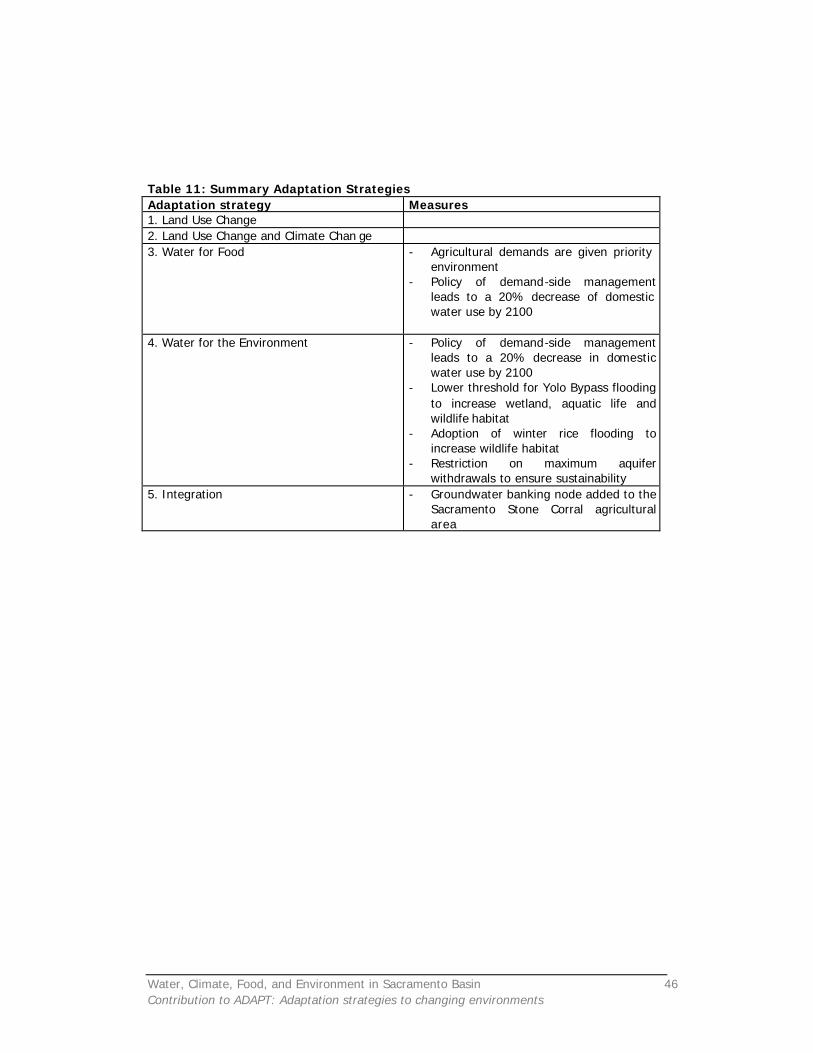
Water, Climate, Food, and Environment in Sacramento Basin 46 Contribution to ADAPT: Adaptation strategies to changing environments
Table 11: Summary Adaptation Strategies Adaptation strategy Measures 1. Land Use Change 2. Land Use Change and Climate Chan ge 3. Water for Food - Agricultural demands are given priority
environment - Policy of demand-side management
leads to a 20% decrease of domestic water use by 2100
4. Water for the Environment - Policy of demand-side management
leads to a 20% decrease in domestic water use by 2100
- Lower threshold for Yolo Bypass flooding to increase wetland, aquatic life and wildlife habitat
- Adoption of winter rice flooding to increase wildlife habitat
- Restriction on maximum aquifer withdrawals to ensure sustainability
5. Integration - Groundwater banking node added to the Sacramento Stone Corral agricultural area
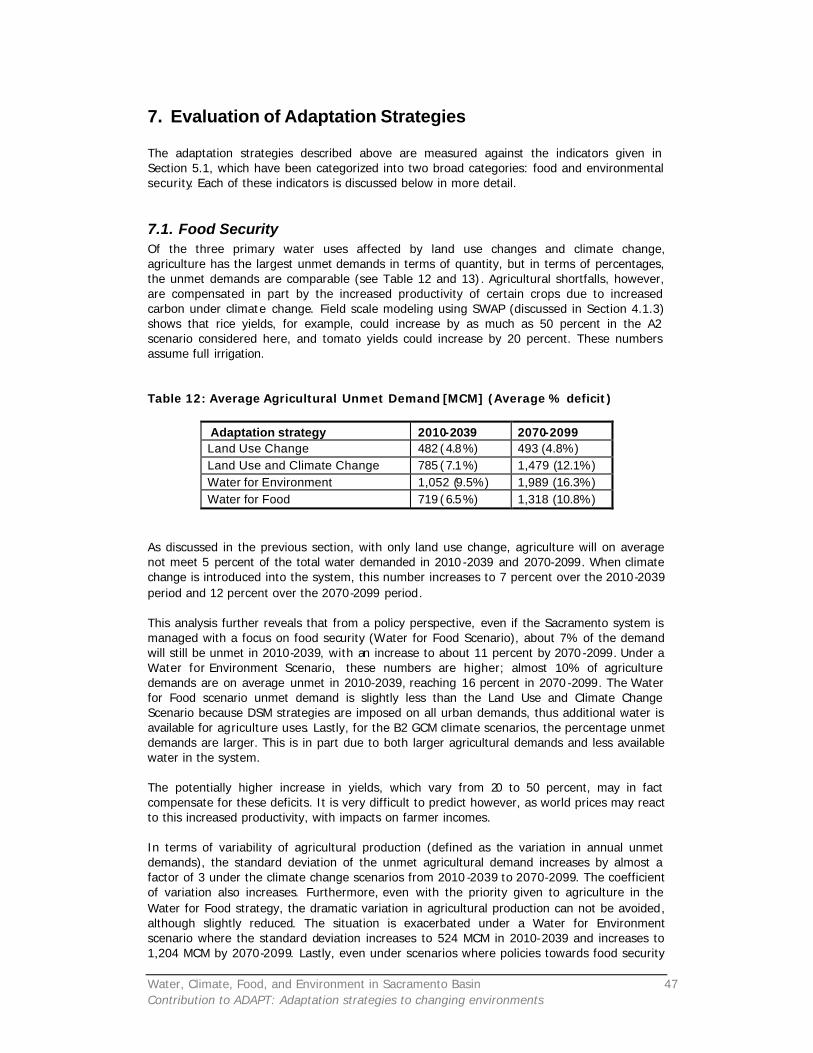
Water, Climate, Food, and Environment in Sacramento Basin 47 Contribution to ADAPT: Adaptation strategies to changing environments
7. Evaluation of Adaptation Strategies The adaptation strategies described above are measured against the indicators given in Section 5.1, which have been categorized into two broad categories: food and environmental security. Each of these indicators is discussed below in more detail.
7.1. Food Security Of the three primary water uses affected by land use changes and climate change, agriculture has the largest unmet demands in terms of quantity, but in terms of percentages, the unmet demands are comparable (see Table 12 and 13). Agricultural shortfalls, however, are compensated in part by the increased productivity of certain crops due to increased carbon under climate change. Field scale modeling using SWAP (discussed in Section 4.1.3) shows that rice yields, for example, could increase by as much as 50 percent in the A2 scenario considered here, and tomato yields could increase by 20 percent. These numbers assume full irrigation. Table 12: Average Agricultural Unmet Demand [MCM] (Average % deficit)
Adaptation strategy 2010-2039 2070-2099 Land Use Change 482 ( 4.8%) 493 (4.8%) Land Use and Climate Change 785 ( 7.1%) 1,479 (12.1%) Water for Environment 1,052 (9.5%) 1,989 (16.3%) Water for Food 719 ( 6.5%) 1,318 (10.8%)
As discussed in the previous section, with only land use change, agriculture will on average not meet 5 percent of the total water demanded in 2010 -2039 and 2070-2099. When climate change is introduced into the system, this number increases to 7 percent over the 2010-2039 period and 12 percent over the 2070-2099 period. This analysis further reveals that from a policy perspective, even if the Sacramento system is managed with a focus on food security (Water for Food Scenario), about 7% of the demand will still be unmet in 2010-2039, with an increase to about 11 percent by 2070 -2099. Under a Water for Environment Scenario, these numbers are higher; almost 10% of agriculture demands are on average unmet in 2010-2039, reaching 16 percent in 2070 -2099. The Water for Food scenario unmet demand is slightly less than the Land Use and Climate Change Scenario because DSM strategies are imposed on all urban demands, thus additional water is available for agriculture uses. Lastly, for the B2 GCM climate scenarios, the percentage unmet demands are larger. This is in part due to both larger agricultural demands and less available water in the system. The potentially higher increase in yields, which vary from 20 to 50 percent, may in fact compensate for these deficits. It is very difficult to predict however, as world prices may react to this increased productivity, with impacts on farmer incomes. In terms of variability of agricultural production (defined as the variation in annual unmet demands), the standard deviation of the unmet agricultural demand increases by almost a factor of 3 under the climate change scenarios from 2010 -2039 to 2070-2099. The coefficient of variation also increases. Furthermore, even with the priority given to agriculture in the Water for Food strategy, the dramatic variation in agricultural production can not be avoided, although slightly reduced. The situation is exacerbated under a Water for Environment scenario where the standard deviation increases to 524 MCM in 2010-2039 and increases to 1,204 MCM by 2070-2099. Lastly, even under scenarios where policies towards food security
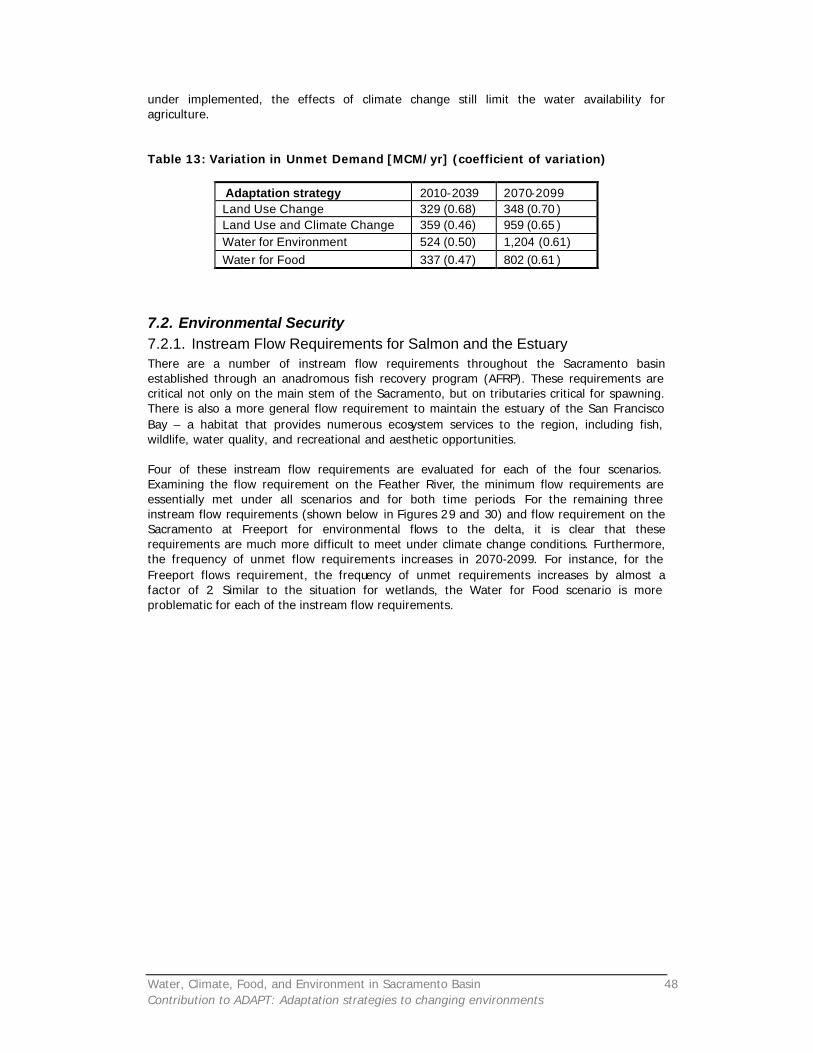
Water, Climate, Food, and Environment in Sacramento Basin 48 Contribution to ADAPT: Adaptation strategies to changing environments
under implemented, the effects of climate change still limit the water availability for agriculture. Table 13: Variation in Unmet Demand [MCM/yr] (coefficient of variation)
Adaptation strategy 2010-2039 2070-2099 Land Use Change 329 (0.68) 348 (0.70 ) Land Use and Climate Change 359 (0.46) 959 (0.65 ) Water for Environment 524 (0.50) 1,204 (0.61) Water for Food 337 (0.47) 802 (0.61 )
7.2. Environmental Security 7.2.1. Instream Flow Requirements for Salmon and the Estuary There are a number of instream flow requirements throughout the Sacramento basin established through an anadromous fish recovery program (AFRP). These requirements are critical not only on the main stem of the Sacramento, but on tributaries critical for spawning. There is also a more general flow requirement to maintain the estuary of the San Francisco Bay – a habitat that provides numerous ecosystem services to the region, including fish, wildlife, water quality, and recreational and aesthetic opportunities. Four of these instream flow requirements are evaluated for each of the four scenarios. Examining the flow requirement on the Feather River, the minimum flow requirements are essentially met under all scenarios and for both time periods. For the remaining three instream flow requirements (shown below in Figures 29 and 30) and flow requirement on the Sacramento at Freeport for environmental flows to the delta, it is clear that these requirements are much more difficult to meet under climate change conditions. Furthermore, the frequency of unmet flow requirements increases in 2070-2099. For instance, for the Freeport flows requirement, the frequency of unmet requirements increases by almost a factor of 2. Similar to the situation for wetlands, the Water for Food scenario is more problematic for each of the instream flow requirements.
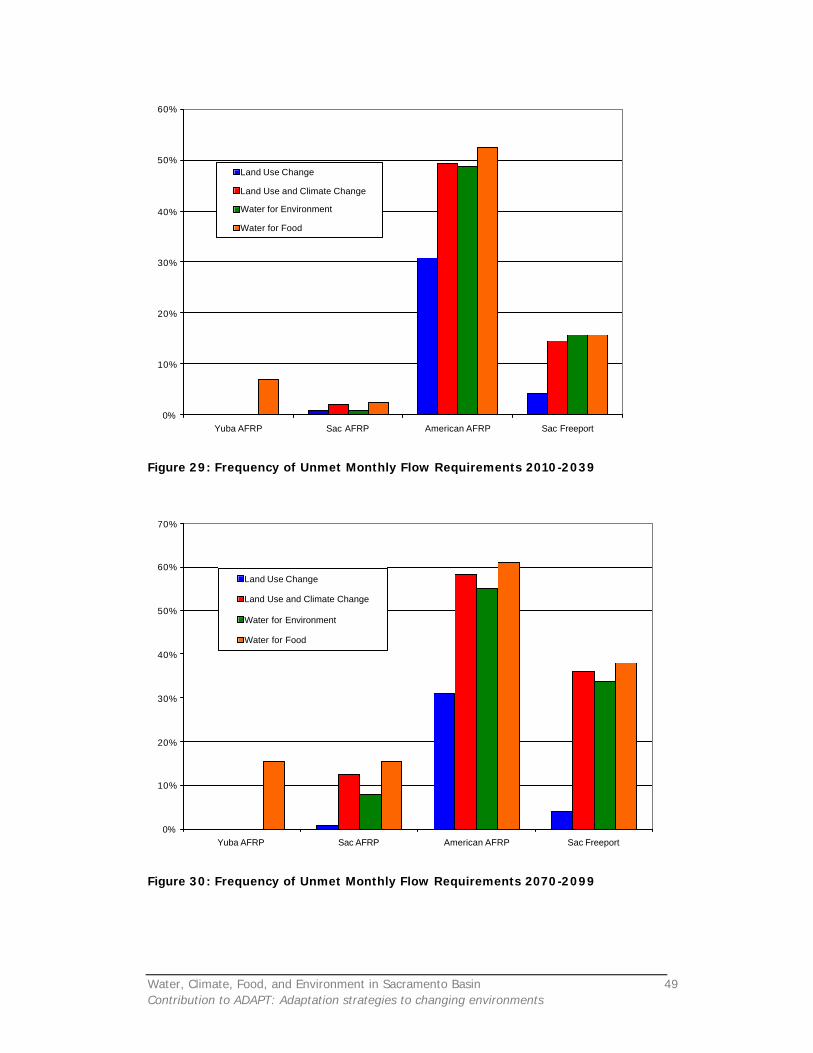
Water, Climate, Food, and Environment in Sacramento Basin 49 Contribution to ADAPT: Adaptation strategies to changing environments
0%
10%
20%
30%
40%
50%
60%
Yuba AFRP Sac AFRP American AFRP Sac Freeport
Land Use Change
Land Use and Climate Change
Water for Environment
Water for Food
Figure 29: Frequency of Unmet Monthly Flow Requirements 2010-2039
0%
10%
20%
30%
40%
50%
60%
70%
Yuba AFRP Sac AFRP American AFRP Sac Freeport
Land Use Change
Land Use and Climate Change
Water for Environment
Water for Food
Figure 30: Frequency of Unmet Monthly Flow Requirements 2070-2099
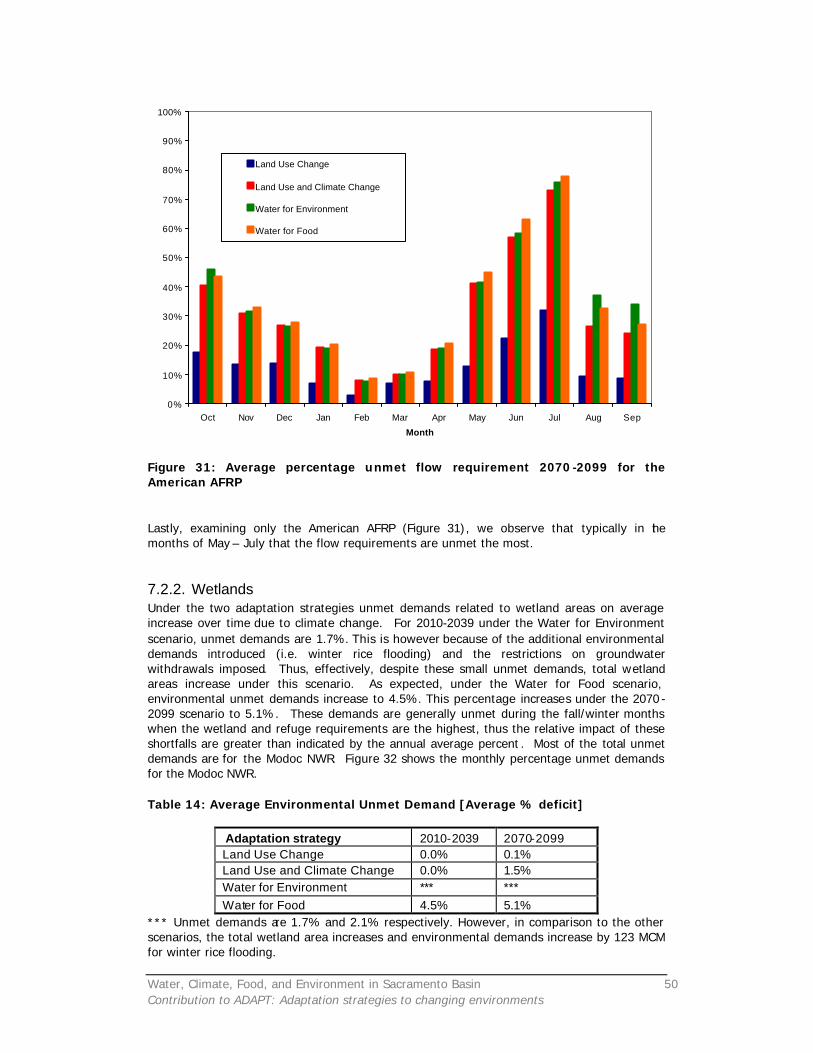
Water, Climate, Food, and Environment in Sacramento Basin 50 Contribution to ADAPT: Adaptation strategies to changing environments
0%
10%
20%
30%
40%
50%
60%
70%
80%
90%
100%
Oct Nov Dec Jan Feb Mar Apr May Jun Jul Aug Sep
Month
Land Use Change
Land Use and Climate Change
Water for Environment
Water for Food
Figure 31: Average percentage unmet flow requirement 2070 -2099 for the American AFRP Lastly, examining only the American AFRP (Figure 31), we observe that typically in the months of May – July that the flow requirements are unmet the most.
7.2.2. Wetlands Under the two adaptation strategies unmet demands related to wetland areas on average increase over time due to climate change. For 2010-2039 under the Water for Environment scenario, unmet demands are 1.7%. This is however because of the additional environmental demands introduced (i.e. winter rice flooding) and the restrictions on groundwater withdrawals imposed. Thus, effectively, despite these small unmet demands, total wetland areas increase under this scenario. As expected, under the Water for Food scenario, environmental unmet demands increase to 4.5%. This percentage increases under the 2070 -2099 scenario to 5.1%. These demands are generally unmet during the fall/winter months when the wetland and refuge requirements are the highest, thus the relative impact of these shortfalls are greater than indicated by the annual average percent . Most of the total unmet demands are for the Modoc NWR. Figure 32 shows the monthly percentage unmet demands for the Modoc NWR. Table 14: Average Environmental Unmet Demand [Average % deficit]
Adaptation strategy 2010-2039 2070-2099 Land Use Change 0.0% 0.1% Land Use and Climate Change 0.0% 1.5% Water for Environment *** *** Water for Food 4.5% 5.1%
*** Unmet demands are 1.7% and 2.1% respectively. However, in comparison to the other scenarios, the total wetland area increases and environmental demands increase by 123 MCM for winter rice flooding.
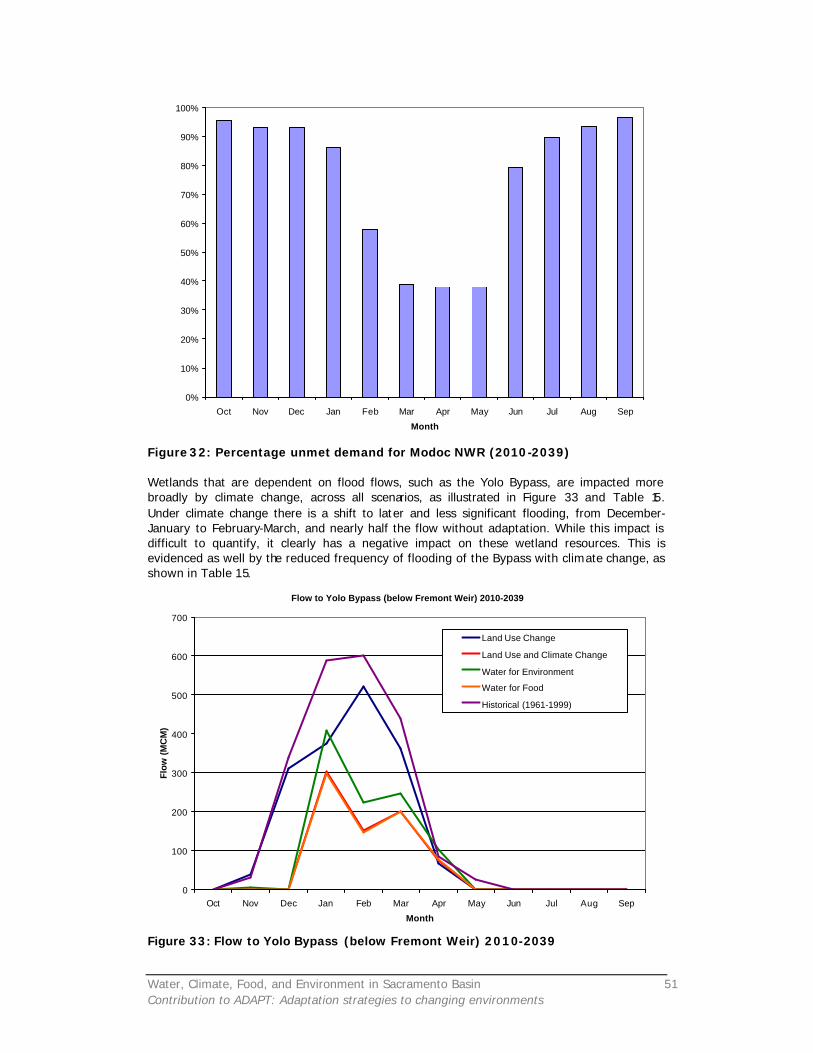
Water, Climate, Food, and Environment in Sacramento Basin 51 Contribution to ADAPT: Adaptation strategies to changing environments
0%
10%
20%
30%
40%
50%
60%
70%
80%
90%
100%
Oct Nov Dec Jan Feb Mar Apr May Jun Jul Aug Sep
Month
Figure 32: Percentage unmet demand for Modoc NWR (2010-2039) Wetlands that are dependent on flood flows, such as the Yolo Bypass, are impacted more broadly by climate change, across all scenarios, as illustrated in Figure 33 and Table 15. Under climate change there is a shift to later and less significant flooding, from December-January to February-March, and nearly half the flow without adaptation. While this impact is difficult to quantify, it clearly has a negative impact on these wetland resources. This is evidenced as well by the reduced frequency of flooding of the Bypass with climate change, as shown in Table 15.
Flow to Yolo Bypass (below Fremont Weir) 2010-2039
0
100
200
300
400
500
600
700
Oct Nov Dec Jan Feb Mar Apr May Jun Jul Aug Sep
Month
Flow
(M
CM
)
Land Use Change
Land Use and Climate Change
Water for Environment
Water for Food
Historical (1961-1999)
Figure 33: Flow to Yolo Bypass (below Fremont Weir) 2010-2039
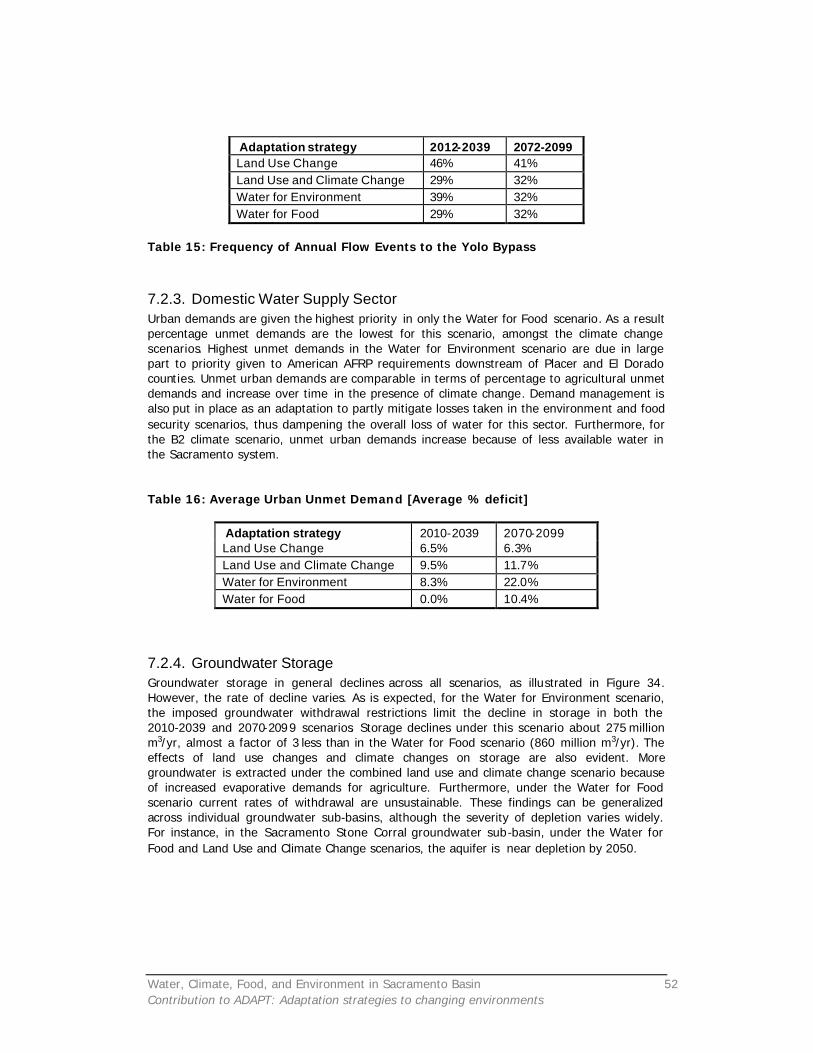
Water, Climate, Food, and Environment in Sacramento Basin 52 Contribution to ADAPT: Adaptation strategies to changing environments
Adaptation strategy 2012-2039 2072-2099 Land Use Change 46% 41% Land Use and Climate Change 29% 32% Water for Environment 39% 32% Water for Food 29% 32%
Table 15: Frequency of Annual Flow Events to the Yolo Bypass
7.2.3. Domestic Water Supply Sector Urban demands are given the highest priority in only the Water for Food scenario. As a result percentage unmet demands are the lowest for this scenario, amongst the climate change scenarios. Highest unmet demands in the Water for Environment scenario are due in large part to priority given to American AFRP requirements downstream of Placer and El Dorado counties. Unmet urban demands are comparable in terms of percentage to agricultural unmet demands and increase over time in the presence of climate change. Demand management is also put in place as an adaptation to partly mitigate losses taken in the environment and food security scenarios, thus dampening the overall loss of water for this sector. Furthermore, for the B2 climate scenario, unmet urban demands increase because of less available water in the Sacramento system. Table 16: Average Urban Unmet Demand [Average % deficit]
Adaptation strategy 2010-2039 2070-2099 Land Use Change 6.5% 6.3% Land Use and Climate Change 9.5% 11.7% Water for Environment 8.3% 22.0% Water for Food 0.0% 10.4%
7.2.4. Groundwater Storage Groundwater storage in general declines across all scenarios, as illustrated in Figure 34. However, the rate of decline varies. As is expected, for the Water for Environment scenario, the imposed groundwater withdrawal restrictions limit the decline in storage in both the 2010-2039 and 2070-2099 scenarios. Storage declines under this scenario about 275 million m3/yr, almost a factor of 3 less than in the Water for Food scenario (860 million m3/yr). The effects of land use changes and climate changes on storage are also evident. More groundwater is extracted under the combined land use and climate change scenario because of increased evaporative demands for agriculture. Furthermore, under the Water for Food scenario current rates of withdrawal are unsustainable. These findings can be generalized across individual groundwater sub-basins, although the severity of depletion varies widely. For instance, in the Sacramento Stone Corral groundwater sub-basin, under the Water for Food and Land Use and Climate Change scenarios, the aquifer is near depletion by 2050.
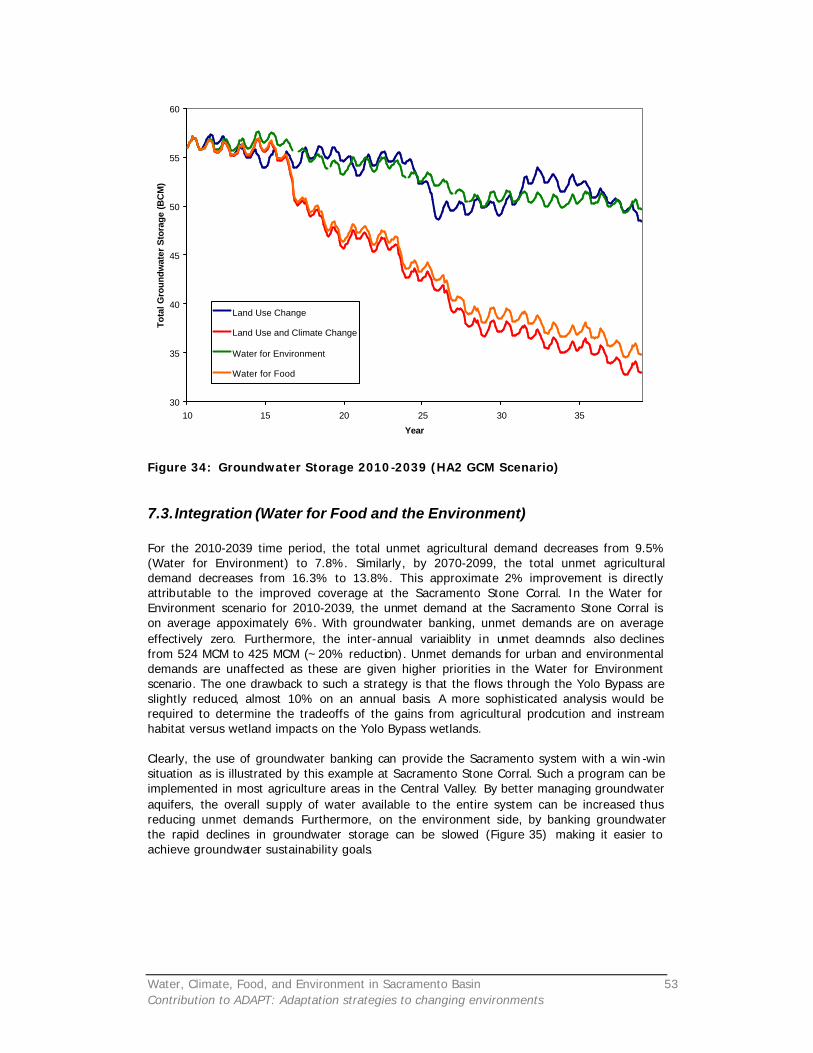
Water, Climate, Food, and Environment in Sacramento Basin 53 Contribution to ADAPT: Adaptation strategies to changing environments
30
35
40
45
50
55
60
10 15 20 25 30 35
Year
Tota
l Gro
undw
ater
Sto
rage
(B
CM
)
Land Use Change
Land Use and Climate Change
Water for Environment
Water for Food
Figure 34: Groundwater Storage 2010-2039 (HA2 GCM Scenario)
7.3. Integration (Water for Food and the Environment) For the 2010-2039 time period, the total unmet agricultural demand decreases from 9.5% (Water for Environment) to 7.8%. Similarly, by 2070-2099, the total unmet agricultural demand decreases from 16.3% to 13.8%. This approximate 2% improvement is directly attributable to the improved coverage at the Sacramento Stone Corral. In the Water for Environment scenario for 2010-2039, the unmet demand at the Sacramento Stone Corral is on average appoximately 6%. With groundwater banking, unmet demands are on average effectively zero. Furthermore, the inter-annual variaiblity in unmet deamnds also declines from 524 MCM to 425 MCM (~20% reduction). Unmet demands for urban and environmental demands are unaffected as these are given higher priorities in the Water for Environment scenario. The one drawback to such a strategy is that the flows through the Yolo Bypass are slightly reduced, almost 10% on an annual basis. A more sophisticated analysis would be required to determine the tradeoffs of the gains from agricultural prodcution and instream habitat versus wetland impacts on the Yolo Bypass wetlands. Clearly, the use of groundwater banking can provide the Sacramento system with a win -win situation as is illustrated by this example at Sacramento Stone Corral. Such a program can be implemented in most agriculture areas in the Central Valley. By better managing groundwater aquifers, the overall supply of water available to the entire system can be increased thus reducing unmet demands. Furthermore, on the environment side, by banking groundwater the rapid declines in groundwater storage can be slowed (Figure 35) making it easier to achieve groundwater sustainability goals.
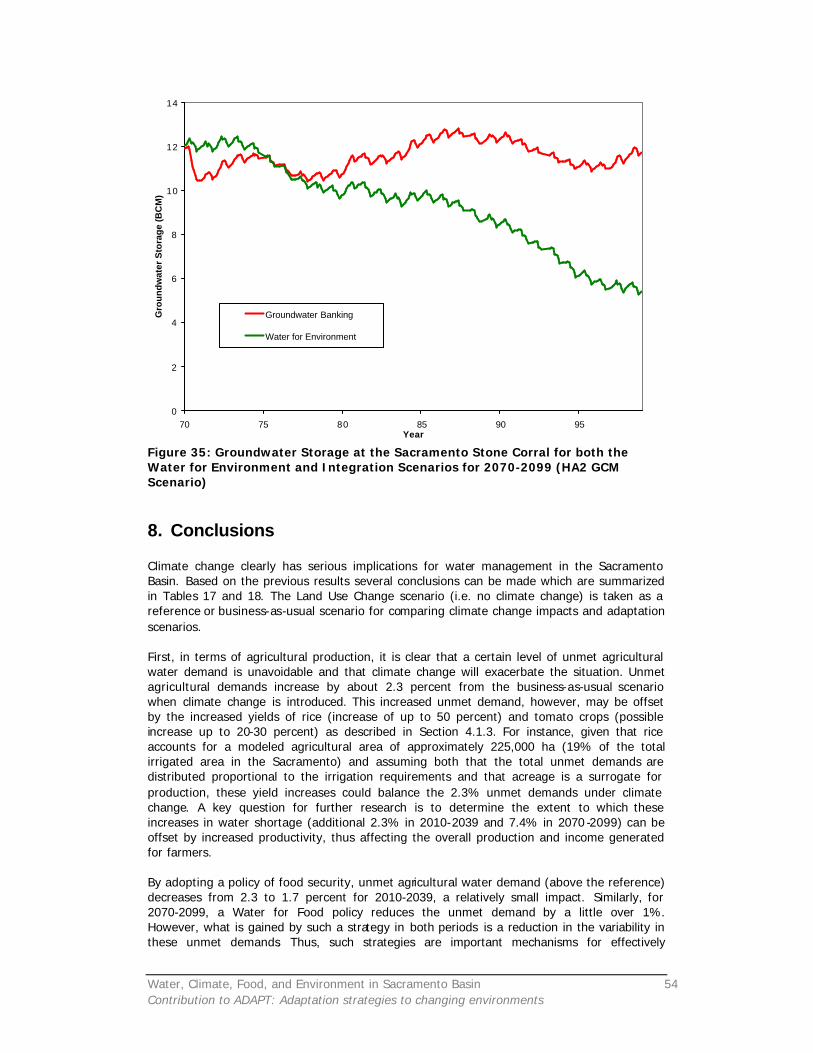
Water, Climate, Food, and Environment in Sacramento Basin 54 Contribution to ADAPT: Adaptation strategies to changing environments
0
2
4
6
8
10
12
14
70 75 80 85 90 95Year
Gro
un
dw
ater
Sto
rag
e (B
CM
)
Groundwater Banking
Water for Environment
Figure 35: Groundwater Storage at the Sacramento Stone Corral for both the Water for Environment and Integration Scenarios for 2070-2099 (HA2 GCM Scenario)
8. Conclusions Climate change clearly has serious implications for water management in the Sacramento Basin. Based on the previous results several conclusions can be made which are summarized in Tables 17 and 18. The Land Use Change scenario (i.e. no climate change) is taken as a reference or business-as-usual scenario for comparing climate change impacts and adaptation scenarios. First, in terms of agricultural production, it is clear that a certain level of unmet agricultural water demand is unavoidable and that climate change will exacerbate the situation. Unmet agricultural demands increase by about 2.3 percent from the business-as-usual scenario when climate change is introduced. This increased unmet demand, however, may be offset by the increased yields of rice (increase of up to 50 percent) and tomato crops (possible increase up to 20-30 percent) as described in Section 4.1.3. For instance, given that rice accounts for a modeled agricultural area of approximately 225,000 ha (19% of the total irrigated area in the Sacramento) and assuming both that the total unmet demands are distributed proportional to the irrigation requirements and that acreage is a surrogate for production, these yield increases could balance the 2.3% unmet demands under climate change. A key question for further research is to determine the extent to which these increases in water shortage (additional 2.3% in 2010-2039 and 7.4% in 2070 -2099) can be offset by increased productivity, thus affecting the overall production and income generated for farmers. By adopting a policy of food security, unmet agricultural water demand (above the reference) decreases from 2.3 to 1.7 percent for 2010-2039, a relatively small impact. Similarly, for 2070-2099, a Water for Food policy reduces the unmet demand by a little over 1%. However, what is gained by such a strategy in both periods is a reduction in the variability in these unmet demands. Thus, such strategies are important mechanisms for effectively
Water, Climate, Food, and Environment in Sacramento Basin 55 Contribution to ADAPT: Adaptation strategies to changing environments
reducing the inter-annual risk farmers bear in terms of agricultural production. Furthermore, in both time periods, these increases in unmet demands can be offset by the use of groundwater banking, as illustrated in the integration (water for food and the environment) scenario. For the Sacramento Stone Corral, for instance, on average with groundwater banking all demands are met. One possible adaptation scenario that was not considered here is the reduction in total agricultural area by switching from low to higher value crops. Clearly such a policy initiative in addition to those described here would make an appreciable difference. Also, there is a ticking time -bomb in the overall water use – in the business-as-usual and Water for Food scenarios, groundwater is being unsustainably mined, and even calls into question whether agriculture would continue to be profitable given the possible pumping costs associated with this mining. Groundwater banking provides a solution to this critical issue while also improving the availability of supplies during dry season events. This issue could be further explored in Phase II of this project. For the environment, it is clear that certain flow requirements related to aquatic ecosystem health (AFRPs) will consistently be difficult to meet (e.g. American River AFRP), while others are relatively easily met (e.g. Feather River AFRP). Strategies that prioritize these flow requirements result in a marginal improvement compared to strategies that prioritize municipal and agricultural demands. It is also clear that with growing stresses on water availability, unless the environment is priorit ized, unmet demands for wetlands and refuges may be as much 5%. These levels of unmet demands may or may not be acceptable depending both on the timing of the deficits (e.g. during critical spawning periods) and on the social value assigned to these ecosystems. By adopting a Water for Environment strategy or Integrated strategy, wetland areas can be increased. Under these scenarios, only approximately 2% of these increased demands are unmet. Similar to the story with agriculture, the business-as-usual scenario will result in about 6% unmet urban demand. As was discussed earlier, this is primarily due to counties that draw municipal water from the American River upstream of higher priority flow requirements. Whether or not the flow requirement would be prioritized over municipal demands in the future is unknown, but poses an interesting tradeoff question. Unmet urban demands are, in general, higher when the environment is prioritized and lower when food security is prioritized (it is assumed that urban demands would always be satisfied before agriculture, although subject to demand management policies) . For instance, by 2070 -2099, unmet demands are estimated to increase by 5% above the business-as-usual case in the presence of climate change. By adopting a Water for Food strategy, unmet urban demands only increase by 4%. But by adopting a Water for Environment strategy, unmet demands increase by 12%. Lastly, as discussed above, groundwater storage declines as the aquifers are pumped at a rate greater than that can be renewed annually without some intervention. For example, by imposing constraints on the maximum amounts that can be withdrawn from the aquifers in the Water for Environment scenario, the rate of decline is significantly slowed. In the Integrated scenario, groundwater banking can further slow, if not eliminate the rate of decline. These results are summarized in Tables 17 and 18 below.
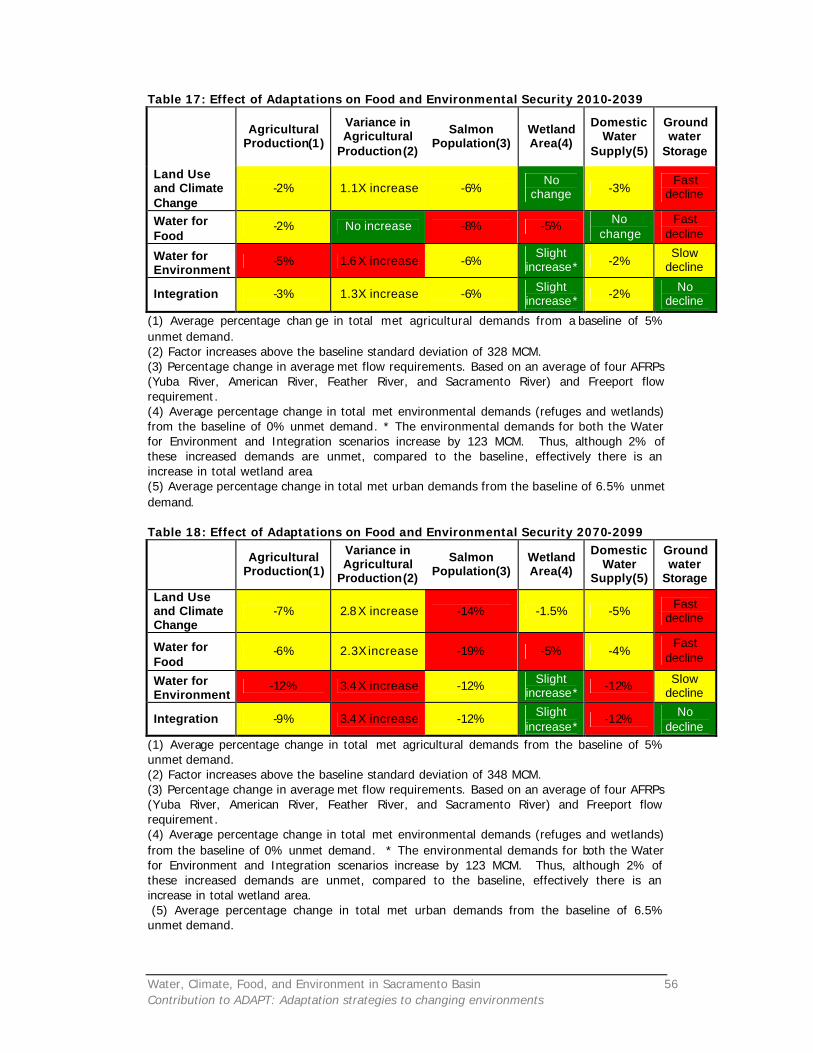
Water, Climate, Food, and Environment in Sacramento Basin 56 Contribution to ADAPT: Adaptation strategies to changing environments
Table 17: Effect of Adaptations on Food and Environmental Security 2010-2039
Agricultural Production(1)
Variance in Agricultural
Production(2)
Salmon Population(3)
Wetland Area(4)
Domestic Water
Supply(5)
Ground water
Storage
Land Use and Climate Change
-2% 1.1X increase -6% No
change -3% Fast
decline
Water for Food
-2% No increase -8% -5% No change
Fast decline
Water for Environment
-5% 1.6X increase -6% Slight
increase* -2% Slow
decline
Integration -3% 1.3X increase -6% Slight increase* -2% No
decline
(1) Average percentage chan ge in total met agricultural demands from a baseline of 5% unmet demand. (2) Factor increases above the baseline standard deviation of 328 MCM. (3) Percentage change in average met flow requirements. Based on an average of four AFRPs (Yuba River, American River, Feather River, and Sacramento River) and Freeport flow requirement. (4) Average percentage change in total met environmental demands (refuges and wetlands) from the baseline of 0% unmet demand. * The environmental demands for both the Water for Environment and Integration scenarios increase by 123 MCM. Thus, although 2% of these increased demands are unmet, compared to the baseline, effectively there is an increase in total wetland area. (5) Average percentage change in total met urban demands from the baseline of 6.5% unmet demand. Table 18: Effect of Adaptations on Food and Environmental Security 2070-2099
Agricultural Production(1)
Variance in Agricultural
Production(2)
Salmon Population(3)
Wetland Area(4)
Domestic Water
Supply(5)
Ground water
Storage
Land Use and Climate Change
-7% 2.8X increase -14% -1.5% -5% Fast decline
Water for Food
-6% 2.3X increase -19% -5% -4% Fast
decline
Water for Environment
-12% 3.4X increase -12% Slight increase* -12% Slow
decline
Integration -9% 3.4X increase -12% Slight increase*
-12% No decline
(1) Average percentage change in total met agricultural demands from the baseline of 5% unmet demand. (2) Factor increases above the baseline standard deviation of 348 MCM. (3) Percentage change in average met flow requirements. Based on an average of four AFRPs (Yuba River, American River, Feather River, and Sacramento River) and Freeport flow requirement. (4) Average percentage change in total met environmental demands (refuges and wetlands) from the baseline of 0% unmet demand. * The environmental demands for both the Water for Environment and Integration scenarios increase by 123 MCM. Thus, although 2% of these increased demands are unmet, compared to the baseline, effectively there is an increase in total wetland area. (5) Average percentage change in total met urban demands from the baseline of 6.5% unmet demand.
Water, Climate, Food, and Environment in Sacramento Basin 57 Contribution to ADAPT: Adaptation strategies to changing environments
The adaptations strategies explored here generally involve making tradeoffs between food and environmental security, as is highlighted by the tables above. Under Water for Food, agricultural security improves at the cost of the environment. Similarly, under Water for Environment, shifting water to the environment entails some shift of water out of agriculture. Moreover, the situation worsens in 2070-2099 as climate change effects become more pronounced. Mitigations of these tradeoffs come into play through the enhancement of productivity of cro ps due to increased carbon, finding non-water consuming activities to support the economy of the region, and implementation of integration win -win strategies such as groundwater banking.
References
Aerts, J. and P. Droogers. 2002. ADAPT Water, Climate, Food and Environment under Climate Change. http://www.geo.vu.nl/users/ivmadapt
Aerts, J. Droogers, P, Huber-Lee, A. Lasage, R. 2003. An Adaptation Framework for River Basins. IVM research reports (in preparation)
Anonymous. 2000. Sri Lanka recapturing missed opportunities. Document of the World Bank. Report No.: 20430-CE.
Cole, D.C., Eyles, J., Gibson, B.L. (1998). Indicators of human health in ecosystems : what do we measure? The science of the total environment.
Doorenbos, J., and A.H. Kassam, 1979. Yield response to water. FAO irrigation and drainage paper 33. Rome, Italy.
Droogers, P. 2000. Estimating actual evapotranspiration using a detailed agro-hydrological model. J. of Hydrology 229: 50 -58.
Droogers, P. 2002. Global high -resolution map of soil hydraulic characteristics. IWMI Working Paper (in preparation).
Droogers, P. and J. Aerts. 2002. ADAPT, Water, Climate, Food and Environment: Adapting Strategies for River Basins under Changing Environments. Project Proposal v. April 4, 2002.
Esrey, S.A., and J.P. Habicht. 1986. Epidemiological evidence for health benefits from improved water and sanitation in developing countries. Epidemiological Reviews 8: 117 -128.
FAO. 2002. Digital soil map of the world and derived soil properties on CD -ROM. http://www.fao.org/ag/agl/agll/dsmw.htm.
Gleick, P.H. 2000. The world’s water 2000 -2001. Island Press.
GTOPO30. 2002. Global digital elevation model. http://edcdaac.usgs.gov/gt opo30/gtopo30.html
Gutowski, W. J., Pan, Z., C. J. Anderson, R. W. Arritt, F. Otieno, E. S. Takle, J. H. Christensen, and O. B. Christensen, 2000. What RCM Data Are Available for California Impacts Modeling? California Energy Commission Workshop on Climat e Change
Water, Climate, Food, and Environment in Sacramento Basin 58 Contribution to ADAPT: Adaptation strategies to changing environments
Scenarios for California, California Energy Commission, Sacramento, California, 12 - 13 June 2000.
Hemakumara, M., R. Barker and P. Droogers. 2001. Ruhuna Benchmark Basin Activities. IWMI Working Paper 27
HYDRO1k. 2002. Elevation Derivative Database. http://edcdaac.usgs.gov/gtopo30/hydro/
Imbulana, K.A.U.S. 2002. World Water Assessment Programma, Case study in Ruhuna Basins, Sri Lanka. Ministry of Irrigation and Water Resources / International Water Management Institute.
IPCC-WG-I, 2001. Climate Change 2001. The Scientific Basis. Contribution of Working Group I to the Third Assessment Report of the Intergovernmental Panel on Climate Change. http://www.grida.no/climate/ipcc_tar/wg1/index.htm.
Landis, J.D. and M. Reilly. 2003. “How We Will Grow: Baseline Projections Of California’s Urban Footprint Through The Year 2100.” Unpublished paper from the author.
OECD (Organization for economic Cooperation and Development). OECD Core set of indicators for environmental performance reviews. Paris. 1994
Purkey, D, et al. Feasibility Study of a Maximal Program of Groundwater Banking, Natural Heritage Institute Report, December 1998. http://www.n-h-i.org/Publications/Pubs_pdf/Conj_use.pdf
Revenga, C., J. Brunner, N. Henninger, K. Kassem, and R. Payne. 2000. Pilot analysis of global ecosystems: Freshwater systems. World Resources Institute.
Semenov M.A. & Barrow E.M. (1997). Use of a stochastic weather generator in the development of climate change scenarios. Climatic Change 35 :397-414
Semenov M.A., Brooks R.J., Barrow E.M. & Richardson C.W (1998) Comparison of the WGEN and LARS-WG stochastic weather generators in diverse climates. Climate Research 10:95 -107.
Semenov, M.A. 2002. LARS-WG stochastic weather generator. http://www.iacr.bbsrc.ac.uk/mas-models/larswg.html
Stanzel, P., A. Öze, V. Smakhtin, E. Boelee, and P. Droogers. 2002. Simulating impacts of irrigation on the hydrology of the Karagan Lagoon in Sri Lanka. IWMI Working Paper 44.
UNFPA. 2002. The state of the world population in 2001. United Nations Population Fund. http://www.unfpa.org/swp/2001/english/indicators/indicators2.html
Van Dam, J.C., J. Huygen, J.G. Wesseling, R.A. Feddes, P. Kabat, P.E.V. VanWalsum, P. Groenendijk, and C.A. van Diepen, 1997. Theory of SWAP version 2.0. Wageningen Agricultural University and DLO Winand Staring Centre. Technical Document 45.
Van Diepen, C.A., J. Wolf, H. Van Keulen, and C. Rappoldt, 1989. WOFOST: a simulation model of crop production. Soil Use and Management 5: 16-25.
WEAP. 2002. Water Evaluation and Planning System. http://www.seib.org/weap
Water, Climate, Food, and Environment in Sacramento Basin 59 Contribution to ADAPT: Adaptation strategies to changing environments
Wösten, J.H.M., Lilly, A., Nemes, A., Le Bas, C., 1998. Using existing soil data to derive hydraulic parameters for simulation models in environmental studies and in land use planning. Report 156. DLO Winand Staring Centre, Netherlands.
WWAP, 2002. World Water Assessment Programme. http://www.unesco.org/water/wwap/