Embed Size (px)
Citation preview

Wastewater Treatment in Kathmandu, Nepal
by
Hillary Green,
Saik-Choon Poh
and
Amanda Richards
Submitted to the Department of Civil and Environmental Engineering in Partial Fulfillment of the Requirements for the Degree of
Master of Engineering
in Civil and Environmental Engineering
at the
Massachusetts Institute of Technology June, 2003
©2003 Hillary Green, Saik-Choon Poh and Amanda Richards
All rights reserved.
The author hereby grants to MIT permission to reproduce and to distribute publicly paper and electronic copies of this thesis document in whole and in part.

Table of Contents
Table of Contents ....................................................................................................................... 2 List of Figures ............................................................................................................................. 3 List of Tables............................................................................................................................... 4 1 Introduction ......................................................................................................................... 5
1.1 Motivation....................................................................................................................... 5 1.2 Existing Wastewater Treatment in Kathmandu .............................................................. 5
2 Waste Stream and Bagmati River Characteristics ..................................................... 8 2.1 Overall............................................................................................................................. 8 2.2 Contributions of Carpet Industry .................................................................................... 8 2.3 Contributions of Detergent Use .................................................................................... 11
3 Treatment Systems........................................................................................................... 14 3.1 Activated Sludge Treatment Process ............................................................................ 14 3.2 Constructed Wetlands as an Alternative Technology in Nepal .................................... 16 3.3 Treatment Efficiency of Dhulikhel Hospital’s Constructed System............................. 17 3.4 Alternative Treatment Options ..................................................................................... 21
3.4.1 Chemically Enhanced Primary Treatment (CEPT)............................................... 21 3.4.2 Advanced Integrated Pond System (AIPS)........................................................... 22
References.................................................................................................................................. 24

3
List of Figures
Figure 1: Map of Wastewater Treatment Plants in Kathmandu Valley (ADB, 2000).................... 6
Figure 2: COD levels in 1% liquid dye solutions ......................................................................... 10
Figure 3: COD levels in 25mg/L dry dye solutions...................................................................... 11
Figure 4: Guheshwori Wastewater Treatment Plant..................................................................... 13
Figure 5: Concentration reduction of Dhulikhel Hospital Constructed Wetland System at
Different Time Interval ......................................................................................................... 18
Figure 6: Sludge Affected Areas in the Wetland System ............................................................. 18
Figure 7: Ponding Effects on the Vertical Flow Bed (Left) and Horizontal Flow Bed (Right) at
Dhulikhel Hospital Due to Sludge Accumulation ................................................................ 19
Figure 8: Flowsheet For a Typical CEPT Plant (Bewley et al) .................................................... 21

4
List of Tables
Table 1: Operating Status of Wastewater Treatment Facilities in Kathmandu Valley (ABD, 2000
and Arata, 2003)...................................................................................................................... 7
Table 2: Water Quality Parameter of the Bagmati River at Sundarighat (ENPHO, 2003) ............ 8
Table 3: Chromium measurements at sampling sites along the Bagmati River ............................. 9
Table 4: Design and Performance Parameters for Guheshwori WWTP (BASP, 2002; Shah, 2002
and Darnal, 2002)...................................................................Error! Bookmark not defined.
Table 5: Summary Statistics of Inlet and Outlet Concentrations and Mean Removal Rates of
Dhulikhel Hospital Constructed Wetland System (1997 to 2000) (Shrestha, 2001) ............ 17
Table 6: Summary Results of Inlet and Outlet Concentrations and Mean Removal Rates of
Dhulikhel Hospital Constructed Wetland System (Jul 2002 to Jan 2003) (ENPHO)........... 19
Table 7:Comparison of Average Removal % for Dhulikhel Hospital Constructed Wetland
System................................................................................................................................... 20
Table 8: Minimum Level of Effluent Quality Attainable Through Application of Secondary or
Equivalent Treatment (EPA, 2003)....................................................................................... 20
Table 9: AIPS Cost Savings, as percentage of costs associated with other treatment systems
(Swanson, 2002) ................................................................................................................... 23

5
1 Introduction
1.1 Motivation
January 2003 marks the fourth straight year that a group of MIT students and staff have
traveled to Nepal to study pressing water quality concerns. In the past, student projects have
focused on improvements in drinking water quality, concentrating on household treatment
systems such as filtration and/or disinfection approaches, with special attention given to
microbial contamination and arsenic. While these projects are ongoing, three students from the
class of 2003 elected to form a group with a new water quality focus: wastewater treatment and
sanitation.
When it comes to basic sanitation, Nepal lags behind all the other nations of South Asia as
well as most other developing countries. It has been estimated that only 27% of the population
of Nepal has access to sanitation (Human Development Report, 2003), while the average is 44%
among developing countries worldwide (UNICEF, 2003). Nepal’s per capita gross domestic
product (GDP) is $240 US, and only 0.5% of this (annually $1.20 US per capita) is spent on
drinking water and sanitation (Human Development Report, 2003).
In urban areas like the cities within Kathmandu Valley (population 1.3 million) and
especially Kathmandu City (population 500,000), the lack of basic sanitation has been
devastating to the quality of local streams and rivers, namely the Bagmati and Bishnumati
Rivers. Methods of sanitation lacking in much of Kathmandu include adequate wastewater
collection and treatment, toilet facilities and solid waste collection and disposal. Agricultural
runoff and industrial discharge without pretreatment contribute to the detrimental effects on
water quality, not to mention public and environmental health.
1.2 Existing Wastewater Treatment in Kathmandu
Kathmandu Valley currently has five municipal wastewater treatment plants (WWTP): an
activated sludge plant at Guheshwori, non-aerated lagoons at Kodku and Dhobighat, and aerated
lagoons at Sallaghari and Hanumanghat. Of the five, the only wastewater treatment plant in
operation as of January 2003 is the activated sludge system at Guheshwori.

6
Figure 1: Map of Wastewater Treatment Plants in Kathmandu Valley (ADB, 2000)
The Kodku WWTP lies along the Bagmati River in the city of Patan (Figure 1). The
Kodku plant is a non-aerated lagoon facility with a design capacity of 1.1 MLD (ADB , 2000).
The 2000 ADB Report lists the plant’s status as “partially operational.” MIT Nepal Project team
member, Tetsuji Arata, observed in January 2003 that the performance of the facility was
doubtful, as effluent discharged into the Bagmati River “was bubbling” and smelled “just like
that of sewer water” (Arata, 2003).
The Dhobighat facility is positioned downstream from Kodku, in the southwest area of
Kathmandu Valley (Figure 1). Designed in 1978, the plant was built with a capacity of 15.4
MLD (ADB , 2000). Today, estimated sewage flow for the area exceeds 120 MLD (Darnal,
2002). In this plant, gravity-driven sewage flows to a sump well at Sundarighat (Figure 1),
where it is pumped to the plant at Dhobighat, consisting two non-aerated lagoons and one
Tribuhaven International Airport
KATHMANDU
PATAN THIMI
BHAKTAPUR
KIRTIPUR
Sallaghari WWTP
Hanumanghat WWTP
Guheshwori WWTP
Kodku WWTP
Map Legend
Other Rivers CITY NAME, Site Name
Major RoadsBagmati River
Hanumante River
N
Dhobighat WWTP
Sundarighat
WWTP Location Site Location

7
facultative pond. The pump station at Sundarighat, the pump main and the interceptors along the
Bagmati and Bishnumati Rivers are all broken in places, so untreated wastewater drains directly
into the Rivers (Darnal, 2002). As of January 2003, this plant was used as a pasture for cattle
(Arata, 2003).
Sallaghari and Hanumanghat WWTP’s both lie along the Hanumante River in Bhaktapur,
upstream from its junction with the Bagmati River near Kodku (Figure 1). These treatment
facilities were designed as aerated lagoons, with capacities of 2.0 and 0.5 MLD, respectively
(ADB, 2000). The 2000 ADB Report describes both plants as partially operating and in need of
rehabilitation.
Tetsuji Arata observes in January 2003 that the aeration systems from both the Sallaghari
and Hanumanghat facilities were removed and sold. He describes that the Sallaghari plant
originally had two collection mains: a northern main with a pump feed, and a southern one using
gravity feed. Since the shutdown of the plant, local farmers have removed the pump from the
northern main and plugged the southern main so that inflowing, untreated wastewater could be
used for irrigation purposes. Also, the Hanumanghat site is used as a crop field (Arata, 2003).
In addition to the collection systems noted above, Kathmandu Valley contains 43,000 septic
tanks. Eight collection vehicles with a capacity of 1.5 m3/vehicle service the tanks, and the
septage is treated using low-energy treatment systems. Upwards of 35 truckloads of sewage a
day should be collected, but “septic tank cleaning is generally performed too infrequently”
(ADB, 2000). One such low-energy treatment method gaining popularity in Kathmandu and
elsewhere is the constructed wetland system, a treatment facility designed to mimic and optimize
the natural removal processes of natural wetlands.
Table 1: Operating Status of Wastewater Treatment Facilities in Kathmandu Valley (ABD, 2000 and Arata, 2003)
Reported Capacity Status Plant MLD ADB Report, Feb 2000 MIT Nepal Team, Jan 2003
Guheshwori 17.3 Under Construction Operating Hanumanghat 0.5 Partially Operating Not Operating Sallaghari 2 Partially Operating Not Operating Kodku 1.1 Partially Operating Partially Operating Dhobighat 15.4 Not Operating Not Operating

8
2 Waste Stream and Bagmati River Characteristics
2.1 Overall
The Bagmati River originates upstream from Kathmandu and flows as the largest and most
culturally significant river through the Valley. Upstream from Kathmandu Valley, the overall
water quality is very good, but this deteriorates quickly as the river reaches the urban areas
within the Valley. Table 2 presents typical water quality data of the Bagmati River at
Sundarighat, a very heavily populated section of Kathmandu.
Table 2: Water Quality Parameter of the Bagmati River at Sundarighat (ENPHO, 2003)
May, 2002 August, 2002 October, 2002 December, 2002pH 7.0 7.3 6.7 6.5 Turbidity (NTU) 100 >100 75 180 TSS (mg/L) 166 304 92 144 BOD (mg/L) 240 54 50 109 COD (mg/L) 317 110 181 255 TDS (mg/L) 260 120 230 360 DO (mg/L) 0.7 6.4 0.4 1.9
NO3-N (mg/L) 0.6 3.4 0.6 >10
NH4-N (mg/L) 18 4 18 20
PO4-P (mg/L) 1.7 0.3 1.3 1 Fecal Coliform (per 100 mL) 230 x 104 2 x 10⁴ 5.6 x 10⁴ 1.8 x 10⁴
Values are listed for each parameter during the dry season (May), the monsoon season
(August), the post-monsoon season (October) and winter (December) of 2002.
2.2 Contributions of Carpet Industry
Domestic sources contribute the majority of pollution to the Bagmati River and therefore
receive the most attention. Industrial waste is often overlooked but can lead to significant
pollution problems. Currently, apart from tourism, the largest industry in Nepal is the carpet
manufacturing industry, which has grown immensely in the past ten years. The process of carpet
manufacturing involves several steps, but those that are potentially the most damaging to the
environment are the carpet dyeing and carpet washing steps. The chemicals used in carpet

9
washing can be harmful to the environment and, as influent to wastewater treatment plants, may
contribute to foaming problems. This study, however, focuses solely on the carpet dyeing aspect
of the industrial waste stream of Kathmandu.
Carpet dyes can either be natural or synthetic. Synthetic dyes are used on a much wider
basis because of their relative ease of use and their relatively low cost. Synthetic dyes, however
can be detrimental to the environment. Not only do synthetic dyes released into surface waters
such as the Bagmati add an aesthetically displeasing color to the water, effluent from the dyeing
process contains chromium and can increase the COD of the water its released to.
Samples were collected from sites along the Bagmati and measured for total chromium content.
The results are shown in Table 3 below.
Table 3: Chromium measurements at sampling sites along the Bagmati River
Sampling Site (from upstream to downstream)
Total Chromium (mg/L)
Sundarijal <0.01 Jorpati <0.01 Guheshwori <0.01 Pashupati 0.01 Tilganga 0.03 Sundarghat 0.02 Chovar 0.03
Though most of Kathmandu Valley’s dyeing companies are reportedly located near
Jorpati, the only dyeing effluent outlets noticed while the authors traversed the river were located
at Tilganga. This could possibly be the reason for the relatively high amount of chromium at
Tilganga.
Mount Everest Dyeing Company of Jorpati, Kathmandu was generous enough to provide
the authors nine samples of their dyes. These samples included four samples of dry powder dyes
in various colors, four samples of the powdered dyes mixed with acetic acid, here referred to as
liquid dyes, and a sample of the acetic acid that is mixed with the powder dyes to make the liquid
dyes. In an effort to test the hypothesis proposed by some colleagues in Nepal that synthetic
dyes increase COD, each dye was tested for its COD. The COD of the acetic acid was also
measured to determine the effect of liquid dyes relative to both powder dyes and the acetic acid
that they are added to. Solutions of either 1 % liquid dye or 1 % acetic acid were prepared using

10
distilled, tap, and Charles River (Boston, Massachusetts) water for different trials. The results of
the COD measurements are provided in Figure 2, except for the acetic acid results.
C O D o f L iq u id D ye S o lu tio n s S olu tions are 1 .0% L iqu id D ye
0
5
10
15
20
25
30
35
40
D is tilled W ater S o lu tions Tap W ate r S o lu tions R iver W ate r S o lu tions
Type o f W ater In S o lu tion
CO
D (m
g/L) W ater A lone
R ed L iq D ye S o lnYe llow L iq D ye S o lnB lue L iq D ye S o lnB lack L iq D ye S o ln
Figure 2: COD levels in 1% liquid dye solutions
The acetic acid COD concentration results are not provided because the acetic acid COD
was greater than 1500 mg/L, the maximum detection limit for the apparatus used. Solutions of
25 mg/L dry dye were also prepared and their COD in Charles River water was measured. The
results of this test are shown in Figure 3.

11
COD in Dry Dye-Charles River Water Solutions (25mg/L dry dye)
0
10
20
30
40
50
60
River Water Red PowderSolution
Indigo PowderSolution
Navy PowderSolution
Black PowderSolution
Solution Name
CO
D (m
g/L)
Run 1Run 2
Figure 3: COD levels in 25mg/L dry dye solutions
Like the liquid dyes, the dry dyes only slightly increase the COD of water (the red dry dye
actually slightly decreases the COD). It is uncertain why acetic acid would exhibit such a high
COD but dry dye mixed with a substantial amount of acetic acid would not. It may be due to a
chemical interaction between the acid and dye. Whatever the reason, it appears from these
results that the acid used in dyeing, and not the dye itself, causes an increase in COD. Acetic
acid may be a significant contributor to the high COD levels seen at Sundarighat.
2.3 Contributions of Detergent Use
As discussed earlier, only 27% of Nepali citizens have access to basic sanitation (Human
Development Report, 2003). One can imagine the devastating effects such a situation has on the
quality of surface waters flowing through urban areas like Kathamandu. Those without other
resources rely on local surface water, namely the Bagmati and Bishnumati Rivers, for bathing,
washing clothes and food, and even as a public toilet. These major rivers have become sewage

12
discharge sites for municipal wastewater and industrial dumping grounds for local businesses
with no other means of disposal.
Not only are the rivers polluted by human waste; they also serve as receiving waters for
foods, health and beauty products and cleaning agents. Consumer products and medicines are
becoming ever-increasingly sophisticated and complex in chemical structure, and many
constituents of these products are not easily degraded even under optimal water quality
conditions. These chemicals retain the properties that make them so useful in consumer products
and have the potential to behave in the environment in ways we never intended.
Anionic surfactants, for example, are used widely in products ranging from shampoos to
soap and detergents to household cleaners. While even high levels of anionic surfactant are non-
toxic, their presence above a certain threshold results in stable foam on water surfaces. In a
survey of 18 laundry detergents popular in Kathmandu households, the average detergent
contains 6.6 weight percent anionic surfactants and 0.04 weight percent orthophosphates. Of the
total anionic surfactants, 8% is recalcitrant under aerobic conditions. In the Bagmati and
Bishnumati Rivers, where dissolved oxygen levels fall below aerobic limits at times, the anionic
surfactants are expected to be much less labile.
Using the manufacturers’ recommendations on the detergent labels, a typical load of
wash water is approximately 25 g (1 handful) detergent in 4 L (half bucket) of water. From the
anionic surfactant levels reported above, characteristic wash water for one load of laundry
contains 6.25 g detergent/L, 413 mg total anionic surfactant/L and 32 mg recalcitrant or “hard”
anionic surfactant/L.
The minimum concentration at which anionic surfactants foam depends on both the
solvent and the level of pollution. For example, in distilled water, the foaming limit is 5 mg
ABS/L. In typical wastewaters, surfactant foaming ceases at levels below 0.5 mg/L.
Kathmandu City has a population of approximately 500,000 residents (Finlay, 2001). The
average family size in Nepal is 6 people, so Kathmandu City is home to approximately 83,000
families. If one load of laundry is washed per family every week, using 4 L water for a load of
laundry, 333 m3 wash water is generated every week in Kathmandu City, or 5x10⁻⁴ m3/s (0.011
MGD).
Flow rates in the Bagmati River are annually at their lowest during the dry season (March
to May). At Sundarighat, for example, the River flowed at a rate of less than 1 m3/s (22.6 MGD)

13
during April 1999 (ADB, 2000). If the worst-case scenario is assumed, such that all of the
wastewater generated by laundry washing is discharged into the Bagmati River, the wash water
is diluted by a factor of about 2000. In such as case, the resulting total anionic surfactant
concentration in the Bagmati River is about 0.2 mg/L, and the hard concentration 0.016 mg/L,
both below the limit of foaming.
For total anionic surfactant levels in the River to reach 0.5 mg/L, each family unit would
have to wash 2.5 loads of laundry per week during the dry season. The 2000 ADB Report
estimates that residents of Kathmandu City use 25 L water/day-person (1,050 L water/week-
family). It is entirely possible, then, that families would sacrifice 10 L/week for 2.5 loads of
laundry/week.
Using this same analysis, one can estimate the contribution of household detergent use to
foaming problems at the Guheshwori WWTP. The Guheshwori treatment plant was designed in
1996 to serve a population of 58,000 and has a treatment capacity of 0.19 m3/s (4.3 MGD)
(Figure 4).
Figure 4: Guheshwori Wastewater Treatment Plant
Once the wastewater is aerated and labile surfactants degrade, 0.08 mg/L ABS remains in
the waste stream. For the ABS to cause foaming in the Guheshwori WWTP, 6 loads of

14
laundry/week-family are required. As in the analysis of household detergent in the Bagmati
River, it is certainly possible that surfactants exist in high enough concentrations to cause
foaming in receiving waters.
Further, the wash water from an average load of laundry contains 2.5 mg/L
orthophosphates. If each family in Kathmandu City were to wash 1 load of laundry/week during
the dry season and to discharge all their wash water into the Bagmati River, household laundry
detergents would contribute 10-3 mg phosphates/L to the River. But phosphate levels in the
Bagmati River at Sundarighat were as high as 1.6 mg/L during May, 2001 (ENPHO, 2003).
Each family in Kathmandu would need to wash 100 loads of laundry per week even to contribute
0.1 mg/L to this 1.6 mg/L phosphates. It is very unlikely, then, that phosphates found in
household laundry detergents are major contributors to the high levels of phosphates in the
Bagmati River.
The real issue with foaming in the Guheshwori WWTP and in places along the Bagmati
River is not a matter of the use of soft and hard surfactants, but an indication of more serious
water quality problems, namely poor surface water quality and inadequate wastewater treatment.
3 Treatment Systems
3.1 Activated Sludge Treatment Process
The activated sludge wastewater treatment process is identified by three major
characteristics: a biological reactor for the decomposition of degradable organic chemicals, a
settling tank for the removal of solids and biomass from the water, and a recycle stream from the
settling tank to the reactor to ensure sufficient levels of microorganisms. In operation since
January 2001, the wastewater treatment plant at Guheshwori is the first activated sludge
treatment plant in Nepal.
This facility provides pre-treatment of wastewater with a mechanical bar rack and a grit
chamber. The Guheshwori WWTP lacks primary clarification tanks. This is not unusual in
smaller plants, especially when oxidation ditches are used (Harrington, 2003). The bar rack
eliminates large objects from the influent, and inorganic particles like sand are removed in the
grit chamber. The wastewater at Guheshwori WWTP is biologically treated in two carrousel-

15
type oxidation ditches, each with three aerators. From the oxidation ditches, wastewater flows
into two secondary clarifiers for the settling of solids. Up to 2,500 MLSS sludge is pumped from
the clarifiers back to the oxidation ditches to be metabolized by microorganisms, and any excess
sludge is wasted to one of fourteen drying beds.
At the time of our MIT Nepal Project team visit in January 2003, the sludge drying beds
were not being used, nor did they appear to have ever been used. The explanation we were given
for this was that all of the sludge from the secondary clarifiers was recycled to the oxidation
ditches as RAS (return activated sludge). Any excess solids are likely to leave the Guheshwori
WWTP with the effluent as TSS (Harrington, 2003). Table 4 displays design and performances
parameters for the Guheshwori Wastewater Treatment Plant. The performance parameters are
averages over the first six months of operation at Guheshwori (January 2001- July 2001).
Table 4: Design and Performance Parameters for Guheshwori WWTP (BASP, 2002; Shah, 2002 and Darnal, 2002)
Guheshwori WWTP Design Parameters
Service Area 5.37 km2 (3.28 mi2) Guheshwori WWTP Performance
Service Population (1996) 58,000 Parameter Influent Effluent RemovalProjected Population (2021) 198,000 BOD5 (mg/L) 270 25 91% Wastewater Produced 80 L/cap-d COD (mg/L) 1150 250 78% WWTP Footprint 51 m2 (164 ft2) TSS (mg/L) 216 100 54%
Energy Consumption 2.3 KW-hr/kg BOD TKN (mg/L) 48 30 38%
Annual Operating Costs $167,000 US NH4-N (mg/L) 41.7 22.1 47% Design Flow 0.19 m3/s (4.3 MGD) P (mg/L) 6.71 3.2 52%
MLSS 3,500 mg/L F/M 0.34
Advantages of conventional activated sludge treatment systems over some of the
alternatives discussed below are a relatively high removal rate of BOD and TSS and capacity to
treat a large amount of wastewater in a relatively small area. Performance data for Guheshwori
shows a lower TSS removal rate than in typical activated sludge WWTP’s, however. One
explanation for this could be the full recycle of sludge from the secondary clarifiers back to the
oxidation ditches.

16
In addition, the use of conventional activated sludge in developing nations has come under
much criticism in recent years (Harleman, 2001). The major disadvantage of activated sludge
systems are high operating costs associated with large energy needs. Nepal has few exploitable
fossil fuel sources, so electricity production efforts have been primarily focused on hydroelectric
plants. Even this source is largely untapped, so electricity remains very expensive.
3.2 Constructed Wetlands as an Alternative Technology in Nepal
Due to the failure of the large treatment plants, small and decentralized treatment systems
such as constructed wetlands are in high demand. Environment and Public Health Organization
(ENPHO) introduced the use of constructed wetlands for wastewater treatment in Nepal as an
alternative to conventional wastewater treatment technologies. ENPHO’s aim was to produce a
sustainable and feasible wastewater treatment system based on the natural ecosystem in this
impoverished country. It would be more appropriate if such plants could be installed at a
community scale around the valley and maintained by such communities.
The first ENPHO-designed constructed wetland system with a two staged sub-surface flow
was for Dhulikhel Hospital. It was built under the leadership of Dr. Roshan R. Shrestha of
ENPHO in 1997 to treat domestic wastewater (Shrestha, 1999). Due to the success of the
Dhulikhel Hospital system, four more sub-surface constructed wetland systems have been built
in and around Kathmandu in the past few years (Shrestha, 2001). The Kathmandu metropolitan
city (KMC) established its own septage treatment plant based on this technology. The Malpi
International School, located near Panauti, has adopted a similar system to treat household
wastewater before discharging the water in De Rosie River. The Sushma Koirala Hospital at
Sankhu and Kathmandu University at Banepa also have their own constructed wetland to treat
their domestic wastewater.
There are several additional constructed wetland systems that are in design phase in Nepal.
The Pokhara Sub-Metropolitan City’s system that is under construction will be the largest
constructed wetland system in Asia. The system is designed to treat 100 m3 of septage and 40
m3 of landfill leachate per day. The technology introduced and designed by ENPHO, is getting
popular and gradually becoming adapted within Nepal.

17
3.3 Treatment Efficiency of Dhulikhel Hospital’s Constructed System
The system has shown high treatment efficiency since its operation began in 1997 to 2000
(Table 5).
Table 5: Summary Statistics of Inlet and Outlet Concentrations and Mean Removal Rates of Dhulikhel Hospital Constructed Wetland System (1997 to 2000) (Shrestha, 2001)
During that interval of time, it was observed that the major pollutants such as total
suspended solids (TSS), organic pollutants, and ammonia-nitrogen had a removal percentage of
more than 95%, while the removal percentage of E. coli was even higher at 99.99% (Shrestha,
2001).
Although the system was initially designed for 20 m3/day of wastewater, since 2000 it
now treats 30 to 40 m3/day. The removal efficiencies for total suspended solids (TSS), 5-day
biochemical oxygen demand (BOD5) and chemical oxygen demand (COD) were not
significantly affected by the increase in hydraulic loading in 1999 and 2000, (Figure 5).
Month Q TSS IN TSS OUT
NH4-N IN
NH4-N OUT
PO4-P IN
PO4-P OUT
BOD4
IN BOD4
OUT COD
IN COD
OUT E.coli IN
E.coli. OUT
(m3/day) (mg/L)(mg/L) (mg/L) (mg/L) (mg/L) (mg/L) (mg/L) (mg/L) (mg/L) (mg/L) (col/mL)(col/mL)Nos. of
Reading 13 12 12 12 11 12 12 13 13 13 11 11 11 Minimum 7 26 0.3 17 0.04 2.2 0.6 31 0 63 4 39000 3 Maximum 40 230 6.7 52 5.4 26 18 210 10 1048 40 8E+08 987 Average 20 83 2.3 33 1.6 8 4 110 3 325 20 1E+08 148 Median 11 41 1.8 19 0.04 2 0.7 41 4 79 18 1E+05 38
Std. Deviation 11 58 1.9 12 2.2 7 5.8 63 3 273 14 2E+08 307
Elimination (%) 97 95 47 97 94 99.99

18
020406080
100120
1997 1998 1999 2000Year
Rem
oval
rate
(%)
TSSremoval(%)BOD5(removal(%)CODremoval(%)
020406080
100120
1997 1998 1999 2000Year
Rem
oval
rate
(%) NH3-N
remova (%)
PO4-Premoval(%)Wastewaterdischarge(m3)
Figure 5: Concentration reduction of Dhulikhel Hospital Constructed Wetland System at Different Time Interval
However, the removal efficiencies of ammonia, phosphorus and pathogens were reduced
with the increase in hydraulic load and time interval. It was reported that due to the loss of
drainage capacity at the upper layer of the vertical flow bed and decrease in hydraulic loading
interval caused the reduction of oxygen flowing into the vertical flow bed. This reduced the
ammonia removal efficiency (Shrestha, 2001). During the trip to Dhulikhel Hospital, the author
noticed that the wetland system was in poor condition. It was observed by the author that the
horizontal flow and vertical flow bed were full of sludge (Figure 6).
Figure 6: Sludge Affected Areas in the Wetland System
The main reason for the sludge accumulation in the wetlands might be the increase in
flowrate above the design flow, which prevents the sludge from settling in the tanks before
discharging into the wetlands. The condition of sludge accumulation in the vertical flow bed was
more serious, as ponding of wastewater affected almost 90 percent of the surface of the bed,
while only 20% of the surface area of the horizontal bed was affected (Figure 7).

19
Figure 7: Ponding Effects on the Vertical Flow Bed (Left) and Horizontal Flow Bed (Right) at Dhulikhel Hospital Due to Sludge Accumulation
The reeds in the wetlands looked unhealthy as the growth was not thick and the reeds
were withered. The average height of the reeds was only 0.3 meter in the horizontal flow bed and
0.5 meter on the vertical flow bed compared to reed growth of 2 to 3 meters in the other wetland
systems. These problems suggested that the wetland system was not maintained regularly.
The removal efficiencies for TSS, BOD5 and COD from July 2002 to January, 2003 are shown in
Table 6.
Table 6: Summary Results of Inlet and Outlet Concentrations and Mean Removal Rates of Dhulikhel Hospital Constructed Wetland System (Jul 2002 to Jan 2003) (ENPHO)
Parameters Date BOD(mg/l) COD(mg/l) TSS(mg/l) PO4 (mg/l)
In Out %
Removal In Out%
Removal In Out%
Removal In Out %
Removal12-Jul-02 62.0 1.5 98 122.4 20.0 84 66.0 3.0 96 3.94 3.27 17 24-Sep-02 84.0 5.4 94 130.6 23.3 82 106.0 5.0 95 2.5 1.0 60 15-Nov-02 72.0 1.9 97 97.6 22.0 78 46.0 5.0 89 2.8 1.5 45 14-Jan-03 349.0 14.3 96 680.0 49.5 93 380.0 24.7 94 8.6 4.9 42 Average Removal % 96 84 93 41
The elimination rates of the respective pollutants were compared to those shown in Table
5 and the removal efficiencies of these pollutants were noted to be significantly reduced (Table
7).

20
Table 7:Comparison of Average Removal % for Dhulikhel Hospital Constructed Wetland System
%Average Removal Date BOD5 (mg/l) COD (mg/l) TSS (mg/l) PO4 (mg/l)
1997-2000 97 94 97 47 2002-2003 96 84 93 41
It was observed that the removal efficiencies of these pollutants in this wetlands system
fluctuate as the influent and effluent discharge was higher in the day than the night (Poh, 2003).
It was also noted in his report that the distribution of different parcels of water remained in the
system longer during the night flow period than the day flow period (The hours selected for the
day and night flow periods were 8:00 A.M to 8:00 P.M and 8:00 P.M to 8:00 A.M respectively).
Thus, for a given reaction rate coefficient (kr), a greater pollutant removal is achieved during the
low flow period because the residence time is higher. Therefore a more stringent sampling
method is needed to determine the mean daily removal efficiencies of pollutants.
Table 8 describes the minimum level of effluent quality attainable by secondary treatment
in terms of the parameters set by the Environmental Protection Agency (EPA) in the U.S.
Table 8: Minimum Level of Effluent Quality Attainable Through Application of Secondary or Equivalent Treatment (EPA, 2003).
Minimum Level of Effluent Quality Attainable Date BOD5 (mg/l) COD (mg/l) TSS (mg/l)
30-Day Average 30 25 30 7-Day Average 45 40 45
Since all requirements for each parameter shall have a 30-day average percent removal not
less than 85 percent, a more rigorous sampling data is needed for the wetlands system at
Dhulikhel Hospital to meet the standards as the recent data provided, is taken only once a month.

21
3.4 Alternative Treatment Options
3.4.1 Chemically Enhanced Primary Treatment (CEPT)
From current knowledge of the wastewater problem in Kathmandu, CEPT appears to be a
viable treatment option. CEPT is more cost-effective than traditional biological treatment
(primary treatment plus activated sludge) (Harleman, 2001). Construction costs of CEPT plants
are on average 60% of the construction costs of a traditional biological treatment plant, though
cost will vary on location and condition. Annual operating costs for CEPT plants are also less
expensive. Though chemical costs for CEPT may be high, they are more than off set by the high
energy cost for biological treatment. This is a bonus in Nepal, where energy can be scarce.
CEPT plants are more robust than biological plants; they can operate under a wider range
of conditions. Industrial influent often has adverse affects on the microorganisms used in
biological treatment leading to plant upsets. Heavy metals, such as chromium can precipitated
out as hydroxides and sulfides with the appropriate chemical addition. Chemical treatment is not
as susceptible to system upsets based on the influent to treatment plants. CEPT plants can also
handle higher influent rates than biological treatment plants, such as Guheshwori, because they
require less residence time.
The basic flowsheet for a CEPT plant is shown in Figure 8.
Figure 8: Flowsheet For a Typical CEPT Plant
Grit Tank Settling Tank Wastewater Treated water
Coagulant Flocculent
Big Particles
Stirring Tank
Sludge

22
Wastewater enters the first tank, where big particles are allowed to settle out. Next, a coagulant
is added, often an iron complex. The coagulant attaches to suspended solids in the stirring tank,
forming denser particles. A flocculent, an anionic polymer is then added, allowing coagulated
solids to combine to form even larger particles. These particles are allowed to settle and form a
sludge, which is separated from treated water. Jar test and coliform test must be performed to
analyze how effective CEPT could be at removing debilitating parasites found in wastewater.
3.4.2 Advanced Integrated Pond System (AIPS)
Another alternative wastewater treatment system gaining popularity in developing and
fully developed nations alike is the advanced integrated pond system (AIPS). AIPS is suitable in
situations of normal wastewater flow as well as highly variable flow rates and organic loadings,
especially in cases of limited industrial pre-treatment and in the presence of toxic organics and
heavy metals (Swanson, 2002).
This treatment system consists of an anaerobic pit beneath an oxygenated, aerobic
reactor. The wastewater enters into the deep anaerobic reactor, where heavy solids settle to form
a thick anaerobic sludge blanket. Some organics are removed as the wastewater passes through
the dense sludge toward the aerobic reactor. Decomposition in the anaerobic pit releases gases
into the aerobic zone, which are either absorbed by the water or emitted to the atmosphere.
The aerobic section contains bacteria and algae for the further decomposition of soluble
organic materials in the wastewater. The oxygen levels in the aerobic zone are controlled with
horizontal surface aerators as well as natural aeration and algal photosynthesis. The aerators are
positioned such to create a circular flow on the pond surface to inhibit seasonal turnover within
the pond and to minimize odors.
A non-aerated pit exists to the side of the aerobic zone. This section of the treatment
system serves as a settling tank, where solids are removed by gravity. The solids in both the
non-aerated zone and the anaerobic zone remain until they are fully decomposed. This is
possible, since the pits are very deep. The advantage of such a design is that no sludge needs to
be removed or wasted (Swanson, 2002).
23
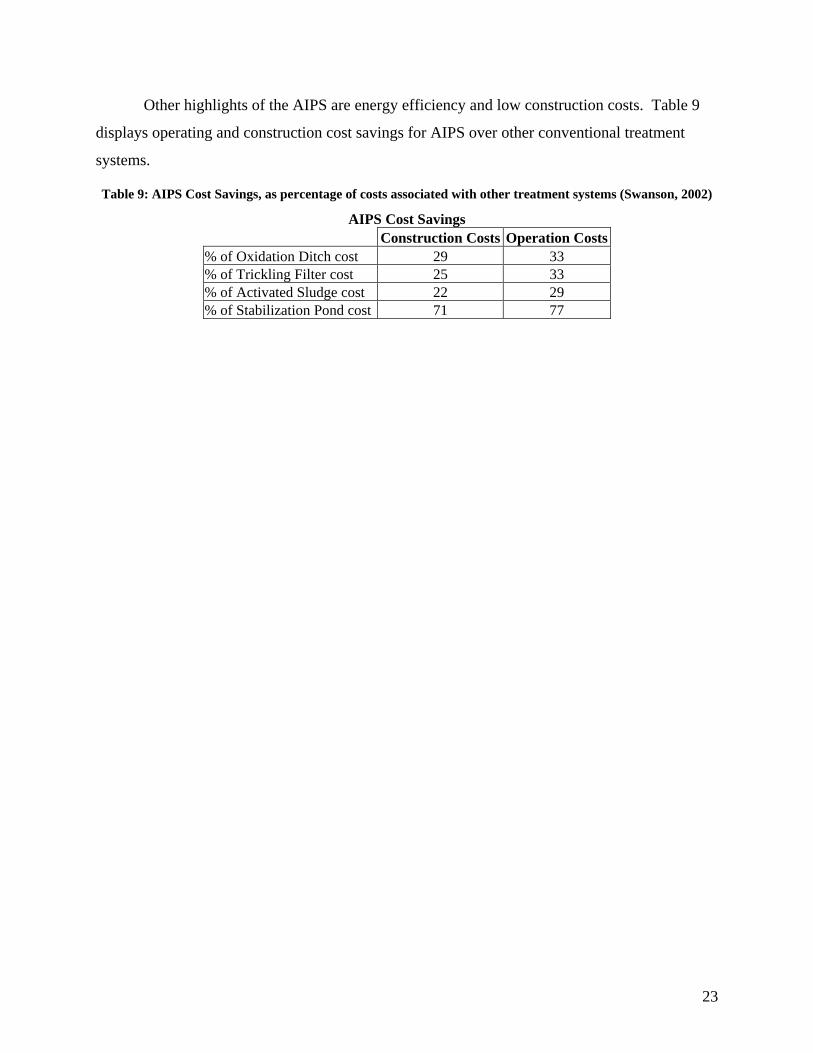
Other highlights of the AIPS are energy efficiency and low construction costs. Table 9
displays operating and construction cost savings for AIPS over other conventional treatment
systems.
Table 9: AIPS Cost Savings, as percentage of costs associated with other treatment systems (Swanson, 2002)
AIPS Cost Savings Construction Costs Operation Costs % of Oxidation Ditch cost 29 33 % of Trickling Filter cost 25 33 % of Activated Sludge cost 22 29 % of Stabilization Pond cost 71 77

24
References
Asian Development Bank “Country Assistance Plan (200-2002) Pipeline Update Nepal”, June 2000. Arata, Tetsuji; “Wastewater in the Greater Kathmandu”, Japan Association of Environment and Society for the 21st Century, March 2003. Bagmati Area Sewerage Construction/Rehabilitation Project (BASP). The Implementation & Monitoring of the Bagmati Area Sewerage Construction/Rehabilitation Project (BASP). Kathmandu: BASP, 2002 (brochure). Darnal, Kiran; “Wastewater System in Kathmandu Valley: An Overview”, Development Insight, August-October 2002. ENPHO, South Asian Trans-Boundary Water Quality Monitoring (SATWQM) Data, 2003. ENPHO, Data from Dhulikhel Hospital Constructed Wetlands, 2002-2003. EPA, Secondary Treatment Regulations, May 15, 2003, http://www.access.gpo.gov/nara/cfr/cfrhtml_00/Title_40/40cfr133_00.html. Finlay, Hugh; Nepal, 5th Edition; Lonely Planet Publications, August 2001. Green, Hillary. The Effects of Carpet Dye on the Bagmati River. A dissertation for the fulfillment of degree of the Master of Engineering in Civil and Environmental Engineering. Massachusetts Institute of Technology, Cambridge, MA. 2003. Harleman, D and Murcott, S; “An Innovative Approach to Urban Wastewater Treatment in the Developing World”, Water 21: Magazine of the International Water Association, June 2001. Harrington, Brian; personal conference, May 2003. Human Development Report, 2003. Poh, Saik-Choon. Assessment of Constructed Wetland System in Nepal. A dissertation for the fulfillment of degree of the Master of Engineering in Civil and Environmental Engineering. Massachusetts Institute of Technology, Cambridge, MA. 2003. Richards, Amanda. Effects of Detergent Use on Water Quality in Kathmandu, Nepal. A dissertation for the fulfillment of degree of the Master of Engineering in Civil and Environmental Engineering. Massachusetts Institute of Technology, Cambridge, MA. 2003.

25
Shah, Ram Deep and Das Sunil Kumar; “Performance of deep oxidation ditch” 28th WEDC Conference, 2002. Shrestha, Roshan R. Application of Constructed Wetlands for Wastewater Treatment in Nepal .A dissertation for the fulfillment of degree of the Doctor of Applied Natural Sciences. University of Agricultural Sciences,Vienna,Austria.1999. Shrestha, Roshan R..A New Step Towards Wastewater Treatment in Nepal .A Journal of the Environment, Vol.6, No.7, 2001. Ministry of Population and Environment, Nepal. 2001. Swanson, Lorne and Edwin Lee; “Advances in Wastewater Treatment and Effluent Disposal at California Wineries,” Swanson International Engineering, 2002. UNICEF, 2003.


![[Urban Management Program City Paper : Kathmandu, Nepal]](https://img.dokumen.tips/doc/110x75/55862592d8b42a4c578b4630/urban-management-program-city-paper-kathmandu-nepal.jpg)
![[Waterworks] City Presentation - Kathmandu(Nepal)](https://img.dokumen.tips/doc/110x75/557c65b1d8b42a757c8b50e4/waterworks-city-presentation-kathmandunepal.jpg)