Embed Size (px)
Citation preview
1
Wage inequality in Spain:A regional perspective*
Ismael Ahamdanech ZarcoInstituto Nacional de Estadística
Carmelo García PérezUniversidad de Alcalá
Hipólito SimónUniversidad de Alicante-IEI- IEB
Abstract
This research examines wage inequality in the Spanish labour market from a regional perspective, drawing on stochastic dominance techniques. The field of study is of particular interest because wage determination in Spain incorporates an important territorial component, facilitated by certain specific institutional elements, given that Spain is one of the few developed countries in which collective bargaining is mainly developed through industry-wide agreements on an infra-national scale applied exclusively to provinces or regions. The main empirical findings are that wage inequality exhibits a significant regional heterogeneity and that both regional differences in workforce heterogeneity and the mix of jobs and workplaces and differences in their wage returns are influential factors in the explanation of regional heterogeneity in the levels of wage inequality. Consequently, the infrequent regional dimension of collective bargaining on an industry level implies the presence in Spain of wage determination mechanisms that are differentiated by region, which give rise to the existence of significant differences in regional wage structures.
Keywords: Wage inequality; stochastic dominance; Spain.JEL Codes: J30, D31.
1. Introduction
The analysis of wage inequality and its determinants has received much attention in economic
literature (Blau and Kahn, 1999 and Katz and Autor, 1999). However, in contrast with the
abundance of international literature that has documented wage dispersion and its trends in other
countries over the last few decades, research addressing these issues in Spain is not extensive. Two
exceptions which can be highlighted are Jimeno et al. (2001) and Palacio and Simón (2004) who
identify education, the type of contract and the profession of individuals and the different wage
levels between companies as factors that have a significant impact on inequality levels in the
Spanish labour market. From a time perspective, Izquierdo and Lacuesta (2006) sustain that in
recent years wage inequality in Spain has been decreasing as a result of the opposing effects
derived from changes in the composition of the workforce, which have had an increasing effect on
inequality, and from modifications experienced by certain returns, which have tended to reduce
inequality. Evidence obtained by Simón (2009) suggests that, from an international perspective,
2
there are a series of significant unique features inherent in the Spanish wage structure, including
the way in which the characteristics of the economic agents are remunerated in the Spanish labour
market that generates, in relative terms, a significant reduction in wage inequality.
The aim of this study is to analyse wage inequality and its trends in Spain from a regional
point of view. The study from this perspective is justified as wage determination in Spain
incorporates an important territorial component, facilitated by certain specific institutional
elements. As it is well known, the Spanish collective bargaining system is characterised by a very
high coverage rate and by the presence of two levels of wage negotiation, the industry and
company levels, the latter having a lower quantitative importance (see, for example, Banco de
España, 2009). This system, characterised by a high coverage rate and by the predominance of
industry-level agreements, is relatively common in other eurozone countries, which also possess
bargaining systems with an intermediate level of centralisation (Du Caju et al., 2008). However, in
contrast to these other countries, the majority of workers in Spain covered by collective bargaining
are covered by industry-wide agreements which have a regional rather than national scope. No
other country close to Spain (except for Germany) has a predominantly sectoral bargaining system
which is developed fundamentally through industry-wide agreements with an infra-national scope.
Furthermore, the link that exists in practice between the minimum wages agreed in the
industry-wide agreements and the actual wages received by the workers is highly significant (see,
for example, Dolado et al. 1997). The unusual regional dimension of sectoral collective bargaining
that exists in Spain plausibly facilitates the presence of differentiated regional mechanisms of wage
determination. This circumstance is consistent with international evidence, in the sense that
collective wage bargaining is a labour institution that is highly influential in shaping the wage
differences between regions that exist in each country (Vamvakidis, 2008), a fact that can be clearly
seen in the specific labour market of Spain, where regional differences in real wages are very
similar to those of the wage floors that are established by sectoral agreements on an infra-national
scale (Simón et al, 2006).
The wage differences between regions in Spain are, in practice, highly significant, and large
in size when compared with other European countries (García and Molina, 2002 and Serrano,
2002). Moreover, they are highly persistent over time, which is partially explained by the high
degree of homogeneity between regions in terms of the wage increases established by industry-
wide collective agreements (Alonso and Izquierdo, 1999). This pronounced persistence over time
is practically incompatible with a wage adjustment capacity that is sufficient to respond to changes
in economic conditions. Consequently, in the Spanish labour market there is only a limited
* Hipólito Simón would like to thank the Ministry of Education and Science for the support received through the project SEJ2007-67767-C04-02. Corresponding author: [email protected]
3
dynamic association between the regional wage differences and unemployment rates and regional
levels of productivity (Bentolila and Jimeno, 1998 and Bentolila and Dolado, 1991). Furthermore,
the differences in wage levels between regions are only partially caused by competitive factors such
as regional differences in prices or the composition of the workforce (López-Bazo and Motellón,
2009 and Simón et al., 2006). This circumstance, together with the low inter-territorial migratory
flows and their low response to regional wage differences, are the main factors that explain the
strongly defined regional segmentation of the Spanish labour market (Bentolila and Jimeno, 1998
and Bover and Velilla, 2005), which is evident in distinct and highly persistent differences in both
employment rates and, especially, unemployment rates (Bande et al., 2008).
In contrast with previous studies on Spain which have exclusively analysed the presence of
regional differences in wage levels, the objective of this study is to examine the regional differences
in wage inequality. It is worth highlighting that very few references have been made to the regional
dimension in the analysis of the distribution of wages other than average wages. These references
are limited to Ahn et al, (2001), who identified the existence of significant regional differences in
the degree of wage inequality and found that the relative size of the young population is a
significant factor in explaining the phenomenon, and El-Attar and López-Bazo (2006), whose
findings show that regional differences in both wage dispersion and wage distribution as a whole
can be explained by a combination of regional differences in the endowments and relative returns
of workforce and companies characteristics. The especial emphasis of this study on the analysis of
the regional dimension of wage inequality will consequently contribute to improving general
knowledge of this phenomenon and its determinants in Spain.
One noteworthy aspect of the research refers to the use of Lorenz inference-based
stochastic dominance techniques. This methodology, as opposed to more common comparative
analyses, based on specific wage inequality measures, enables the non-ambiguous ranking of wage
distributions according to their degree of inequality. This avoids the classic multiplicity of index
numbers problem whereby the significance of the results of distribution inequality comparisons
may vary depending on the specific inequality indexes used (Bishop and Formby, 1994). In
contrast, the use of the empirical comparison of Lorenz stochastic dominance provides a clear way
of examining whether significant differences in inequality levels exist in practice between Spanish
regions, and the extent to which inequality experiences significant changes over time. In addition,
it is worth highlighting that there are very few studies in international literature that have applied
this methodology to the analysis of wage distributions: as far as we know, the only exception is
Bishop et al. (1997) for the case of the United States.
This study attempts to provide answers to a basic question, namely, to what extent there
are significant differences between wage inequality levels in Spanish regions, and in the case where
4
they exist, to identify their underlying factors. This analysis is related to previous studies carried
out from an international comparative perspective addressing the reasons for the strong
heterogeneity existing between countries in the level of wage inequality. The results of these
studies suggest that the differences in workforce characteristics only explain a small proportion of
international differences in inequality, indicating that the majority of these differences are
associated with differences in the characteristics of job positions and companies (Blau and Kahn,
1996 and 2005 and Simón, 2010). The analysis of the factors that influence the regional differences
in inequality levels is developed by using both the inference-based Lorenz stochastic dominance
techniques together with the methodology proposed by Juhn et al. (1993). This technique enables
the generation of counterfactual wage distributions under certain hypothetical scenarios, and its
application facilitates a specific examination of whether the regional differences in wage inequality
are due to Spanish regions being different in terms of the composition of their workforces and
firms or, alternatively, to the presence of differentiated mechanisms for determining wages.
In short, the main findings of the research reveal that in practice there are significant
variations between regions in terms of the wage inequality in the Spanish labour market, and that
the overall process of wage inequality reduction which is being experienced in Spain is a
phenomenon that extends to the majority of the regions. They also suggest that the regional
differences existing in the characteristics of the workforce and companies constitute a highly
significant determinant of the regional differences in wage inequality, although the presence of
different mechanisms for determining wages also plays a relevant role.
The structure of the research is as follows. Following this introduction, the second section
describes the data. Subsequently, the third section specifies the methodology used. The fourth
section provides descriptive evidence and develops an empirical analysis of wage inequality in the
Spanish regions. The study finishes with the conclusions.
2. Data
The information source from which the microdata have been retrieved for the research
study is the Encuesta de Estructura Salarial (Wage Structure Survey; hereafter EES) for 1995 and
2002. The EES is a two-stage survey of wage earners based on their employers’ social security
contributions. One of the most relevant features of the EES is that it includes observations for
individuals in each establishment, therefore providing what is known in economic literature as
matched employer-employee microdata (reviews of the significant impact that the availability of
this type of microdata has had on the understanding of how the labour market operates, and
particularly with respect to wage determination, may be found in Hamermesh, 2008 and Abowd
and Kramarz, 1999). The EES covers those employees that work in establishments with ten or
more workers in the following branchs of activity: industry, construction, retail, hotel and
5
restaurant trade, transport and communications, financial intermediation, property sale and rental
activities and business services (and in the case of the 2002 wave, also health, education and other
social activities). Although the EES possibly represents the most complete source of
microeconomic data on wages in Spain, the fact that the its coverage of the labour market is not
complete should be taken into account when interpreting the results of the empirical analysis.
In addition to information regarding wages, the EES contains diverse information with
respect to the characteristics of the workers (sex, age, education and seniority) and their job
positions and companies (occupation, type of contract, working hours, sector, size, type of
collective agreement and region). The information contained in the EES also facilitates the
calculation of variables relative to the composition of the workforce based on the series of
observations for each establishment. Although these types of variables are subject to a certain
degree of measurement error as they are calculated from information of a sample, it should be
noted that their use in econometric analysis is relatively frequent (see, for example, Bayard et al.,
2003 and Card and De la Rica, 2006). Another point to take into consideration is that those
observations corresponding to the over-65s and resident of Ceuta and Melilla have been
eliminated, and, in the case of the 2002 wave of the EES, those observations relating to the sectors
of activity that were not covered in the 1995 wave have also been eliminated in order to develop
an empirical analysis for a homogeneous segment of the labour market. The final samples include
a total of 155,889 observations for 1995 and 107,961 observations for 2002. The samples have a
relatively large size and enable analyses to be developed broken down by region (the size of the
regional samples in 1995 range from 3,238 observations for La Rioja to 22,640 for Madrid and in
2002 from 2,199 observations for La Rioja to 17,961 for Catalonia).
The wage concept used in the empirical analysis is the gross hourly wage. This wage has
been calculated using the wage information corresponding to the month of October for each year,
which was selected by the Instituto Nacional de Estadística (Spanish National Institute of Statistics)
due to the fact that October is representative of the whole year in terms of wage payments. The
wage per hour has the same definition for both 1995 and 2002, rendering it totally comparable
between both periods, and it covers all types of payments made by companies, with the exception
of overtime payments1. The wages of 1995, originally expressed in pesetas, have been converted
into euros.
3. Methodology
3.1. Lorenz stochastic dominance and statistical inference
1 The calculation of the hourly wage has been carried out for both 1995 and 2002 in the following way: [(basic monthly wage + monthly wage complements + extra annual payments calculated per month)]/[bargained annual working time/12].
6
Traditionally, stochastic dominance techniques have been principal tools in comparative
empirical research studies on income and economic wellbeing (see, for example, the analyses
developed using these techniques in Bishop et al., 1991 and Ahamdanech and García, 2007, from
an international comparative perspective, and Del Río and Ruiz-Castillo, 1996, for the specific case
of Spain). However, their application in the comparative analysis of wage distributions has had a
significantly more limited scope, despite the advantages inherent in adapting the technique to this
field of study.
One of the most notable advantages of the Lorenz dominance for comparing relative wage
inequality between regions (or, alternatively its evolution over time) is that this comparison is not
based on specific measurements of wage distribution, but uses them all. There are also tools of
statistical inference that can be used to avoid problems derived from sampling errors which arise
when working with samples. Not considering these errors appropriately can frequently lead, in
practice, to erroneous conclusions in comparative analyses of the stochastic dominance between
distributions (Bishop et al., 1997).
The Lorenz dominance applied to the context of this study is based on the comparison of
the Lorenz curves of two wage distributions. Let AiL be the coordinate of the Lorenz curve of
wage distribution for region A in quantile i. According to the Lorenz method, wage distribution of
region A dominates that of region B if Bi
Ai LL for every i with at least a strict inequality. Thus, if
wage distribution of region A Lorenz dominates that of region B the distribution of A is more
egalitarian than that of B2, taking into account that the whole distribution has been used for the
comparison. In the case where the Lorenz curves of the two regions cross, there are no dominance
relations in terms of inequality between their wage distributions3. It is important to point out that
Lorenz dominance is not incompatible with the use of inequality indices, which provide complete
rankings, rather it is complementary to them, enriching the examination of the phenomenon.
Notwithstanding, if the empirical analyses are based on sample data, the cuts in the curves
may be due to sampling errors, and consequently they will not be statistically significant. However,
certain hypothesis testing procedures can be found in the economic literature with respect to this
question that are useful in determining whether the cuts in the curves are significant, which
extends the ranking power of the technique described. Although a detailed analysis of the
application of stochastic inference for the Lorenz dominance is presented in Appendix 1, it is
important to highlight some aspects. Firstly, it is based on samples from which sampling statistics
2 Atkinson (1970) includes a formal demonstration of how a Lorenz dominance of a distribution over another implies that the values of the indices usually used in economic literature for measuring inequality, such as the Gini index or the variation coefficient , are necessarily lower for the first distribution.
7
are generated whose asymptotic distributions are obtained. A hypothesis test is developed based
on these distributions in order to analyse the statistical significance of the differences in the
Lorenz curve coordinates. The sampling weights of the observations included in the survey are
considered in the calculations for obtaining the comparative statistics between coordinates of the
Lorenz curve, whose expressions are presented in Appendix 1.
3.2. The Juhn et al. (1993) technique
As indicated in the introduction, one of the basic objectives of this study is to examine the
factors that influence the regional differences in levels of wage inequality. In order to analyse this
question in more detail, in addition to the inferential techniques of statistical dominance, the
methodology proposed by Juhn et al. (1993) has been used. This technique is based on the
calculation of counterfactual wage distributions (more details of its application may be found in
Appendix 1). Adapted to the specific context of this research study, this technique enables us to
calculate the counterfactual wage distributions that each of the Spanish regions would have in the
case where they differ from a reference wage distribution (that corresponding to Spain as a whole
has been used), exclusively in the characteristics of the workers and companies or, alternatively, in
the relative returns of these characteristics. Through the subsequent application of the stochastic
dominance technique to the counterfactual wage distributions which are generated by this
methodology, it is possible to analyse the reasons for the regional differences in wage inequality,
and more specifically, whether these differences are due to the Spanish regions being different in
terms of the composition of their workforce and companies, or alternatively in the way in which
these factors are remunerated4.
The explanatory variables included in the specification of the wage equations on which the
technique proposed by Juhn et al. (1993) is based cover a wide spectrum of characteristics both in
terms of the individuals and their job positions and companies5. The former comprise the gender
of the individual; the maximum level of general education (distinguishing between eleven different
levels); the years of potential experience in the labour market (measured as the age of the
individual less the age when entering the labour market after finishing full time education) and its
quadratic form and years of seniority in the current position and its quadratic form. The
3 Note that the comparison is applicable immediately to the comparison of inequality of a region in two moments of time.4 One of the shortcomings of this technique is that it does not provide detailed information regarding the individual effect of each of the explanatory variables included in the equation, only of the overall effect of them all. This circumstance implies that it is not possible to differentiate between variables in accordance with criteria such as their evaluation from the point of view of equal opportunities and social justice (see Roemer, 1998). 5
It is worth highlighting that the explanatory capacity of the wage equations is relatively high: the adjusted coefficients of determination of the regressions of equations (A.4) and (A.5) take values of around 0.55 for both years in the case of Spain and of between 0.44 and 0.66 for each of the Spanish regions. The detailed results of the estimates are not included in the study due to space constraints, but they are available from the authors on request.
8
characteristics of the job positions considered are the type of contract (permanent or temporary);
the type of working day (full time or part time) and occupation (distinguishing between fifty seven
occupations)6. Finally, the attributes of the establishments are the sector (considering the divisions
of the CNAE-93 classification); the type of collective agreement (industry-wide on a national level,
industry-wide on a regional or provincial level, company agreement and other types of agreement);
the size (five segments); the proportion of women; and the average number of years of education,
seniority and experience, respectively of the establishment’s workforce7.
4. Empirical results
4.1. Descriptive evidence
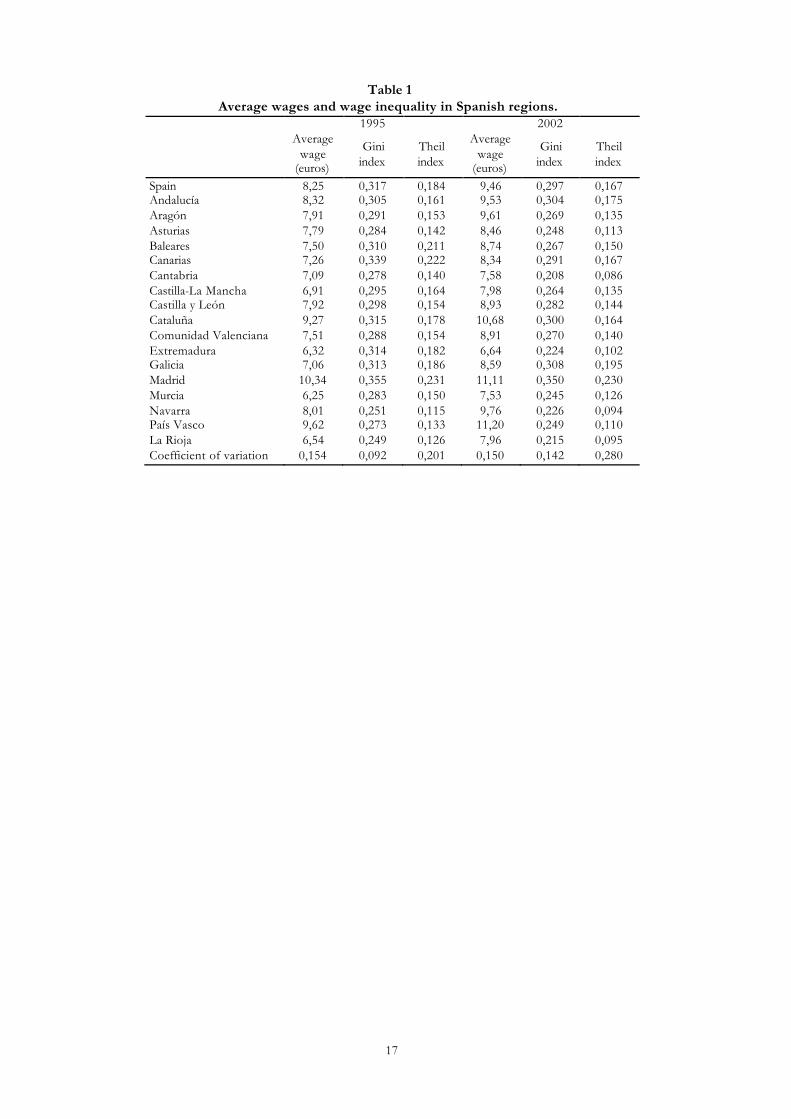
Table 1 contains, for the whole of the period analysed, information of the Spanish regions
regarding average wages and wage inequality (the latter is measured through the use of two
inequality indices usually employed, the Gini index and the Theil index). By examining this
evidence it can be clearly observed that the presence in the Spanish labour market of differences
between regions in terms of wage structures is not limited to average wages, but extends to the
levels of wage inequality. The regional variability in the levels of inequality of hourly wages is a
phenomenon which seems to become more accentuated over time (the coefficient of variation of
the regional values of both measurements of inequality experience significant increases: from 0.092
to 0.142 in the case of the Gini index and from 0.201 to 0.280 in the case of the Theil index).
Furthermore, it is worth noting the strong temporal stability in regional wage determination, given
the strong similarity in both years with respect to both regional differences in average wages (the
correlation coefficient is 0.95) and those of inequality levels (the correlation coefficient of both
measurements of inequality is higher than 0.75 and statistically significant at conventional levels).
A final circumstance to highlight is the presence of a relationship, albeit more prominent in 2002,
between the levels of average wages and wage inequality whereby both tend to be comparatively
higher (lower) in the same regions.
In the specific case of wage inequality, the region with the largest inequality is
systematically that of Madrid (where, by way of example, the Theil index in 1995 and 2005 takes
values of 0.231 and 0.230, significantly higher than the values of this index for Spain as a whole,
6 Although the 2002 wave of the EES incorporates information regarding the nationality of the individual, andwhether the individual carries out a supervisory role, these variables are not included in the 1995 wave. Consequently, it was decided not to include them in the specification of the equation. 7 While not being a exhaustive justification for using these explanatory variables, the majority of which constitute standards in economic literature, it should be pointed out that the inclusion of the proportion of women and the average years of education, seniority and experience in the establishment respond to the recent evidence available for Spain in the sense that a high presence of women significantly decreases relative wages of companies (Amuedo-Dorantes and De la Rica, 2006), and that the endowment of the workforce as a whole of a company in practice has a high impact on the individual wages of all of the workers (Alcalá and Hernández, 2006).
9
0.184 and 0.167 respectively)8. On the contrary, the lowest levels of inequality are found in
Navarra and La Rioja in 1995 (according to the Theil index and Gini values respectively), and in
Cantabria (according to both indexes) in 2002. As it can be observed, while the regional rankings
of inequality at each moment of time show a similar trend for both measurements of inequality
(the Spearman rank correlation coefficient for regional values of both measurements takes values
of 0.958 in 1995 and 0.970 in 2002), these rankings exhibit certain differences depending on the
specific measurement of inequality. These results illustrate the problem of multiplicity of indices
that frequently arises in comparative analyses when inequality measurements are used.
Based on the above-mentioned descriptive evidence it can be established that the results of
regional comparisons of inequality may be sensitive to the index used to measure it, and that the
reduction in wage inequality in Spain, while having a general nature, exhibits a certain degree of
regional heterogeneity in its intensity. These circumstances underline the advisability of using
stochastic dominance techniques for analysing the relative levels of wage inequality in Spanish
regions and their changes over time, given the advantages associated with their use. Therefore,
these techniques provide an unambiguous ranking with respect to levels of inequality, enabling a
record to be made of those cases in which regional differences of inequality are statistically
significant.
4.2. Lorenz dominance
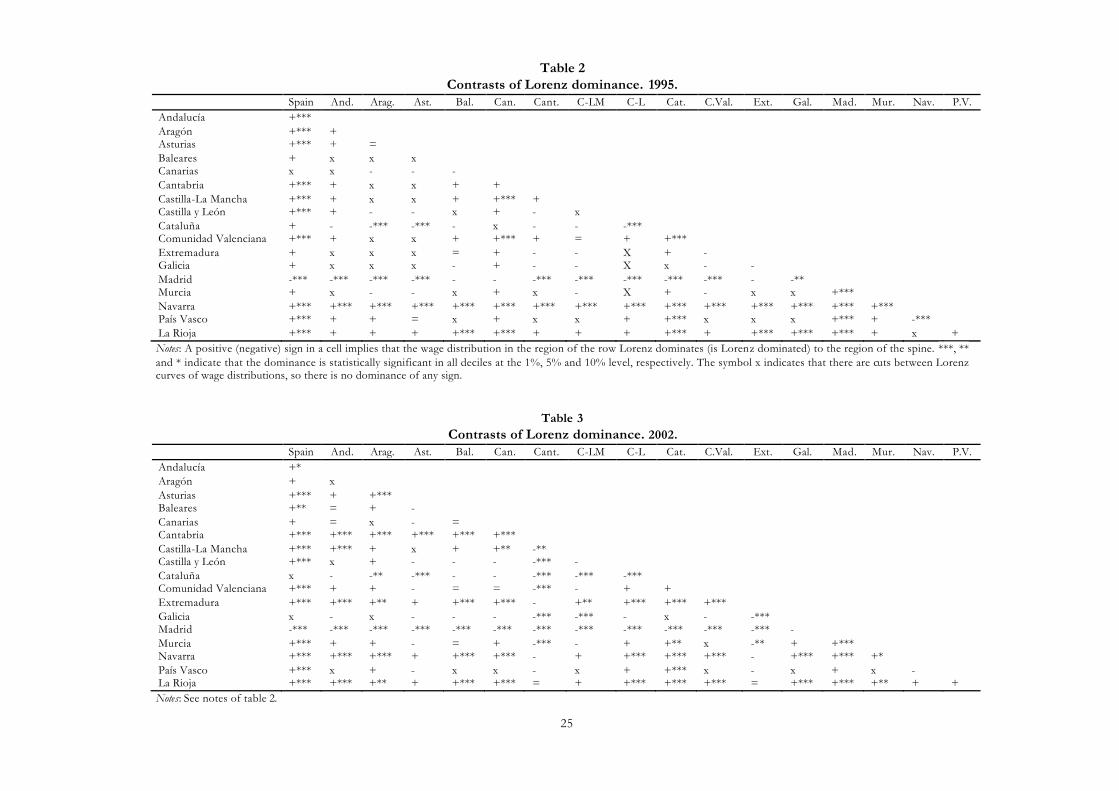
The basicquestion that this study attempts to address is the extent to which significant and
persistent wage differences exist between the wage inequality levels of Spanish regions. In order to
explain this question, tables 2 and 3 include the results derived from applying the contrasts of
Lorenz stochastic dominance to the bilateral comparisons of wage distributions of the Spanish
regions for each of the years analysed (the first column of each table corresponds to the
comparison with the wage distribution for Spain as a whole). In order to facilitate the
interpretation of the results, it is worth pointing out that if a region exercises Lorenz dominance in
a positive (negative) sense over another, this implies that the first has a lower (higher) wage
inequality. Furthermore, this dominance is strong if statistically significant differences of the same
sign are detected in the coordinates of the two Lorenz curves in the comparisons developed for all
the deciles of the distributions. The dominance is weak if there is some statistically significant
difference in one of them, but there is at least one decile for which the null hypothesis of the
equality of the coordinates of the two Lorenz curves cannot be rejected. Finally, there is no
8 Elaborating on this point, it is worth highlighting that, according to the data of the European Wage Structure Survey,the wage inequality in Madrid in 2002 was only exceeded in the context of the EU-15 by the regions of London and Île de France when the NUTS1 territorial references are considered (Eurostat, 2005). Note that the European Wage Structure Survey contains equivalent information to that of the Wage Structure Survey conducted for Spain by the Spanish National Institute of Statistics and is wholly comparable between countries.
10
dominance of one distribution over another if the results of the comparisons reveal differences
with opposite signs in different deciles.
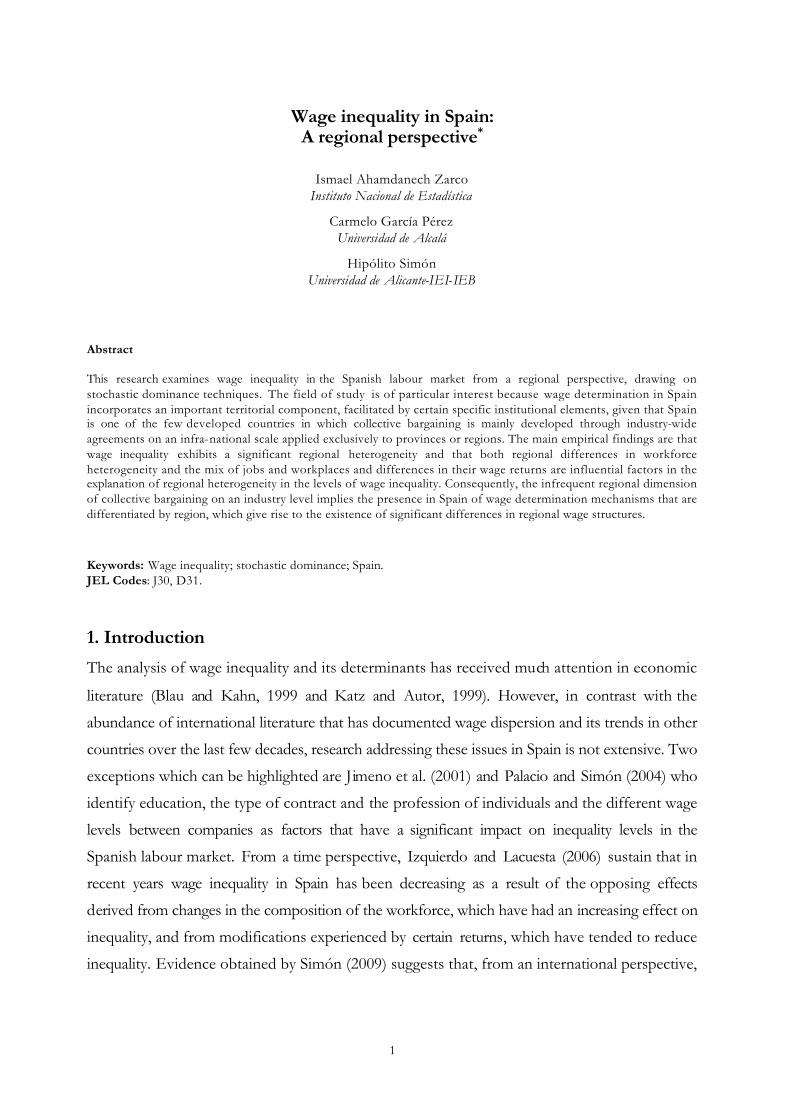
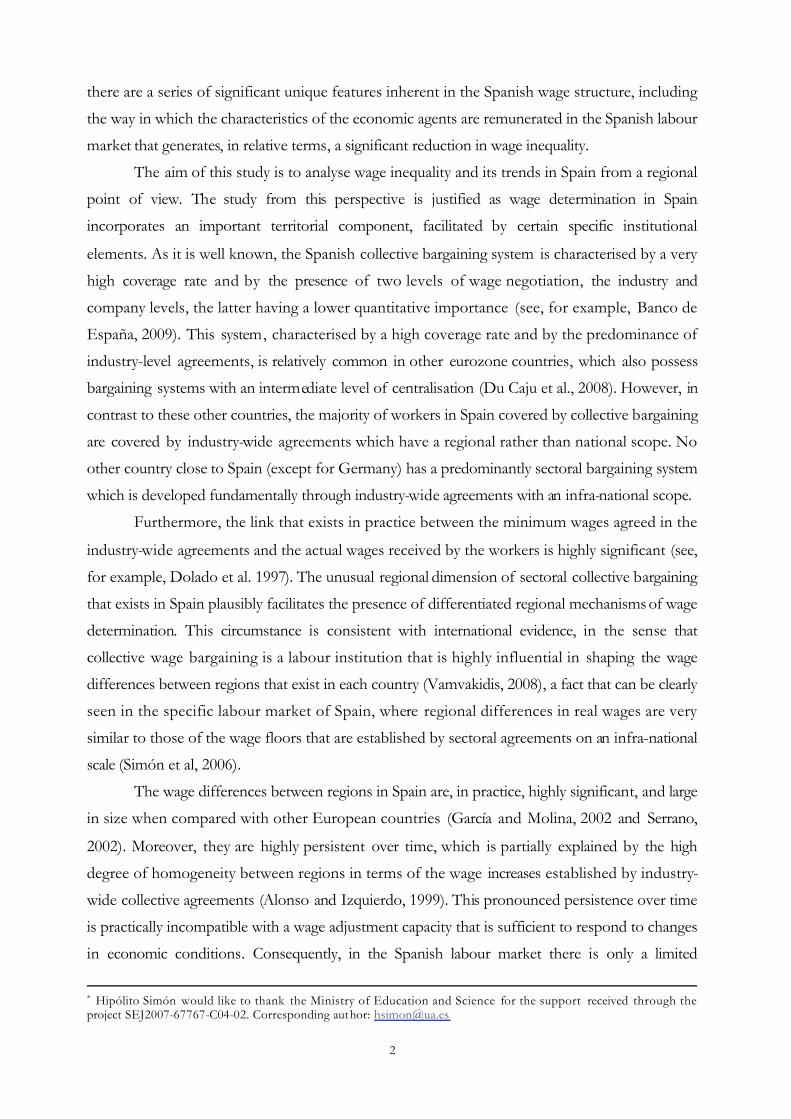
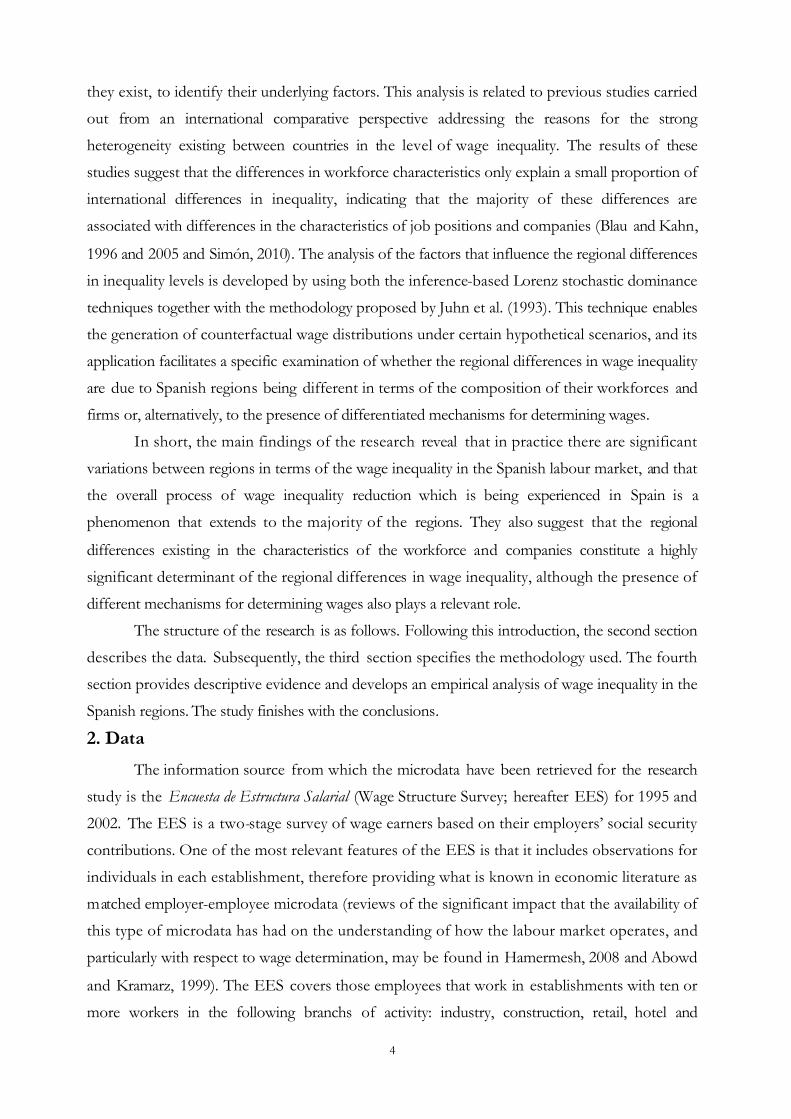
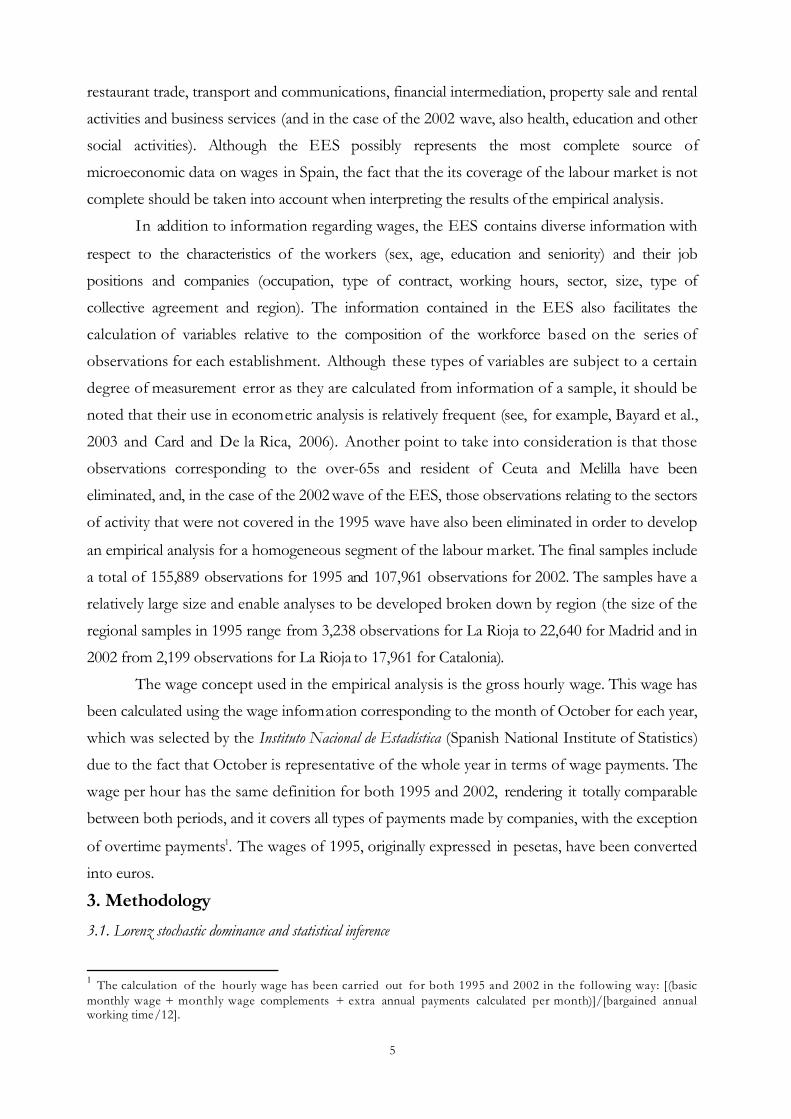
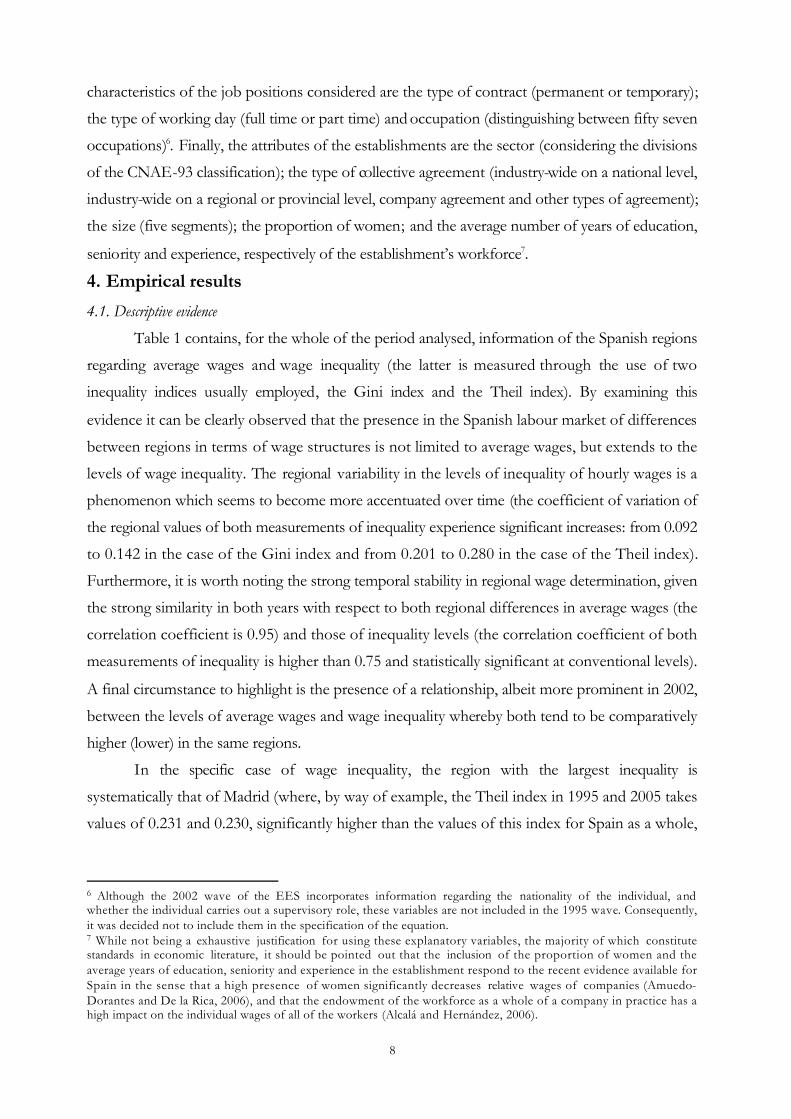
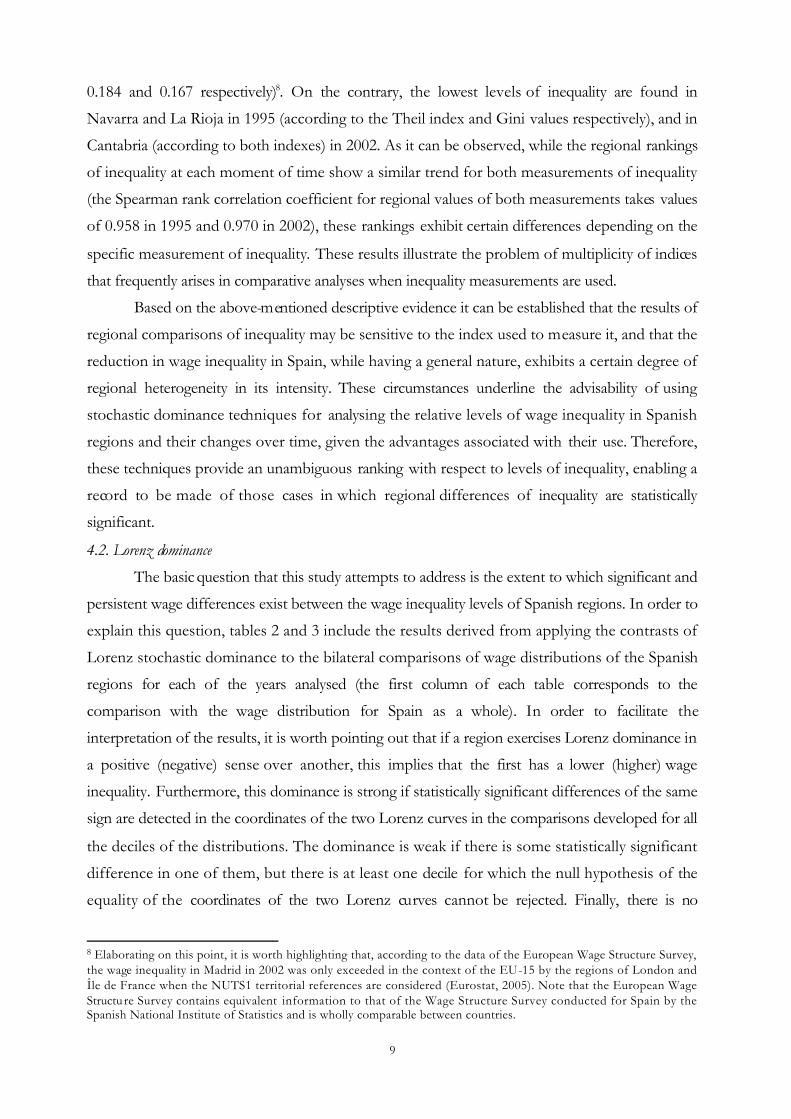
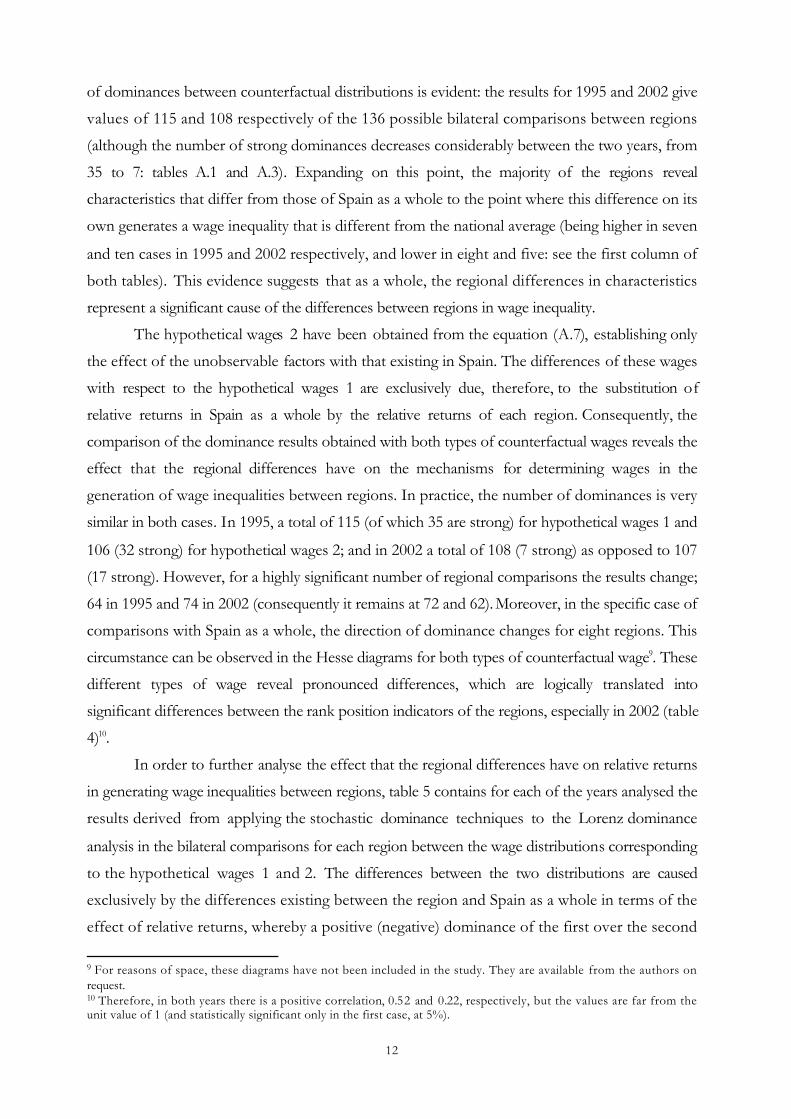
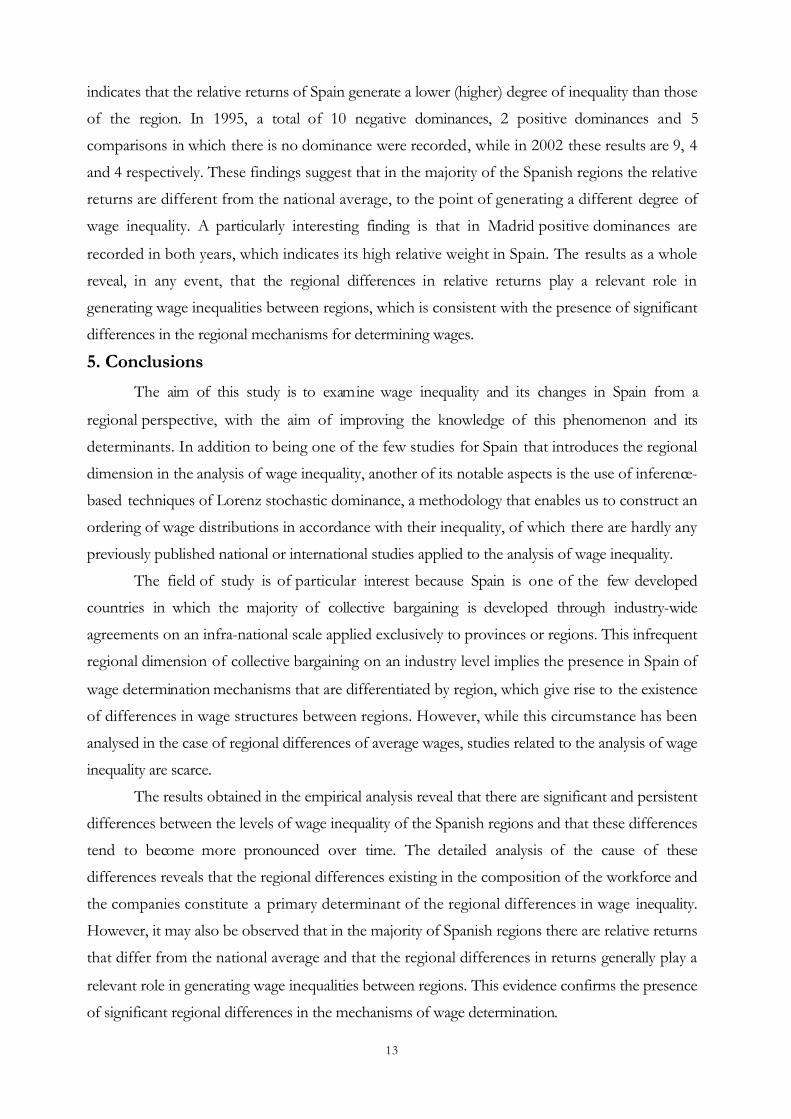
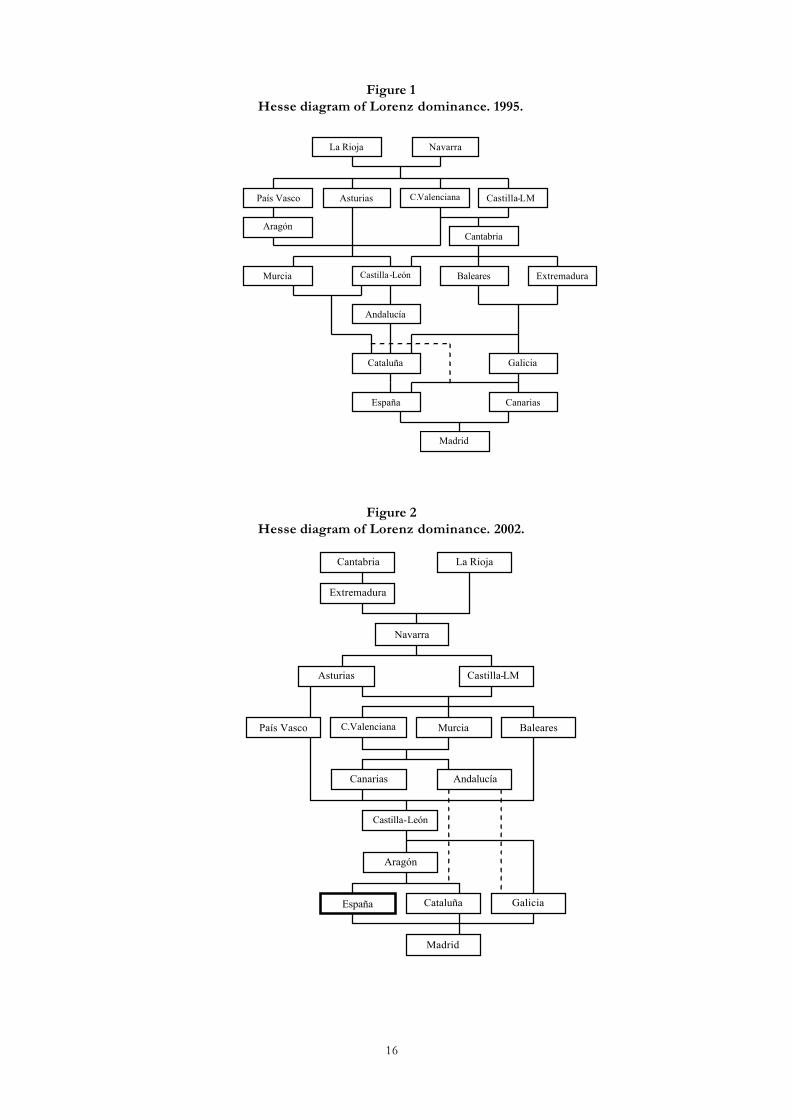
Figures 1 and 2 contain the Hesse diagrams for the regional wage distributions (together
with that of Spain as a whole) for 1995 and 2002 respectively. These diagrams represent a ranking
of the distributions in accordance with their inequality, whereby those territories that occupy a
higher position have a lower wage inequality. The presence of a continuous line between the boxes
of two territories corresponds to a situation in which, according to the stochastic dominance
comparisons, the territory with a higher position Lorenz dominates the other (either weak or
strong dominance) and therefore, has a lower wage inequality. Furthermore, with a continuous line
all of the dominances that are transmitted flowing down from the lines that intersect it are taken
into account. A discontinuous line implies that there is dominance between the two territories that
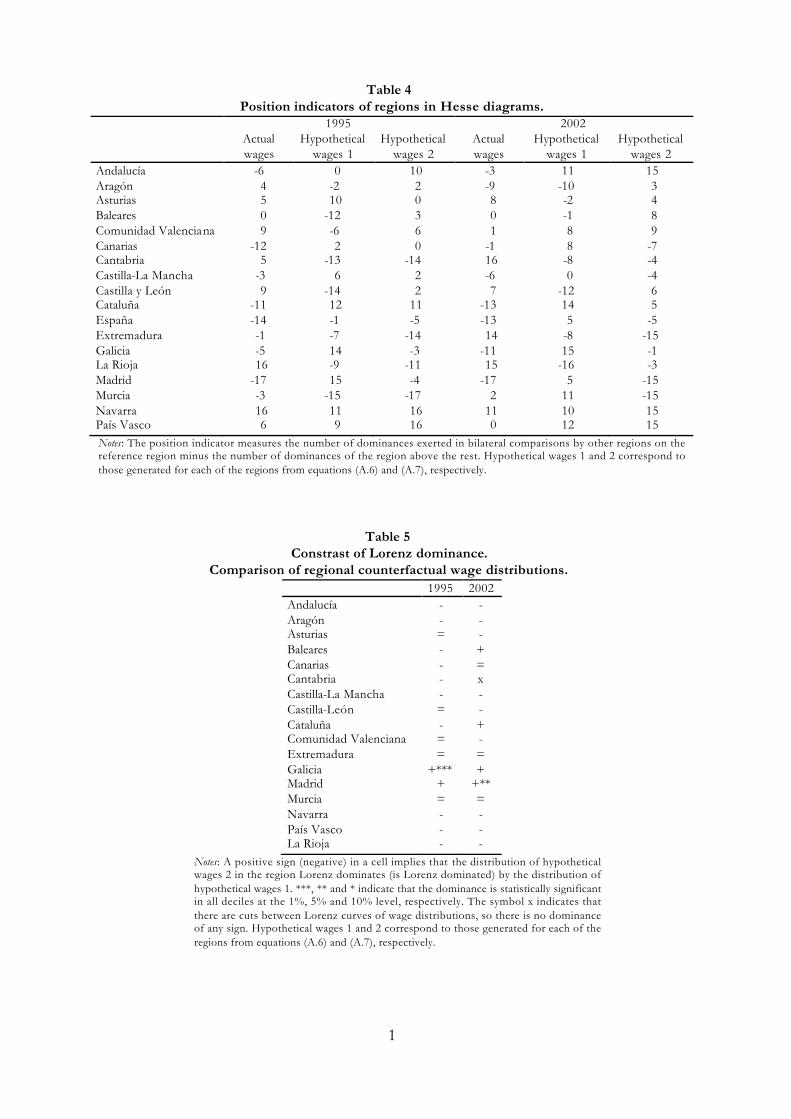
it connects, but intersection with other lines does not imply dominance. Finally, table 4 illustrates
an indicator with which the position of each region in the Hesse diagram is determined, and which
corresponds to the number of dominances of the region of reference over the rest of the regions
less the number of dominances of the other regions over the region of reference.
The Hesse diagrams reveal that, in practice, there are many Lorenz dominances between
regions, a circumstance that confirms that the levels of wage inequality of Spanish regions are not
similar and exhibit considerable differences. Likewise, irrespective of the year of reference, regions
such as Catalonia, Galicia and Madrid reveal a trend of comparatively high inequality levels while,
on the contrary, La Rioja or Navarra possess a comparatively low wage inequality. These results
are consistent, in turn, with the values of the synthetic rank position indicators for each region in
the diagrams (table 4). Focusing on the comparison with Spain as a whole, one result worth
mentioning is that it can be concluded that Madrid is the only Spanish region that has levels of
wage inequality that are higher than the national average, with the opposite scenario applying to
the majority of the other regions. This finding suggests that the wage inequality existing in Spain as
a whole is highly influenced by the specific case of Madrid, which can be plausibly explained,
among other circumstances, by its high relative demographic weight.
The detailed results of the stochastic dominance comparisons included in tables 2 and 3
confirm that the differences in inequality existing between Spanish regions and the national
average (first column of the tables) are evident in a high proportion of cases (including that of the
comparison of Madrid with Spain) in the form of strong dominance of one distribution over
another, being statistically significant at 1%. Nevertheless, it should be noted that the number of
dominances in the comparisons between regions is much higher, especially in the case of strong
dominances, in 2002 (for which 51 bilateral comparisons reveal weak dominances; 54 strong
dominances with a level of significance of at least 10% and 21 comparisons no dominances) than
11
in 1995 (for which 59 of the 136 bilateral comparisons reveal weak dominances; 39 strong
dominance and no dominances are found in 38 comparisons). This result confirms that the
differences between regions in terms of wage inequality levels tend to become more intense over
time.
In some regions significant changes in relative levels of wage inequality are detected.
Aragon, for example, in 1995 was among the regions with the lowest levels of inequality and in
2002 it had become one of the regions with highest inequality. From having an intermediate level
of inequality, Cantabria and Extremadura became regions with some of the lowest levels of
inequality and the Canary Islands became a region with an intermediate level of inequality in 2002
after having a comparatively high level in 1995. The rank position indicators of the regions in the
Hesse diagrams for both years reveal however, a positive and statistically significant correlation
(also taking into consideration Spain in the comparison, the Spearman Rank correlation coefficient
takes a value of 0.76, being statistically significant at 1%), which suggests that on the whole there is
relatively stable ranking of the Spanish regions in accordance with their levels of inequality.
Overall, the findings reveal that there are significant and persistent wage differences
between the wage inequality levels of Spanish regions, and that these differences tend to become
more pronounced over time. The next step in the analysis is concerned with identifying the factors
that underlie these differences and more specifically, the extent to which they are caused by inter-
regional differences in terms of the characteristics of the workers and companies or, alternatively
by inter-regional differences in the relative returns of these factors.
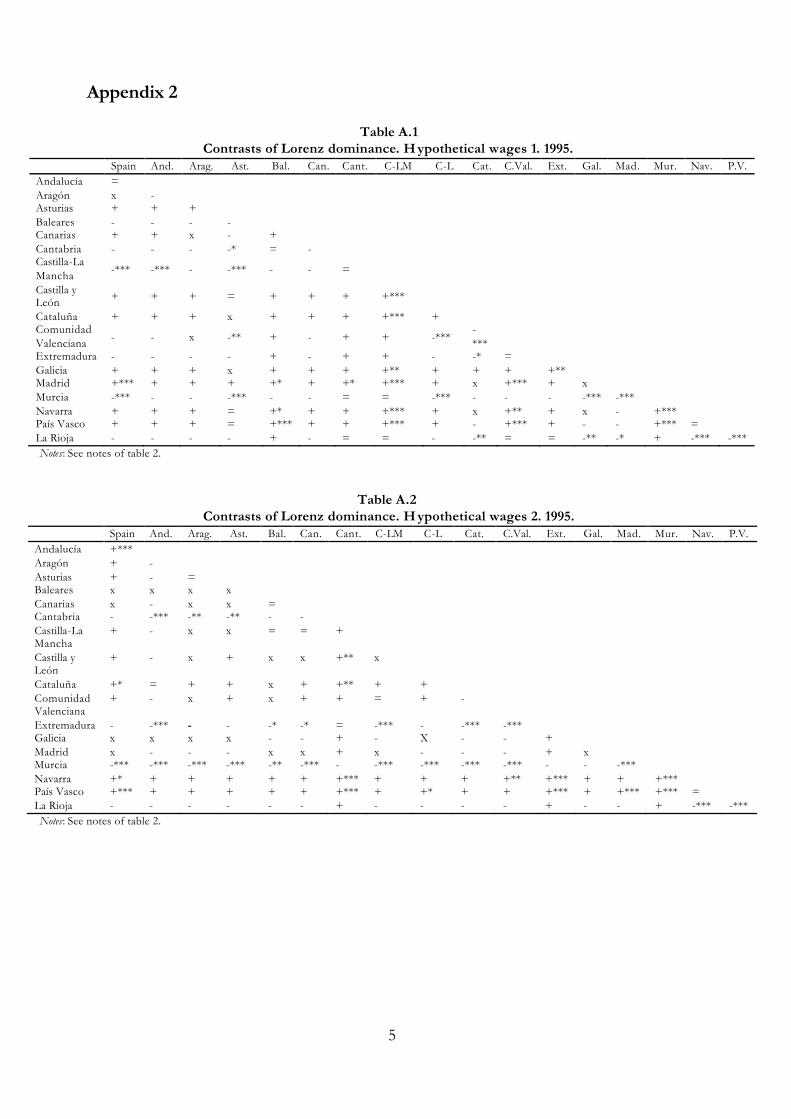
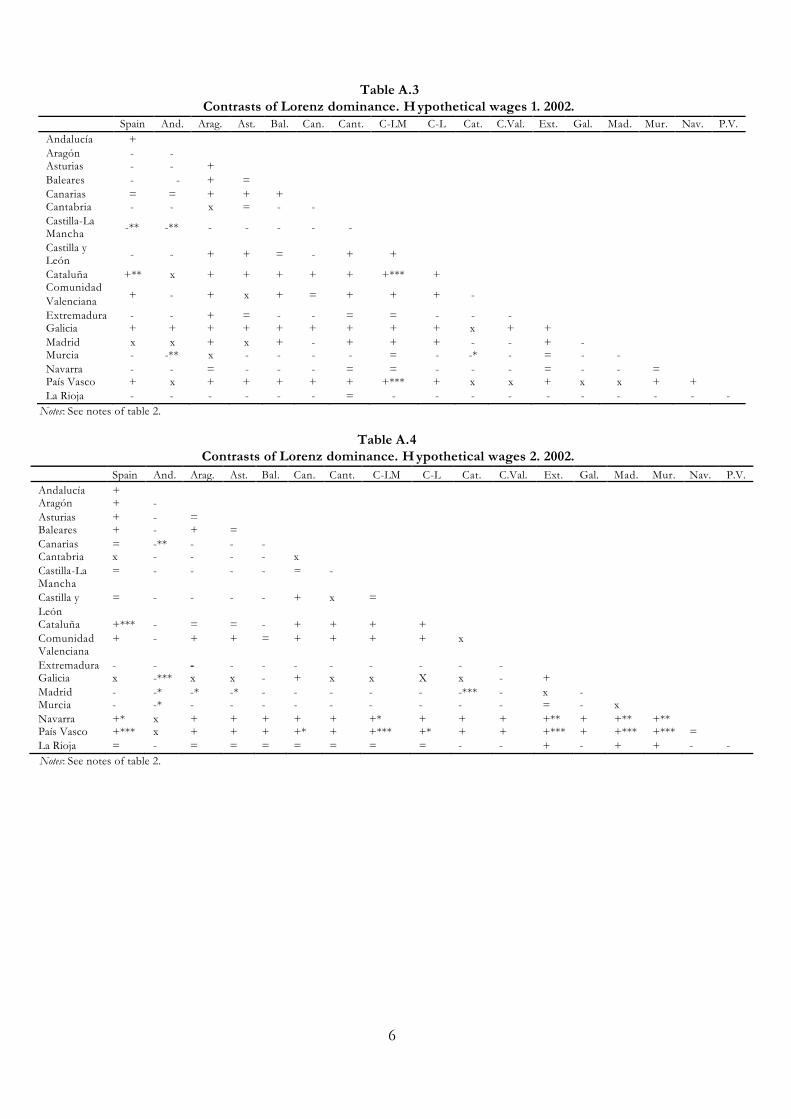
Tables A.1 to A.4 of Appendix 2 show the results of applying stochastic dominance
techniques to the analysis of the Lorenz dominance between the regional wage distributions
corresponding to the two types of counterfactual wages generated with the technique proposed by
Juhn et al. (1993). These tables also include the results of the bilateral comparisons of the
counterfactual distributions between all the regions and those of the comparison of each of them
with that of Spain as a whole (note that the latter case is equivalent to the comparison with the
wage distribution observed for Spain, given that this is the reference taken in the generation of
counterfactual wages).
The hypothetical wages 1, as referred to herein, have been obtained for each region from
the equation (A.6), which implies the application of the returns of the characteristics and the effect
of the unobservable factors of Spain on the characteristics of the individuals and companies in
each region. The differences between regions in terms of the distributions of hypothetical wages 1
therefore are exclusively due to their differences in characteristics, so the results of the
comparisons in this case are indicative of the effect of this factor in the generation of regional
differences in wage inequality. In relation to this point, the existence of a highly significant number
12
of dominances between counterfactual distributions is evident: the results for 1995 and 2002 give
values of 115 and 108 respectively of the 136 possible bilateral comparisons between regions
(although the number of strong dominances decreases considerably between the two years, from
35 to 7: tables A.1 and A.3). Expanding on this point, the majority of the regions reveal
characteristics that differ from those of Spain as a whole to the point where this difference on its
own generates a wage inequality that is different from the national average (being higher in seven
and ten cases in 1995 and 2002 respectively, and lower in eight and five: see the first column of
both tables). This evidence suggests that as a whole, the regional differences in characteristics
represent a significant cause of the differences between regions in wage inequality.
The hypothetical wages 2 have been obtained from the equation (A.7), establishing only
the effect of the unobservable factors with that existing in Spain. The differences of these wages
with respect to the hypothetical wages 1 are exclusively due, therefore, to the substitution of
relative returns in Spain as a whole by the relative returns of each region. Consequently, the
comparison of the dominance results obtained with both types of counterfactual wages reveals the
effect that the regional differences have on the mechanisms for determining wages in the
generation of wage inequalities between regions. In practice, the number of dominances is very
similar in both cases. In 1995, a total of 115 (of which 35 are strong) for hypothetical wages 1 and
106 (32 strong) for hypothetical wages 2; and in 2002 a total of 108 (7 strong) as opposed to 107
(17 strong). However, for a highly significant number of regional comparisons the results change;
64 in 1995 and 74 in 2002 (consequently it remains at 72 and 62). Moreover, in the specific case of
comparisons with Spain as a whole, the direction of dominance changes for eight regions. This
circumstance can be observed in the Hesse diagrams for both types of counterfactual wage9. These
different types of wage reveal pronounced differences, which are logically translated into
significant differences between the rank position indicators of the regions, especially in 2002 (table
4)10.
In order to further analyse the effect that the regional differences have on relative returns
in generating wage inequalities between regions, table 5 contains for each of the years analysed the
results derived from applying the stochastic dominance techniques to the Lorenz dominance
analysis in the bilateral comparisons for each region between the wage distributions corresponding
to the hypothetical wages 1 and 2. The differences between the two distributions are caused
exclusively by the differences existing between the region and Spain as a whole in terms of the
effect of relative returns, whereby a positive (negative) dominance of the first over the second
9 For reasons of space, these diagrams have not been included in the study. They are available from the authors on request. 10 Therefore, in both years there is a positive correlation, 0.52 and 0.22, respectively, but the values are far from the unit value of 1 (and statistically significant only in the first case, at 5%).
13
indicates that the relative returns of Spain generate a lower (higher) degree of inequality than those
of the region. In 1995, a total of 10 negative dominances, 2 positive dominances and 5
comparisons in which there is no dominance were recorded, while in 2002 these results are 9, 4
and 4 respectively. These findings suggest that in the majority of the Spanish regions the relative
returns are different from the national average, to the point of generating a different degree of
wage inequality. A particularly interesting finding is that in Madrid positive dominances are
recorded in both years, which indicates its high relative weight in Spain. The results as a whole
reveal, in any event, that the regional differences in relative returns play a relevant role in
generating wage inequalities between regions, which is consistent with the presence of significant
differences in the regional mechanisms for determining wages.
5. Conclusions
The aim of this study is to examine wage inequality and its changes in Spain from a
regional perspective, with the aim of improving the knowledge of this phenomenon and its
determinants. In addition to being one of the few studies for Spain that introduces the regional
dimension in the analysis of wage inequality, another of its notable aspects is the use of inference-
based techniques of Lorenz stochastic dominance, a methodology that enables us to construct an
ordering of wage distributions in accordance with their inequality, of which there are hardly any
previously published national or international studies applied to the analysis of wage inequality.
The field of study is of particular interest because Spain is one of the few developed
countries in which the majority of collective bargaining is developed through industry-wide
agreements on an infra-national scale applied exclusively to provinces or regions. This infrequent
regional dimension of collective bargaining on an industry level implies the presence in Spain of
wage determination mechanisms that are differentiated by region, which give rise to the existence
of differences in wage structures between regions. However, while this circumstance has been
analysed in the case of regional differences of average wages, studies related to the analysis of wage
inequality are scarce.
The results obtained in the empirical analysis reveal that there are significant and persistent
differences between the levels of wage inequality of the Spanish regions and that these differences
tend to become more pronounced over time. The detailed analysis of the cause of these
differences reveals that the regional differences existing in the composition of the workforce and
the companies constitute a primary determinant of the regional differences in wage inequality.
However, it may also be observed that in the majority of Spanish regions there are relative returns
that differ from the national average and that the regional differences in returns generally play a
relevant role in generating wage inequalities between regions. This evidence confirms the presence
of significant regional differences in the mechanisms of wage determination.
14
References
Ahamdanech, C.; García, C. (2007): "Welfare, Inequality and Poverty Rankings in the European Union using an Inference-based Stochastic Dominance Approach", en Bishop J. y Y. Amiel (eds.) Research On Economic Inequality (Vol. 14): Inequality and Poverty, ed. Elsevier JAI.
Alonso, J.; Izquierdo, M. (1999): “Disparidades regionales en el empleo y el desempleo”, Papeles de Economía Española, nº 80, pp. 79-98.
Abowd, J.M.; Kramarz, F. (1999): “The Analysis of Labour Markets Using Matched Employer-Employee Data”, in O. Ashenfelter and D. Card (ed.) Handbook of Labour Economics , ed. North -Holland.
Ahn, N.; Izquierdo, M.; Jimeno, J.F. (2001): “El componente demográfico de la desigualdad salarial: diferencias entre Comunidades Autónomas españolas”, Fundación Caixa Galicia, Documento de Economía nº 10.
Alcalá, F.; Hernández, P.J. (2006): “Las externalidades del capital humano en la empresa española”, Revista de Economía Aplicada, nº 41 (vol. XIV), pp. 61-83.
Amuedo-Dorantes, C.; De la Rica, S. (2006): “The Role of Segregation and Pay Structure on the Gender Wage Gap: Evidence from Matched Employer-Employee Data for Spain”, Contributions to Economic Analysis & Policy, 5(1), pp. 1-32.
Atkinson, A.B. (1970): “On the Measurement of Inequality”, Journal of Economic Theory, 2(3), pp. 244-263.Bande, R.; Fernández, M.; Montuenga, V. (2008): “Regional unemployment in Spain: Disparities, business
cycle and wage setting”, Labour Economics , vol. 15(5), pp. 885-914.Bayard, K.; Hellerstein, J.; Neumark, D. y Troske, K. (2003): “New evidence on sex segregation and sex
differences in wages from matched employee-employer data”, Journal of Labor Economics, vol. 21, nº 4, pp.887-922.
Beach, C.M.; Davidson, R. (1983): “Distribution-free statistical inference with Lorenz curves and income shares”, Review of Economic Studies, 50, pp. 723-735.
Beach, C.M.; Chow, K.V.; Formby, J.P.; Slotsve, G.A. (1994): “Statistical inference for decile means”, Economic Letters, 45 (2), pp. 161-167.
Bentolila, S.; Dolado, J.J. (1991): “Mismatch and internal migration in Spain, 1962-1986”, en F. Padoa-Schioppa (ed.), Mismatch and labour mobility, ed. Cambridge University Press.
Bentolila, S.; Jimeno, J.F. (1998): “Regional Unemployment Persistence (Spain, 1976-1994)”, Labour Economics, vol. 5(1), pp. 25-51.
Blau, F.D.; Kahn, L.M. (1996): “International Differences in Male Wage Inequality: Institutions versus Market Forces”, Journal of Political Economy, 101(4), pp. 791-837.
Blau, F.D. y Kahn, L.M. (1999): “Institutions and Laws in the Labor Market”, en O. Ashenfelter y D. Card (ed.) Handbook of Labor Economics, ed. North-Holland.
Blau, F.D.; Kahn, L.M. (2005): “Do cognitive test scores explain higher US wage inequality?”, The Review of Economics and Statistics, 87(1), pp. 184-193.
Bishop, J.A.; Formby, J.P.; Thistle, P.D (1989): “Statistical inference, income Distributions and social welfare”, en D.J. Slotje (ed.), Research on Economic Inequality, Vol.1, Greenwich, CN: JAI Press.
Bishop, J.A.; Formby, J.P.; Thistle, P.D (1991): “Rank dominance and international comparisons of income distribution”, European Economic Review, 35, pp. 1399-1409.
Bishop, J.A.; Formby, J.P.; Thistle, P.D (1994). “A dominance evaluation of distribution of income and the benefits of economic growth in the Unites States”, en Bergstrand, J., T. Cosimano y R.G. Sheehan (eds.), The changing distribution of income in an open U.S. economy, North Holland, 69-109.
Bishop, J.A.; Formby, J.P.; Thistle, P.D.(1997): “Changing American Earnings Distributions: One-Half Century of Experience”, Empirical Economics, 22(4), págs 501-514.
Bover, O.; Velilla, P. (2005): “Migrations in Spain: Historical Background and Current Trends”, en K. Zimmerman (ed.) European Migration. What Do We Know?, ed. Oxford University Press.
Card, D.; De la Rica, S. (2006): “Firm-level Contracting and the Structure of Wages”, Industrial and Labor Relations Review, vol. 59 (4), pp. 573-593.
Del Río, C.; Ruiz Castillo, J. (1996): “Ordenaciones de bienestar e inferencia estadística. El caso de las EPF de 1980-81 y 1990-91”, en La desigualdad de recursos. II Simposio sobre Igualdad y Distribución de la Renta y la Riqueza, Fundación Argentaria, Colección Igualdad, vol. 6, pp. 9-44.
Du Caju, P.; Gautier, E.; Momferatou, D.; Ward-Warmedinger, M. (2008): “Institutional features of wage bargaining in 23 European countries, the US and Japan”, ECB Working Paper No 974.
15
El-Attar, M.; López-Bazo, E. (2006): “Heterogeneidad en las distribuciones salariales entre las regiones españolas”, Papeles de Economía Española, 107, pp. 214-230.
Eurostat (2005): Employment in Europe. 2005.García, I.; Molina, J.A. (2002): “Inter-regional wage differentials in Spain”, Applied Economics Letters, 9, pp.
209-215. Hamermesh, D. (2008): “Fun with matched firm-employee data: Progress and road maps”, Labour
Economics, vol. 15(4), pp. 662-672.Izquierdo, M.; Lacuesta, A. (2006): “Wage inequality in Spain: Recent developments”, Documento de
Trabajo del Banco de España Nº 0615.Jimeno, J.F., Izquierdo, M.; Hernanz, V. (2001): “La desigualdad salarial en España: Descomposición y
variación por niveles de salarios”, Papeles de Economía Española, nº 88, pp. 113-125.Juhn, C., Murphy, K.; Pierce, B. (1993): “Wage inequality and the rise in returns to skill”, Journal of Political
Economy 101, 31, pp. 410-442.Katz, L.F. y Autor, D.H. (1999): “Changes in the Wage Structure and Earnings Inequality”, en O.
Ashenfelter y D. Card (ed.) Handbook of Labor Economics , ed. North -Holland.López-Bazo, E.; Motellón, E. (2009): “Human Capital and Regional Wage Gaps”, Documents de Treball
IREA, Nº. 24, 2009Palacio, J.I. y Simón, H. (2004): “Dispersión salarial entre establecimientos y desigualdad salarial en
España”, Revista de Economía Aplicada, Vol. XII(36), págs 47-81.Serrano, L. (2002): “Salarios regionales y dotaciones de capital humano”, Revista de Economía Aplicada, 28, pp.
23-38.Simón, H.; Ramos, R.; Sanromá, E. (2006): “Collective bargaining and regional wage differences in Spain:
An empirical analysis”, Applied Economics, 38, pp. 1749–1760.Simón, H. (2009): “La desigualdad salarial en España: Una perspectiva internacional y temporal”,
Investigaciones Económicas, vol. XXXIII(3), pp. 439-471.Simón, H. (2010): “International Differences in Wage Inequality: A New Glance with European Matched
Employer-Employee Data”, British Journal of Industrial Relations, 48(2), pp. 310-346.Stoline, M.R.; Ury, H.K. (1979): “Tables of the Studentized Maximum Modulus Distributions and an
Application to Multiple Comparisons Among Means”, Technometrics, 21, pp. 87-93.Vamvakidis, A. (2008): “Regional Wage Differentiation and Wage Bargaining Systems in the EU”, IMF
Working Paper 08/43.
16
Figure 1Hesse diagram of Lorenz dominance. 1995.
Aragón
AsturiasPaís Vasco
Cantabria
Baleares
Navarra
Madrid
Cataluña
España
C.ValencianaValenciana
Castilla-León
Galicia
Andalucía
Murcia
La Rioja
Canarias
Castilla-LM
Extremadura
Figure 2Hesse diagram of Lorenz dominance. 2002.
Aragón
Asturias
País Vasco
Cantabria
Baleares
Navarra
Madrid
CataluñaEspaña
C.Valenciana
Castilla-León
Galicia
Andalucía
Murcia
La Rioja
Canarias
Castilla-LM
Extremadura
17
Table 1Average wages and wage inequality in Spanish regions.
1995 2002Average
wage(euros)
Giniindex
Theilindex
Average wage
(euros)
Giniindex
Theilindex
Spain 8,25 0,317 0,184 9,46 0,297 0,167Andalucía 8,32 0,305 0,161 9,53 0,304 0,175Aragón 7,91 0,291 0,153 9,61 0,269 0,135Asturias 7,79 0,284 0,142 8,46 0,248 0,113Baleares 7,50 0,310 0,211 8,74 0,267 0,150Canarias 7,26 0,339 0,222 8,34 0,291 0,167Cantabria 7,09 0,278 0,140 7,58 0,208 0,086Castilla-La Mancha 6,91 0,295 0,164 7,98 0,264 0,135Castilla y León 7,92 0,298 0,154 8,93 0,282 0,144Cataluña 9,27 0,315 0,178 10,68 0,300 0,164Comunidad Valenciana 7,51 0,288 0,154 8,91 0,270 0,140Extremadura 6,32 0,314 0,182 6,64 0,224 0,102Galicia 7,06 0,313 0,186 8,59 0,308 0,195Madrid 10,34 0,355 0,231 11,11 0,350 0,230Murcia 6,25 0,283 0,150 7,53 0,245 0,126Navarra 8,01 0,251 0,115 9,76 0,226 0,094País Vasco 9,62 0,273 0,133 11,20 0,249 0,110La Rioja 6,54 0,249 0,126 7,96 0,215 0,095Coefficient of variation 0,154 0,092 0,201 0,150 0,142 0,280
25
Table 2Contrasts of Lorenz dominance. 1995.
Spain And. Arag. Ast. Bal. Can. Cant. C-LM C-L Cat. C.Val. Ext. Gal. Mad. Mur. Nav. P.V.
Andalucía +***Aragón +*** +Asturias +*** + =Baleares + x x xCanarias x x - - -Cantabria +*** + x x + +Castilla-La Mancha +*** + x x + +*** +Castilla y León +*** + - - x + - xCataluña + - -*** -*** - x - - -***Comunidad Valenciana +*** + x x + +*** + = + +***Extremadura + x x x = + - - X + -Galicia + x x x - + - - X x - -Madrid -*** -*** -*** -*** - - -*** -*** -*** -*** -*** - -**Murcia + x - - x + x - X + - x x +***Navarra +*** +*** +*** +*** +*** +*** +*** +*** +*** +*** +*** +*** +*** +*** +***País Vasco +*** + + = x + x x + +*** x x x +*** + -***La Rioja +*** + + + +*** +*** + + + +*** + +*** +*** +*** + x +
Notes: A positive (negative) sign in a cell implies that the wage distribution in the region of the row Lorenz dominates (is Lorenz dominated) to the region of the spine. ***, ** and * indicate that the dominance is statistically significant in all deciles at the 1%, 5% and 10% level, respectively. The symbol x indicates that there are cuts between Lorenz curves of wage distributions, so there is no dominance of any sign.
Table 3
Contrasts of Lorenz dominance. 2002.
Spain And. Arag. Ast. Bal. Can. Cant. C-LM C-L Cat. C.Val. Ext. Gal. Mad. Mur. Nav. P.V.
Andalucía +*Aragón + xAsturias +*** + +***Baleares +** = + -Canarias + = x - =Cantabria +*** +*** +*** +*** +*** +***Castilla-La Mancha +*** +*** + x + +** -**Castilla y León +*** x + - - - -*** -Cataluña x - -** -*** - - -*** -*** -***Comunidad Valenciana +*** + + - = = -*** - + +Extremadura +*** +*** +** + +*** +*** - +** +*** +*** +***Galicia x - x - - - -*** -*** - x - -***Madrid -*** -*** -*** -*** -*** -*** -*** -*** -*** -*** -*** -*** -Murcia +*** + + - = + -*** - + +** x -** + +***Navarra +*** +*** +*** + +*** +*** - + +*** +*** +*** - +*** +*** +*País Vasco +*** x + - x x - x + +*** x - x + x -La Rioja +*** +*** +** + +*** +*** = + +*** +*** +*** = +*** +*** +** + +
Notes: See notes of table 2.
1
Table 4Position indicators of regions in Hesse diagrams.
1995 2002Actual wages
Hypothetical wages 1
Hypothetical wages 2
Actual wages
Hypothetical wages 1
Hypothetical wages 2
Andalucía -6 0 10 -3 11 15Aragón 4 -2 2 -9 -10 3Asturias 5 10 0 8 -2 4Baleares 0 -12 3 0 -1 8Comunidad Valenciana 9 -6 6 1 8 9Canarias -12 2 0 -1 8 -7Cantabria 5 -13 -14 16 -8 -4Castilla-La Mancha -3 6 2 -6 0 -4Castilla y León 9 -14 2 7 -12 6Cataluña -11 12 11 -13 14 5España -14 -1 -5 -13 5 -5Extremadura -1 -7 -14 14 -8 -15Galicia -5 14 -3 -11 15 -1La Rioja 16 -9 -11 15 -16 -3Madrid -17 15 -4 -17 5 -15Murcia -3 -15 -17 2 11 -15Navarra 16 11 16 11 10 15País Vasco 6 9 16 0 12 15
Notes: The position indicator measures the number of dominances exerted in bilateral comparisons by other regions on the reference region minus the number of dominances of the region above the rest. Hypothetical wages 1 and 2 correspond to those generated for each of the regions from equations (A.6) and (A.7), respectively.
Table 5Constrast of Lorenz dominance.
Comparison of regional counterfactual wage distributions.
1995 2002
Andalucía - -Aragón - -Asturias = -Baleares - +Canarias - =Cantabria - xCastilla-La Mancha - -Castilla-León = -Cataluña - +Comunidad Valenciana = -Extremadura = =Galicia +*** +Madrid + +**Murcia = =Navarra - -País Vasco - -La Rioja - -
Notes: A positive sign (negative) in a cell implies that the distribution of hypothetical wages 2 in the region Lorenz dominates (is Lorenz dominated) by the distribution of hypothetical wages 1. ***, ** and * indicate that the dominance is statistically significant in all deciles at the 1%, 5% and 10% level, respectively. The symbol x indicates that there are cuts between Lorenz curves of wage distributions, so there is no dominance of any sign. Hypothetical wages 1 and 2 correspond to those generated for each of the regions from equations (A.6) and (A.7), respectively.
2
Appendix 1
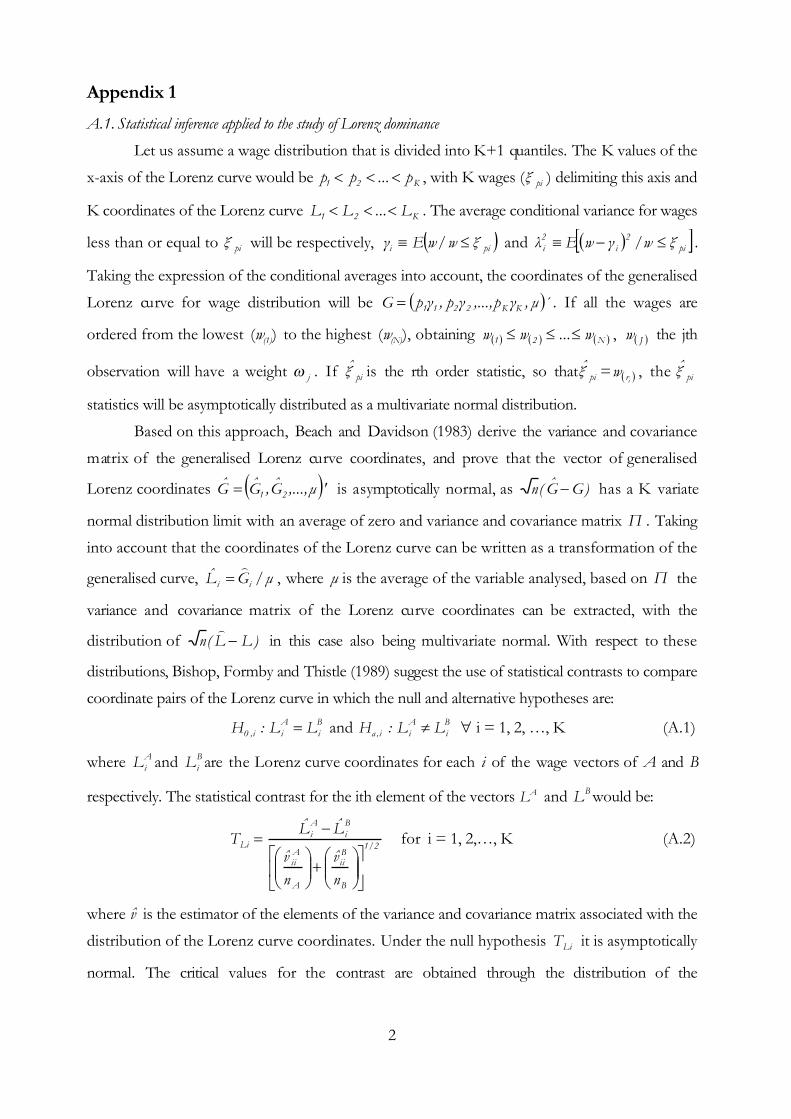
A.1. Statistical inference applied to the study of Lorenz dominance
Let us assume a wage distribution that is divided into K+1 quantiles. The K values of the
x-axis of the Lorenz curve would be K21 p...pp , with K wages ( piξ ) delimiting this axis and
K coordinates of the Lorenz curve K21 L...LL . The average conditional variance for wages
less than or equal to piξ will be respectively, pii ξw/wEγ and pi2
i2i ξw/γwEλ .
Taking the expression of the conditional averages into account, the coordinates of the generalised
Lorenz curve for wage distribution will be μ,γp,...,γp,γpG KK2211 . If all the wages are
ordered from the lowest (w(1)) to the highest (w(N)), obtaining N21 w...ww , Jw the jth
observation will have a weight j . If piξ is the rth order statistic, so that piξ = irw , the piξ
statistics will be asymptotically distributed as a multivariate normal distribution.
Based on this approach, Beach and Davidson (1983) derive the variance and covariance
matrix of the generalised Lorenz curve coordinates, and prove that the vector of generalised
Lorenz coordinates 'μ,...,G,GG 21 is asymptotically normal, as )GG(n has a K variate
normal distribution limit with an average of zero and variance and covariance matrix Π . Taking
into account that the coordinates of the Lorenz curve can be written as a transformation of the
generalised curve, μ/GL ii
, where μ is the average of the variable analysed, based on Π the
variance and covariance matrix of the Lorenz curve coordinates can be extracted, with the
distribution of )LL(n
in this case also being multivariate normal. With respect to these
distributions, Bishop, Formby and Thistle (1989) suggest the use of statistical contrasts to compare
coordinate pairs of the Lorenz curve in which the null and alternative hypotheses are:
Bi
Aii,0 LL:H and B
iAii,a LL:H i = 1, 2, …, K (A.1)
where AiL and B
iL are the Lorenz curve coordinates for each i of the wage vectors of A and B
respectively. The statistical contrast for the ith element of the vectors AL and BL would be:
2/1
B
Bii
A
Aii
Bi
Ai
Li
n
v
n
v
LLT
for i = 1, 2,…, K (A.2)
where v is the estimator of the elements of the variance and covariance matrix associated with the
distribution of the Lorenz curve coordinates. Under the null hypothesis LiT it is asymptotically
normal. The critical values for the contrast are obtained through the distribution of the
3
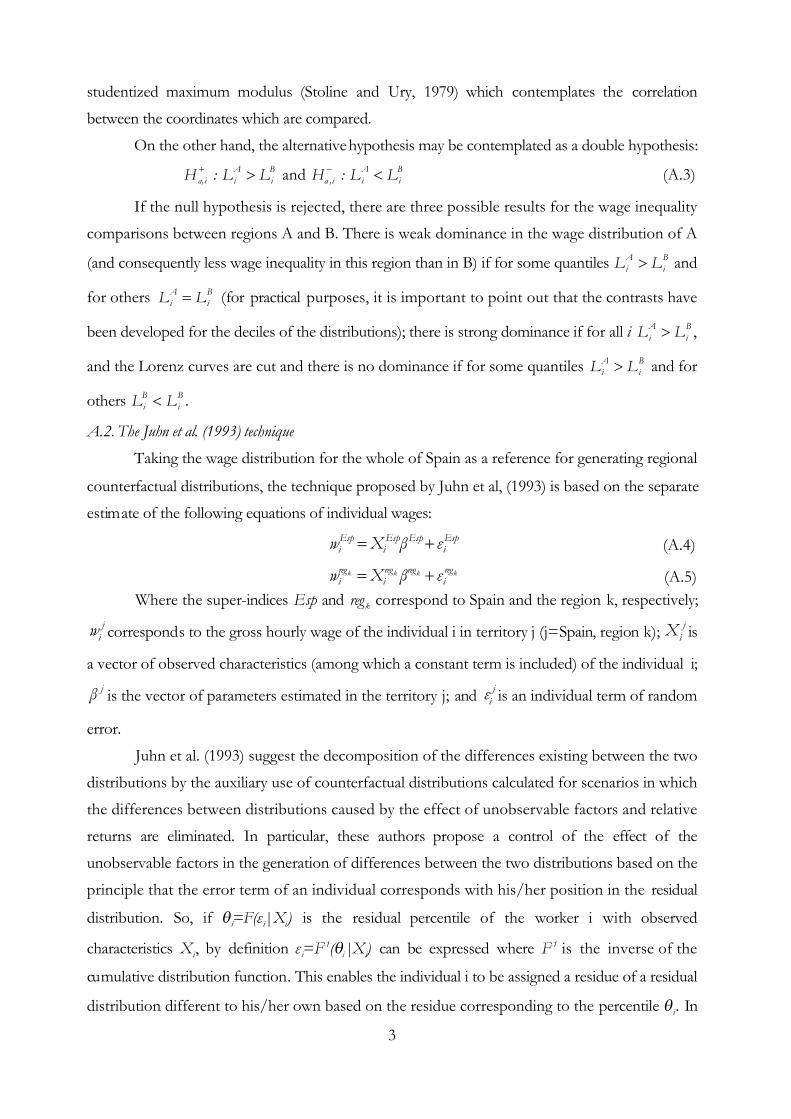
studentized maximum modulus (Stoline and Ury, 1979) which contemplates the correlation
between the coordinates which are compared.
On the other hand, the alternativehypothesis may be contemplated as a double hypothesis:
Bi
Aii,a LL:H and B
iAii,a LL:H (A.3)
If the null hypothesis is rejected, there are three possible results for the wage inequality
comparisons between regions A and B. There is weak dominance in the wage distribution of A
(and consequently less wage inequality in this region than in B) if for some quantiles Bi
Ai LL and
for others Bi
Ai LL (for practical purposes, it is important to point out that the contrasts have
been developed for the deciles of the distributions); there is strong dominance if for all i Bi
Ai LL ,
and the Lorenz curves are cut and there is no dominance if for some quantiles Bi
Ai LL and for
others Bi
Bi LL .
A.2. The Juhn et al. (1993) technique
Taking the wage distribution for the whole of Spain as a reference for generating regional
counterfactual distributions, the technique proposed by Juhn et al, (1993) is based on the separate
estimate of the following equations of individual wages:
Espi
EspEspi
Espi εβXw (A.4)
kkkk regi
regregi
regi εβXw (A.5)
Where the super-indices Esp and regk correspond to Spain and the region k, respectively;
jiw corresponds to the gross hourly wage of the individual i in territory j (j=Spain, region k);
jiX is
a vector of observed characteristics (among which a constant term is included) of the individual i;
jβ is the vector of parameters estimated in the territory j; andj
iε is an individual term of random
error.
Juhn et al. (1993) suggest the decomposition of the differences existing between the two
distributions by the auxiliary use of counterfactual distributions calculated for scenarios in which
the differences between distributions caused by the effect of unobservable factors and relative
returns are eliminated. In particular, these authors propose a control of the effect of the
unobservable factors in the generation of differences between the two distributions based on the
principle that the error term of an individual corresponds with his/her position in the residual
distribution. So, if i=F(εi|Xi) is the residual percentile of the worker i with observed
characteristics Xi, by definition εi=F-1(i|Xi) can be expressed where F-1 is the inverse of the
cumulative distribution function. This enables the individual i to be assigned a residue of a residual
distribution different to his/her own based on the residue corresponding to the percentile i. In
4
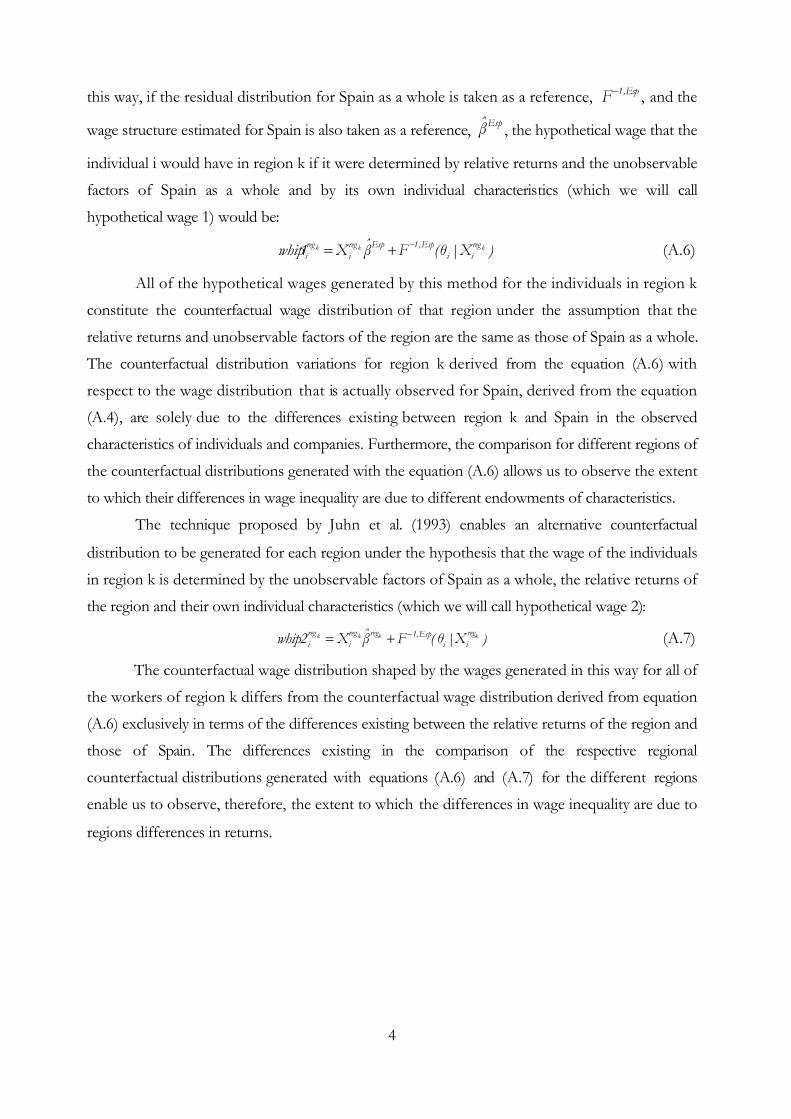
this way, if the residual distribution for Spain as a whole is taken as a reference, Esp,1F , and the
wage structure estimated for Spain is also taken as a reference, Espβ , the hypothetical wage that the
individual i would have in region k if it were determined by relative returns and the unobservable
factors of Spain as a whole and by its own individual characteristics (which we will call
hypothetical wage 1) would be:
)X|θ(FβX1whip kkk regii
Esp,1Espregi
regi
(A.6)
All of the hypothetical wages generated by this method for the individuals in region k
constitute the counterfactual wage distribution of that region under the assumption that the
relative returns and unobservable factors of the region are the same as those of Spain as a whole.
The counterfactual distribution variations for region k derived from the equation (A.6) with
respect to the wage distribution that is actually observed for Spain, derived from the equation
(A.4), are solely due to the differences existing between region k and Spain in the observed
characteristics of individuals and companies. Furthermore, the comparison for different regions of
the counterfactual distributions generated with the equation (A.6) allows us to observe the extent
to which their differences in wage inequality are due to different endowments of characteristics.
The technique proposed by Juhn et al. (1993) enables an alternative counterfactual
distribution to be generated for each region under the hypothesis that the wage of the individuals
in region k is determined by the unobservable factors of Spain as a whole, the relative returns of
the region and their own individual characteristics (which we will call hypothetical wage 2):
)X|θ(FβX2whip kkkk reg
iiEsp,1regreg
i
reg
i (A.7)
The counterfactual wage distribution shaped by the wages generated in this way for all of
the workers of region k differs from the counterfactual wage distribution derived from equation
(A.6) exclusively in terms of the differences existing between the relative returns of the region and
those of Spain. The differences existing in the comparison of the respective regional
counterfactual distributions generated with equations (A.6) and (A.7) for the different regions
enable us to observe, therefore, the extent to which the differences in wage inequality are due to
regions differences in returns.
5
Appendix 2
Table A.1Contrasts of Lorenz dominance. H ypothetical wages 1. 1995.
Spain And. Arag. Ast. Bal. Can. Cant. C-LM C-L Cat. C.Val. Ext. Gal. Mad. Mur. Nav. P.V.
Andalucía =Aragón x -Asturias + + +Baleares - - - -Canarias + + x - +Cantabria - - - -* = -Castilla-La Mancha
-*** -*** - -*** - - =
Castilla y León
+ + + = + + + +***
Cataluña + + + x + + + +*** +Comunidad Valenciana
- - x -** + - + + -***-***
Extremadura - - - - + - + + - -* =Galicia + + + x + + + +** + + + +**Madrid +*** + + + +* + +* +*** + x +*** + xMurcia -*** - - -*** - - = = -*** - - - -*** -***Navarra + + + = +* + + +*** + x +** + x - +***País Vasco + + + = +*** + + +*** + - +*** + - - +*** =La Rioja - - - - + - = = - -** = = -** -* + -*** -***
Notes: See notes of table 2.
Table A.2Contrasts of Lorenz dominance. H ypothetical wages 2. 1995.
Spain And. Arag. Ast. Bal. Can. Cant. C-LM C-L Cat. C.Val. Ext. Gal. Mad. Mur. Nav. P.V.
Andalucía +***Aragón + -Asturias + - =Baleares x x x xCanarias x - x x =Cantabria - -*** -** -** - -Castilla-La Mancha
+ - x x = = +
Castilla y León
+ - x + x x +** x
Cataluña +* = + + x + +** + +Comunidad Valenciana
+ - x + x + + = + -
Extremadura - -*** - - -* -* = -*** - -*** -***Galicia x x x x - - + - X - - +Madrid x - - - x x + x - - - + xMurcia -*** -*** -*** -*** -** -*** - -*** -*** -*** -*** - - -***Navarra +* + + + + + +*** + + + +** +*** + + +***País Vasco +*** + + + + + +*** + +* + + +*** + +*** +*** =La Rioja - - - - - - + - - - - + - - + -*** -***
Notes: See notes of table 2.
6
Table A.3Contrasts of Lorenz dominance. H ypothetical wages 1. 2002.
Spain And. Arag. Ast. Bal. Can. Cant. C-LM C-L Cat. C.Val. Ext. Gal. Mad. Mur. Nav. P.V.
Andalucía +Aragón - -Asturias - - +Baleares - - + =Canarias = = + + +Cantabria - - x = - -Castilla-La Mancha
-** -** - - - - -
Castilla y León
- - + + = - + +
Cataluña +** x + + + + + +*** +Comunidad Valenciana
+ - + x + = + + + -
Extremadura - - + = - - = = - - -Galicia + + + + + + + + + x + +Madrid x x + x + - + + + - - + -Murcia - -** x - - - - = - -* - = - -Navarra - - = - - - = = - - - = - - =País Vasco + x + + + + + +*** + x x + x x + +La Rioja - - - - - - = - - - - - - - - - -
Notes: See notes of table 2.
Table A.4Contrasts of Lorenz dominance. H ypothetical wages 2. 2002.
Spain And. Arag. Ast. Bal. Can. Cant. C-LM C-L Cat. C.Val. Ext. Gal. Mad. Mur. Nav. P.V.
Andalucía +Aragón + -Asturias + - =Baleares + - + =Canarias = -** - - -Cantabria x - - - - xCastilla-La Mancha
= - - - - = -
Castilla y León
= - - - - + x =
Cataluña +*** - = = - + + + +Comunidad Valenciana
+ - + + = + + + + x
Extremadura - - - - - - - - - - -Galicia x -*** x x - + x x X x - +Madrid - -* -* -* - - - - - -*** - x -Murcia - -* - - - - - - - - - = - xNavarra +* x + + + + + +* + + + +** + +** +**País Vasco +*** x + + + +* + +*** +* + + +*** + +*** +*** =La Rioja = - = = = = = = = - - + - + + - -
Notes: See notes of table 2.