Embed Size (px)
Citation preview

Work Health Report
TRENDS IN WORK HEALTH
The occupational health situation in Singapore continues to be satisfactory. The success of measures to ensure thehealth of our workers has been possible because of the strong support of employers, unions and other partners forour various enforcement and promotional programmes.
Data from our medical and industrial hygiene surveillance activities indicate that noise and chemical exposure levelsin workplaces remain satisfactory.
Monitoring Conditions at Work
Exposure levels of specific workplace hazards provide a good indicator of the conditions in the work environment.Workplaces with specific hazards are required to have regular industrial hygiene monitoring and medical surveillance(including biological monitoring) for their exposed workers. The frequency of noise monitoring is once every threeyears, while that for chemical monitoring is usually annual. The results of both industrial hygiene and biologicalmonitoring are submitted to the Division. The Division also conducts detailed industrial hygiene assessments on aselective basis in high risk workplaces.
Industrial hygiene data from our selective assessments, as well as from companies with in-plant monitoring, ismaintained in a National Database for Noise and Chemical Exposure. This enables us to identify high risk workplaces,evaluate trends in exposure levels and advise employers regarding control measures and appropriate monitoringprogrammes.
59

Workers' Health Status
In terms of new work-related abnormal medical results, the overall rate remained low. The increase from 2.9 per 1,000workers examined in 2004 to 6.5 in 2005 was mainly due to detection of noise-induced deafness and cases ofoverexposure to toluene and trichloroethylene.
Detection of work-related abnormal results among workers examined for exposure to noise was highest in the transportindustry (mainly the ship building and repairing industry), while among workers examined for exposure to chemicals,detection of work-related abnormal results was highest in solvent exposed workers in the dry cleaning and paperproducts industry.
Work Health Report
60

Work Health Report
Results of Medical Monitoring for Noise Exposure, 2005
0% 10% 20% 30% 40% 50% 60% 70% 80% 90% 100%
Others* (20,716)
Manufacturing of ElectronicProducts and Components
(6,942)
Manufacturing of Chemical andChemical Products (4,023)
Manufacturing of TransportEquipment and Related
Activites (25,931)
Manufacturing of FabricatedMetal Products, Machinery
and Equipment (15,118)
All industries (72,730)
I
nd
ust
ry
(
No
.of
wo
rker
s ex
amin
ed)
% of workers examined
Normal results Abnormal results- Non Work-related Abnormal results- Work-related
*Others: include manufacturing of food products and beverages/ textiles/wearing apparel/paper and paper products/rubber and
plastic/non-metallic mineral products/basic metals/electrical machinery/furniture, printing, sawmilling,recycling, construction,
wholesale trade and other business activities.
61

Work Health Report
Results of Biological Monitoring for Chemical Exposure, 2005
0% 10% 20% 30% 40% 50% 60% 70% 80% 90% 100%
Others* (1,189)
Manufacturing ofChemical, Petrochemical,
Rubber & Plastics (466)
Manufacturing ofFabricated Metal
Products, Machinery andEquipment (268)
Dry Cleaning (95)
All industries (2,018)
% of workers examined^
< 20%BTLV 20-80% BTLV > 80%BTLV
In
du
stry
(N
o. o
f w
ork
ers
exam
ined
)
*Others: include manufacturing of basic metals/electrical machinery/electronic products and components/paper and paper products/ ransport equipment/ medical precision and optical instruments, printing, other service activities, other business activities, and construction industries.^Excludes medical examinations where biological monitoring is not applicable, viz., chest x ray, lung function and skin examinations for asbestos, silica, raw cotton, tar, pitch and bitumen exposure.
62

OCCUPATIONAL DISEASES
Notification of occupational diseases by doctors and employers is required under the Factories Act. There are31notifiable diseases. To facilitate such notifications, the Division conducts joint specialist clinics that are located atvarious hospitals and polyclinics. All notifications are investigated to confirm the work-relatedness of the cases, aswell as identify any other employees who may be similarly affected. Preventive measures are recommended to thecompany and employees concerned.
Work Health Report
63

The occupational disease incidence increased from 2.0 per 10,000 employed persons in 2004 to 2.4 in 2005, mainlydue to more noise induced deafness cases from the marine sector. The denominator is based on data of all employedpersons from Labour Market Report 2005. Noise induced deafness and industrial dermatitis remained the two leadingoccupational diseases, accounting for 87% of the 545 cases. The number of persons affected by excessive absorptionof chemicals increased from six in 2004 to 24 in 2005, accounting for 4% of the cases, mainly due to more casesdetected in the paper products and lamination industries.
Work Health Report
Occupational Disease Incidence
8.7
5.8
4.8 4.6
2.8 2.7 2.5 2.42.0
2.4
0
1
2
3
4
5
6
7
8
9
10
1996 1997 1998 1999 2000 2001 2002 2003 2004 2005
Year
No
. of
Cas
es p
er 1
00,0
00 E
mp
loye
dP
erso
ns
64

Work Health Report
Occupational Diseases, 2005
8428
391
2413 5
54
Noise Induced Deafness
Industrial Dermatitis
Gassing
Excessive Absorption of Chemicals
Barotrauma
Compressed Air Illness
Occupational Lung Disease
Work-related Musculoskeletal Disorder
Others
(71.7%)
(15.4%)
(0.6%) (0.9%)(4.4%)
(0.7%)
(0.2%)
(5.1%)
(0.9%)
65

Noise Induced Deafness
Noise Induced Deafness (NID) continued to be the leading occupational disease in 2005, with 391 cases, accountingfor 72% of all occupational disease cases confirmed. Most of these cases were in the early stages of the disease.Seven (or 1.8%) had advanced or severe hearing loss, compensable under the Workmen's Compensation Act,compared to four in 2004.
The majority of the NID cases (57.1%) worked in companies manufacturing transport equipment (e.g., ship buildingand repairing), basic metals (eg., iron and steel), machinery and equipment (e.g., tools and die), fabricated metalproducts (eg., structural metal ), warehousing and support activities for transport.
Work Health Report
Noise Induced Deafness
0
200
400
600
800
1000
1200
1400
Year
No
. of
Cas
es
Total NID Cases 1302 861 674 659 366 359 339 300 251 391
NID Advanced 25 18 11 13 12 14 16 6 4 7
NID Early 1277 843 663 646 354 345 323 294 247 384
1996 1997 1998 1999 2000 2001 2002 2003 2004 2005
66

Work Health Report
Noise Induced Deafness By Industry, 2005
74
44
4334
41
109
11
1110
16
282625
9
Manufacture of Transport Equipment (SSIC 35)
Manufacture of Basic Metals (SSIC 29)
Manufacture of Machinery and Equipment (SSIC 31)
Manufacture of Fabricated Metal Products except Machinery and Equipment (SSIC 30)
Warehousing and Support Activities for Transport (SSIC 55)
Repair and Maintenance of Vehicles,Office Equipment,Personal and Household Goods (SSIC 92)
Manufacture of Chemicals and Chemical Products (SSIC 25)
Manufacture of Furniture;Manufacturing Nec (SSIC 36)
Electricity and Gas Supply (SSIC 40)
Construction (SSIC 45)
Manufacture of Paper and Paper Products (SSIC 22)
Printing and Reproduction of Recorded Media (SSIC 23)
Manufacture of Rubber and Plastic Products (SSIC 27)
Manufacture of Non-Metallic Mineral Products except Products of Petroleum and Coals (SSIC 28)
Other industries
(18.9%)
(11.2%)
(11.0%)
(8.9%)(7.1%)(6.9%)
(6.4%)
(4.1%)
(2.8%)
(2.8%)
(2.6%)
(2.3%)
(2.3%)
(10.5%)
(2.3%)
67

Industrial Dermatitis
Industrial Dermatitis (ID) continued to be the second most common occupational disease, with 84 cases in 2005.The common causative agents were oils, cement, wet work and detergents.
Work Health Report
Industrial Dermatitis by Causative Agent, 2005
18
16
155
44
22
Oils Cement Wet Work/DetergentsAcids & Alkalis Nickel SolventOthers
(21.4%)
(19.0%)
(17.9%)(6.0%)(4.8%)
(4.8%)
(26.2%)
Industrial Dermatitis
20
40
60
80
100
120
140
Year
No
. of
Cas
es
No. of IndustrialDermatitis Cases
111 126 132 116 93 118 99 67 81 84
1996 1997 1998 1999 2000 2001 2002 2003 2004 2005
68

Work Health Report
Industrial Dermatitis By Industry, 2005
26
7665
55
4
4
16
Construction (SSIC 45)
Manufacture of Transport Equipment (SSIC 35)
Manufcture of Machinery and Equipment (SSIC 31)
Other Service Activities (SSIC 93)
Public Administration and Defence (SSIC 94)
Hotels and Restaurants (SSIC 58)
Other industries
(8.3%)
(19.0%)
(4.8%)
(4.8%)
(7.1%) (7.1%)
(31.0%)
(6.0%)(6.0%)
(6.0%)
Manufacture of Electronic Products and Components (SSIC 33)
Manufacture of Fabricated Metal Products except Machinery and Equipment (SSIC 30)
Manufacture of Chemicals and Chemical Products (SSIC 25)
69

In 2005, a total of 28 persons were affected in confined space and gassing incidents compared to 25 in 2004. Sixwere fatal cases.
Death Traps
• Five workers were overcome by high levels of toluene inside a confined space of a box culvert. Two of thefour workers involved in spray painting and a rescuer died. Apparently there was no suitable breathingapparatus provided and it was believed that the box culvert was not adequately ventilated.
• A worker was found unconscious in an ISO tank while carrying out touch up cleaning using a wipe cloth andthinner containing toluene and acetone. He subsequently died.
• A crew member died after entering a freezer tank of a fishing vessel to retrieve some fishing equipment. Twoother rescuers also lost consciousness. The oxygen level in the tank was 8-10% volume of air. Gas testingwas not conducted nor was the tank certified safe for entry.
• A worker died from oxygen deficiency while inspecting a tank on board a barge. The oxygen level in the tankwas found to be 10%, well below the atmospheric level of 21%.
Work Health Report
Gassing
3
17
13
6
20
16
1 1
19
28
0
5
10
15
20
25
30
1996 1997 1998 1999 2000 2001 2002 2003 2004 2005
Year
No
. of
case
s
70

Treat Chemicals with Respect
• Fifteen workers had acute exposure to triethylamine (TEA) vapour that had leaked from a damaged packageduring parcel sorting. They had symptoms of eye, nose, throat and lung irritation, but all recovered withoutany permanent health effects. The exposure occurred as no precautionary measures were taken during thecleaning up of the spill since the consignment was declared as non-hazardous goods.
• Two technicians vomited and fainted after dismantling a “live” pipeline during the changing of cylinders. Itwas believed that the pipeline which had erroneous labels contained nitrogen trifluoride.
• A technician felt giddy and nauseous while filling nitrogen into a gas cylinder containing the hydrogen sulphideat a specialty gas centre. He was exposed to the gas mixture which escaped as the nitrogen filling pressure(100 bars) exceeded the activation pressure (40 bars) of the safety relief valve. He has since recovered fully.
Excessive Absorption of Chemicals
Work Health Report
Poisoning and Excessive Absorption of Chemicals
0
10
20
30
40
50
60
Year
No
. of
Cas
es
Excessiveabsorption ofchemicals
45 30 47 48 22 36 12 20 6 24
Poisoning 19 0 6 0 1 0 11 0 0 0
1996 1997 1998 1999 2000 2001 2002 2003 2004 2005
There were 23 cases of overexposure to solvents and one case of lead overexposure from a factory manufacturing lead stabilizers for PVC compounding. The solvents involved were toluene,trichloroethylene and perchloroethylene used in degreasing in the paper products, lamination, dry cleaning, gold jewellery and ink manufacturing industries.
71

Barotrauma
Work Health Report
Compressed Air Illness/Barotrauma
0
5
10
15
20
25
30
Year
No
. of
case
s
Compressed Air Illness 0 0 0 0 1 0 20 8 4 5
Barotrauma 0 0 1 2 28 0 10 8 6 5
1996 1997 1998 1999 2000 2001 2002 2003 2004 2005
Of the 10 cases, one was a freelance commercial diver, laying pipes on the seabed as part of the Deep
Tunnel Sewerage System project, while nine were involved in the construction of a transmission cable tunnel,
working at pressures of up to 2.3 bars while changing cutter heads of the tunnel boring machine.
72

Compressed Air Illness
Work Health Report
Compressed Air Illness/Barotrauma
0
5
10
15
20
25
30
Year
No
. of
case
s
Compressed Air Illness 0 0 0 0 1 0 20 8 4 5
Barotrauma 0 0 1 2 28 0 10 8 6 5
1996 1997 1998 1999 2000 2001 2002 2003 2004 2005
Of the 10 cases, one was a freelance commercial diver, laying pipes on the seabed as part of the Deep
Tunnel Sewerage System project, while nine were involved in the construction of a transmission cable tunnel,
working at pressures of up to 2.3 bars while changing cutter heads of the tunnel boring machine.
73

Occupational Lung Disease
Work Health Report
Silicosis, Asbestosis, Occupational Asthma
0
2
4
6
8
Year
No
.of
Cas
es
Silicosis 2 1 1 5 2 3 0 1 1 1
Asbestosis 0 1 0 3 0 1 0 0 0 2
Occupational Asthma 7 7 3 2 3 4 3 0 1 1
1996 1997 1998 1999 2000 2001 2002 2003 2004 2005
The two workers with asbestosis had worked previously as pipe fitters in a factory manufacturing asbestos
cement pipes, while the worker with silicosis had previous exposure to silica dust while employed as a
blaster and grinder in a granite quarry .
A technician developed occupational asthma after exposure to ethylenediamine (EDTA) during the transfer of
chemicals into enclosed reactors in a chemical plant. He has since recovered after his transfer to another
section with no exposure to EDTA.
74

SAYING GOODBYE TO BODY ACHE AND BAD BACKS
There are two Joint Clinics at Tan Tock Seng Hospital and Singapore General Hospital catering to patients who mayhave Work-related Musculoskeletal Disorders (WRMSD) . Here are the cases confirmed in 2005.
Repetitive Strain Disorders of the Upper Limbs
• An electrician involved in changing and checking batteries located at the bottom of buses developed rightshoulder supraspinatus tendonitis. His work involved bending his back and using force on his upper limbpulling and pushing trays containing batteries, weighing 20 kg each. Recommendations to the companyincluded training workers on proper posture, provision of gloves to improve the grip, as well as lubricationand regular maintenance of the trays to minimize frictional forces.
• A trainee chef from a restaurant developed de Quervain’s tenosynovitis of the left wrist and thumb within twomonths of work. Her work involved repetitive and forceful movements of the wrist and thumb during kneadingof dough and wrapping prawns into dumpling skin. The company has since put in place a schedule to rotatesuch work among the employees and is looking into the feasibility of implementing more frequent rest breaksand automation for dough kneading.
Bending of back and excessive shoulderelevation
Adopting correct posture and use of gloves toimprove grip
Work Health Report
75

Backache
• A 29 year old store cum delivery man, diagnosed with prolapsed intervertebral disc, presented with pain inthe low back and left buttock of insidious onset. His work involved manual packing and frequent lifting ofautomobile parts (weighing 10-20 kg) from boxes, and to the storeroom or delivery truck. He had adoptedawkward postures e.g. bending at waist during lifting. The company is looking into the use of lifting devicesand rotation of tasks. Training on correct lifting techniques was conducted.
Awkward bending at the waist during lifting
Work Health Report
76

EXPOSURE LEVELS
Chemical Exposure Levels
Overall, chemical exposure levels remained satisfactory. The percentage of high risk workplaces that had excessivechemical exposure increased to 15.3% from the lower base of 8.1% in 2004, reflecting our ongoing efforts in identifyingsuch workplaces and enforcing requirements to reduce chemical exposure.
Work Health Report
% High Risk Workplaces* Exceeding PEL for ChemicalHazards
19.5
6.5
14.9
8.1
15.3
0
5
10
15
20
25
2001 2002 2003 2004 2005Year
% H
igh
Ris
k W
ork
pla
ces
* Where any exposure level in the high risk workplace exceeds the PEL for any chemical monitored.
77

Our surveillance data indicate that workplaces with significant chemical exposure levels (of over 50% PEL), weremainly from the following industries:
• Manufacture of paper and paper products• Manufacture of petrochemical and petrochemical products
Work Health Report
Chemical Exposure* in High Risk Workplaces
0% 25% 50% 75% 100%
Other Industries^ (54)
Mfg of Chemical,
Petrochemical,
Rubber & Plastics (44)
Mfg of Paper & Paper
Products (8)
All Industries (106)
% High Risk Workplaces Monitored
< 10% PEL 10% - 50% PEL > 50% PEL - < 100% PEL
* The % derived are based on the highest exposure level from the latest assessment results.^ Include: Mfg of basic metals, fabricated metal products, machinery & equipment, mfg of transportequipment, printing & reproduction of recorded media, mfg of medical, precision & optical instruments,IAQ assessment in retail
= 100% PEL
78

Air levels of all solvents were lower in 2005, reflecting significant improvements following our enforcement activitiesin the metalworking and aircraft-servicing industries, with none of these exposure levels exceeding 50% PEL.
The paper products, lamination, dry cleaning, gold jewellery and ink manufacturing industries were also targetedfollowing the detection of excessive absorption cases in these industries. These efforts resulted in a number ofsuccessful intervention cases that contributed to subsequent reductions in air levels.
Work Health Report
Exposure to all Solvents
10.6 12.1
19.4
10.6
17.3
05
10152025
2001 2002 2003 2004 2005
Year
%P
EL
79
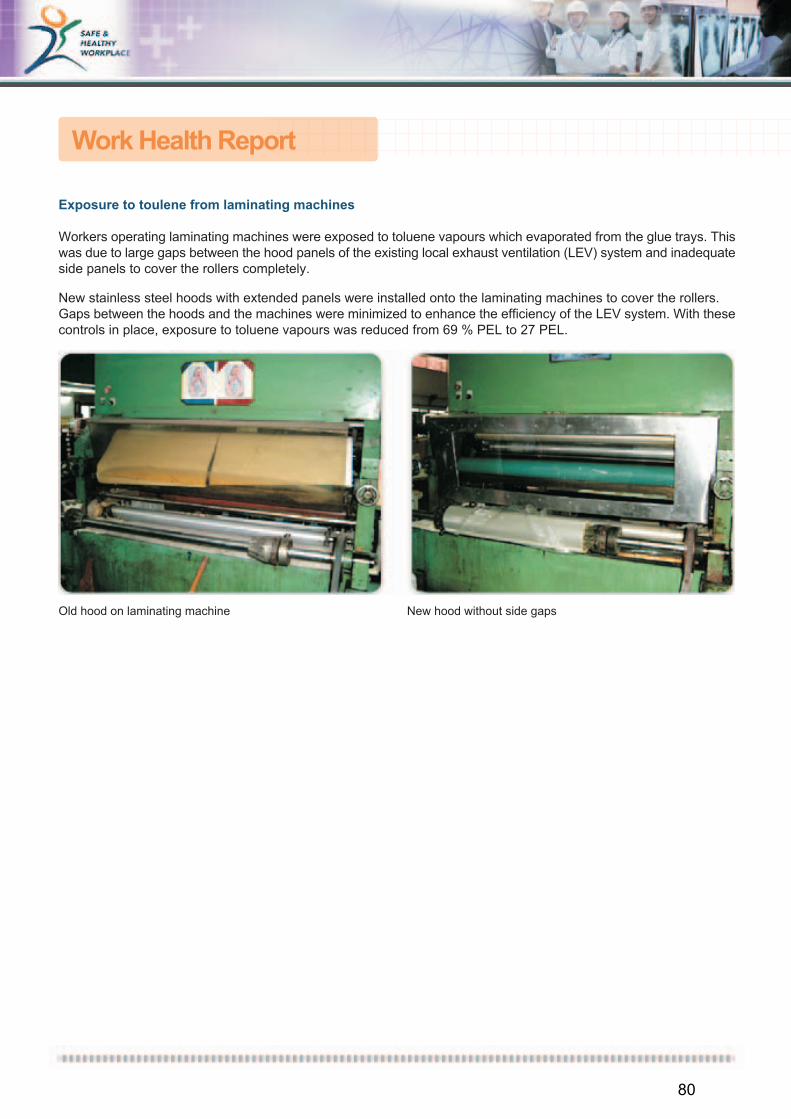
Exposure to toulene from laminating machines
Workers operating laminating machines were exposed to toluene vapours which evaporated from the glue trays. Thiswas due to large gaps between the hood panels of the existing local exhaust ventilation (LEV) system and inadequateside panels to cover the rollers completely.
New stainless steel hoods with extended panels were installed onto the laminating machines to cover the rollers.Gaps between the hoods and the machines were minimized to enhance the efficiency of the LEV system. With thesecontrols in place, exposure to toluene vapours was reduced from 69 % PEL to 27 PEL.
Old hood on laminating machine
!New hood without side gaps
Work Health Report
80

Exposures to heavy metals were also reduced, although one chemical plant noted some increase in air levels ofChromium III arising from a new process line. The factory was advised to improve the effectiveness of engineeringcontrols.
As to other airborne contaminants, significant levels were noted in talc, non-specific respirable and nuisance dustduring our enforcement activities on factories in the chemical products, rubber and plastic products industry, inkmanufacturing. The companies concerned were advised on the implementation of engineering controls, includinglocal exhaust ventilation, and general ventilation improvements.
Work Health Report
Exposure to all Heavy Metals
48.3
17.6
25.3
38
16.6
0
10
20
30
40
50
60
2001 2002 2003 2004 2005
Year
%P
EL
81

Noise Exposure Levels
Overall, the average noise levels in high risk workplaces remained satisfactory. The high percentage of workplaceswith excessive noise reflects our ongoing efforts in identifying such workplaces and enforcing requirements to reducenoise exposure.
Under the Factories (Noise) Regulations, companies with 10 or more workers exposed to excessive noise, i.e., abovean equivalent sound pressure level of 85 dBA over an 8-hour workday, are required to monitor the noise exposureat least once every three years.
Work Health Report
% High Risk Workplaces* with Noise LevelsExceeding 85dBA
76
79.4
68.7
82.182.1
50
60
70
80
90
2001 2002 2003 2004 2005Year
%W
ork
pla
ces
* Where any Leq, 8hr in the high risk workplace exceeds 85 dBA.
82

Our surveillance data indicate that workplaces with very high noise levels (90 dBA and above) were mainly from thefollowing industries:
• Manufacture of fabricated metal products, machinery and equipment• Manufacture of electronic products and components• Manufacture of transport equipment
Work Health Report
Noise Exposure* in High Risk Workplaces
0% 25% 50% 75% 100%
% High Risk Workplaces Monitored
< 85 dBA = 85 dBA - < 90 dBA = 90 dBA - < 95 dBA > 95 dBA
* The % derived are based on the highest exposure level from the latest assessment results^ Include: Mfg of beverages, textile, wearing apparel, tanning & dressing of leather, wood & wood
products, printing & reproduction of record media, coke & refined petroleum products, petrochemical &petrochemical products, chemical & chemical products, rubber & plastic products, non-metallic
products, mfg of precision product, electricity & gas supply and warehousing.
All Industries (299)
Mfg of Food Product and Paper & Paper Products (25)
Mfg of Basic Metal, Fabricated Metal Products,Machinery & Equipment, Mfg of Electrical Machinery (110)
Mfg of Electronic Products & Components (30)
Mfg of Transport Equipment (14)
Other Industries^ (134)
83

Noise exposure in the manufacture of transport equipment improved due to the successful implementation ofengineering controls in workplaces involved in aircraft repair and aircraft components manufacture.
Enforcement activities were stepped up in the food and paper products industries where processes with high noiselevels were detected. These processes involved the use of high pressure nitrogen for inerting food containers in foodpreservation and compressed air for roller compression in the lamination of paper products.
Work Health Report
Average Noise Levels* in High Risk Workplaces
82
82.481.9
81.6
81.8
81
82
83
2001 2002 2003 2004 2005Year
Leq
,8h, d
BA
* 8-hr equivalent noise levels averaged over a 3-year period, e.g. for 2005, the noise level isaveraged over 2003, 2004 and 2005. Based on results of noise monitoring conducted every 3
years as required under the Factories (Noise) Regulations.
84