Embed Size (px)
Citation preview

Vulnerability Assessment
of Urban Marginalised Communities: A Pilot study in Bangalore Slum areas
byCentre For Education & Documentation(CED)
With support from
Indian Network on Ethics and Climate Change (INECC)
November 2010-May 2011
Indian Network on Ethics and Climate
Change (INECC).
www.inecc.net
Centre for Education and
Documentation (CED)
www.doccentre.net
c/o Laya, 501, Kurupam Castle, East
Point Colony,
Peda Waltair, Visakhapatnam - 530017
3 Suleman Chambers, 4 Battery
Street, Mumbai 400001

Vulnerability Assessment: Urban Areas: A Pilot study ii
Vulnerability Assessment of Urban Marginalised Communities: A Pilot study in Bangalore Slum areas
Advisory Group: Walter Mendoza (Chair) CED, Prof. T.G.Sitharam (Chairman, CiSTUP, IISc), Dr.H.S.Sudhira(Researcher, Gubbi Labs), Rohan D'Souza (Ph.D fellow, NIAS), Dr.Bidisha Nandy (Post-Doc fellow, IISc), Dr. Harini Nagendra(Adjunct Fellow, ATREE & Asia Research Co-ordinator, Indiana University),Vinay Baindur(Independent Researcher) are among the advisors. Other facilitators :Issac Amrutraj(Activist),Wilma Rodrigues (SAAHAS),Prema Manthesh(Ragpickers Education & Development Scheme-REDS). .
Report by John D’Souza Questionnaire and Research Design: Hita Unnikrishnan
Researchers :Veena B N Research Assistance: Jacintha Menezes
2011

Vulnerability Assessment: Urban Areas: A Pilot study iii
Table of Contents I Issues & Themes 1 I.1 Vulnerability to Climate Change in the urban context I.2 Areas of Urban Vulnerability, and Indicators I.3 Bangalore: Features of Bangalore with relation to areas of Urban Vulnerability I.4 Development and Governance of Slums in Bangalore II Methodology of the Study 8 II.1 Factors influencing methodology of the study
II.2 The Process of the study II.3 Areas chosen for Study: Rationale and Process
III People & Livelihood 12 IV. Habitat 17 V. Civic Amenities 24
V.1 Sanitation & Waste V.2 Water availability & usage V.3 Energy
VI. Perceptions, Impacts & Coping mechanism to Climate Change 41 VI.1 Health VI.2 Perceptions of climate change VI.3 Impacts & Coping mechanism to climate change
VII. Learnings from study 51

Vulnerability Assessment: Urban Areas: A Pilot study iv
Preface INECC is a network of organizations and concerned individuals working with marginalized communities in India. The network came together in 1996 in order to understand the implications of Climate Change in the work of its constituents and the perspective of the rural and marginalized communities. INECC has learnt that while Climate Change is a global phenomenon, it is the marginalised majority in the world who will suffer the most impacts of climate change. Further, INECC is convinced that any real solution to the crisis, particularly for the marginalised communities, must be anchored to the core principle of sustainable societies. Hence INECC posits that the discourse on Climate Change cannot and must not be delinked from the life and livelihood of local communities, especially those at the economic and environmental margins who will become increasingly vulnerable to climate change. INECC believes that Climate Change is a part of a larger environmental crisis and that it relates to the ecologically destructive development processes that are being pursued globally. Therefore ecologically destructive development process must give way to a new paradigm of development. (INECC Position paper Draft 2. March 2009) Recognising that Climate Change most adversely affects marginalized communities, and that Climate Change is indeed upon us, INECC felt that it was necessary to have a better understanding of the vulnerability of these communities to climate change as well as develop and prepare adequate resilience to the impacts of climate change. The problems and the solutions will be different for different eco-regions and therefore INECC has, over the last few years, taken up vulnerability studies in each of the eco regions, through its partners. The aims of the assessments has been to study
• the people's perception on the nature of changes in their neighborhoods and climate. • the impact of these changes in their living conditions, livelihood and health. • the factors responsible for their situation.
The studies also aims to map the nature of vulnerability by age and gender in the neighborhood and to corroborate where possible, people's perception with secondary sources – studies, reports etc. in order to enable NGOs to inform their approach as well as contribute to policy and programmes of government and other bodies. With this background in mind, CED and INECC embarked on a pilot study to test the relevance of the known parameters of urban vulnerability to situation on the ground, and relate it to people’s perception of the issues involved, and then develop preliminary initiatives for intervention on vulnerability and resilience, which is in line with what people consider as important and urgent. Thus, the study listens to the normal day-to-day concerns and responses of marginalized population, particularly women and how they cope with the various issues they face. This pilot study preludes a much wider study that would hopefully include greater participation from the various stakeholders working on urban issues within communities.

Vulnerability Study: Urban Areas: A Pilot Study 1
I Issues & Themes Vulnerability to Climate change is the degree to which a system is affected by adverse effects of climate change. Human vulnerability thus includes the vulnerability of social and economic systems, health status, physical infrastructure and environmental assets.1 The IPCC defines it as “the degree to which a system is susceptible to, or unable to cope with, adverse effects of climate change, including climate variability and extremes. Vulnerability is a function of the character, magnitude, and rate of climate variation to which a system is exposed, its sensitivity, and its adaptive capacity. The term ‘vulnerability’ may therefore refer to the vulnerable system itself, e.g., low-lying islands or coastal cities; the impact to this system, e.g., flooding of coastal cities and agricultural lands or forced migration; or the mechanism causing these impacts, e.g. disintegration of the West Antarctic ice sheet”2 . Thus Vulnerability to Climate Change has to be looked at three levels: Direct impacts are the system’s exposure to crises, stresses and shocks. There is the direct impact due to rise in sea level and increase in sea temperatures that may inundate low lying areas or result in depletion of fish stock. Sea level rise will have multiple impacts. It will inundate coastal settlements, aggravate flood situations, erode beaches, further impacting settlements, and will leave vast swathes of land and water sources saline. The net result will be the displacement of people from these densely populated areas. There are also the impacts of extreme weather events like flash floods, heat waves, droughts and other impacts of rise in temperature on vectors. Sensitivity of the system: At the next level is the sensitivity of the system already impacted by environmental degradation - changes brought about by dumping of industrial waste or reduction of mangroves, deforestation, depletion of ground water, poor quality of amenities like sewerage etc. Adaptive capacity & long term recovery: The ability of the system to attenuate stresses or cope with the consequences is critical. We need a clearer understanding of coping strategies or mechanisms, of who and what are at risk, from what. Which are the specific stresses and perturbations which have higher risk and major impacts. This includes the consequences and attendant risks of slow (or poor) system recovery. This perspective suggests that the most vulnerable individuals, groups, classes and regions and the most sensitive to perturbations or stresses, have the weakest capacity to respond and ability to recover. When stresses or perturbations emanating from the environment coalesce with those arising from society, significant consequences can result. For example, economic depression reduces society's capability to develop or maintain pre-emptive coping measures to reduce the impacts of drought, such that the co-occurrence of drought and economic depression synergistically enlarges the vulnerability of the system”3.

Vulnerability Assessment: Urban Areas: A Pilot study 2
I.1 Vulnerability to Climate Change in the urban context Less than two percent of the global population resided in “megacities” of 10 million or more inhabitants, about 25 years ago. Today the proportion exceeds four percent. In India, according to the 2011 census, 31.2% of the total population lives in urban centres compared with 27.8% in 2001 and 25.5% in 1991. For the first time since Independence that the absolute increase in population between 2001 & 2011 in urban areas ( at 91 million) was more than in rural areas at (90.4 million). The biggest trend towards urbanization is in southern India, where all states except Andhra Pradesh have more than 35% of the population in urban centres. In Karnataka the level of urbanization has increased from 33.9 percent in the 2001 Census, to 38.57 percent in 2011. Bangalore has a population of 87.1 lakhs (provisional population figures 2011)4 I.2 Areas of Urban Vulnerability and Indicators Every city is marked by informal settlements where the poor are forced to live without access to basic services like water and sanitation. In some cities like Mumbai, for instance, half of the population (49 percent according to Census 2001) lives in slums. They are forced to accept dangerous and inhuman living conditions, in which any untoward natural event is likely to become a disaster. Vulnerability to Climate Change sits on top of, and is exacerbated by other vulnerabilities created by poor access to land, overcrowding and low-quality housing and a complex set of social, institutional and economic processes. Environmentally too the city is precariously poised. Contaminants and gases in an urban setting are 5-25 times more than that of a rural environment; rainfall and cloudiness 5-10% more; fog as much as twice as frequent (especially in winter); temperature 0.5-2°C higher; relative humidity about 2% less; radiation 15-20% less and winds 20-30% less5. Due to climate change the frequency of warm spells and heat waves are likely to increase, exacerbating the heat island effect in cities where temperatures may go up to 10 degrees higher in densely populated areas. Air pollutions would also worsen in these conditions. Thus there is increased risk of heat related mortality, increase in vector borne diseases, respiratory diseases. Following heavy precipitation events, increased cyclonic activity, and predicted global warming, there is an increased risk of floods and landslides, damage to homes and business, loss of income and property. Low lying areas are susceptible to water borne diseases, increased breeding of vectors, water related diseases. The cities along the coast, and there are many of them, suffer loss of property, damage to shelters, salination of water, coastal flooding etc due the projected sea level rise. Drought in the hinterland, creates food shortages, where poorer people are unable to cope with increased prices of food, leading massive malnutrition among children and women particularly. Further these urban spaces are subject to increase distress migration from rural areas.

Vulnerability Assessment: Urban Areas: A Pilot study 3
I.3 Features of Bangalore with relation to areas of Urban Vulnerability A tiny village in the 12th century, Bengaluru grew to a cantonment township and from there to one of the fastest growing cities in the world. In the Nehruvian era, the 60s and 70s Bangalore became the hub of some of the biggest public sector undertakings, like BHEL, BEML, HAL . It houses industries like textiles, aviation, space as well as numerous commercial and educational institutions. Major IT companies and biotechnology firms have a prominent base within this city – all contributing to the growing economy of the city6. As of 2001, the city had an economy of US$ 47.2b.7 It’s share of US$3.7b in Foreign Direct Investment was the third highest for an Indian city. As of 2009, Bangalore was inducted in the list of global cities and ranked as a “Beta World City” along with cities such as Miami, Boston, Kuwait8. The city now has a population of over 6 million and has achieved a decadal growth rate of 47% between 2001 and 2011.9 Bangalore provides a classic example of the impacts of city growth, where urban landscapes have shown unprecedented growth rates, and how a predominantly rural population converts to an urban one10. The rapid expansion of the city has also taken place at the expense of natural ecosystems11. Overview of slums and fringes in Bangalore The slum population in metropolitan slums has been growing at a faster rate than the metro as a whole. In Bangalore the number of slum dwellers in a decade has risen from 23% in 2001 to nearly 30-40% of the city's current population. The city attracts large numbers of migrants in search of employment from other states most notably Tamil Nadu, Kerala and the backward districts within Karnataka. Many have been brought in as labour for construction. So as the economy grows, more and more slums are also needed to house the people providing services. The service work force thus includes transport workers, masons, plumbers, electricians, sweepers, dhobis, peddlers, hawkers, cobblers, daily wage workers, laborers, dhobis etc. Most women folk engage themselves as domestic or office helps, or else generate a source of income from some cottage industry like making of incense sticks or agarbathis.12 Thus nearly 1.7 lakhs households crowd into the more than 400 slums in the city13. Nearly 1.7 lakh households live in these slums. There is ambiguity regarding the number of slums in the city. While the KSCB places the number of slums in the city at 473, other sources place it at 45014 , 73315 and 56916. According to BBMP, city hosts 569 slums — of these, 228 are notified and 341 unauthorized. The locations of slums are least desirable from the habitat point of view – low lying areas that are susceptible to inundation, quarry pits, tank beds, along railway lines, near cemeteries, slaughter houses, etc. According to a project report prepared for the Karnataka Slum Clearance Board by the Center for Symbiosis of Technology, Environment and Management (STEM), 1/3rd of slums in the city are located in environmentally sensitive and filthy areas, where water stagnation breeds mosquitoes and other heath hazards. Almost 90% of all slum houses are kutcha and semi pucca shabby dwellings.17 The Bruhat Bengaluru Mahanagara Palike has recently been expanded to incorporate fringe areas of the city18. These fringe areas are predominately rural in their environs. According to Mr. Issac Amruthraj, an activist working in these areas, 85 zones with area characteristics of a village have already been considered as slums.
Table 1: Demography of the Bengaluru Urban agglomeration1: Bengaluru UA 1971 1981 1991 2001 20111
Population (000s) 1654 2922 4130 5701 9588
Decadal growth - 76.67% 41.30% 38.04% 46.68%
Area sq km 174.71 365.65 413.03 492.55 -
Sex ratio 874.39 895.52 903.52 907.76 908

Vulnerability Assessment: Urban Areas: A Pilot study 4
The Mysore slum areas (Improvement and clearance) Act, 1973 ..the government may declare an area a slum if a) any area is likely to be a source of danger to health, safety or convenience of the public of that area or of its neighborhood, by reason of the area being low-lying, insanitary, squalid, over crowded or otherwise; or b) the buildings in that area, used or intended to be used for human habitation are-
i) in any respect, unfit for human habitation; or ii) by reason of dilapidation, overcrowding, faulty arrangement and
design of such buildings, narrowness or faulty arrangement of streets, lack of ventilation, light or sanitation facilities, or any combination of these factors, detrimental to safety, health or morals.
I.4 Development and Governance of Slums in Bangalore The nodal agency that deals with the slums of Bengaluru is the Karnataka Slum Development Board, formerly, the Karnataka Slum Clearance Board. The Karnataka Slum Clearance Board was constituted during July 1975 under the provisions of the Karnataka Slum Areas (Improvement and Clearance) Act 197319. Other nodal agencies that partially look into the slum affairs include the erstwhile Bangalore City Corporation and the Bangalore Development Authority. Improvement of Slums: Declared slums20 are entitled to land rights and certain benefits, including infrastructure services like water and electricity toilets, street lighting, drains, storm water channels, and community bathrooms. Thus slum dwellers covet declared slum status. Even if such a status does not bring in any real development, it provides a security form being evicted. However the process of declaration is a lengthy and byzantine mechanism which can take years, if not decades. Thus all infrastructure improvement by the communities themselves is in limbo as the conditions of declaration of slums ( see box), in a way, encourage insanitary conditions. In 2010, the state government has made it mandatory for deputy commissioners to take approval from the secretary of the housing department before declaring any habitation as a slum in their jurisdiction. This new hurdle in obtaining slum declarations has made it more difficult for the people to access the subsidies to which they become entitled once the status is achieved21. There is also a move to replace all slums in the city with pucca apartment blocks, construction of which has already begun in many places. The Board also undertakes construction of houses for the Economically Weaker Sections (EWS) of the society at a subsidized rate, that provides them with the basic amenities. This program is currently being implemented in the slums by replacing the existing shanties, sheds and huts with apartment blocks in which the residents can live comfortably22. A major problem of governance is that there are a multiplicity of agencies concerned with slums areas in Bangalore. The following tables indicates the functions of each of these agencies, their functions and functional overlaps, which often make them dysfunctional.
AGENCY Functions Functional Overlap
BDA
Responsible for land use zoning, regulation and planning of land, providing sites, creating urban infrastructure and improving urban environment
A function of BBMP under the Constitution which is also partly carried out by BMRDA and ABIDe
BMRDA Responsible for planning, coordinating, and supervising the orderly development of land in the larger Bangalore Metropolitan Region
A Municipal Corporation function mainly carried by BDA in city limits

Vulnerability Assessment: Urban Areas: A Pilot study 5
KUIDFC Provides assistance for urban agencies in planning, financing, and providing expertise to develop urban infrastructure
A Municipal Corporation function; similar tasks also carried out by ABIDe
KSCB Performs rehabilitation of all declared slum areas in the city
A Municipal Corporation function also performed by BDA and BBMP
BWSSB Responsible for the pumping and distribution of drinking water, sewerage collection, water and waste water treatment and disposal
A Municipal Corporation function; some aspects like waste water disposal also carried out by BBMP
Infrastructure of Bengaluru: Water: The Bengaluru Water Supply and Sewerage Board (BWSSB) is the nodal agency that deals with water supply and drainage in the city. Earlier Bengaluru depended on its lakes and local wells. The city began to import water from the Cauvery river in the early 20th century. The Cauvery water supply scheme today has reached its 7th stage and is steadily expanding23. Most of the water pipelines in the city are as old as 50 years24. These pipelines have either become corroded or cracked making them susceptible to various contaminants. The Bengaluru Water Supply and Sewerage Board (BWSSB) is the nodal agency that deals with water supply and drainage in the city. Earlier Bengaluru depended on its lakes and local wells. The city began to import water from the Cauvery river in the early 20th century. The Cauvery water supply scheme today has reached its 7th stage and is steadily expanding25. Most of the water pipelines in the city are as old as 50 years26. These pipelines have either become corroded or cracked making them susceptible to various contaminants. Supply to areas such as Ulsoor, Manjunatha Nagar, HAL 2nd and 3rd Stages, Murphy Town, Wilson Garden and Koramangala have been found to have unacceptable levels of contaminants in water. Further, since the supply is irregular, moist surface and air within the pipelines provide breeding space for the various microbes that enter the system through contact with stagnating water sources such as puddles or ditches, most frequently in the monsoon seasons. Drainage and Sanitation: Bangalore's original sewerage system was built in 1922. It covered only the heart of the city. Programmes to expand the system to unsewered areas were undertaken in 1950, and after 1960 when the BWSSB was formed28. The system uses a network of pipes, underground ducts and drains to tackle the sewage and in most cases the flow is gravitational. The drainage system of the city was never planned, and it grew haphazardly just like the city. Site allotments by the erstwhile corporation, the Bangalore Development Authority and the Slum Clearance Board have been made without providing adequate consideration to drainage channels. People have also in the past been dumped into flood zones without being warned29. The city's many interconnected and fast disappearing lakes are also used as dumping grounds for partly treated or, for the most part untreated sewage from the neighborhoods.
Number of ground level reservoirs 56
Number of overhead tanks 68
Number of borewells 8000

Vulnerability Assessment: Urban Areas: A Pilot study 6
Climate of Bengaluru: The city of Bengaluru lies in the center of the Mysore Plateau, which is part of the precambrian Deccan Plateau. The city is at an elevation of 3,018sq feet (920m). Its lush greenery with numerous gardens and open spaces had led to it being called the ’Garden City’ of India, a term which has given way to “silicon valley of India”. According to Kopper's broad climate classification, the climate of the city can be broadly classed as the tropical monsoon Plateau type30. The four main seasons that the city experiences are31: a) The cold weather season (December to February) – Characterized by a period of cool weather, clear skies and a diurnal temperature range of 10-14°C. This season also is a period of little or no rainfall. b) The hot weather season (March to May) – The temperature in this season rapidly rises to a maximum of 33.5°C. March is typically a dry month with low humidity. April and May are months characterized by considerable rainfall and thunder. An average rainfall of 160mm occurs during this period most of which occurs in May. c) The South West Monsoon Season ( June to September): Is a moist, cloudy and rainy period with a total seasonal rainfall of about 490mm. September is the month of maximum rainfall with ~143mm of recorded rainfall. This is also a period of strong and steady winds blowing from the South West to the West. d) The North East monsoon Season (October to November): Also is a moist, cloudy and rainy period with a lesser cloud cover. Winds are weaker and blow from the ENE to NE. The change in wind direction from WSW to ENE32 is very characteristic. Bangalore has seen a rapid replacement of its lush greenery with concrete and asphalt roads and numerous high rises. It has also received the dubious distinction of being the third most polluted city in the country and has loads of nitrous oxides and other particulate matter in its atmosphere, which are trapping the heat and contributing to an increase in temperature.33
1 Mitchell, J. K. (eds.) (1999); Crucibles of Hazard: Megacities and Disasters in Transition. Tokyo: UN University Press. As quoted in Mumbai after 26/7 Deluge: Some Issues and Concerns in Regional Planning . R. B. Bhagat1, Mohua Guha and Aparajita Chattopadhyay - www.cicred.org 2 IPCC – http://www.ipcc.ch/publications_and_data/ar4/wg2/en/ch19s19-1-2.html 3 Alex De Sherbinin, Andrew Schiller and Alex Pulsipher;.The vulnerability of global cities to climate hazards, Environment and Urbanization, Vol 21, Number I, April 2009,Sage, New Delhi 4 Census 2011: Rapid urbanizations sees dip in since last head count: State’s rural population on decline,

Deccan Herald, 16 July 2011. 5 Landsberg H.E. Climate and Urban Planning; Urban Climates; World Meteorological Organization; pp372. 6 Dandekar, V.M, Nilakantha Rath; Poverty in India; Indian School of Political Economy; Second Reprint 2009. 7 Ramesh Chandra and Raju N.R.; Policy and its Implementations to Abate Impact of Urbanization on Bangalore Lakes; Lakes: Conservation and Management; ICFAI Press, 2008; pp164-171 8 http://www.diserio.com/gawc-world-cities.html last accessed on 28 June 2011, at 11:50 am, IST 9 H.S. Sudhira, T.V. Ramachandra and H. Balasubrahmanya; City Profile: Bangalore; Cities 24; 2007; pp 379-390. 10 A. Mani; A Study on the Climate of Bangalore; Essays on Bangalore – Vol 2; KSCST; 1985; pp 2-17 11 Nagendra Harini; Maps Lakes and Citizens; Seminar 6134; September 2010 12 R. Krishna Kumar; Squalor amidst islands of wealth; The Hindu, Bangalore Edition dated 6 June 1997. 13 Bangalore has a bright future; Deccan Herald, Bangalore ed; 21 October 1993. 14 http://www.hindu.com/2006/04/30/stories/2006043001030400.htm last accessed on 28 June 2011, at 10:57am, IST 15 http://www.hindu.com/2007/04/28/stories/2007042802250200.htm, last accessed on 28 June 2011, at 11:07am, IST 16 http://articles.timesofindia.indiatimes.com/2011-03-17/bangalore/29137890_1_slum-population-slum-dwellers-urban-poverty last accessed on 28 June 2011, at 11:12 am, IST 17 Daksha Hathi; Amendment likely to give slum dwellers a better life; The Deccan herald, Bangalore Edition dated 5 October 2000. 18 http://www.bangaloremirror.com/article/10/2009050920090509001429720128b9276/BBMP-becomes-more-%E2%80%98bruhat%E2%80%99-.html last accessed on 29 June 2011, at 1:03pm. 19 http://housing.kar.nic.in/DOH_KSCB_page.htm last accessed on 28 June 2011, at 9:10am, IST 20 Connecting the slums: A utility's pro poor approach in Bangalore; Water and Sanitation Program field report, February 2006. 21 http://www.hindu.com/2010/05/15/stories/2010051564081100.htm last accessed on 29 June 2011, at 12:15pm, IST. 22 http://housing.kar.nic.in/DOH_KSCB_page.htm last accessed on 29 June 2011, at 12:36 am, IST 23 http://www.bwssb.org/water_source_schemes_cauvery.html last accessed on 28 June 2011, at 2:31pm, IST. 24 Bacteria thrive in city water; The Deccan Herald, Bangalore Edition, dated 29 April 2011. 25 http://www.bwssb.org/water_source_schemes_cauvery.html last accessed on 28 June 2011, at 2:31pm, IST. 26 Bacteria thrive in city water; The Deccan Herald, Bangalore Edition, dated 29 April 2011.
27 Deepa Kurup; Chronic Water Woes; The Hindu, Bangalore Edition dated 22 March 2011.Vulnerability Assessment: Urban Areas: A Pilot study 7
28 http://www.bwssb.org/sewerage_system.html accessed on 28 June 2011, at 2:52pm, IST. 29 Viju Abraham; Deluge of the Centure: Two faces of disaster; Deccan Herald, Bangalore edition dated 18 September 1986. 30 Krishna Rao P.R and T.V. Ramachandra Iyer; Climate of Bangalore; Souvenir Volume of the Indian Science Congress; 1951; pp 116-130. 31A. Mani; A Study on the Climate of Bangalore; Essays on Bangalore – Vol 2; KSCST; 1985; pp 2-17 32 http://www.windfinder.com/wind/windspeed.htm last accessed on 28 June 2011, at 11:45 am, IST 33 Gauri Lankesh;Above Normal: Bangalore experiences worst summer in years; Environment; dated 06 June 1993.

Vulnerability Assessment: Urban Areas: A Pilot Study 8
II Methodology of the Study II.1 Factors influencing methodology of the study. In his lecture on Climate Risk & Vulnerability, Prof T Jayaraman who is a member of the negotiating Indian team at the Conference of Parties (COP) has opined that while the naive rationale of a vulnerability study would be to determine the differing degrees of vulnerability, one must question the usefulness of being able to do higher levels of quantification. He says that the important reason for studying vulnerability is to provide the basis for intervention, to find out that what needs to be done, who needs more help/assistance and where States, NGOs, and others should focus. Prof. Jayaraman emphasizes the difference between risk and vulnerability. The entire population risks the various negative effects, some more, some less according to locational difference, but there is a specific section in every location which is unable to withstand the shock without suffering long-term or irreversible loss of well being. He says coping is an insufficient concept, as it does not probe the long term or irreversible loss of well being. Speaking at the National Consultation of the All India Peoples’ Science Forum in Mumbai in July 2001, Prof Jayaraman, who is, Professor at Centre for Science, Technology and Society, School of Habitat Studies, Tata Institute of Social Sciences, Mumbai said that such studies should help us decide the kind of funding, financial assistance required by the most vulnerable. A vulnerability study should premise itself on and take into consideration the following assumptions:
i) A good index should discriminate well – depending on vulnerability. ii) There will be no universality in solutions as these would vary according to agro-climatic,
ecological, geophysical features. iii) There are a large number of variables that determine vulnerability. This along with
differentiation across groups, will result in non-standard interpretation. Thus rather than look for uniformity of variables, it may be fruitful to arrive at socio-politico-technical decisions.
Thus this study revolves around those who live near drains, sewage, who are susceptible to floods, landslides, whose houses provide less protection for their family and possessions. In terms of coping it looks at those who are least capable to cope with impacts on health, injury, death, those who are not able to take short term measures like moving family, belongings, money, utensils, beddings etc just before the flood or disaster hits, and those who are unable to deal with loss of property or income. Many of the devastating impacts occur even without even being recognized as climate change related. It is also in these areas that transformation action, economic, social and environment action is most needed. Thus this study focuses on these elements, and is basically anecdotal in nature, rather than quantitative.

Vulnerability Assessment: Urban Areas: A Pilot Study 9
II.2 The Process of the study. This study focuses on vulnerability of the marginalized in an urban setting. To begin with an advisory group was formed mainly consisting of people from civil society and NGOs working with such marginalized communities, and academicians who have been engaged with social and civic issues. Prof. T.G.Sitharam (Chairman, CiSTUP, IISc), Dr.H.S.Sudhira(ex-IISc, Researcher, Gubbi Labs), Rohan D'Souza (Ph.D fellow, NIAS), Dr.Bidisha Nandy (Post-Doc fellow, IISc), Dr. Harini Nagendra(Adjunct Fellow, ATREE & Asia Research Co-ordinator, Indiana University),Vinay Baindur(Independent Researcher) are among the advisors.Issac Amrutraj(Activist), Wilma Rodrigues (SAAHAS) andPrema Manthesh(Ragpickers Education & Development Scheme-REDS) helped us in this study. At the first meeting of the advisory committees, it was decided that since the purpose of the study is to inform intervention particularly by civil society, the study should be conducted in those areas where NGOs of different kinds are working, so that the benefits of study can inform immediate and proximate action. The CSOs/local representatives identified to gain access to potential locations for the study included REDS, M. Issac Amruthraj, CIEDS, IYCN. After an initial survey of the areas recommended by local CSOs, a comparison chart of all the areas surveyed was prepared to identify the best locations for the study. Comparison chart included the demographics, location, infrastructural amenities, general living conditions within the slums, usage of resources and a preliminary characterization of the coping strategies encountered in each slum. It was also decided to choose three types of slum settings a) an old slum naturally formed by early urbanization, b)a rehabilitation or artificially created settlement and c) a peri-urban settlement, which is now urbanized. It was decided that in view of the purpose of the study, the nature of the issue, and the time framework, it was decided that the study should be based on intensive interaction with a small group and should centre itself on informing us about the understanding of and response to those areas and indicators of vulnerability that are being discussed at the macro level, and give us insights into its micro aspects, and ground level perceptions. It was therefore decided to do structured interviews based on a preset questionnaire one at the household level and another at the neighborhood level. Further in order to have some kind of relative reference to peoples interpretations, perceptions and assessment of each of the parameters it was decided to put some measurable quantities or determinable qualities of assets, amenities, and impacts. The questionnaires were prepared with inputs and guidance from Dr. Sudhira. This questionnaire is designed to elicit information on the socio-economic and demographic characteristics, access to essential civic amenities, climatic changes and to some current issues, experiences and coping strategies. The parameters and indicators which have bearing on vulnerability in general and climate change were identified as individual’s personal background – migratory status, usage and management of natural resources (water and energy), the infrastructural deficits as well as strengths. Perceptions of the community with respect to local environmental changes and the reasons attributed to the changes. In addition, the broad themes to be explored in the study include accessibility and consumption of water, sanitation facilities, solid waste management, energy sources, transportation, public and civic amenities, educational amenities, health care facilities and general health trends of the respondents, Livelihoods and environmental challenges posed due to these livelihoods, housing structure, and observed climatic changes.

Vulnerability Assessment: Urban Areas: A Pilot Study 10
The two questionnaires were pre-tested for clarity and concepts by interviewing three households from Parappana Agrahara. One staff member with two observers conducted the interviews. This was followed by detailed discussion at CED, among the researchers, and reactions sought from the advisory committee, by circulating the responses as well as at a meeting on April 11 2011 The local representatives from each area –Mr. Manjunath : Parappana Agrahara, Mr. Luvies : EWS Quarters and Mr. Pandurang : KS Garden then helped us identify the persons to be interviewed.
The household level questionnaire ( final version in Annexure X.3 ) were administered by detailed interviews with key members of the household. CED staff members themselves conducted the interviews, an essential feature of the study, which enabled individual level discussion on various episodes and grey interpretations of responses. One to one interviews conducted with the family members by the team in the case of administering the family questionnaires. 56 families in KS Garden, 54 in EWS Quarters and 43 in Parappana Agrahara were surveyed. Attention paid to developing a strong interpersonal relation with the respondents to enable them to talk freely and without reservations and thus help in the data gathering process. These interactions formed the basis of many individual stories that we have presented within the report. The neighbourhood survey included observation visits around the different parts of the slum, by the teams of three women investigators from CED, the same who were conducting the interviews. A gathering of community members formed the group to whom the neighborhood questionnaire was administered – the group could be as large as 20 members per community gathering. This enabled an understanding of the community’s background and their history in that community. Also, the kind of response measures and strategies adopted by each community became clearer at this level of interrogation. Data was keyed into a spreadsheet Annexure X.1 and quantitative and qualitative data separated, collated to form the final report. It should be noted here that the compilation of the report was done in the absence of the original director of the study, and the main researcher.

Vulnerability Assessment: Urban Areas: A Pilot Study 11
Stakeholder Workshop: Discussion on preliminary findings, validations of conclusions with peer
NGOs, and researchers
In the stake-holders meeting to discuss the preliminary findings, and validate the findings, it was eminently pointed out by Dr Sumi Kirshnan and Ms. Manjulika Vaz on that the results are not so much quantifications of the occurrence or incidence.
II.3Areas chosen for Study: Rationale and Process
The areas were chosen from their counterparts because of the following reasons: a) KS Garden: Old slum in the core of the city; vulnerability to climate changes marked by the
cramped houses and their proximity to the open drains, large number of homes. b) EWS Quarters: Typical example of relocation settlement and its attendant issues, the ability
of the area to convey the vulnerability of its community due to forces beyond their control and institutional in nature, Kutcha homes that provide an insight into the exposure of its residents to climatic extremes and how the community adapts to these issues.
c) Parappana Agrahara: Fringe habitat in the periphery of Bangalore, recently incorporated into the city’s limits, represents an ideal example of rural to urban transition, the community’s evolution to a more urban mindset, degradation of the nearby lake and possibilities of future disasters in the area because of this.

Vulnerability Assessment: Urban Areas: A Pilot Study 12
III People & Livelihood The households interviewed were mainly those where access of the local NGOs was maximum, and thus they represented the likely client groups of NGOs working in the area. Over 70% of the interviewed groups were women. They were more accessible and were not necessarily the “head of the household”.
Gender KS EWS PA Male M 14 19 14 47
Female F 41 35 31 107 Total 55 54 45 154
In our discussions, only fifty percent of those interviewed gave clear responses on whether they
had a rural or an urban background. A significant number of women said that they migrated due to marriage, a few for reasons of employment. About nine persons in EWS, said that they came to secure a good education for their children.
Background KS EWS PA Urban U 14 14 5 33 Rural R 10 15 11 36
Total Responses 24 29 16 69 out of 55 54 45 154
Reason for Migration KS EWS PA
Marriage 1 15 6 15 36 Moved with Household 2 1 5 6
Education 3 9 9 Work/employment 4 8 7 4 19
other-cheap rent 5 1 Total Reponses 25 28 19 72
out of 55 54 45 154 Work/employment
d M i4 &1 1 1
Livelihoods & Security
Most people come into cities to make a livelihood. Others to seek an education for their kids. Most of them have left behind agriculture based livelihood. While in general a major reason for migration would be displacement either by projects or for social reasons, the reason for migration among the respondents to our study is indicative of the population in these three areas. The remaining residents have been in Bangalore for over two generations are unable to give a reason for their coming to the city, but speculate that it was non-profitable agriculture.
Range of responses KS EWS PA
Low rainfall 2
Non profitable agriculture 1 1
Agricultural land acquired by the government for the 1
Shakeel Ahmed is a 52 year old agricultural worker from Bihar. He owns 5 acres of land in Bihar on

Vulnerability Assessment: Urban Areas: A Pilot Study 13
which he grew wheat. However with the onset of a labour crisis in the state, he could not manage. He come to Bangalore with his two sons leaving his wife behind, so that he could find a job and give the children an education. Education is perceived as the prime economic mobility instrument. Shakeel now works as a security guard and stays in the tin sheds of EWS Quarters. Ganesh and his wife Venkatamma had no livelihood in Chitoor. They migrated to Bangalore and had to borrow Rs. 20,000/- from a brick kiln owner. Today both of them are working in the brick kiln as well as tend to the sheep of the owner, almost as bonded labour, in return for Rs-400 per week towards food expenses. In Bangalore, the poor have to be content with whatever work comes their way. With all the effort, a majority of them earn less than Rs. 5000 a month. It goes up to Rs. 10,000/- per month. .
Even the higher income groups find it impossible to get out of the slum and go in for formal housing. Further, due to lack of security of tenure, and their inability to take significant measures against major perturbations individually, they can only resort to temporary and make shift arrangements.
In terms of occupations, they are usually coolies, or service workers.
Occupation Number of respondents KS EWS PA Coolies: 46 Coolies 14 12 20 Service Workers: 30 Drivers (taxi, lorries) 5 0 2 Truck and lorry cleaners 1 0 0 Hotel workers 0 2 0 Carpenters 1 0 0 Auto drivers 4 0 0 Cable operators 1 0 0 Contractors 0 0 1 Caterers 1 0 0
05000
10000150002000025000300003500040000450005000055000600006500070000
K13
K12
K47
K30
K27
K25
K41
K43 K7 K16
P17
P13 P6 P39
P20
P15
P37
E12 E9 E13 E6 E10
E40
E32
E43
E30
Monthly
income
Respondents from Kader Sharif From Parapanna Agrahara From EWS quarters
Monthly income

Vulnerability Assessment: Urban Areas: A Pilot Study 14
Tailors 2 0 1 Painters 2 0 1 Electrical repair 1 0 0 Welders 1 0 0 Grocers 4 0 0 Service Jobs: 24 BBMP Workers 5 1 3 CMC workers 1 0 5 Watchmen 0 2 1 Choultry helpers 1 0 0 Office cleaners 3 1 1 Employment: 9 Factory supervisors 1 1 1 Senior factory employees 1 0 0 Social workers 1 0 0 Acid factory employees 0 0 1 Garment workers 0 0 3 Informal Work: 33 Domestic helps 13 14 5 Child caretakers 0 0 1
The women tend to take up jobs which are part-time, like domestic help so that they can take care of their household duties. Further the burden of dealing with dampness, water logging, heat strokes, all climate related impacts falls on them. Vasanthi, is a single parent who migrated when agricultural labour was scarce in Tiruvannamalai, and has been working as working as domestic help for about 10 years. She has now taken up a house keeper’s job at the Bangalore Club. K32 for example is a grocer by occupation. She also owns a goat. The vegetables left over at the end of the day after her business form her goat's feed. Gowramma has been rearing goats for the last 15 years. She was also cultivating their two acres of land for Ragi, Paddy and vegetables, but the land has since been taken over. She laments the fact that she now has to buy food. In fact food is the major expense, and the women in slums are usually seen foraging for job to ease the situation. P19 has a small kitchen garden in her backyard, where she grows vegetables that serve her family's needs. She grows runner beans, brinjals, fenugreek etc.

Vulnerability Assessment: Urban Areas: A Pilot Study 15
Women in EWS selling cooked food
On the other hand Munialappa who has one acre in Parappana Agrahara, still grows one crop of ragi, and considers the 30 sacks that he gets from it, to be best security and has therefore refused to sell his land. He also has two cows, a pair of oxen and 15-20 sheep. He has fenced his land with silver oak trees, and has a borewell. He is now planning to dig pits around his farm in order to allow rain water to recharge the ground water.
Provisions procured KS EWS PA
Provisions from ration shop 12 2
Food from open market 12 2
From both ration shop and open 1 1
Either ration shop or open market
Supplement the ration with purchase 1 1
Bringing from Village 3 1 1
No response 36 39 39

Vulnerabil
Herding sh
ity Assessment
heep at Parap
t: Urban Areas
anna Agrahara
s: A Pilot Study
a
y 16

Vulnerability Assessment: Urban Areas – A Pilot study 17
IV. Habitat
KS Garden (KSG):
The Kader Sharif Garden Slum is in the heart of the city near the busy double road and Lalbaug road and is more than 90 years old. Phase I of the slum has been notified and the land has been transferred to KSCB(Karnataka Slum Clearance Board). Phase II is yet to be notified and the case is pending in the court. The slum is an old unplanned settlement consisting of around 1500 houses. The main approach road is at an elevation while the interior regions are very low lying. Thus the houses closer to the roads which are at a higher elevation don’t get flooded. The more well-to do, have retrofitted or re-built their houses after elevating them by two to three feet. This seems to have exacerbated the problems of the poorer people, as the flooding that they experience is more severe. The slum boasts of a community toilet facility as well maintained by three persons paid directly from the collections of usage. The slum has numerous kabaadi (paper and solid waste) recycling shops. There are many small transport operators closeby which provide employment opportunities. The people are mainly early migrants from Tamil Nadu, and have settled here for many generations. Most people are service workers like plumbers, painters, masons, carpenters, coolies and drivers. CIEDS (Center for Informal Education and Developmental Studies) originally started working with this group, and set up “Shramik” as a cooperative to take up these works for households around. This group now specializes in low cost construction, using Laurie Baker techniques, which has eventually led to the formation of the Centre for Vernacular Architecture. The area is close to the BBMP (Bruhat Bengaluru Mahanagara Palike) office, and about 200 of them at present work in BBMP at various levels – peons, assistants, clerks etc. It is also close to the KR Market

Vulnerability Assessment: Urban Areas – A Pilot study 18
(Bangalore City Market) and many women retail vegetables in the locality after buying the older veggies at the main markets at low prices. Some of the women breed chicken, hen and goats. The goats feed on the waste vegetables. The women also work as domestic help in the neighborhood. The people are mainly high schools dropouts, with a few degree holders. EWS Quarters(EWS)
The EWS quarters consists of about 1600 houses. The settlement is over 20 years old. It has been notified and people have been issued identity cards, though they may not be the original allottees. The slum is so called because it was originally a complex of three storied concrete houses under the economically weaker section programme. The original allottees got rooms of 125 square feet each for Rs. 42000/- payable over a period of 14 years under a HUDCO loan. However the buildings started collapsing after paying the first installment of Rs.2000/-. On its collapse, people were shifted to tin sheds, which did not have doors, or any amenities. Over time the residents made make-shift arrangements letting out the grey water from their houses. Some have dug pits in front of their house. In some of the lanes, residents got-together and constructed drainage of pipes, leading the grey water to the storm water drain on the main road. Two waste management units operated by Saahas and Center for Social Action are located in the area. The location is totally devoid of any tress and vegetation, and is largely low lying. The people are mostly service workers comprising painters, welders, carpenters, auto-rickshaw drivers as well as coolies and security guards,. The women work as domestic help in the nearby areas of Ejipura, Viveknagar and Koramangala. The area is surrounded by middle class residences and shops namely Samatha Nagar, Koramangala Main

Road, Passport Office, Bangalore One Center etc. Christ University and Infant Jesus Church are also prominent institutions in the area.
Parappana Agrahara(PA)
This is an old village which has been recently integrated into the BBMP limits and is still technically a village, and not yet notified as a slum. The village is located near the Electronics City, or rather the IT And Biotechnology hub of the city that has now come up near the area.
The main problem of the residents is that the Central Jail, which was relocated on the other side of the Parapanna Agrahara lake village in 2001, dumps all its effluents without much treatment onto the lakes. Around 150 acres of agricultural land belonging to this village was acquired to start the prison in the 80s. The area is close to the industrial area of Bommanahalli, and most of the male members of the family would work in the factories, industries there, while the women took care of the agricultural work. The women were therefore dependent for their livelihood on rain and on the lake, and therefore lament the deterioration of the lakes and environment. There were a few families living on fishing in the lakes. Other occupations included weaving. The current composition is mainly that of migrants from Karnataka
Vulnerability Assessment: Urban Areas - A Pilot Study 19

Vulnerability Assessment: Urban Areas – A Pilot study 20
and Tamil Nadu, who came as contract labourers. Now the village has quite a few Pourakarmikas who work in closeby areas such as Bandepalya, Singasandra, Garvebhavi Palya, all which have come into BBMP limits since last 2010 March. Many people of older generation have not received any formal education. Among the younger ones, there is a large number of school drop-outs. There are a few graduates though. The village has around 400-450 house, at a relatively high elevation. Very few families have toilets and bathrooms inside their homes and open defecation is the norm.
Nature of Housing Slums in the core of the city, as in Kader Shariff are generally very crowded. The living spaces are also very small, and as the family expands, it gets more cramped. K34 for example says that when their son got married, they rented another room in the neighbourhood, which they used as a bedroom. It becomes like an extension of the main home, and the inter‐room space is adapted for drawing purposes, as well as for drying clothes, water storage, resting on a hot afternoon. Given the continuous retrofitting, slum dwellers, except in the extreme cases do not see their habitat in static terms like katcha or pucca. They are all somewhere in the continuum between the two.

Vulnerability Assessment: Urban Areas – A Pilot study 21
Type of House KS EWS PA Katcha 1 3 50 2 55
Semi Pucca 5 7 6 13 Pucca 10 28 2 29 59
Total Responses 38 52 37 127 out of 55 54 45 154
The people are able to characterize the type of flooring, walls, and roofing more clearly. In KS Garden the roofing is mainly asbestos sheets, flooring and walls of cement. Some in KS Garden even had tiled flooring. EWS scores badly because of the temporary nature of tin construction with a large number of mud floors.
Type of Roofing KS EWS PA Grass/Thatched 1
Tarpaulin 2 Wooden 4 1 1
Corrugated Tin sheet 5 50 1 51 Corrugated Asbestos
sheet 6 33 1 32 66
Tiled 8 6 1 1 8 Cement/Slab 10 11 0 4 15
Total Incidences 53 52 39 144 Total Responses 47 52 39 138
out of 55 54 45 154 Asbestos and Tiled 6 & 8 1 1
Asbestos and Cement 6 & 10 2 2
Type of flooring KS EWS PA Mud 1 0 25 2 27
Brick 2 Stone 4 1 2 3
Cement or Red Oxide 8 29 25 31 85 Tiles 10 17 6 23
Total Responses 47 52 39 138
out of 55 54 45 154
Type of Walls KS EWS PA Tin 1 50 50
Mud 2 11 4 15 Stone 6 Brick 8 4 3 7
Cement 10 35 2 31 68 Total incidence 52 52 38 142
Total responses 48 52 38 138 out of 55 54 45 154
Mud and Cement 2 & 10 2 2
The houses of the respondents to our study within Kader Sharif were for the most part pucca to semi pucca structures, the only exceptions being K2, K3, K9, K12, K13, K25 and K31 who lived in semi pucca
Vulnerability Assessment: Urban Areas – A Pilot study 22
dwellings with tiled roofs, mud walls and red oxide, floors that increase their exposure to the natural elements. K4 lives in a completely katcha frame where the roofs were thatched and the walls were made of mud. The monthly income of the respondents who lived in the semi pucca homes ranged between Rs. 1,800 to Rs. 4000, an exception here again being K13 who has no source of income. K13 is an elderly woman whose husband has passed away and whose children have abandoned her. She however has the land on conditional ownership, but meets her essential requirements through the generosity of her neighbors. This low scale of income in these families could account for the houses not being renovated in time to stop the ravages that nature inflicts on them.
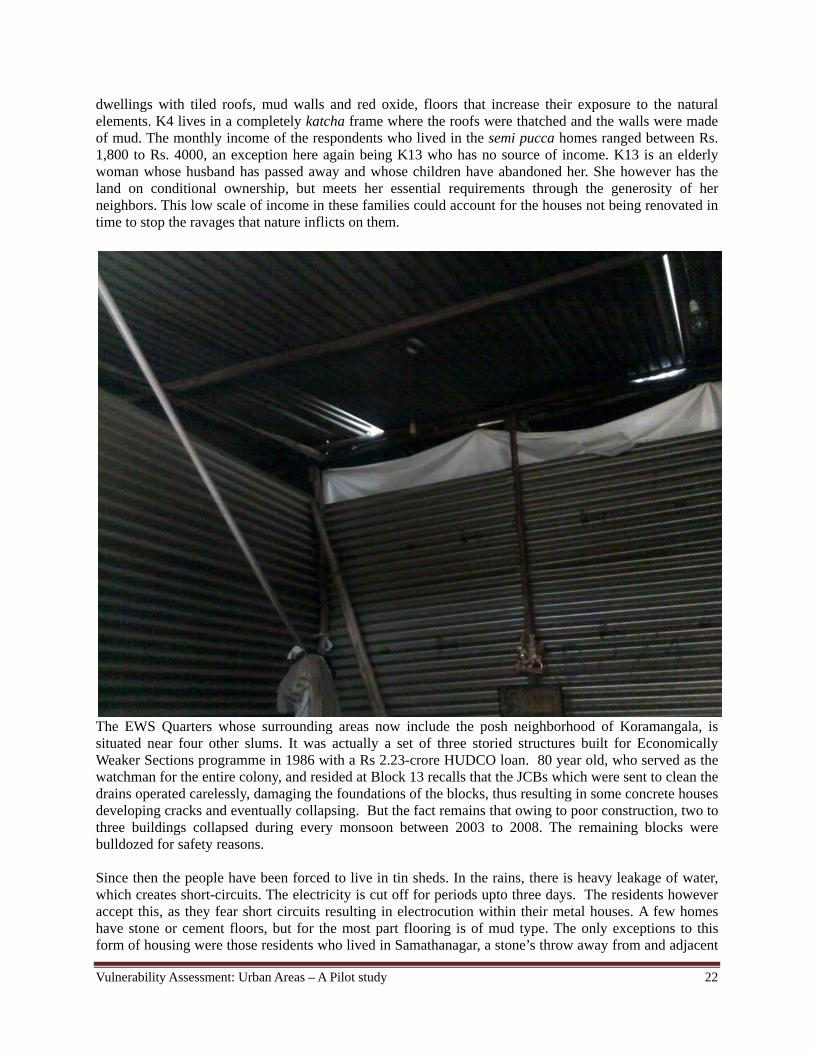
The EWS Quarters whose surrounding areas now include the posh neighborhood of Koramangala, is situated near four other slums. It was actually a set of three storied structures built for Economically Weaker Sections programme in 1986 with a Rs 2.23-crore HUDCO loan. 80 year old, who served as the watchman for the entire colony, and resided at Block 13 recalls that the JCBs which were sent to clean the drains operated carelessly, damaging the foundations of the blocks, thus resulting in some concrete houses developing cracks and eventually collapsing. But the fact remains that owing to poor construction, two to three buildings collapsed during every monsoon between 2003 to 2008. The remaining blocks were bulldozed for safety reasons. Since then the people have been forced to live in tin sheds. In the rains, there is heavy leakage of water, which creates short-circuits. The electricity is cut off for periods upto three days. The residents however accept this, as they fear short circuits resulting in electrocution within their metal houses. A few homes have stone or cement floors, but for the most part flooring is of mud type. The only exceptions to this form of housing were those residents who lived in Samathanagar, a stone’s throw away from and adjacent

Vulnerability Assessment: Urban Areas – A Pilot study 23
to the EWS Quarters. These residents were E8 and E9, whose homes were pucca with E8 having mold roofing as well. She has witnessed the roof of the tin sheds in poorer homes fly off during heavy storms. E9 who had a pucca home with asbestos roofing, has settled on the land, however unofficially. Shakeel Ahmed, 52, a security guard in Bangalore, has been living in EWS quarters for eight years. He hails from Bihar. He was owning 5 acres of land, where he grew wheat. Due to a shortage of agricultural labour there, he was not able to continue his agricultural operations there. Ahmed felt that he needed to educate his children, and therefore he brought his two sons to Bangalore and left his wife behind to look after the fields. He now lives in a tin shed in EWS quarters. During the rainy season he protects himself by putting tarpaulin sheets on the roof and on the walls. Parapanna Agrahara still has a rural feel to it. Its houses have been developed over time, and many of them live in pucca houses. As they were situated close to industrial development areas, many of them have jobs in factories and have been able to invest in their houses. The exceptions are in semi pucca dwelling (P3, P9, P25, P27, P30, P34, P38, and P43) The income of these respondents range from Rs.2500 to Rs.5000, the only exception being P38, who having an income of Rs.10, 000 did not ascribe to the hypothesis that lower the income, the poorer the nature of housing in this locality. P41 was the only respondent interviewed who lived in a katcha dwelling. Her family’s income was Rs.4000. While it follows that in general within the studied areas and among the respondents interviewed, the nature of housing is not a direct function of the income, it has been noticed that people who have low incomes tend to undertake fewer renovations or retrofitting within their homes, making them more vulnerable to experiencing harsh weather conditions in a more acute manner. A very important indicator of ways of coping became apparent to us when we visited the EWS quarters in July during the rains to verify some unclear facts. Many people have re-done their homes by cementing, or upgrading their bathing spaces. It seems to be a regular pre-monsoon activity. Even the government works tend to fructify just before the monsoon as we saw that a full stretch of new tin sheds had been constructed and people who were in very old tin sheds have moved into these new ones.

Vulnerability Study: Urban Areas – A Pilot Study 25
V. Civic Amenities V.1 Sanitation & Waste In Bangalore, the system of sewers for the conveyance of domestic and industrial waste water
through underground drainage system was introduced in the year 1922. It initially was confined to heavily populated area in the heart of the city and although a gradual extension took place then onwards it was not until 1950 that a major programme of sewer construction was commenced.
With the formation of the Board (BWSSB- Bangalore Water Supply And Sewerage Board) in
1964, the programme to provide Sewerage system in the unsewered areas was taken up in a phased manner and the treatment of sewage before it is led into the natural valleys was also tackled. (http://www.bwssb.org/sewerage_system.html).
Both sewerage and storm water flow by gravity beyond the cityi.However it is widely known

Vulnerability Study: Urban Areas – A Pilot Study 26
that the sewerage treatment systems are well below par in the city. Further, expansion of the sewerage infrastructure in the city can treat only 18.6% of the city’s total sewage output. Furthermore, in many parts of the city, the network of pipes that connect the STPS(Sewage Treatement Plant System) to the drainage is missing, old or damaged and industrial effluents are being let off into storm water drains, further impacting the city’s natural water bodiesii
Living in overcrowded conditions brings in its own hazards, primary among them is the
required intensity of Sanitation and Solid Waste disposal facilities.
The following are the incidence of various sanitary amenities among the persons interviewed. Bath Facilities KS EWS PA
Open water bodies – lakes/ponds 1 0 Community baths- paid 2 2 2 4
Community baths – free 3 2 2 Individual baths at home 4 53 50 41 144
Total Responses 55 52 43 150 out of 55 54 45 154
Purification of Water KS EWS PA None 1 33 38 22 93
(2)Filtering 2 6 2 13 21 Adding chemicals – alum/potassium permanganate 3
Boiling 4 14 10 15 39 Total incidences 53 50 50 153 Total responses 52 51 40 143
out of 55 54 45 154 none& boiling 1&4 1 1 2
Filtering& Boiling 2&4 9 9
The household interviews in the three areas revealed that KS garden, which is in the heart of
the city, and the oldest, had BWSSB drainage connection, whereas in the so called planned settlement under economically weaker sections, the connections were to open drains in 27 out of the 54, and 12 households have a pipe going to the corner of their own shed. And in Parappana Agrahara, which has only recently been brought into the corporation, 16 let their grey water into open plot nearby whereas the seven who had septic tanks for their toilet, claimed to let their grey water into the same pits..
Grey Water Drainage KS EWS PA Pipes leading to neighbouring public/private property 1 6 16 22
drains leading to stormwater drainage facility 2 1 27 3 31 Open drains leading to collecting chamber 3 4 12 16 32
BWSSB sewerage connection 4 47 4 51 Total Responses 52 49 35 136
out of 55 54 45 154
EWS Quarters, the tin sheds have not been provided with drainage facilities. The families that live towards the periphery of the slum, facing the main entrance divert the sewage generated in the homes to the open gutter that lines the street. We also observed one family diverting the sewage to a pit in the corner of the shed. This pit was being cleaned using bare hands by the residents of that shed.

Vulnerability Study: Urban Areas – A Pilot Study 27
Kader Sharief Garden boasts of an official sewage connection from BWSSB. However since the lanes are very narrow, the cylindrical concrete chambers which were constructed in between houses, are either too small or at a shallow depth. Due to poor construction and maintenance, there is seepage of rainwater into the chambers raising the level of sewage above the inflow mark, resulting in the sewage flowing back into the toilets, as well as the bath and wash spaces in the houses. It is for this reason that 47 persons prefer to use the community toilet system.Only 9 people have individual toilets using the BWSSB facility. In the neighbourhood discussion, the people estimated that only 400 houses had internal toilets, whereas the 24 cubicle community toilet served the remaining 1700 families. We also observed that many children do not use the toilets.
Toilet Facilities KS EWS PA Open fields 1 1 23 24
Community toilets – paid 2 47 41 88 Community toilets – free 3 1 1 Individual toilets in home 4 9 9 21 39
Total Incidence 56 52 44 152 Total response 55 52 44 152
out of 55 54 45 154 Paid & Home 2&4 1 1
In the event of heavy rains, when overflow levels are reached, low-lying areas within the slum are inundated by a mixture of sewage as well as storm water.
The community toilet system here is two sets of twelve toilets built by the government in 2005.The toilets are maintained by the community. Users are charged Re 1 per use, and the proceeds are shared by the three persons maintaining the toilet. Once every two months or so the pipes get clogged, and the workers attend to the problem immediately.

Vulnerability Study: Urban Areas – A Pilot Study 28
The number of toilets are clearly not enough, as there is a huge queue during peak hours, due to which the toilets are open as early as 4 am. All cubicles are kept locked at night, with the exception on one disabled friendly toilet, which is used in an emergency. The new toilet complex gets piped water which is a big relief as people do not have to carry water, and proper flushing takes place, as compared to the earlier 40 year old complex.
In EWS Quarters with over 1,512 households, ie population of 6500 people have to use 4
toilet complexes of 10 cubicles each, half of which have been dysfunctional for a long time. In addition, Clogging is frequent, nearly once every three days. Unlike in KS Garden, the community toilets are not maintained locally, rather they have to wait for authorities to fix any problem. 9 out of the 54 respondents to our questionnaire have made individual arrangements, which may not be very sanitary. One of them pointed out that the reason for opting for individual toilets was safety of the young girls of their household.
Parappana Agrahara is a village that has recently been introduced into the BBMP ward limits
and drainage connections are virtually non existent. There is no community facility, and a large number of people still do not use toilets of any kind. Among the 45 households interviewed, 3 had their toilets sending their black water to storm water drains, and seven into poorly constructed soak pits indicating major vulnerability in case of heavy rains. P29: Is a respondent whose husband works with an acid factory and who consequently suffers from chest congestion and asthma. The family has an individual toilet in their home which was constructed with support from the maternal home of the lady as they have young daughters and due to concerns regarding their safety with the practice of open defecation. Sewage water from their home flows into neighboring open plots and the family is voicing concerns about what will happen when buildings are constructed on these plots. They say that the community has been approaching the concerned authorities for a proper drainage connection for the last 2 years but to no avail. The house is in an interior location of the village and due to this it is often ignored by the garbage collection vans. Therefore she dumps her wastes into a neighboring plot and sets them ablaze once a week in order to keep the plot tidy.
The overall sanitation situation in all three slums, were such that they are very vulnerable to
rain, and with the increasing unpredictability of rains, particularly extreme conditions as are predicted in a climate changing environment, their vulnerability is bound to get worse. Thus reducing vulnerability of these slums would mean improving the sewerage and type of toilets facilities and the
Vulnerabil
various mW
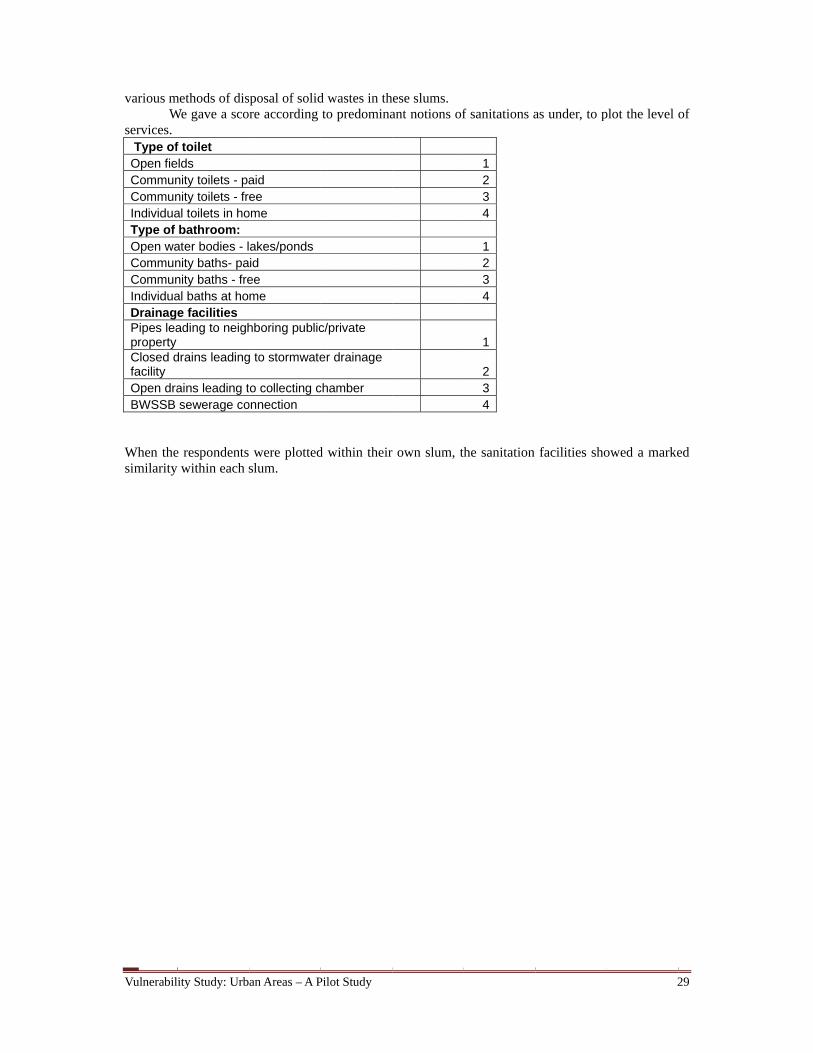
services. Type ofOpen fieCommunCommunIndividuaType of Open waCommunCommunIndividuaDrainagePipes leaproperty Closed dfacility Open draBWSSB
When thesimilarity
ity Study: Urb
methods of disWe gave a sco
f toilet lds
nity toilets - panity toilets - freal toilets in hobathroom:
ater bodies - lnity baths- panity baths - freal baths at hoe facilities ading to neigh
drains leading
ains leading tsewerage co
e respondents within each s
an Areas – A P
posal of solidre according
aid ee
ome
akes/ponds id ee me
hboring public
g to stormwate
o collecting connection
were plottedslum.
Pilot Study
d wastes in thto predomina
c/private
er drainage
chamber
d within their
ese slums. ant notions of
r own slum, th
f sanitations a
1234
1234
1
234
he sanitation
as under, to p
facilities sho
2
plot the level o
owed a marke
29
of
ed

Vulnerabil
ThEWS Quaslum, thergets bettepremises permanen
When wesignificanhigher inc
It is seen trange of residents this measParappananot a funcinfrastruct
Thsewers, anare not lik Disposal The dispoVans makthe Van. Rit is depostend to thforage andmotorisedis quite a
ity Study: Urb
his indicates arter using core is a correlaer. Thus indi
as well alonnce of dwellin
e plotted the snt change in thcomes is disce
that in Khadethese individwithin the sa
sure has beena Agrahara, hction of the totural need and
hus for any rond toilets at thkely to be mad
l of Solid W
osal of solid wke their roundResidents in Asited into the
hrow their wad they are gen
d vans to commess. E14 co
an Areas – A P
that it is relatommunity toiation, though icating that sngwith bette
ngs does not tr
same sanitatihe pattern of ernable.
er Sharief garduals range fame area. Witn incorporatehowever, a shoilet facilitiesd not so much
obust resilienhe communityde individual
Waste
waste in Bangd daily, and peApartments g moving van
aste into opennerally messy
me in, and so Complained tha
Pilot Study
ted to the hisilets even wha bit episodi
some familier housing. ranslate into a
on facilities, disposal of w
den only 14 ffrom Rs. 400thin EWS Qud for security
harp skew is os of the househ by the incom
nce to vulneraby level if not ply even amon
galore is relianeople are expenerally orga. Even so, man space/corney and smelly. Community bat waste water
tory of the slhen they haveic, showing as tend to inHowever, in
a better toilet
according towaste, though
families have 00 to Rs. 60
uarters, only 8y reasons anobserved, indehold. This sme in this are
bility, the compossible at th
ng the higher
nt on collectiected to com
anize a privateany residents ers. These spa
In most slumbins, are provir disposal sys
lum, with the e to pay for ian upward trecorporate a n Parappana facility in ma
income (chathe incidence
individual to0,000, on an 8 respondentsnd is not a fudicative of thesuggests that
ea.
mmunity wouhe individual lincome group
on of solid we down with e door to dooeven in so c
aces become ms areas, the ided. Generalstems was ver
majority in Kt. When we l
end as the natseparate toileAgrahara, th
any cases.
art below), the of higher ty
oilet systems aaverage hig
s have individunction of the fact that famthe facility a
uld have to invlevel. But sucps
waste in motortheir waste an
or collection, alled middle places for stby-lanes are
lly the entire sry poorly man
3
KS Garden anlook with eacture of housinet within thehe increase
here isn’t mucype of toilet fo
and the incomher than othdual toilets anheir income. Imily income arises out of a
vest in good ch investment
rized vans. Thnd deposit inand from theclass localitie
tray animals too narrow fospace around naged.
30
nd ch ng eir in
ch for
me her nd In is
an
ts
he nto re es to
for it

Vulnerability Study: Urban Areas – A Pilot Study 31
Solid Waste Disposal KS EWS PA Throwing into empty plot 1 2 12 14 Throwing into open drain 2 9 2 11
Segregating and composting 3 Burning 4 1 1 2
Community bins 8 41 4 3 48 Collection Vans 10 6 36 26 68
Total incidences 47 52 44 143 Total responses 47 52 37 136
out of 55 54 45 154 Throwing into empty plot & drain & burning 1,2,4 1
Throwing into empty plot & drain 1,2 2 Throwing into empty plot & collection van 1,10 4
V.2 Water availability & usage
Urban water systems will be affected by most of the predicted climatic changes: droughts will affect water supply and higher temperatures, besides increasing evaporation in supply lakes, could lead to the deterioration of waste & water pipes contaminating fresh water. This risk, sits over and above other factors which threaten urban water supply like deforestation of catchment areas, reduction of seepage due to urbanization, and contamination of aquifers by modern development. The BWSSB which supplies piped water to Bangalore sources it from the Cauvery river (about 80% of total water supply) and the Arkavathy river (about 20% of the total water supply)iii

Vulnerabil
In its webto 125 (gLPCD forpeople in slums and
The qualit
The graphcombinatireliant on
The Cauvdaily requresponden
lpcd of wwater respevery altewere toldtherefore
ity Study: Urb
bsite, the BWSgross) liters pr a city like BBangalore is
d poorer areas
ty of water re
h below shoion of BWSSMunicipal B
very drinkinguirement of wnts in KS Gar
water. Of thepectively. Hoernate day, wid that over 50they have to r
an Areas – A P
SSB admits thper capital peBangalore. Ho
only about 4s.
eceived in any
ows that bothSB Cauvery wore well wate
g water supplwater, if not rden, only 14
ese 14 responowever, K4, Kth K55 acces
0-60% of the rely on neigh
Pilot Study
hat the per car day (LPCDwever, the pe
40-45 LPCD.
y slum, varies
h the old citywater and borer.
y is limited tmore for em respondents
ndents, a few K12, K38 ansing only 3 pdwellers do
hbours for the
apita water supD) which is ber capita availOne of BWS
s depending o
y area settlerewell water,
to alternate dmergencies. T
collect over
like K6 and d K55 have a
pots of water inot have a Bdrinking wat
pply at presenbelow the Nalability of waSSB mandates
on the source
ments, KS G, whereas Par
days. Peoplehe graph abo30 pots of wa
K16 capture access to onlyin a day. In thBWSSB Cauvter requiremen
nt in Bangaloational Standaater for vast ms is to provid
and extent of
Garden and Erappana Agra
e have to storove tells us tater which is
at about 60 y less than 10he neighborhovery water cnts.
3
ore is about 10ard of 150-20
majority of poode bore wells
f pollution.
EWS source ahara is main
re double thethat of the 5about 120-15
and 40 pots o0 pots of watood survey, wonnection, an
32
00 00 or in
a nly
eir 55 50
of ter we nd

Vulnerability Study: Urban Areas – A Pilot Study 33
The piped water supply near each house in EWS Quarters comes from water tanks containing bore well water on every alternate day. The average number of pots of water collected range between 10 and 20, approximating to 50-100 lpcd per capita per day. Of the 54 respondents interviewed only 6 respondents collected more than 20 pots of water. In fact E5, E6 and E9 have reported usage of only BWSSB water for their domestic uses. E24 and E30 stood far below the average at 8 and 2 pots of water respectively. This is usually due to the fact that the men and women are away at work at the time of supply. These families have to resort to reducing the water usage by things like bathing on alternate days.
To make up for the shortfall of water, the lower consumers, use the water from the community level borewell for cleaning, washing and other purposes.
Cooking Water source KS EWS PA BWSSB P 34 47 81 Borewell B 5 5 29 39
Tanker T 1 1 Community Tap CT 1 5 6
Rain Water Harvesting RWH 0 Total incidence 41 52 34 127
Total Responses 35 50 34 119 out of 55 54 45 154
BWSSB & Borewell (P & B) 5 2 7 BWSSB &Borewell& tank (P&B&T) 1 1
Bathing Water Source KS EWS PA BWSSB P 30 42 72 Borewell B 19 48 29 96
Community Tap CT 2 5 7 Rain Water Harvesting RWH 1 4 5
Total incidences 51 91 38 180 Total Responses 34 50 34 118
out of 55 54 45 154 BWSSB & Borewell (P & B) 17 40 57
BWSSB & Borewell &Rain (P & B & RWH) 1 1 Borewell & Rain (B & RWH) 1 2 3
Community Tap & Rain (CT & RWH) 2 2
Cleaning Water Source KS EWS PA BWSSB P 22 41 63 Borewell B 25 49 29 103
Tanker T 2 2 RWH RWH 1 6 7
Community Tap CT 2 5 7 Total incidences 51 91 40 182 Total Responses 22 50 34 106
out of 55 54 45 154 BWSSB &
Borewell&Community Tap P & B & D 1 1
BWSSB & Borewell P & B 16 40 56 BWSSB & Tanker P & Tanker 1 1
BWSSB & Borewell &Rain P & B & RWH 1 1

Vulnerability Study: Urban Areas – A Pilot Study 34
BWSSB & Rain B & RWH 1 2 3 Community Tap & Rain CT & RWH 4 4
Rainwater collection KS EWS PA Y 7 17 13 37 N 8 8
Total Responses 7 17 21 45 out of 55 54 45 154
Some even salvage whatever rainwater they can from leaky roofs. The community also has to contend with contaminated water. E19: mentioned TV9 and other television channels filmed the bad quality of water, filled with worms and other problems, but after all that hue and cry, the problem still persists. There is also the problem of water mafia who charge the users for this free water. Thus they have a vested interest in keeping water in short supply.
In Parappana Agrahara, the water source is two community level bore wells supplied by the CMC, before the area was incorporated into the BBMP. Compared to earlier when they drew water from open wells, they do collect what they consider sufficient water, as they now have to ferry it for shorter distances.
P2 recalls when she had moved to Parappana Agrahara after her marriage, the lake had a lot of water. Now it is full of weeds. P3 mentioned how lower castes were not allowed access to open wells in the Reddy locality, and were dependent on the lake for meeting their water requirements. However since the jail has been relocated to this area, the water of the lake has slowly become contaminated.
Over the years, the water level in the borewell has gone down, and the water contains a lot of salts. The open wells have been filled up. In earlier days the community, used to draw water from the lake for its domestic purposes including drinking. However, the effluents from the recently shifted Central Jail, has made the water unfit for consumption. Only 4 families among the interviewed people, receive water everyday from the borewell close to their homes.
P5 has a big synthetic tank in which she stores water. She does allow her neighbors to use this water in emergencies, but that is rare. But as mentioned by P7, the water source is drying up. He said that 5-10 years ago, one used to get 4-5 inches depth of water every day from the bore well, whereas today, not even 2 inches depth of water is available from the same source. The open wells have already dried up. This situation is likely to get exacerbated due to climate change.
The other issue in Parappana Agrahara is the presence of salts, which forms a thick deposit in the vessels upon heating. Thus the residents avoid boiling water. They also cannot use geysers or immersion heater rods.
The Comptroller and Auditor General has observed that 53% of the 920 MLD(Million litres per day) generated iv by Bangalore is discharged directly into stormwater drains and lakes, contaminating water bodies and groundwater". The groundwater quality in BMR(Bangalore Metropolitian Region) was affected due to presence of pollutants in excess of permissible limits". (http://www.dnaindia.com/bangalore/report_over-half-of-bangalore-s-sewage-flows-into-storm-water-drains-lakes-report_1520311)
Even this is in short supply as is evident from the complaint by one of the respondents, that certain gangs control this water and charge a fee for what is supposed to be free to the community.

Vulnerability Study: Urban Areas – A Pilot Study 35
Even in such a situation, people do not have the means and wherewithal to treat the water. Most of the people interviewed indicated that there do not boil or treat the water. K12 said that the shortage (high cost) of kerosene makes it impossible to boil water.
V. 3 Energy
Energy Use is a critical contributor to Climate Change. It is also a critical factor for development. For the Urban poor, Energy use is mainly in four areas
a) Lighting and Heating b) Conveniences like Fans, TV, Electric Iron c) Cooking Both Electricity based like Mixer, Grinder, and cooking fuel like Kerosene,
firewood and LPG. d) Transportation to Work.
ELECTRICITY: In the City, the most convenient method for Lighting and Heating as well as conveniences would be electricity. The Urban poor who have settled into slums do have basic access to electricity. However within Parappana Agrahara, we were told that there were cases where residents had not been provided with electricity at all.
Electric connections KS EWS PA Metered electric connection 41 0 16 57
Non metered electric connection 2 0 0 2 Free Connections from Pole 51 51
The Slum Declaration Act provides that slum areas should be provided with electricity and other amenities at a subsidized cost. Yet there are a few households which find it convenient not to have independent meters, and borrow electricity from neighbours by playing them a fixed monthly charge. The reason for this could well be a disconnection due to default in payment or other reasons. The Electricity infrastructure is very unstable. Open transformers, overhead transmission and distributions lines, ensure that every rain brings with it short-circuits, exposed wires etc. and extended periods of power cuts. Respondents from the area seem reasonably satisfied with the service except for the occasional load shedding. Unlike in rural areas, voltage fluctuation is not severe and occurrence of extreme low voltage is not perceived. A frequent complaint was that when disruption of supply does occur, it remains so for around two days. However in EWS power cuts associated with short circuits due to rains, are welcome, as a safety measure. During monsoons, given their unstable metal housing structures, the risk of electrocution is high. The usage pattern of the electricity given below, shows that the most predominant usage is one or two bulb, or fluorescent tubes for lighting, a fan for cooling, and TV for entertainment. The mixie is also in popular use. These along with one or two dysfunctional fridges, or washing machines, seem mainly items which have been salvaged or hand-me-downs, as many were reported in state of disrepair.
Lighting KS EWS PA Bulb 30 53 23 106 Tube 30 7 37
Cfl 6 15 21 Bulb&CFL 0 2 2
Bulb & Tube 13 13 Cfl & Tube 2 3 5
Total incidences 81 53 50 184 total response
out of 55 54 45 154

Vulnerability Study: Urban Areas – A Pilot Study 36
Utilities KS EWS PA Fan 44 25 36 105 Iron 11 8 8 27
motor 1 1 Total Incidences 55 33 45 133 Total Responses
out of 55 54 45 154
Cooking KS EWS PA Mixie 41 21 31 93 Stove 8 2 10
Coil 3 3 total Incidences 52 21 33 106 total responses
out of 55 54 45 154
Luxury KS EWS PA (FRD)Fridge 3 2 5 10
Wash mc. 2 2 total incidences 5 2 5 12 total responses
out of 55 54 45 154 2 Fridges ar not in working conditions
Entertainment KS EWS PA Radio 1 2 3 Tape 1 1
TV 43 28 33 104 Radio &Tape&TV 1 1
Radio &TV 1 1 Total incidences 46 28 36 110 Total responses
out of 55 54 45 154
: COOKING FUEL: LPG is considered the most suitable cooking fuel, both from aspiration as well as climate change point of view. Praful Bidwai in his book “ An India that can say yes”, in fact recommends distribution of subsidized if not free LPG to the poor, as he believes it has a multiplier effect.
Fuel for Cooking KS EWS PA kerosene K 45 36 28 109 Firewood FD 17 25 30 72
Gas LPG 10 17 27 54 Dung D 11 11
Total incidences 72 78 96 246 Total responses 53 54 44 151
out of 55 54 45 154 K + FD 17 20 19 56 K+LPG 2 1 12 15
K+FD+D 9 9 LPG+K+FD+D 5 5

Vulnerability Study: Urban Areas – A Pilot Study 37
LPG+K+FD 7 7 LPG + K + D 6 6
LPG + FD 3 17 20 FD + D 9 9
The table above shows slum wise, usage of cooking fuels. Of the 55 respondents interviewed in KS Garden, only 10 used LPG as a source of energy for cooking. In fact, within the slum the most commonly used fuels were a combination of kerosene and firewood. Kerosene in limited quantities was procured from the ration shops using the special card, while the same dealers supplied extra quantities of the same product at an exorbitant. Firewood is bought from local dealers at Rs.50 for 12 kilos. In Parappana Agrahara, the preferred fuel type for most of the respondents was a combination of firewood and kerosene. The usage of LPG was observed more in this area when compared to KS Garden, 27 respondents out of the total of 45 interviewed used LPG either alone or in combination with another fuel source.
In EWS Quarters, where the respondents were used to a different kind of lifestyle in the past years, the usage of LPG was seen to be more widespread than in KS Garden and Parappana Agrahara, irrespective of the income of the respondents. Here too, only 13 respondents used LPG as the only fuel source for their cooking needs. 19 respondents of the total 54 interviewed, made use of LPG as a fuel source, of which, only 2 respondents used it in conjunction with kerosene and firewood.
The usage of the different fuel types, in the case where the respondents used a variety of fuels was of a conservationist type. Among the families who used LPG in association with kerosene and firewood, in all the three areas, it was observed that kerosene was used in the event of scarcity of the gas facility, while firewood was used to heat bath water. This measure of using firewood to heat bath water was seen to be a method of conservation of more valuable( in terms of cost) fuels like LPG and kerosene

Vulnerability Study: Urban Areas – A Pilot Study 38
for meeting the family’s food demands for a longer period of time. The same pattern of usage was observed in the families, which made use of kerosene as a fuel in association with firewood and other biomass. Kerosene was used to secure the cooking demands of the family, while bath water was always heated using the firewood.
However, the system has its own set of issues. The supply of kerosene through the ration card is limited to 7 liters per family per month. Unscrupulous practices by the dealers mean that the family does not get even 5 liters per month of the resource. They are forced to procure the kerosene then, at exorbitant rates that tax the family’s already meager incomes. In order to deal with this issue, some families use the limited amount of kerosene provided initially, and then switch over to firewood or other biomass, to meet their cooking demands for the remainder of the month. The usage of firewood however, is hampered in the monsoon months, where setting an open fire is not a viable option. The families then rely upon the black kerosene market to fulfill their demands.
It was observed that in all the three areas, the use of fossil fuel and inefficient burning of natural resources was the most predominant. A choice that was made for the respondents either due to lack of resources or their nature of accommodation, but one which is indicted in the name of black carbon, and has far reaching consequences in the context of climate change and its effects.
Among the people we interviewed, LPG was not pre-dominant, and they cited reason of lack of funds, and space. The decision is however influenced by the fact that waste organic and other material is easily available. This is supplemented with firewood and Kerosene stoves.
TRANSPORT: The main of public Transport is the bus service of the Bengaluru Metropolitan Transport Corporation (BMTC). Till recently these services predominantly served the main routes, with change-overs at key points like Shivaji nagar, City Market etc. Thus cheap second hand two wheelers autorikshaws ( three wheelers) became the preferred mode of transport. Most poor people took to walking to the feeder points or to two wheelers if their place of work was close enough.
Kader Sharief Garden is located between the busy thoroughfares of Mission and Lal Bagh Road. Thus while no bus comes into the slum, there are a large number of busses available at the feeder points. The roads inside the slums are too narrow for the buses, but numerous autos are seen plying up to the periphery of the slum.
EWS Quarters is located opposite the Bangalore One Center feeder point at Koramangala, where there are a lot of buses. The slum is accessible to emergency services like ambulances, fire response services and other vehicles. A good collection of autos also ply in the bylanes.
The village of Parappana Agrahara, is however a few kilometers from the Hosa Road Junction which is the feeder point on the route to Electronic City. While buses to the feeder point are plenty, buses into the village work erratically every half hour or so. Private bus/Van services or autos are also very limited.
MODES OF TRANSPORT USED:
Mode of Transport daily KS EWS PA Walk (substantial) 1 30 24 20 74
Bus 7 18 12 14 44 Two wheeler 8 3 7 5 15
Auto 10 3 3 other Car(driver) 1
Total Incidences 54 43 39 149

Vulnerability Study: Urban Areas – A Pilot Study 39
Total Responses 47 45 40 132 out of 55 54 45 154
Walk & Bus 1 & 7 5 1 6 Walk & Auto 1 & 10 2 2
Bus & Two wheeler 7 & 8 1 3 4
Transport in Emergency KS EWS PA Walk 21 18 17 56 Auto 19 18 8 45
Ambulance 2 1 3 Bus 2 3 7 12
Two wheeler 2 2 Car 1 1 2
Total Incidences 43 41 36 120 Total Responses 41 42 29 112
out of 55 54 45 154 Walk/Auto 2 2 4 Walk/Bus 2 2
Auto/Twowheeler 1 1 Auto/Bus 2 2
The most preferred mode of transport in KS Garden was walking to the place of work, followed by the usage of the public bus systems. Within Parappana Agrahara, which is a place constrained by the access to public transport services, the respondents either tended to walk or use their private modes of transportation. In EWS Quarters, interestingly, it was observed that 40 out of the total of 54 respondents interviewed tended to walk to their place of work. The usage of privately owned vehicles was also not restricted to the people with the highest income. In all the three areas, among the people who commuted daily using private means, a privately owned two wheeler was the most common. There was no individual among the interviewed who owned a 4-wheeler.
This graph tries to draw a relation between the distance travelled to work and the mode of transportation preferred by the respondents. People travelling longer distances tend to rely more on the public transportation system ranked 3, the people who travelled shorter distances walked to their destination for the most part. People travel medium distance for regular jobs or small businesses, prefer using rented autorickshaw or their own two wheeler, generally the very cheap second ones, which may be inefficient from the fuel consumption point of view but given the short distances they
0
2
4
6
8
10
12
K13
K15
K26
K45
K2
K20
K37
K8
P1
P13
P23
P39
P16
P37
P33
E9
E21
E31
E39
E46
E6
E26
Distance commuted to work- rank Mode of transport used everyday

Vulnerability Study: Urban Areas – A Pilot Study 40
have to travel, there is not incentive for them to acquire more efficient vehicles or spend money on maintenance.
It may be noted that in Parappana Agrahara, a vast majority of the people interviewed had only short distances to traverse, and therefore preferred walking or cycling as an alternative to the erratic bus service within the area. In EWS Quarters also, a large majority of respondent families had shorter distances to cover and as such the preferred mode of transport was by walk or the bus. In this slum, however, the distance travelled by the respondent dictates the ownership of a vehicle as seen from the graph. This pattern differs from what was observed in the other areas surveyed as in both KS Garden and Parappana Agrahara, the ownership of a vehicle was determined by their income.
In this context of climate change, this pattern observed in EWS Quarters, may be seen as a resilience building strategy against the current consumerist approach to ownership of vehicles. Here, need to traverse a large distance engenders a need to improve upon the mode of transport and while the distance remains shorter, other means of transport are seen to be preferred. Can this be translated into a policy framework, as a means to conserve fossil fuel and to ease the pressure on Bengaluru’s already chock full traffic scenario?
i http://www.bwssb.org/sewerage_system.html last accessed on 2 June 2011, at 3:05pm, IST ii BWSSB’s new plans for Water Conservation; The New Indian Express, Bangalore Edition, dated 23 March
2011. iii http://www.bwssb.org/help_faq.html last accessed on July1, 2011 at 11:13am, IST. ivhttp://www.schools.indiawaterportal.org/sites/schools.indiawaterportal.org/files/Bangalore_Water_Supply_Res
ources.pdf

Vulnerability Assessment: Urban Area – A Pilot study 40
Chikungunya K S EWS PA
M F M F M F T
2006 1 1
2008 1 1 1 4 7
2009 19 23 8 9 3 6 68
2010 5 16 4 9 34
2011 1 1
25 49 13 23 3 7 Dengue
K S EWS PA
M F M F M F T
2006 2 2
2008
2009 1 1 2
2010 1 2 3
VI. Health, Perceptions and Impacts of Climate Change
VI.1 Health
There are several environmental factors which dramatically influence the health of the marginalized urban population. Among the people interviewed too, the incidence of chickungunya was startling. In 2011, while the interviews were being conducted the incidence of asthama and conjunctivitis in Parappana Agrahara was abnormally high. The most significant cause seem to be the poor sanitation facilities, and dampness, heat and congested conditions of their habitat. These are conditions that get exacerbated due to climate change effects like heavy precipitation, extremes of temperature which add to conditions like overflow of sewerage, broken water and sewerage pipes, accumulation of water and degeneration of water bodies, contamination of open drains or collection of solid waste. In the KS Garden slum, even in the elevated houses, dampness seeps through the floors, making most particularly children vulnerable to colds, and chest infections. 35 year old Vasanti, for instance, lives in a low lying house. Even in the slightest of rain, her house is affected and the walls get damp. Vasanti works as a house keeping staff in the Bangalore Club. As her job brings her in close contact with dust and water, her living conditions make her very prone to cold cough and fevers. A large open storm water drain runs close to this slum. There is a lot of stagnant grey to blackish water in the drain which makes it an ideal breeding ground for mosquitoes. Indeed, the community has also had a recent outbreak of Chikungunya over 2008 and 2009, with very few individuals spared from infection. Chikungunya affected more number of females across all three locations. People in KS Garden are the most affected, perhaps because of overcrowding, and possibly because of the way in which the sewage is connected. Multiple members in a single household have been affected. For example all the family members of K10 were affected. 3 females and 2 males were affected from the family of K29. 3 females and 3 males were affected from the family of K48. 2 females and 3 males were affected from the family of K49. The newspaper had reported outbreak of Chikungunya in June 2008 in Bangalore. Since then, every year there have been reported cases of Chikungunya and Denguei.
Health Data Diseases related to quality of air: Chronic asthma patients -8, Conjunctivitis -33, Pnemonia-1, Wheezing -1, Water related diseases: Typhoid -18, Dysentery -3, Diarrhea- 4, Hepatitis A- 1 Vector borne diseases: Malaria- 4, Dengue- 7, Chikungunya- 73 Infections: Fevers- 23, four reported it as common among their children, Cold & cough 7 with three reporting it as common among children, worms 1, Others: Lice -3, Skin infection- 3, diabetes- 2, BP- 1, Heart disease - 2, Jaundice -1, Chicken pox -1, Cancer -1,

Vulnerability Assessment: Urban Area – A Pilot study 41
Traditional medicines for common ailments
KS EWS PA
Using various combinations of home remedies for common ailments
9 7 10
Prefer seeing a doctor 1 1
Take Over the counter medicines 1
No response 45 47 33
Within EWS Quarters too, the situation is no different. A large open drain which runs close to this slum is also used as a waste dump yard. Further many residences have had to resort to having individual toilet connected to soak pits outside their house. Since they have to be cleaned regularly, they are not properly sealed. Most families also dump their grey water nearby. Thus this leads to a concentrated breeding of disease vectors. As in KS garden, in EWS too there was a major outbreak of Chikungunya. In the fringe of Parappana Agrahara there is practically no drainage system. Many houses simply let their sewage into a neighboring empty plot of land, if not directly into the lake. A few houses have built soak pits. The effects of such practices are only getting worse as more and more plots are developed. Now that the area has been brought into the BBMP, there is an expectation of a sewerage and drainage system. But till then the situation is fast degenerating, what with extremely high levels of sewage, both grey and black into the lakes. The highly eutrophic effect from the nitrogenous sewage has resulted in 4 to 5 feet matte of thick weeds on the surface of the lake. The lake has also become a breeding ground for mosquitoes. 24 year old Yashoda who works as a pourakarmika (sweeper) with the BBMP, says that due to the rigors of her job, her nose gets clogged and that she often has cough and chest related difficulties. This is exacerbated as at her home, she is plagued by mosquitoes and has to use mosquito coils to repel mosquitoes through the night. She feels that as long as the sewage water from the jail is let into the lake, the mosquitoes will not reduce in their numbers around this area. So bad is the situation that many residents feel that instead of trying to re-vitalise the lake, it should be filled up, much like other lake areas in the centre of the land hungry city. P4 seems to be the lone dissenting voice and she feels that the vegetation cover of the area needs to be improved and that the mosquito menace would be curbed only if the lake is revived and the sewage inflow into the lake from the jail is stopped. Another important health hazard is the gradual increase in heat. While Bangalore, which was known for its salubrious climate, seems to be victim of the heat island effect caused by increasing construction, climate change is likely to make it worse. The biggest sufferers would be people living in these makeshift tin sheds, as they are in EQS quarters, as they feel the heat more acutely, and have reported very high incidence of heat stroke. E6 for example cannot use the fan because the bamboo used to hang it has started to crumble. All family members suffer from rashes on the skin due to excessive heat. Therefore they sleep outdoors at night which again makes them targets for the mosquitoes.
Issues of health are closely tied to belief systems, and folk remedies. In order to test whether
some of the changes of health status are attributed to extraneous origins and whether people have continued to take recourse to folk medicines, with what result, the respondents were asked to about religious beliefs affecting the health. It was generally found that except for Chicken Pox, most people clearly attributed degeneration of health to environmental and job conditions. In the case of Chicken Pox, there were a few families who paid obeisance to a Mother Goddess. Most persons did not say that they consulted a doctor at the onset of any ailment. Some did take recourse to herbal remedies. A few of the respondents resort to use of traditional remedies particularly various forms of kashayams indicating that resilience could be built around self-treatment. For example K3 considers consuming worm tablets as a remedy for most common ailments, suggesting that her experience is that most of the ailments are relating to feacal contamination. K24 on the other hand specifically mentioned taking ENO for most common ailments, which suggest that they have to do with stomach-related ailment and flatulence.

Vulnerability Assessment: Urban Area – A Pilot study 42
Most waited out the first few days, before consulting a doctor. This indicated that the costs and accessibility could be a determining factor. All this, albeit in a limited way suggests that a public health system which is free and efficient, and local is needed.
VI.2 Perceptions of Climate Change
All respondents, without exception had no understanding of climate change. There is however the perceptions that these are environmental changes. In the study we elicited their perception of temperature changes and rainfall patterns, ground water levels as perceived by water in the borewells. Other issues like flooding or water logging, and changes in water quality and quantity, provided us with an insight to their perception of issues which are major long term indicators on impact of climate change. Some of the people had specific perceptions of environmental change. P3 of Parapana Agrahara says “15-20 years ago, the area used to witness what we call “Jadi male”, which is characterised by continuous drizzles over 2-3 days. This phenomenon which used to occur at least 4-5 times in a year is completely missing now. She says that today the rain pours heavily and then stops completely”. Most migrants from harsher climates do perceive the changes as manageable. E4 in EWS quarters is from Uttar Pradesh. He did not find Bangalore weather conditions to be extreme either in terms of temperature or rainfall. He is more concerned with the vulnerability that the tin sheds bring, when the place heats up in summer and the roofs tend to blow off in storms. P30 does tend to compare the clean green atmosphere in her villages with the rapid changes in her neighbourhood as the lake is now overflowing with sewage, impacting the health of the people living near it. She remembered the pristine beauty of the lake, which used to overflow when it rains. She remembers a time when fishing was a widespread practice among the community in the waters of the lake. She says that while fish still thrive beneath the weeds, many have been killed due to the extensive pollution of the lake waters.
Today rains have decreased. She also notes that when in the olden days one open well sufficed for the entire village, today-two bore wells as well as the tankers that occasionally come into the village are not enough to satisfy the water demands of the community.
The following is a tabulation of descriptions of respondent’s perceptions about temperature variations in temperature changes over a period of 20-30 years
Range of responses KS EWS PA
Increased heat, making it impossible to remain indoors and causing frequent disorders 26 41 6
Increased but manageable heat, with spells of rain in summer 2 1 13
Increased cold 2 0 1
No significant change 2 2 0
Did not observe 24 3 23
A significant number of respondents when asked to describe the changes said that they did not observe any changes, except in EWS where the increased heat is palpable as they live in tin sheds.

Vulnerability Assessment: Urban Area – A Pilot study 43
PERCEPTION TO CHANGES IN RAINFALL: We also asked the respondents if they had noticed any change in the rainfall patterns over 20-30 years. The following table details the responses received.
Rainfall Patterns KS EWS PA Increased rainfall 3 3 4
Increased Erratic Rainfall 12 2 4 Increased rainfall with heavy winds 22
Decreased rainfall 1 7 Decreased rainfall – lesser intensity and no
fixed patterns 2 1 1
Increase in non-seasonal and summer rainfall 2 1 3
No change 1 1 1 Did not notice any particular change 1 1 1
No response 32 39 23
K21 has identified that June rains are now erratic K11 says flooding is due to overcrowding & concretization K20 feels that because of erratic rains new illnesses have been seen and is also a problem for the homeless. Because of overcrowding there is no free flow of wind. P3 says that 15-20 yrs ago there used to be Jadi-Male which is rains (drizzle) over 2-3 days continuously for 4-5 times a yr this is missing completely now. P30 says that the lake was overflowing when it used to be regular and each shower had a name. Kumaresh from KS Garden at the Stakeholders meeting mentioned that earlier there used to be Jadi-male(a continuous drizzle lasting over 2-3 days). All respondents from EWS Quarters, who for reasons already mentioned experience the ravages of weather more acutely noted that there has been an increased in the rains accompanied by heavy winds. At the time of the survey, the team met a gentleman whose hand was injured because of the flying sheet in storms, and the mother of a child who went into shock because of the same event. PERCEPTIONS TO CHANGES IN EVENTS OF FLASH FLOODING: Flooding and water logging, in Bangalore is generally attributed to urban interference with natural drainage. K11spoke of concretizations of pavements, while K21 said that chambers and sewerage line were responsible for reducing flows and the degeneration of the lake systems of the city. These are exacerbated by the poor housing as experiences by leaky roof and walls and low lying terrains on which the poor in the slum have settled down. The incidence of water logging within communities and the city as a whole made us also ask the respondents if they have noticed any changes in the patterns of flooding over time.
Range of responses KS EWS PA
Increased 10 42 0
Decreased 11 3 0

Vulnerability Assessment: Urban Area – A Pilot study 44
No change 2 0 0
Did not notice 30 2 43
All residents of Parappana Agrahara did not notice any water logging as the village is at a higher elevation and the two depressions form the Parappana Agrahara Lake and the Kudlu Lake. The deterioration of the lake however could cause major flooding issues in the village in the future. When asked about such a hypothetical scenario, the villagers said that the immediate concern was the mosquitoes that breed in the lakes and that they would prefer filling up and reclaiming the land rather than review the lake. PERCEPTIONS TO CHANGES IN QUANTITY OF WATER:
Availability of water KS EWS PA
Less water available as of now 10 5 6
Less water available compared to previous times 4 1 7
Now water available is more 4 3 2
previously people has to go a distance to bring water , now 4 0 5
No response 33 44 25
buying water , caste issues 0 1 1
E25 used to buy buy water from closeby area since there where not many taps. P3 Inspite of water being present in wells, was not allowed to use it because they belonged to a lower caste. E40 observes that they felt water was more now because earlier there were few wells, so there was less water, now there are plenty of borewells and Kaveri water. K13 who feels less water is available now is because rich people use more water. K20 also feels that water is less now compared to previous times when they used to travel a distance to fetch water, which was more abundant. Most of the respondents who were women were acutely aware of the water situation in most areas. Within KS Garden the issue seems to have worsened when the pipes have been laid down for water and the residents feel that the water made available to them via these channels is not adequate. 31 respondents of a total of 55 have stated this as a change they have noticed over the years with respect to water quantity. Within EWS Quarters, the water availability seems to have been a persistent problem and 41 respondents mentioned it as such in our study. A majority of people in Parappana Agrahara feel that there is no point in worrying about changes; rather it would be more prudent to find ways and means to make do with what is currently available. Changes in the depth of bore wells in the community:
Range of responses KS EWS PA
Has become deeper with lesser quantities of water available. 0 0 7
Increased numbers of bore wells required now to meet water demands of the entire community 0 0 11
No particular change noticed 55 54 23
Within EWS Quarters and KS Garden none of the respondents had noticed any particular change in depth of borewell water. Only persons from Parapana Agrahara were aware of the borewell issue. This is perhaps because the borewell as the only current source of water and are still quite rural in their outlook. But getting increasing urbanized, many residents translated the lowering of the borewell water level to “more bore wells are needed to satisfy the demands of the entire village”.

Vulnerability Assessment: Urban Area – A Pilot study 45
Changes in the quality of the water:
Quality of Water KS EWS PA
Salty water over the years , a thick deposit of salt on vessels 0 0 7
Bad odour, worms and muddy water 11 9 1
Contamination of Sewage 7 13 0
water is sweet 2
rainwater filled lakes. Now sewage , effluents are let into lake . Lots of fish have 0 0 1
all open wells have dried up or covered 0 0 1
No response 37 32 32
P30 observes that previously rain water filled the Parapana lake, but now sewage, effluents are let into the lake, due to which lots of fish have been killed. P3 observes that many of the open wells have dried up or covered. E21, E22, K13 and others have observed worms in water and bad odour in water. There seems to be deteriorating water quality. In EWS and KS Garden where the communities have access to piped water, the perception is that contamination by sewerage causes such contamination. In Parappana Agrahara, the issue is salinity of water from the bore well. Reasons attributed to the changes:
Range of responses KS EWS PA
Due to transition from secure concrete homes to kutcha tin sheds 5 49 0
Improper maintenance of supply infrastructure – water tanks not cleaned regularly etc. 2 0 0
Diversion of cleaner resources to richer segments of society 2 0 0
Increased overcrowding – People have settled on every available piece of land therefore there is no 4 1 3
Converting open space into a concrete jungle – that does not allow for ground water recharge and 2 0 0
Cutting down of trees in the area and surroundings – creating space for more development 4 2 13
Climate has changed drastically post the tsunami of 2004 1 0 0
Weather patterns in control of the Almighty, what we can do is see how best to cope with what has 4 1 0
Local environment feels colder after migration from warmer regions of the country 1 0 0
6. Cannot tell 41 1 27
A large majority of people from both KS Garden as well as Parappana Agrahara were unable to state a definite cause to the changes. These were also the people who had not noticed any change. In EWS Quarters, a community that has been affected by corruption, bureaucratic dealings linked with their housing issues, attributed these changes to governance issues.

Vulnerability Assessment: Urban Area – A Pilot study 46
VII.3 Impacts & coping mechanism to climate change Most of the indirect adverse effects of climate change are such that they cannot be mitigated
through individual action – more frequent water logging for instance or the increase in disease vectors and the more direct exacerbation of existing problems like mixing of sewage with fresh water or rain water.
An example is the increasing contamination of ground water, based on which the quality of water in the borewells which the CMC and BWSSB have resorted to in order to supply water to the poorer areas. A recent report of the CAG (Comptroller and Auditor General of India) for the year ended March 31, 2010 says that the existing sewage network covers only 40% of Bangalore Metropolitan Region (BMR) and the sewage treatment plants receive only 47% of the sewage generated, "The remaining 53 per cent was discharged directly into storm water drains and lakes, contaminating water bodies and groundwater".
Another issue is that Corporations are more comfortable with centralized systems of delivering water, sanitation, and the building rules prohibit any other forms of decentralized black water disposal. Several models like DEWATS (Decentralised Waste Water Treatment System) or Dry Latrines are implementable particularly in the newer areas brought under the Corporation. A case in point is Parappana Agrahara, some households want to set up septic tanks, as the larger centralized sewerage, will take a long time coming.
Further, the problems with centralized systems are that they are generally inadequate. In KS garden for example inadequate sewerage facilities can create disasters in times of stress like higher rainfall and clogging of drains, accumulation of water.
Thus those having so called better sewerage facilities do use more higher means of coping with
floods, like placing temporary barricades on the entrance of home to restrict inflow of water- 7 rank, Raising the level of the doorstep using cement -8, and raising the level of the entire home to prevent future flash floods rank 9. Very few peak at 10 which means they do not require to do anything for floodings. The highest incidence is Parappana Agrahara, as overall there is an outlet of the drainage into the lake, due to more open spaces, as well as the fact that open defecation takes place outside the habitation area.
EWS which is an example of poorly maintained facilities is worse affected with the only exception being a household with high income as well as a relatively new occupant on open land in the periphery.
Most people have somehow coped with the impacts of climate change, and they relate to it as they
do to all kinds of environmental and social impacts. While it cannot be said to be “adaptation” to the perturbations, these measure nonetheless indicate the manner in which individual households tend to
0
5
10
15
K4 K31 K8 K6 K37
K15
K29
K38
K43
K22
K49
E12 E3 E51 E1 E40
E16
E37 E5 E29
E11
P30 P8 P2 P15
P34
P21
P37
P20
Coping with flash floods Coping with heat

Vulnerability Assessment: Urban Area – A Pilot study 47
respond, as well as point to more specific proximate action that can be taken.
Coping with heavy rains KS EWS PA No strategy in place 4 14 0
Placing vessels, barricading etc 33 6 0 Tarpaulins and shamiana 0 10 0
Bailing out water 15 22 0 Not affected by floods 3 2 43
Coping with Floods KS EWS PA
Bail out the water 15 2 2
Send children away to drier houses 1 2 0
modification to house 5 5 1
Use of Jute to remove dampness 5 0 0
Use of tarpaulins on roofs 0 13 0
No floods observed 3 0 4
No response 26 32 38
The following households have modified their houses to avoid the floods. E28, E29,E30 ,E2 have elevated their door step, and cemented the floor . Leakage through the roof is avoided by collecting water, they have placed tyres on the roof so that they dont fly off. E21 has put a shamiana to avoid the water from the leaking roof. K37, K39, K42, K43 have constructed a small wall 1ft at the doorstep to prevent water from entering, house has been repaired, floors are built. K55 's house is leaking so they have kept plates where tiles are broken. K31 just bails out water. A family in KS garden places large vessels on their roof. The water is then bailed out or used for cleaning. In EWS Quarters, a family has extended their tin shack with a wall of hollow blocks and asbestos roof. They have also built a toilet with a soak pit very recently. They use this extended room during rains especially in the night. Sunitha’s husband works with decorators, which provides Shamianas for hire. Some of the cloth from discarded Shamianas have been used inside four of the tin shed in EWS neighborhood, to reduced the summer heat, and protect them from rain. Sunitha collects rain water at one end of the sheet and uses it for washing.
E4 says that they have to stay outdoors and children are not able to study due to the excessive
heat. K33 used cotton buds in her ears to “keep out the cold”. She is also used to betel leaf eating, which provides heat (because of the chuna used). Likewise, most of the people we spoke did not have specific strategies for coping with the cold. The responses typically varied between “we do not do anything about it” to “we use sweaters, shawls and other warm clothing” or “We drink a lot of tea and coffee to bear with cold”. One family at KS Garden, has fitted their home with a 500W incandescent bulb.
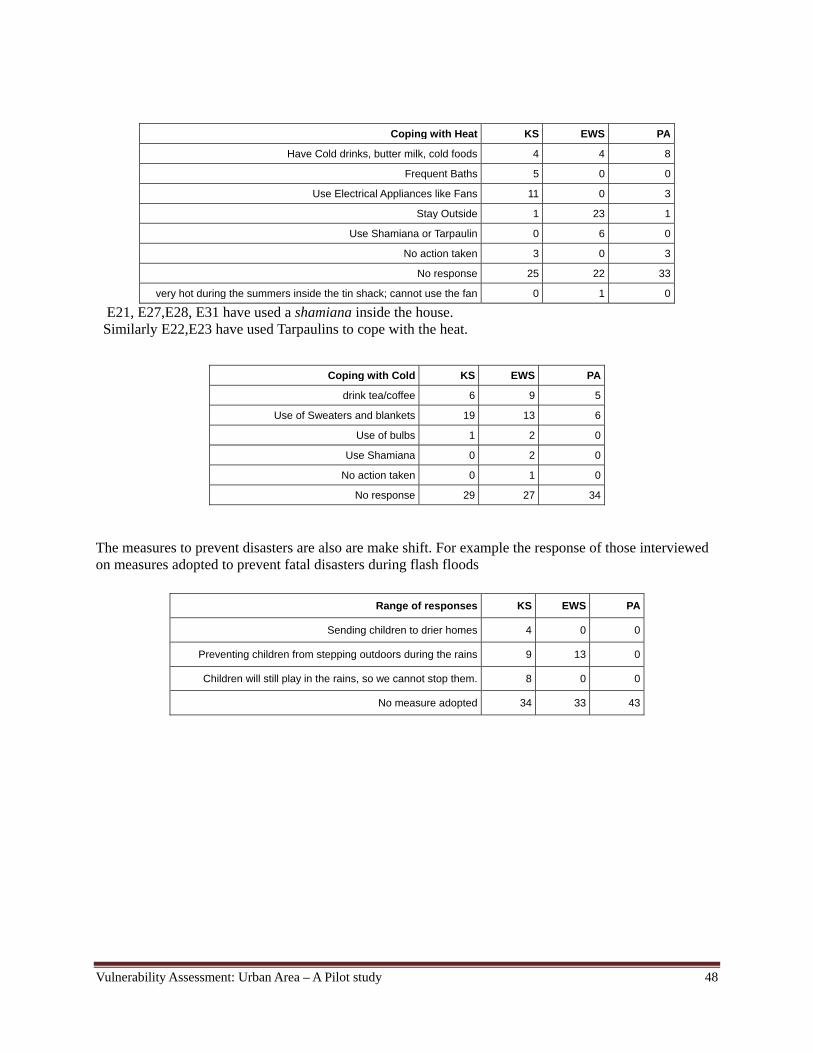
Vulnerability Assessment: Urban Area – A Pilot study 48
Coping with Heat KS EWS PA
Have Cold drinks, butter milk, cold foods 4 4 8
Frequent Baths 5 0 0
Use Electrical Appliances like Fans 11 0 3
Stay Outside 1 23 1
Use Shamiana or Tarpaulin 0 6 0
No action taken 3 0 3
No response 25 22 33
very hot during the summers inside the tin shack; cannot use the fan 0 1 0
E21, E27,E28, E31 have used a shamiana inside the house. Similarly E22,E23 have used Tarpaulins to cope with the heat.
Coping with Cold KS EWS PA
drink tea/coffee 6 9 5
Use of Sweaters and blankets 19 13 6
Use of bulbs 1 2 0
Use Shamiana 0 2 0
No action taken 0 1 0
No response 29 27 34
The measures to prevent disasters are also are make shift. For example the response of those interviewed on measures adopted to prevent fatal disasters during flash floods
Range of responses KS EWS PA
Sending children to drier homes 4 0 0
Preventing children from stepping outdoors during the rains 9 13 0
Children will still play in the rains, so we cannot stop them. 8 0 0
No measure adopted 34 33 43
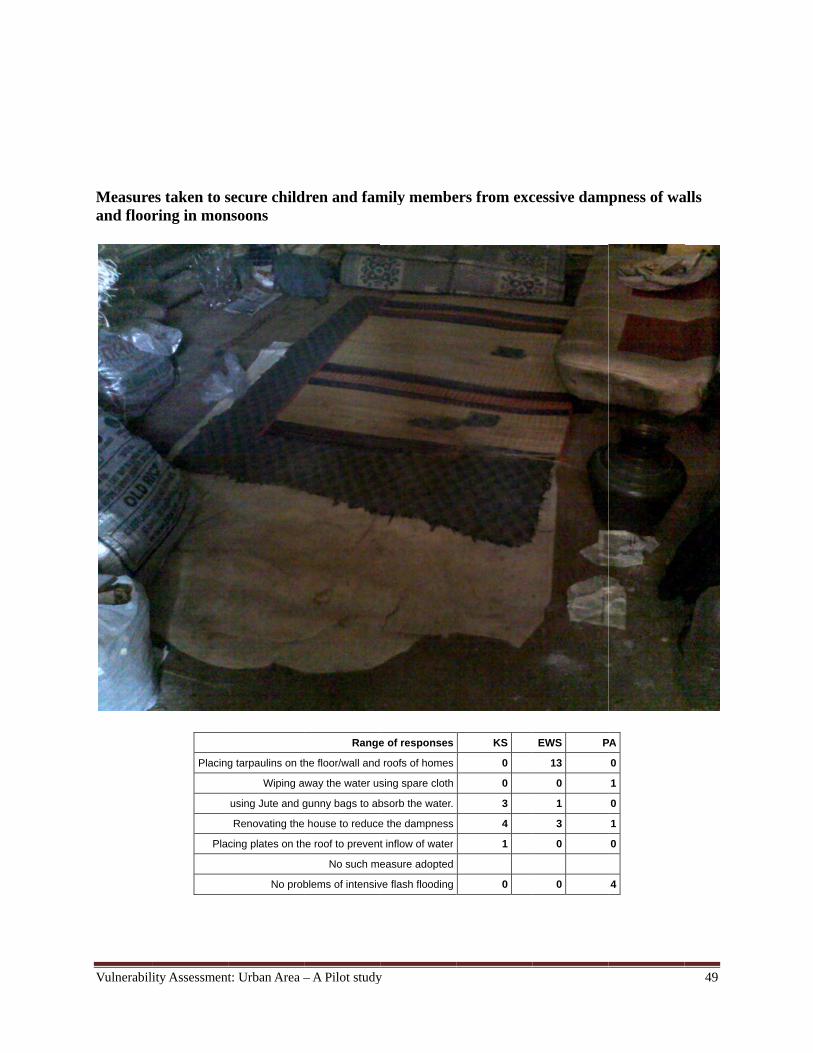
Vulnerabil
Measureand floor
ity Assessment
es taken to sring in mon
Placing
Pla
t: Urban Area –
secure childnsoons
g tarpaulins on th
Wiping a
using Jute and g
Renovating the
cing plates on th
No prob
– A Pilot study
dren and fam
Range
he floor/wall and
way the water us
gunny bags to ab
house to reduce
he roof to prevent
No such me
blems of intensiv
y
mily membe
e of responses
roofs of homes
sing spare cloth
bsorb the water.
e the dampness
t inflow of water
easure adopted
ve flash flooding
ers from exc
KS
0
0
3
4
1
0
cessive dam
EWS P
13
0
1
3
0
0
pness of wa
PA
0
1
0
1
0
4
49
alls

Vulnerability Assessment: Urban Area – A Pilot study 50
i Chikungunya outbreak confirmed, Times of India, Jun 25, 2008 (http://articles.timesofindia.indiatimes.com/2008-06-25/bangalore/27750275_1_chikungunya-cases-fever-and-joint-pain-hospitals) Ostrich-like, govt denies dengue is here, Deccan Herald, July 31, 2011 (http://www.deccanherald.com/content/85287/ostrich-like-govt-denies-dengue.html) Gastro on the rise; dengue & chikungunya loom in Bangalore, Daily News & Analysis, June 18, 2011
(http://www.dnaindia.com/print710.php?cid=1556289 ) Doctors warn against dengue, chikungunya, Deccan Herald, June 27, 2011 (http://www.deccanherald.com/content/172085/doctors-warn-against-dengue-chikungunya.html)

Learning from study 51
VII. Learnings from study The aim of the study was not so much to determine the extent but to understand the nature of vulnerability. We were not able to separate the vulnerability to climate change from the other intertwining vulnerabilities. This meant that we could only explore the interlocking issues and learn about areas of adaptation that go beyond climate change. The predominant vulnerability of people living in the slums under study is water logging and flooding. This has direct impacts on the general health particularly of children who are prone to allergies resulting in colds, asthma etc. The other impact is on vector borne diseases, particularly Chikungunya. In all the areas surveyed, the incidence of such diseases particularly during epidemics, is far far higher than for the general population. Beyond vulnerability relating to elevation and natural drainage of the slum, the exact extent of vulnerability correlates primarily to the specific history of intervention by political events or NGO intervention on issues of tenure, and specific problems like water, amenities like toilets etc. The other important indicator is the nature of housing. While it is generally true that income and status has a lot to do with the kind of houses people possess and the kind of drainage they use, the more significant operand has been the development programme, and interaction with the slum development/regulating authority. Though people generally build their own dwellings, their vulnerability stems from the fact that they cannot choose a good location, and have to make do with what is there to be occupied. The newer entrants would go by the rent or unofficial payments they can afford. Once settled, the incremental nature of improvement of habitat and housing, is a creative function, where people use whatever resources they can muster in their environment. The extensive use of plastic sheets, gunny sacks, used flex, or buckets, plates to ward off the water, and then resorting to physically bailing out water, raising barricades of one to two feet height etc is testament to the resilience, or more correctly struggle of people against the elements. That this is likely to get worse in climate change is not in their radar, but they have perceived a change in the pattern of rains. Most vulnerable are those who have mud flooring, this combined with poor drainage of grey water in the neighbourhood, makes any kind of perturbation extremely intolerable. They are the poorest and cannot afford to fall ill. Women are most affected by and the burden of recovering from water logging – namely swabbing, bailing out water, dealing with overflowing moris mainly falls on them. They also affected by contamination of water. Overall most women we interviewed said that the situation with the water has been improving. This is mainly due to the fact that they do not have to fetch water from the distances that they used to, or that arrangements have been made, sometimes locally, to bring the water points closer home. To that extent, the BWSSB has been making changes, bringing piped river water, or digging more borewells with local storage tanks. The maintenance of these are very precarious, and the women complain of foul smelling water, and even worms in supply. In the newer slums, namely in the peri-urban fringes, women perceive a loss of traditional livelihood options like goat tending, agriculture, kitchen gardening, as their habitat gets increasingly urbanized and polluted. Extremes of climate events would perhaps make this worse. A similar learning arises from the paucity of firewood. While subsidised kerosene is provided at ration shops, but these are not sufficient, and its supply entails a lot of leakages. In our study we found that people make up that shortfall by using firewood stoves, where they use all kinds of waste from the environment, many of the substances quite toxic, when burnt. Most people do not use LPG as their

Learning from study 52
spaces/huts are not designed to house a stove attached to a cylinder. Perhaps the one-piece stoves, distributed free would take care of their special and safety concerns. In the area of health impacts, we looked at practices. While people do tend to make offerings and prayers to recover from illnesses, these actions seem to be more out of “abundant caution”, as they go in for different forms of treatment. First preference would be different types of home remedies like kashayams. The doctor is not the preferred course of action, as they are not proximate and involve travel and medical costs. Most helpful adaptation would therefore be more information on oncoming epidemics, increasing instances of viral attacks, so that people can appreciate the nature of the symptoms. And of course, a low cost, friendly Primary Health Centre would be most welcome and effective. An important vulnerability arises from is security of housing tenure. We have seen higher mobility in EWS quarters, where people had legal titles and identities. As soon as people become better off, they tend to shift out to a better location. Thus the poorer persons tend to stay on and live with the mud floorings, and leaky roofs, and do patch-work with whatever resources that they have. So even in areas where there is high mobility, those who are left behind are increasingly those who are poorer and therefore concentration of vulnerability both in terms of conditions as well as income. In Parapanna Agrahara, the people are more rooted in the area, and they have traditional occupancy rights, and traditional forms of livelihood. Here most floors were cemented, and asbestos roofing, save one or two of the poorest who have to do with mud floor and thatched roofs. In Khader Sharif Garden, which was actually occupation of private land a long time ago, most floors would be cement and roofs tiled or of asbestos. Here there is a little mobility and excessive crowding. Thinking of mobility and crowding, many of the fresh migrants into the city, work in familial network, and therefore crowding into existing spaces in the old slum areas. As migration to cities is bound to increase, partly due to climate change, capacities would be stretched, and the poorer incoming lot would get into spaces like the old run-down sheds in EWS. Run down places never die, they find new occupants! But on a more serious note, one of the main learnings of this study has been what we have not been able to study – namely the newer migrant, and their initiation into the worst and most vulnerable of locations. Most issues like toilets, good drainage are best sorted out at the community level, at least for maintenance. The example of KS Garden where the three persons required to maintain the facility are paid by the contributions, and supervised by representatives of the community, rather than as is the case of EWS where the staff of the community toilets are seen as employees of the corporation. Water and Electricity become the indicators of progress, small amounts of which are greeted gratefully. Almost all would use electricity for basic lighting. Though there are a few CFL bulbs, CDMs giving free CFLs would be ideally welcome. Almost every home will have a TV, and would take pride in owning one. The Fan and Mixie are a necessity, but both of which have come into prominence as hand me downs or poor second hand purchases. Most of these appliances are energy inefficient, but they are well worth it as they provide immense value to a beleaguered life. Electrical wiring also is temporary. Electrical efficiencies given the low rate of consumption, is not an economic option for the household point of view. Many people make do with connections from neighbours and loose wiring, and inefficient appliances. Perhaps the total electricity saved by proper regulated supply, good wirings and more efficient appliances would go a long way to pay for the material itself. Perhaps a potential pro-poor CDM!

Learning from study 53
The other issue is transport: wherever public transport is not convenient, people tend to use old two wheelers or hired auto rickshaws for medium distances especially. Since it is used for essential travel only, the higher per-trip costs, far out-weigh the disadvantage of not being able to put the upfront money required to have a good efficient vehicle. To us on the outside therefore there is a close link between urban systems of water, housing, sanitation, energy, transport, health and vulnerability to climate change. While people will do what they can at their level to cope with perturbations, there is an expectation of development at the major infrastructure level. When we visited EWS quarters during the monsoons much after we did the survey, we found that the authorities had constructed many new sheds to replace those which were in pathetic conditions. Side by side individual people, who did what they could. Many cemented their flooring. They of course did not have the resources to redo the foundation, or make byways for underground flow of water so as not to harm their foundations. New Tin Sheds in EWS Quaters
To conclude, housing practices, plan & design, and utilities are the main parameters which affect vulnerability. The absolute poor would have no means to do even the bare minimum. And what the little better off can do would hardly be sufficient to adapt even to pre- climate change situations. Thus climate change would call for more concerted and overarching integrated action, by a range of actors, particularly state, and NGOs. While proactive
adaptation responses must attend to the needs of the poorest, any real resilience to impacts of climate change can only take place with development of employment, livelihood and habitat. Poor urban people highlight employment, assets and savings, and income as the key determinants of their well being. This is heavily related to the security and predictability of income, as well as to the security of assets (e.g. tenure as opposed to ownership). In terms of livelihood, the most buoyant careers in these three slums is service work ranging from municipal or public goods services, transports, plumbing, masonry, carpentry etc. For Destitute women and single women parents too, domestic work and that too part time, is a lifeline. Being unorganised, and dispersed, services is not evenly accessed, or given. The example of Shramik organizing a cooperative of such workers, and ending up being a pro-active habitat player, indicates the benefits of a cooperative approach. In places like EWS, an unofficial extension of water lines close to the homes of the women have been enabled by such cooperative action.