Embed Size (px)
Citation preview

Vortex induced vibrations of a rotating circular cylinder at low Reynolds numberMing Zhao, Liang Cheng, and Lin Lu Citation: Physics of Fluids 26, 073602 (2014); doi: 10.1063/1.4886196 View online: http://dx.doi.org/10.1063/1.4886196 View Table of Contents: http://scitation.aip.org/content/aip/journal/pof2/26/7?ver=pdfcov Published by the AIP Publishing Articles you may be interested in Numerical simulation of vortex-induced vibration of a circular cylinder in a spanwise shear flow Phys. Fluids 27, 063101 (2015); 10.1063/1.4921882 An experimental investigation of vortex-induced vibration of a rotating circular cylinder in the crossflow direction Phys. Fluids 27, 067101 (2015); 10.1063/1.4921683 Vortex-induced vibration of a circular cylinder of finite length Phys. Fluids 26, 015111 (2014); 10.1063/1.4862548 Numerical simulation of vortex-induced vibration of two circular cylinders of different diameters at low Reynoldsnumber Phys. Fluids 25, 083601 (2013); 10.1063/1.4816637 Numerical simulation of vortex-induced vibration of a square cylinder at a low Reynolds number Phys. Fluids 25, 023603 (2013); 10.1063/1.4792351
This article is copyrighted as indicated in the article. Reuse of AIP content is subject to the terms at: http://scitation.aip.org/termsconditions. Downloaded to IP:
130.95.223.58 On: Mon, 16 Nov 2015 05:46:13
PHYSICS OF FLUIDS 26, 073602 (2014)
Vortex induced vibrations of a rotating circular cylinderat low Reynolds number
Ming Zhao,1,a) Liang Cheng,2,3 and Lin Lu4
1School of Computing, Engineering and Mathematics, University of Western Sydney,Locked Bag 1797, Penrith NSW 2751, Australia2School of Civil, Environmental and Mining Engineering, The University of WesternAustralia, 35 Stirling Highway, Crawley WA 6009, Australia3State Key Laboratory of Coastal and Offshore Engineering, Dalian University ofTechnology, Dalian 116024, China4Center for Deepwater Engineering, Dalian University of Technology, Dalian 116024, China
(Received 16 May 2014; accepted 19 June 2014; published online 9 July 2014)
Vortex-induced vibration (VIV) of a rotating circular cylinder at a low Reynoldsnumber of 150 and a low mass ratio of 2 is studied numerically. Simulations areconducted at three rotation rates of α = 0, 0.5, and 1 and reduced velocities in therange of 1–13 with an interval of 0.2. The numerical results show that the rotation ofthe cylinder increases the response amplitude and widens the lock-in regime for theone-degree-of-freedom (1-dof) VIV in the cross-flow direction. The two-degree-of-freedom (2-dof) responses of the cylinder at α = 0.5 and 1 are significantly differentfrom that at α = 0. For the 2-dof VIV, the response amplitude in the inline direction,which is much smaller than that in the cross-flow direction at α = 0, is increasedsignificantly at α = 0.5 and 1. One initial branch is found at α = 0.5 and two initialbranches are found at α = 1. In the initial branches, the response frequency locks ontoa frequency that is smaller than the natural frequency of the cylinder and the responseamplitude increases with the reduced velocity. The vortex shedding is found to be inthe P+S mode for reduced velocities near the higher boundary of the initial branchesand 2S mode in all other reduced velocity ranges for the 2-dof VIV. Simulations areconducted under both the increasing and decreasing reduced velocity conditions. Ahysteresis region is found near the higher boundary of the lower branch for α = 0, 0.5,and 1 in the 1-dof of VIV and for α = 0 in the 2-dof VIV. The hysteresis region occursnear the higher boundary of the initial branches for α = 0.5 and 1 in the 2-dof VIV.By analysing the component of the force coefficient that is in phase with the velocityof the cylinder, it is found that pressure force excites the vibration and the viscousforce damps the vibration in both the inline and the cross-flow directions in the 2-dofVIV. The magnitude of the time averaged pressure and viscous force coefficientsthat are in phase with the velocities of the cylinder in the lock-in regime are foundto be much greater than their counterparts outside the lock-in regime. C© 2014 AIPPublishing LLC. [http://dx.doi.org/10.1063/1.4886196]
I. INTRODUCTION
Vortex shedding flow in the wake of a circular cylinder in a fluid flow has been of interest in manystudies due to its engineering importance. Flow in the wake of a circular cylinder transitions fromtwo-dimensional (2D) to three-dimensional (3D) when the Reynolds number exceeds a critical value.The critical Reynolds numbers for the transition of the flow from 2D to 3D found in different studiesdiffer slightly in the range of 140–190.1 The Floquet stability analysis by Barkley and Henderson2
showed that the 3D instability starts at a Reynolds number of about 188.5. Miller and Williamson3
a)Author to whom corresponding should be addressed. Electronic mail: [email protected]. Tel.: +61 2 4736 0085.
1070-6631/2014/26(7)/073602/28/$30.00 C©2014 AIP Publishing LLC26, 073602-1
This article is copyrighted as indicated in the article. Reuse of AIP content is subject to the terms at: http://scitation.aip.org/termsconditions. Downloaded to IP:
130.95.223.58 On: Mon, 16 Nov 2015 05:46:13
073602-2 Zhao, Cheng, and Lu Phys. Fluids 26, 073602 (2014)
found that the highest Reynolds number for laminar vortex shedding could be extended up toRe = 194 and even beyond 200 for a short period of time if the end effect is eliminated. Thetransition of the flow from 2D to 3D was intensively studied by many researchers.2, 4–9
If a cylinder rotates in the fluid flow, the rotation speed of the cylinder affects the wake flow.In addition to the Reynolds number, flow past a rotating cylinder is also dependent on the rotationrate α, which is defined as the ratio of the rotating speed of the cylinder surface to the free streamvelocity. Vortex shedding in the wake of a rotating cylinder was found to be fully suppressed ifthe rotation rate is greater than 2.10–14 Early studies of flow past a rotating circular cylinder werefocused on very low Reynolds numbers of Re ≤ 100.15, 16 Kang et al.17 simulated flow past a rotatingcircular cylinder numerically at low Reynolds numbers and found that the critical rotation rates wereabout 1.4, 1.8, and 1.9 for Re = 60, 100, and 160, respectively, and the Strouhal number was nearlyindependent on the rotation rate. The large eddy simulation by Karabelas18 showed that the vortexshedding for a high Reynolds number of 1.4 × 10⁵ was suppressed at a rotation rate of 1.3.
Stojkovic et al.19 found a second vortex shedding regime in the rotation speed range of 4.8≤ α ≤ 5.15 for Re = 100. The second vortex shedding mode is observed in the range of 4.85≤ α ≤ 5.17 for Re = 100 and is characterized by the shedding of one counterclockwise vortex fromthe upper part of the cylinder in one vortex shedding period.20 Mittal and Kumar21 and Lu et al.22
found that, for Re = 200, the flow remained stable for 1.91 ≤ α ≤ 4.34 but lost its stability againfor α ≈ 4.35. The vortex shedding disappears again as the rotation ratio exceeds around 4.8. Lam27
studied flow past a rotating cylinder at Re = 3600 to 5000 and α ≤ 2.5 using flow visualization andPIV measurements. It was found that the wake became increasingly narrow and deflected sidewayswith the increasing cylinder rotation speed and the formation length of the vortices decreased withincreasing α, leading to a slow increase in the vortex shedding frequency.
Three-dimensionality of flow past a rotating cylinder has also been studied. Mittal28 found thatthe centrifugal instabilities existed along the entire span in a three-dimensional setup for a rotationrate of 5 and flow separation occurred near the cylinder ends due to the effect of the “no-slip”side-wall. The Direct Numerical Simulations (DNS) by Akoury et al.29 showed that the rotationof the cylinder attenuated the three-dimensional instability and increases the critical Reynoldsnumber for three-dimensionality. The flow was found to be three-dimensional at Re ≈ 220 for α
= 0.5. Rao et al.30 found that, while the three-dimensionality for α ≤ 1 was similar to that of thenon-rotating cylinder, the three-dimensional scenario at higher rotation rates became increasinglycomplex.
Vibration of a rotating circular cylinder in fluid flow has attracted less attention than that ofa non-rotating circular cylinder. Extensive reviews of VIV of a circular cylinder can be found inRefs. 31–36. Large-amplitude oscillations of an elastically mounted cylinder in a fluid flow occurwhen the vortex shedding frequency synchronizes with the oscillation frequency of the cylinder.37
The synchronization between the vortex shedding and the vibration of the cylinder is also called the“lock-in” or “lock-on” in literature. Lock-in occurs in a range of reduced velocities and the lock-inregime of the reduced velocity is dependent on the mass ratio and damping ratio of the system.34, 35
The mass ratio is defined as the ratio of the cylinder mass to the displaced fluid mass. The reducedvelocity Vr is defined as Vr = U/ fn D, where U is the free-stream velocity, fn is the structural naturalfrequency, and D is the cylinder diameter, which is measured in vacuum. The natural frequency ofthe free vibration of a cylinder in still water (defined as fnw in this study) is used in many laboratorystudies of VIV to define the reduced velocity, i.e., Vr = U/ fnw D.38–41 In most of the numericalstudies of VIV at low Reynolds numbers, the reduced velocity is defined using the structural naturalfrequency.42, 43 At high mass ratios, the structural natural frequency and the response frequency influid are essentially the same and the VIV frequency locks in with the natural frequency.31, 44 Whenthe mass ratio is in the order of O (1), the response frequency can be significantly greater than thenatural frequency.41
Williamson and Roshko37 found that the vortex-shedding pattern in the wake of a vibratingcylinder is related to the response mode of the cylinder. They conducted studies of a vibratingcylinder in fluid flow and used the number of the vortices that are shed from the cylinder to definethe vortex shedding mode. For example, the 2P mode stands for two pairs of vortices being generatedin one cycle of vibration and 2S mode stands for two single vortices being generated in one cycle
This article is copyrighted as indicated in the article. Reuse of AIP content is subject to the terms at: http://scitation.aip.org/termsconditions. Downloaded to IP:
130.95.223.58 On: Mon, 16 Nov 2015 05:46:13
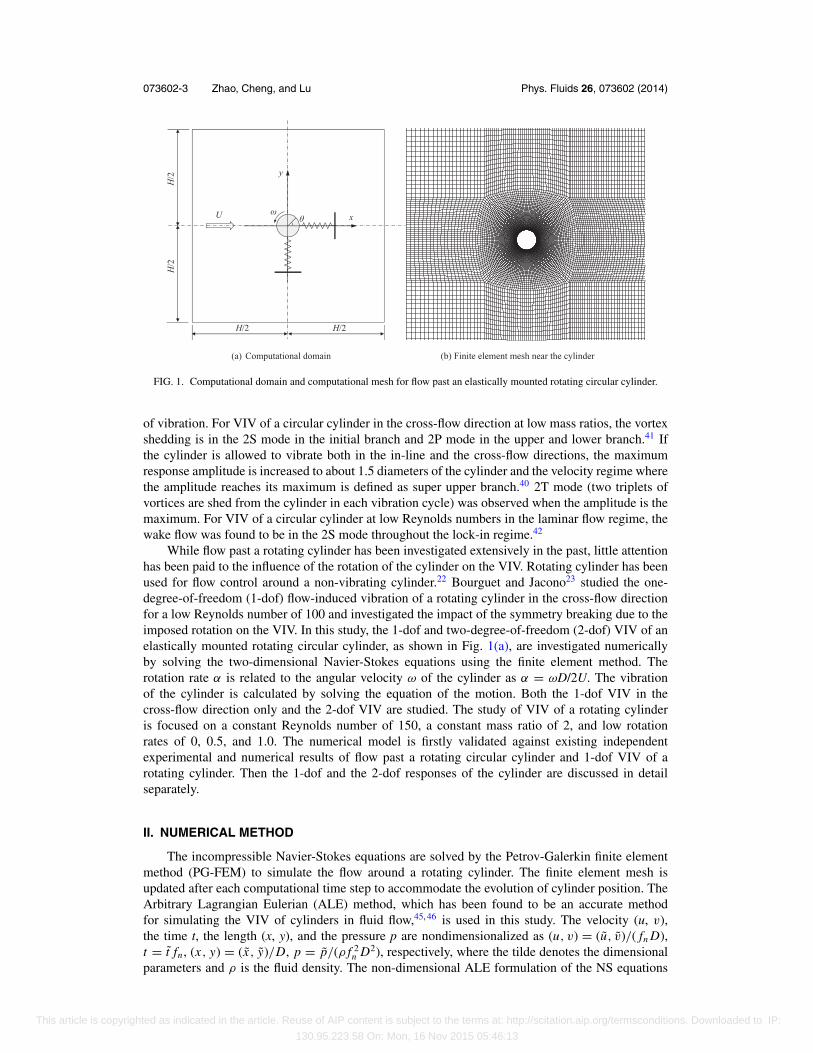
073602-3 Zhao, Cheng, and Lu Phys. Fluids 26, 073602 (2014)
(a) Computational domain (b) Finite element mesh near the cylinder
U x
y
H/2H/2
H/2
H/2
FIG. 1. Computational domain and computational mesh for flow past an elastically mounted rotating circular cylinder.
of vibration. For VIV of a circular cylinder in the cross-flow direction at low mass ratios, the vortexshedding is in the 2S mode in the initial branch and 2P mode in the upper and lower branch.41 Ifthe cylinder is allowed to vibrate both in the in-line and the cross-flow directions, the maximumresponse amplitude is increased to about 1.5 diameters of the cylinder and the velocity regime wherethe amplitude reaches its maximum is defined as super upper branch.40 2T mode (two triplets ofvortices are shed from the cylinder in each vibration cycle) was observed when the amplitude is themaximum. For VIV of a circular cylinder at low Reynolds numbers in the laminar flow regime, thewake flow was found to be in the 2S mode throughout the lock-in regime.42
While flow past a rotating cylinder has been investigated extensively in the past, little attentionhas been paid to the influence of the rotation of the cylinder on the VIV. Rotating cylinder has beenused for flow control around a non-vibrating cylinder.22 Bourguet and Jacono23 studied the one-degree-of-freedom (1-dof) flow-induced vibration of a rotating cylinder in the cross-flow directionfor a low Reynolds number of 100 and investigated the impact of the symmetry breaking due to theimposed rotation on the VIV. In this study, the 1-dof and two-degree-of-freedom (2-dof) VIV of anelastically mounted rotating circular cylinder, as shown in Fig. 1(a), are investigated numericallyby solving the two-dimensional Navier-Stokes equations using the finite element method. Therotation rate α is related to the angular velocity ω of the cylinder as α = ωD/2U. The vibrationof the cylinder is calculated by solving the equation of the motion. Both the 1-dof VIV in thecross-flow direction only and the 2-dof VIV are studied. The study of VIV of a rotating cylinderis focused on a constant Reynolds number of 150, a constant mass ratio of 2, and low rotationrates of 0, 0.5, and 1.0. The numerical model is firstly validated against existing independentexperimental and numerical results of flow past a rotating circular cylinder and 1-dof VIV of arotating cylinder. Then the 1-dof and the 2-dof responses of the cylinder are discussed in detailseparately.
II. NUMERICAL METHOD
The incompressible Navier-Stokes equations are solved by the Petrov-Galerkin finite elementmethod (PG-FEM) to simulate the flow around a rotating cylinder. The finite element mesh isupdated after each computational time step to accommodate the evolution of cylinder position. TheArbitrary Lagrangian Eulerian (ALE) method, which has been found to be an accurate methodfor simulating the VIV of cylinders in fluid flow,45, 46 is used in this study. The velocity (u, v),the time t, the length (x, y), and the pressure p are nondimensionalized as (u, v) = (u, v)/( fn D),t = t fn , (x, y) = (x, y)/D, p = p/(ρ f 2
n D2), respectively, where the tilde denotes the dimensionalparameters and ρ is the fluid density. The non-dimensional ALE formulation of the NS equations
This article is copyrighted as indicated in the article. Reuse of AIP content is subject to the terms at: http://scitation.aip.org/termsconditions. Downloaded to IP:
130.95.223.58 On: Mon, 16 Nov 2015 05:46:13
073602-4 Zhao, Cheng, and Lu Phys. Fluids 26, 073602 (2014)
for incompressible flows is expressed as45, 46
∂ui
∂t+ (
u j − u j,mesh) ∂u j
∂x j+ ∂p
∂xi= Vr
Re
∂2ui
∂x j∂x j, (1)
∂ui
∂xi= 0, (2)
where x1 = x and x2 = y are the Cartesian coordinates in the in-line and transverse directions ofthe flow, respectively; ui is the fluid velocity component in the xi-direction; t is the time; and ui, mesh
is the velocity of the movement of the mesh nodes. The nondimensionalization method used inthis study leads to a nondimensional free-stream velocity that is equal to the reduced velocity anda nondimensional vibration frequency that is equal to the ratio of the vibration frequency to thestructural natural frequency. The nondimensional equation of the motion of the cylinder is
Xi + 4πζ Xi + 4π2 Xi = 2
π
V 2r CFi
m∗ , (3)
where X1 = X and X2 = Y are the displacements of the cylinder system in the inline and cross-flowdirections, respectively; Xi and Xi are the velocity and the acceleration of the cylinder, respectively;m* = m/md is the mass ratio with m being the mass of the cylinder and md = ρπD2/4 being the
displaced mass of the fluid; ζ = c/(
2√
km)
is the damping ratio with c and k being the damping
constant and spring constant of the system, respectively; and CF1 = CD and CF2 = CL are the dragand lift coefficients, respectively, which are defined as CD = FD/(ρDU2/2), CL = FL/(ρDU2/2) withFD and FL being the drag and lift forces on the cylinder, respectively. The equations of motion,Eq. (3), are solved using the fourth-order Runge-Kutta algorithm.
After each computational time step in the numerical simulation, the position of the cylinderchanges and each finite element node needs to be moved accordingly. The governing equation forcalculating the displacements of the nodes of the FEM mesh is
∇ · (γ∇Si ) = 0, (4)
where Si represents the displacement of the nodal points in the xi-direction and γ is a parameter thatcontrols the mesh deformation. In order to avoid excessive deformation of the near-wall elements,the parameter γ in a finite element is set to be γ = 1/A, with A being the area of the element.By specifying the displacements at all boundaries, Eq. (4) is solved by the Galerkin FEM. Thedisplacement Si is the same as the displacement of the cylinder plus the rotation speed of thecylinder on the cylinder surface and zero on the rest of the boundaries.
A square rectangular computational domain of a boundary length of 200D is discretized intoquadrilateral four-node linear finite elements. Figure 1(b) shows an example of the finite elementsaround the cylinders. Zhao et al.47 simulated VIV of a cylinder at Re = 1000–15000 and found thatif the width of the computational domain to the cylinder diameter ratio is greater than 10, the effectsof the side boundaries on the results have been negligibly weak in the lock-in regime. Prasanthet al.48 found that the blockage factor (the diameter to the domain width ratio) must be no morethan 1% in order to obtain accurate results for Re ≤ 150. It is expected that the blockage factor of0.5% used in this study will be small enough to eliminate the effects from the domain size on thenumerical results. Initially, the velocity and the pressure in the whole computational domain are setto zero. The non-dimensional velocity at the inlet boundary is Vr and the velocity at the cylindersurfaces equals to the sum of translational and rotational velocities of the cylinder surface. At theoutlet boundary, the pressure and the gradient of velocity in the inline direction are set to zero. Atthe two lateral boundaries, the gradient of the pressure and the velocity in the cross-flow directionare set to zero.
III. VALIDATION AND MESH DEPENDENCY STUDY
Simulations of flow past a rotating non-vibrating cylinder are conducted and the results of thevelocity, pressure, and force coefficient are compared with the available data in published literature.
This article is copyrighted as indicated in the article. Reuse of AIP content is subject to the terms at: http://scitation.aip.org/termsconditions. Downloaded to IP:
130.95.223.58 On: Mon, 16 Nov 2015 05:46:13
073602-5 Zhao, Cheng, and Lu Phys. Fluids 26, 073602 (2014)
0
0.1
0.2
0.3
0.4
0.5
0.6
0.7
0 0.5 1 1.5 2 2.5
AC
L
Kang et al. (1999), Hc/D=100
Present, H/D=200
Present, H/D=120
Present, H/D=40
(a) Lift coefficient for Re=160
0
0.1
0.2
0.3
0.4
0 0.5 1 1.5 2 2.5
AC
D
Ref. 17, Hc/D=100
Present, H/D=200
Present, H/D=120
Present, H/D=40
(b) Drag coefficient for Re=160
0
0.1
0.2
0.3
0.4
0.5
0 0.5 1 1.5 2 2.5
AC
L
Ref. 17, Hc/D=100Present, H/D=200Present, H/D=120Present, H/D=40
(c) Lift coefficient for Re=100
0
0.1
0.2
0 0.5 1 1.5 2 2.5A
CD
Ref. 17, Hc/D=100Present, H/D=200Present, H/D=120Present, H/D=40
(d) Drag coefficient for Re=100
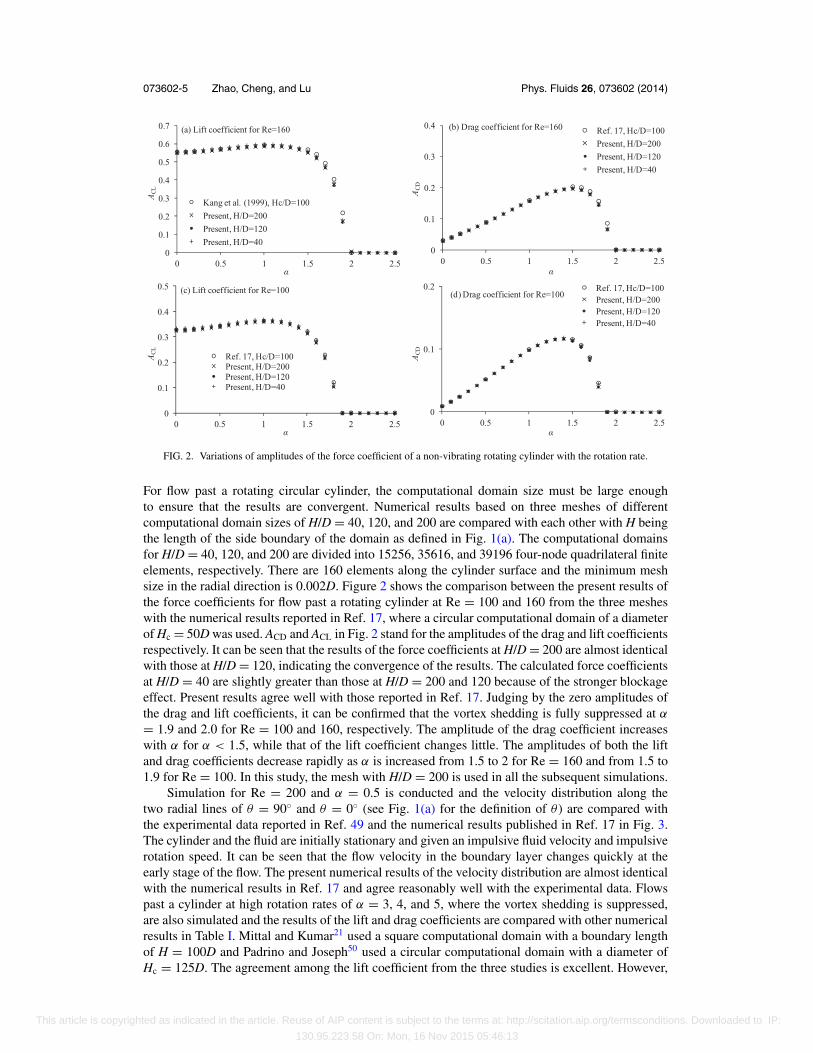
FIG. 2. Variations of amplitudes of the force coefficient of a non-vibrating rotating cylinder with the rotation rate.
For flow past a rotating circular cylinder, the computational domain size must be large enoughto ensure that the results are convergent. Numerical results based on three meshes of differentcomputational domain sizes of H/D = 40, 120, and 200 are compared with each other with H beingthe length of the side boundary of the domain as defined in Fig. 1(a). The computational domainsfor H/D = 40, 120, and 200 are divided into 15256, 35616, and 39196 four-node quadrilateral finiteelements, respectively. There are 160 elements along the cylinder surface and the minimum meshsize in the radial direction is 0.002D. Figure 2 shows the comparison between the present results ofthe force coefficients for flow past a rotating cylinder at Re = 100 and 160 from the three mesheswith the numerical results reported in Ref. 17, where a circular computational domain of a diameterof Hc = 50D was used. ACD and ACL in Fig. 2 stand for the amplitudes of the drag and lift coefficientsrespectively. It can be seen that the results of the force coefficients at H/D = 200 are almost identicalwith those at H/D = 120, indicating the convergence of the results. The calculated force coefficientsat H/D = 40 are slightly greater than those at H/D = 200 and 120 because of the stronger blockageeffect. Present results agree well with those reported in Ref. 17. Judging by the zero amplitudes ofthe drag and lift coefficients, it can be confirmed that the vortex shedding is fully suppressed at α
= 1.9 and 2.0 for Re = 100 and 160, respectively. The amplitude of the drag coefficient increaseswith α for α < 1.5, while that of the lift coefficient changes little. The amplitudes of both the liftand drag coefficients decrease rapidly as α is increased from 1.5 to 2 for Re = 160 and from 1.5 to1.9 for Re = 100. In this study, the mesh with H/D = 200 is used in all the subsequent simulations.
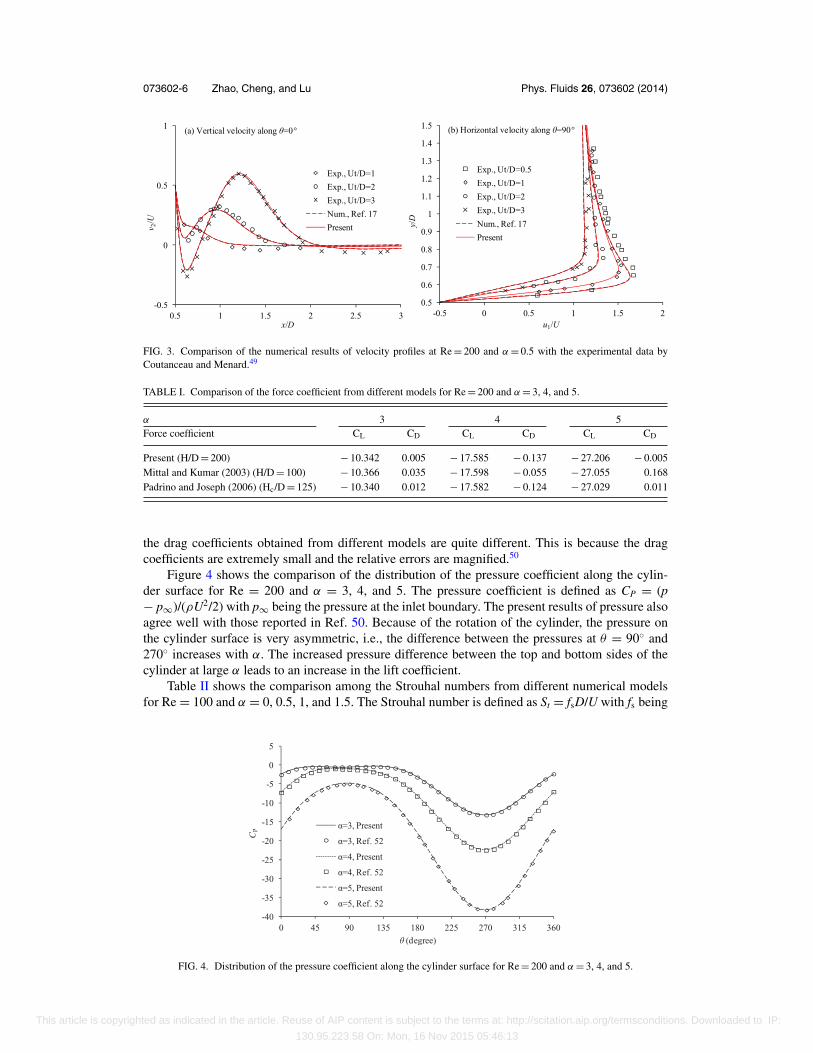
Simulation for Re = 200 and α = 0.5 is conducted and the velocity distribution along thetwo radial lines of θ = 90◦ and θ = 0◦ (see Fig. 1(a) for the definition of θ ) are compared withthe experimental data reported in Ref. 49 and the numerical results published in Ref. 17 in Fig. 3.The cylinder and the fluid are initially stationary and given an impulsive fluid velocity and impulsiverotation speed. It can be seen that the flow velocity in the boundary layer changes quickly at theearly stage of the flow. The present numerical results of the velocity distribution are almost identicalwith the numerical results in Ref. 17 and agree reasonably well with the experimental data. Flowspast a cylinder at high rotation rates of α = 3, 4, and 5, where the vortex shedding is suppressed,are also simulated and the results of the lift and drag coefficients are compared with other numericalresults in Table I. Mittal and Kumar21 used a square computational domain with a boundary lengthof H = 100D and Padrino and Joseph50 used a circular computational domain with a diameter ofHc = 125D. The agreement among the lift coefficient from the three studies is excellent. However,
This article is copyrighted as indicated in the article. Reuse of AIP content is subject to the terms at: http://scitation.aip.org/termsconditions. Downloaded to IP:
130.95.223.58 On: Mon, 16 Nov 2015 05:46:13
073602-6 Zhao, Cheng, and Lu Phys. Fluids 26, 073602 (2014)
-0.5
0
0.5
1
0.5 1 1.5 2 2.5 3
v 2/U
x/D
Exp., Ut/D=1
Exp., Ut/D=2
Exp., Ut/D=3
Num., Ref. 17
Present
(a) Vertical velocity along =0°
0.5
0.6
0.7
0.8
0.9
1
1.1
1.2
1.3
1.4
1.5
-0.5 0 0.5 1 1.5 2
y /D
u1/U
Exp., Ut/D=0.5
Exp., Ut/D=1
Exp., Ut/D=2
Exp., Ut/D=3
Num., Ref. 17
Present
(b) Horizontal velocity along =90°
FIG. 3. Comparison of the numerical results of velocity profiles at Re = 200 and α = 0.5 with the experimental data byCoutanceau and Menard.49
TABLE I. Comparison of the force coefficient from different models for Re = 200 and α = 3, 4, and 5.
α 3 4 5Force coefficient CL CD CL CD CL CD
Present (H/D = 200) − 10.342 0.005 − 17.585 − 0.137 − 27.206 − 0.005Mittal and Kumar (2003) (H/D = 100) − 10.366 0.035 − 17.598 − 0.055 − 27.055 0.168Padrino and Joseph (2006) (Hc/D = 125) − 10.340 0.012 − 17.582 − 0.124 − 27.029 0.011
the drag coefficients obtained from different models are quite different. This is because the dragcoefficients are extremely small and the relative errors are magnified.50
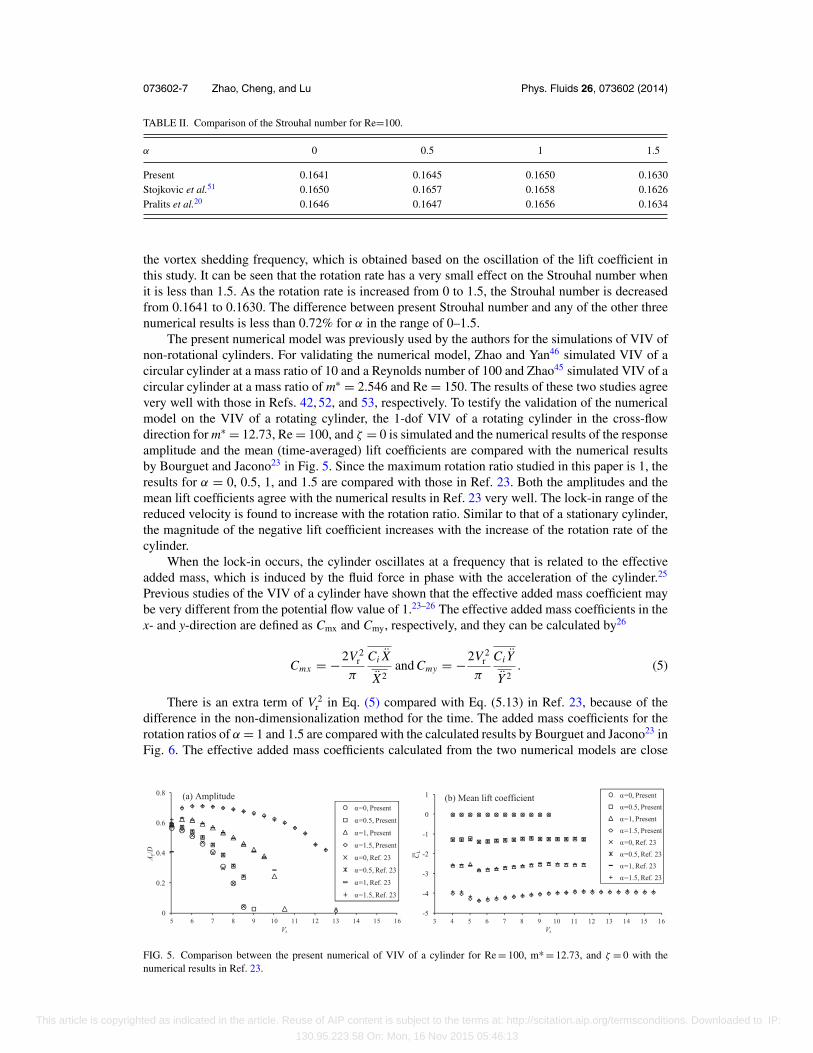
Figure 4 shows the comparison of the distribution of the pressure coefficient along the cylin-der surface for Re = 200 and α = 3, 4, and 5. The pressure coefficient is defined as CP = (p− p∞)/(ρU2/2) with p∞ being the pressure at the inlet boundary. The present results of pressure alsoagree well with those reported in Ref. 50. Because of the rotation of the cylinder, the pressure onthe cylinder surface is very asymmetric, i.e., the difference between the pressures at θ = 90◦ and270◦ increases with α. The increased pressure difference between the top and bottom sides of thecylinder at large α leads to an increase in the lift coefficient.
Table II shows the comparison among the Strouhal numbers from different numerical modelsfor Re = 100 and α = 0, 0.5, 1, and 1.5. The Strouhal number is defined as St = fsD/U with fs being
-40
-35
-30
-25
-20
-15
-10
-5
0
5
0 45 90 135 180 225 270 315 360
P
(degree)
=3, Present
=3, Ref. 52
=4, Present
=4, Ref. 52
=5, Present
=5, Ref. 52
FIG. 4. Distribution of the pressure coefficient along the cylinder surface for Re = 200 and α = 3, 4, and 5.
This article is copyrighted as indicated in the article. Reuse of AIP content is subject to the terms at: http://scitation.aip.org/termsconditions. Downloaded to IP:
130.95.223.58 On: Mon, 16 Nov 2015 05:46:13
073602-7 Zhao, Cheng, and Lu Phys. Fluids 26, 073602 (2014)
TABLE II. Comparison of the Strouhal number for Re=100.
α 0 0.5 1 1.5
Present 0.1641 0.1645 0.1650 0.1630Stojkovic et al.51 0.1650 0.1657 0.1658 0.1626Pralits et al.20 0.1646 0.1647 0.1656 0.1634
the vortex shedding frequency, which is obtained based on the oscillation of the lift coefficient inthis study. It can be seen that the rotation rate has a very small effect on the Strouhal number whenit is less than 1.5. As the rotation rate is increased from 0 to 1.5, the Strouhal number is decreasedfrom 0.1641 to 0.1630. The difference between present Strouhal number and any of the other threenumerical results is less than 0.72% for α in the range of 0–1.5.
The present numerical model was previously used by the authors for the simulations of VIV ofnon-rotational cylinders. For validating the numerical model, Zhao and Yan46 simulated VIV of acircular cylinder at a mass ratio of 10 and a Reynolds number of 100 and Zhao45 simulated VIV of acircular cylinder at a mass ratio of m∗ = 2.546 and Re = 150. The results of these two studies agreevery well with those in Refs. 42, 52, and 53, respectively. To testify the validation of the numericalmodel on the VIV of a rotating cylinder, the 1-dof VIV of a rotating cylinder in the cross-flowdirection for m∗ = 12.73, Re = 100, and ζ = 0 is simulated and the numerical results of the responseamplitude and the mean (time-averaged) lift coefficients are compared with the numerical resultsby Bourguet and Jacono23 in Fig. 5. Since the maximum rotation ratio studied in this paper is 1, theresults for α = 0, 0.5, 1, and 1.5 are compared with those in Ref. 23. Both the amplitudes and themean lift coefficients agree with the numerical results in Ref. 23 very well. The lock-in range of thereduced velocity is found to increase with the rotation ratio. Similar to that of a stationary cylinder,the magnitude of the negative lift coefficient increases with the increase of the rotation rate of thecylinder.
When the lock-in occurs, the cylinder oscillates at a frequency that is related to the effectiveadded mass, which is induced by the fluid force in phase with the acceleration of the cylinder.25
Previous studies of the VIV of a cylinder have shown that the effective added mass coefficient maybe very different from the potential flow value of 1.23–26 The effective added mass coefficients in thex- and y-direction are defined as Cmx and Cmy, respectively, and they can be calculated by26
Cmx = −2V 2r
π
Ci X
X2and Cmy = −2V 2
r
π
Ci Y
Y 2. (5)
There is an extra term of V 2r in Eq. (5) compared with Eq. (5.13) in Ref. 23, because of the
difference in the non-dimensionalization method for the time. The added mass coefficients for therotation ratios of α = 1 and 1.5 are compared with the calculated results by Bourguet and Jacono23 inFig. 6. The effective added mass coefficients calculated from the two numerical models are close
0
0.2
0.4
0.6
0.8
5 6 7 8 9 10 11 12 13 14 15 16
Ay/
D
Vr
=0, Present
=0.5, Present
=1, Present
=1.5, Present
=0, Ref. 23
=0.5, Ref. 23
=1, Ref. 23
=1.5, Ref. 23
(a) Amplitude
-5
-4
-3
-2
-1
0
1
3 4 5 6 7 8 9 10 11 12 13 14 15 16
CL
Vr
=0, Present
=0.5, Present
=1, Present
=1.5, Present
=0, Ref. 23
=0.5, Ref. 23
=1, Ref. 23
=1.5, Ref. 23
(b) Mean lift coefficient
FIG. 5. Comparison between the present numerical of VIV of a cylinder for Re = 100, m* = 12.73, and ζ = 0 with thenumerical results in Ref. 23.
This article is copyrighted as indicated in the article. Reuse of AIP content is subject to the terms at: http://scitation.aip.org/termsconditions. Downloaded to IP:
130.95.223.58 On: Mon, 16 Nov 2015 05:46:13
073602-8 Zhao, Cheng, and Lu Phys. Fluids 26, 073602 (2014)
-0.5
0
0.5
1
1.5
2
2.5
3
4 5 6 7 8 9 10 11 12 13
Cm
y
Vr
=1, Present
=1, Ref. 23
(a) = 1
-0.5
0
0.5
1
1.5
2
2.5
4 5 6 7 8 9 10 11 12 13
Cm
y
Vr
=1.5, Present
=1.5, Ref. 23
(b) = 1.5
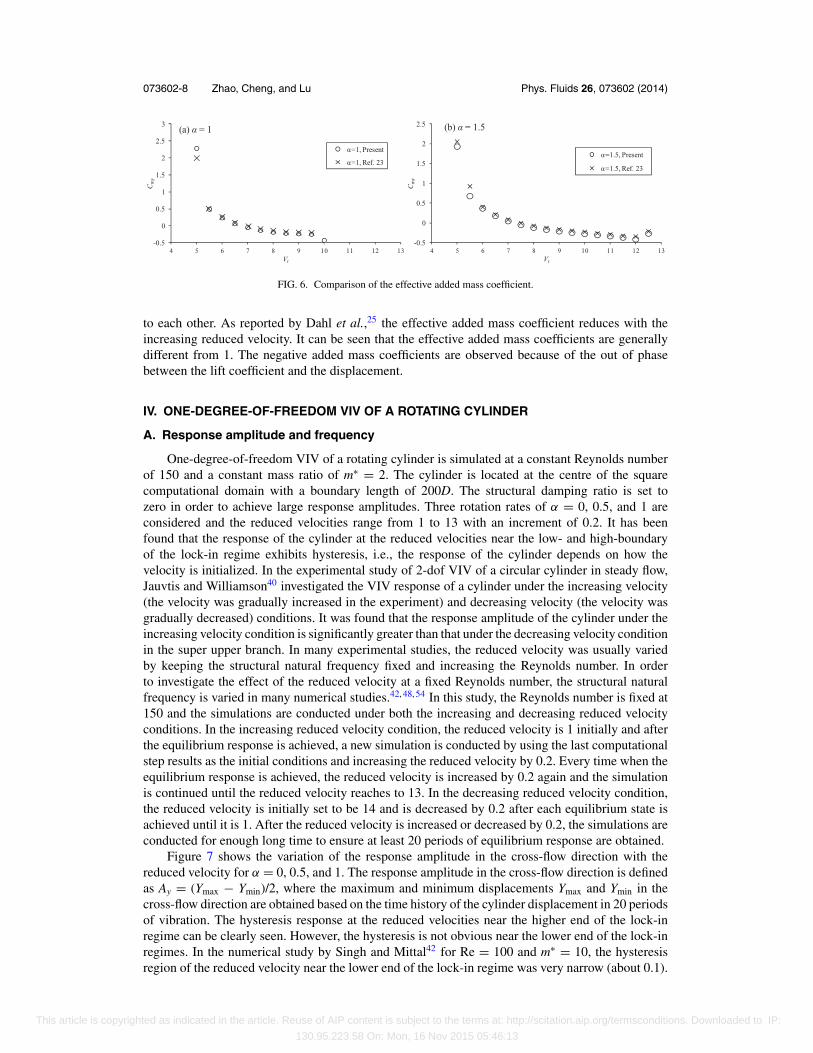
FIG. 6. Comparison of the effective added mass coefficient.
to each other. As reported by Dahl et al.,25 the effective added mass coefficient reduces with theincreasing reduced velocity. It can be seen that the effective added mass coefficients are generallydifferent from 1. The negative added mass coefficients are observed because of the out of phasebetween the lift coefficient and the displacement.
IV. ONE-DEGREE-OF-FREEDOM VIV OF A ROTATING CYLINDER
A. Response amplitude and frequency
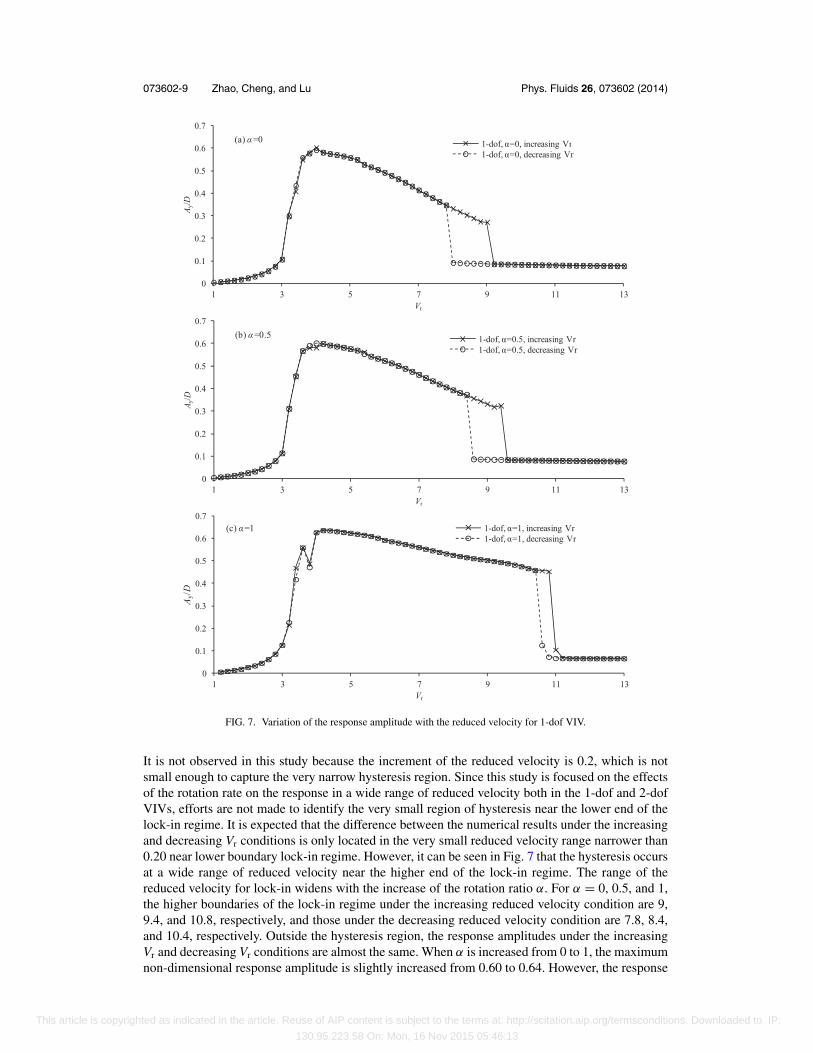
One-degree-of-freedom VIV of a rotating cylinder is simulated at a constant Reynolds numberof 150 and a constant mass ratio of m∗ = 2. The cylinder is located at the centre of the squarecomputational domain with a boundary length of 200D. The structural damping ratio is set tozero in order to achieve large response amplitudes. Three rotation rates of α = 0, 0.5, and 1 areconsidered and the reduced velocities range from 1 to 13 with an increment of 0.2. It has beenfound that the response of the cylinder at the reduced velocities near the low- and high-boundaryof the lock-in regime exhibits hysteresis, i.e., the response of the cylinder depends on how thevelocity is initialized. In the experimental study of 2-dof VIV of a circular cylinder in steady flow,Jauvtis and Williamson40 investigated the VIV response of a cylinder under the increasing velocity(the velocity was gradually increased in the experiment) and decreasing velocity (the velocity wasgradually decreased) conditions. It was found that the response amplitude of the cylinder under theincreasing velocity condition is significantly greater than that under the decreasing velocity conditionin the super upper branch. In many experimental studies, the reduced velocity was usually variedby keeping the structural natural frequency fixed and increasing the Reynolds number. In orderto investigate the effect of the reduced velocity at a fixed Reynolds number, the structural naturalfrequency is varied in many numerical studies.42, 48, 54 In this study, the Reynolds number is fixed at150 and the simulations are conducted under both the increasing and decreasing reduced velocityconditions. In the increasing reduced velocity condition, the reduced velocity is 1 initially and afterthe equilibrium response is achieved, a new simulation is conducted by using the last computationalstep results as the initial conditions and increasing the reduced velocity by 0.2. Every time when theequilibrium response is achieved, the reduced velocity is increased by 0.2 again and the simulationis continued until the reduced velocity reaches to 13. In the decreasing reduced velocity condition,the reduced velocity is initially set to be 14 and is decreased by 0.2 after each equilibrium state isachieved until it is 1. After the reduced velocity is increased or decreased by 0.2, the simulations areconducted for enough long time to ensure at least 20 periods of equilibrium response are obtained.
Figure 7 shows the variation of the response amplitude in the cross-flow direction with thereduced velocity for α = 0, 0.5, and 1. The response amplitude in the cross-flow direction is definedas Ay = (Ymax − Ymin)/2, where the maximum and minimum displacements Ymax and Ymin in thecross-flow direction are obtained based on the time history of the cylinder displacement in 20 periodsof vibration. The hysteresis response at the reduced velocities near the higher end of the lock-inregime can be clearly seen. However, the hysteresis is not obvious near the lower end of the lock-inregimes. In the numerical study by Singh and Mittal42 for Re = 100 and m∗ = 10, the hysteresisregion of the reduced velocity near the lower end of the lock-in regime was very narrow (about 0.1).
This article is copyrighted as indicated in the article. Reuse of AIP content is subject to the terms at: http://scitation.aip.org/termsconditions. Downloaded to IP:
130.95.223.58 On: Mon, 16 Nov 2015 05:46:13
073602-9 Zhao, Cheng, and Lu Phys. Fluids 26, 073602 (2014)
0
0.1
0.2
0.3
0.4
0.5
0.6
0.7
1 3 5 7 9 11 13
Ay/
D
Vr
1-dof, =0, increasing Vr1-dof, =0, decreasing Vr
(a) =0
0
0.1
0.2
0.3
0.4
0.5
0.6
0.7
1 3 5 7 9 11 13
Ay/
D
Vr
1-dof, =0.5, increasing Vr1-dof, =0.5, decreasing Vr
(b) =0.5
0
0.1
0.2
0.3
0.4
0.5
0.6
0.7
1 3 5 7 9 11 13
Ay/D
Vr
1-dof, =1, increasing Vr1-dof, =1, decreasing Vr
(c) =1
FIG. 7. Variation of the response amplitude with the reduced velocity for 1-dof VIV.
It is not observed in this study because the increment of the reduced velocity is 0.2, which is notsmall enough to capture the very narrow hysteresis region. Since this study is focused on the effectsof the rotation rate on the response in a wide range of reduced velocity both in the 1-dof and 2-dofVIVs, efforts are not made to identify the very small region of hysteresis near the lower end of thelock-in regime. It is expected that the difference between the numerical results under the increasingand decreasing Vr conditions is only located in the very small reduced velocity range narrower than0.20 near lower boundary lock-in regime. However, it can be seen in Fig. 7 that the hysteresis occursat a wide range of reduced velocity near the higher end of the lock-in regime. The range of thereduced velocity for lock-in widens with the increase of the rotation ratio α. For α = 0, 0.5, and 1,the higher boundaries of the lock-in regime under the increasing reduced velocity condition are 9,9.4, and 10.8, respectively, and those under the decreasing reduced velocity condition are 7.8, 8.4,and 10.4, respectively. Outside the hysteresis region, the response amplitudes under the increasingVr and decreasing Vr conditions are almost the same. When α is increased from 0 to 1, the maximumnon-dimensional response amplitude is slightly increased from 0.60 to 0.64. However, the response
This article is copyrighted as indicated in the article. Reuse of AIP content is subject to the terms at: http://scitation.aip.org/termsconditions. Downloaded to IP:
130.95.223.58 On: Mon, 16 Nov 2015 05:46:13

073602-10 Zhao, Cheng, and Lu Phys. Fluids 26, 073602 (2014)
0
0.5
1
1.5
2
2.5
1 3 5 7 9 11 13
f y/f n
Vr
1-dof, =0, increasing Vr1-dof, =0, decreasing Vr
(a) =0
f/fn=1
0
0.5
1
1.5
2
2.5
1 3 5 7 9 11 13
f y/f n
Vr
1-dof, =0.5, increasing Vr1-dof, =0.5, decreasing Vr
(b) =0.5
f/fn=1
0
0.5
1
1.5
2
2.5
1 3 5 7 9 11 13
f y/f
n
Vr
1-dof, =1, increasing Vr1-dof, =1, decreasing Vr
(c) =1
f/fn=1
FIG. 8. Variation of the response frequency with the reduced velocity for 1-dof VIV.
amplitude near the higher boundary of the lock-in regime is increased significantly. For instance, theresponse velocity at Vr = 9 is increased from 0.27 to 0.50 after α is increased from 0 to 1. It can beseen in Fig. 7 that the difference in the response amplitude between α = 0.5 and 1 is bigger than thatbetween α = 0 and 0.5, indicating that the change of the response amplitude with α become fasteras α increases.
Figure 8 shows the comparison between the response frequencies under the increasing anddecreasing Vr conditions for α = 0, 0.5, and 1. Similar to the response amplitude, the responsefrequency under the increasing Vr condition is the same as that under the decreasing Vr condition,except in the hysteresis regions. The whole range of the reduced velocity can be divided into fourregimes based on Fig. 8. In the regimes of Vr ≤ 3 for α = 0 and 0.5 and Vr ≤ 3.4 for α = 1, theresponse frequency increases with the reduced velocity linearly for all the three rotation ratios. Inthe regimes of 3.2 ≤ Vr ≤ 3.8, 3.2 ≤ Vr ≤ 4, and 3.6 ≤ Vr ≤ 3.8 for α = 0, 0.5, and 1, respectively,the response frequency locks onto a constant frequency which is lower than the natural frequency.In the third regime of the reduced velocity for each α, the non-dimensional response frequency f/fn
This article is copyrighted as indicated in the article. Reuse of AIP content is subject to the terms at: http://scitation.aip.org/termsconditions. Downloaded to IP:
130.95.223.58 On: Mon, 16 Nov 2015 05:46:13
073602-11 Zhao, Cheng, and Lu Phys. Fluids 26, 073602 (2014)
-3.5
-3
-2.5
-2
-1.5
-1
-0.5
0
0.5
1 3 5 7 9 11 13
Y
Vr
1-dof, =0, increasing Vr
1-dof, =0.5, increasing Vr
1-dof, =1, increasing Vr
FIG. 9. Variation of the mean position of the cross-flow displacement with the reduced velocity under the increasing Vr
condition for 1-dof VIV.
is close to 1. The Strouhal numbers for a non-vibrating rotating cylinder at α = 0, 0.5, and 1 are veryclose to each other and they are St = 0.1843, 0.1840, and 0.1835, respectively. The reduced velocitycorresponding to a natural frequency which is the same as the vortex shedding frequency is about5.426, 5.435, and 5.450, respectively, for α = 0, 0.5, and 1. It can be seen that when the reducedvelocity is smaller than about 5.4, the response frequency of the cylinder does not exactly match thestructural frequency, and the detuning increases as the reduced velocity moves away from about 5.4(natural frequency moves away from the vortex shedding frequency of a non-vibrating cylinder).This phenomenon was referred to as soft-lock-in in Ref. 55. When the reduced velocity is greaterthan the higher boundary of the lock-in regime, the response amplitude becomes very small and theresponse frequency increases linearly with the increasing reduced velocity. A sudden jump in theresponse frequency occurs when the reduced velocity exceeds the higher boundary of the lock-inregime.
If the cylinder rotates, the mean position of the cylinder in the cross-flow direction movesin the negative y-direction and its magnitude increases with the increase of the reduced velocity.Figure 9 shows the variation of the mean position of the displacement in the cross-flow directionwith the reduced velocity. The magnitude of the mean position of the cylinder increases with theincreasing rotation rate. This is due to the increase in the magnitude of the mean lift coefficient,which has been found in Refs. 17 and 56 for a non-vibrating cylinder.
B. Force coefficients
It has been well known that the phase between the force and the vibration displacement inthe cross-flow direction jumps from 0◦ to 180◦ at the boundary between the upper and lowerbranches.39, 40 For VIV of a cylinder, the fluid forces were found to only peak at the vibrationfrequency or at frequencies corresponding to higher harmonic of vibration frequency.23 The higherharmonics in the forces also exist in the case of VIV of a non-rotating cylinder.25, 40 Bourguetand Jacono23 decomposed both the displacement and the force into harmonics of the fundamentalfrequency of the displacement and examined the phase between the first harmonic components of thedisplacement and the force. In this study, the phase between the displacement and the force (definedas ψy) is examined by the correlation between the displacement and the force. The correlationbetween the displacement and the force in the x- and the y-directions is defined as
Rx = (X − X )(CD − CD)/(X ′C ′D) and Ry = (Y − Y )(CL − CL)/(Y ′C ′
L), (6)
respectively, where the primes stand for the root mean square values and the over-bars stand forthe averaging over time. The correlation coefficient is 1 if the displacement is in phase with theforce and −1 if the displacement is out of phase with the force. Figure 10 shows the variation ofthe correlation coefficient between the Y-displacement and the lift coefficient for the 1-dof VIV inthe increasing Vr condition. For all the three rotation ratios, the correlation coefficient is found to
This article is copyrighted as indicated in the article. Reuse of AIP content is subject to the terms at: http://scitation.aip.org/termsconditions. Downloaded to IP:
130.95.223.58 On: Mon, 16 Nov 2015 05:46:13

073602-12 Zhao, Cheng, and Lu Phys. Fluids 26, 073602 (2014)
-1.5
-1
-0.5
0
0.5
1
1.5
1 2 3 4 5 6 7 8 9 10 11 12 13
Cor
rela
tion
coef
fici
ent
Vr
=0
=0.5
=1
FIG. 10. Correlation between the displacement in the cross-flow direction and the lift coefficient for the 1-dof VIV in theincreasing Vr condition.
change from 1 to −1 when the reduced velocity is increased from 5 to 6. If the structural damping iszero, the vibration frequency is lower than the natural frequency when Ry ≈ 1 (ψy = 0◦) and higherthan the natural frequency when Ry ≈ −1 (ψy = 180◦).35 It can be seen by comparing Fig. 8 withFig. 10 that the vibration frequency exceeds the natural frequency when the correlation changesfrom 1 to −1.
For a damped system, part of the energy of the flow has to be transferred to the system toovercome the energy loss due the structural damping. Because the structural damping ratio is zeroin this study, the net time averaged energy transferred from the flow to the system should be zero.However, the instantaneous energy transfer between the flow and the structure is found to oscillatewith time.23 A force excites the vibrations if it is in phase with the velocity of the cylinder, anddamps the vibrations if it is out of phase with the velocity of the cylinder. Bourguet and Jacono23
found that the force due to pressure (referred as pressure force) excites the vibration and the forcedue to viscosity (referred as viscous force) damps the vibration of the cylinder. In this study thecontributions of the forces due to pressure and viscosity are quantified. The components of the total,the pressure, and the viscous lift coefficients that are in phase with the velocity of the cylinder aredefined as CLv, Cp
Lv, and CvLv, respectively, and they are calculated by
CLv =√
2(CL − CL)Y√Y 2
, CpLv =
√2(Cp
L − CpL)Y√
Y 2, Cv
Lv =√
2(CvL − Cv
L)Y√Y 2
, (7)
where pressure and viscous lift coefficients (CpL and Cv
L) are obtained by integrating the pressure andthe shear stress over the cylinder surface, respectively.
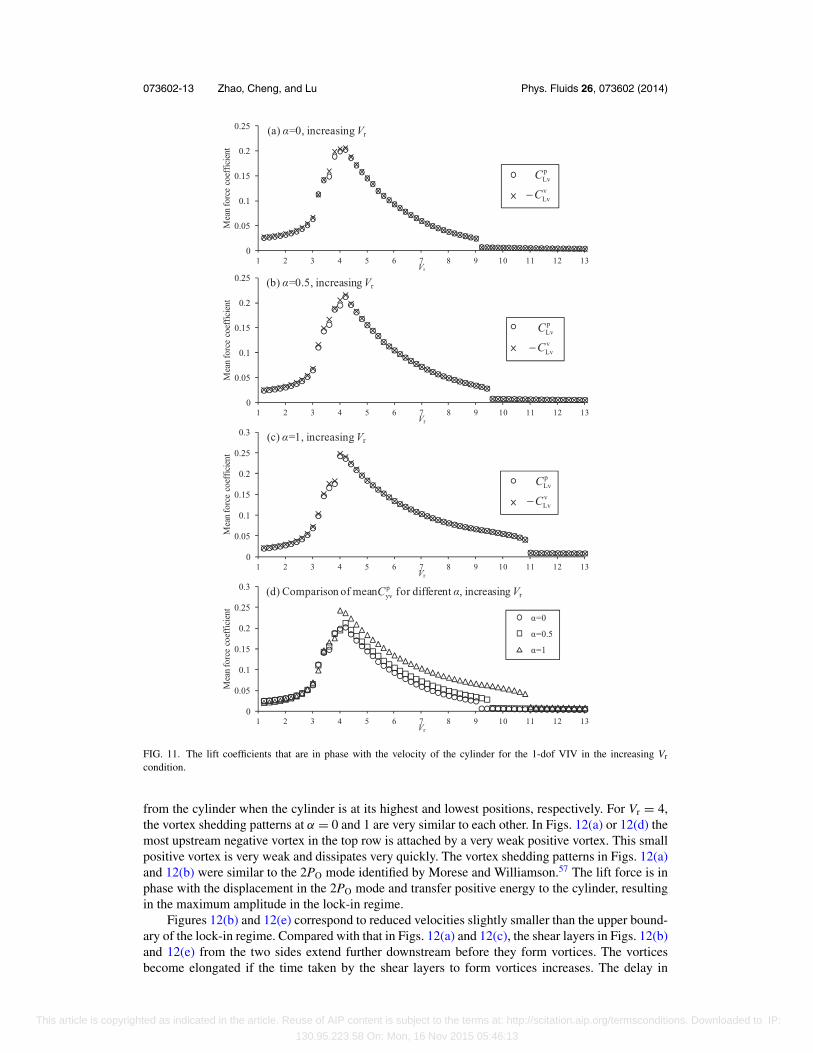
Figure 11 shows the variations of the time averaged coefficients CpL and −Cv
L with the reducedvelocity for the 1-dof VIV in the increasing Vr condition. It is found that the pressure force alwaysexcites the vibration, while the viscous force always damps the vibration both inside and outsidethe lock-in regime. Because Cv
L is found to be always negative, −CvL is shown in Fig. 11 in order
to compare the two force coefficients straightforwardly. It can be seen that both CpL and −Cv
L reachtheir maximum value at a same reduced velocity as the vibration amplitude of the cylinder does.Cp
L and −CvL outside the lock-in regime are very small, especially for reduced velocities higher than
the upper boundary of the lock-in regime. CpL and −Cv
L are almost the same as each other in all thecases, leading to a zero net energy transfer from the fluid flow to the structure.
C. Vortex shedding flow
Figure 12 shows the vorticity contours of the wake flow under the increasing velocity conditionfor α = 0 and 1 at the instants when the cylinder is at its highest position. The non-dimensionalvorticity is defined as ω = (∂v/∂x − ∂u/∂y)/Vr . The vortex shedding for all the reduced velocitiesand rotation ratios is in the 2S mode, i.e., two single vortices are shed from the cylinder in oneperiod of vibration. However, the vortex shedding patterns in different reduced velocities may bedifferent from each other significantly. The reduced velocities in Figs. 12(a) and 12(d) are thosewhen the response amplitudes reach its maximum. A negative vortex and a positive vortex are shed
This article is copyrighted as indicated in the article. Reuse of AIP content is subject to the terms at: http://scitation.aip.org/termsconditions. Downloaded to IP:
130.95.223.58 On: Mon, 16 Nov 2015 05:46:13
073602-13 Zhao, Cheng, and Lu Phys. Fluids 26, 073602 (2014)
0
0.05
0.1
0.15
0.2
0.25
1 2 3 4 5 6 7 8 9 10 11 12 13
Mea
n fo
rce
coef
fici
ent
Vr
(a) =0, increasing Vr
vLv
pLv
C
C
−
0
0.05
0.1
0.15
0.2
0.25
1 2 3 4 5 6 7 8 9 10 11 12 13
Mea
n fo
rce
coef
fici
ent
Vr
(b) =0.5, increasing Vr
vLv
pLv
C
C
−
0
0.05
0.1
0.15
0.2
0.25
0.3
1 2 3 4 5 6 7 8 9 10 11 12 13
Mea
n fo
rce
coef
fici
ent
Vr
(c) =1, increasing Vr
vLv
pLv
C
C
−
0
0.05
0.1
0.15
0.2
0.25
0.3
1 2 3 4 5 6 7 8 9 10 11 12 13
Mea
n fo
rce
coef
fici
ent
Vr
=0
=0.5
=1
(d) Comparison of mean for different , increasing VrpyvC
FIG. 11. The lift coefficients that are in phase with the velocity of the cylinder for the 1-dof VIV in the increasing Vr
condition.
from the cylinder when the cylinder is at its highest and lowest positions, respectively. For Vr = 4,the vortex shedding patterns at α = 0 and 1 are very similar to each other. In Figs. 12(a) or 12(d) themost upstream negative vortex in the top row is attached by a very weak positive vortex. This smallpositive vortex is very weak and dissipates very quickly. The vortex shedding patterns in Figs. 12(a)and 12(b) were similar to the 2PO mode identified by Morese and Williamson.57 The lift force is inphase with the displacement in the 2PO mode and transfer positive energy to the cylinder, resultingin the maximum amplitude in the lock-in regime.
Figures 12(b) and 12(e) correspond to reduced velocities slightly smaller than the upper bound-ary of the lock-in regime. Compared with that in Figs. 12(a) and 12(c), the shear layers in Figs. 12(b)and 12(e) from the two sides extend further downstream before they form vortices. The vorticesbecome elongated if the time taken by the shear layers to form vortices increases. The delay in
This article is copyrighted as indicated in the article. Reuse of AIP content is subject to the terms at: http://scitation.aip.org/termsconditions. Downloaded to IP:
130.95.223.58 On: Mon, 16 Nov 2015 05:46:13

073602-14 Zhao, Cheng, and Lu Phys. Fluids 26, 073602 (2014)
FIG. 12. Contours of the vorticity for the 1-dof VIV under the increasing velocity condition for α = 1 and Vr = 4.
This article is copyrighted as indicated in the article. Reuse of AIP content is subject to the terms at: http://scitation.aip.org/termsconditions. Downloaded to IP:
130.95.223.58 On: Mon, 16 Nov 2015 05:46:13

073602-15 Zhao, Cheng, and Lu Phys. Fluids 26, 073602 (2014)
the formation of the vortices enables the vortex shedding frequency being locked onto the vibrationfrequency of the cylinder in a large range of the reduced velocity in the lock-in regime. The wideningof the lock-in regime for a rotating cylinder is explained by examining the vortex shedding patternshown in Fig. 12. When the cylinder rotates anticlockwisely, the relative velocity of the fluid atthe bottom surface of the cylinder is reduced. The weakened shear layer postpones the timing ofthe formation of the positive vortices from the bottom surface of the cylinder. The elongation ofthe vortices shed from the bottom surface of the cylinder is a good indication of the delay in theformation of the vortices from the bottom surface of the cylinder. It is observed that each vortex fromthe bottom surface of the cylinder is so elongated that it is split into two while travelling downstream.Kang et al.17 reported that the vortex shedding frequency reduced with the increasing rotation ratioat Re = 160 for a non-vibrating rotating cylinder. A slight change in the phase of vortex-inducedforce can lead to a change in the energy input from the vortices to the cylinder (sometimes fromnegative to positive).57
The reduced velocities in Figs. 12(c) and 12(f) are slightly higher than the upper boundary ofthe lock-in regime. The vortices in Figs. 12(c) and 12(f) are shed from the cylinder faster than thosein Figs. 12(b) and 12(e) because more vortices are aligned downstream the cylinder. The vortexshedding patterns for α = 0.5 are similar to those for α = 1 and are not presented in Fig. 12. Thedifference between the vortices from the bottom surface and those from the top surface for α = 0.5is weaker than that for α = 1 (Fig. 12(e)).
V. TWO-DEGREE-OF-FREEDOM VIV OF A ROTATING CYLINDER
A. Vibration amplitude and frequency
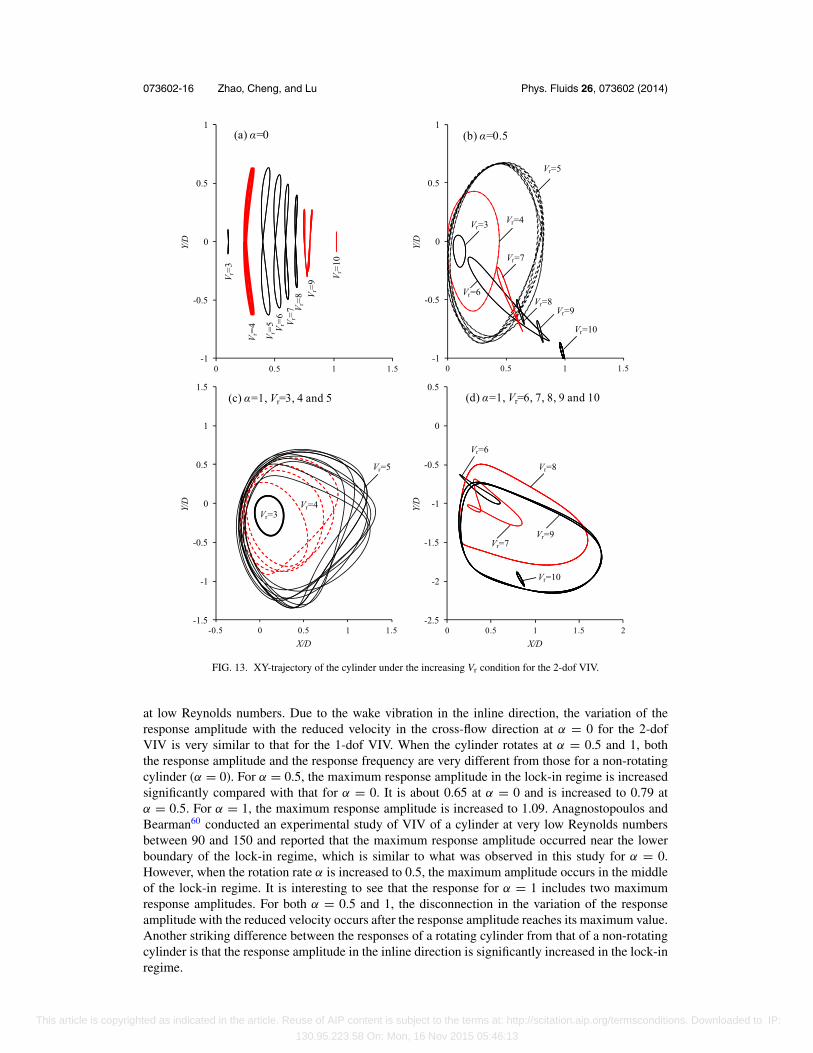
The input parameters for simulating the 2-dof VIV of a rotating cylinder are the same as thoseused in the 1-dof VIV, except that the cylinder is allowed to vibrate in both the inline and thecross-flow directions. The structural natural frequencies in the inline and cross-flow directions arethe same. The XY-trajectories of the 2-dof vibration of the cylinder for α = 0, 0.5, and 1 are shown inFig. 13. For α = 0, the vibration trajectories in the lock-in regime are in the shape of “8”, except thatat Vr = 9, the higher boundary of the lock-in regime. Based on the shape of the vibration trajectories,it is observed that the vibration frequency in the inline direction is twice that in the cross-flowdirection for α = 0. When the reduced velocity is outside the lock-in regime (for example, Vr = 3and 10 in Fig. 13(a)), the cylinder almost vibrates only in the cross-flow direction with negligiblysmall amplitude in the inline direction. The trajectories of the cylinder in the lock-in regime for α
= 0.5 and 1 are similar to each other and are significantly different from those for α = 0. If thecylinder rotates at α = 0.5 and 1, the trajectory of the cylinder in one period of vibration comprisesone single loop as shown in Figs. 13(b)–13(d). The single-loop trajectories suggest that the vibrationfrequency in the inline direction is the same as that in the cross-flow direction. It appears that thedimension of the XY-trajectory in the inline direction increases with α, indicating the increase ofthe inline amplitude. Some of the vibrations are not exactly periodic such as those at Vr = 5 forα = 0.5 and at Vr = 4 and 5 for α = 1. These reduced velocities are near the boundaries betweentwo branches.
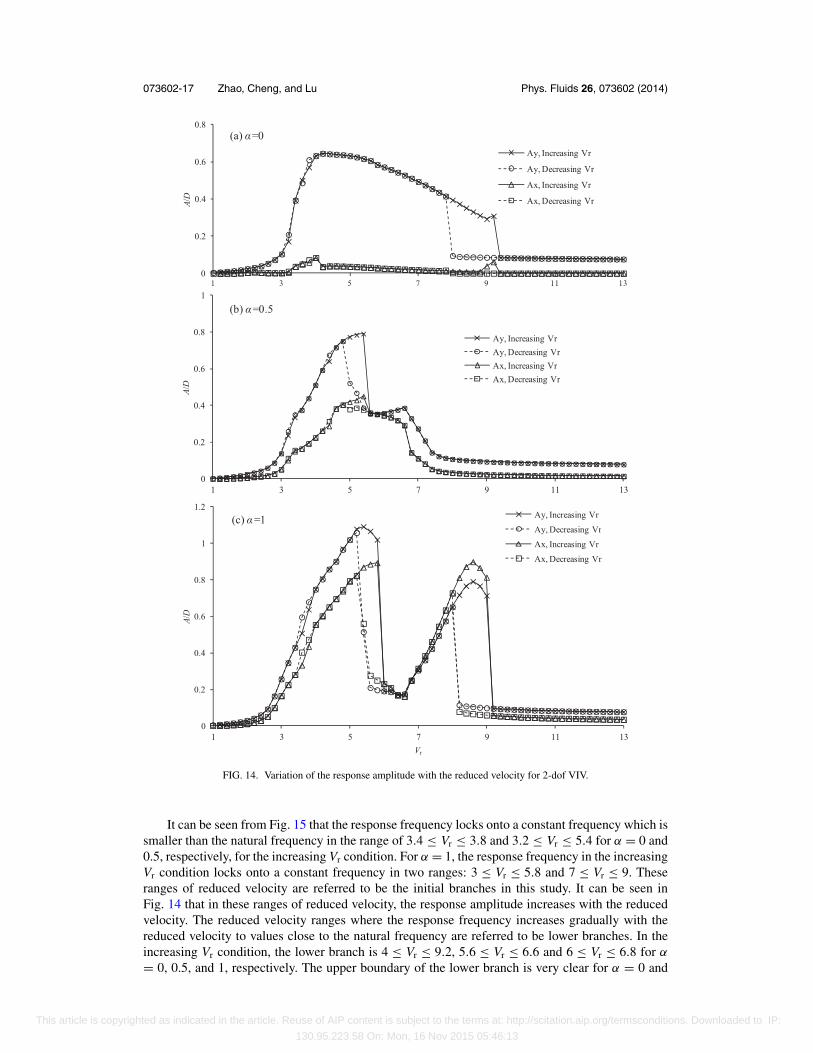
Figure 14 shows the variations of the response amplitudes in the inline and the cross-flowdirections with the reduced velocity. The response amplitude in the inline direction is defined asAx = (Xmax − Xmin)/2 with Xmax and Xmin being the maximum and minimum displacements inthe inline direction, respectively. Figure 15 shows the variation of the response frequency in thecross-flow direction with the reduced velocity for the 2-dof VIV. Similar to that of the 1-dof VIV, thehysteresis near the lower boundary of the lock-in regime is not obvious. Weak difference betweenthe response amplitudes under the increasing and the decreasing Vr conditions is observed in thereduced velocity range between 3 and 4. For α = 0, the response amplitude in the in-line direction isnegligibly smaller than that in the cross-flow direction. This agrees with experimental observationsat high Reynolds numbers in Refs. 40 and 58 and the numerical simulations at low Reynoldsnumbers in Refs. 42 and 59. The response amplitude reaches its maximum in the upper branchin the 2-dof VIV of a non-rotating cylinder.35, 38, 39 The upper branch cannot be clearly identified
This article is copyrighted as indicated in the article. Reuse of AIP content is subject to the terms at: http://scitation.aip.org/termsconditions. Downloaded to IP:
130.95.223.58 On: Mon, 16 Nov 2015 05:46:13
073602-16 Zhao, Cheng, and Lu Phys. Fluids 26, 073602 (2014)
FIG. 13. XY-trajectory of the cylinder under the increasing Vr condition for the 2-dof VIV.
at low Reynolds numbers. Due to the wake vibration in the inline direction, the variation of theresponse amplitude with the reduced velocity in the cross-flow direction at α = 0 for the 2-dofVIV is very similar to that for the 1-dof VIV. When the cylinder rotates at α = 0.5 and 1, boththe response amplitude and the response frequency are very different from those for a non-rotatingcylinder (α = 0). For α = 0.5, the maximum response amplitude in the lock-in regime is increasedsignificantly compared with that for α = 0. It is about 0.65 at α = 0 and is increased to 0.79 atα = 0.5. For α = 1, the maximum response amplitude is increased to 1.09. Anagnostopoulos andBearman60 conducted an experimental study of VIV of a cylinder at very low Reynolds numbersbetween 90 and 150 and reported that the maximum response amplitude occurred near the lowerboundary of the lock-in regime, which is similar to what was observed in this study for α = 0.However, when the rotation rate α is increased to 0.5, the maximum amplitude occurs in the middleof the lock-in regime. It is interesting to see that the response for α = 1 includes two maximumresponse amplitudes. For both α = 0.5 and 1, the disconnection in the variation of the responseamplitude with the reduced velocity occurs after the response amplitude reaches its maximum value.Another striking difference between the responses of a rotating cylinder from that of a non-rotatingcylinder is that the response amplitude in the inline direction is significantly increased in the lock-inregime.
This article is copyrighted as indicated in the article. Reuse of AIP content is subject to the terms at: http://scitation.aip.org/termsconditions. Downloaded to IP:
130.95.223.58 On: Mon, 16 Nov 2015 05:46:13
073602-17 Zhao, Cheng, and Lu Phys. Fluids 26, 073602 (2014)
FIG. 14. Variation of the response amplitude with the reduced velocity for 2-dof VIV.
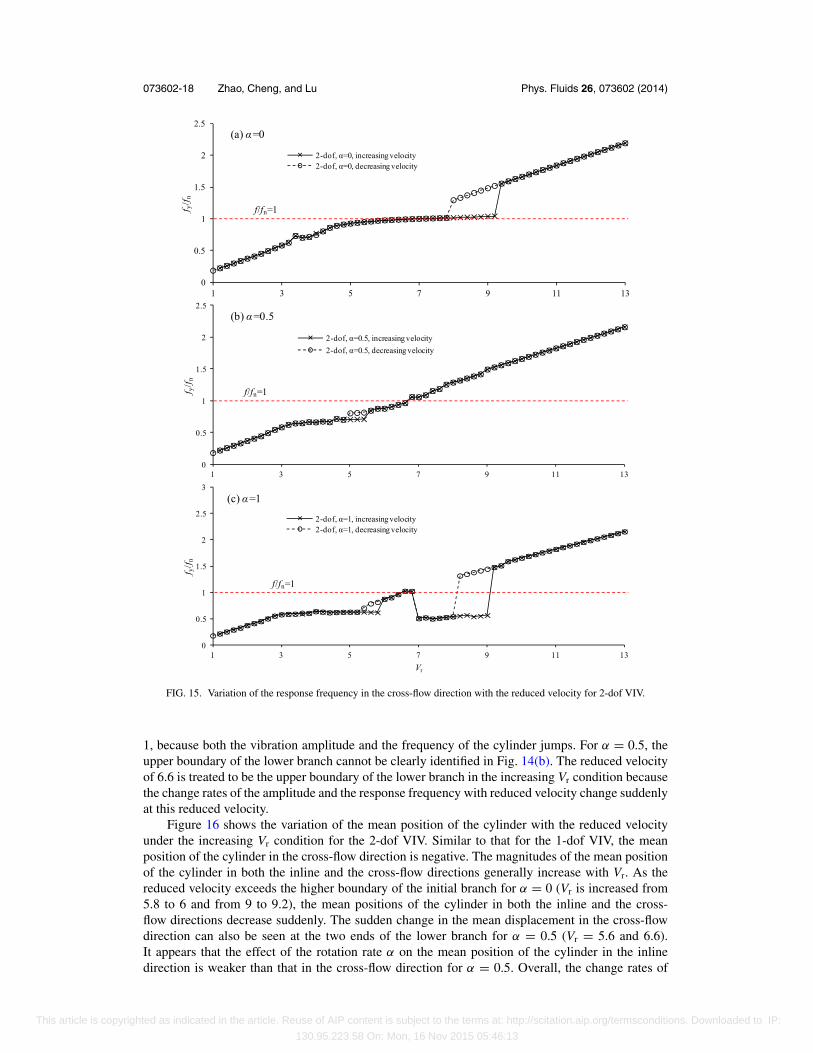
It can be seen from Fig. 15 that the response frequency locks onto a constant frequency which issmaller than the natural frequency in the range of 3.4 ≤ Vr ≤ 3.8 and 3.2 ≤ Vr ≤ 5.4 for α = 0 and0.5, respectively, for the increasing Vr condition. For α = 1, the response frequency in the increasingVr condition locks onto a constant frequency in two ranges: 3 ≤ Vr ≤ 5.8 and 7 ≤ Vr ≤ 9. Theseranges of reduced velocity are referred to be the initial branches in this study. It can be seen inFig. 14 that in these ranges of reduced velocity, the response amplitude increases with the reducedvelocity. The reduced velocity ranges where the response frequency increases gradually with thereduced velocity to values close to the natural frequency are referred to be lower branches. In theincreasing Vr condition, the lower branch is 4 ≤ Vr ≤ 9.2, 5.6 ≤ Vr ≤ 6.6 and 6 ≤ Vr ≤ 6.8 for α
= 0, 0.5, and 1, respectively. The upper boundary of the lower branch is very clear for α = 0 and
This article is copyrighted as indicated in the article. Reuse of AIP content is subject to the terms at: http://scitation.aip.org/termsconditions. Downloaded to IP:
130.95.223.58 On: Mon, 16 Nov 2015 05:46:13
073602-18 Zhao, Cheng, and Lu Phys. Fluids 26, 073602 (2014)
FIG. 15. Variation of the response frequency in the cross-flow direction with the reduced velocity for 2-dof VIV.
1, because both the vibration amplitude and the frequency of the cylinder jumps. For α = 0.5, theupper boundary of the lower branch cannot be clearly identified in Fig. 14(b). The reduced velocityof 6.6 is treated to be the upper boundary of the lower branch in the increasing Vr condition becausethe change rates of the amplitude and the response frequency with reduced velocity change suddenlyat this reduced velocity.
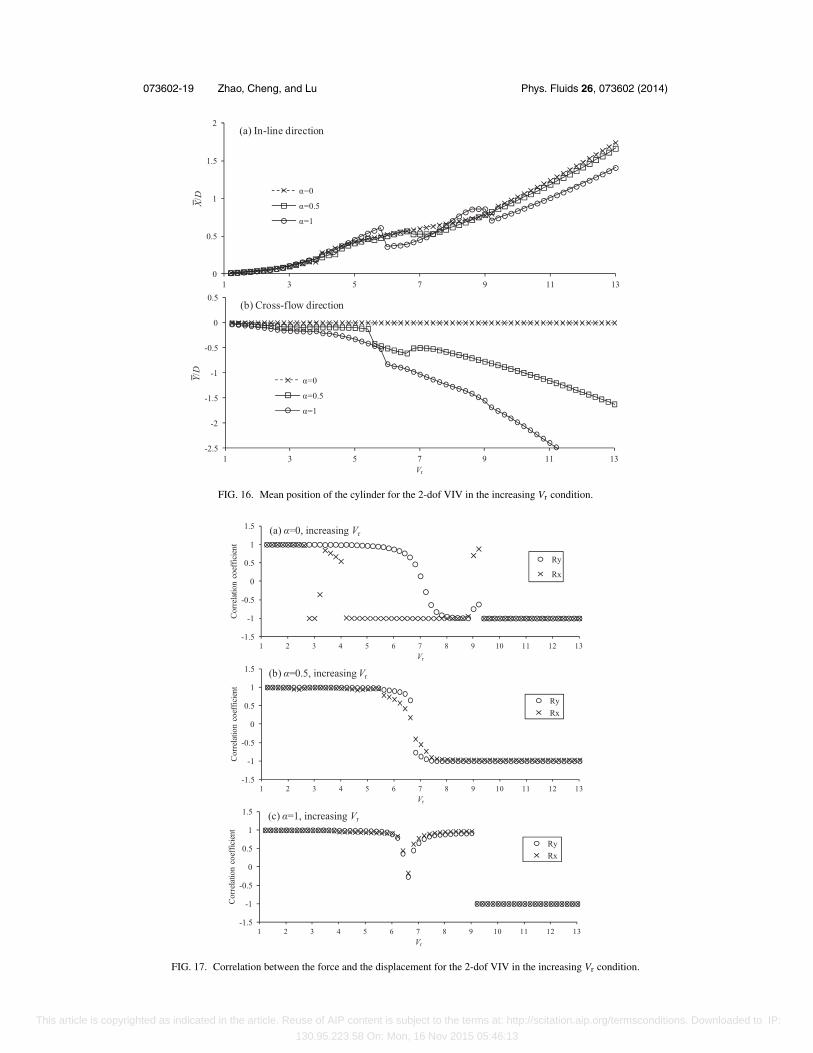
Figure 16 shows the variation of the mean position of the cylinder with the reduced velocityunder the increasing Vr condition for the 2-dof VIV. Similar to that for the 1-dof VIV, the meanposition of the cylinder in the cross-flow direction is negative. The magnitudes of the mean positionof the cylinder in both the inline and the cross-flow directions generally increase with Vr. As thereduced velocity exceeds the higher boundary of the initial branch for α = 0 (Vr is increased from5.8 to 6 and from 9 to 9.2), the mean positions of the cylinder in both the inline and the cross-flow directions decrease suddenly. The sudden change in the mean displacement in the cross-flowdirection can also be seen at the two ends of the lower branch for α = 0.5 (Vr = 5.6 and 6.6).It appears that the effect of the rotation rate α on the mean position of the cylinder in the inlinedirection is weaker than that in the cross-flow direction for α = 0.5. Overall, the change rates of
This article is copyrighted as indicated in the article. Reuse of AIP content is subject to the terms at: http://scitation.aip.org/termsconditions. Downloaded to IP:
130.95.223.58 On: Mon, 16 Nov 2015 05:46:13
073602-19 Zhao, Cheng, and Lu Phys. Fluids 26, 073602 (2014)
FIG. 16. Mean position of the cylinder for the 2-dof VIV in the increasing Vr condition.
FIG. 17. Correlation between the force and the displacement for the 2-dof VIV in the increasing Vr condition.
This article is copyrighted as indicated in the article. Reuse of AIP content is subject to the terms at: http://scitation.aip.org/termsconditions. Downloaded to IP:
130.95.223.58 On: Mon, 16 Nov 2015 05:46:13

073602-20 Zhao, Cheng, and Lu Phys. Fluids 26, 073602 (2014)
FIG. 18. Variations of the RMS drag and lift coefficients with the reduced velocity for the 2-dof VIV in the increasing Vr
condition.
the mean position of the cylinder with the reduced velocity in both the inline and the cross-flowdirection increases with the increasing reduced velocity.
B. Force coefficients and effective added mass coefficients
The correlation coefficients between the vibration displacement and the force coefficient in boththe x- and the y-directions are shown in Fig. 17. The variation of the correlation coefficient Ry withVr for α = 0 and 0.5 is similar to their counterparts in the 1-dof VIV. The correlation Rx for α = 0varies between 1 and −1 a number of times as shown in Fig. 17(a). By comparing Fig. 17(a) andFig. 14(a) it can be seen that whenever the Rx changes from −1 to values close to 1, i.e., the drag forcechange from out of phase to in phase with the inline displacement, the amplitude in the x-directionincreases. The variations of Rx and Ry with the reduced velocity are similar to each other forα = 0.5. It can be seen in Fig. 14(b) that the variations of the displacements in the x- and y-directions with the reduced velocity are also similar to each other. The variation of Ry with thereduced velocity for α = 1 is very different from those for α = 0 and 0.5. The sudden reductionof Ry in the reduced velocity range of 6 ≤ Vr ≤ 7 leads to significant reduction in the responseamplitude.
Figures 18(a) and 18(b) show the variation of the root mean square (RMS) drag and liftcoefficients (C′
D and C′L) with the reduced velocity for the 2-dof VIV under the increasing Vr
condition, respectively. The increase in the rotation rate α leads to significant increase in both thedrag and lift coefficients. The increased drag and lift coefficients on a rotating cylinder correspondto the increase in the response amplitudes. Another reason why the maximum response amplitudeincreases with the increasing rotation rate is because the initial branch, where the response amplitudeincreases with the increasing Vr, is widened significantly.
Of the total force, only the component that is in phase with the velocity of the cylinder excitesthe vibration. Figure 19 shows the variation of the time averaged force coefficients that are in phasewith the velocities of the cylinder for 2-dof VIV in the increasing Vr condition. The pressure and
This article is copyrighted as indicated in the article. Reuse of AIP content is subject to the terms at: http://scitation.aip.org/termsconditions. Downloaded to IP:
130.95.223.58 On: Mon, 16 Nov 2015 05:46:13
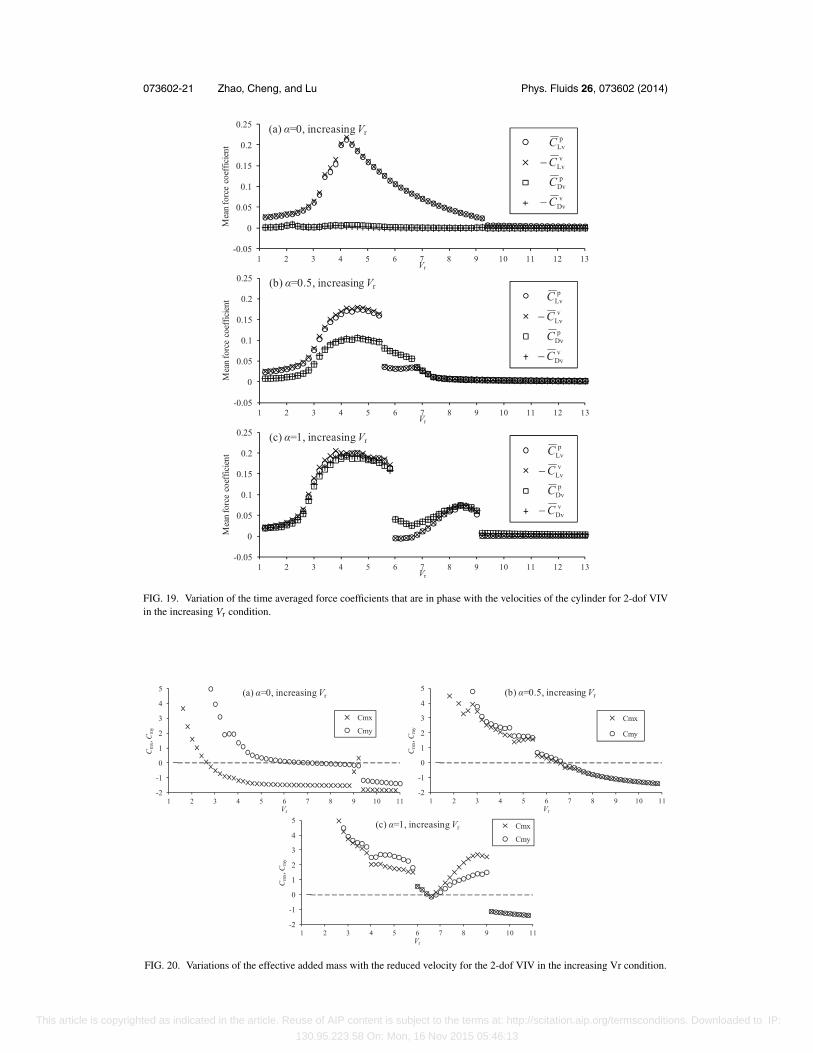
073602-21 Zhao, Cheng, and Lu Phys. Fluids 26, 073602 (2014)
FIG. 19. Variation of the time averaged force coefficients that are in phase with the velocities of the cylinder for 2-dof VIVin the increasing Vr condition.
FIG. 20. Variations of the effective added mass with the reduced velocity for the 2-dof VIV in the increasing Vr condition.
This article is copyrighted as indicated in the article. Reuse of AIP content is subject to the terms at: http://scitation.aip.org/termsconditions. Downloaded to IP:
130.95.223.58 On: Mon, 16 Nov 2015 05:46:13
073602-22 Zhao, Cheng, and Lu Phys. Fluids 26, 073602 (2014)
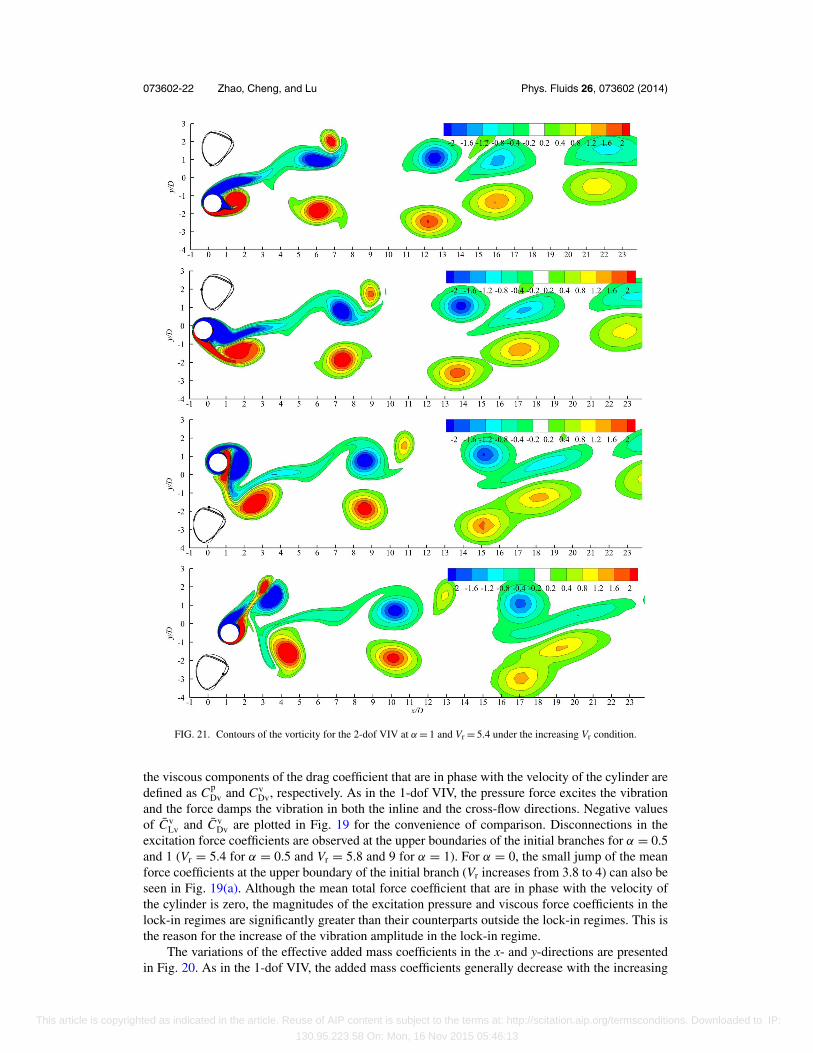
FIG. 21. Contours of the vorticity for the 2-dof VIV at α = 1 and Vr = 5.4 under the increasing Vr condition.
the viscous components of the drag coefficient that are in phase with the velocity of the cylinder aredefined as Cp
Dv and CvDv, respectively. As in the 1-dof VIV, the pressure force excites the vibration
and the force damps the vibration in both the inline and the cross-flow directions. Negative valuesof Cv
Lv and CvDv are plotted in Fig. 19 for the convenience of comparison. Disconnections in the
excitation force coefficients are observed at the upper boundaries of the initial branches for α = 0.5and 1 (Vr = 5.4 for α = 0.5 and Vr = 5.8 and 9 for α = 1). For α = 0, the small jump of the meanforce coefficients at the upper boundary of the initial branch (Vr increases from 3.8 to 4) can also beseen in Fig. 19(a). Although the mean total force coefficient that are in phase with the velocity ofthe cylinder is zero, the magnitudes of the excitation pressure and viscous force coefficients in thelock-in regimes are significantly greater than their counterparts outside the lock-in regimes. This isthe reason for the increase of the vibration amplitude in the lock-in regime.
The variations of the effective added mass coefficients in the x- and y-directions are presentedin Fig. 20. As in the 1-dof VIV, the added mass coefficients generally decrease with the increasing
This article is copyrighted as indicated in the article. Reuse of AIP content is subject to the terms at: http://scitation.aip.org/termsconditions. Downloaded to IP:
130.95.223.58 On: Mon, 16 Nov 2015 05:46:13
073602-23 Zhao, Cheng, and Lu Phys. Fluids 26, 073602 (2014)
FIG. 22. Contours of the vorticity for the 2-dof VIV under the increasing velocity condition at α = 1 and Vr = 6.4.
reduced velocity except in the second initial branch for α = 1. Disconnection occurs at the boundariesof the response branches. If a response is sinusoidal, the effective added mass coefficients is relatedto the response frequency as f/ fn = √
m∗/(m∗ + Cm), where f and Cm stands for the vibrationfrequency and the added mass coefficient in either the x- or the y-direction. Based on the XY-trajectories in the shape of “8”, the vibration frequency in the x-direction is twice that in they-direction for α = 0. Because of this, the effective mass coefficient in the x-direction is smaller thanthat in the y-direction for α = 0. The one-loop XY-trajectories for α = 0.5 and 1 indicate that thefundamental vibration frequencies in the x- and the y-directions are the same. However, the slightdifference between the added mass coefficients in the x- and the y-directions occurs for α = 0.5because the vibration is not exactly sinusoidal, and this difference becomes strong for α = 1. Thecorrelation between the added mass coefficient and the response can be seen by observing Figs. 14,15, and 20. For instance, the lock-in of the response frequency to an almost constant value in therange of 3.4 ≤ Vr ≤ 3.8 corresponds to the constant added mass coefficient in the same range ofreduced velocity. Instead of being constant as the response frequency, the added mass coefficients
This article is copyrighted as indicated in the article. Reuse of AIP content is subject to the terms at: http://scitation.aip.org/termsconditions. Downloaded to IP:
130.95.223.58 On: Mon, 16 Nov 2015 05:46:13
073602-24 Zhao, Cheng, and Lu Phys. Fluids 26, 073602 (2014)
FIG. 23. Contours of the vorticity for the 2-dof VIV under the increasing velocity condition at α = 1 and Vr = 8.6.
in both the x- and the y-directions decrease slowly with the reduced velocity in the initial branch3.2 ≤ Vr ≤ 5.4 for α = 0.5 and the first initial branch (3 ≤ Vr ≤ 5.8) for α = 1, probably because theresponse is not sinusoidal. Bourguet and Jacono23 reported that when a response is not sinusoidal,the effective added mass coefficient has difference from the one predicted by assuming the responseto be sinusoidal. For α = 1, the added mass coefficient in the second initial branch increases withthe increasing reduced velocity, although the response frequency changes little. This is becausethe response is very different from a sinusoidal response as shown in Fig. 19(d). Whenever theeffective added mass coefficient is zero, the response frequency becomes the same as the naturalfrequency.
C. Vortex shedding flow patterns
Figure 21 shows the vorticity contours of the wake for α = 1 and Vr = 5.4, where the re-sponse amplitude is the maximum in the first initial branch under the increasing Vr condition. The
This article is copyrighted as indicated in the article. Reuse of AIP content is subject to the terms at: http://scitation.aip.org/termsconditions. Downloaded to IP:
130.95.223.58 On: Mon, 16 Nov 2015 05:46:13

073602-25 Zhao, Cheng, and Lu Phys. Fluids 26, 073602 (2014)
FIG. 24. Contours of the vorticity for the 2-dof VIV under the increasing velocity condition for α = 0.5 and Vr = 5.4.
instantaneous position of the cylinder on the XY-trajectory is shown in each diagram in Fig. 21.The vortex shedding flow, which is asymmetric due to the rotation of the cylinder, is found to bein the P+S mode, i.e., one pair of vortices and one single vortex are shed from the cylinder inone period of vibration. When the cylinder moves from its lowest position to its highest position,one positive vortex is shed from the bottom side of the cylinder as shown in Fig. 21(b). One negativevortex starts to be shed from the cylinder as the cylinder is at its highest position as shown inFig. 21(c). When the cylinder moves from its highest to its lowest position, a small posi-tive vortex is shed from the cylinder as shown in Fig. 21(d). This small positive vortex dissi-pates out as x/D exceeds 20. Govardhan and Williamson (2000) also found that, in each pairof the vortices in the 2P vortex shedding mode, the second vortex is smaller than the firstone.
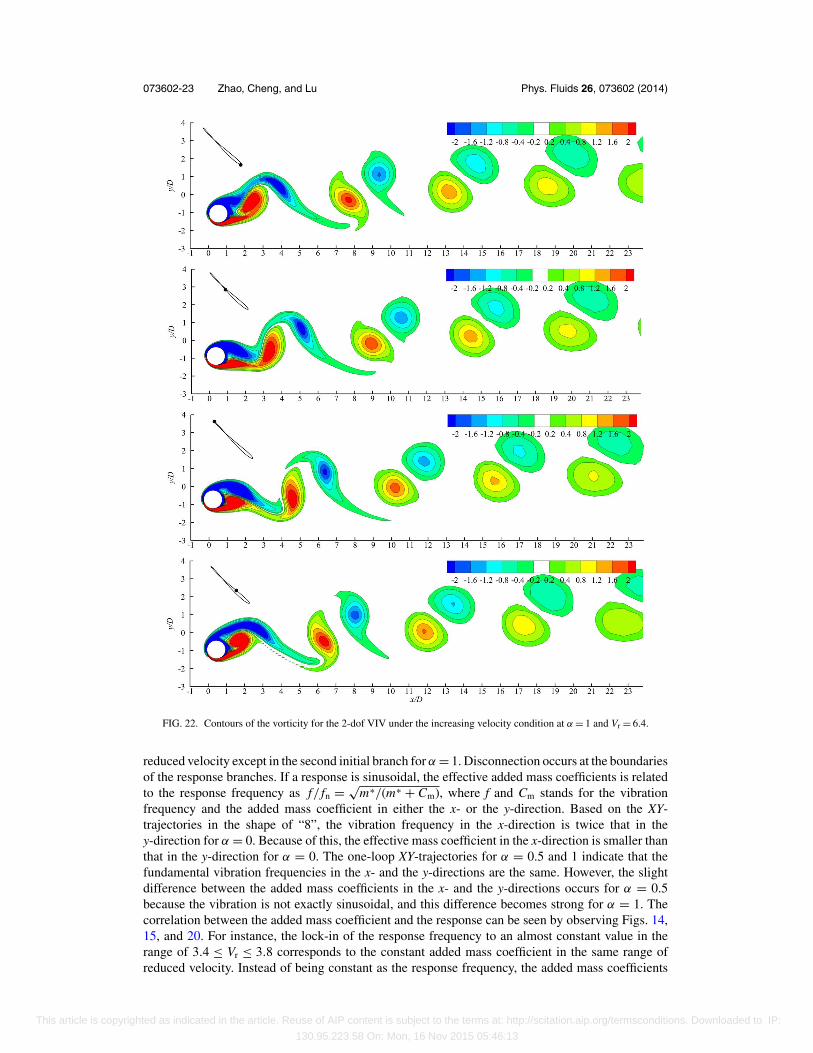
Figure 22 shows the vorticity contours of the wake flow under the increasing velocity condi-tion at α = 1 and Vr = 6.4, which is in the lower branch between the two upper branches. Thevortex shedding is in the 2S mode, i.e., two vortices are shed from the cylinder in one period of
This article is copyrighted as indicated in the article. Reuse of AIP content is subject to the terms at: http://scitation.aip.org/termsconditions. Downloaded to IP:
130.95.223.58 On: Mon, 16 Nov 2015 05:46:13

073602-26 Zhao, Cheng, and Lu Phys. Fluids 26, 073602 (2014)
vibration. Because of the rotation of the cylinder, the vortex street in the wake of the cylinder isaligned above y/D = 0 line. The vortices in the wake of the cylinder are in pairs and are regularlyarranged.
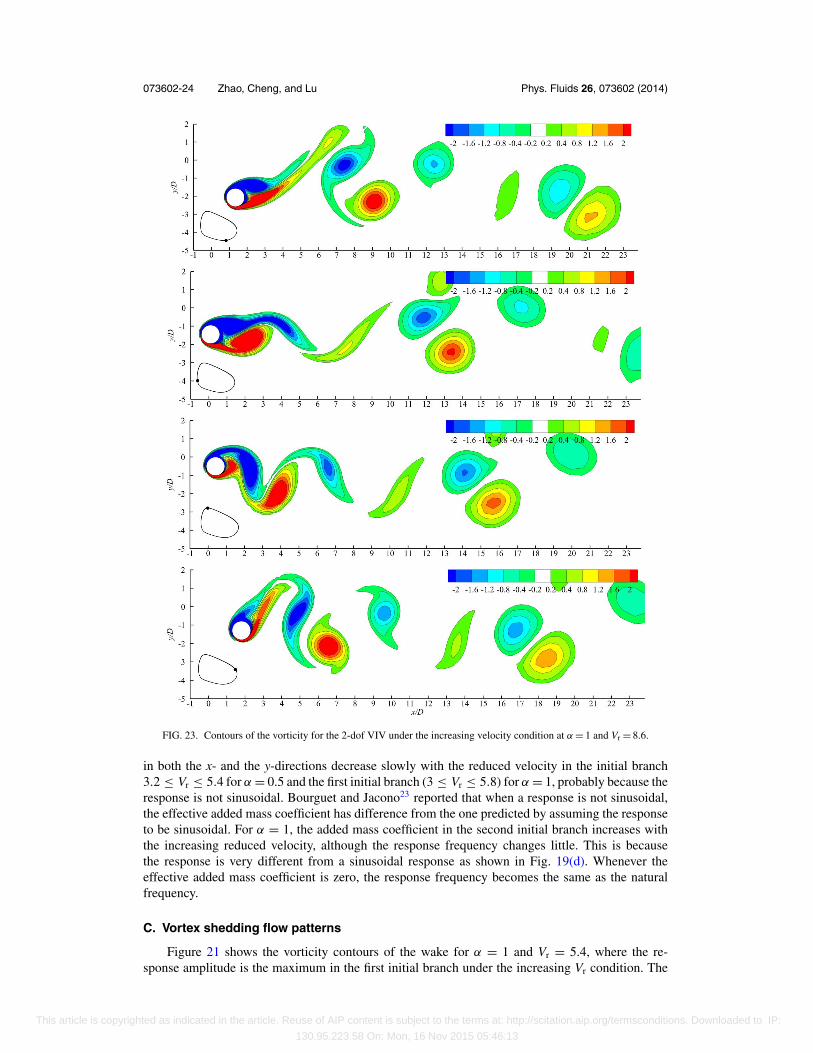
Figure 23 shows the vorticity contours of wake flow under the increasing velocity condition atα = 1 and Vr = 8.6, where the response amplitude is the highest in the second upper branch. Similarto the vortex shedding mode observed in Fig. 21, the vortex shedding mode in Fig. 23 is in the P+Smode. However, the formation of the vortices in the wake of the cylinder is found to be differentfrom that in Fig. 21. The shear layers in Fig. 23 from the top and bottom sides of the cylinderextend further downstream before they form vortices, in contrast to those in Fig. 21. The delay inthe formation of the vortices contributes to the smaller drag and lift coefficients in the second upperbranch than those in the first upper branch. The timing of the vortex shedding in Fig. 23 is not thesame as that in Fig. 21. For example, the small positive vortex is shed from the cylinder when thecylinder is at its lowest position in Fig. 23, while it is shed when the cylinder is moving down inFig. 21.
Figure 24 shows the vorticity contours of the wake flow under the increasing velocity conditionfor α = 0.5 and Vr = 5.4, where the response amplitude is the maximum in the upper branch. Thepattern of the vortex shedding flow in Fig. 24 is very similar to that at α = 1 shown in Fig. 17.However, the small positive vortex that is shed from the cylinder in Fig. 24 is weaker than that inFig. 17. At α = 0, the vortex shedding in the whole lock-in regime becomes 2S mode and the vortexshedding is very similar to that shown in Fig. 22 and is not shown here.
VI. CONCLUSIONS
Vortex-induced vibration of a rotating circular cylinder at a low Reynolds number of 150 and alow mass ratio of 2 is studied numerically. Simulations are conducted for three rotation rates of 0,0.5, and 1 and reduced velocities in the range of 1 to 13 with an interval of 0.2.
For 1-dof VIV, the rotation of the cylinder widens the lock-in regime and also increases theresponse amplitude in the lock-in regime. Apart from the widened lock-in regime and the increasedresponse amplitude, the variations of the response amplitude and the frequency with the reducedvelocity for α = 0, 0.5, and 1 are similar to each other. The mean position of the cylinder in the1-dof VIV is negative and its magnitude increases with α.
For α = 0, the response of the cylinder in the 2-dof VIV is very similar to that in the 1-dof VIVand the response amplitude in the inline direction is significantly smaller than that in the cross-flowdirection. When the rotation rate is increased to 0.5 and 1, the response of the cylinder in the 2-dofVIV is changed significantly. For α = 0.5 and 1, both the drag coefficient and the response amplitudein the inline direction are increased significantly and become comparable with their counterpartsin the cross-flow direction. The response amplitudes in the cross-flow direction for α = 0.5 and 1are also increased significantly compared with that for α = 0. No obvious upper branches in thevariation of the response amplitude with the reduced velocity are observed for α = 0, 0.5, and 1. Forα = 1, two initial branches are observed and the maximum amplitude in the cross-flow direction inthe first initial branch is about 60% higher than that for α = 0. The shape “8” vibration XY-trajectoryin the lock-in regime at α = 0 is changed to the single looped XY-trajectory at α = 0.5 and 1,suggesting that the vibration frequency in the inline direction is the same as that in the cross-flowdirection.
By analysing the force component that are in phase with the velocity of the cylinder, it is foundthat the pressure force excites the vibration and the viscous force damping the vibration in both1-dof and 2-dof VIVs. Because the damping ratio is zero in this study, the time-averaged total forcethat is in phase with the velocity of the cylinder is zero, resulting a zero energy transfer from thefluid to the cylinder.
The vortex shedding in the initial branches for α = 0.5 and 1 are found to be in the P+Smode, with two positive vortices and one negative vortex are shed from the cylinder in one period ofvibration. In the lower branch and outside the lock-in regime, the vortex shedding is in the 2S mode.The vortex shedding in the 1-dof VIV for α = 0, 0.5, and 1 and that in the 2-dof VIV for α = 0 isalways in the 2S mode, regardless inside or outside the lock-in regime.
This article is copyrighted as indicated in the article. Reuse of AIP content is subject to the terms at: http://scitation.aip.org/termsconditions. Downloaded to IP:
130.95.223.58 On: Mon, 16 Nov 2015 05:46:13
073602-27 Zhao, Cheng, and Lu Phys. Fluids 26, 073602 (2014)
ACKNOWLEDGMENTS
The authors would like to acknowledge the support from the Australia Research Council throughARC Discovery Projects Program (Grant No. DP110105171). The calculations were carried out onthe Computational Facilities of Intersect Ltd. in NSW, Australia.
1 C. H. K. Williamson, “Vortex dynamics in the cylinder wake,” Annu. Rev. Fluid Mech. 28, 477–539 (1996).2 D. Barkley and R. D. Henderson, “Three-dimensional Floquet stability analysis of the wake of a circular cylinder,” J. Fluid
Mech. 322, 215–241 (1996).3 G. D. Miller and C. H. K. Williamson, “Control of three-dimensional phase dynamics in a cylinder wake,” Exp. Fluids 18,
26–35 (1994).4 D. J. Tritton, “Experiments on the flow past a circular cylinder at low Reynolds numbers,” J. Fluid Mech. 6, 547–567
(1959).5 C. H. K. Williamson, “The existence of two stages in the transition to three-dimensionality of a cylinder wake,” Phys.
Fluids 31, 3165–3168 (1988).6 H. Zhang, U. Fey, B. R. Noack, M. Konig, and H. Eckelmann, “On the transition of the cylinder wake,” Phys. Fluids 7(4),
779–794 (1995).7 C. H. K. Williamson, “Three-dimensional wake transition,” J. Fluid Mech. 328, 345–407 (1995).8 A. Prasad and C. H. K. Williamson, “Three-dimensional effect in turbulent bluff-body wakes,” J. Fluid Mech. 343, 235–265
(1997).9 M. Zhao, J. Thapa, L. Cheng, and T. Zhou, “Three-dimensional transition of vortex shedding flow around a circular cylinder
at right and oblique attacks,” Phys. Fluids 25, 014105 (2013b).10 F. Diaz, J. Gavalda, J. G. Kawall, J. F. Keller, and F. Giralt, “Vortex shedding from a spinning cylinder,” Phys. Fluids 26,
3454–3460 (1983).11 H. M. Badr, M. Coutanceau, S. C. R. Dennis, and C. Menard, “Unsteady flow past a rotating circular cylinder at Reynolds
numbers 103 and 104,” J. Fluids Mech. 220, 459–484 (1990).12 C. C. Chang and R. L. Chern, “Vortex shedding from an impulsively started rotating and translating circular cylinder,” J.
Fluid Mech. 233, 265–298 (1991).13 Y. T. Chew, M. Cheng, and S. C. Luo, “A numerical study of flow past a rotating circular cylinder using a hybrid vortex
scheme,” J. Fluid Mech. 299, 35–71 (1995).14 M. H. Chou, “Numerical study of vortex shedding from a rotating cylinder immersed in a uniform flow field,” Int. J. Numer.
Methods Fluids 32, 545–567 (2000).15 H. M. Badr, S. C. R. Dennis, and P. J. S. Young, “Steady and unsteady flow past a rotating circular cylinder at low Reynolds
numbers,” Comput. Fluids 17(4), 579–609 (1989).16 T. Tang and D. B. Ingham, “On steady flow past a rotating circular cylinder at Reynolds numbers 60 and 100,” Comput.
Fluids 19(2), 217–230 (1991).17 S. Kang, H. Choi, and S. Lee, “Laminar flow past a rotating circular cylinder,” Phys. Fluids 11, 3312–3321 (1999).18 S. J. Karabelas, “Large eddy simulation of high-Reynolds number flow past a rotating cylinder,” Int. J. Heat Fluid Flow
31, 518–527 (2010).19 D. Stojkovic, M. Breuer, and F. Durst, “Effect of high rotation rates on the laminar flow around a circular cylinder,” Phys.
Fluids 14, 3160–3178 (2002).20 J. Pralits, L. Brandt, and F. Giannetti, “Instability and sensitivity of the flow around a rotating circular cylinder,” J. Fluid
Mech. 650, 513–536 (2010).21 S. Mittal and B. Kumar, “Flow past a rotating cylinder,” J. Fluid Mech. 476, 303–334 (2003).22 L. Lu, J. M. Qin, B. Teng, and Y. C. Li, “Numerical investigations of lift suppression by feedback rotary oscillation of
circular cylinder at low Reynolds number,” Phys. Fluids 23, 033601 (2011).23 R. Bourguet and D. L. Jacono, “Flow-induced vibrations of a rotating cylinder,” J. Fluid Mech. 740, 342–380 (2014).24 T. Sarpkaya, “Vortex-induced oscillations: A selective review,” J. Appl. Mech. 46, 241–258 (1979).25 J. M. Dahl, F. S. Hover, M. S. Triantafyllou, and O. H. Oakley, “Dual resonance in vortex-induced vibrations at subcritical
and supercritical Reynolds numbers,” J. Fluid Mech. 643, 395–424 (2010).26 K. Vikestad, J. K. V. Andiver, and C. M. Larsen, “Added mass and oscillation frequency for a circular cylinder subjected
to vortex-induced vibrations and external disturbance,” J. Fluids Struct. 14, 1071–1088 (2000).27 K. M. Lam, “Vortex shedding flow behind a slowly rotating circular cylinder,” J. Fluids Struct. 25, 245–262 (2009).28 S. Mittal, “Three-dimensional instabilities in flow past a rotating cylinder,” J. Appl. Mech. 71, 89–95 (2004).29 R. E. L. Akoury, M. Braza, R. Perrin, G. Harran, and Y. Hoarau, “The three-dimensional transition in the flow around a
rotating cylinder,” J. Fluid Mech. 607, 1–11 (2008).30 A. Rao, J. Leontini, M. C. Thompson, and K. Hourigan, “Three-dimensionality in the wake of a rotating cylinder in a
uniform flow,” J. Fluid Mech. 717, 1–29 (2013).31 P. W. Bearman, “Vortex shedding from oscillating bluff_bodies,” Annu. Rev. Fluid Mech. 16, 195–222 (1984).32 A. Okajima, “Brief review: Numerical analysis of the flow around vibrating cylinders,” J. Wind Eng. Indus. Aerodyn. 46
and 47, 881–884 (1993).33 B. M. Sumer and J. Fredsøe, Hydrodynamics Around Cylindrical Structures (World Scientific, 1997).34 T. Sarpkaya, “A critical review of the intrinsic nature of vortex-induced vibrations,” J. Fluids Struct. 19(4), 389–447
(2004).35 C. H. K. Williamson and R. Govardhan, “Vortex-induced vibrations,” Annu. Rev. Fluid Mech. 36, 413–455 (2004).36 C. H. K. Williamson and R. Govardhan, “A brief review of recent results in vortex-induced vibrations,” J. Wind Eng. Indus.
Aerodyn. 96, 713–735 (2008).
This article is copyrighted as indicated in the article. Reuse of AIP content is subject to the terms at: http://scitation.aip.org/termsconditions. Downloaded to IP:
130.95.223.58 On: Mon, 16 Nov 2015 05:46:13
073602-28 Zhao, Cheng, and Lu Phys. Fluids 26, 073602 (2014)
37 C. H. K. Williamson and A. Roshko, “Vortex formation in the wake of an oscillating cylinder,” J. Fluids Struct. 2, 355–381(1988).
38 A. Khalak and C. H. K. Williamson, “Dynamics of a hydroelastic cylinder with very low mass and damping,” J. FluidsStruct. 10, 455–472 (1996).
39 A. Khalak and C. H. K. Williamson, “Motions, force and mode transitions in vortex-induced vibrations at low mass-damping,” J. Fluids Struct. 13, 813–851 (1999).
40 N. Jauvtis and C. H. K. Williamson, “The effect of two degrees of freedom on vortex-induced vibration at low mass anddamping,” J. Fluid Mech. 509, 23–62 (2004).
41 R. Govardhan and C. H. K. Williamson, “Modes of vortex formation and frequency response of a freely vibrating cylinder,”J. Fluid Mech. 420, 85–130 (2000).
42 S. P. Singh and S. Mittal, “Vortex-induced oscillations at low Reynolds numbers: Hysteresis and vortex-shedding modes,”J. Fluids Struct. 20, 1085–1104 (2005).
43 M. Zhao, L. Cheng, and T. Zhou, “Numerical simulation of vortex-induced vibration of a square cylinder at a low Reynoldsnumber,” Phys. Fluids 25, 023603 (2013).
44 C. C. Feng, “The measurements of vortex-induced effects on flow past a stationary and oscillation and galloping,” M.S.thesis (University BC, Vancouver, Canada, 1968).
45 M. Zhao, “Flow induced vibration of two rigidly coupled circular cylinders in tandem and side-by-side arrangements at alow Reynolds number of 150,” Phys. Fluids 25, 123601 (2013).
46 M. Zhao and G. Yan, “Numerical simulation of vortex-induced vibration of two circular cylinders of different diameters atlow Reynolds number,” Phys. Fluids 25, 083601 (2013).
47 M. Zhao, F. Tong, and L. Cheng, “Numerical simulation of two-degree-of-freedom vortex-induced vibration of a circularcylinder between two lateral plane walls in steady currents,” J. Fluids Eng. 134, 104501 (2012).
48 T. K. Prasanth, S. Behara, S. P. Singh, R. Kumar, and S. Mittal, “Effect of blockage on vortex-induced vibrations at lowReynolds numbers,” J. Fluids Struct. 22, 865–876 (2006).
49 M. Coutanceau and C. Menard, “Influence of rotation on the near wake development behind an impulsively started circularcylinder,” J. Fluid Mech. 158, 399–466 (1985).
50 J. C. Padrino and D. D. Joseph, “Numerical study of the steady-state uniform flow past a rotating cylinder,” J. Fluid Mech.557, 191–223 (2006).
51 D. Stojkovic, P. Schon, M. Breuer, and F. Durst, “On the new vortex shedding mode past a rotating circular cylinder,”Phys. Fluids 15, 1257–1260 (2003).
52 Y. Bao, D. Zhou, and J. Tu, “Flow interference between a stationary cylinder and an elastically mounted cylinder arrangedin proximity,” J. Fluids Struct. 27, 1425–1446 (2011).
53 I. Borazjani and F. Sotiropoulos, “Vortex-induced vibrations of two cylinders in tandem arrangement in the proximity-wakeinterference region,” J. Fluid Mech. 621, 321–364 (2009).
54 J. S. Leontini, M. C. Thompson, and K. Hourigan, “The beginning of branching behaviour of vortex-inducedvibrationduring two-dimensional flow,” J. Fluids Struct. 22, 857–864 (2006).
55 S. Mittal and V. Kumar, “Finite element study of vortex-induced cross-flow and in-line oscillations of a circular cylinderat low Reynolds numbers,” Int. J. Numer. Methods Fluids 31, 1087–1120 (1999).
56 I. Ghazanfarian and M. R. H. Nobari, “A numerical study of convective heat transfer from a rotating cylinder with cross-flowoscillation,” Int. J. Heat Mass Transfer 52, 5402–5411 (2009).
57 T. L. Morese and C. H. K. Williamson, “Prediction of vortex-induced vibration response by employing controlled motion,”J. Fluid Mech. 634, 5–39 (2009).
58 A. Sanchis, G. Sælevik, and J. Grue, “Two-degree-of-freedom vortex-induced vibrations of a spring-mounted rigid cylinderwith low mass ratio,” J. Fluids Struct. 24, 907–919 (2008).
59 C. Ji, Z. Xiao, Y. Wang, and H. Wang, “Numerical investigation on vortex-induced vibration of an elastically mountedcircular cylinder at low Reynolds number using the fictitious domain method,” Int. J. Comput. Fluid Dyn. 25(4), 207–221(2011).
60 P. Anagnostopoulos and P. W. Bearman, “Response characteristics of a vortex-excited cylinder at low Reynolds numbers,”J. Fluids Struct. 6, 39–50 (1992).
This article is copyrighted as indicated in the article. Reuse of AIP content is subject to the terms at: http://scitation.aip.org/termsconditions. Downloaded to IP:
130.95.223.58 On: Mon, 16 Nov 2015 05:46:13