Embed Size (px)
DESCRIPTION
JNRD is an open access journal with monthly publication. JNRD aims to be a source of knowledge for transdisciplinary professionals in the area of the Natural Resources. http://jnrd.info/
Citation preview

INTEGRATED WATER RESOURCES MANAGEMENT
LAND USE DYNAMICS AND BIODIVERSITY
ENERGY EFFICIENCY AND RENEWABLE RESOURCES
REGIONAL MANAGEMENT AND SUSTAINABLE LIVELIHOOD OF THE POOR
ISSN 0719 - 2452
VOLUME 2 - 2012
DOI: 10.5027/jnrd.v2i0.01 - DOI: 10.5027/jnrd.v2i0.07
In situ conservation and landscape genetics in forest species 1
Authors: Martín M.A, Herrera M.A, Martín L.M. DOI: 10.5027/jnrd.v2i0.01
Environmental impact assessment of land use systems using emergy in Teresópolis-Brazil 6
Authors: Juan Carlos Torrico Albino, Marc JanssensDOI: 10.5027/jnrd.v2i0.02
Monitoring for the Presence of Parasitic Protozoa and Free-living Amoebae in Drinking Water Plants 15
Authors: Amany Saad AmerDOI: 10.5027/jnrd.v2i0.03
Sustainabilty- cliché in Conservation Circles 22
Authors: Dheeraj KaulDOI: 10.5027/jnrd.v2i0.04
Response on Sustainabilty- cliche in conservation circles 23
Authors: Hartmut GaeseDOI: 10.5027/jnrd.v2i0.05
Saline water pollution in groundwater: issues and its control 25
Author: Setyawan Purnama, Muh Aris MarfaiDOI: 10.5027/jnrd.v2i0.06
Energy options from the 20th century: comparing conventional and nuclear energy from a sustainable standpoint 33
Author: Eric Ndeh Mboumien NgangDOI: 10.5027/jnrd.v2i0.07
Journal of Natural Resources and Development 2012; 02: 1 - 41Volume II
Contents
JOURNAL OF NATURAL RESOURCES AND DEVELOPMENT
In situ conservation and landscape genetics in forest speciesMartín M A * a , Herrera M A b, Martín L M a
a Departamento de Genética, Escuela Técnica Superior de Ingeniería Agronómica y de Montes, Edificio Gregor Mendel, Universidad de Córdoba Campus de Excelencia Internacional Agroalimentario, Córdoba, Spain.
b Departamento de Ingeniería Forestal, Escuela Técnica Superior de Ingeniería Agronómica y de Montes, Edificio Leonardo Da Vinci, Universidad
de Córdoba Campus de Excelencia Internacional Agroalimentario , Córdoba, Spain.
* Corresponding author : [email protected]
Article history Abstract
Received 06.10.2011Accepted 23.12.2011Published 08.03.2012
Conservation of forest genetic resources is essential for sustaining the environmental and productive values of forests. One of the environmental values is the conservation of the diversity that is assessed through the amount of genetic diversity stored by forests, their structure and dynamics. The current need for forest conservation and management has driven a rapid expansion of landscape genetics discipline that combines tools from molecular genetics, landscape ecology and spatial statistics and is decisive for improving not only ecological knowledge but also for properly managing population genetic resources. The objective of this study is to show the way to establish the safeguard of genetic diversity through this approach using the results obtained in sweet chestnut (Castanea sativa Mill.) that has provided a better understanding on the species genetic resources. In this respect, we will show how the information provided by different types of molecular markers (genomic and genic) offer more accurate indication on the distribution of the genetic diversity among and within populations assuming different evolutionary drivers.
Keywords
Genetic resourcesLandscape geneticsSweet chestnut
Why to conserve plant genetic resources?
The approval of the Convention on Biological Diversity (CBD 1992) and the International Treaty on Plant Genetic Resources for Food and Agriculture (FAO 2001) constitute a response to the environmental degradation that is the direct results of human pressure on the ecosystem. Accordingly, it is necessary an integral system of conservation and sustainable use of the genetic resources that includes economical, social, political and ethical aspects. Forest systems provide food, as well as a large number of non-food goods and services and shape, in great part, a landscape in which human footprint is enhanced. These types of services, which have intangible value, are “externalities”. In this study we will try to
show how the discipline of landscape genetics can contribute to safeguarding the forest genetic resources. Biodiversity is defined as the variation of all living organisms at different levels: ecosystems, species and genetic diversity (Wilson 1988). In this context, genetic diversity is defined as the basis of all biodiversity and is widely considered as the main requirement for the long-term survival of species on an evolutionary time scale (Booy et al. 2000; Namkoong 2001). Conservation of such variability has become a renewed focus under the expectation that its loss could render populations and species less able to adapt to ongoing environmental changes (Mace et al. 2003; Jump and Peñuelas 2005). On the other
Journal of Natural Resources and Development 2012; 02: 01-05 01
Different approaches to evaluate genetic diversity
02Journal of Natural Resources and Development 2012; 02: 01-05
hand, sustainability is defined as the use of natural resources without risking their exploitation by future generations (World Commission on Environment and Development 1987). For all these reasons, forest management can only be considerate as sustainable if it includes a suitable system of plant genetic resources conservation. Conservation of forest genetic resources is, therefore, essential for sustaining the productive values of forests, maintaining the vitality of forest ecosystems and, thereby, for maintaining their environmental roles (Young et al. 2000). However, one of the greatest threat to forests and the diversity housed in them is the increasing pressure to which these forests are exposed from human management (Poffenberg 1996; Palmerg-Lerche 1999). Although it is inevitable that land use changes will influence forests structure, such changes should be planned to help ensure conservation as a major component in land use planning and management strategies. Currently, different degrees of management can be found in forest trees, from natural forests without intervention (for example Araucaria araucana (Mol.) K. Koch, Nothofagus sp., Abies pinsapo Boiss. and Taxus bacatta L.) to highly altered systems (Olea europaea L., Quercus sp., Juglans reggia L. and Castanea sativa Mill.). This means that strategies to preserve these gene pools have to be adapted to each particular case.Furthermore, problems related to the conservation and use of these genetic resources are especially complex, not only because genes must be retained, but also because we have to maintain genotypes (set of co-adapted genes that are the result of natural and artificial selection) and evolutionary processes that have led to this diversity (Namkoong and Ouédrago 1997).
The CBD and the Treaty have led to initiatives, at different levels, that seek to translate its principles into actions considering national and regional realities. In Spain in 2006, the Spanish Strategy for the Conservation and Sustainable Use of Forest Genetic Resources was presented (MIMAM 2006). This Strategy is currently being developed through several national plans. In addition, in 2010, the Ministry of Science and Innovation established the ten most important research topics in which Spain must be leader in 2020, being the genetic resources one of them.In most forests with high environmental values, there is a better understanding of their specific composition and the ecosystems in which they are related rather than the degree of genetic diversity of species they contain (Young et al. 2000). The knowledge of such diversity is particularly relevant in the case of woody species, which have been named “ecosystem engineers” (Wright and Jones 2006; Shackak et al. 2008). The concept of landscape ecology was developed at the end of the 1930s. The objective of this approach is to have an advanced comprehension of ecological processes and landscape function (Farina 2000). Landscape ecology emphasizes the ecological effects of the spatial and temporal patterning of ecosystems (Turner 1989, 2005). Currently there is growing interest in combining the tools of molecular genetics with the principles of ecological biogeography and landscape ecology (Manel et al. 2003; Latta 2006). Evolutionary processes are
influenced by environmental variation over space and time, including genetic divergence among populations, speciation and evolutionary change in morphology, physiology and behaviour (Kozak et al. 2008). Studies on genetic structure in natural populations, including within and among population genetic diversity and genetic differentiation, have been a major topic in evolutionary ecology and genetics (Patausso 2009). In this respect, in the international literature there is a new and integrating approach in the study and management of natural resources: landscape genetics (Manel et al. 2003; Holderegger and Wagner 2008). This approach integrates the tools provided by molecular genetics and ecology with the new statistical tools such as geostatistics, maximum likelihood and Bayesian approaches (Wulder et al. 2004; Storz 2005). The aim is to provide information about the interaction between landscape features and evolutionary processes, such as gene flow, genetic drift and natural selection (Manel et al. 2003; Latta 2006; Storfer et al. 2007). Furthermore, it enables the spatial mapping of allele frequencies from one ore more species (or populations) and subsequently the correlation of such patterns with the current landscape (Storfer et al. 2007; 2010). In this respect, landscape environmental features (elevation, slope, etc.) can influence genetic structuring of populations at a regional level because they can affect gene flow and exert selection pressure (Gomez et al. 2005). Currently, a step forward in this discipline is the new field of landscape genetics of adaptive genetic variation that establishes the relationship between adaptive genomic regions and environmental factors, being prominent in plant studies (Holderegger et al. 2010). An example that Landscape Genetics is a rapidly evolving field is the fact that in January 2012, the paper that first coined this term (Manel et al. 2003) has 520 citations according to Thomson Reuters web of science. In the same way, there has been an impressive increase in the number of publications on this subject in the last years: 6 in 2000, 40 in 2005 and 181 in 2011. This demontrates that this is a disciplicine with an important scientific impact. These early research models have focused across all ecosystems (terrestrial, riverscape, seascape) and plant studies comprises 14.5% of the current studies (Storfer et al. 2010). In forest trees, several studies on habitat fragmentation, connectivity or barriers to gene movement and human impact have been carried out to understand how landscape affects the genetic structure of species (Petit et al. 2002, Oddou-Muratorio et al. 2004, Sork and Smouse 2006; Miller et al. 2006; Tollefsrud et al. 2009; Bagnoli et al. 2009), showing accurate information on the status of species genetic resources in a given area, and thus its contribution to the conservation of its diversity. Furthermore, another important advantage is that analysis can be performed at individual level and populations are not necessary to be predefined. The advantage of using individuals as the operational unit are to avoid potential bias in identifying populations in advance and to conduct studies at finer scale (Manel et al. 2003). This is noteworthy, given that, until now, genetic analyses of natural populations have relied on procedures based on the concept that distinct populations of a species exist across a landscape (Miller et al. 2002). In this context, the characterisation and quantification of both genetic diversity and the mechanisms that influence it require the use of molecular markers that provide a tool for forest genetic conservation (Moritz 1994).
03Journal of Natural Resources and Development 2012; 02: 01-05
In recent years, microsatellite markers (SSRs) have become the most used markers for studying forest genetics, because they are highly polymorphic, codominant and widespread across the genome (Glaubitz and Moran 2000). From the evolutionary point of view, they are interesting because are present in all species genomes, although distributed in low frequency in coding regions (Tautz and Renz 1984; Powell et al. 1996). These markers are neutral and have proven very useful in studies of genetic diversity, however, are not suitable for estimating adaptive genetic diversity.Recently, the increased availability of DNA sequences has permitted the development of EST-based SSR markers. ESTs (expressed sequence tag) are expressed in different physiologic conditions of plants. It has been stated that the generation of SSRs from EST is relatively easy and inexpensive because they are sub-products of sequence data from genes or EST that are publicly available. Their main advantages compared with genomic SSRs are that they are quick to obtain and are present in expressed regions of the genome, showing the potential of having known functions (Varshney et al. 2005). Other characteristic is they are more than three times as transferable across species as compared with anonymous SSRs (Peakall et al. 1998; Varshney et al. 2005). Studies based on gene expression hold great potential for shedding light on complex ecological phenomena such as phenotypic plasticity. Such studies can be used to identify candidate genes and to provide a genome wide means of studying the genetic basis of the mechanisms by which organisms respond to environmental changes (Grivet et al. 2008).Although these techniques can give an adequate view of the situation of the genetic resources in a particular species, the next step to design a strategy for its conservation and sustainable use implies to undertaking other studies focused on the productive organization that is technical and socioeconomic factors. Within the technical aspects to consider are: the forest yield potential (timber and other goods), the products quality, the management practises and the possibility of classifying the product. In the socioeconomic the organization of the sector and the human communities involved in its management should be analysed.
Sweet chestnut (Castanea sativa Miller), the only species of the genus Castanea in Europe, is one of the multipurpose species of most economic importance in the Mediterranean region. This species has characteristics of interest, not only for fruit and timber but also for its contribution to the landscape and environment, that make it a good model of integration between natural and man driven distribution of biodiversity under changing environmental.Over many centuries man has influenced the European chestnut populations through propagation and management, leading to a population structure far from one expected in a purely natural situation. For these reasons, chestnut genetic structure is complex (Grossman and Romane 2004). Several situations can be distinguished: a) High forest. They are chestnut populations that come from
seeds (saplings) and each tree has a different genotype. Currently, these stands are dedicated to timber production or simply have an environmental value. Furthermore, in recent times, great attention is paid to trees that stand out from the surrounding vegetation because of their age, size, ecological role and other peculiarities. In general, there is a new acceptance of the importance of ancient woods founded on the recognition of their richness in term of genetic diversity, cultural heritage and historical features (Fay 2002). These trees can reach important diameters, considering as “monumental” those larger than 7 meters in girth at a mean height of 1.30 meters (d.b.h) (Krebs et al. 2005). In this respect, chestnut is a tree of remarkable development and exceptional longevity, and there are examples of chestnut notable for its antiquity and monumentality as “Cento Cavalli” from Sicilia (Italia) and “Castaño Viejo” from San Román de Sanabria or “Castaño Santo” from Istán (Spain).b) Coppice. They are chestnuts for timber production. In this case, trees come from seeds but regenerate by stump (coppice shoots). In ancient formations, each of these stumps leads to a different set of feet, arranged in circular form. In any case, the resulting formation has a single genotype. c) Orchards. They are chestnut dedicated to fruit production. Due to the difficulties of the species vegetative reproduction, the clonal varieties are grafted onto seedling rootstocks coming from seeds. In this case, the genetic structure of rootstocks is different to the grafted varieties. Thus, what is expected for rootstocks is that each tree has its own genotype and the grafted part is instead a mixture of clones. The reproduction systems followed in these traditional plantations mean that new rootstocks are the result of the germination of different chestnut varieties (Martín et al. 2009), in which, given the species self-incompatibility (McKay 1942), pollen is from exogenous origin. The fact that fruit production occurs in places with high environmental value and traditional systems, leads to multiple traditional varieties obtained by farmers themselves, a system which tends to maintain a high degree of genetic diversity (Martín et al. 2009, 2010a; Pereira-Lorenzo et al. 2010). Given these considerations, the improvement in the knowledge of the distribution of the species genetic variability, and its integration in landscape will be a support for management systems that ensure its sustainability, according to the objectives of the strategy described before.During the last years the consequences of global warming on the shifts in plants phenology, namely in the anticipation of budburst and blooming dates, has been widely discussed (Walther et al. 2002; Jump and Peñuelas 2005). In this respect, the identification of specific loci that underlie divergently selected traits should allow us to address fundamental questions about the genetic basis of population’s adaptability to different environmental conditions (Storz 2005). In chestnut, studies aimed at evaluating traits of adaptive significance related to climate change such as water use efficiency, bud burst, bud set and growth, etc., showed a strong population effect for most characters evaluated, indicating differences in adaptation among populations and across the distribution range of the species (Lauteri et al. 1998; Pliura and Erikson 2002; Fernández-López et al. 2005). Furthermore, a study of nine European chestnut populations from areas of contrasting climatic conditions in the
Sweet chestnut: a case of study
Tools to evaluate genetic diversity
04Journal of Natural Resources and Development 2012; 02: 01-05
Mediterranean basin, using genomic and genic microsatellite markers, confirmed that combining genomic SSRs and EST-SSRs is a useful tool to give complementary information to explain the genetic and adaptive diversity in chestnut. In this respect, the analysis revealed different clustering pattern between populations, being the grouping according to geographic distances in the case of genomic SSRs and two differentiated groups based on the northern-southern distribution of the populations for genic markers (Martin et al. 2010b). In this later, loci under selection were identified, probably associated with genes controlling phenological traits related to local adaptation at bud burst. The northern populations flushed and formed winter buds later, and grew more than the southern populations, while early flushing could be advantageous for the development of plants before summer drought. Landscape genetics approach was applied to sixteen populations (high forest), covering the distribution range of the species in Spain, using microsatellite markers. Results revealed a high level of genetic diversity, which in part followed a geographical pattern, but also areas particularly rich in diversity were detected. These results permitted proposing a hypothesis regarding the pattern of genetic structure of the species in Spain, suggesting the influence of both historical climate changes and human activity (Martín et al. in press). Data confirmed the existence of a possible refugium area located in northwest, as described by other authors (Krebs et al. 2004; Fineschi et al. 2000; Mattioni et al. 2008), but also detected a second possible refugium in northeastern Spain. Conversely, the genetic structure of southern populations was the result of man management, given the extensive movement of chestnut genetic material across Europe in the past, and the influence of Romans in the Mediterranean basin (Columela 1979; Adua 1999; Conedera et al. 2004).This type of studies could provide valuable baseline data that should allow more in-depth studies of landscape genetics associated with other species that can contribute to their conservation and management.
This research was supported by grants AGL2009-07931 and AGL2010-15147 from the Spanish Ministry of Science and Innovation and the European Regional Development Fund (FEDER) from the European Union. The first author is grateful to the «Agrifood Campus of International Excellence (ceiA3)» from the Spanish Ministry of Education and the Ministry of Science and Innovation for the financial support.
Adua M., 1999. The sweet chestnut throughout history from the Miocene to the third
millennium. Acta Hort. 494, 29-36.
Bagnoli F., Vendramin G.G., Buonamici A., Doulis A., Gonzalez-Martinez S., La Porta N.
Magri D., Raddi P., Sebastiani F., Fineschi S., 2009. Is Cupressus sempervirens native
in Italy? An answer from genetic and palaeobotanical data. Mol. Ecol 18, 2276-2286.
Berrocal del Brío M., Gallardo-Lancho J.F., Cardeñoso-Herrero J.M., 1998. El castaño.
Productor de Fruto y Madera. Creador de Paisaje y Protector. Mundi-Prensa. Madrid.
Booy G., Hendricks R.J.J., Smulders M.J.M., van Groenendael J.M., Vosman B., 2000.
Genetic diversity and the survival of populations. Plant Biol. 2, 379-395.
CBD (Convention on Biological Diversity), 1992. Río de Janeiro. http: //www.biodiv.org/
doc/legal/cbd.
Columela L.J.M. 1979. De Res Rustica. Siglo I d.C. Los doce libros de Agricultura. Editorial
Iberia. Barcelona, Spain
FAO, 2001. International Treaty for Plant Genetic Resources for Food and Agriculture.
Rome, Italy: Food and Agriculture Organization. ftp://ext-ftp. fao. org/ ag/ cgrfa/
it/ ITPGRe.pdf.
Farina A., 2000. Principles and Methods in Landscape Ecology. Kluwer Academic Press.
236 pp.
Fay N., 2002. Environmental arboricultura, tree ecology and veteran tree management.
Arboricultural J. 26, 213-238.
Fernández-López J., Zas R., Díaz R., Aravanopoulos F.A., Alizoti P.G., Botta R., Mellano
M.G., Villani F., Cherubini M., Eriksson G., 2005. Geographic variability among
extreme European wild chestnut populations. Acta Hort. 693, 181-186
Fineschi S., Taurchini D., Villani F., Vendarmin G.G., 2000. Chlororplast DNA polymorphism
reveals little geograpgical structure in Castanea sativa Mill. (Fagaceae) throughout
southern European countries. Mol. Ecol. 9, 1495-1503.
Glaubitz J.C., Moran G.F., 2000. Genetic Tools: The use of Biochemical and Molecular
Markers, in: Young A., Boshier D., Boyle T. (Eds)., Forest Conservation Genetics. CSIRO
Publishing, Australia, pp. 39-52.
Gomez A., Vendramin G.G., Gonzalez-Martinez S., Alia R., 2005. Genetic diversity and
differentiation of two Mediterranean pines (Pinus halepensis Mill. and Pinus pinaster
Ait.) along a latitudinal cline using chloroplast microsatellite markers. Drivers Dist.
11, 257-263.
Grivet D., Sork V.L., Westfall R.D., Daviss F.W., 2008. Conserving the evolutionary potential
of California valley oak (Quercus lobata Née): a multivariate genetic approach to
conserving planning. Mol. Ecol. 17, 139-156.
Holderegger R., Wagner H.H., 2008. Landscape Genetics. BioScience 58,199-207.
Holderegger R., Buehler D., Gugerli F., Manel S., 2010. Landscape genetics of plants.
Trends Plant Sci. 15, 675-682.
Jump A.S., Peñuelas J., 2005. Running to stand still: adaptation and the response of plants
to rapid climate change. Ecol. Letter 8, 1010-1020.
Kozak K.H., Graham C.H., Wiens J.J., 2008. Integrating GIS-based environmental data into
evolutionary biology. Trends Ecol. Evol. 23, 141-148.
Krebs P., Conedera M., Pradella M., Torriani D., Felber M., Tinner W., 2004. Quaternary
refugia of the sweet chestnut (Castanea sativa Miller): an extended palynological
approach. Veg. Hist. Archaebot. 13, 145-160.
Krebs P., Conedera M., Fonti P., 2005. The inventory of the giant chestnut trees in the
southern Switzerland. Acta Horticulturae 693, 171-178.
Latta R.G., 2006. Integrating patterns across multiple genetic markers to infer spatial
process. Landscape Ecol. 21, 809-820.
Lauteri M., Monteverdi M.C., Sansotta A., Cherubini M., Spaccino L., Villani F., Küçük M.,
1998. Adaptation to drought in European chestnut. Evidences from a hybrid zone
and from controlled crosses between drought and wet adpated populations. Acta
Hort. 494, 345-353.
Mace G.M., Gittleman J.L., Purvis A., 2003. Preserving the tree of life. Science 300, 1707-
1709.
Manel S., Schwartz M.K., Luikart G., Taberlet P., 2003. Landscape genetics: combining
landscape ecology and population genetics. Trends Ecol. Evol. 18, 189-197.
Martín M.A., Alvarez J.B., Mattioni C., Cherubini M., Villani F., Martín L.M., 2009.
Identification and characterisation of traditional chestnut varieties of southern Spain
using morphological and simple sequence repeats SSR markers. Ann. Appl. Biol.
154, 389-398.
Martín M.A., Mattioni C., Cherubini M., Taurchini D., Villani F., 2010a. Genetic
Acknowledgments
References
05Journal of Natural Resources and Development 2012; 02: 01-05
characterisation of traditional chestnut varieties in Italy using microsatellite (SSRs)
markers. Ann. Appl. Biol. 157, 27-44.
Martín M.A., Mattioni C., Cherubini M., Taurchini D., Villani F., 2010b. Neutral and adaptive
genetic diversity in European chestnut populations by means of genomic and genic
microsatellite markers. Tree Genet. Genom. 6, 735-744.
Martín M.A., Mattioni C., Molina J.R., Álvarez J.B., Cherubini M., Herrera M.A., Villani F.,
Martín L.M., Landscape genetic structure of chestnut (Castanea sativa Mill.) in Spain.
Tree Genet. Genom. in press. DOI: 10.1007/s11295-011-0427-x.
Mattioni C., Cherubini M., Micheli E., Villani F., Bucci G., 2008. Role of domestication in
shaping Castanea sativa genetic variation in Europe. Tree Genet. Genom. 4, 563-574.
McKay J.W., 1942. Self-sterility in the Chinese chestnut (Castanea mollisima). Proc. Am.
Soc. Hort. Sc. 41, 156-16.
Miller M.P., Blinn D.W., Keim P., 2002. Correlations between observed dispersal capabilities
and patterns of genetic differentiation in four aquatic insect species from the Arizona
White Mountains, USA. Freshwater Biol. 47, 1660–1673.
Miller M.P., Bellinger M.R., Forsman E.D., Haig S.M., 2006. Effects of historical climate
change, habitat connectivity, and vicariance on genetic structure and diversity across
the range of the red tree vole (Phenacomys longicaudus) in the Pacific Northwestern
United States. Mol. Ecol. 15, 145-159.
MIMAM, 2006. Estrategia de Conservación y Uso Sostenible de los Recursos Genéticos
Forestales. Madrid, Spain.
Moritz C., 1994. Application of mitochondrial DNA analysis in conservation: a critical
review. Mol. Ecol. 3, 401-411.
Namkoong G., 2001. Forest Genetics: pattern and complexity. Can. J. Forest Res. 31, 623-
632.
Namkoong G., Ouédrago A.S., 1997. Developing decision making support strategies for
conservation and sustainable use of forest genetic resources. Research proposal,
IPGRI-UBC, IPGRI. Rome, Italy.
Oddou-Muratorio S., Demuse-Munsh B., Pélissier R., Gouyon P.H., 2004. Impacts of gene
flow and logging history on the local genetic structure of scattered tree species,
Sorbus torminalis L. Crantz. Mol. Ecol. 13, 3689-3702.
Palmerg-Lerche C., 1999. Conservation and management of forest genetic resources. J.
For. Sci. 11, 286-302.
Pautasso M., 2009. Geographical genetics and the conservation of forest trees. Perspect.
Plant Ecol. 11, 157-189.
Peakall R., Gilmore S., Keys W., Morgante M., Rafalski A., 1998. Cross-species amplification
of soybean (Glycine max) simple sequence repeats (SSRs) within the genus and
other legume genera: Implications for the transferability of SSRs in plants. Mol. Biol.
Evol. 15, 1275-1287.
Pereira-Lorenzo S., Costa R., Ramos-Cabrer A., Ribeiro C., da Silva M., Manzano G.,
Barreneche T., 2010. Variation in grafted european chestnut and hybrids microsatellite
reveals two main origins in the Iberian Peninsula. Tree Genet. Genom. 5, 701-715.
Petit R.J., Latouche-Hallé C., Pemonge M.H., Kremer A., 2002. Chloroplast DNA variation
of oaks in France and the influence of forest fragmentation on genetic diversity.
Forest Ecol. Manag. 156, 115-129.
Pliura A., Eriksson G., 2002. Genetic variation in juvenile height and biomass of open-
pollinated families of six Castanea sativa Miller populations in a 2X2 factorial
temperature x watering experiment. Silv. Genet. 51, 152-160.
Poffenberger M., 1996. Communities and forest management. IUCN. Cambridge, UK.
Powell W., Machray G.C., Provan J., 1996. Polymorphism revealed by simple sequence
repeats. Trends Plant. Sci. 1, 215-222.
Shachak M., Boeken B., Groner E., Kadmon R., Lubin Y., Meron E., Neeman G., Perevolotsky
A., Shkedy Y., Ungar E.D., 2008. Woody species as landscape modulators and their
effect on biodiversity patterns. Bioscience 58, 209–221.
Sork V.L., Smouse P.E., 2006. Genetic analysis of landscape connectivity in tree populations.
Landscape Ecol. 21, 821-836.
Storfer A., Murphy M.A., Evans J.S., Goldberg C.S., Robinson S., Spear S.F., Dezzani R.,
Delmelle E., Vierling L., Waits L.P., 2007. Putting the ‘landscape’ in landscape genetics.
Heredity 98, 128-142.
Storfer A., Murphy M.A., Spear S.F., Holderegger R., Waits L.P., 2010. Landscape genetics:
where are we now? Mol. Ecol. 19, 3496–3514.
Storz J.F., 2005. Using genome scans of DNA polymorphism to infer adaptive population
divergence. Mol. Ecol. 14, 671-688.
Tautz D., Renz M., 1984. Simple sequences are ubiquitous repetitive components of
eukaryotic genomes. Nucleic Acids Res. 12, 4127-4138.
Tollefsrud M.M., Sønstebø J.H., Brochmann C., Johnsen Ø., Skrøppa T., Vendramin G.G.,
2009. Combined analysis of nuclear and mitochondrial markers provide new insights
into the genetic structure of North European Picea abies. Heredity 102, 549-562.
Turner M.G., 1989. Landscape Ecology: The Effect of Pattern on Process. Ann. Rev. Ecol.
Syst. 20, 171-197.
Varshney R.K., Graner A., Sorrells M.E., 2005. Genic microsatellite markers in plants:
features and applications. Trends Biotechnol. 23, 48-55.
Walther G., Post E., Convey P., Menzel A., Parmesank C., Beebee T.J.C., Fromentin J.M.,
Hoegh-Guldberg O., Bairlein F., 2002. Ecological responses to recent climate change.
Nature 416, 389-395.
Wilson E.O., 1988. Biodiversity. National Academy Press. Washington, DC.
World Commission on Environment and Development, 1987. Our common future Oxford
University Press. Oxford, UK.
Wright J.P., Jones C.G., 2006. The concept of organisms as ecosystem engineers ten years
on: progress, limitations, and challenges. BioScience 56, 203–209.
Wulder M., Hall R., Coops N., Franklin S., 2004. Remotely sensed data for ecosystem
characterization. BioScience 54, 511–521.
Young A., Boshier D., Boyle J., 2000. Forest Conservation Genetics: principles and practice
CSIRO- CABI Publishing. New York.
JOURNAL OF NATURAL RESOURCES AND DEVELOPMENT
Environmental impact assessment of land use systems using emergy in Teresópolis-BrazilTorrico J C * a , Janssens M b
a University of Applied Sciences Cologne - Institute for Technology and Resources Management in the Tropics and Subtropics, Betzdorferstr 2, 50679, Köln-Germany.
b University of Bonn, Unit of Tropical Crops. Sechtemer Straße 29, D-50389-Wesseling-Germany.
* Corresponding author : [email protected]
Article history Abstract
Received 03.11.2011Accepted 14.11.2011Published 07.05.2012
This paper provides a set of indices based on emergy analysis for the Côrrego Sujo basin, Teresópolis-Brazil. Encompassing natural and agricultural systems, the Côrrego Sujo basin has been affected by destruction and fragmentation of natural habitats and unsustainable land use practices. The main objective is to evaluate the environmental impact of the land use systems, the load capacity and the use of natural and economic resources. The studied land use systems were: i) agriculture, ii) grassland and cattle, iii) rainforest and iv) forest in regeneration stage (fallow: 1, 2 and 3 years old). Emergy analysis integrates all flows within a system of coupled economic and environmental work in common biophysical units (solar emjoules – seJ). The main conclusions of the study are: the basin does not have dependence of purchased resources and the environmental impact is moderate; the efficiency of the basin as a system is highly positive and it represents a positive contribution to the economy; the emergy exchange ratio is moderate and; the biggest contributions to the system come from natural sources showing that the ecological sustainability is moderate to good.
Keywords
EmergyAgro-ecological evaluationLand-use systemsTeresópolis
Introduction
After the UN Convention on Biological Diversity of Rio de Janeiro in 1992 there was increased concern and interest in internalizing environmental costs (Kumar et al. 2004 and Mota 2000). The intrinsic value of natural resources like soil as a contribution to national, regional and local economic productivity is not adequately recorded in financial planning and decision making. As a consequence, long-term sustainability is challenged by degrading natural resources (Cohen et al. 2006), and by improper functionality of ecosystems. There is also a need to develop quantitative tools that can be used to support policy makers (Bouman et al. 1999), to understand the functions of natural systems and to identify alternative state within
agricultural systems. The Atlantic Forest, or Mata Atlântica, is one of the worlds most outstanding and most threatened ecosystems (Myers 1990; Myers et al. 2000; Mittermeier et al. 2005). On the one hand it hosts an enormous structural, floristic and faunal diversity comprising a high degree of endemism at all levels of organism organization (Fonseca et al. 1999; Kinzey 1981; Morawetz and Krügel 1997; Mori et al. 1981; Prance 1987). On the other hand, its destruction since the beginning of the colonization of South America has led to a dramatic reduction and fragmentation of the ecosystem (Bertoni et al. 1988; Dean 1996; Leitão Filho 1987). Of the five South American biodiversity hotspots
Journal of Natural Resources and Development 2012; 02: 06-14 06DOI number: 10.5027/jnrd.v2i0.02
07Journal of Natural Resources and Development 2012; 02: 06-14
the Atlantic Forest is the most densely populated one and comprises the smallest portion of protected areas (Mittermeier et al. 2005). Today agricultural landscapes, different land use types and some of the biggest Brazilian urban agglomerations are embedded in the area once almost continuously covered by the Mata Atlântica.The reduction and fragmentation of natural ecosystems by anthropogenic impacts have elevated the rate of species extinction by one thousand times the natural background rate (Pimm et al. 1995). Physical and chemical qualities of landscapes have been affected by the destruction and fragmentation of natural habitats and unsustainable land use practices. Soil erosion and landslides are natural processes but have been intensified by man made degradation (Augustin 1999; Coelho Netto 2003). Other parameters affected by anthropogenic landscape transformations are soil and air quality as well as surface and groundwater availability and quality. In turn, the negative effects of man made habitat destruction are impairing the productivity of land use systems. In spite of this, the importance of ecosystem services are not sufficiently recognized and appreciated by the society (Tonhasca Jr. 2005).Accelerating anthropogenic climate change is likely to magnify the effects of habitat destruction and fragmentation (Thomas et al. 2004). Its specific effects on biodiversity have yet to be assessed for most of the biodiversity hotspots (Midgley et al. 2002). In general, ongoing climate change is affecting the vulnerability of ecosystems and land use systems at economic, social and environmental level (Parmesan and Yohe 2003; Rahmstorf and Schellnhuber 2007). Therefore, the evaluation of related risk and resilience potential considering climate change scenarios is useful for developing concepts, strategies and instruments for sustainable natural and agricultural resource management and conservation. Trade-off and synergy analyses help to identify alternative sustainable states, as a multidisciplinary organizing principle and a basis for conceptual modelling to design and organise research and development projects in order to quantify and assess the sustainability of agricultural production systems (Crissman et al. 1998).The objective of this paper is therefore to evaluate the environmental impact of land use systems; including the load capacity1 and use of natural and economic resources, using the emergy methodology in Teresópolis, Rio de Janeiro.
Comparing agro-ecological systems
When comparing agricultural and natural systems, or mixed systems combining the latter two components it is difficult to find appropriate yardsticks. When using monetary methods in farming systems analyses one is left with a double difficulty, viz.; (i) only the saleable output of agricultural systems will be taken into account, leaving some of the production side effects unaccounted for like e.g. soil improvement or degradation, erosion control, biomass residues left in situ, rotation effects etc; and (ii) most of the ecosystem services are difficult to monetize.
1 The load capacity is an indicator of the load on the environmental and might be considered a measure o stress due to economic activity
When adopting biomass as a yard stick some comparisons are possible to do although the reduction of crops or vegetation to dry weight is somewhat clumsy as there is not such a thing as dry biomass to be observed on a farmer’s field or in natural vegetation, not to speak about the irrelevant reduction of animals or even human beings into dry weight “items”. However, biomass appraisals give us important information as to the photosynthetic potential of agro-ecological systems as e.g. litter fall, net primary production (NPP), carbon sequestration etc. Some comparisons are easier to do by using spatial parameters. Foresters like to use basal area of a forest stand as an indicator of growth and biomass capital. Other spatial parameters have been proposed like eco-volume, bio-volume contending that living plants and animals are acting as visible volume units. The bio-volume of plants and animals is closely related with their fresh weight. West et al. (1997, 2001) proposed the universal law of biology stating that there exists a universal relation, valid for all living organisms, between metabolic energy rate, E and fresh biomass, M as follows (West et al. 1997, 2001, also referred as the WBE model):
E = kM3/4
Where E = metabolic energy of a living organism M = fresh weight of a living organism k = specific coefficient for each species
After log transformation, all organisms, plants or animals, line up linearly. However, this approach cannot consider inert components or physical attributes of the surrounding environment. This leads us into parameters of energy for comparing different agro-ecological systems. Energy is a relevant parameter to study the sustainability of systems. It is also, essential to most human activities, including agriculture. Too much energy means wastage, global warming and other environmental pressures (Simoes 2001). Energy might be more sensitive and a concrete indicator in guiding us for better resource allocation (Wilson 1974, Chou 1993). Resources of agricultural production can also be discussed in terms of land energy and labour (Doyle 1990). Agriculture can also be defined as an alternate process of concentration and dilution of energy and resources (Janssens et al. 2011). The increased productivity by hectare leads to a decline of energy use efficiency. Intensive production brought a high dependence on inputs from non-renewable resources. Systems analysis of agricultural production is the first step to study this situation (Hill 1976). Since life is basically, an energy transforming process, energy issues are central to sustainability. “Everything is based on energy. Energy is the source and control of all things, all values, and all actions of human beings and nature”, according to Odum & Odum (1976). While social and economic sustainability certainly are essential and highly desirable, energy processes and limitations set definite bottom lines (Jansen 2000). Energetic output to input ratios are widely used (Pimentel 1989). Many cropping systems have ratios being lower than one. However, it is difficult to incorporate values for eco-system services.
DOI number: 10.5027/jnrd.v2i0.02
08Journal of Natural Resources and Development 2012; 02: 06-14
The emergy analysis method
The emergy analysis method was selected as a method to study the different agricultural systems in Teresópolis because it provides a general category i.e. emergy, for measurement of heterogeneous flows within the ecosystem, as well as an instrument to account for interactions between physical flows in nature and the economy and monetary flows within internal and external markets of natural resources and goods (Odum 1986, Odum 1996, Odum 1998). Emergy can be considered as the “embodied or embedded energy” for each component of a system i.e. the total sum of energy of a given kind required to achieve this component. For the sake of easy comparison, energy of solar origin is used as yard stick and expressed as seJ (solar embodied joule). Hence, the solar constant amounting to 1350 W m-2 i.e. the energy/time/area/wavelength vs. wavelength received at the top of the Earth’s atmosphere from the sun is equivalent to 1350 seJ and will release 1350 Joule of available sun light energy. This situation is for a portion of the Earth where the sun’s rays are straight overhead. Note that by far most of the energy occurs in visible wavelengths. Above solar transformation ratio between 1350 seJ and 1350 J has been called solar “transformity” (in seJ/J). Solar energy has a solar transformity of 1. Other examples of solar transformities are given by Vito et al. (2004). Emergy evaluation is an environmental accounting method that addresses the issue of environmental and economic sustainability by quantifying the total amount of natural resources that nature spends (i.e. dissipates) and the total amount of economic resources are consumed to produce a product or operate a service (Tilley 2010, Vito et al. 2004) . A history and review of applications of the emergy method was given by Brown and Ulgiati (2004).Due to emergy’s ability to compare environmental and economic resources used in agricultural production, emergy analysis can assess a system’s sustainability based on indices that relate the free work of nature based on renewable inputs to non-renewable resource consumption, agricultural yield and economic investment. A fundamental assumption of emergy analysis is that the worth of a contributed resource to agricultural production is proportional to its solar emergy, i.e., the total amount of solar energy dissipated directly and indirectly (Brown and Herendeen 1996). The emergy theory also has been criticized and observed by several authors like Spreng 1988, Mansson 1993, Ayres 1998, Cleveland et al. 2000 the most criticized points are (i) that emergy theory of value ignores human preference and demand. (ii) There seems to be much confusion about the relationship between emergy and other thermodynamic properties. (iii) It is difficult to know the inputs and processes over a long period of time like from the prehistoric period onwards. (iv) Problems of quantifying transformation units. (v) Tenuous physical and biological foundations to assign monetary values to ecological products and services.The same critics have been refuted by (Patten 1993, Odum 1995a, 1995b), who says that emergy method provides a bridge that connects economic and ecological systems. The economic and ecological aspects can be compared on an objective basis that is independent of their monetary perception. Emergy analysis provides an ecocentric evaluation method.It is scientifically sound and shares the rigor of thermodynamic
methods. Emergy analysis recognizes the different qualities of energy or abilities to do work. Emergy analysis provides a more holistic alternative to many existing methods for environmentally conscious decision making. Emergy analysis can quantify the contribution of natural capital for sustaining economic activity. There are not many methods to analyze agro-ecologically the farming systems and compare each other in a holistic form, some of the alternatives to emergy methods could be thermodynamic variation as energy and exergy analysis, discussed in Nilson (1997) and Bastianoni & Marchettini (1997), biomass balance (Janssens et al. 2009). Multivariable analysis combined with systems analysis, this method implies a lot of input data including some social, physical, economical, environmental, etc. (Grace 2006), information that are not available in the study region. Another common used method is the economical analysis, alone this method doesn’t say too much about the environmental behavior of the system. Other fast assessment method could be agroclimax evaluation, discussed in Janssens 2009.
This study was carried out in the Côrrego Sujo basin, Rio de Janeiro, from April 2003 to December 2005. Emergy analysis was used to compare the main land use and natural systems in the municipality of Teresópolis within the mountain region of the Atlantic Forest. The studied systems were: i) agriculture, ii) grassland and cattle, iii) rainforest, iv)forest in regeneration stage (fallow: 1, 2 and 3 years old). The results of those analyses in the Côrrego Sujo Basin were extrapolated to the whole municipality of Teresópolis.
Procedure of emergy evaluation
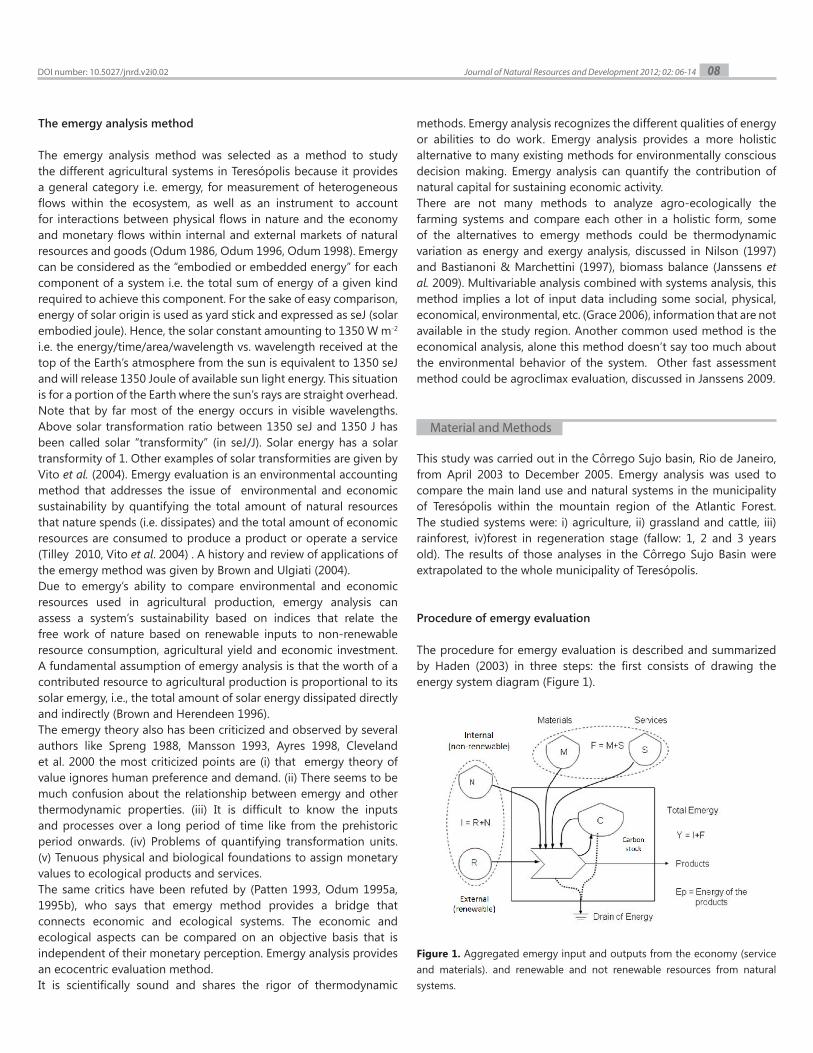
The procedure for emergy evaluation is described and summarized by Haden (2003) in three steps: the first consists of drawing the energy system diagram (Figure 1).
Figure 1. Aggregated emergy input and outputs from the economy (service and materials). and renewable and not renewable resources from natural systems.
Material and Methods
DOI number: 10.5027/jnrd.v2i0.02
09Journal of Natural Resources and Development 2012; 02: 06-14
The second elaborates the emergy evaluation table and the third is calculating the emergy indicators and the summary diagrams. The summary diagrams show all aggregated emergy inputs from the economy as service or materials and from natural systems in the form of renewable or non renewable resources.
In Figure 1, R is the sum of the renewable emergy flows supporting the economy (i.e. rain, waves, tide); N is the sum of non-renewable resources from within the system (national) boundary; M is the sum
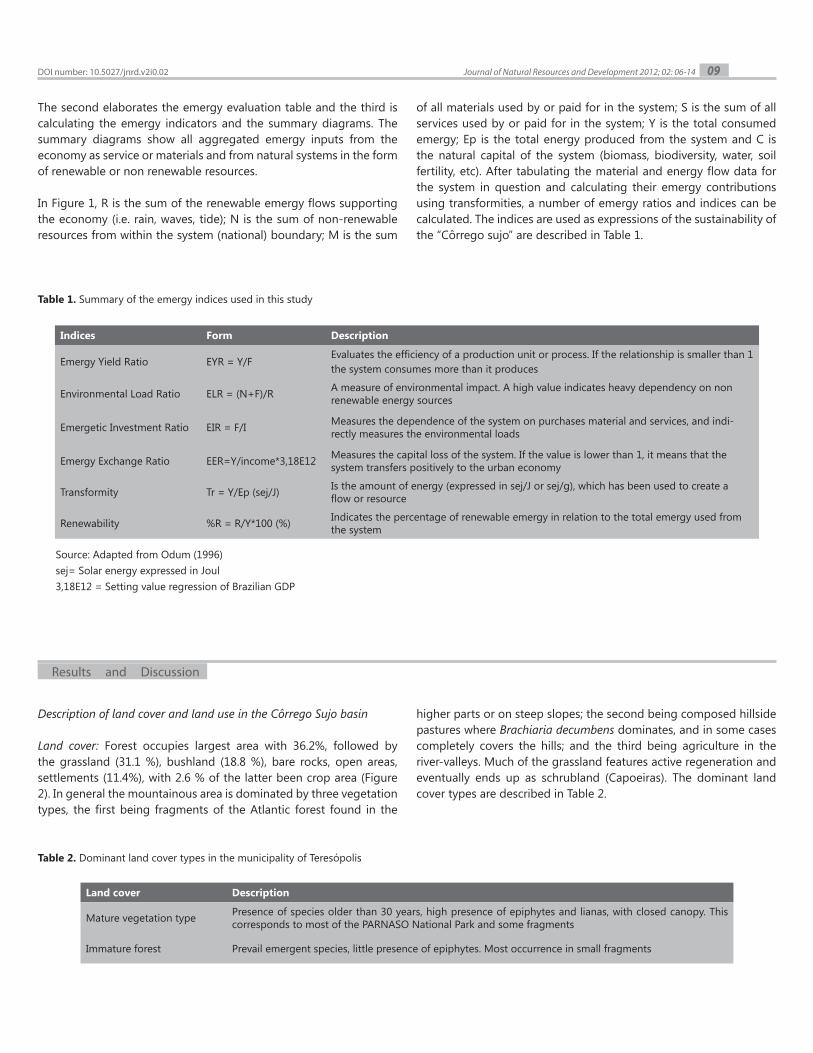
of all materials used by or paid for in the system; S is the sum of all services used by or paid for in the system; Y is the total consumed emergy; Ep is the total energy produced from the system and C is the natural capital of the system (biomass, biodiversity, water, soil fertility, etc). After tabulating the material and energy flow data for the system in question and calculating their emergy contributions using transformities, a number of emergy ratios and indices can be calculated. The indices are used as expressions of the sustainability of the “Côrrego sujo” are described in Table 1.
Results and Discussion
Table 1. Summary of the emergy indices used in this study
Source: Adapted from Odum (1996)sej= Solar energy expressed in Joul3,18E12 = Setting value regression of Brazilian GDP
Description of land cover and land use in the Côrrego Sujo basin
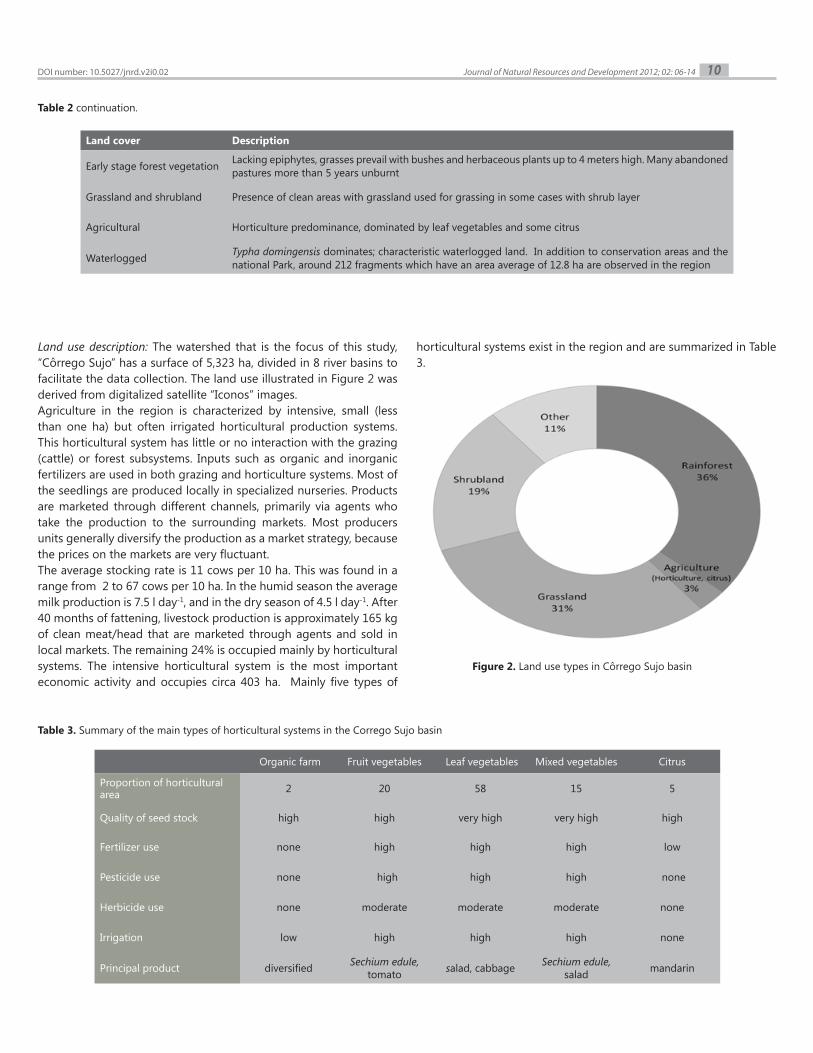
Land cover: Forest occupies largest area with 36.2%, followed by the grassland (31.1 %), bushland (18.8 %), bare rocks, open areas, settlements (11.4%), with 2.6 % of the latter been crop area (Figure 2). In general the mountainous area is dominated by three vegetation types, the first being fragments of the Atlantic forest found in the
higher parts or on steep slopes; the second being composed hillside pastures where Brachiaria decumbens dominates, and in some cases completely covers the hills; and the third being agriculture in the river-valleys. Much of the grassland features active regeneration and eventually ends up as schrubland (Capoeiras). The dominant land cover types are described in Table 2.
Table 2. Dominant land cover types in the municipality of Teresópolis
DOI number: 10.5027/jnrd.v2i0.02
Land cover Description
Mature vegetation type Presence of species older than 30 years, high presence of epiphytes and lianas, with closed canopy. This corresponds to most of the PARNASO National Park and some fragments
Immature forest Prevail emergent species, little presence of epiphytes. Most occurrence in small fragments
Indices Form Description
Emergy Yield Ratio EYR = Y/F Evaluates the efficiency of a production unit or process. If the relationship is smaller than 1 the system consumes more than it produces
Environmental Load Ratio ELR = (N+F)/R A measure of environmental impact. A high value indicates heavy dependency on non renewable energy sources
Emergetic Investment Ratio EIR = F/I Measures the dependence of the system on purchases material and services, and indi-rectly measures the environmental loads
Emergy Exchange Ratio EER=Y/income*3,18E12 Measures the capital loss of the system. If the value is lower than 1, it means that the system transfers positively to the urban economy
Transformity Tr = Y/Ep (sej/J) Is the amount of energy (expressed in sej/J or sej/g), which has been used to create a flow or resource
Renewability %R = R/Y*100 (%) Indicates the percentage of renewable emergy in relation to the total emergy used from the system
10Journal of Natural Resources and Development 2012; 02: 06-14
Table 2 continuation.
Land use description: The watershed that is the focus of this study, “Côrrego Sujo” has a surface of 5,323 ha, divided in 8 river basins to facilitate the data collection. The land use illustrated in Figure 2 was derived from digitalized satellite “Iconos” images. Agriculture in the region is characterized by intensive, small (less than one ha) but often irrigated horticultural production systems. This horticultural system has little or no interaction with the grazing (cattle) or forest subsystems. Inputs such as organic and inorganic fertilizers are used in both grazing and horticulture systems. Most of the seedlings are produced locally in specialized nurseries. Products are marketed through different channels, primarily via agents who take the production to the surrounding markets. Most producers units generally diversify the production as a market strategy, because the prices on the markets are very fluctuant. The average stocking rate is 11 cows per 10 ha. This was found in a range from 2 to 67 cows per 10 ha. In the humid season the average milk production is 7.5 l day-1, and in the dry season of 4.5 l day-1. After 40 months of fattening, livestock production is approximately 165 kg of clean meat/head that are marketed through agents and sold in local markets. The remaining 24% is occupied mainly by horticultural systems. The intensive horticultural system is the most important economic activity and occupies circa 403 ha. Mainly five types of
horticultural systems exist in the region and are summarized in Table 3.
Figure 2. Land use types in Côrrego Sujo basin
Table 3. Summary of the main types of horticultural systems in the Corrego Sujo basin
DOI number: 10.5027/jnrd.v2i0.02
Land cover Description
Early stage forest vegetation Lacking epiphytes, grasses prevail with bushes and herbaceous plants up to 4 meters high. Many abandoned pastures more than 5 years unburnt
Grassland and shrubland Presence of clean areas with grassland used for grassing in some cases with shrub layer
Agricultural Horticulture predominance, dominated by leaf vegetables and some citrus
Waterlogged Typha domingensis dominates; characteristic waterlogged land. In addition to conservation areas and the national Park, around 212 fragments which have an area average of 12.8 ha are observed in the region
Organic farm Fruit vegetables Leaf vegetables Mixed vegetables Citrus
Proportion of horticultural area 2 20 58 15 5
Quality of seed stock high high very high very high high
Fertilizer use none high high high low
Pesticide use none high high high none
Herbicide use none moderate moderate moderate none
Irrigation low high high high none
Principal product diversified Sechium edule, tomato salad, cabbage Sechium edule,
salad mandarin
11Journal of Natural Resources and Development 2012; 02: 06-14
The organic system combines a variety of crops and forest species, annual crops such as cassava and sweet corn with vegetable crops such as lettuce, green onion and cauliflower.
Of the 2,954 horticultural establishments in Teresópolis a little more than 2,500 have viable conditions for agricultural production. Manpower is sufficient to increase cultivation area or intensify production. On average there are three people per farm unit, totally dedicated to production. The population growth in the region has remained constant in recent years at least 1% annual growth (IBGE 2010). Some other agricultural systems and plant communities present in the region are:
Sylvopastoral systems: It is the combination of pastures with trees. In addition to live fences, trees dispersed in pastures are the most common and most traditional silvopastoral system found in Teresópolis. The density of trees in pastures varies from zero, to approximately 30 or more per hectare. Few farmers permit greater than 25% canopy cover in their pastures fearing that greater tree cover will diminish the amount of pasture produced. The most important species are listed in Torrico (2010).Agroforestry systems: The studied agroforestry systems correspond to horticultural crops combined with some trees. The crops are mostly horticultural crops listed in Torrico (2010). Ecological systems: Is a type of agroforestry system, which combines intensively trees and crops, we account for this system diversity index of H=3.19, richness index R=96, dominance index 1-D=0.93. Those
indices indicate that the system manages more agrobiodiversity inside the system. Species are listed in Torrico (2010). Short rotation crop: Crops that complete their agricultural cycle in less than three months. Examples are presented in Torrico, 2010. Perennials crops: Plants that persist for more than 2 growing seasons, in the region Citrus, banana, piper. Shrubland: Plant community characterized by vegetation dominated by bushes, including grasses, herbs, and geophytes, shrubland species are listed in Torrico (2010). Grassland vegetation: Dominated by grasses (Brachiaria decumbens) and other herbaceous plants.
Emergy evaluation
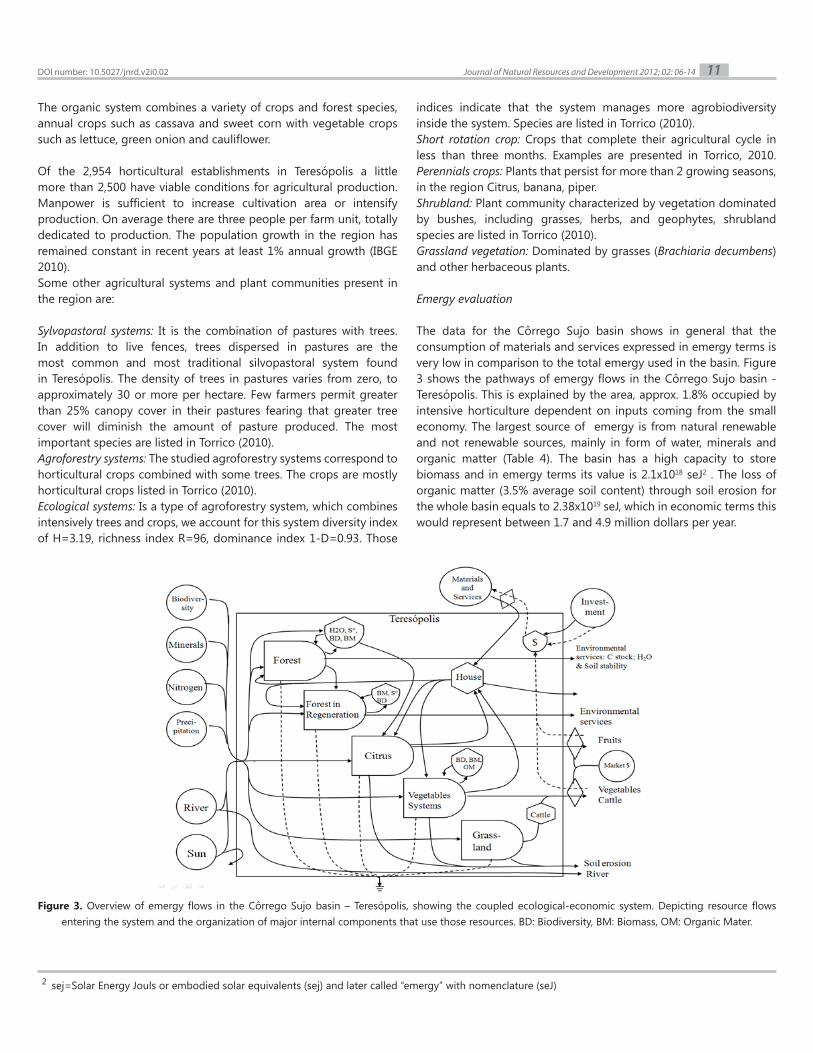
The data for the Côrrego Sujo basin shows in general that the consumption of materials and services expressed in emergy terms is very low in comparison to the total emergy used in the basin. Figure 3 shows the pathways of emergy flows in the Côrrego Sujo basin - Teresópolis. This is explained by the area, approx. 1.8% occupied by intensive horticulture dependent on inputs coming from the small economy. The largest source of emergy is from natural renewable and not renewable sources, mainly in form of water, minerals and organic matter (Table 4). The basin has a high capacity to store biomass and in emergy terms its value is 2.1x10¹⁸ seJ2 . The loss of organic matter (3.5% average soil content) through soil erosion for the whole basin equals to 2.38x10¹⁹ seJ, which in economic terms this would represent between 1.7 and 4.9 million dollars per year.
Figure 3. Overview of emergy flows in the Côrrego Sujo basin – Teresópolis, showing the coupled ecological-economic system. Depicting resource flows entering the system and the organization of major internal components that use those resources. BD: Biodiversity, BM: Biomass, OM: Organic Mater.
2 sej=Solar Energy Jouls or embodied solar equivalents (sej) and later called “emergy” with nomenclature (seJ)
DOI number: 10.5027/jnrd.v2i0.02
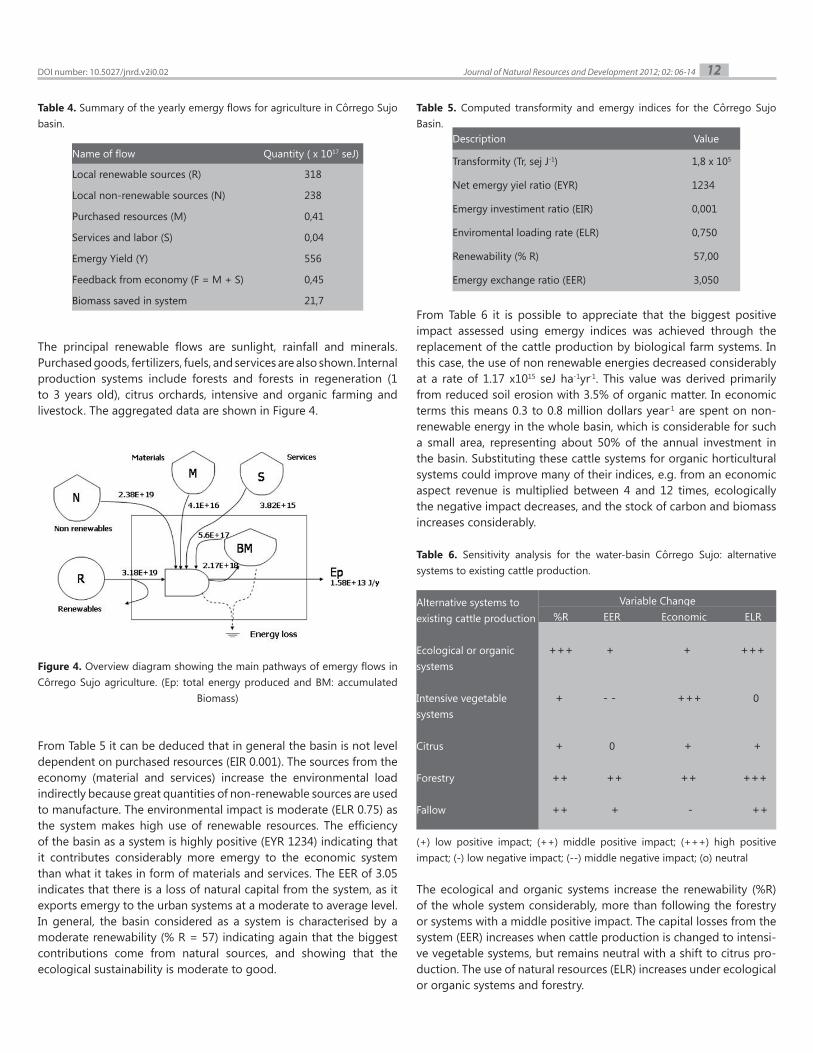
Table 4. Summary of the yearly emergy flows for agriculture in Côrrego Sujo basin.
The principal renewable flows are sunlight, rainfall and minerals. Purchased goods, fertilizers, fuels, and services are also shown. Internal production systems include forests and forests in regeneration (1 to 3 years old), citrus orchards, intensive and organic farming and livestock. The aggregated data are shown in Figure 4.
Figure 4. Overview diagram showing the main pathways of emergy flows in Côrrego Sujo agriculture. (Ep: total energy produced and BM: accumulated
Biomass)
From Table 5 it can be deduced that in general the basin is not level dependent on purchased resources (EIR 0.001). The sources from the economy (material and services) increase the environmental load indirectly because great quantities of non-renewable sources are used to manufacture. The environmental impact is moderate (ELR 0.75) as the system makes high use of renewable resources. The efficiency of the basin as a system is highly positive (EYR 1234) indicating that it contributes considerably more emergy to the economic system than what it takes in form of materials and services. The EER of 3.05 indicates that there is a loss of natural capital from the system, as it exports emergy to the urban systems at a moderate to average level. In general, the basin considered as a system is characterised by a moderate renewability (% R = 57) indicating again that the biggest contributions come from natural sources, and showing that the ecological sustainability is moderate to good.
Table 5. Computed transformity and emergy indices for the Côrrego Sujo Basin.
From Table 6 it is possible to appreciate that the biggest positive impact assessed using emergy indices was achieved through the replacement of the cattle production by biological farm systems. In this case, the use of non renewable energies decreased considerably at a rate of 1.17 x10¹⁵ seJ ha-1yr-1. This value was derived primarily from reduced soil erosion with 3.5% of organic matter. In economic terms this means 0.3 to 0.8 million dollars year-1 are spent on non-renewable energy in the whole basin, which is considerable for such a small area, representing about 50% of the annual investment in the basin. Substituting these cattle systems for organic horticultural systems could improve many of their indices, e.g. from an economic aspect revenue is multiplied between 4 and 12 times, ecologically the negative impact decreases, and the stock of carbon and biomass increases considerably.
Table 6. Sensitivity analysis for the water-basin Côrrego Sujo: alternative systems to existing cattle production.
(+) low positive impact; (++) middle positive impact; (+++) high positive impact; (-) low negative impact; (--) middle negative impact; (o) neutral
The ecological and organic systems increase the renewability (%R) of the whole system considerably, more than following the forestry or systems with a middle positive impact. The capital losses from the system (EER) increases when cattle production is changed to intensi-ve vegetable systems, but remains neutral with a shift to citrus pro-duction. The use of natural resources (ELR) increases under ecological or organic systems and forestry.
12Journal of Natural Resources and Development 2012; 02: 06-14
Name of flow Quantity ( x 1017 seJ)
Local renewable sources (R) 318
Local non-renewable sources (N) 238
Purchased resources (M) 0,41
Services and labor (S) 0,04
Emergy Yield (Y) 556
Feedback from economy (F = M + S) 0,45
Biomass saved in system 21,7
Variable ChangeAlternative systems to existing cattle production
Ecological or organic systems
Intensive vegetable systems
Citrus
Forestry
Fallow
%R EER Economic ELR
+++ + + +++
+ - - +++ 0
+ 0 + +
++ ++ ++ +++
++ + - ++
DOI number: 10.5027/jnrd.v2i0.02
Transformity (Tr, sej J-1) 1,8 x 10⁵
Net emergy yiel ratio (EYR) 1234
Emergy investiment ratio (EIR) 0,001
Enviromental loading rate (ELR) 0,750
Renewability (% R) 57,00
Emergy exchange ratio (EER) 3,050
Description Value
13Journal of Natural Resources and Development 2012; 02: 06-14
In Teresópolis, annual agricultural crops and short rotation perennials (mixed systems) tend to have the greatest economic productivity per hectare per year but have marginal or even negative returns when ex-pressed in emergy terms due to inputs for soil preparation, fertilizing and harvesting in accordance with Holgrem (2003) who studied crop rotation and its effect on emergy ratios. Long rotations and low input plantation and natural forestry (organic-farm) have lower economic productivity per hectare per year but can more easily be managed in a sustainable way and finally, can be grown on marginal land too poor for food production. These advantages show up as high emer-gy yield ratios Farmers that organize their operations by drawing on high yield emergy sources (vegetable systems) are able to displace their fellow farmers who continue to organize their farming systems around local renewable emergy flows The results from analyses of the vegetable systems demonstrated the increased yield per area resulting from investments in high ener-gy resources (e.g. fertilizers, services). However, the dependence on these inputs reduces the fraction of renewable energy and increases environmental degradation, making these systems less sustainable relative to systems more dependent on renewable energies. Dependence on non-renewable energies for larger yields may be a good strategy when non-renewable energies are readily available. However, when non-renewable energy sources are no longer avai-lable, or environmental degradation prohibits their use, agriculture will need to be reorganized to rely on the limited flow of renewable resources.
a. The landscape is dominated by three components: forest inclu-ding (fragments, 36.2%), grassland (31.1%) and forest regeneration (18.8%). This landscape tends to change slowly, will being replaced pastures either by horticulture or in areas with steep slop, by forest regeneration. The cropped area is only 2.6% of the total available land.b. The emergy exchange ratio is moderate as the largest contribu-tions to the system come from natural sources, resulting in a level of ecological sustainability that is moderate to good. The largest con-tributors to sustainability are the organic or ecological agricultural systems they are the only ones that have the capacity to save capi-tal in form of biomass. These systems use fewer resources from the economy and depend more on natural renewable resources, which guarantee its sustainability. They ensure the survival of the producer throughout the time and the preservation of biodiversity. c. The substitution of cattle systems for any other agricultural or fo-rest system represents clear gains economic and environmental. The best options were the organic and forest systems. d. The basin is not dependant on purchased resources and the envi-ronmental impact of production systems is moderate. The efficiency of the basin as a system is highly positive and represents a positive contribution to the economy.
Augustin C., 1999. The relationship between gully erosion and land use in Gouveia, Minas
Gerais, Brazil, in: Cunha S., Guerra A. (Eds.) Abstracts of Papers and Posters. Regional
Conference on Geomorphology. July 17 - 22, 1999. International Association of
Geomorphologists (IAG). Rio de Janeiro, Brazil.
Bastianoni, S., Marchettini, N. 1997. Emergy/exergy ratio as a measure of the level of
organization of systems, Ecological Modelling, Volume 99, Issue 1, 16 June 1997,
Pages 33-40, ISSN 0304-3800, 10.1016/S0304-3800(96)01920-5.
Bertoni E., Martins F., Moraes JL., Shepard GJ., 1988. Composição florística do Parque
Estadual de Vassununga, Santa Rita do Passa Quatro. Boletim Técnico do Instituto
Florestal 42(1988):149-170
Bouman BA., Jansen HG., Schipper RA., Nieuwenhuyse A., Hengsdijk H., Bouma J., 1999.
A framework for integrated biophysical and economic land use analysis at different
scales. Agriculture, Ecosystems & Environment. Vol. 75, Issues 1-2, 55-73
Coelho Netto A., 2003. Evolução de cabeceiras de drenagem no médio valo do Paraíba
do Sul (SP/RJ): a formação e o crescimento da rede de canais sob controle estrutural.
Revista Brasileira de Geomorfologia 4 (2003): 118-167
Cohen M., Brown M., Shepherd K., 2006. Estimating the environmental costs of soil
erosion at multiple scales in Kenya using emergy synthesis. Agriculture, Ecosystems
& Environment. Vol. 114, Issues 2-4, 249-269
Crissman C., Antle J., Capalbo S., 1998. Economic, environmental and health tradeoffs in
agriculture: pesticides and the sustainability of Andean potato production. Kluver
Academic Publishers. Massachusetts, USA.
Dean W., 1996. A ferro e fogo: a historia e a devastação da Mata Atlântica brasileira.
Companhia das Letras. São Paulo, Brazil.
Fonseca G., Herrmann G., Leite Y., 1999. Macrogeography of Brazilian mammals. In:
Eisenberg J. & Redford K. (eds.). Mammals of the Neotropics. Volume 3: The central
Neotropics. University of Chicago Press, Chicago, USA. pp. 549-563
Grace, James. 2006. Structural Equation Modeling and Natural Systems. Cambridge
University Press (January 5, 2007). 378 pages.
Haden A., 2003. Emergy Evaluations of Denmark and Danish Agriculture. Assessing the
Limits of Agricultural Systems to Power Society. Ekologiskt Landbruk, Nr 37
Holgrem D., 2003. Biomass Fuels from sustainable land use: a permaculture perspective.
Holgrem design service. In Collected Writings & Presentations 1978-2006. Available
on: http://www.patricioleon.cl/permacultura/books/David%20Holgrem/David%20
Holmgren/CW&P%201978-2006%20v2.pdf
IBGE. 2010. Instituto Brasileiro de Geofragia e Estadistica. Censo demográfico 2010,
available on [http://www.ibge.com.br/cidadesat/topwindow.htm?1]
Kinzey W., 1981. The titi monkeys, genus Callicebus. In: Coimbra- Filho A. and Mittermeier
R. (eds.). Ecology and behaviour of Neotropical primates. Volume 1. Academia
Brasileira de Ciências. Rio de Janeiro, Brazil.
Kumar V., Mills D., Anderson J., Mattoo A., 2004. An alternative agriculture system is
defined by a distinct expression profile of select gene transcripts and proteins. PNAS
2004 101: 10535-10540; published online before print as 10.1073/pnas.0403496101
Leitão Filho HF., 1987. Aspectos taxonômicos das florestas do Estado de São Paulo.
Sivicultura em São Paulo 16 (1987):.197-206
Midgley G., Hannah L., Millar D., Rutherford M., Powrie L., 2002. Assessing the vulnerability
of species richness to anthropogenic climate change in a biodiversity hotspot. Global
Ecology and Biogeography 11(2002): 445–451
Mittermeier R., Robles-Gil P., Hoffman M., Pilgrim J., Brooks, T., Mittermeier C., Lamoreux
J., Fonseca G., 2005. Hotspots revisited: earth’s biologically richest and most
endangered terrestrial ecoregions. University of Chicago Press. Chicago, USA.
Mora-Wetz W., Krügel P., 1997. Computer aided comparative chorology of neotropical
plants. Phytogéographie tropicale: Réalités et perspectives: actes du colloque
international de phytogéographie tropicale, en hommage au professeur Raymond
Schnell. IRD-Institut de Recherche pour le Développement. Paris, France. pp. 218-
230
Mori S., Bom B., Prance G., 1981. Distribution patterns and conservation of eastern
Brazilian coastal forest tree species. Brittonia 33: 233-245
C o n c l u s i o n s
R e f e r e n c e s
DOI number: 10.5027/jnrd.v2i0.02

14Journal of Natural Resources and Development 2012; 02: 06-14
Mota, J., 2000. Valoração de Ativos Ambientais como Subsídio à Decisão Pública. Tese de
Doutorado: Centro de Desenvolvimento Sustentável (CDS). Universidade de Brasília.
Brasilia, Brasil.
Myers N., 1990. The biodiversity challenge: expanded hot-spots analysis. The
Environmentalist 10 (1990): 243-256
Myers N., Mittermeier R., Mittermeier C., Fonseca G., Kent J., 2000. Biodiversity hotspots
for conservation priorities. Nature 403 (2000): 853-858
Nilson, D. 1997. Energy, exergy and emergy analysis of using Straw as fuel in district
heating plants. Biomass and Bioenergy Vol. 13, Nos. l/2, pp. 63-73, 1997. c, 1997
Elsevier Science
Odum H. T., 1998. Self-organization, transformity, and information. Science Vol. 242
(1998): 113- 139
Odum H.T., 1996. Environmental Accounting: Emergy and Environmental Decision
Making. John Wiley & Sons Inc. NY, USA. pp. 370.
Parmesan C., Yohe G., 2003. A globally coherent fingerprint of climate change impacts
across natural systems. Nature 421 (2003): 37-42
Pimm S., Russell G., Gittleman J., Brooks T., 1995. The future of biodiversity. Science Vol.
269 (1995): 347–350.
Prance G.,1987. Biogeography of neotropical plants. In: Whitmore T. & Prance, G. (eds.).
Biogeography and quaternary history in tropical America. Claredon Press, Oxford,
UK. P: 175-196
Rahmstorf S., Schellnhuber H., 2007. Der Klimawandel. Diagnose, Prognose, Therapie. 5th
Edition. Verlag C. H. Beck, München, Germany.
Thomas C., Cameron A., Green R., Bakkenes M., Beaumont L., Collingham Y., Erasmus
B., De Siqueira M., Grainger A., Hannah L., Hughes L., Huntley B., Van Jaarsveld A.,
Midgely G., Miles L., Ortega Huerta M., Peterson A., Phillips O. Williams S., 2004.
Extinction risk from climate change. Nature 427 (2004): 125–128
Tonhasca JR., 2005. Ecologia e historia natural da Mata Atlântica. Editora Interciência,
Rio de Janeiro.
Torrico, J.C. 2010. Agrobiodiversity assessment in the Atlantic Rainforest region of Rio de
Janeiro. CienciAgro | Vol.2 Nr.1 (2010) 228-236.
UNICAMP, 2004. A importância da análise emergética em sistemas Agro-ecológicos. IV
Workshop internacional em Estudos Avançados Sobre Energia. Ecologia e Energia na
América Latina. 16-19 de Junho de 2004.
DOI number: 10.5027/jnrd.v2i0.02
JOURNAL OF NATURAL RESOURCES AND DEVELOPMENT
Monitoring for the presence of parasitic protozoa and free-living amoebae in drinking water plantsAmer A S a *
a Central Laboratory for Environmental Quality Monitoring (CLEQM), National Water Research Center (NWRC), El-Kanater, Qalubiya, Cairo, Egypt.
* Corresponding author : [email protected]
Article history Abstract
Received 26.03.2012Accepted 04.06.2012Published 09.07.2012
Contamination of drinking water by microorganisms represents a major human health hazard in many parts of the world. The main objective of drinking water treatment is to provide microbiologically safe drinking water. The conventional drinking water treatment and disinfection has proved to be one of the major public health advances in modern times. A number of processes; namely water treatment, disinfection and changes influence the quality of drinking water delivered to the customer’s tap during transport of treated water via the distribution system. At least 325 water-associated outbreaks of parasitic protozoan disease have reported. In this study, drinking water from treatment plants evaluated for the presence of parasitic protozoa. Water samples collected from two main points: (a) outlet of the water treatment plants (b) distribution system at different distances from the water treatment plants. Protozoa were concentrated from each water sample by adsorption and accumulation on the nitrocellulose membrane filters (0.45 µm pore size) and detected by conventional staining methods.
Keywords
Parasitic protozoaDrinking waterDesinfection
Introduction
Waterborne diseases occur worldwide. Outbreaks caused by the contamination of community water systems have the potential to cause diseases in large numbers of consumers. Waterborne outbreaks have economic consequences. Beyond the cost of health care for affected patients, their families and contacts, and the economic costs of illness and disease, they also create a lack of confidence in potable water quality and in the water industry in general. Interest in the contamination of drinking water by enteric pathogenic protozoa has increased considerably during the past three decades and the waterborne route (Panagiotis, et. al., 2007) transmits a number of protozoan parasitic infections of humans.Free-living amoebae (FLA) are the most prevalent protozoa found in the environment. FLA are isolated from soil, air, and water, dust, sewage, and sediments (Rodriguez-Zaragoza, 1994). They can colonize
water systems and have been isolated from drinking water plants (Hoffmann and Michel, 2001; Thomas, et. al., 2008), hospital water networks (Thomas, et. al., 2006), domestic water networks (Kilvington, et. al., 2004), and cooling towers. Among FLA, Acanthamoeba species are the most frequently found in human infections (Céline, et. al., 2010). Pathogenic FLA, such as Naegleria fowleri, Acanthamoeba spp., Balamuthia mandrillaris and Sappinia diploidea can cause life-threatening infections in humans and animals (Schuster and Visvesvara, 2004; Daft, et. al., 2005; Jonas Behets, et. al., 2007). FLAs are also a factor for keratitis and encephalitis (Fields, et. al., 2002, Akın, 2003: Dilara and Zuhal, 2011). They are responsible for human infections and can host pathogenic microorganisms.Giardia lamblia and Cryptosporidium parvum are parasitic, intestinal protozoan responsible for disease outbreaks in humans. When
Journal of Natural Resources and Development 2012; 02: 15-21 15DOI number: 10.5027/jnrd.v2i0.03
16Journal of Natural Resources and Development 2012; 02: 16-21
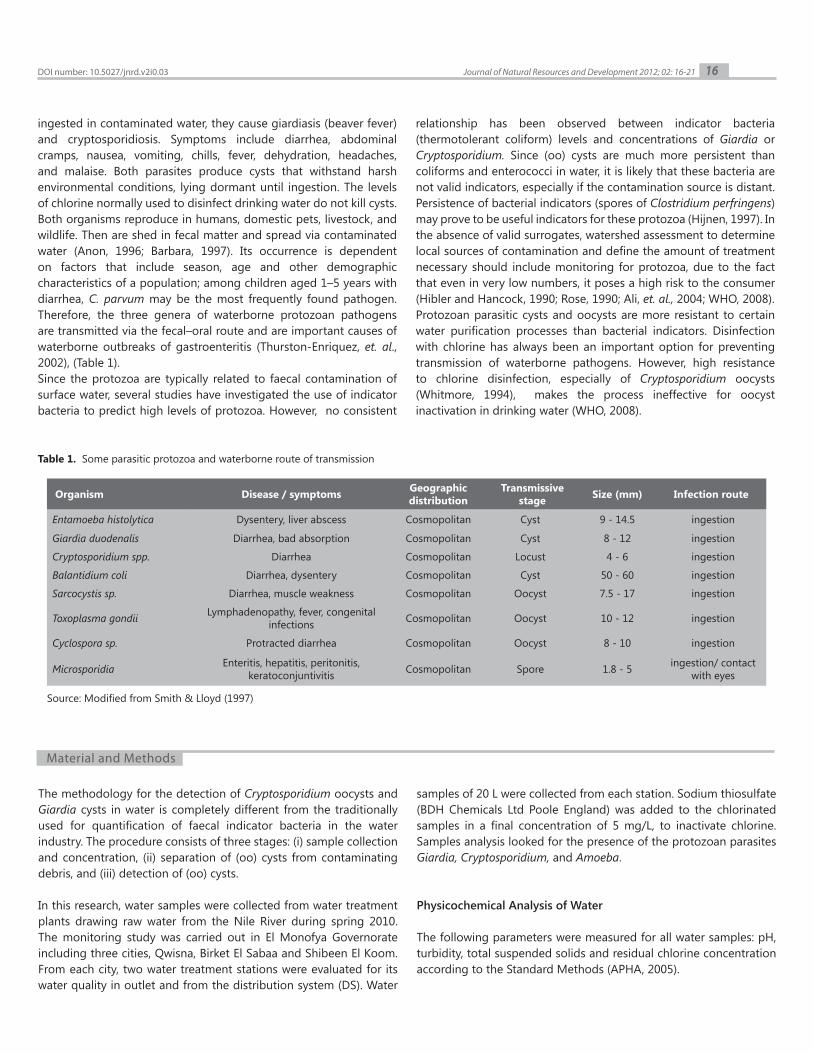
ingested in contaminated water, they cause giardiasis (beaver fever) and cryptosporidiosis. Symptoms include diarrhea, abdominal cramps, nausea, vomiting, chills, fever, dehydration, headaches, and malaise. Both parasites produce cysts that withstand harsh environmental conditions, lying dormant until ingestion. The levels of chlorine normally used to disinfect drinking water do not kill cysts. Both organisms reproduce in humans, domestic pets, livestock, and wildlife. Then are shed in fecal matter and spread via contaminated water (Anon, 1996; Barbara, 1997). Its occurrence is dependent on factors that include season, age and other demographic characteristics of a population; among children aged 1–5 years with diarrhea, C. parvum may be the most frequently found pathogen. Therefore, the three genera of waterborne protozoan pathogens are transmitted via the fecal–oral route and are important causes of waterborne outbreaks of gastroenteritis (Thurston-Enriquez, et. al., 2002), (Table 1). Since the protozoa are typically related to faecal contamination of surface water, several studies have investigated the use of indicator bacteria to predict high levels of protozoa. However, no consistent
relationship has been observed between indicator bacteria (thermotolerant coliform) levels and concentrations of Giardia or Cryptosporidium. Since (oo) cysts are much more persistent than coliforms and enterococci in water, it is likely that these bacteria are not valid indicators, especially if the contamination source is distant. Persistence of bacterial indicators (spores of Clostridium perfringens) may prove to be useful indicators for these protozoa (Hijnen, 1997). In the absence of valid surrogates, watershed assessment to determine local sources of contamination and define the amount of treatment necessary should include monitoring for protozoa, due to the fact that even in very low numbers, it poses a high risk to the consumer (Hibler and Hancock, 1990; Rose, 1990; Ali, et. al., 2004; WHO, 2008).Protozoan parasitic cysts and oocysts are more resistant to certain water purification processes than bacterial indicators. Disinfection with chlorine has always been an important option for preventing transmission of waterborne pathogens. However, high resistance to chlorine disinfection, especially of Cryptosporidium oocysts (Whitmore, 1994), makes the process ineffective for oocyst inactivation in drinking water (WHO, 2008).
Organism Disease / symptoms Geographic distribution
Transmissive stage Size (mm) Infection route
Entamoeba histolytica Dysentery, liver abscess Cosmopolitan Cyst 9 - 14.5 ingestion
Giardia duodenalis Diarrhea, bad absorption Cosmopolitan Cyst 8 - 12 ingestion
Cryptosporidium spp. Diarrhea Cosmopolitan Locust 4 - 6 ingestion
Balantidium coli Diarrhea, dysentery Cosmopolitan Cyst 50 - 60 ingestion
Sarcocystis sp. Diarrhea, muscle weakness Cosmopolitan Oocyst 7.5 - 17 ingestion
Toxoplasma gondii Lymphadenopathy, fever, congenital infections Cosmopolitan Oocyst 10 - 12 ingestion
Cyclospora sp. Protracted diarrhea Cosmopolitan Oocyst 8 - 10 ingestion
Microsporidia Enteritis, hepatitis, peritonitis, keratoconjuntivitis Cosmopolitan Spore 1.8 - 5 ingestion/ contact
with eyes
Table 1. Some parasitic protozoa and waterborne route of transmission
Source: Modified from Smith & Lloyd (1997)
The methodology for the detection of Cryptosporidium oocysts and Giardia cysts in water is completely different from the traditionally used for quantification of faecal indicator bacteria in the water industry. The procedure consists of three stages: (i) sample collection and concentration, (ii) separation of (oo) cysts from contaminating debris, and (iii) detection of (oo) cysts.
In this research, water samples were collected from water treatment plants drawing raw water from the Nile River during spring 2010. The monitoring study was carried out in El Monofya Governorate including three cities, Qwisna, Birket El Sabaa and Shibeen El Koom. From each city, two water treatment stations were evaluated for its water quality in outlet and from the distribution system (DS). Water
samples of 20 L were collected from each station. Sodium thiosulfate (BDH Chemicals Ltd Poole England) was added to the chlorinated samples in a final concentration of 5 mg/L, to inactivate chlorine. Samples analysis looked for the presence of the protozoan parasites Giardia, Cryptosporidium, and Amoeba.
Physicochemical Analysis of Water
The following parameters were measured for all water samples: pH, turbidity, total suspended solids and residual chlorine concentration according to the Standard Methods (APHA, 2005).
Material and Methods
DOI number: 10.5027/jnrd.v2i0.03
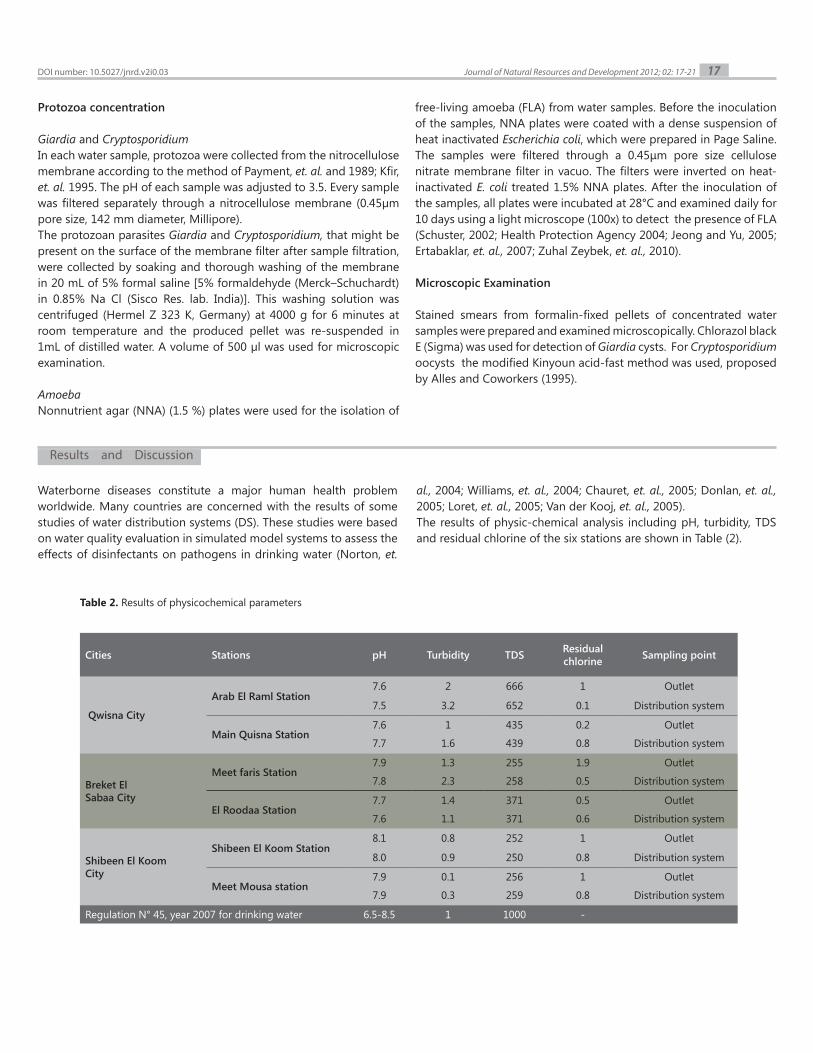
17Journal of Natural Resources and Development 2012; 02: 17-21
Protozoa concentration
Giardia and CryptosporidiumIn each water sample, protozoa were collected from the nitrocellulose membrane according to the method of Payment, et. al. and 1989; Kfir, et. al. 1995. The pH of each sample was adjusted to 3.5. Every sample was filtered separately through a nitrocellulose membrane (0.45µm pore size, 142 mm diameter, Millipore).The protozoan parasites Giardia and Cryptosporidium, that might be present on the surface of the membrane filter after sample filtration, were collected by soaking and thorough washing of the membrane in 20 mL of 5% formal saline [5% formaldehyde (Merck–Schuchardt) in 0.85% Na Cl (Sisco Res. lab. India)]. This washing solution was centrifuged (Hermel Z 323 K, Germany) at 4000 g for 6 minutes at room temperature and the produced pellet was re-suspended in 1mL of distilled water. A volume of 500 µl was used for microscopic examination.
AmoebaNonnutrient agar (NNA) (1.5 %) plates were used for the isolation of
free-living amoeba (FLA) from water samples. Before the inoculation of the samples, NNA plates were coated with a dense suspension of heat inactivated Escherichia coli, which were prepared in Page Saline. The samples were filtered through a 0.45μm pore size cellulose nitrate membrane filter in vacuo. The filters were inverted on heat-inactivated E. coli treated 1.5% NNA plates. After the inoculation of the samples, all plates were incubated at 28°C and examined daily for 10 days using a light microscope (100x) to detect the presence of FLA (Schuster, 2002; Health Protection Agency 2004; Jeong and Yu, 2005; Ertabaklar, et. al., 2007; Zuhal Zeybek, et. al., 2010).
Microscopic Examination
Stained smears from formalin-fixed pellets of concentrated water samples were prepared and examined microscopically. Chlorazol black E (Sigma) was used for detection of Giardia cysts. For Cryptosporidium oocysts the modified Kinyoun acid-fast method was used, proposed by Alles and Coworkers (1995).
Results and Discussion
Cities Stations pH Turbidity TDS Residual chlorine Sampling point
Qwisna City
Arab El Raml Station7.6 2 666 1 Outlet
7.5 3.2 652 0.1 Distribution system
Main Quisna Station7.6 1 435 0.2 Outlet
7.7 1.6 439 0.8 Distribution system
Breket El Sabaa City
Meet faris Station7.9 1.3 255 1.9 Outlet
7.8 2.3 258 0.5 Distribution system
El Roodaa Station7.7 1.4 371 0.5 Outlet
7.6 1.1 371 0.6 Distribution system
Shibeen El Koom City
Shibeen El Koom Station8.1 0.8 252 1 Outlet
8.0 0.9 250 0.8 Distribution system
Meet Mousa station7.9 0.1 256 1 Outlet
7.9 0.3 259 0.8 Distribution system
Regulation N° 45, year 2007 for drinking water 6.5-8.5 1 1000 -
Waterborne diseases constitute a major human health problem worldwide. Many countries are concerned with the results of some studies of water distribution systems (DS). These studies were based on water quality evaluation in simulated model systems to assess the effects of disinfectants on pathogens in drinking water (Norton, et.
al., 2004; Williams, et. al., 2004; Chauret, et. al., 2005; Donlan, et. al., 2005; Loret, et. al., 2005; Van der Kooj, et. al., 2005).The results of physic-chemical analysis including pH, turbidity, TDS and residual chlorine of the six stations are shown in Table (2).
Table 2. Results of physicochemical parameters
DOI number: 10.5027/jnrd.v2i0.03
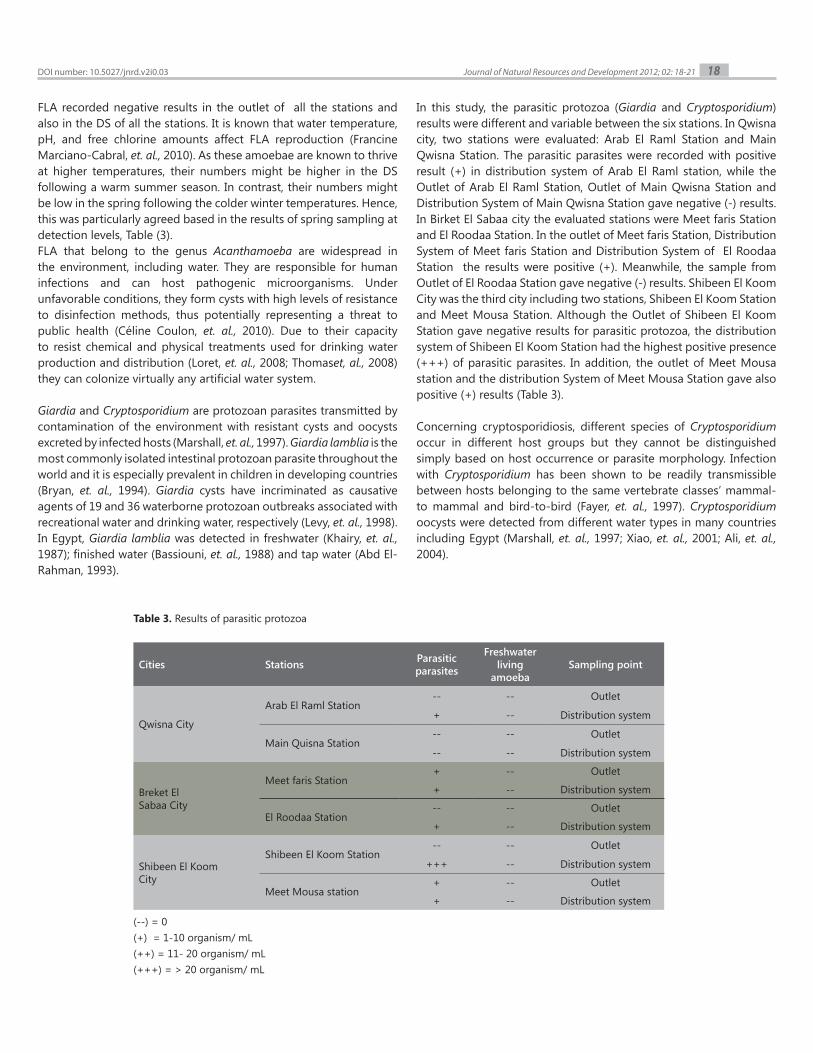
18Journal of Natural Resources and Development 2012; 02: 18-21
FLA recorded negative results in the outlet of all the stations and also in the DS of all the stations. It is known that water temperature, pH, and free chlorine amounts affect FLA reproduction (Francine Marciano-Cabral, et. al., 2010). As these amoebae are known to thrive at higher temperatures, their numbers might be higher in the DS following a warm summer season. In contrast, their numbers might be low in the spring following the colder winter temperatures. Hence, this was particularly agreed based in the results of spring sampling at detection levels, Table (3).FLA that belong to the genus Acanthamoeba are widespread in the environment, including water. They are responsible for human infections and can host pathogenic microorganisms. Under unfavorable conditions, they form cysts with high levels of resistance to disinfection methods, thus potentially representing a threat to public health (Céline Coulon, et. al., 2010). Due to their capacity to resist chemical and physical treatments used for drinking water production and distribution (Loret, et. al., 2008; Thomaset, al., 2008) they can colonize virtually any artificial water system.
Giardia and Cryptosporidium are protozoan parasites transmitted by contamination of the environment with resistant cysts and oocysts excreted by infected hosts (Marshall, et. al., 1997). Giardia lamblia is the most commonly isolated intestinal protozoan parasite throughout the world and it is especially prevalent in children in developing countries (Bryan, et. al., 1994). Giardia cysts have incriminated as causative agents of 19 and 36 waterborne protozoan outbreaks associated with recreational water and drinking water, respectively (Levy, et. al., 1998). In Egypt, Giardia lamblia was detected in freshwater (Khairy, et. al., 1987); finished water (Bassiouni, et. al., 1988) and tap water (Abd El-Rahman, 1993).
In this study, the parasitic protozoa (Giardia and Cryptosporidium) results were different and variable between the six stations. In Qwisna city, two stations were evaluated: Arab El Raml Station and Main Qwisna Station. The parasitic parasites were recorded with positive result (+) in distribution system of Arab El Raml station, while the Outlet of Arab El Raml Station, Outlet of Main Qwisna Station and Distribution System of Main Qwisna Station gave negative (-) results.In Birket El Sabaa city the evaluated stations were Meet faris Station and El Roodaa Station. In the outlet of Meet faris Station, Distribution System of Meet faris Station and Distribution System of El Roodaa Station the results were positive (+). Meanwhile, the sample from Outlet of El Roodaa Station gave negative (-) results. Shibeen El Koom City was the third city including two stations, Shibeen El Koom Station and Meet Mousa Station. Although the Outlet of Shibeen El Koom Station gave negative results for parasitic protozoa, the distribution system of Shibeen El Koom Station had the highest positive presence (+++) of parasitic parasites. In addition, the outlet of Meet Mousa station and the distribution System of Meet Mousa Station gave also positive (+) results (Table 3).
Concerning cryptosporidiosis, different species of Cryptosporidium occur in different host groups but they cannot be distinguished simply based on host occurrence or parasite morphology. Infection with Cryptosporidium has been shown to be readily transmissible between hosts belonging to the same vertebrate classes’ mammal-to mammal and bird-to-bird (Fayer, et. al., 1997). Cryptosporidium oocysts were detected from different water types in many countries including Egypt (Marshall, et. al., 1997; Xiao, et. al., 2001; Ali, et. al., 2004).
Cities Stations Parasitic parasites
Freshwater living
amoebaSampling point
Qwisna City
Arab El Raml Station-- -- Outlet
+ -- Distribution system
Main Quisna Station-- -- Outlet
-- -- Distribution system
Breket El Sabaa City
Meet faris Station+ -- Outlet
+ -- Distribution system
El Roodaa Station-- -- Outlet
+ -- Distribution system
Shibeen El Koom City
Shibeen El Koom Station-- -- Outlet
+++ -- Distribution system
Meet Mousa station+ -- Outlet
+ -- Distribution system
Table 3. Results of parasitic protozoa
(--) = 0(+) = 1-10 organism/ mL(++) = 11- 20 organism/ mL(+++) = > 20 organism/ mL
DOI number: 10.5027/jnrd.v2i0.03
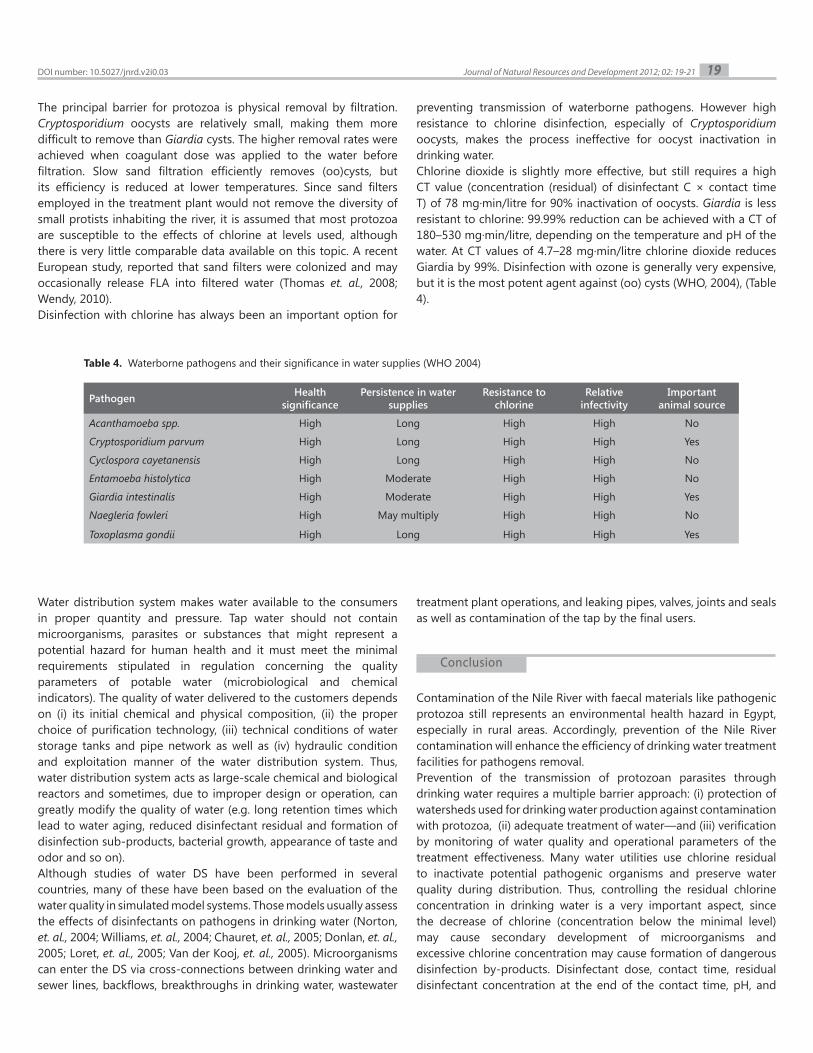
19Journal of Natural Resources and Development 2012; 02: 19-21
The principal barrier for protozoa is physical removal by filtration. Cryptosporidium oocysts are relatively small, making them more difficult to remove than Giardia cysts. The higher removal rates were achieved when coagulant dose was applied to the water before filtration. Slow sand filtration efficiently removes (oo)cysts, but its efficiency is reduced at lower temperatures. Since sand filters employed in the treatment plant would not remove the diversity of small protists inhabiting the river, it is assumed that most protozoa are susceptible to the effects of chlorine at levels used, although there is very little comparable data available on this topic. A recent European study, reported that sand filters were colonized and may occasionally release FLA into filtered water (Thomas et. al., 2008; Wendy, 2010).Disinfection with chlorine has always been an important option for
preventing transmission of waterborne pathogens. However high resistance to chlorine disinfection, especially of Cryptosporidium oocysts, makes the process ineffective for oocyst inactivation in drinking water. Chlorine dioxide is slightly more effective, but still requires a high CT value (concentration (residual) of disinfectant C × contact time T) of 78 mg·min/litre for 90% inactivation of oocysts. Giardia is less resistant to chlorine: 99.99% reduction can be achieved with a CT of 180–530 mg·min/litre, depending on the temperature and pH of the water. At CT values of 4.7–28 mg·min/litre chlorine dioxide reduces Giardia by 99%. Disinfection with ozone is generally very expensive, but it is the most potent agent against (oo) cysts (WHO, 2004), (Table 4).
Pathogen Health significance
Persistence in water supplies
Resistance to chlorine
Relative infectivity
Important animal source
Acanthamoeba spp. High Long High High No
Cryptosporidium parvum High Long High High Yes
Cyclospora cayetanensis High Long High High No
Entamoeba histolytica High Moderate High High No
Giardia intestinalis High Moderate High High Yes
Naegleria fowleri High May multiply High High No
Toxoplasma gondii High Long High High Yes
Table 4. Waterborne pathogens and their significance in water supplies (WHO 2004)
Water distribution system makes water available to the consumers in proper quantity and pressure. Tap water should not contain microorganisms, parasites or substances that might represent a potential hazard for human health and it must meet the minimal requirements stipulated in regulation concerning the quality parameters of potable water (microbiological and chemical indicators). The quality of water delivered to the customers depends on (i) its initial chemical and physical composition, (ii) the proper choice of purification technology, (iii) technical conditions of water storage tanks and pipe network as well as (iv) hydraulic condition and exploitation manner of the water distribution system. Thus, water distribution system acts as large-scale chemical and biological reactors and sometimes, due to improper design or operation, can greatly modify the quality of water (e.g. long retention times which lead to water aging, reduced disinfectant residual and formation of disinfection sub-products, bacterial growth, appearance of taste and odor and so on). Although studies of water DS have been performed in several countries, many of these have been based on the evaluation of the water quality in simulated model systems. Those models usually assess the effects of disinfectants on pathogens in drinking water (Norton, et. al., 2004; Williams, et. al., 2004; Chauret, et. al., 2005; Donlan, et. al., 2005; Loret, et. al., 2005; Van der Kooj, et. al., 2005). Microorganisms can enter the DS via cross-connections between drinking water and sewer lines, backflows, breakthroughs in drinking water, wastewater
treatment plant operations, and leaking pipes, valves, joints and seals as well as contamination of the tap by the final users.
Contamination of the Nile River with faecal materials like pathogenic protozoa still represents an environmental health hazard in Egypt, especially in rural areas. Accordingly, prevention of the Nile River contamination will enhance the efficiency of drinking water treatment facilities for pathogens removal.Prevention of the transmission of protozoan parasites through drinking water requires a multiple barrier approach: (i) protection of watersheds used for drinking water production against contamination with protozoa, (ii) adequate treatment of water—and (iii) verification by monitoring of water quality and operational parameters of the treatment effectiveness. Many water utilities use chlorine residual to inactivate potential pathogenic organisms and preserve water quality during distribution. Thus, controlling the residual chlorine concentration in drinking water is a very important aspect, since the decrease of chlorine (concentration below the minimal level) may cause secondary development of microorganisms and excessive chlorine concentration may cause formation of dangerous disinfection by-products. Disinfectant dose, contact time, residual disinfectant concentration at the end of the contact time, pH, and
Conclusion
DOI number: 10.5027/jnrd.v2i0.03
20Journal of Natural Resources and Development 2012; 02: 20 -21
temperature are commonly used to monitor the performance of disinfection processes. The most critical conditions for disinfection processes are low temperatures and high turbidity in the water to be treated.Finally, the positive results in outlets samples may be due to failure of sand filters stage to remove pathogenic organisms, or the chlorine concentration was below the minimal level. In case of positive results in distribution system, this can be attributed to leaking pipes, valves, joints and seals, as well as contamination of the tap by the final users.
One of the most important aspects of watershed protection is the recognition of local sources of contamination with parasitic protozoa and the control of that contamination by diversion or treatment of discharges and reduction of direct input of faeces, especially in otherwise pristine waters, by people, farm animals, and wildlife or from manure storage. In addition, emphases on the application of quality control standards in drinking water purification plants, and periodic follow-up for its quality.
Abd El-Rahman, R.H., 1993. Occurrence of Cryptosporidium and Giardia lambliain some
water bodies and sources. Ph. D. thesis, High Institute of Public Health, Alexandria
University, Egypt.
Akın Z, Saygı G. Çevreden izole ettiğimiz 2003. Acanthamoeba ve Naegleria türleri
üzerinde çalışmalar. Türk Parazitol Derg 27: 117-121, 2003.
Ali, M.A., Al-Herrawyb, A.Z., El-Hawaary, S.E. 2004. Detection of enteric viruses, Giardia
and Cryptosporidium in two different types of drinking water treatment facilities.
Water Research 38 (2004) 3931–3939
Alles, A.J., Waldron, L.S., Sierra, A.R., Mattia, A.R., 1995. Prospective comparison of direct
immunofluorescence and conventional staining methods for detection of Giardia
and Cryptosporidium spp. in human fecal specimens. J. Clin. Microbiol. 33, 1632–
1634.
Anon, 1996. Giardia and Cryptosporidium in drinking water. It is Your Health information
sheet. Health Canada, Ottawa.
APHA, 1998. Standard Methods for Examination of Water and Wastewater, 19th ed.
American Public Health Association, Washington, DC.
American Public Health Association Standard Methods for the Examination of Water and
Wastewater, 21th ed., American Public Health Association Inc., New York, N.Y.
Barbara G. Lucas. 1997. Field Methods for Giardia and Cryptosporidium Sample
Collection. In partial fulfillment of the requirements of the Biology Co-op Program
University of Victoria Summer 1997.
Bassiouni, H.K., Saad, L.M., El-Sharkawi, F.M., El-Sebaie, O.D., 1988. Isolation of viable
and infective Giardia lamblia cysts from drinking water. Bull. High Institute of Public
Health 18, 479–510.
Bryan, R.T., Pinner, R.W., Berkelman, R.L., 1994. Emerging infectious diseases in the United
States. Ann. New York Acad. Sci. 740, 346–361.
Céline Coulon, Anne Collignon, Gerald McDonnell and Vincent Thomas 2010. Resistance
of Acanthamoeba Cysts to Disinfection Treatments Used in Health Care Settings.
American Society for Microbiology.
Chauret, C., Volk, C., Stover, L., Dykstra, T. S., Andrews, R. C. & Gagnon, G. A. 2005. Effect of
disinfectants on microbial ecology in model distribution systems. J. Water Health 4,
359–369.
Daft BM, Visvesvara GS, Read DH, Kinde H, Uzal FA, Manzer MD 2005. Seasonal
meningoencephalitis in Holstein cattle caused by Naegleria fowleri. J Vet Diagn
Invest 17:605–609
Dilara Meryem BURAK and Zuhal ZEYBEK 2011. Investigation of Legionella pneumophila
and free-living amoebas in the domestic hot water systems in İstanbul. Turk J Biol
35 (2011) 679-685.
Donlan, R. M., Forster, T., Murga, R., Brown, E., Lucas, C., Carpenter, J. & Fields, B. 2005.
Legionella pneumophila associated with the protozoan Hartmannella vermiformis in
a model multi-species biofilm has reduced susceptibility to disinfectants. Biofouling
21, 1–7.
Ertabaklar, H., Türk M., Dayanir, V., Ertuğ, S. and Walochnik, J. 2007. Acanthamoeba
keratitis due to Acanthamoeba genotype T4 in a non-contact-lens wearer in Turkey.
Parasitology research, 100: 241–246.
Fayer, R., Speer, C.A., Dubey, J.P., 1997. General biology of Cryptosporidium. In: Fayer, R.
(Ed.), Cryptosporidium and Cryptosporidiosis. CRC Press, Boca Raton, FL, pp. 1–42.
Fields SB, Benson FB, Besser RE 2002. Legionella and legionnaires’ disease: 25 years of
investigation. Clin Microb Rev 15: 506-526, 2002.
Francine Marciano-Cabral, Melissa Jamerson and Edna S. Kaneshiro 2010. Free-living
amoebae, Legionella and Mycobacterium in tap water supplied by a municipal
drinking water utility in the USA. Journal of Water and Health, 08.1, 2010
Health Protection Agency. 2004. Isolation and identification of Acanthamoeba species.
National Standard Method, 17(2):1-12.
Hibler, C.P., Hancock, C.M., 1990. Waterborne giardiasis. In: Mc Feters, G.A. (Ed.),
Drinking Water Microbiology. Springer, New York, pp. 294–321.
Hijnen WAM, 1997. Spores of sulphite reducing clostridia: a surrogate parameter for
assessing the effects of water treatment processes on protozoan (oo) cysts? In:
Fricker CR, Clancy JL, Rochelle PA, eds. Proceedings of the International Symposium
on Waterborne Cryptosporidium, March 1997, Newport Beach, CA, USA. Denver, CO,
American Water Works Association: 115–126.
Hoffmann, R., and R. Michel. 2001. Distribution of free-living amoebae (FLA) during
preparation and supply of drinking water. Int. J. Hyg. Environ. Health 203:215-219.
Jeong, H.J. and Yu, H.S. 2005. The role of domestic tap water in Acanthamoeba
contamination in contact lens storage cases in Korea. The Korean Journal of
Parasitology, 43(2): 47-50.
Jonas Behets & Priscilla Declerck & Yasmine Delaedt & Lieve Verelst & Frans Ollevier
2007. Survey for the presence of specific free-living amoebae in cooling waters from
Belgian power plants. Parasitol Res (2007) 100:1249–1256.
Kfir, R., Hilner, C., du Preez, M., Bateman, B., 1995. Studies evaluating the applicability of
utilizing the same concentration techniques for the detection of protozoan parasites
and viruses in water. Water Sci. Technol. 417–423.
Khairy, A., Hassan, E., Abd El-Aal, N., 1987. The role of rural drinking water in transmission
of intestinal protozoal infection in Khorshed village. Part I: Water and domestic water
sources. Tanta Med. J. 15, 785–800.
Kilvington, S., T. Gray, J. Dart, N. Morlet, J. R. Beeching, D. G. Frazer, and M. Matheson.
2004. Acanthamoeba keratitis: the role of domestic tap water contamination in the
United Kingdom. Invest. Ophthalmol. Vis. Sci. 45:165-169.
Levy, D.A., Bens, M.S., Craun, G.F., Calderon, R.L., Herwaldt, B.L., 1998. Surveillance for
waterborne-disease outbreaks. United States, 1995–1996. Mor. Mortal. Wkly. Rep.
CDC-Surveill-Summ 47, 1–34.
Loret, J. F., Robert, S., Thomas, V., Cooper, A. J., McCoy, W. F. and Levi, Y. 2005. Comparison
of disinfectants for biofilm, protozoa and Legionella control. J. Water Health 34,
423–433.
Loret, J. F., M. Jousset, S. Robert, C. Anselme, G. Saucedo, F. Ribas, A. Martinez, and V.
Catalan. 2008. Elimination of free-living amoebae by drinking water treatment
processes. Eur. J. Water Quality 39:37-50.
Recomendations
References
DOI number: 10.5027/jnrd.v2i0.03
21Journal of Natural Resources and Development 2012; 02: 21-21
Marshall, M.M., Naumovitz, D., Ortega, Y., Sterling, C.R., 1997. Waterborne protozoan
pathogens. Clin. Microbiol. Rev. 10, 67–85.
Norton, C. D., Le Chevallier, M. W. and Falkinham, J. O., III 2004. Survival of Mycobacterium
avium in a model distribution system. Water Res. 38, 1457–1466.
Panagiotis Karanis, Christina Kourenti and Huw Smith 2007. Waterborne transmission of
protozoan parasites: A worldwide review of outbreaks and lessons learnt. Journal of
Water and Health, 05.1, 2007.
Payment, P., Berube, A., Perrcault, D., Armon, R., Trudel, M., 1989. Concentration of Giardia
lamblia cysts, Legionella pneumophila, Clostridium perfringens, human enteric
viruses and coliphages from large volumes of drinking water using a single filtration.
Can. J. Microbiol. 35, 932–935.
Rodriguez-Zaragoza, S. 1994. Ecology of free-living amoebae. Crit. Rev. Microbiol.
20:225-241.
Rose, J.B., 1990. The occurrence and control of Cryptosporidium. In: Mc Feters, G.A. (Ed.),
Drinking Water Microbiology. Springer, New York, pp. 294–321.
Schuster, F.L. 2002. Cultivation of Pathogenic and Opportunistic Free-Living Amoebas.
Clinical Microbiology Reviews, 15(3): 342–354.
Schuster FL, Visvesvara GS 2004. Free-living amoebae as opportunistic and non-
opportunistic pathogens of humans and animals. Int J Parasitol 34:1001–1027
Smith, H. V. & Lloyd, A. 1997. Protozoan parasites in drinking water: a UK perspective.
New World Water 1, 109–116.
Thomas, V., K. Herrera-Rimann, D. S. Blanc, and G. Greub. 2006. Biodiversity of amoebae
and amoebae-resisting bacteria in a hospital water network. Appl. Environ. Microbiol.
72:2428-2438.
Thomas, V., J. F. Loret, M. Jousset, and G. Greub. 2008. Biodiversity of amoebae and
amoebae-resisting bacteria in a drinking water treatment plant. Environ. Microbiol.
10:2728-2745.
Thurston-Enriquez, J.A., Watt, P., Dowd, S.E., Enriquez, R., Pepper, I.L., Gerba, C.P., 2002.
Detection of protozoan parasites and microsporidia in irrigation waters used for
crop production. J. Food Prot. 65, 378–382.
Van der Kooj, D., Veenendaal, H. R. & Scheffer, W. J. H. 2005. Biofilm formation and
multiplication of Legionella in a model warm water system with pipes of cooper,
stainless steel, and cross-linked polyethylene. Water Res. 39, 2789–2798.
Wendy C. TrzynA1, Margaret W. MbUgUA, Andrew roger Son 2010. Acanthamoeba in the
Domestic Water Supply of Huntington, West Virginia, U.S.A. Acta Protozool. (2010)
49: 9–15.
Whitmore TN 1994. Rapid techniques for the recovery of Cryptosporidium. In: Betts WB
et. al., eds. Protozoan parasites and water. Cambridge, Royal Society of Chemistry:
139–142.
WHO 2004. Guidelines for Drinking-water Quality 2004 (third Ed.). Geneva: World Health
Organisation. Available at: www.who.int/water_sanitation_health/dwq/gdwq3/en/
print.html (Also available as a pdf document)
Williams, M. M., Domingo, J. W. S., Meckes, M. C., Kelty, C. A. & Rochon, H. S. 2004.
Phylogenetic diversity of drinking water bacteria in a distribution system simulator.
J. Appl. Microbiol. 96, 954–964.
Xiao, L., Singh, A., Limor, J., Graczyk, T.K., Gradus, S., Lal, A., 2001. Molecular characterization
of Cryptosporidium oocysts in samples of raw surface water and wastewater.
Appl. Environ. Microbiol. 67, 1097–1101.
Zuhal Zeybek, Miray Üstüntürk, Ali Rıza Binay 2010. Morphological Characteristics and
Growth Abilities of Free Living Amoeba Isolated From Domestic Tap Water Samples
in İstanbul. IUFS J Biol 2010, 69(1): 17-23
DOI number: 10.5027/jnrd.v2i0.03
JOURNAL OF NATURAL RESOURCES AND DEVELOPMENT
Sustainabilty- cliché in conservation circlesDeeraj Koul
Masters in Ecology and Environment from the Sikkim Manipal University of Medical and Technological Sciences, India.
A lot is being talked about the sustainable environment in Himalayas and its management these days. There is no doubt that it is getting affected. But how do we manage it? On this point is the question mark. Previous efforts have yielded little and attempt to improve other services, like infrastructure, agriculture, irrigation, water supply and to large extent man’s greed to make a few quick bucks fast, have seriously impacted the environment in Himalayas. So what is the way out? Sustainable environment or is it? The torch bearers for sustainability have to be conservationist, and more important, conservation organizations which get huge sums of money for the projects’ sustainability so that it runs on its own long after the project is over. Unfortunately, the word “sustainability” has become a fad these days. Almost all conservation projects talk about sustainability without knowing how to make conservation projects sustainable in reality.
If we look at various projects like; joint forest management, medicinal plants conservation, biodiversity conservation, cold desert development, pasture land development, social forestry and all other conservation projects, most of them are made to look sustainable till the funds keep flowing in and once the project gets over and funds dry up, sustainability also dries up as if it was affected by a severe drought or washed away by a powerful tsunami. Some conservationists contend that the sustainability of the project is time specific, and the project had achieved its target when it was running actively and they are not concerned about it once the project gets over. But is it the power of sustainability or money flow that keeps the project running? Doesn’t sustainability mean long-lasting or is the word directly proportional to money flow?Alas! What became of the word “sustainability” which was splashed all over the pages when the project proposals were made and highlighted in a big way while submitting the project? Was it then misinterpreted or is it a word too big that anything and everything can hide behind it?Actually, at the end - a smart person knows what to highlight and what to hide, camouflaging the small achievements as big and juggling with data. The final outcome is a crisp report with all the achievements declaring that overall goals of the project have been met and a few lessons learnt.
Now, is any organization ready to open the can of worms of current sustainability of their previous projects? Has there been any assessment of the post impact of the project, let´s say after 2 or 3 years after the project was completed to know whether the sustainability is still there or has fizzled out? Mostly no, because organizations don’t get money to do assessment of projects long completed. They only get money for new projects, also no organization wants to count its failures as they might dent their standing position and maybe prospectus to get future projects can also damp. So it is time to write a new project proposal, involving high-caliber project proposal writers, having vast experience in writing good proposals, masters in splashing it with high- falutin words, some fancy ideas which can be made to look innovative but that have loose bonding with real goals and sustainability.
Cheers
Journal of Natural Resources and Development 2012; 02: 22 22
Commentary
DOI number: 10.5027/jnrd.v2i0.04
JOURNAL OF NATURAL RESOURCES AND DEVELOPMENT
Response on Sustainabilty- cliché in conservation circles Hartmut Gaese
Professor, Doctor in Land Use System Research. Institute for Technology and Resources Management in the Tropics and Subtropics. Cologne University of Applied Sciences. Germany.
The Word “sustainability” has become a fad these days – tells Deeraj Koul in his comment “Sustainability – cliché in conservation circles”: Fads and fashions are like Bird Flu – Virus, spreading out over our globe like powerful waves occupying thinking and mental activity – nobody is absolutely resistant. Fads create mainstreams and mainstream opinions dominating disputations and very often creating schism and discrimination in minds and opinions: Differing opinions from mainstream are seen as abnormal or anomalous – anomalous representatives do not respect the mainstream verity – like heretics who don’t acknowledge the dogma.
Deeraj Koul puts his finger into another ragged wound and asks: “Doesn’t sustainability mean long-lasting or is the word directly proportional to money flow?” He refers to the phenomenon that the sustainability-virus meanwhile has occupied the thinking of people in institutions responsible for financing projects in the area of “natural resources and development” – this causes the proportionality of sustainability and money flow. If your project approach is sustainable one is “absolved”! Payments for “Ecosystem Services” or ”Clean Development Mechanism” are examples for flashfloods for money flows financing thousands of NGO in the name of sustainability causing distortions and biases like every subsidy. Our predictors say that this will save our world.
On the other hand it is a scientific requirement to study how to manage scarce natural resources following a long-lasting concept over generations – having in mind the still growing world population and already degraded and destructed natural resources – this is a matter of fact! It is a matter of labelling, doing good while following fashion: Given that we consider the resources-flows on behalf of nature “ecosystem services” and that we acknowledge the flows of “ecosystem services” as the “dividend” or “benefit” that society receives from natural capital (TEEB-Synthetic Report 2009), then we can try to quantify the benefits that nature provides for society and so far quantify losses or deficits of resources flows. Most of these natural services do not have explicit prices because they are not traded in open markets.
Furthermore it is a scientific requirement to study how ecosystems could be managed with a constructive intervention, if they are in degradation because of increasing utilization due to population growth and growth of demand for resources. If we accept that ecosystems have to have a “balance of flow” we have to know the needs for maintaining that balance of flow – because we know the permanent need for energy input into that systems. For sure: the density of world population in comparison with that one in the Neolithicum is thousandfold higher and the energy-consumption is hundredfold higher today. Ecosystem services were reduced in that time – but simultaneously increased the ability of humans to dominate negative externalities through technology and management.
Journal of Natural Resources and Development 2012; 02: 23-24 23
Commentary
DOI number: 10.5027/jnrd.v2i0.05

Journal of Natural Resources and Development 2012; 02: 23-24 24
The two basic laws of thermodynamics and the entropy give us the “highway guide rails” for a resources management following a concept of a “long-lasting-view” (fashionable word is “sustainability”) assuming that the state of dynamic equilibrium should have a minimum of entropy production. The material balance principle (equation) is: A= B+C+D; where B+C+D represents the discharge flows to the environment. An ecosystem consumes the less energy the nearer the system is to the balance (or “equilibrium flow). If we have then sufficient energy we can realize all kind of resource use (for food production, bio energy etc.). That clarifies the importance of energy policy.
It is a matter of labelling, doing good while following fashion: When these believes enter into cerebral mechanism of civil servants responsible for assessment of project and research proposals things will happen as described by Deeraj Koul: The word “sustainability” is directly proportional to money flow (Augustinus in “Sermo”: Ubi defecerit ratio, ibi est fidei aedificatio!!). Even university students very often expect to hear from professors mainstream opinions and they are less amused about sceptical and critical sentences. Historically we know this phenomenon from religious wars.
Even so it is a necessity for scientists preparing proposal for projects to incorporate analytical methods for long lasting views into the future – to develop keen prospective how to feed the world population with scarce resources in an already wounded nature which always will respond persistently (“naturam expelles furca, tamen usque recurret” – Horaz). So let us continue to quarrel about notions and ideas!
DOI number: 10.5027/jnrd.v2i0.05
JOURNAL OF NATURAL RESOURCES AND DEVELOPMENT
Saline water intrusion toward groundwater: Issues and its controlPurnama S a * , Marfai M A a.
a Faculty of Geography, Gadjah Mada University, Yogyakarta, Indonesia
* Corresponding author : [email protected]
Article history Abstract
Received 03.07.2012Accepted 14.09.2012Published 05.10.2012
Nowadays, saline water pollution has been gaining its importance as the major issue around the world, especially in the urban coastal area. Saline water pollution has major impact on human life and livelihood. It´s mainly a result from static fossil water and the dynamics of sea water intrusion.. The problem of saline water pollution caused by seawater intrusion has been increasing since the beginning of urban population. The problem of sea water intrusion in the urban coastal area must be anticipated as soon as possible especially in the urban areas developed in coastal zones,. This review article aims to; (i) analyze the distribution of saline water pollution on urban coastal area in Indonesia and (ii) analyze some methods in controlling saline water pollution, especially due to seawater intrusion in urban coastal area. The strength and weakness of each method have been compared, including (a) applying different pumping patterns, (b) artificial recharge, (c) extraction barrier, (d) injection barrier and (e) subsurface barrier. The best method has been selected considering its possible development in coastal areas of developing countries. The review is based considering the location of Semarang coastal area, Indonesia. The results have shown that artificial recharge and extraction barrier are the most suitable methods to be applied in the area.
GroundwaterSaline water pollutionSeawater intrusion control
Introduction
Water has an important role for human life and livelihood. Unfortunately water in the term of quality and quantity is getting worse over the time. The issues related to water quality and quantity have been increasing all over the world, including saline water pollution. Therefore, problems related to saline water pollution (as seawater intrusion) have become a crucial issue for the communities (Obikoya and Bennel 2010). The three major sources of fresh water are rainwater, surface water (rivers, lakes, and swamps) and groundwater. From these, the groundwater is the main contributor to our lives as source of drinking water. The usage of groundwater in human lives and other organisms on Earth is supported by its bigger availability compared to other sources. From all fresh water found on Earth (not including the ice in the polar region) 96% is groundwater (Todd and
Mays 2005). Therefore, only four percent remains in reservoirs, lakes, rivers and as water vapor in the air. The abundance of groundwater represents its function as the major source of fresh water to fulfill the human population need. Unfortunately, the effect of human activities toward groundwater results in groundwater contamination, changing the chemical composition of water. Saline water pollution is one type of groundwater contamination. It´s mostly caused by human activities. In coastal areas the cases of saline water pollution are dominated by seawater intrusion. Seawater intrusion occurred in urban coastal areas is caused especially by groundwater over pumping. In Indonesia groundwater over pumping led not only to seawater intrusion, but also to land subsidence (Marfai and King 2007; Marfai and King 2008a; Marfai and King 2008b; Marfai
Journal of Natural Resources and Development 2012; 02: 25-32 25
Keywords
DOI number: 10.5027/jnrd.v2i0.06
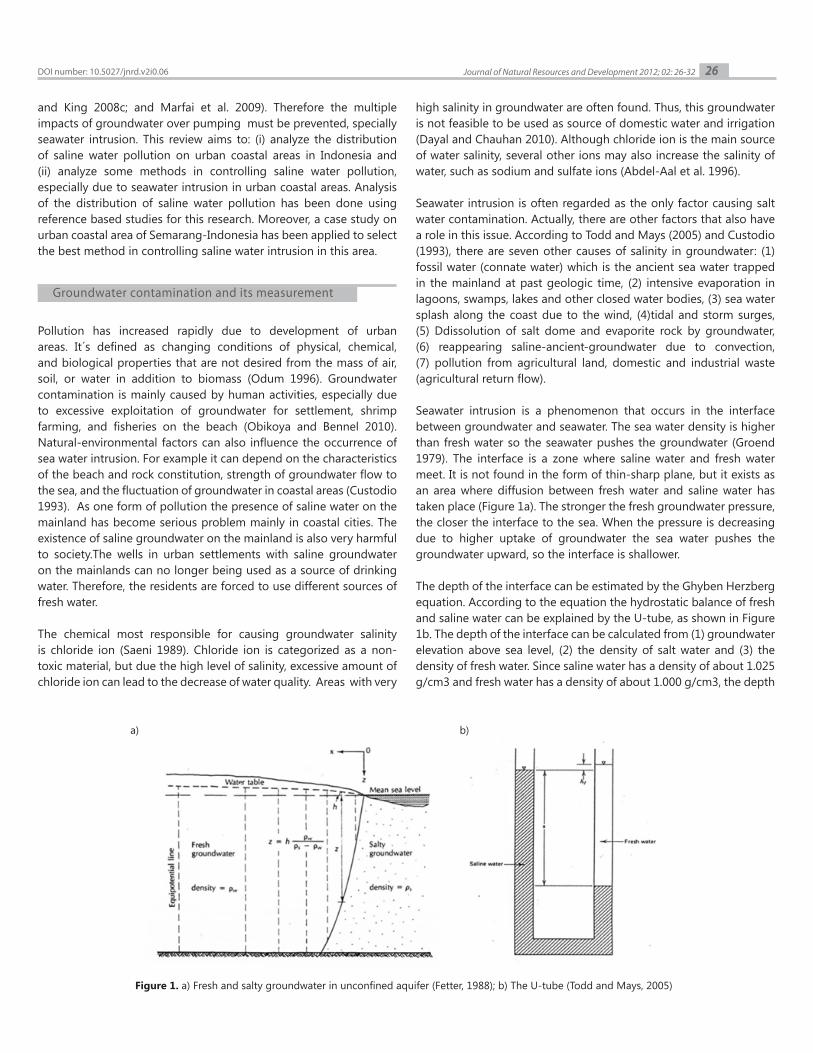
26Journal of Natural Resources and Development 2012; 02: 26-32
and King 2008c; and Marfai et al. 2009). Therefore the multiple impacts of groundwater over pumping must be prevented, specially seawater intrusion. This review aims to: (i) analyze the distribution of saline water pollution on urban coastal areas in Indonesia and (ii) analyze some methods in controlling saline water pollution, especially due to seawater intrusion in urban coastal areas. Analysis of the distribution of saline water pollution has been done using reference based studies for this research. Moreover, a case study on urban coastal area of Semarang-Indonesia has been applied to select the best method in controlling saline water intrusion in this area.
Pollution has increased rapidly due to development of urban areas. It´s defined as changing conditions of physical, chemical, and biological properties that are not desired from the mass of air, soil, or water in addition to biomass (Odum 1996). Groundwater contamination is mainly caused by human activities, especially due to excessive exploitation of groundwater for settlement, shrimp farming, and fisheries on the beach (Obikoya and Bennel 2010). Natural-environmental factors can also influence the occurrence of sea water intrusion. For example it can depend on the characteristics of the beach and rock constitution, strength of groundwater flow to the sea, and the fluctuation of groundwater in coastal areas (Custodio 1993). As one form of pollution the presence of saline water on the mainland has become serious problem mainly in coastal cities. The existence of saline groundwater on the mainland is also very harmful to society.The wells in urban settlements with saline groundwater on the mainlands can no longer being used as a source of drinking water. Therefore, the residents are forced to use different sources of fresh water.
The chemical most responsible for causing groundwater salinity is chloride ion (Saeni 1989). Chloride ion is categorized as a non-toxic material, but due the high level of salinity, excessive amount of chloride ion can lead to the decrease of water quality. Areas with very
high salinity in groundwater are often found. Thus, this groundwater is not feasible to be used as source of domestic water and irrigation (Dayal and Chauhan 2010). Although chloride ion is the main source of water salinity, several other ions may also increase the salinity of water, such as sodium and sulfate ions (Abdel-Aal et al. 1996).
Seawater intrusion is often regarded as the only factor causing salt water contamination. Actually, there are other factors that also have a role in this issue. According to Todd and Mays (2005) and Custodio (1993), there are seven other causes of salinity in groundwater: (1) fossil water (connate water) which is the ancient sea water trapped in the mainland at past geologic time, (2) intensive evaporation in lagoons, swamps, lakes and other closed water bodies, (3) sea water splash along the coast due to the wind, (4)tidal and storm surges, (5) Ddissolution of salt dome and evaporite rock by groundwater, (6) reappearing saline-ancient-groundwater due to convection, (7) pollution from agricultural land, domestic and industrial waste (agricultural return flow).
Seawater intrusion is a phenomenon that occurs in the interface between groundwater and seawater. The sea water density is higher than fresh water so the seawater pushes the groundwater (Groend 1979). The interface is a zone where saline water and fresh water meet. It is not found in the form of thin-sharp plane, but it exists as an area where diffusion between fresh water and saline water has taken place (Figure 1a). The stronger the fresh groundwater pressure, the closer the interface to the sea. When the pressure is decreasing due to higher uptake of groundwater the sea water pushes the groundwater upward, so the interface is shallower.
The depth of the interface can be estimated by the Ghyben Herzberg equation. According to the equation the hydrostatic balance of fresh and saline water can be explained by the U-tube, as shown in Figure 1b. The depth of the interface can be calculated from (1) groundwater elevation above sea level, (2) the density of salt water and (3) the density of fresh water. Since saline water has a density of about 1.025 g/cm3 and fresh water has a density of about 1.000 g/cm3, the depth
Figure 1. a) Fresh and salty groundwater in unconfined aquifer (Fetter, 1988); b) The U-tube (Todd and Mays, 2005)
a) b)
Groundwater contamination and its measurement
DOI number: 10.5027/jnrd.v2i0.06
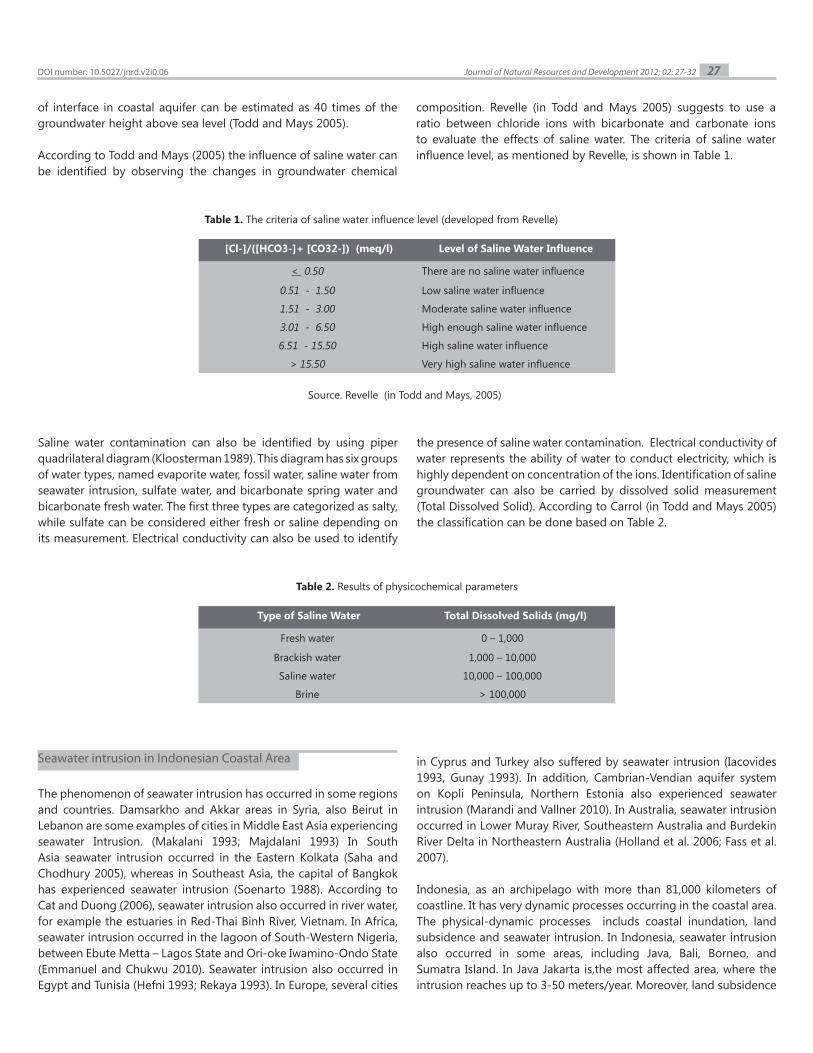
27Journal of Natural Resources and Development 2012; 02: 27-32
Saline water contamination can also be identified by using piper quadrilateral diagram (Kloosterman 1989). This diagram has six groups of water types, named evaporite water, fossil water, saline water from seawater intrusion, sulfate water, and bicarbonate spring water and bicarbonate fresh water. The first three types are categorized as salty, while sulfate can be considered either fresh or saline depending on its measurement. Electrical conductivity can also be used to identify
the presence of saline water contamination. Electrical conductivity of water represents the ability of water to conduct electricity, which is highly dependent on concentration of the ions. Identification of saline groundwater can also be carried by dissolved solid measurement (Total Dissolved Solid). According to Carrol (in Todd and Mays 2005) the classification can be done based on Table 2.
Table 2. Results of physicochemical parameters
of interface in coastal aquifer can be estimated as 40 times of the groundwater height above sea level (Todd and Mays 2005).
According to Todd and Mays (2005) the influence of saline water can be identified by observing the changes in groundwater chemical
composition. Revelle (in Todd and Mays 2005) suggests to use a ratio between chloride ions with bicarbonate and carbonate ions to evaluate the effects of saline water. The criteria of saline water influence level, as mentioned by Revelle, is shown in Table 1.
[Cl-]/([HCO3-]+ [CO32-]) (meq/l) Level of Saline Water Influence
< 0.50 There are no saline water influence
0.51 - 1.50 Low saline water influence
1.51 - 3.00 Moderate saline water influence
3.01 - 6.50 High enough saline water influence
6.51 - 15.50 High saline water influence
> 15.50 Very high saline water influence
Source. Revelle (in Todd and Mays, 2005)
Table 1. The criteria of saline water influence level (developed from Revelle)
Type of Saline Water Total Dissolved Solids (mg/l)
Fresh water 0 – 1,000
Brackish water 1,000 – 10,000
Saline water 10,000 – 100,000
Brine > 100,000
The phenomenon of seawater intrusion has occurred in some regions and countries. Damsarkho and Akkar areas in Syria, also Beirut in Lebanon are some examples of cities in Middle East Asia experiencing seawater Intrusion. (Makalani 1993; Majdalani 1993) In South Asia seawater intrusion occurred in the Eastern Kolkata (Saha and Chodhury 2005), whereas in Southeast Asia, the capital of Bangkok has experienced seawater intrusion (Soenarto 1988). According to Cat and Duong (2006), seawater intrusion also occurred in river water, for example the estuaries in Red-Thai Binh River, Vietnam. In Africa, seawater intrusion occurred in the lagoon of South-Western Nigeria, between Ebute Metta – Lagos State and Ori-oke Iwamino-Ondo State (Emmanuel and Chukwu 2010). Seawater intrusion also occurred in Egypt and Tunisia (Hefni 1993; Rekaya 1993). In Europe, several cities
in Cyprus and Turkey also suffered by seawater intrusion (Iacovides 1993, Gunay 1993). In addition, Cambrian-Vendian aquifer system on Kopli Peninsula, Northern Estonia also experienced seawater intrusion (Marandi and Vallner 2010). In Australia, seawater intrusion occurred in Lower Muray River, Southeastern Australia and Burdekin River Delta in Northeastern Australia (Holland et al. 2006; Fass et al. 2007).
Indonesia, as an archipelago with more than 81,000 kilometers of coastline. It has very dynamic processes occurring in the coastal area. The physical-dynamic processes includs coastal inundation, land subsidence and seawater intrusion. In Indonesia, seawater intrusion also occurred in some areas, including Java, Bali, Borneo, and Sumatra Island. In Java Jakarta is,the most affected area, where the intrusion reaches up to 3-50 meters/year. Moreover, land subsidence
Seawater intrusion in Indonesian Coastal Area
DOI number: 10.5027/jnrd.v2i0.06
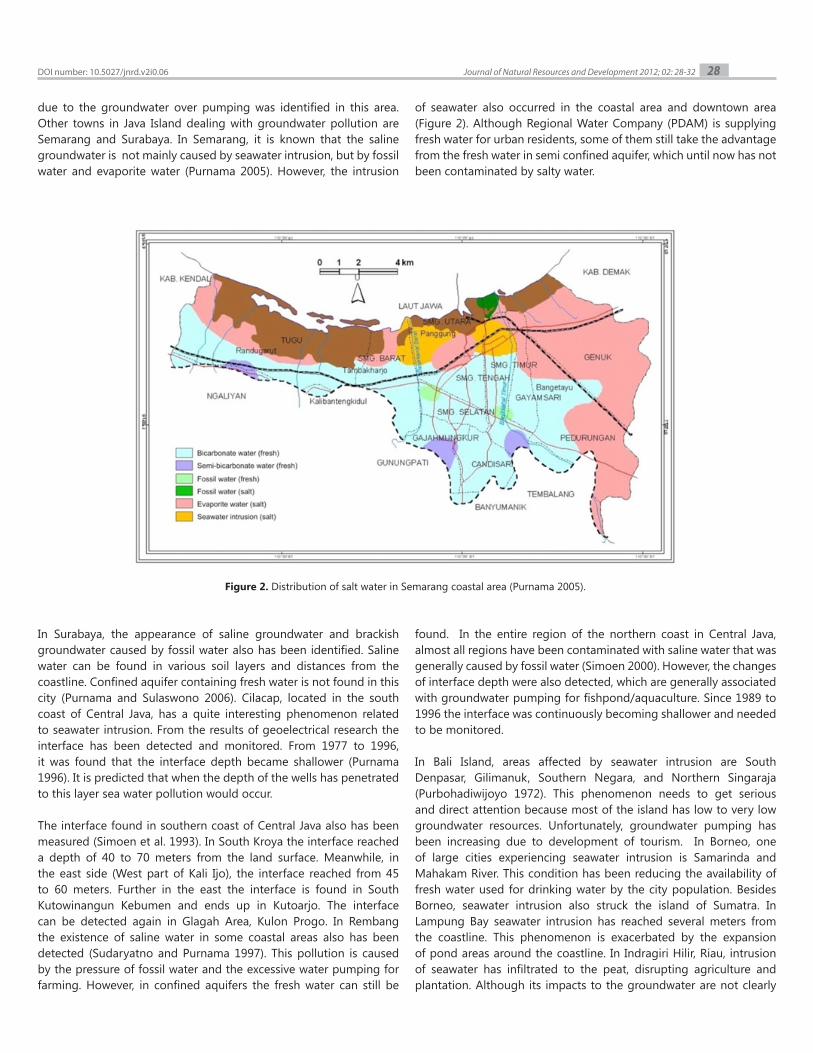
28Journal of Natural Resources and Development 2012; 02: 28-32
due to the groundwater over pumping was identified in this area. Other towns in Java Island dealing with groundwater pollution are Semarang and Surabaya. In Semarang, it is known that the saline groundwater is not mainly caused by seawater intrusion, but by fossil water and evaporite water (Purnama 2005). However, the intrusion
of seawater also occurred in the coastal area and downtown area (Figure 2). Although Regional Water Company (PDAM) is supplying fresh water for urban residents, some of them still take the advantage from the fresh water in semi confined aquifer, which until now has not been contaminated by salty water.
Figure 2. Distribution of salt water in Semarang coastal area (Purnama 2005).
In Surabaya, the appearance of saline groundwater and brackish groundwater caused by fossil water also has been identified. Saline water can be found in various soil layers and distances from the coastline. Confined aquifer containing fresh water is not found in this city (Purnama and Sulaswono 2006). Cilacap, located in the south coast of Central Java, has a quite interesting phenomenon related to seawater intrusion. From the results of geoelectrical research the interface has been detected and monitored. From 1977 to 1996, it was found that the interface depth became shallower (Purnama 1996). It is predicted that when the depth of the wells has penetrated to this layer sea water pollution would occur.
The interface found in southern coast of Central Java also has been measured (Simoen et al. 1993). In South Kroya the interface reached a depth of 40 to 70 meters from the land surface. Meanwhile, in the east side (West part of Kali Ijo), the interface reached from 45 to 60 meters. Further in the east the interface is found in South Kutowinangun Kebumen and ends up in Kutoarjo. The interface can be detected again in Glagah Area, Kulon Progo. In Rembang the existence of saline water in some coastal areas also has been detected (Sudaryatno and Purnama 1997). This pollution is caused by the pressure of fossil water and the excessive water pumping for farming. However, in confined aquifers the fresh water can still be
found. In the entire region of the northern coast in Central Java, almost all regions have been contaminated with saline water that was generally caused by fossil water (Simoen 2000). However, the changes of interface depth were also detected, which are generally associated with groundwater pumping for fishpond/aquaculture. Since 1989 to 1996 the interface was continuously becoming shallower and needed to be monitored.
In Bali Island, areas affected by seawater intrusion are South Denpasar, Gilimanuk, Southern Negara, and Northern Singaraja (Purbohadiwijoyo 1972). This phenomenon needs to get serious and direct attention because most of the island has low to very low groundwater resources. Unfortunately, groundwater pumping has been increasing due to development of tourism. In Borneo, one of large cities experiencing seawater intrusion is Samarinda and Mahakam River. This condition has been reducing the availability of fresh water used for drinking water by the city population. Besides Borneo, seawater intrusion also struck the island of Sumatra. In Lampung Bay seawater intrusion has reached several meters from the coastline. This phenomenon is exacerbated by the expansion of pond areas around the coastline. In Indragiri Hilir, Riau, intrusion of seawater has infiltrated to the peat, disrupting agriculture and plantation. Although its impacts to the groundwater are not clearly
DOI number: 10.5027/jnrd.v2i0.06
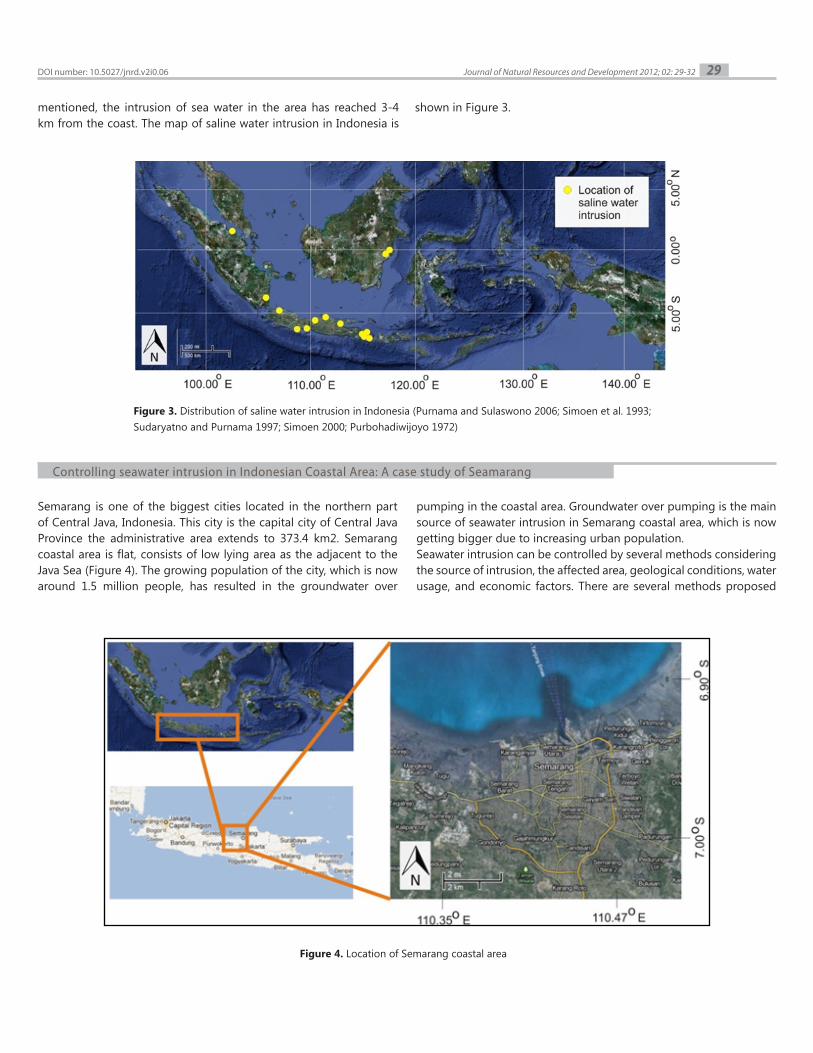
29Journal of Natural Resources and Development 2012; 02: 29-32
Semarang is one of the biggest cities located in the northern part of Central Java, Indonesia. This city is the capital city of Central Java Province the administrative area extends to 373.4 km2. Semarang coastal area is flat, consists of low lying area as the adjacent to the Java Sea (Figure 4). The growing population of the city, which is now around 1.5 million people, has resulted in the groundwater over
pumping in the coastal area. Groundwater over pumping is the main source of seawater intrusion in Semarang coastal area, which is now getting bigger due to increasing urban population. Seawater intrusion can be controlled by several methods considering the source of intrusion, the affected area, geological conditions, water usage, and economic factors. There are several methods proposed
Controlling seawater intrusion in Indonesian Coastal Area: A case study of Seamarang
mentioned, the intrusion of sea water in the area has reached 3-4 km from the coast. The map of saline water intrusion in Indonesia is
shown in Figure 3.
Figure 3. Distribution of saline water intrusion in Indonesia (Purnama and Sulaswono 2006; Simoen et al. 1993; Sudaryatno and Purnama 1997; Simoen 2000; Purbohadiwijoyo 1972)
Figure 4. Location of Semarang coastal area
DOI number: 10.5027/jnrd.v2i0.06
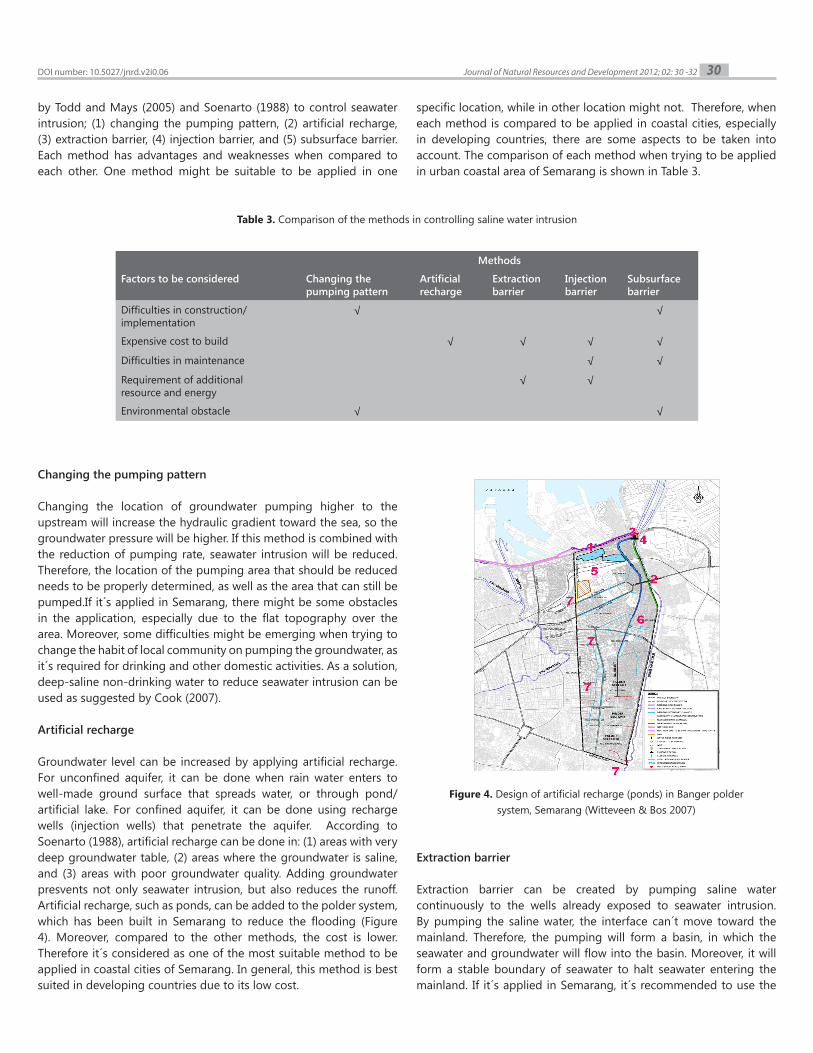
30Journal of Natural Resources and Development 2012; 02: 30 -32
by Todd and Mays (2005) and Soenarto (1988) to control seawater intrusion; (1) changing the pumping pattern, (2) artificial recharge, (3) extraction barrier, (4) injection barrier, and (5) subsurface barrier. Each method has advantages and weaknesses when compared to each other. One method might be suitable to be applied in one
specific location, while in other location might not. Therefore, when each method is compared to be applied in coastal cities, especially in developing countries, there are some aspects to be taken into account. The comparison of each method when trying to be applied in urban coastal area of Semarang is shown in Table 3.
Methods
Factors to be considered Changing the pumping pattern
Artificial recharge
Extraction barrier
Injection barrier
Subsurface barrier
Difficulties in construction/ implementation
√ √
Expensive cost to build √ √ √ √Difficulties in maintenance √ √Requirement of additional resource and energy
√ √
Environmental obstacle √ √
Table 3. Comparison of the methods in controlling saline water intrusion
Changing the pumping pattern
Changing the location of groundwater pumping higher to the upstream will increase the hydraulic gradient toward the sea, so the groundwater pressure will be higher. If this method is combined with the reduction of pumping rate, seawater intrusion will be reduced. Therefore, the location of the pumping area that should be reduced needs to be properly determined, as well as the area that can still be pumped.If it´s applied in Semarang, there might be some obstacles in the application, especially due to the flat topography over the area. Moreover, some difficulties might be emerging when trying to change the habit of local community on pumping the groundwater, as it´s required for drinking and other domestic activities. As a solution, deep-saline non-drinking water to reduce seawater intrusion can be used as suggested by Cook (2007).
Artificial recharge
Groundwater level can be increased by applying artificial recharge. For unconfined aquifer, it can be done when rain water enters to well-made ground surface that spreads water, or through pond/artificial lake. For confined aquifer, it can be done using recharge wells (injection wells) that penetrate the aquifer. According to Soenarto (1988), artificial recharge can be done in: (1) areas with very deep groundwater table, (2) areas where the groundwater is saline, and (3) areas with poor groundwater quality. Adding groundwater presvents not only seawater intrusion, but also reduces the runoff. Artificial recharge, such as ponds, can be added to the polder system, which has been built in Semarang to reduce the flooding (Figure 4). Moreover, compared to the other methods, the cost is lower. Therefore it´s considered as one of the most suitable method to be applied in coastal cities of Semarang. In general, this method is best suited in developing countries due to its low cost.
Extraction barrier
Extraction barrier can be created by pumping saline water continuously to the wells already exposed to seawater intrusion. By pumping the saline water, the interface can´t move toward the mainland. Therefore, the pumping will form a basin, in which the seawater and groundwater will flow into the basin. Moreover, it will form a stable boundary of seawater to halt seawater entering the mainland. If it´s applied in Semarang, it´s recommended to use the
Figure 4. Design of artificial recharge (ponds) in Banger polder system, Semarang (Witteveen & Bos 2007)
DOI number: 10.5027/jnrd.v2i0.06
31Journal of Natural Resources and Development 2012; 02: 31-32
integration of several wells so this treatment can be done in a bigger scale. However, since the movement of water in the interface is very low, the effect of this effort can´t be perceived immediately in the area. In addition, this method also requires high cost and effort, which can be major a obstacle to the Semarang government. Some innovations might be required to reduce the cost, in which the actual cost could be compensated by using the saline water for other purposes. Saline water can be used for cooling turbine engine, as applied in Suralaya, Banten-Indonesia.
Seawater can also be used in the circulation of conditioner air made from rust resistant materials in hotels and factories. For some coastal tourism areas where the sea is very dangerous for swimming, the salty water can be used to fill swimming pools and other activities related to water, such as waterparks and other attractions related to water. Salt water fishpond or seawater aquarium can also be constructed along with the manufactured salt water fountain (Soenarto 1988). With respect to its effect to groundwater in surrounding area, when the cost can be reduced this method can also become one of the most suitable methods to be applied in Semarang coastal area. This method can also be combined with other methods, such as artificial recharge, to improve its effectiveness in controlling sea water intrusion.
Injection barrier
Injection barrier can be created by filling the fresh water into injection wells located at the coastline. The infiltrated water would raise the groundwater level below the wells, which function as a barrier preventing sea water move further to the mainland. Until now, this method is considered difficult to be implemented in Semarang, because (1) the cost is very expensive, (2) the injection process requires continuous energy from electricity and diesel power, (3) the requirement of fresh water with good quality, in which water with high turbidity will clog the house pump and injection well, (4) the requirement of long pipe with appropriate filter, and (5) the discharge of injected water is highly dependent on soil texture (Soenarto 1988),
Subsurface barrier
Subsurface barrier is a barrier placed under the ground and functioned as a boundary between saline water and fresh water. It can consist of clay, concrete, bentonite, or asphalt (Todd and Mays 2005). Due to expensive cost and complex engineering construction, it is also very difficult to be implemented in Semarang coastal area.
Sea water intrusion is considered as one of the factor causing the increase of saline water contamination in fresh water. The existence of saline water on the mainland is very harmful to the society. The wells in urban settlement can no longer being used as source of drinking water due to high concentration of chloride, sodium and sulfate ions. This condition is faced by Semarang City as the research area.
Generally, sea water intrusion is faced coastal urban area due to groundwater over pumping. While in Semarang City, characteristics of the beach and rock formation, strength of groundwater flow to the sea, and the fluctuation of groundwater in coastal area also influence the occurence of this phenomenon. There are many method to indentify sea water intrusion i.e. (1) Ghyben Herzberg equation, (2) ratio between chloride ions with bicarbonate and carbonate ions, (3) piper quadrilateral diagram, (4) electrical conductivity and (5) dissolved solid measurement. Selection of method is depend on the area condition. The second, third and fourth method is successfully to be applied in the research area of Semarang City.
Besides Semarang City, several areas in Indonesia are also suffering by sea water intrusion. The areas are including parts of Java, Bali, Borneo and Sumatra Island. Indeed, these are mainly urban coastal areas located in low lying areas with flat topography similar to Semarang City. The dinamic nature of saline water contamination due to intrusion of sea water is considered to be dangerous, it should be anticipated early. From some proposed method to control sea water intrusion, i.e.: (1) changing pumping pattern, (2) artificial recharge, (3) extraction barrier, (4) injection barrier and (5) sub-surface barrier, the combination of artificial recharge and the extraction barrier is considered the most suitable to be applied in Semarang City. In general, both methods are well suited to coastal areas in developing country due to its low cost.
We would like to acknowledge Andung B. Sekaranom for his help on the data collection and also to the reviewers who give their advices on this paper.
Abdel-Aal HK, Ibrahim AA, Shalabi MA, and Al-Harbi DK. 1996. Chemical Separation
Process for Highly Saline Water. 1. Parametric Experimental Investigation. Ind. Eng.
Chem. Res. 35: 799-804.
Carrol, D., 1962., Rainwater as a chemical agent of geologic processes-a review, U.S.
Geological Survey Water-Supply Paper 1535-G, 18 pp.
Cat VM and Duong BD. 2006. Assessment of Saline Water Intrusion into Estuaries of Red-
Thai Binh River during Dry Season Having Considered Water Released from Upper
Reservoirs and Tidal Fluctuation. Vietnam-Japan Estuary Workshop, Hanoi.
Cook CW. 2008. A Hydrologist Perspective on Deep Saline Water Exploration. Balleau
Groundwater, Inc.
Custodio E. 1993. Specific Methodologies to Identify and Monitor Sea Water Intrusion,
Especially in Its Early Stages. Expert Consultation on Sea Water Intrusion In Cairo.
FAO Land and Water Development Division and FAO Regional Office for The Near
East Research Institute for Groundwater (Egypt).
Dayal B and Chauhan RS. 2010. Recharge of Saline Water Aquifers with Rain Water and
Its Impact on Water Quality and Crop Production. Biological Forum-An International
Journal 2 (2): 36-37.
Emmanuel BE and Chukwu LO. 2010. Spatial Distribution on Saline Water and Possible
Sources of Intrusion into Tropical Freshwater Lagoon and Transitional Effects on
The Lacustrine Ichthyofaunal Density. Africal Journal of Environmental Sciences and
Conclusion
Acknowledgement
References
DOI number: 10.5027/jnrd.v2i0.06
32Journal of Natural Resources and Development 2012; 02: 32-32
Technology 4 (7): 480-491.
Fass T, Cook PG, Stieglitz T, and Herczeg AL. 2007. Development of Saline Groundwater
through Transpiration of Sea Water. Groundwater 45 (6):703-710.
Groend PV. 1979. Salt Intrusion. Tidal Farming Opening Project (Proyek Pembukaan
Persawahan Pasang Surut. Department of Public Works, Jakarta Indonesia.
Gunay G. 1993. Solutions of Sea Water Intrusion in Turkey. Expert Consultation on Sea
Water Intrusion In Cairo. FAO Land and Water Development Division and FAO
Regional Office for The Near East Research Institute for Groundwater (Egypt).
Hefni K. 1993. A Special Case of Salt Water Intrusion in Siwa, Egypt. Expert Consultation
on Sea Water Intrusion In Cairo. FAO Land and Water Development Division and FAO
Regional Office for The Near East Research Institute for Groundwater (Egypt).
Holland KL, Tyerman SD, Mensforth LJ, and Walker GR. 2006. Tree Water Sources Over
Shallow, Saline Groundwater in The Lower River Muray, South Eastern Australia:
Implication for Groundwater Recharge Mechanism. Australian Journal of Botany 54:
193-205.
Iacovides IS. 1993. Groundwater Management and Legislative Measures in Cyprus. Expert
Consultation on Sea Water Intrusion In Cairo. FAO Land and Water Development
Division and FAO Regional Office for The Near East Research Institute for
Groundwater (Egypt).
Makalani M. 1993. Sea Water Intrusion in Coastal Aquifer of Syria. Expert Consultation on
Sea Water Intrusion In Cairo. FAO Land and Water Development Division and FAO
Regional Office for The Near East Research Institute for Groundwater (Egypt).
Majdalani M. 1993. Sea Water Intrusion in Cenomanian-Turonial Limestone Aquifers of
Beyrouth. Expert Consultation on Sea Water Intrusion In Cairo. FAO Land and Water
Development Division and FAO Regional Office for The Near East Research Institute
for Groundwater (Egypt).
Marandi A and Vallner L. 2010. Upconing of Saline Water from The Crstalline Basement
into The Cambrian-Vendian Aquifer of The Kopli Peninsula, Northern Estonia.
Estonian Journal of Earth Sciences 59 (4): 277-287.
Marfai MA and King L. 2007. Monitoring land subsidence in Semarang, Indonesia.
Environmental Geology 53: 651-659.
Marfai MA and King L. 2008a. Tidal inundation mapping under enhanced land subsidence
in Semarang, Central Java Indonesia. Natural Hazards 44: 93-109.
Marfai MA and King L. 2008b. Potential vulnerability implications of coastal inundation
due to sea level rise for the coastal zone of Semarang City, Indonesia. Environmental
Geology 54:1235-1245.
Marfai MA and King L. 2008c. Coastal flood management in Semarang, Indonesia.
Environmental Geology. 55: 1507-1518.
Marfai MA, Yulianto F, Hizabron DR, Ward P, Aerts. 2009. Preliminary assessment and
modeling the effects of climate change on potential coastal flood damage in Jakarta,
Joint research report, Vree Univ Amsterdam and Gadjah Mada univ.
Odum EP. 1996. Fundamental Ecology (Dasar-Dasar Ekologi). Gadjah Mada University
Press, Yogyakarta Indonesia.
Obikoya IB and Bennel JD. 2010. Geophysical Investigation of The Fresh-Saline Water
Interface in Coastal Area of Aberwyngregyn. MSc Thesis. School of Ocean Sciences,
University of Wales. Bangor.
Purbohadiwidjojo MM. 1972. Synoptic Hydrogeological Map of Bali (Peta Hidrologi Tinjau
Pulau Bali), Indoensian Directorate of Geology, Bandung.
Purnama S. 1996. Changes of Seawater Intrusion in Cilacap Urban Area (Perkembangan
Intrusi Air Laut di Kota Administratif Cilacap). Faculty of Geography, Gadjah Mada
University, Yogyakarta Indonesia.
Purnama S. 2005. Saline Water Distribution in Coastal Lowland of Semarang Area and
Willingness to pay of the inhabitants to fresh water improvement (Distribusi Airtanah
Asin di Dataran Pantai Kota Semarang dan Ketersediaan Membayar Penduduk dalam
Perbaikan Kondisi Sumber Air). Majalah Geografi Indonesia 19 (1): 41-61.
Purnama S. and Sulaswono B. 2006. Application of Geoelectrical Surver for Saline
Water Identification in Surabaya City Aquifer (Pemanfaatan Teknik Geolistrik untuk
Mendeteksi Persebaran Airtanah Asin Pada Akufier Bebas di Kota Surabaya). Majalah
Geografi Indonesia 20 (1): 52-66.
Rekaya M. 1993. The Tunesian Experience of Sea Water Intrusion Control. Expert
Consultation on Sea Water Intrusion In Cairo. FAO Land and Water Development
Division and FAO Regional Office for The Near East Research Institute for
Groundwater (Egypt).
Revelle, R., 1941., Criteria for recognition of sea water in groundwaters, Trans. Amer.
Geophysical Union, v. 22, pp. 593-597
Saeni MS. 1989. Environmental Chemistry (Kimia Lingkungan). Center of Biological Inter-
university. IPB Bogor, Indonesia
Saha DK and Chodbury K. 2005. Saline Water Contamination of The Aquifer Zones of
Eastern Kolkata j. ind. Geophys. Union 9 (4): 241-247
Simoen S, Suyono, and Purnama S. 1993. Seawater Intrusion Distribution into
Groundwater in Southern Coast of Central Jawa and Daerah Istimewa Yogyakarta
(Penyebaran Penyusupan Air Laut ke Dalam Airtanah di Daerah Pantai Selatan Jawa
Tengah dan Daerah Istimewa Yogyakarta). Gadjahmada Research Department,
Yogyakarta Indonesia.
Simoen S. 2000. Monitoring of Sea Water Intrusion into Coastal Aquifer Using
Geoelectrical Sounding: A Case Study Of The Northern-Coastal Area of Central Java,
Indonesia. The Indonesian Journal of Geography 32 (80): 167-187.
Soenarto 1988. Seawater Intrusion in Jakarta Groundwater (Penyusupan Air Asin dalam
Airtanah Jakarta). Jurnal Penelitian dan Pengembangan Pengairan 8 (4) 123-139.
Stuyfzand PJ. 1986. A New Hydrochemical Classification of Water Types: Principles and
Application to The Coastal Dunes Aquifer System of Netherlands. Salt Water Intrusion
Meeting 9. The Netherland Waterwork Testing and Research Institute KIWA Ltd, Delf.
Sudaryatno and Purnama S. 1997. Seawater Intrusion Mapping in Rembang District,
Central Java (Pemetaan Intrusi Air Laut di Kabupaten Rembang, Propinsi Jawa
Tengah). Gadjahmada Research Department, Yogyakarta Indonesia.
Todd DK and Mays LW. 2005. Groundwater Hydrology. John Wiley & Sons, New York.
Witteveen & Bos. 2007. Development Banger Pilot Polder Semarang: Powerpoint
Presentation. Witteveen & Bos Co Ltd.
DOI number: 10.5027/jnrd.v2i0.06
JOURNAL OF NATURAL RESOURCES AND DEVELOPMENT
Energy options from the 20th Century: Comparing Conventional and Nuclear Energy from a Sustainable StandpointEric Ndeh Mboumien Nganga,b*
a Student, Masters of Environmental Management and Sustainability, University of South Australia, Australia.
b Founder Action Group on Governance and Environmental Management (AGGEM) Cameroon, P.O. Box 1132, Bamenda, Cameroon.
*Corresponding author: [email protected]
Article history Abstract
Received 18.07.2012Accepted 24.09.2012Published 09.11.2012
Different Energy options have been the driving force for the world economy with an evolution in types and sources. Decades ago choosing what energy option to use did not call for much debate as issues of sustainability, pressure on our environment, and our climate were not a major concern. However today, humans have to grapple with these current global challenges especially those exacerbated by our current sources of energy. The review article argues that science and sustainability thinking should be the basis for making the choice about what energy option is suitable for our era. It proposes that a more fruitful discourse should follow from a dialogue that puts in place the set of sustainability indicators and evaluating the suitability of the options for our era in that context. Focusing on two energy options; conventional and nuclear energy; the review compares them based on a set of sustainability indicators including, but not limited to, the environment, economics, ethics, expertise requirements, technical information, health, safety, uncertainty and government funding. In trying to answer the question Unsustainable conventional energy sources, is nuclear energy similar?, the review concludes that despite the demerits of nuclear energy, it is the solution to meet the world’s growing energy needs and to reverse the impending threat posed by climate change if research and development efforts in the sector are accelerated.
Conventional energyNuclear energySustainability
Introduction
The discovery and use of new energy sources has been central to human’s survival through the different stages leading up to the industrial and technological era. The quest for more and efficient sources was the motivation for the use of biomass (wood), through harvesting the wind to steer ships, to the use of energy from the combustion of coal, oil, gas (Nakicenovic and Grubler 2000, p. 5). The
base load electricity generated from these sources has been the main energy source in driving most aspects of modern life and recently, directly used in transportation and domestic heating sector by some countries (Bodansky 2004, p. 5).
The conventional energy sources (coal, oil and gas) have progressively
Journal of Natural Resources and Development 2012; 02: 33-41 33
Keywords
DOI number: 10.5027/jnrd.v2i0.07
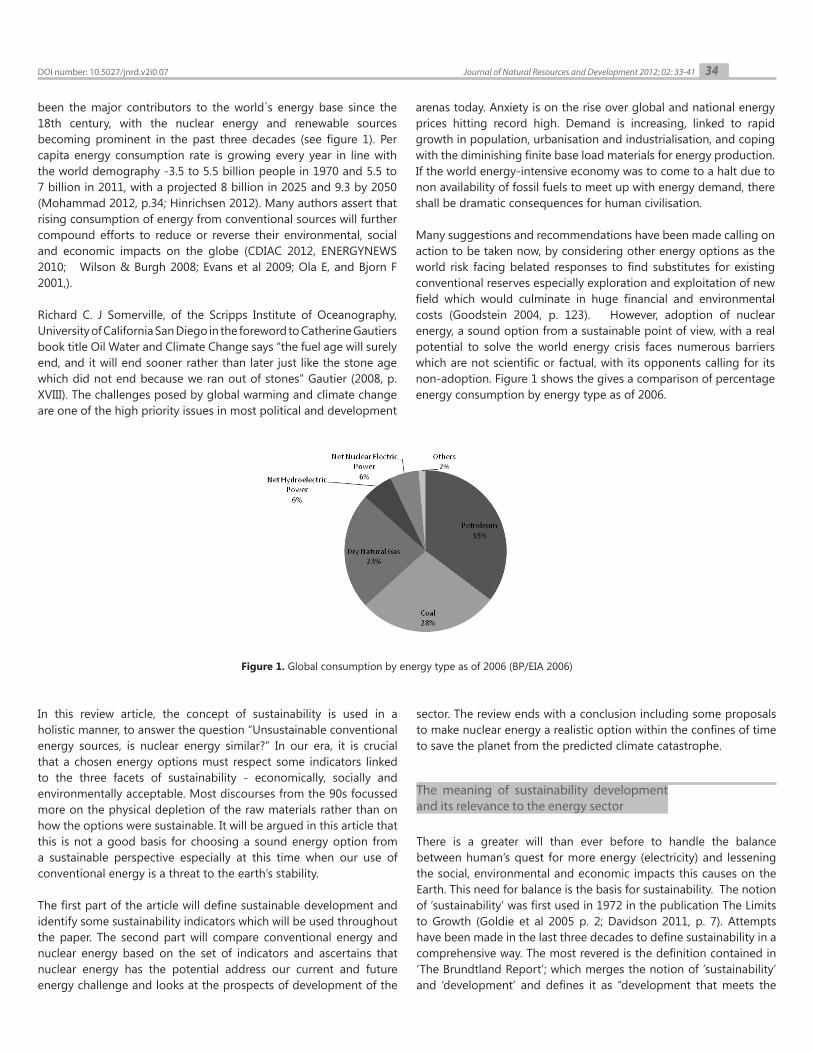
34Journal of Natural Resources and Development 2012; 02: 33-41
been the major contributors to the world´s energy base since the 18th century, with the nuclear energy and renewable sources becoming prominent in the past three decades (see figure 1). Per capita energy consumption rate is growing every year in line with the world demography -3.5 to 5.5 billion people in 1970 and 5.5 to 7 billion in 2011, with a projected 8 billion in 2025 and 9.3 by 2050 (Mohammad 2012, p.34; Hinrichsen 2012). Many authors assert that rising consumption of energy from conventional sources will further compound efforts to reduce or reverse their environmental, social and economic impacts on the globe (CDIAC 2012, ENERGYNEWS 2010; Wilson & Burgh 2008; Evans et al 2009; Ola E, and Bjorn F 2001,).
Richard C. J Somerville, of the Scripps Institute of Oceanography, University of California San Diego in the foreword to Catherine Gautiers book title Oil Water and Climate Change says “the fuel age will surely end, and it will end sooner rather than later just like the stone age which did not end because we ran out of stones” Gautier (2008, p. XVIII). The challenges posed by global warming and climate change are one of the high priority issues in most political and development
arenas today. Anxiety is on the rise over global and national energy prices hitting record high. Demand is increasing, linked to rapid growth in population, urbanisation and industrialisation, and coping with the diminishing finite base load materials for energy production. If the world energy-intensive economy was to come to a halt due to non availability of fossil fuels to meet up with energy demand, there shall be dramatic consequences for human civilisation.
Many suggestions and recommendations have been made calling on action to be taken now, by considering other energy options as the world risk facing belated responses to find substitutes for existing conventional reserves especially exploration and exploitation of new field which would culminate in huge financial and environmental costs (Goodstein 2004, p. 123). However, adoption of nuclear energy, a sound option from a sustainable point of view, with a real potential to solve the world energy crisis faces numerous barriers which are not scientific or factual, with its opponents calling for its non-adoption. Figure 1 shows the gives a comparison of percentage energy consumption by energy type as of 2006.
Figure 1. Global consumption by energy type as of 2006 (BP/EIA 2006)
In this review article, the concept of sustainability is used in a holistic manner, to answer the question “Unsustainable conventional energy sources, is nuclear energy similar?” In our era, it is crucial that a chosen energy options must respect some indicators linked to the three facets of sustainability - economically, socially and environmentally acceptable. Most discourses from the 90s focussed more on the physical depletion of the raw materials rather than on how the options were sustainable. It will be argued in this article that this is not a good basis for choosing a sound energy option from a sustainable perspective especially at this time when our use of conventional energy is a threat to the earth’s stability.
The first part of the article will define sustainable development and identify some sustainability indicators which will be used throughout the paper. The second part will compare conventional energy and nuclear energy based on the set of indicators and ascertains that nuclear energy has the potential address our current and future energy challenge and looks at the prospects of development of the
sector. The review ends with a conclusion including some proposals to make nuclear energy a realistic option within the confines of time to save the planet from the predicted climate catastrophe.
There is a greater will than ever before to handle the balance between human’s quest for more energy (electricity) and lessening the social, environmental and economic impacts this causes on the Earth. This need for balance is the basis for sustainability. The notion of ‘sustainability’ was first used in 1972 in the publication The Limits to Growth (Goldie et al 2005 p. 2; Davidson 2011, p. 7). Attempts have been made in the last three decades to define sustainability in a comprehensive way. The most revered is the definition contained in ‘The Brundtland Report’; which merges the notion of ‘sustainability’ and ‘development’ and defines it as “development that meets the
The meaning of sustainability development and its relevance to the energy sector
DOI number: 10.5027/jnrd.v2i0.07
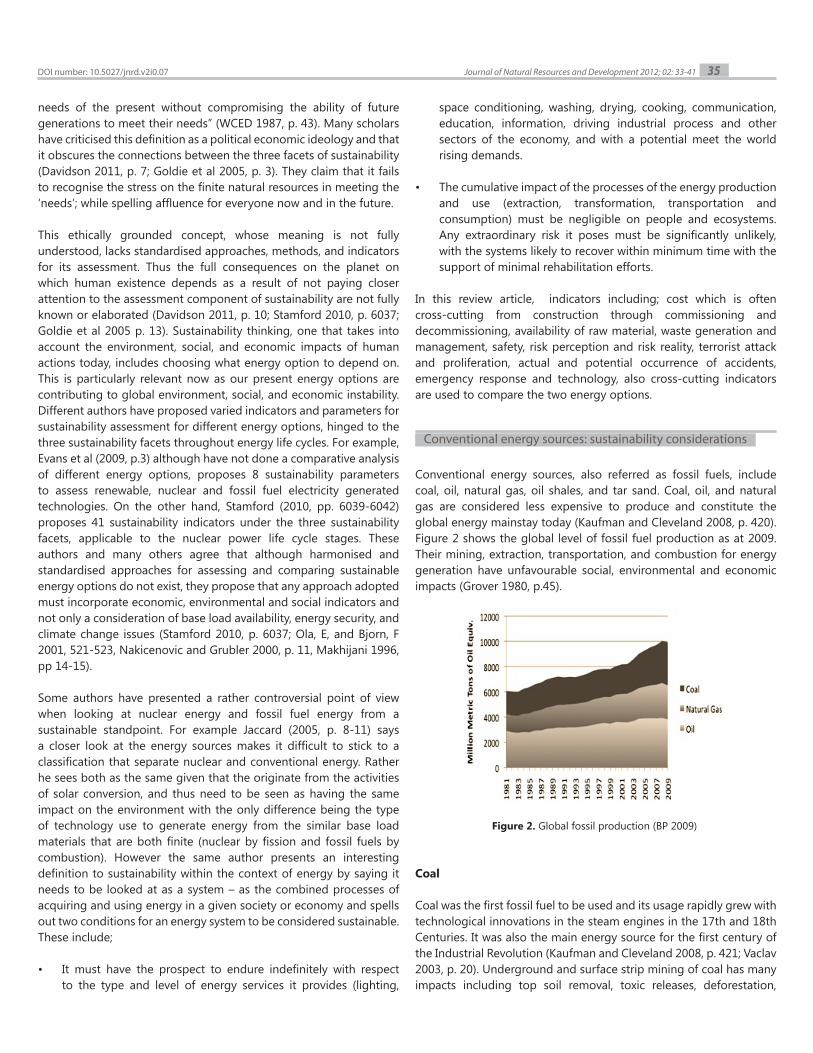
35Journal of Natural Resources and Development 2012; 02: 33-41
needs of the present without compromising the ability of future generations to meet their needs” (WCED 1987, p. 43). Many scholars have criticised this definition as a political economic ideology and that it obscures the connections between the three facets of sustainability (Davidson 2011, p. 7; Goldie et al 2005, p. 3). They claim that it fails to recognise the stress on the finite natural resources in meeting the ‘needs’; while spelling affluence for everyone now and in the future.
This ethically grounded concept, whose meaning is not fully understood, lacks standardised approaches, methods, and indicators for its assessment. Thus the full consequences on the planet on which human existence depends as a result of not paying closer attention to the assessment component of sustainability are not fully known or elaborated (Davidson 2011, p. 10; Stamford 2010, p. 6037; Goldie et al 2005 p. 13). Sustainability thinking, one that takes into account the environment, social, and economic impacts of human actions today, includes choosing what energy option to depend on. This is particularly relevant now as our present energy options are contributing to global environment, social, and economic instability. Different authors have proposed varied indicators and parameters for sustainability assessment for different energy options, hinged to the three sustainability facets throughout energy life cycles. For example, Evans et al (2009, p.3) although have not done a comparative analysis of different energy options, proposes 8 sustainability parameters to assess renewable, nuclear and fossil fuel electricity generated technologies. On the other hand, Stamford (2010, pp. 6039-6042) proposes 41 sustainability indicators under the three sustainability facets, applicable to the nuclear power life cycle stages. These authors and many others agree that although harmonised and standardised approaches for assessing and comparing sustainable energy options do not exist, they propose that any approach adopted must incorporate economic, environmental and social indicators and not only a consideration of base load availability, energy security, and climate change issues (Stamford 2010, p. 6037; Ola, E, and Bjorn, F 2001, 521-523, Nakicenovic and Grubler 2000, p. 11, Makhijani 1996, pp 14-15).
Some authors have presented a rather controversial point of view when looking at nuclear energy and fossil fuel energy from a sustainable standpoint. For example Jaccard (2005, p. 8-11) says a closer look at the energy sources makes it difficult to stick to a classification that separate nuclear and conventional energy. Rather he sees both as the same given that the originate from the activities of solar conversion, and thus need to be seen as having the same impact on the environment with the only difference being the type of technology use to generate energy from the similar base load materials that are both finite (nuclear by fission and fossil fuels by combustion). However the same author presents an interesting definition to sustainability within the context of energy by saying it needs to be looked at as a system – as the combined processes of acquiring and using energy in a given society or economy and spells out two conditions for an energy system to be considered sustainable. These include;
• It must have the prospect to endure indefinitely with respect to the type and level of energy services it provides (lighting,
space conditioning, washing, drying, cooking, communication, education, information, driving industrial process and other sectors of the economy, and with a potential meet the world rising demands.
• The cumulative impact of the processes of the energy production and use (extraction, transformation, transportation and consumption) must be negligible on people and ecosystems. Any extraordinary risk it poses must be significantly unlikely, with the systems likely to recover within minimum time with the support of minimal rehabilitation efforts.
In this review article, indicators including; cost which is often cross-cutting from construction through commissioning and decommissioning, availability of raw material, waste generation and management, safety, risk perception and risk reality, terrorist attack and proliferation, actual and potential occurrence of accidents, emergency response and technology, also cross-cutting indicators are used to compare the two energy options.
Conventional energy sources, also referred as fossil fuels, include coal, oil, natural gas, oil shales, and tar sand. Coal, oil, and natural gas are considered less expensive to produce and constitute the global energy mainstay today (Kaufman and Cleveland 2008, p. 420). Figure 2 shows the global level of fossil fuel production as at 2009. Their mining, extraction, transportation, and combustion for energy generation have unfavourable social, environmental and economic impacts (Grover 1980, p.45).
Coal
Coal was the first fossil fuel to be used and its usage rapidly grew with technological innovations in the steam engines in the 17th and 18th Centuries. It was also the main energy source for the first century of the Industrial Revolution (Kaufman and Cleveland 2008, p. 421; Vaclav 2003, p. 20). Underground and surface strip mining of coal has many impacts including top soil removal, toxic releases, deforestation,
Conventional energy sources: sustainability considerations
Figure 2. Global fossil production (BP 2009)
DOI number: 10.5027/jnrd.v2i0.07
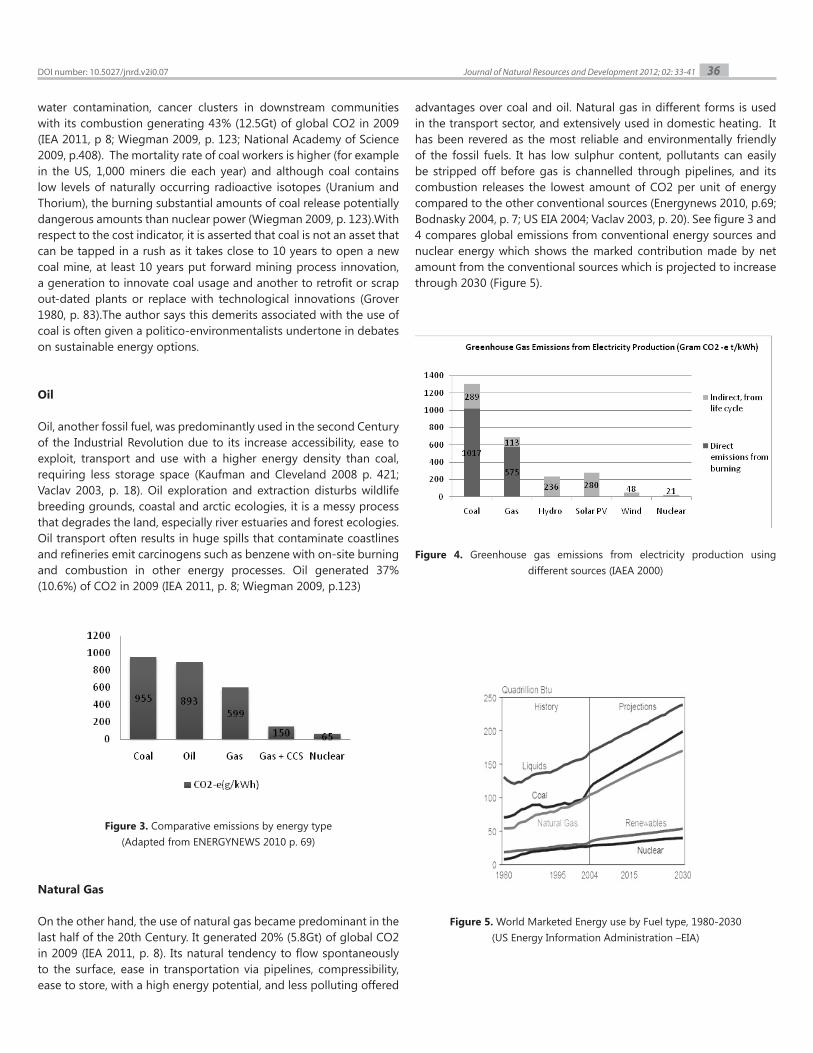
36Journal of Natural Resources and Development 2012; 02: 33-41
water contamination, cancer clusters in downstream communities with its combustion generating 43% (12.5Gt) of global CO2 in 2009 (IEA 2011, p 8; Wiegman 2009, p. 123; National Academy of Science 2009, p.408). The mortality rate of coal workers is higher (for example in the US, 1,000 miners die each year) and although coal contains low levels of naturally occurring radioactive isotopes (Uranium and Thorium), the burning substantial amounts of coal release potentially dangerous amounts than nuclear power (Wiegman 2009, p. 123).With respect to the cost indicator, it is asserted that coal is not an asset that can be tapped in a rush as it takes close to 10 years to open a new coal mine, at least 10 years put forward mining process innovation, a generation to innovate coal usage and another to retrofit or scrap out-dated plants or replace with technological innovations (Grover 1980, p. 83).The author says this demerits associated with the use of coal is often given a politico-environmentalists undertone in debates on sustainable energy options.
Oil
Oil, another fossil fuel, was predominantly used in the second Century of the Industrial Revolution due to its increase accessibility, ease to exploit, transport and use with a higher energy density than coal, requiring less storage space (Kaufman and Cleveland 2008 p. 421; Vaclav 2003, p. 18). Oil exploration and extraction disturbs wildlife breeding grounds, coastal and arctic ecologies, it is a messy process that degrades the land, especially river estuaries and forest ecologies. Oil transport often results in huge spills that contaminate coastlines and refineries emit carcinogens such as benzene with on-site burning and combustion in other energy processes. Oil generated 37% (10.6%) of CO2 in 2009 (IEA 2011, p. 8; Wiegman 2009, p.123)
Natural Gas
On the other hand, the use of natural gas became predominant in the last half of the 20th Century. It generated 20% (5.8Gt) of global CO2 in 2009 (IEA 2011, p. 8). Its natural tendency to flow spontaneously to the surface, ease in transportation via pipelines, compressibility, ease to store, with a high energy potential, and less polluting offered
advantages over coal and oil. Natural gas in different forms is used in the transport sector, and extensively used in domestic heating. It has been revered as the most reliable and environmentally friendly of the fossil fuels. It has low sulphur content, pollutants can easily be stripped off before gas is channelled through pipelines, and its combustion releases the lowest amount of CO2 per unit of energy compared to the other conventional sources (Energynews 2010, p.69; Bodnasky 2004, p. 7; US EIA 2004; Vaclav 2003, p. 20). See figure 3 and 4 compares global emissions from conventional energy sources and nuclear energy which shows the marked contribution made by net amount from the conventional sources which is projected to increase through 2030 (Figure 5).
Figure 3. Comparative emissions by energy type (Adapted from ENERGYNEWS 2010 p. 69)
Figure 4. Greenhouse gas emissions from electricity production using different sources (IAEA 2000)
Figure 5. World Marketed Energy use by Fuel type, 1980-2030 (US Energy Information Administration –EIA)
DOI number: 10.5027/jnrd.v2i0.07
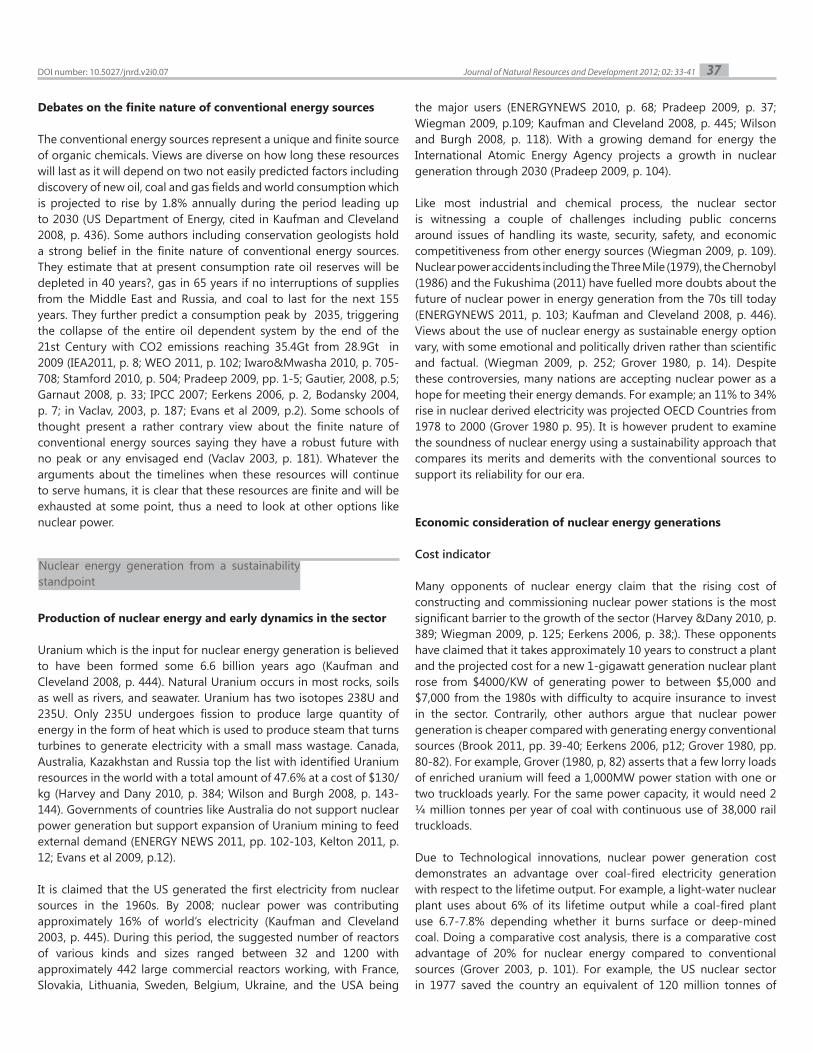
37Journal of Natural Resources and Development 2012; 02: 33-41
Debates on the finite nature of conventional energy sources
The conventional energy sources represent a unique and finite source of organic chemicals. Views are diverse on how long these resources will last as it will depend on two not easily predicted factors including discovery of new oil, coal and gas fields and world consumption which is projected to rise by 1.8% annually during the period leading up to 2030 (US Department of Energy, cited in Kaufman and Cleveland 2008, p. 436). Some authors including conservation geologists hold a strong belief in the finite nature of conventional energy sources. They estimate that at present consumption rate oil reserves will be depleted in 40 years?, gas in 65 years if no interruptions of supplies from the Middle East and Russia, and coal to last for the next 155 years. They further predict a consumption peak by 2035, triggering the collapse of the entire oil dependent system by the end of the 21st Century with CO2 emissions reaching 35.4Gt from 28.9Gt in 2009 (IEA2011, p. 8; WEO 2011, p. 102; Iwaro&Mwasha 2010, p. 705-708; Stamford 2010, p. 504; Pradeep 2009, pp. 1-5; Gautier, 2008, p.5; Garnaut 2008, p. 33; IPCC 2007; Eerkens 2006, p. 2, Bodansky 2004, p. 7; in Vaclav, 2003, p. 187; Evans et al 2009, p.2). Some schools of thought present a rather contrary view about the finite nature of conventional energy sources saying they have a robust future with no peak or any envisaged end (Vaclav 2003, p. 181). Whatever the arguments about the timelines when these resources will continue to serve humans, it is clear that these resources are finite and will be exhausted at some point, thus a need to look at other options like nuclear power.
Production of nuclear energy and early dynamics in the sector
Uranium which is the input for nuclear energy generation is believed to have been formed some 6.6 billion years ago (Kaufman and Cleveland 2008, p. 444). Natural Uranium occurs in most rocks, soils as well as rivers, and seawater. Uranium has two isotopes 238U and 235U. Only 235U undergoes fission to produce large quantity of energy in the form of heat which is used to produce steam that turns turbines to generate electricity with a small mass wastage. Canada, Australia, Kazakhstan and Russia top the list with identified Uranium resources in the world with a total amount of 47.6% at a cost of $130/kg (Harvey and Dany 2010, p. 384; Wilson and Burgh 2008, p. 143-144). Governments of countries like Australia do not support nuclear power generation but support expansion of Uranium mining to feed external demand (ENERGY NEWS 2011, pp. 102-103, Kelton 2011, p. 12; Evans et al 2009, p.12).
It is claimed that the US generated the first electricity from nuclear sources in the 1960s. By 2008; nuclear power was contributing approximately 16% of world’s electricity (Kaufman and Cleveland 2003, p. 445). During this period, the suggested number of reactors of various kinds and sizes ranged between 32 and 1200 with approximately 442 large commercial reactors working, with France, Slovakia, Lithuania, Sweden, Belgium, Ukraine, and the USA being
the major users (ENERGYNEWS 2010, p. 68; Pradeep 2009, p. 37; Wiegman 2009, p.109; Kaufman and Cleveland 2008, p. 445; Wilson and Burgh 2008, p. 118). With a growing demand for energy the International Atomic Energy Agency projects a growth in nuclear generation through 2030 (Pradeep 2009, p. 104).
Like most industrial and chemical process, the nuclear sector is witnessing a couple of challenges including public concerns around issues of handling its waste, security, safety, and economic competitiveness from other energy sources (Wiegman 2009, p. 109). Nuclear power accidents including the Three Mile (1979), the Chernobyl (1986) and the Fukushima (2011) have fuelled more doubts about the future of nuclear power in energy generation from the 70s till today (ENERGYNEWS 2011, p. 103; Kaufman and Cleveland 2008, p. 446). Views about the use of nuclear energy as sustainable energy option vary, with some emotional and politically driven rather than scientific and factual. (Wiegman 2009, p. 252; Grover 1980, p. 14). Despite these controversies, many nations are accepting nuclear power as a hope for meeting their energy demands. For example; an 11% to 34% rise in nuclear derived electricity was projected OECD Countries from 1978 to 2000 (Grover 1980 p. 95). It is however prudent to examine the soundness of nuclear energy using a sustainability approach that compares its merits and demerits with the conventional sources to support its reliability for our era.
Economic consideration of nuclear energy generations
Cost indicator
Many opponents of nuclear energy claim that the rising cost of constructing and commissioning nuclear power stations is the most significant barrier to the growth of the sector (Harvey &Dany 2010, p. 389; Wiegman 2009, p. 125; Eerkens 2006, p. 38;). These opponents have claimed that it takes approximately 10 years to construct a plant and the projected cost for a new 1-gigawatt generation nuclear plant rose from $4000/KW of generating power to between $5,000 and $7,000 from the 1980s with difficulty to acquire insurance to invest in the sector. Contrarily, other authors argue that nuclear power generation is cheaper compared with generating energy conventional sources (Brook 2011, pp. 39-40; Eerkens 2006, p12; Grover 1980, pp. 80-82). For example, Grover (1980, p, 82) asserts that a few lorry loads of enriched uranium will feed a 1,000MW power station with one or two truckloads yearly. For the same power capacity, it would need 2 ¼ million tonnes per year of coal with continuous use of 38,000 rail truckloads.
Due to Technological innovations, nuclear power generation cost demonstrates an advantage over coal-fired electricity generation with respect to the lifetime output. For example, a light-water nuclear plant uses about 6% of its lifetime output while a coal-fired plant use 6.7-7.8% depending whether it burns surface or deep-mined coal. Doing a comparative cost analysis, there is a comparative cost advantage of 20% for nuclear energy compared to conventional sources (Grover 2003, p. 101). For example, the US nuclear sector in 1977 saved the country an equivalent of 120 million tonnes of
Nuclear energy generation from a sustainability standpoint
DOI number: 10.5027/jnrd.v2i0.07
38Journal of Natural Resources and Development 2012; 02: 33 -41
coal, 2.6 trillion cubic feet of natural gas, or 425 trillion barrels of oil, all worth $5.9 billion. While in Britain in 1979, costs including capital costs, nuclear processing and decommissioning charges were announced as follows; nuclear 0.76pence/KWH, coal 1.23pence/KWH, oil 1.42pence/KWH.
Construction and commissioning cost indicators
Technological innovations in the nuclear power sector have had an influence on the cost factor. For example the Integral Fast Reactor (IFR) and other Generation IV reactors are less complex and competitive with any other type of power generation at a cost of US$1200/KW (ENERGYNEWS 2011, pp. 39-40).These reactors are capable of using spent fuels, weapon heads which are abundant in countries like Russia and thus not necessitating the mining of uranium in the next 1,000 years. There is strong international collaboration to build a new generation of reactors which efficiently use reactor fuel through recycling with affordable high decommissioning robotic technologies (Wilson and Burgh 2008, pp.127-128)
Environmental and Social considerations (Nuclear reactor safety and waste handling)
Waste Generation and management indicator
A. CO2 Emissions indicator
In an era where all decisions are guided by scientific evidence of the impact on the globe, which is currently under threat from carbon emissions, nuclear energy generation is the most sound option as it contributes a negligible amount to the global carbon emissions ( see table 1). It is estimated that avoided emissions will hit 150 million tonnes per year by 2020 and 2.4 billion tonnes per year by 2050 if nuclear power is maximally deployed (National Academy of Science 2009, p. 114). In addition it does not produce of SO2, NOx and this is not mentioned in current debates about nuclear energy’s soundness (Vaclav 2003, p. 313).
B. Radioactive waste (nuclear plant construction waste and spent fuels)
Comparing amount of waste generated from the 1000MW plant example cited above, Grover (1980, p. 182) says about a cubic metre of waste is generated by the nuclear plant while coal waste would require about 12,000 railway trucks to remove it. The author strongly affirms his position in support of nuclear energy saying despite the emotional talks; it is safe, clean, and more environmentally desirable. As a sign of conservation he believes, fast breeder reactors which make use of the readily available uranium (with less than 3% residual waste for burial with negligible possibility for leaching into nature) should be used. Comparing the final risk to the environment, research, and the technological requirements for storing nuclear waste and geosequestering of CO2 into coal seams and saline aquifers, the
nuclear option is the cheapest option (Rothwel and Graber 2010 p. 176-177, EnergyNews 2002, p. 396-398, AEN2002, P. 23).
Natural radioactive decay to a stable state of plutonium has been reported to occur in the Earth’s crust. The example of in Oklo Gabon in West Africa, which demonstrates a successful isolation of radioactive wastes from the biosphere without contaminations has been repeatedly cited (Nersesian 2007, p. 282; Glover 1980, p. 168). This is prompting more research in geological disposal.
Plants Safety indicator
Many are tempted to believe a reactor could blow up like an atomic bomb. However this is not the case as there is not enough fission and material is not arranged in a reactor in such a way as to cause an explosion (Kaufman and Cleveland 2008, p. 458-459, Eerkens 2006, p. 20). The authors assert that present day systems are regulated with backups to ensure minimised risk of radiation exposure to people and the environment. For example, the US nuclear plants use a number of physical barriers to prevent the escape of radioactive materials, including the ceramic pellet around fuel rods made of heat, radiation, corrosion resistant zirconium alloy, all placed in a thick reinforced containment unit. In addition it is asserted that the low radioactivity measured around nuclear plants and fuel facilities are equivalent to natural radioactivity from the Earth, food, and water (ENERGYNEWS 2009 p. 39; Wilson and Burgh 2008, pp. 118-119). However it is difficult to say how safe nuclear reactors are as there is uncertainty associated with the likelihood of mechanical or computer malfunctions, or the likelihood of human error in plant operations.
Technological Safety and emergency response indicator
Accidents such as the Three Mile Island in 1979 and Chernobyl in 1986 have caused massive changes in the design of reactors. These include emergency response planning, reactor operator training, human factors, engineering, and radiation protection (Wilson and Burgh 2008, p. 117; Eerkens 2006, pp. 6-7; Bodansky 2004, p.20; Clover 2003, p. 167; Vaclav 2003, pp. 311, 315). These changes have all enhanced safety of new plants and operations of existing plants and thus do not deter advances in nuclear. Bartzis (1995, p. 138) argues that other severe accidents have occurred in the chemical industry causing loss of lives and massive evacuations like the Seveso Accident of 1976 in Italy with the release of TCDD (2,3,7,8 tetrachlorodibenzoparadioxin) which is one of the most poisonous substances. He further asserts that computerised emergency response systems, for example the RODOS System at European Community level, have been built to handle nuclear emergencies, realised with the participation of 18 national laboratories. One key aspect of the decision support system is its potential to generate automatically all information essential to decision making to ensure safety including source term, dispersion, disposition, doses, health effects, economic effects and counter measure scenarios.
DOI number: 10.5027/jnrd.v2i0.07
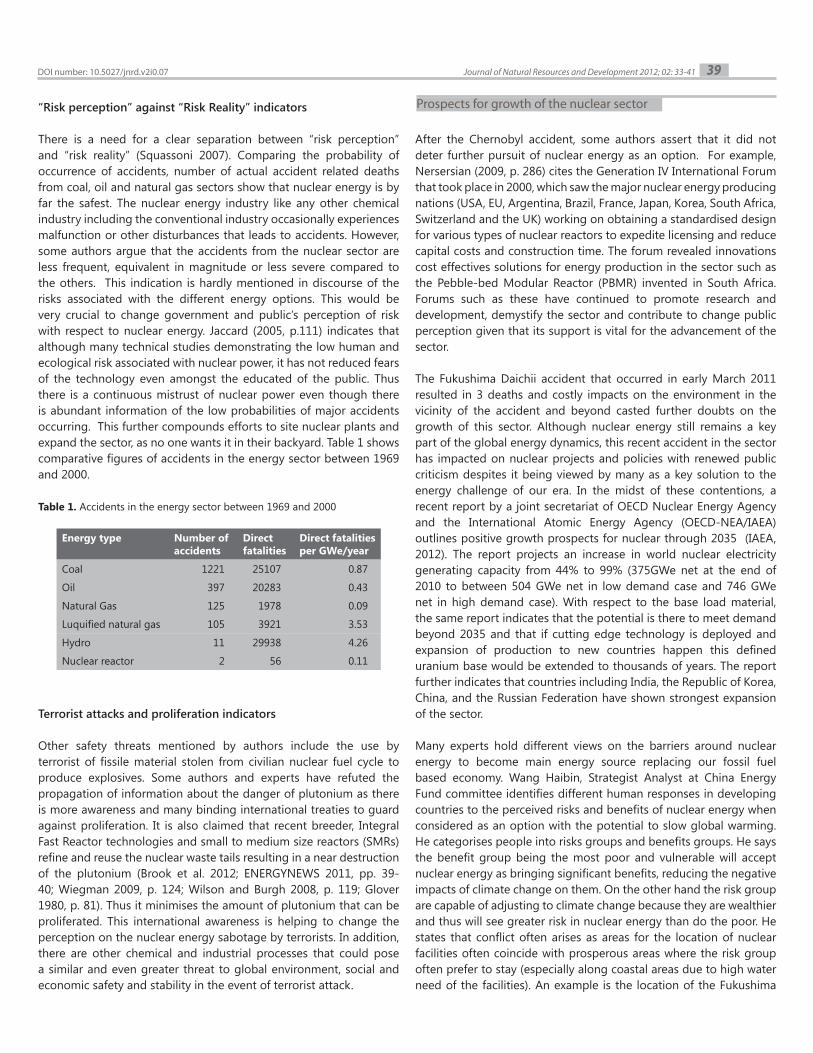
“Risk perception” against “Risk Reality” indicators
There is a need for a clear separation between “risk perception” and “risk reality” (Squassoni 2007). Comparing the probability of occurrence of accidents, number of actual accident related deaths from coal, oil and natural gas sectors show that nuclear energy is by far the safest. The nuclear energy industry like any other chemical industry including the conventional industry occasionally experiences malfunction or other disturbances that leads to accidents. However, some authors argue that the accidents from the nuclear sector are less frequent, equivalent in magnitude or less severe compared to the others. This indication is hardly mentioned in discourse of the risks associated with the different energy options. This would be very crucial to change government and public’s perception of risk with respect to nuclear energy. Jaccard (2005, p.111) indicates that although many technical studies demonstrating the low human and ecological risk associated with nuclear power, it has not reduced fears of the technology even amongst the educated of the public. Thus there is a continuous mistrust of nuclear power even though there is abundant information of the low probabilities of major accidents occurring. This further compounds efforts to site nuclear plants and expand the sector, as no one wants it in their backyard. Table 1 shows comparative figures of accidents in the energy sector between 1969 and 2000.
Table 1. Accidents in the energy sector between 1969 and 2000
Terrorist attacks and proliferation indicators
Other safety threats mentioned by authors include the use by terrorist of fissile material stolen from civilian nuclear fuel cycle to produce explosives. Some authors and experts have refuted the propagation of information about the danger of plutonium as there is more awareness and many binding international treaties to guard against proliferation. It is also claimed that recent breeder, Integral Fast Reactor technologies and small to medium size reactors (SMRs) refine and reuse the nuclear waste tails resulting in a near destruction of the plutonium (Brook et al. 2012; ENERGYNEWS 2011, pp. 39-40; Wiegman 2009, p. 124; Wilson and Burgh 2008, p. 119; Glover 1980, p. 81). Thus it minimises the amount of plutonium that can be proliferated. This international awareness is helping to change the perception on the nuclear energy sabotage by terrorists. In addition, there are other chemical and industrial processes that could pose a similar and even greater threat to global environment, social and economic safety and stability in the event of terrorist attack.
After the Chernobyl accident, some authors assert that it did not deter further pursuit of nuclear energy as an option. For example, Nersersian (2009, p. 286) cites the Generation IV International Forum that took place in 2000, which saw the major nuclear energy producing nations (USA, EU, Argentina, Brazil, France, Japan, Korea, South Africa, Switzerland and the UK) working on obtaining a standardised design for various types of nuclear reactors to expedite licensing and reduce capital costs and construction time. The forum revealed innovations cost effectives solutions for energy production in the sector such as the Pebble-bed Modular Reactor (PBMR) invented in South Africa. Forums such as these have continued to promote research and development, demystify the sector and contribute to change public perception given that its support is vital for the advancement of the sector.
The Fukushima Daichii accident that occurred in early March 2011 resulted in 3 deaths and costly impacts on the environment in the vicinity of the accident and beyond casted further doubts on the growth of this sector. Although nuclear energy still remains a key part of the global energy dynamics, this recent accident in the sector has impacted on nuclear projects and policies with renewed public criticism despites it being viewed by many as a key solution to the energy challenge of our era. In the midst of these contentions, a recent report by a joint secretariat of OECD Nuclear Energy Agency and the International Atomic Energy Agency (OECD-NEA/IAEA) outlines positive growth prospects for nuclear through 2035 (IAEA, 2012). The report projects an increase in world nuclear electricity generating capacity from 44% to 99% (375GWe net at the end of 2010 to between 504 GWe net in low demand case and 746 GWe net in high demand case). With respect to the base load material, the same report indicates that the potential is there to meet demand beyond 2035 and that if cutting edge technology is deployed and expansion of production to new countries happen this defined uranium base would be extended to thousands of years. The report further indicates that countries including India, the Republic of Korea, China, and the Russian Federation have shown strongest expansion of the sector.
Many experts hold different views on the barriers around nuclear energy to become main energy source replacing our fossil fuel based economy. Wang Haibin, Strategist Analyst at China Energy Fund committee identifies different human responses in developing countries to the perceived risks and benefits of nuclear energy when considered as an option with the potential to slow global warming. He categorises people into risks groups and benefits groups. He says the benefit group being the most poor and vulnerable will accept nuclear energy as bringing significant benefits, reducing the negative impacts of climate change on them. On the other hand the risk group are capable of adjusting to climate change because they are wealthier and thus will see greater risk in nuclear energy than do the poor. He states that conflict often arises as areas for the location of nuclear facilities often coincide with prosperous areas where the risk group often prefer to stay (especially along coastal areas due to high water need of the facilities). An example is the location of the Fukushima
39Journal of Natural Resources and Development 2012; 02: 33-41
Prospects for growth of the nuclear sector
Energy type Number of accidents
Direct fatalities
Direct fatalities per GWe/year
Coal 1221 25107 0.87
Oil 397 20283 0.43
Natural Gas 125 1978 0.09
Luquified natural gas 105 3921 3.53
Hydro 11 29938 4.26
Nuclear reactor 2 56 0.11
DOI number: 10.5027/jnrd.v2i0.07
40Journal of Natural Resources and Development 2012; 02: 33-41
plant case which give much incentive for and the interest of the risk group to adopt a not-in-my-back yard comportment towards locating nuclear plants. For example in China, potential sites will be the rich and pristine coast of the Yangtze Delta, Pearl River Delta and the Bohai Bay Area full of businesses and often owned by the risk groups (Haibin 2012).
Wiegman (2009, p. 252) says scientific facts should be the basis for making choices about energy options for this century and beyond. He argues that the debate around the nuclear option as a future energy choice has seen proponents or opponents accept or denying it without any scientific basis. From a sustainable standpoint, many authors assert that the merits of nuclear energy outweighs its demerits and merits of conventional energy sources and is the solution energy challenges (Harvey 2010, p. 387; Bodansky 2004, p.22). However, a major advancement with the use of nuclear energy as a main source of energy generation is not expected prior to 2050, a timescale these authors say is longer than expected for quickly curbing CO2 emissions from conventional sources.
Despite the uncertainties surrounding the future and impacts of conventional energy sources on the earth, many enthusiasts in countries like Denmark and Australia have discourage the pursuance of nuclear energy as a sound option from a sustainable standpoint. Rather they favour more exploitation and use of conventional energy sources and investments in ponderous alternative energy sources (seawaves, tidal power, windmills, geothermal) which are more capital and material intensive and fall short of their energy generating potentials. Some institutions have equally voice their support for renewable energy as a climate benign solution to meet the growing global energy needs especially for developing countries. For example the 2001 report of the Global Environmental Facility states;
A transition to renewable is inevitable, not because fossil fuel supplies will run out - large reserves of oil, coal and gas remain in the world - but because cost and risks of using these supplies will continue to increase relative to renewable energy.
It is worth mention that some authors have completely denied both the conventional energy and nuclear energy options as unfit for our era. For example, Jaccard (2005, p.2) asserts that nuclear energy and fossil fuels failed to stand the test of time with respect to financial performance as the cost of nuclear power added up higher than envisage often excluding the high cost for insurance liabilities, upfront subsidies, decommissioning and cost of permanent storage of radioactive waste. Also oil, the dominant fossil fuel has experienced a volatile price as a result of depleted resources and the geopolitical instability for example the oil price shocks of 1970s and early 1980s and the increase in price following the 1991 Gulf War and 2003 Iraq War. Contrary to other authors who cite renewable energy as incurring ponderous costs, Jaccard (2005, p.3) claims that although the initial cost for renewable energy might sometimes be very high, its cost of operation is eventually stable and predictable, reflecting the continuous and free energy from the sun and other natural forces.
The discourse on energy options that will help reverse the impending environmental, economic and social instability of the planet needs to be informed by a clear sustainability framework and indicators. It is clear from the essay that nuclear power generation incurs a significant competitive capital cost which is often deferred in some cases by government subsidies. On the other hand, its opponents who strongly support the burning of fossil fuels, fail to see carbon cost associated with the life cycle cost for conventional fuels. This cost if added results in a cost which is significantly higher than that of nuclear energy. Ongoing research and technological advances show that solutions to the safety, security, issues of waste, and construction time exist. These can be effectively harmonised and for sharing across the board in the nuclear sector which is unlikely with carbon handling from conventional energy. Thus its soundness is not doubted.
However it will require more years to agree on standards, harmonise operations and skills for wide sharing aimed at a sustainable nuclear energy sector. In addition, it will require a quick change of some present systems and adapting sectors’ operations which rely heavily on natural gas and oil. For example the transport systems, other production equipment and systems, and home heating systems to electrical. The examples of other countries like Australia and Japan that have advanced with the use of electric vehicles, electrified public transport systems, battery powered systems and electric domestic heating will be very useful. The timescale to expect a significant contribution of nuclear energy at a level which replaces the conventional energy sources as an option with less carbon emissions is difficult to estimate. The wise decision now would be to speed up this technologies and applications of this less capital, material intensive and sound option to handle the economic, social and environmental urgencies of our era.
Australian Government Department of Resources, Energy and Tourism 2011, ‘Energy in
Australia 2011’, ENERGYNEWS, vol. 29, no. 4.
Bartzis, J, 1995, ‘Environmental Monitoring and Simulation’, in Avouris N and Page B
(eds), Environmental informatics: methodology and applications of environmental
information processing. Kluwer Academic Publishers, pp. 138-150.
Bodansky, D 2004, Nuclear energy: principles, practices and perceptions, Spinger, New
York.
BP 2006, Global consumption by energy type as of 2006, British Petroleum, London.
Brook, B 2011, ‘Advanced Nuclear Power Systems for Long-term Energy and Climate
Security’, ENERGYNEWS, vol. 29, no. 2, pp. 39-40.
Brook, B, Blees, T, and Hannum, W 2012, Nuclear Waste: Use fast reactors to burn
plutonium, Nature, 486, pp.167-168.
Bulletin of Atomic Scientists (2012), The nuclear approach to climate risk, http://www.
thebulletin.org/web-edition/roundtables/the-nuclear-approach-to-climate-risk,
accessed 4/08/2012.
CDIAC 2012, Carbon dioxide Information Analysis Centre – http:/cdiac.ornl.gov, accessed
12/08/2012
Davidson, k 2011, ‘Can we measure sustainability?’ in Roetman P &Daniels C (eds),
Creating Sustainable communities in a changing world. Crawford House Publishing,
Conclusion
References
DOI number: 10.5027/jnrd.v2i0.07
41Journal of Natural Resources and Development 2012; 02: 33-41
Adelaide, pp. 5-11.
Dittmar, M 2012, ‘Nuclear energy: Status and future limitations’,Energy, vol. 37, no. 1, pp.
35 – 40.
Eerkens, J 2006,The nuclear Imperatives, Springer, Dordrecht.
Evans, A, Strezov V, & Tim, E 2009, Comparing the sustainability parameters of renewable,
nuclear and fossil fuel electricity generation technologies, http://www.worldenergy.
org/documents/congresspapers/272.pdf, accessed 20/04/2012,
Faeth, P 2012, ‘Energy Security and Water’, Environment, vol. 54, no. 1 pp. 4-6.
Garnaut, R 2008, the Garnaut Climate Change Review; Final Report, Cambridge University
Press, Melbourne
Gautier, C 2008, Oil, Water and Climate: An introduction, Cambridge University Press,
Cambridge.
GEF 2001, Renewable Energy: GEF partners with Business for a Better Future, 3,
Washington DC,
Geodesic 2002, Australian Energy News, Issue 24, June, p. 23.
Goldie, J, Douglas B, &Furnass, B 2005,In Search of Sustainability, CSIRO.
Goodstein, D 2004, Out of Gas: the End of the Age of oil, Norton, New York.
Gover, J 1980, The struggle for power: the real issue behind the uranium argument, E. J.
Dwyer Pty Ltd, NSW.
Haibin, W 2012, The nuclear approach to climate risk: To each technology, its proper
time and place, Bulletin of the Atomic Scientist, http://thebulletin.org/web-edition/
roundtables/the-nuclear-approach-to-climate-risk, accessed 15/08/2012
Harvey, L 2010, Energy and the New Reality: Carbon-free energy supply, Earthscan Ltd,
London.
Hinrichsen, D 2012, Commentary: 20 years on - and time runs desperately short,
http://www.peopleandplanet.net/?lid=30401§ion=33&topic=27, accessed
19/08/2012
IAEA 2012, Global Uranium Supply Ensured for Long Term, http://www.iaea.org/
newscenter/pressreleases/2012/prn201219.html, accessed 04/08/2012
IEA2011, ‘World Energy Outlook (WEO) 2011’, ENERGYNEWS, vol. 29, no. 4, p. 102
IEA 2011, CO2Emissions from Fuel Combustion, http://www.iea.org/co2highlights/
co2highlights.pdf, accessed 19/04/2012.
IAEA 2000, Comparative Carbon Dioxide Emissions from Power Generation, http://www.
worldnuclear.org/education/comparativeco2.html, accessed 17/08/2012
IPCC 2007, Contribution of Working Group III to the Fourth Assessment Report of the
Intergovernmental Panel on Climate Change, 2007, Cambridge University Press,
Cambridge Fourth Assessment Report: Climate Change 2007
Iwaro, J, &Mwasha, A 2010, ‘Towards energy sustainability in the world: the implications
of energy subsidy for developing countries’, International Journal of Energy and
Environment, Vol.1, Issue 4 pp. 705-715.
Jaccard, M 2005, Sustainable Fossil Fuels: The unusual suspect in the quest for clean and
enduring energy, CUP, Cambridge.
Kelton, G 2012, ‘Premier confident mine will go ahead’, Advertiser 17, April 2012, p. 12.
Makhijani, A 1996, comparison of fossil fuels and nuclear energy, Energy and society,
Energy and Society, pp. 14-16
Meaton, C 2010, ‘The elephant in the energy room’, ENERGYNEWS, vol. 28, no. 3, pp.
68-69.
Muhammad, I 2012, Visualising Global Shift in Energy Demand and Supply, International
Journal of Energy Economics and Policy, Vol. 2, No.3, p134-146.
Murray, L 2009, The History of nuclear energy, viewed 18/04/2012DOI: 10.1016/B978-0-
12-370547-1.00015-8.
Nakicenovic, N. And Grübler, A. (2000) ‘Energy and the protection of the atmosphere’,
International Journal of Global Energy Issues, Vol. 13, Nos. 1–3, pp.4–57.
NAS 2009, America’s Energy Future: Technology and Transformation, National Academies
Press, Washington.
Nersesian, R 2007, Energy for the 21st Century: a comparative guide to conventional and
alternative sources, M.E. Sharpe, London.
Ola, E, and Bjorn, F 2001, ‘An approach to sustainability assessment of energy’, in
Semedi S (ed), Building sustainable energy systems: Swedish Experience, Bulls
Tryckeriaktiebolag, Halstad, pp. 503-530.
Pradeep, S 2009, Energy and Climate Change: issues of sustainable development , The
Associate Publishers, AmbalaCantt, India.
Rothwell, G,& Graber, R 2010,‘The role of nuclear power in climate change’, in Sioshansi
F (ed) Generating electricity in a carbon-constrained world, Academy Press, pp. 175-
206, DOI: 10.1016/B978-1-85617-655-2.00020-1.
Selena, Ng 2009, ‘Global Nuclear Power and Opportunities for Australia’, ENERGYNEWS,
vol. 27, no. 2, pp. 27-28.
Squassoni, S 2007, Risks and Realities: The “New Nuclear Energy Revival, http://www.
armscontrol.org/act/2007_05/squassoni, viewed 17/08/2012
Stamford, L 2011, ‘Sustainability indicators for the assessment of nuclear power’ Energy,
vol. 36, no. 10, pp. 6037-6057, viewed 17 April 2012, DOI: 101016/j.energy.2011.08.011.
US Energy Information Administration 2004, Projections: Energy for the analysis of global
energy markets in 2007, International Energy Annual, May-July 2006.
Vacla, S 2003, at the Crossroads; global perspectives and uncertainties, The MIT Press,
London.
WCED Report 1987, http://www.un-documents.net/our-common-future.pdf, accessed
01/08/2012
WEO 2011, Cost of delaying action on climate change, http://www.iea.org/publications/
worldenergyoutlook/publications/weo-2011/, accessed 17/08/2012
Wiegman, D, 2009, Climate change: what we know and what to do about it, Island
Press, California.
Wilson, J, and Burgh, G 2008, Energising our future: Rational choices for the 21st Century,
John Wiley & Sons, New Jersey.
DOI number: 10.5027/jnrd.v2i0.07