Embed Size (px)
Citation preview

A joint newsletter of theStatistical Computing& Statistical GraphicsSections of the AmericanStatistical Association.
Winter 2002Vol.13 No.2
A WORD FROM OUR CHAIRS
Statistical Computing
Susan Holmes is the 2002 Chairof the Statistical Computing Sec-tion.
As we come to the new year I would like to remind youthat the new President Elect of the ASA is one of thefounding fathers of Statistical Computing: Brad Efron.As he takes on this new challenge he is asking us to pro-vide him with names of our most dynamic volunteersfor many committee positions he has to fill, if you areinterested in nominating someone or yourself to any ofASA’s many committees (I will not list them here, thereare more than a page’s worth), please send email to: JimDickey, [email protected], by phone at (703) 684-1221or by mail to: Jim Dickey, ASA, 1429 Duke Street,Alexandria, VA 22314. It is important that our sectionkeeps providing participants for the committees that areactually making the decisions for the ASA, as we haveseen in the past, our priorities may be different and thisis a great way to voice them.
Statistical computing is making a big difference in thefield of biology in which I work, I just finished teachingmy first ‘Introductory Statistics for Biologists’ using R,and had an enthusiastic reception from the students whoafter some difficulties-( a steep learning curve at the be-ginning!), really like the empowerment that R brings tothem.
I am proud to be part of such a dynamic community whois setting the tone for the future of microarray analysiswith the wonderful Bioconductor project, and the
Statistical Graphics
Steve Eick is the 2002 Chair forthe Statistical Graphics Section.
It’s been great to be the 2002 Graphics Section Chair,although I’m looking forward to being Chair emeritus.The contributions of all of the section officers are partic-ularly appreciated with special note and thanks to Deb-orah Swayne and Di Cook.
What’s new in the world of visualization? I think we’reabout due for a new generation of visualization tools.The other day I ran across some stunning performancestatistics. The graphics capability of PCs is increas-ing at dramatic rate driven by the economics of the UScomputer game industry. In 2001, the US game indus-try grossed $6.3 billion despite a global recession. ATIdemonstrated their latest chip at Siggraph on a scenethat used to take 20 minutes/frame in 1998. It now runsat 60 Hz, a factor of 72,000x speed increase in 4 years,compared to about 5x for Moore’s law over the sametime. nVidia’s new chip can render Toy Story scenesin real time that used to require a rendering farm foroff-line processing a few years ago. When fundamen-tal component performance rates change by one to twomagnitudes, it is often worthwhile to re-engineer thesystems containing the components. Such a dramaticincrease in graphics performance is likely to create op-portunities for another generation of visualization toolsthat moves beyond polygons, texture mapping, and 3D.The research challenge is how to exploit this capability.
CONTINUED ON PAGE 8...

SPECIAL ARTICLE
Dynamically ConditionedChoropleth Maps:Shareware ForHypothesis Generationand EducationDaniel B. Carr, Yuguang Zhang, Yaru Li, GeorgeMason University
OverviewThis article introduces a dynamic Java shareware ap-plication called conditioned choropleth (CC) maps.CCmaps is a tool for exploratory analysis ofgeospatially-indexed data. In particular its dynamicpartitioning sliders facilitate stratified comparison ofregions such as states or counties. The goals ofCCmaps include better-focused hypothesis generationabout geospatial patterns and involvement of more peo-ple. The simple user interface and associated descrip-tive statistics also makes CCmaps a suitable tool for avariety of educational purposes. The software is avail-able via www.galaxy.gmu.edu/∼dcarr/ccmaps.
Background: Limitations and Uses of Choro-pleth MapsChoropleth maps display regions on a map, such asstates, and use the color of each region to representa statistic describing the region. Typically a classedchoropleth map converts the statistics of interest intosix or fewer classes and represents these classes usingeasily distinguished hues. Figure 1 is an example ofa three-class choropleth map. The regions in the fig-ure are health service areas (counties or aggregates ofcounties based on where people get their hospital care).The statistics represented are the lung cancer mortalityrates for white men ages 65-74 during the period 1988to 1992. The mortality rates are expressed as the num-ber of deaths per 100,000. Regions with rates from 60to 370 appear in blue. Regions with rates between 38and 45 appear medium gray and those with higher ratesappear red. In simple terms the colors indicated regionswith low, medium and high rates. Spatial patterns arequite evident. Most of the blue appears in the West andmuch of the red appears in the Southeast.
The cartographic community recognizes the manyweaknesses of choropleth maps (Dent 1990). Oneweakness is that political region boundaries may havelittle relationship to the contours of the underlying phe-
nomena of interest. The political regions are like pre-cut jigsaw puzzle pieces. The choropleth map approachpaints each piece one color based on the class of an as-sociated statistic, and put the pieces together in the hopeof producing a puzzle piece step function that approxi-mates the underlying surface. If the researcher choosesdifferent regions as the basis for statistical summaries,such as zip code regions, the resulting choropleth mapcan look quite different. The problem of obtaining dif-ferent views due to the choice of summarization regionsis well known and goes by a variety of names such asthe modifiable areal unit problem. Gotway and Young[2002] provide a recent discussion.
A second weakness is that region area can inappropri-ately influence our perception of estimate importance.Our visual system gives more weight to regions withlarger areas. In mortality studies, the number of peo-ple being described is typically more important thanthe area of the region that was chosen as basis for pro-viding a summary. This motivated Dorling (1995) torepresent statistics using equal population cartograms.The choropleth map, however, remains the more popu-lar representation. In part this is because the traditionalboundaries stay the same as the populations change andthe map looks familiar.
A third common weakness in a choropleth map is thatan indication of estimate uncertainty is typically absent.A rare exception is the use of stripped regions to pro-vide a two-class representation of estimate reliability(MacEachren, Brewer and Pickle 1995). Stripped re-gions indicate estimates with poor reliability.
Even a tight confidence bound for a region estimatedoes not make the modifiable areal unit problem goaway. If the region of interest is a state, a tight confi-dence bound for population-based rate can simply in-dicate a large population. At the same time there maybe huge variation in the mortality rates for the differ-ent counties of that state. Carr, Wallin and Carr (2000)used boxplots to indicate spatial variation for smallerregions that cover the summarization region. However,such graphics are not typically connected to choroplethmaps. Similarly estimates based on several years of datamay hide variation over time. Such spatial-temporalresolution issues will remain even with increased abil-ity to collect data. For example, federal agencies of-ten restrict the spatial-temporal resolution of summariesmade available to the public in order to address confi-dentiality issues.
There are of course other problems associated withchoropleth maps such as the confounding of variablesand absence of desired data. These common problems
2 Statistical Computing & Statistical Graphics Newsletter Vol.13 No.2

Figure 1: A 3-class chloropleth map showing health service areas.
are not specific to choropleth maps.
Despite the weaknesses, choropleth maps remain popu-lar and researchers continue using them to generate hy-pothesis about the spatial patterns that appear. Display-ing geospatially-indexed estimates on a map is a goodstrategy for hypothesis generation. Researchers oftenrelate their knowledge about phenomena, such as cli-mate, traffic density, sales, and so on, to spatial loca-tion. Spatial patterns appearing on a map can triggerrecall of knowledge that provides the basis for explain-ing observed patterns.
Spatial patterns may be due to many sources of vari-ation. In the context of generating hypotheses, JohnTukey (1976) said that, “the unadjusted plot should notbe made.” In other words, our perceptual/cognitive abil-ities are poor in terms of adjusting for known sources ofvariation and envisioning the result as a map. A bet-ter strategy is to control for known sources of variationand/or adjust the estimates before making the map.
Different communities control or adjust for anticipatedsources of variation in different ways. In mortality stud-ies well-trained statisticians can use sophisticated re-gression/smoothing methods to adjust for known risk
factors and then display the residuals on a map. Thispreferred approach is accessible to a very limited com-munity.
A more common mapping practice stratifies the pop-ulation of interest into more homogeneous groups andproduces separate maps for each stratum. In mortalityrate mapping, for example, sex and race specific mapsare standard and woe be to the researcher that does notdisplay age specific or age-adjusted estimates.
The stratification approach leads to a multiplicity ofmaps that grows exponentially with the number of strat-ification factors. At the same time the population basefor obtaining estimates decreases. These are importantconsiderations in terms of producing an atlas of mortal-ity maps. The award winning Atlas of United StatesMortality (Pickle et al. 1997) shows maps that con-trol for sex, race, and age and describes other knownrisk factors. The desire to control the variation due totwo additional risk factors motivated the developmentof CCmaps.
Vol.13 No.2 Statistical Computing & Statistical Graphics Newsletter 3
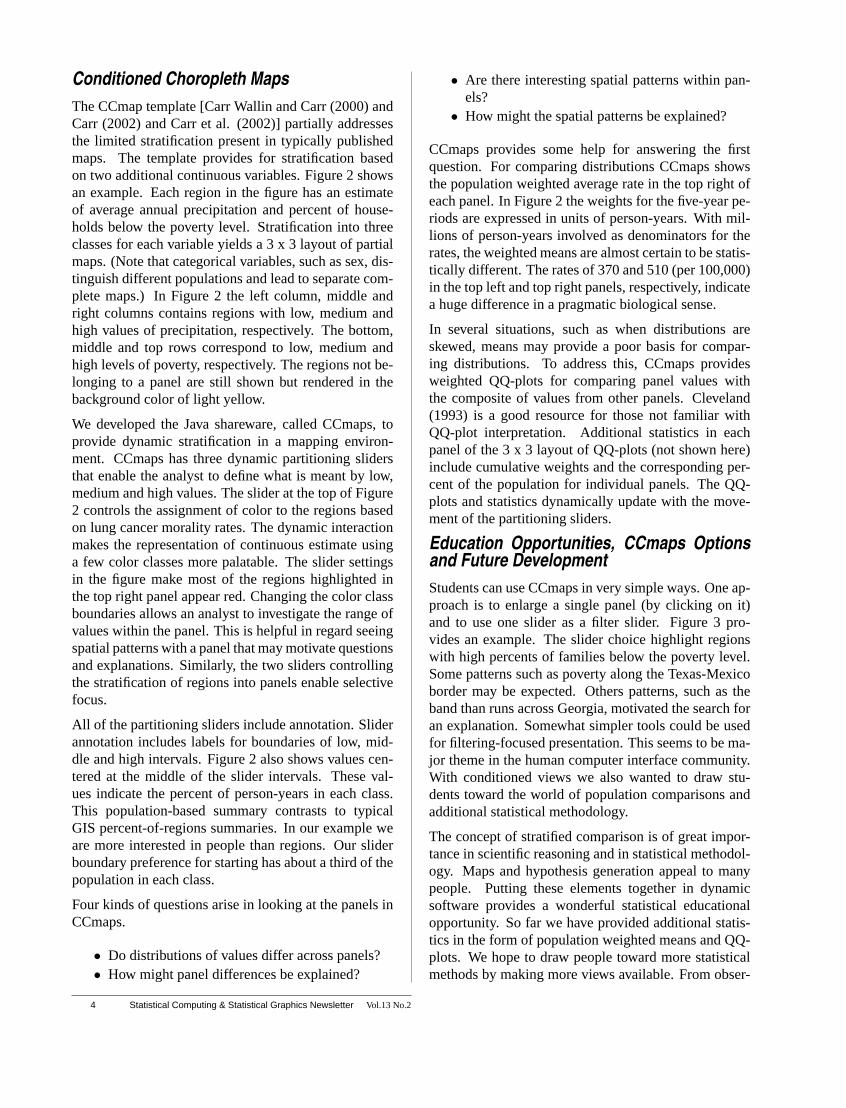
Conditioned Choropleth MapsThe CCmap template [Carr Wallin and Carr (2000) andCarr (2002) and Carr et al. (2002)] partially addressesthe limited stratification present in typically publishedmaps. The template provides for stratification basedon two additional continuous variables. Figure 2 showsan example. Each region in the figure has an estimateof average annual precipitation and percent of house-holds below the poverty level. Stratification into threeclasses for each variable yields a 3 x 3 layout of partialmaps. (Note that categorical variables, such as sex, dis-tinguish different populations and lead to separate com-plete maps.) In Figure 2 the left column, middle andright columns contains regions with low, medium andhigh values of precipitation, respectively. The bottom,middle and top rows correspond to low, medium andhigh levels of poverty, respectively. The regions not be-longing to a panel are still shown but rendered in thebackground color of light yellow.
We developed the Java shareware, called CCmaps, toprovide dynamic stratification in a mapping environ-ment. CCmaps has three dynamic partitioning slidersthat enable the analyst to define what is meant by low,medium and high values. The slider at the top of Figure2 controls the assignment of color to the regions basedon lung cancer morality rates. The dynamic interactionmakes the representation of continuous estimate usinga few color classes more palatable. The slider settingsin the figure make most of the regions highlighted inthe top right panel appear red. Changing the color classboundaries allows an analyst to investigate the range ofvalues within the panel. This is helpful in regard seeingspatial patterns with a panel that may motivate questionsand explanations. Similarly, the two sliders controllingthe stratification of regions into panels enable selectivefocus.
All of the partitioning sliders include annotation. Sliderannotation includes labels for boundaries of low, mid-dle and high intervals. Figure 2 also shows values cen-tered at the middle of the slider intervals. These val-ues indicate the percent of person-years in each class.This population-based summary contrasts to typicalGIS percent-of-regions summaries. In our example weare more interested in people than regions. Our sliderboundary preference for starting has about a third of thepopulation in each class.
Four kinds of questions arise in looking at the panels inCCmaps.
• Do distributions of values differ across panels?• How might panel differences be explained?
• Are there interesting spatial patterns within pan-els?
• How might the spatial patterns be explained?
CCmaps provides some help for answering the firstquestion. For comparing distributions CCmaps showsthe population weighted average rate in the top right ofeach panel. In Figure 2 the weights for the five-year pe-riods are expressed in units of person-years. With mil-lions of person-years involved as denominators for therates, the weighted means are almost certain to be statis-tically different. The rates of 370 and 510 (per 100,000)in the top left and top right panels, respectively, indicatea huge difference in a pragmatic biological sense.
In several situations, such as when distributions areskewed, means may provide a poor basis for compar-ing distributions. To address this, CCmaps providesweighted QQ-plots for comparing panel values withthe composite of values from other panels. Cleveland(1993) is a good resource for those not familiar withQQ-plot interpretation. Additional statistics in eachpanel of the 3 x 3 layout of QQ-plots (not shown here)include cumulative weights and the corresponding per-cent of the population for individual panels. The QQ-plots and statistics dynamically update with the move-ment of the partitioning sliders.
Education Opportunities, CCmaps Optionsand Future DevelopmentStudents can use CCmaps in very simple ways. One ap-proach is to enlarge a single panel (by clicking on it)and to use one slider as a filter slider. Figure 3 pro-vides an example. The slider choice highlight regionswith high percents of families below the poverty level.Some patterns such as poverty along the Texas-Mexicoborder may be expected. Others patterns, such as theband than runs across Georgia, motivated the search foran explanation. Somewhat simpler tools could be usedfor filtering-focused presentation. This seems to be ma-jor theme in the human computer interface community.With conditioned views we also wanted to draw stu-dents toward the world of population comparisons andadditional statistical methodology.
The concept of stratified comparison is of great impor-tance in scientific reasoning and in statistical methodol-ogy. Maps and hypothesis generation appeal to manypeople. Putting these elements together in dynamicsoftware provides a wonderful statistical educationalopportunity. So far we have provided additional statis-tics in the form of population weighted means and QQ-plots. We hope to draw people toward more statisticalmethods by making more views available. From obser-
4 Statistical Computing & Statistical Graphics Newsletter Vol.13 No.2
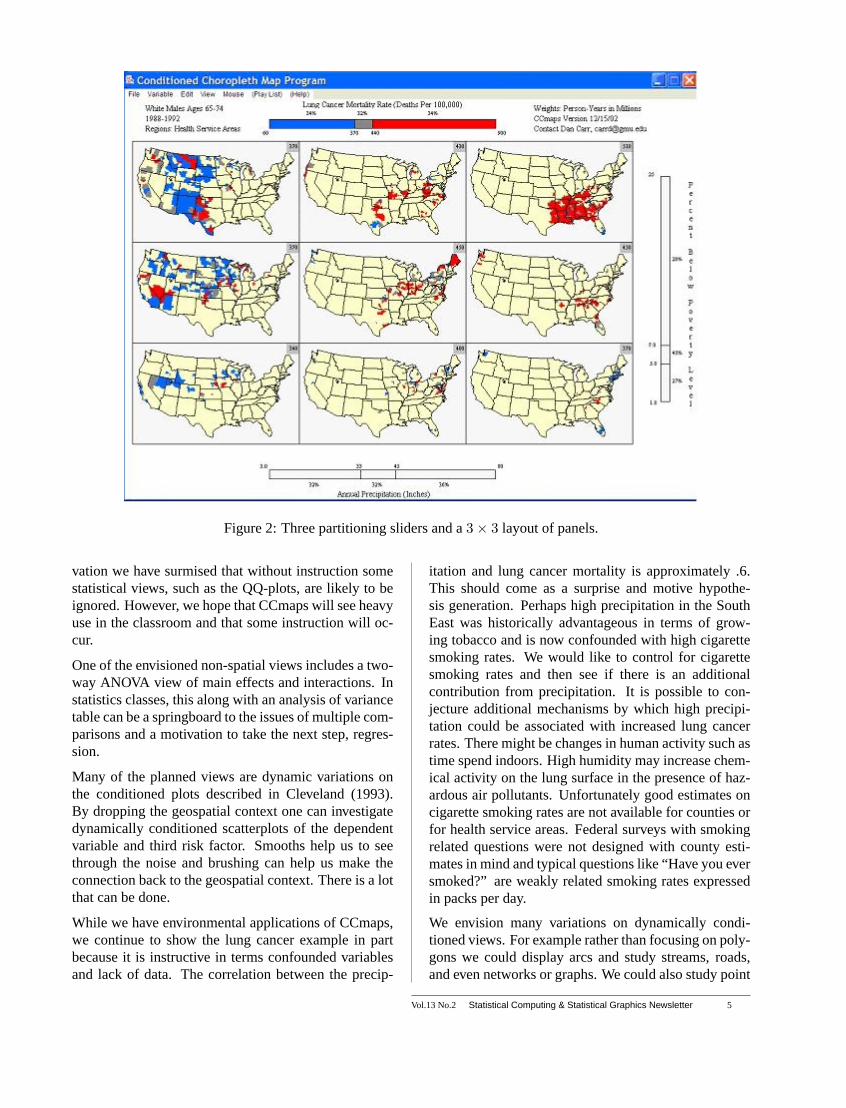
Figure 2: Three partitioning sliders and a3× 3 layout of panels.
vation we have surmised that without instruction somestatistical views, such as the QQ-plots, are likely to beignored. However, we hope that CCmaps will see heavyuse in the classroom and that some instruction will oc-cur.
One of the envisioned non-spatial views includes a two-way ANOVA view of main effects and interactions. Instatistics classes, this along with an analysis of variancetable can be a springboard to the issues of multiple com-parisons and a motivation to take the next step, regres-sion.
Many of the planned views are dynamic variations onthe conditioned plots described in Cleveland (1993).By dropping the geospatial context one can investigatedynamically conditioned scatterplots of the dependentvariable and third risk factor. Smooths help us to seethrough the noise and brushing can help us make theconnection back to the geospatial context. There is a lotthat can be done.
While we have environmental applications of CCmaps,we continue to show the lung cancer example in partbecause it is instructive in terms confounded variablesand lack of data. The correlation between the precip-
itation and lung cancer mortality is approximately .6.This should come as a surprise and motive hypothe-sis generation. Perhaps high precipitation in the SouthEast was historically advantageous in terms of grow-ing tobacco and is now confounded with high cigarettesmoking rates. We would like to control for cigarettesmoking rates and then see if there is an additionalcontribution from precipitation. It is possible to con-jecture additional mechanisms by which high precipi-tation could be associated with increased lung cancerrates. There might be changes in human activity such astime spend indoors. High humidity may increase chem-ical activity on the lung surface in the presence of haz-ardous air pollutants. Unfortunately good estimates oncigarette smoking rates are not available for counties orfor health service areas. Federal surveys with smokingrelated questions were not designed with county esti-mates in mind and typical questions like “Have you eversmoked?” are weakly related smoking rates expressedin packs per day.
We envision many variations on dynamically condi-tioned views. For example rather than focusing on poly-gons we could display arcs and study streams, roads,and even networks or graphs. We could also study point
Vol.13 No.2 Statistical Computing & Statistical Graphics Newsletter 5
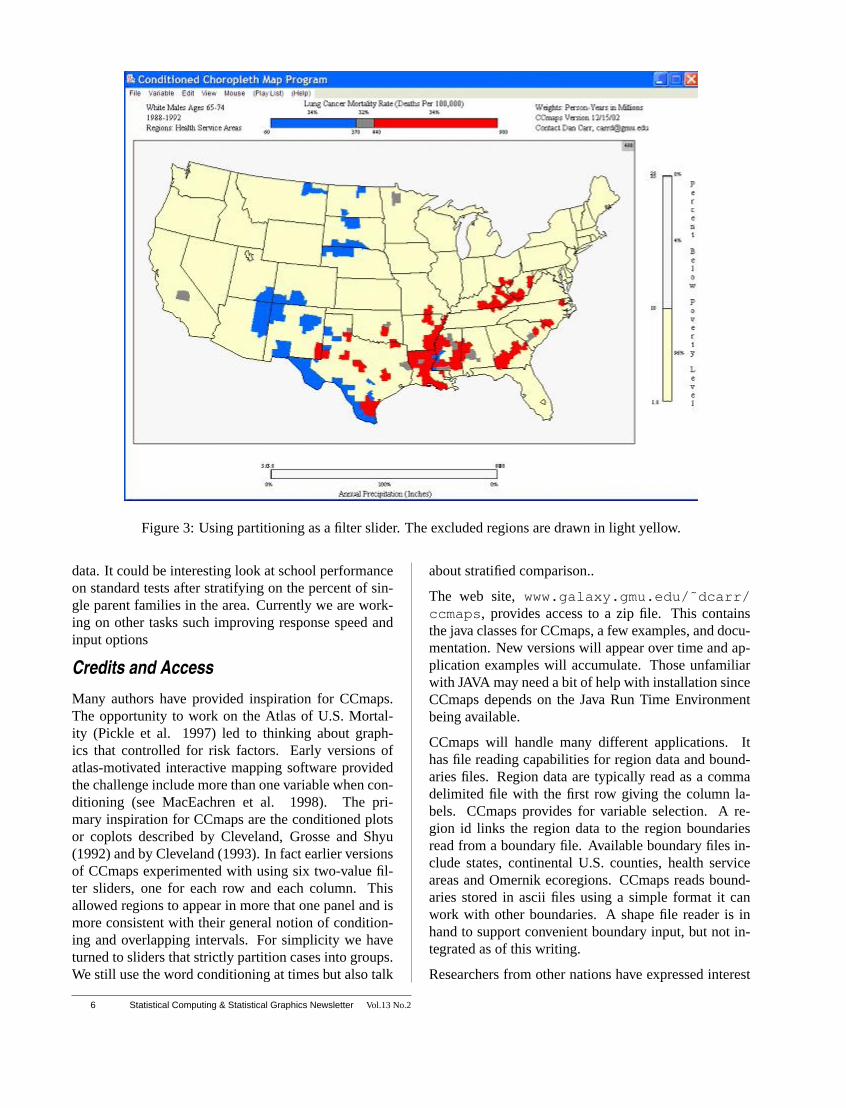
Figure 3: Using partitioning as a filter slider. The excluded regions are drawn in light yellow.
data. It could be interesting look at school performanceon standard tests after stratifying on the percent of sin-gle parent families in the area. Currently we are work-ing on other tasks such improving response speed andinput options
Credits and AccessMany authors have provided inspiration for CCmaps.The opportunity to work on the Atlas of U.S. Mortal-ity (Pickle et al. 1997) led to thinking about graph-ics that controlled for risk factors. Early versions ofatlas-motivated interactive mapping software providedthe challenge include more than one variable when con-ditioning (see MacEachren et al. 1998). The pri-mary inspiration for CCmaps are the conditioned plotsor coplots described by Cleveland, Grosse and Shyu(1992) and by Cleveland (1993). In fact earlier versionsof CCmaps experimented with using six two-value fil-ter sliders, one for each row and each column. Thisallowed regions to appear in more that one panel and ismore consistent with their general notion of condition-ing and overlapping intervals. For simplicity we haveturned to sliders that strictly partition cases into groups.We still use the word conditioning at times but also talk
about stratified comparison..
The web site,www.galaxy.gmu.edu/˜dcarr/ccmaps , provides access to a zip file. This containsthe java classes for CCmaps, a few examples, and docu-mentation. New versions will appear over time and ap-plication examples will accumulate. Those unfamiliarwith JAVA may need a bit of help with installation sinceCCmaps depends on the Java Run Time Environmentbeing available.
CCmaps will handle many different applications. Ithas file reading capabilities for region data and bound-aries files. Region data are typically read as a commadelimited file with the first row giving the column la-bels. CCmaps provides for variable selection. A re-gion id links the region data to the region boundariesread from a boundary file. Available boundary files in-clude states, continental U.S. counties, health serviceareas and Omernik ecoregions. CCmaps reads bound-aries stored in ascii files using a simple format it canwork with other boundaries. A shape file reader is inhand to support convenient boundary input, but not in-tegrated as of this writing.
Researchers from other nations have expressed interest
6 Statistical Computing & Statistical Graphics Newsletter Vol.13 No.2

in CCmaps. We anticipate help in producing versions inother languages.
AcknowledgementsThe current version of CCmaps builds up the initial Javaimplementation of Duncan MacPherson. This work waspartially supported by NSF Grant No. 9983461.
ReferencesDent, B. D. (1990)Cartography Thematic Map Design,Second Edition, Wm C. Brown Publishers, Dubuque,Iowa.
Carr, D. B, Wallin, J. F. and Carr, D. A. (2000) Two NewTemplates for Epidemiology Applications. Linked Mi-cromap Plots and Conditioned Choropleth Maps,Statis-tics in Medicine, 19:2521-2538.
Carr, D. B. (2002)Graphical Displays, Encyclopediaof Environmetrics, Eds. A. H. El-Shaarawi and W. W.Piegorsch, Vol. 2. John Wiley & Sons, pp. 933-960
Carr, D. B, Chen, J., Bell, S., Pickle, L. and Zhang,Y. (2002) Interactive Linked Micromap Plots And Dy-namically Conditioned Choropleth Maps,Proceedingsof the Second National Conference on Digital Govern-ment Research, May 20-22, pp. 61-67.
Cleveland, W. S. (1993)Visualizing Data, Hobart Press,Summit, New Jersey.
Dorling, D. (1995)A New Social Atlas of Britain.John
Wiley and Sons, Chichester, England.
Cleveland, W. S., Grosse, E. and Shyu, W. M. (1992)Local Regression Models. Statistical Models In S, Eds:J. M. Chambers and T. J. Hastie. Wadsworth andBrooks Cole, Pacific Grove, CA.
Gotway, C. A. and Young, L. J. (2002) Combining In-compatible Spatial Data.Journal of the American Sta-tistical Association.97(458):632–648.
Pickle, L. W., Mungiole, M., Jones, G. K. and White,A.A. (1997) Atlas of United States Mortality. Hy-attsville, MD: National Center for Health Statistics.
MacEachren, A.M., Boscoe, F.P., Haug, D. and Pickle,L.W., (1998) Geographic Visualization: Designing Ma-nipulable Maps for Exploring Temporally Varying Geo-referenced Statistics,Proceedings, Information Visual-ization ’98. IEEE Computer Society, Raleigh-Durham,NC, Oct. 19-20, 1998, pp. 87-94.
MacEachren, A.M. Brewer, C.A. and L.W. Pickle(1995) Mapping Health Statistics: Representing DataReliability. Proceedings of the 17th International Car-tographic Conference, Barcelona, Spain.Barcelona;Institut Cartograpjic de Catalunya.
Tukey, J.W. (1976) Statistical mapping: What shouldnot be plotted,Proceedings of the 1976 Workshop onAutomated Cartography and Epidemiology.U. S. De-partment of Health, Education, and Welfare, Arlington,Virginia, March 18-19, 1976, pp. 18-26.
Editorial
Well we almost made the 2 issues within the calendaryear. The December issue needed a little more polish-ing before it got broadcast, so it didn’t get completelyfinalized before Christams. So happy new year!
There are a number of good articles in this issue, fo-cusing on graphics and graphics software. Our regularcontributor, Dan Carr, is back with new, lovely ideasand software for geographic data visualization. Mar-tin Theus, from the Augsburg group discusses his soft-ware, Mondrian. Zach Cox a student in electrical en-gineering at Iowa State University, now-graduated, hascontributed an article on his software JSOMap, whichcontributes to visual methods for self-organizing maps.Heike Hofmann tests out the microarray analysis toolsin the R BioConductor package, and reports on her ex-periences. The statistical computing and graphics pro-gram chairs for JSM 2003 give a preview of the pro-gram. And finally there are several reports from confer-ences that occurred this year, JSM ’02, InfoViz ’02 and
Data Visualization III.
Thank you to all the contributors to this issue and werequest submissions in the form of papers for the nextnewsletter, to appear at the early in 2003. The newslet-ter is a good forum for interesting, new, on-the-edge ma-terial. So please send us more submissions! We’re aim-ing in the future (from the next issue) to get the newslet-ter to appear regularly at the end of April and Octobereach year.
Di has been working on posters to highlight statisticalgraphics. By the next issue she may be able to focussome but if not there’ll be samples available on her website. If you have favorite graphics please let her knowabout them - they might be potential candidates to forthe primary graphic on a poster.
Dianne Cook and Ranjan Maitra
Vol.13 No.2 Statistical Computing & Statistical Graphics Newsletter 7

FROM OUR CHAIRS (Cont.). . .
Statistical ComputingCONTINUED FROM PAGE 1
graphical power of GGobi for analysing the largedatasets flooding the field. Providing the tools that im-plement the research that we do in multivariate and non-parametric will still be useful many years from now, asthis success shows.
Let me remind you that the abstract deadlines are com-ing up, San Francisco will host JSM 2003, and I hopeto see many of you here!
Keep coding... with all the success that you deserve, Iwish you all a happy new year, with a special wish forpeace in these troubled times.
Susan Holmes,Associate Professor,Statistics, Stanford [email protected]
©©
Statistical GraphicsCONTINUED FROM PAGE 1
At a personal level, my startup is launched and moving.We named the company Visintuit, our second choice fora name. A deep web search revealed that our originalname, a combination of the letters in our last names,belonged to a Bosnian war criminal. Starting a com-pany with no revenues and no venture money is ex-
tremely focusing. It’s pretty tough right now to landinvestment funding and so we decided that this com-pany had to be customer-funded. After flailing aroundat bit, we realized that there is a huge opportunity to ap-ply visualization to Intelligence Analysis and HomelandSecurity problems. We subsequently landed a researchcontract to create the Analysis Whiteboard, an informa-tion visualization tool that enables an analyst to manip-ulate a knowledge space, organize hypothesis, collectfacts, link structures, create arguments, and visualizerelationships. Although our initial focus is on intelli-gence analysts, a broad swath of the US economy is fo-cused on information analysis. Our hope, as with everyentrepreneur, is that the Analysis Whiteboard will beuseful for many professions including law enforcementdetective work, financial investigators, lawyers, histori-ans, investigative reporters, and maybe even universityprofessors! My next goal is get customer number two.
The next few years look to be really interesting times tobe involved with visualization. As I indicated above, in-creased graphics power will relieve many existing per-formance constraints and open up opportunities to dra-matically new approaches. It will be a fun ride as thesechipsets get deployed.
Please consider getting involved with section activities.The health of our section, one of the largest in ASA,depends on volunteers.
Stephen G. EickCEO and Co-founder Visintuit, [email protected]
©©
TOPICS IN BIOINFORMATICS
Experiences withBioConductor
Heike Hofmann, Statistics, Iowa State University
This article shows the sldies from a presentationmade at Iowa State University on using BioConduc-tor www.bioconductor.org for data collected onArabidopsis plants using Affymetrix arrays.
8 Statistical Computing & Statistical Graphics Newsletter Vol.13 No.2

Vol.13 No.2 Statistical Computing & Statistical Graphics Newsletter 9

10 Statistical Computing & Statistical Graphics Newsletter Vol.13 No.2

SOFTWARE PACKAGES
Interactive DataVisualization usingMondrianMartin Theus, University of Augsburg, Departmentof Computeroriented Statistics and Data Analy-sis, Universitatsstr. 14, 86135 Augsburg, Germany,[email protected]
IntroductionThis article presents the Mondrian graphical data visu-alization software. It is written in Java and is avail-able for Windows, Unix and Mac OS X. Key featuresof Mondrian are its high level of interactivity, a highlystructured selection mechanism, and pervasive use oflinking throughout. Mondrian tries to combine the bestfeatures of interactivity that have been seen in soft-ware like DataDesk, Manet and others.The idea of se-lection sequences, first introduced in Manet, has beenimplemented within the context of selection rectangles.Selection rectangles allow users to select data pointsprogressively and visualize the selected points interac-tively.Besides the standard plots like histograms, scat-terplots, barcharts and maps, Mondrian offers specialmultivariate plots: mosaic plots for categorical vari-ables and parallel coordinates plots for continuous vari-ables.A direct link to databases (currently restricted tomySQl databases) offers the ability to work on largerdata sets. Furthermore, Mondrian has graphical tools tohandle large data sets. Alpha-blending is used to coun-teract overplotting problems, and (logical) zooming op-erations support navigation of the data set.Mondrianfollows the recommended convention of graphical userinterface. The implementation emphasizes speed andease of use.The paper concentrates on the interactive
properties of Mondrian. The software is mainly for dataexploration rather than simply static data presentation.
Special Plots for High Dimensional DataAlthough linking and highlighting across different plotscan already increase the number of dimensions to lookat simultaneously, it is desirable to find visualizationswhich include many variables at a time. Mosaic plotsfor categorical data and parallel coordinate plots forcontinuous data are ideal for gaining insight into highdimensional data.
Mosaic Plots
Mosaic plots are a relatively new development. Recentimplementations include a static version for S-Plus andR by Emmerson (1998) and an interactive version byHofmann (1998) within theMANET software. To flex-ibly reorder the variables in the plot and to include andexclude variables the four arrow keys are used. Emptycells which occur very often if the number of crossedcategories is very high, are not subdivided on lowerlevels. In situations with many crossed variables thisusually reduces the number of cells to draw drastically.Since Mondrian supports queries there are no labelsprinted around a mosaic plot. With only a few vari-ables and categories in a mosaic plot, labels usually fitaround the plot. But more complex plots with, e.g. 8 bi-nary variables would need twice as much space for thelabels as for the plot itself. Additionally to queries, thename of the data set and the names of the variables in theplot are shown in the title bar of the plot window.Manydata sets and most database queries present data in analready summarized form, i.e. a table. In Mondrian mo-saic plots as well as barcharts can handle data which issummarized, specifying attribute variables and a countvariable. Obviously any non-negative numeric variablecan be used as a weight variable, which allows for veryflexible plots, which might be hard to interpret. A sim-
Vol.13 No.2 Statistical Computing & Statistical Graphics Newsletter 11
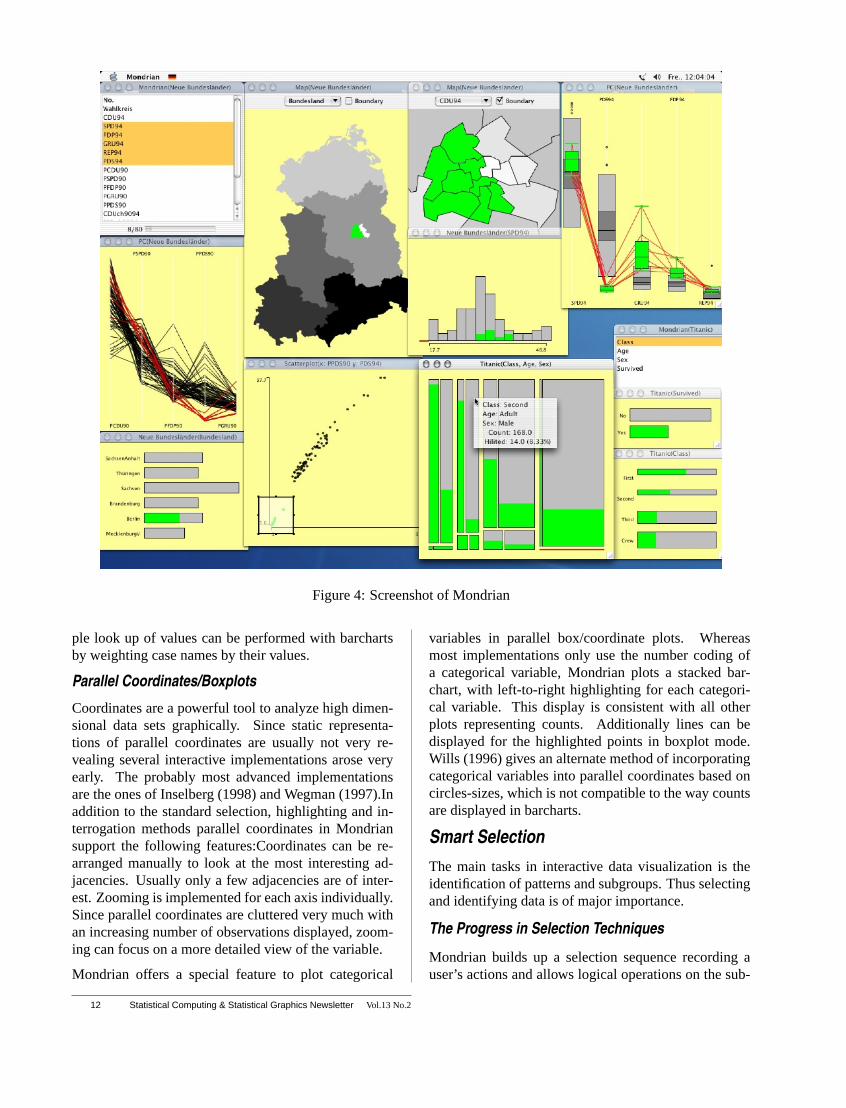
Figure 4: Screenshot of Mondrian
ple look up of values can be performed with barchartsby weighting case names by their values.
Parallel Coordinates/Boxplots
Coordinates are a powerful tool to analyze high dimen-sional data sets graphically. Since static representa-tions of parallel coordinates are usually not very re-vealing several interactive implementations arose veryearly. The probably most advanced implementationsare the ones of Inselberg (1998) and Wegman (1997).Inaddition to the standard selection, highlighting and in-terrogation methods parallel coordinates in Mondriansupport the following features:Coordinates can be re-arranged manually to look at the most interesting ad-jacencies. Usually only a few adjacencies are of inter-est. Zooming is implemented for each axis individually.Since parallel coordinates are cluttered very much withan increasing number of observations displayed, zoom-ing can focus on a more detailed view of the variable.
Mondrian offers a special feature to plot categorical
variables in parallel box/coordinate plots. Whereasmost implementations only use the number coding ofa categorical variable, Mondrian plots a stacked bar-chart, with left-to-right highlighting for each categori-cal variable. This display is consistent with all otherplots representing counts. Additionally lines can bedisplayed for the highlighted points in boxplot mode.Wills (1996) gives an alternate method of incorporatingcategorical variables into parallel coordinates based oncircles-sizes, which is not compatible to the way countsare displayed in barcharts.
Smart SelectionThe main tasks in interactive data visualization is theidentification of patterns and subgroups. Thus selectingand identifying data is of major importance.
The Progress in Selection Techniques
Mondrian builds up a selection sequence recording auser’s actions and allows logical operations on the sub-
12 Statistical Computing & Statistical Graphics Newsletter Vol.13 No.2

sequent selection subsets. This is more advanced thanthesimpleimplementation of selecting data where newsubsets replace prior selections. In simple systems thereis no way of refining a selection or selecting over differ-ent plots and/or variables. The moreadvancedway tohandle selections is to allow the user to combine the cur-rent selection with a new selection with boolean func-tions likeand, or, Xor, not. This allows to refine a selec-tion step by step to drill down to a very specific subsetof the data. When dealing with a wholesequenceof se-lections, it is often desirable to change a selection at anearlier stage, without having to redefine all precedingand successive selection steps. By storing the sequenceof selections it is possible to make changes to any step inthe sequence. Selection Sequences have been first im-plemented in MANET (Theus et al, 1998).The approachused by Mondrian combines the advanced selection asdescribed in Wills (1996) and Shneiderman’s (1994) dy-namic queries. Mondrian keeps a list of any selectionassociated with a data set. For each entry in the listthe selection area in screen coordinates and data coordi-nates, the selection step, the corresponding plot windowand the selection mode (e.g. and, or, not) is stored. Thecurrently selected subset of the data can then be deter-mined by processing all elements of the list, no matterwhich kind of modification to the list was the reason foran update of the selection subset.
Selection Rectangles
Allowing multiple selections in a single window as wellas across different windows makes a visual guide to theselections performed indispensable.
Mondrian introducesSelection Rectangles. Selectionrectangles indicate the area which was selected. An ex-isting selection rectangle can be used as a brush by sim-ply dragging the selection rectangle. The eight handleson the rectangle permit a flexible resizing of the rectan-gles. This enables various slicing techniques.
The ability to handle more than one selection in onewindow is indispensable when dealing with parallel co-ordinates.
Database Connections and very large DataSetsMondrian allows to connect directly to databases.When connected to a database, Mondrian does not keepa copy of the data outside the database. The data whichis needed for the plots is retrieved via SQL queries. Ob-viously this only makes sense for plots which just need asummary of the data, which are, barcharts, mosaic plots,histograms and binned scatterplots. The amount of datawhich is needed to build these plots is a constant, which
does not grow with the size of the data itself.
Special modifications to standard plots have been im-plemented in Mondrian, in order to make these plotsusable for even very large data sets. Scatterplots canbe displayed in a binned version, i.e. as the result of a2-dim. breakdown over thex- andy-variable. Addition-ally α-channel transparency can be used for density es-timations in scatterplots as well as to avoid overplottingin parallel coordinates.
ReferencesEmerson, J. (1998) Mosaic Displays in S-Plus: A gen-eral implementation and case study.Statistical Comput-ing and Graphics Newsletter.9(1):17–23.
Hofmann, H. (1998) Simpson on board the Titanic? In-teractive Methods for Dealing with Multivariate Cat-egorical Data. Statistical Computing and statisticalGraphics Newsletter.9(2):16–19.
Inselberg, A. (1998) Visual Data Mining.Computa-tional Statistics.13(1):47–63.
Schneidermann, B. (1994) Dynamic Queries for VisualInformation Seeking.IEEE Software. 11(6):70-77.
Theus, M., Hofmann, H. and Wilhelm, A. (1997) Selec-tion Sequences - Interactive Analyses of Massive DataSets. InComputing Science and Statistics.29.
Wegman, E. and Luo, Q. (1997) High DimensionalClustering Using Parallel Coordinates and the GrandTour. InComputing Science and Statistics. 28:352–360.
Wills, G. (1996) Selections: 524288 Ways to Say “Thisis Interesting”. InProceedings of InfoViz ’96, IEEESymposium on Information Visualization.IEEE Com-puter Society Press, pages 54–60.
Vol.13 No.2 Statistical Computing & Statistical Graphics Newsletter 13

JSOMap - a Java-basedSelf-Organizing MapPackageZach Cox, Department of Electrical Engineering,Iowa State University
AbstractJSOMap is a Java-based package for working with Self-Organizing Maps (Kohonen 2001). Utilizing object-oriented and smart software design principles (Gamma,Helm et al. 1995) (Bloch 2001) it is intended to be in-credibly easy to use in a variety of applications, frompure number crunching to interactive demos, while alsobeing very flexible and supportive of customization.JSOMap was used in conjunction with Orca to de-velop new methods for exploring the results of the Self-Organizing Map algorithm using the grand tour andlinked brushing data visualization techniques.
JSOMap PackageThere are several things to note about the SOM. First,there are no restrictions on what a pattern actually is.Traditionally, a pattern is a vector (i.e. ); however, apattern could conceptually be anything else, such asa string of characters or some generic set of objects.Whatever a pattern is, a distance metric must be definedfor it.
Second, the way in which the algorithm adjusts themodels is not specified. (Kohonen 2001) and many oth-ers have created numerous forms of the SOM algorithm.Several examples include the original online version,the batch version, and the minimum spanning tree ver-sion.
The main parts of the SOM are specified in JSOMapby six Java interfaces, as shown below in Figure 5. Byspecifying these main parts as interfaces, different typesof patterns and algorithms can be created and still re-ferred to by their interface. Users are free to createtheir own implementations that plug-in to the rest of theJSOMap API and can also adapt existing data structuresby implementing the JSOMap interfaces.
JSOMap includes implementations of these interfacesfor the traditional SOM. These implementations in-clude vector patterns, vector nodes and models, theonline SOM algorithm and the batch SOM algorithm.For more information on the rest of the JSOMapAPI, please see the appropriate documents available athttp://jsomap.sourceforge.net .
Using JSOMap to Visually Explore Self-Organizing MapsIncreasingly, research is being done on how best to vi-sualize the SOM and how to interpret these results. Forexample, (Kaski, Venna et al. 1999) color nodes of themap to accentuate cluster structure, (Vesanto 1999) col-ors each node of the map based on its model’s valueof a single variable, and (Himburg 1998) links coloringbetween the map in feature space and Sammon’s pro-jection of the map in input space. These visualizationsrepresent the end-results of the SOM algorithm and arestatic; that is, the appearance of nodes and models isfixed. The results presented here use ideas from (Buja,Cook et al. 1996) to visualize the SOM in new interac-tive ways.
Visualizing the map along with the patterns in inputspace using a grand tour (Asimov 1985) provides a bet-ter understanding of how the SOM algorithm works.The grand tour plot shows the patterns and the map ininput space, and also shows the progression of the SOMalgorithm as it positions the map. This type of high-dimensional animated visualization of the SOM is novelto the statistics and data mining field, clearly showingthe user the effectiveness of the SOM algorithm.
Linked brushing (McDonald 1982) between the plot ofthe map in input space and a plot of the map in featurespace provides a greater understanding of the outcomeof the algorithm. Three types of linked brushing areprovided:
1. Brushing a node brushes its corresponding model(and vice-versa).
2. Brushing a pattern brushes the node (and model)that the pattern is projected to.
3. Brushing a node (or model) brushes all of the pat-terns projected to that node.
This interactive linked brushing is also a new SOM vi-sualization method, allowing the user to interact withthe appearance of the plots and discover structure in thedata set.
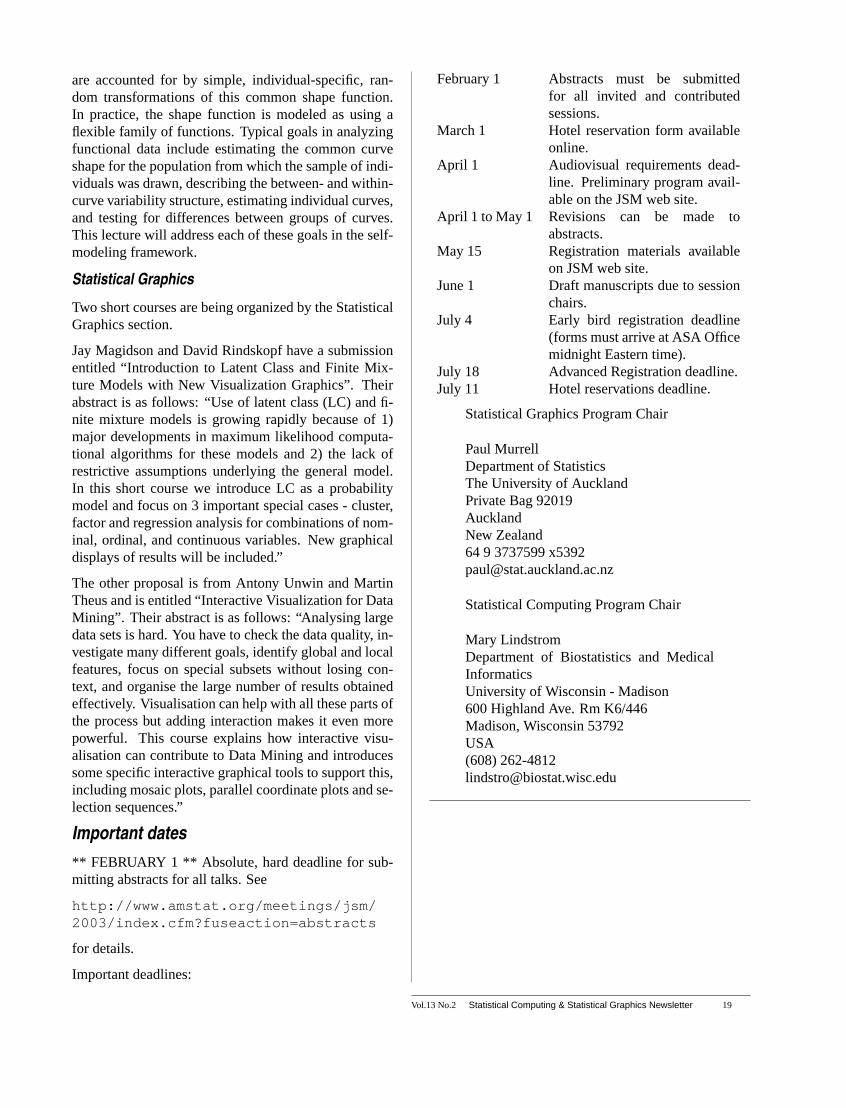
Figure 6 below shows an example of the two linkedplots. The patterns come from three normal distribu-tions in three dimensions, forming three clusters. Thepatterns in the tour view are brushed according to theirclusters, and the brushing is linked to the nodes andmodels that the patterns are projected to. The plot ofthe map in feature space clearly shows the cluster struc-ture of the data.
Orca (Sutherland, Rossini et al. 2000), a Java-baseddata visualization package, was used for the creation of
14 Statistical Computing & Statistical Graphics Newsletter Vol.13 No.2
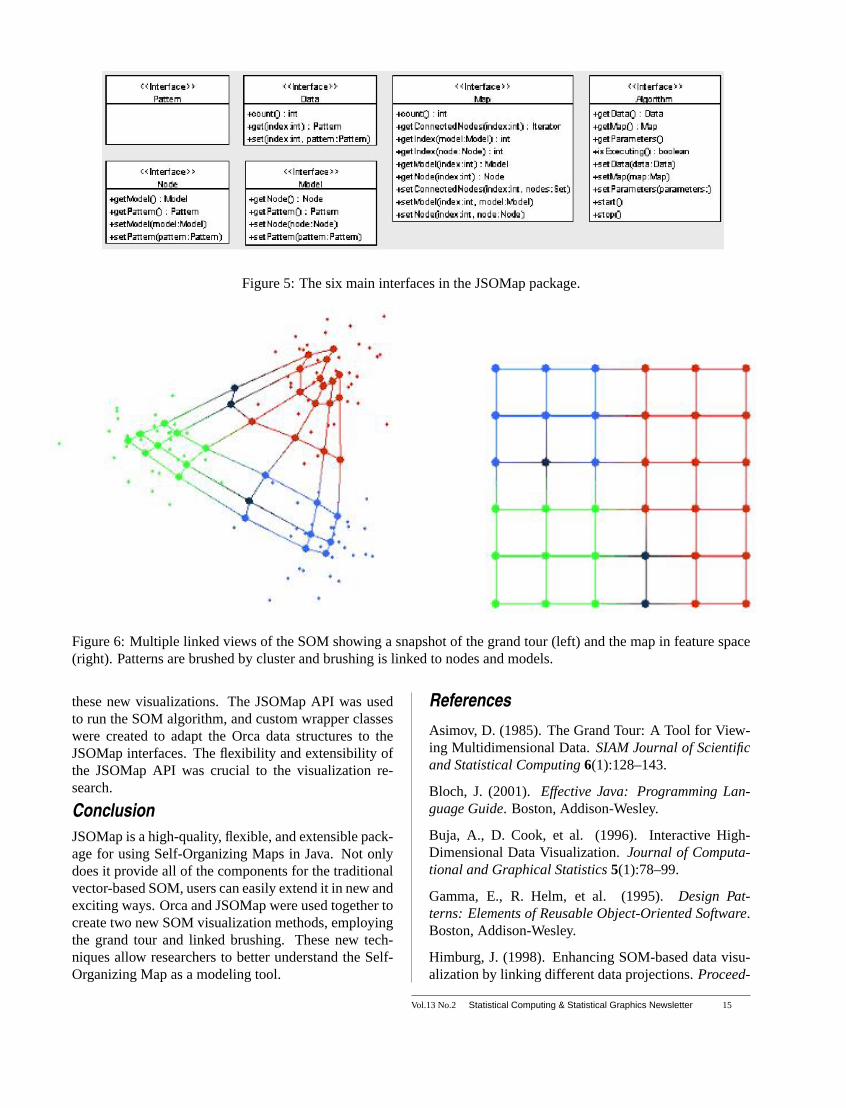
Figure 5: The six main interfaces in the JSOMap package.
Figure 6: Multiple linked views of the SOM showing a snapshot of the grand tour (left) and the map in feature space(right). Patterns are brushed by cluster and brushing is linked to nodes and models.
these new visualizations. The JSOMap API was usedto run the SOM algorithm, and custom wrapper classeswere created to adapt the Orca data structures to theJSOMap interfaces. The flexibility and extensibility ofthe JSOMap API was crucial to the visualization re-search.
ConclusionJSOMap is a high-quality, flexible, and extensible pack-age for using Self-Organizing Maps in Java. Not onlydoes it provide all of the components for the traditionalvector-based SOM, users can easily extend it in new andexciting ways. Orca and JSOMap were used together tocreate two new SOM visualization methods, employingthe grand tour and linked brushing. These new tech-niques allow researchers to better understand the Self-Organizing Map as a modeling tool.
ReferencesAsimov, D. (1985). The Grand Tour: A Tool for View-ing Multidimensional Data.SIAM Journal of Scientificand Statistical Computing6(1):128–143.
Bloch, J. (2001). Effective Java: Programming Lan-guage Guide. Boston, Addison-Wesley.
Buja, A., D. Cook, et al. (1996). Interactive High-Dimensional Data Visualization.Journal of Computa-tional and Graphical Statistics5(1):78–99.
Gamma, E., R. Helm, et al. (1995).Design Pat-terns: Elements of Reusable Object-Oriented Software.Boston, Addison-Wesley.
Himburg, J. (1998). Enhancing SOM-based data visu-alization by linking different data projections.Proceed-
Vol.13 No.2 Statistical Computing & Statistical Graphics Newsletter 15

ings of the International Symposium on Intelligent DataEngineering and Learning (IDEAL ’98), Hong Kong.
Kaski, S., J. Venna, et al. (1999). Coloring that revealshigh-dimensional structures in data.6th InternationalConference on Neural Information Processing.
Kohonen, T. (2001). Self-Organizing Maps.Berlin,Springer.
McDonald, J. A. (1982). Interactive Graphics for Data
Analysis, Statistics Department Tech Report, StanfordUniversity.
Sutherland, P., A. Rossini, et al. (2000). Orca: A Visu-alization Toolkit for High-Dimensional Data.Journalof Computational and Graphical Statistics.9(3):509–529.
Vesanto, J. (1999). SOM-Based Data VisualizationMethods.Intelligent Data Analysis3(2):111–126.
NEWS CLIPPINGS AND SECTION NOTICES
Report on JSM 2002Statistical ComputingProgramTim Hesterberg, Insightful Corp., 2002 Stat Com-puting Program Chair
The JSM 2002 in New York was the biggest ever, andthe Stat Computing Section had a huge program. Yes, itwas hectic. And overpriced ($30 for a box lunch?). Butit’s good to think back on.
What is JSM? Officially ”Joint Statistical Meetings”,but this year ”Jumble of Sessions on Microarrays” fitequally well. There were one or more microarray ses-sions at every time slot, of every day. We stat computersdid our part, with four such sessions.
Our other sessions ran the gamut, from data mining, im-age analysis, and MCMC, to sonification (you should’aheard it), and everything in between; 48 sessions alto-gether (OK, some of those we just co-sponsored), plusinvited technical exhibits, an introductory overview lec-ture, and poster sessions. Not to mention our mixer,with great door prizes including tickets to a Broadwayhit!
Credit goes to;
Claudia Becker, Frank Bretz, Francesca Chiaromonte,Jim Hobert, David Marchette, John Maryak, B.Narasimhan, Dan Nettleton, Jorg Polzehl, Ingo Ruczin-ski, Matthias Schonlau, Mark Segal, David van Dyk,Gregory Warnes, Yingnian Wu, and Xiangrong Yin,
for putting together some great sessions.
Report on JSM 2002Statistical GraphicsProgramMario Peruggia, Ohio State University, 2002 StatGraphics Program Chair
There appears to be an almost universal consensuswithin the statistical community that the 2002 JointMeetings have been extremely successful. I have heardcolleagues and friends variously describe the meetingsas “great,” “memorable,” and the “best meetings ever.”There are, of course, various factors that contribute tothe public perception of how successful a scientific con-vention is. I have no doubt that location plays a funda-mental role and the vibrant and eclectic charm of NewYork City is hard to match.
However, the quality of the scientific program remainsthe crucial ingredient for success, and last year’s overallprogram was indeed outstanding. As the 2002 GraphicsProgram Chair, I should not be responsible for singingthe praise of our section’s program, but, having heardcomplimentary remarks and comments from many ob-jective and unbiased sources, I am convinced that theGraphics Section truly managed to put together an in-teresting and engaging series of events.
If there is anything I can be proud of, it is having beenable to assemble an outstanding team of collaboratorswho took it upon themselves to do the hard work oforganizing the various sessions and activities. I wouldtherefore like to recognize the efforts of Bill Eddy, RobMcCulloch, and Debby Swayne, who helped with theinvited program and of Lionel Galway, Heike Hofmann,Paul Murrell, and Naomi Robbins who helped with thetopic contributed program. They ought to be congratu-lated along with all the speakers they invited, the pre-senters of regular contributed talks, the poster presen-ters, and the organizers and leaders of the roundtableand continuing education events. I would also like tothank all the sponsors who contributed door prizes for
16 Statistical Computing & Statistical Graphics Newsletter Vol.13 No.2

the traditional raffle held at our popular business meet-ing.
Many persons have given me insight and suggestionson how to run a successful program and to all of themI am very grateful. Among them I would like to singleout Debby Swayne to whom I have turned for adviceinnumerable times. For many years Debby has beenan indefatigable contributor to our section’s activitiesin various official capacities, most notably as a formerProgram Chair and Section Chair, as well as many un-official but equally important ones. Quite honestly, sheand not I should take credit for many of the ideas thathave helped to shape up last year’s program.
Finally, I would like to wish Paul Murrell luck with the2003 program. Paul did an excellent job organizing the2002 roundtable luncheons and will no-doubt put to-gether a top-notch program. With San Francisco being agreat city, the main ingredients for success are all thereand we should all be looking forward to our August ren-dezvous in California.
JSM 2003 ProgramThe Statistical Graphics and Statistical Computing pro-gram chairs have been busy this Summer and Fallputting together invited session, topic contributed ses-sions, and continuing education activities. The invitedprogram is complete but the contributed program is stillunderway with a February 1 deadline for all abstracts. Ifyou plan to give a contributed talk please consider orga-nizing a topic contributed session (see below). Also, weare in need of volunteers to chair sessions, both invitedand contributed.
Be sure to note the deadlines listed at the end of thisarticle.
The program: Invited sessionsThere will be two invited sessions organized by the Sec-tion on Statistical Graphics and six organized by theSection on Statistical Computing at JSM 2003.
Statistics Graphics
Dan Carr, David Scott, Linda Pickle, and a representa-tive from the GeoStat Project will present papers de-scribing the work of the Digital Government QualityGraphics project. This project is producing stunningimages to help people access the enormous amount ofinformation gathered by the Federal government - fromtheir web site: “The Federal government distributes avast quantity of statistical summaries in printed and
electronic form. The full wealth of information thatmight be derived from these summaries is not being re-alized because limited attention is paid to disseminatingsummaries in understandable forms. The objective ofthis research is to develop and assess quality graphicsfor federal statistical summaries.”
The other invited session is entitled “Graphics forBioinformatics” and will showcase some of the visu-alization research being done in this exciting new area.Speakers will be Vincent Carey on “Visualization andinference for genomic networks”, Jeff Saffer on “Us-ing Visualization to Provide Context and Focus Withinand Among Bioinformatics Data Sets”, and a represen-tative from the University of Washington on “Visual-ization for Flow Cytometry”. Tony Rossini will providediscussion.
Statistical Computing
This year we are lucky to have six Statistical Comput-ing invited sessions. Susmita Datta organized a sessionentitled “Recent Contributions in Bioinformatics”. Theinvited speakers are Jean Yee Hwa Yang, Soumya Ray-chaudhuri and Chaehyung Ahn. This session will focuson recent contributions made by statisticians to the areaof bioinformatics, particularly, microarray data analy-sis and proteomics. The goal of this session is to en-hance the enthusiasm amongst statisticians for this ex-citing area of research.
Imola Fodor is the organizer for a session entitled“Methods for mining video data”. Finding useful in-formation in vast collections of video data is a prob-lem shared by many application domains. Examples in-clude: understanding scientific phenomena, monitoringtraffic, detecting unusual activities in a scene, and re-trieving videos based on their content. The goal of thesession is two-fold: 1) expose statisticians to issues invideo data mining, and 2) elicit feedback from statis-ticians on techniques currently used in the field. Thespeakers are Padhraic Smyth, Bangalore Manjunath andSerge Belongie.
The session “Interface of Statistics and Music” is be-ing organized by Chris Raphael. For many people theterm “computer music” is something of an oxymoron.However, the cornerstone of computer music - the will-ingness to view music as “data” - left significant andprofound changes on the 20th century musical land-scape. This same view of music as data has more re-cently been the door for the statistics community, andthere is a growing body of statistical energy and interestfocusing on various musical applications. The speakersare Christopher Raphael, Jan Beran and Mark Hansen.
Vol.13 No.2 Statistical Computing & Statistical Graphics Newsletter 17

Our own Susan Holmes has organized a session entitled“Statistics and large genetic and biological databases”which will cover the use of large databases to builduseful information for recognizing special types of se-quences and properties. The speakers are Jun Liu, Wolf-gang Huber and Martin Vingron.
Ranjan Maitra has organized a session entitled “MCMCcomputations for large-dimensional problems” whichwill cover new ideas on speeding MCMC computationsin severely large-dimensional problems. The speak-ers are David Draper, Rafaela M. Guidi and Christo-pher Holloman and they will discuss ideas for reduc-ing the autocorrelation time of MCMC output, auxil-iary variables algorithms for continuum random clusterprocesses and a multi-resolution MCMC algorithm thatincorporates elements of genetic algorithms.
Finally, Robert Nowak has organized a session enti-tled “Statistics on the Frontiers in Computer NetworkTraffic Analysis”. From a statistical perspective, thechallenges inherent in the analysis of computer networktraffic data include: massive datasets, complex tempo-ral dependencies, graph-based topologies, and decision-making problems constrained typically by locally par-tial sharing of information. The goal of this session is toshowcase work on frontier topics in this area to mem-bers of the larger statistics community. The speakersare William Cleveland, Eric D. Kolaczyk and Nina Taftwith Nick Duffield providing a discussion.
The program: Topic Contributed Sessions
There are also plans afoot for several topic contributedsessions and still time to organize more. The advantagesof a topic contributed session over a regular contributedpaper session are that speakers are alloted 20 minuteseach and the talks in a session are all on a commontheme. If you are interested in organizing one, pleasecontact one of us (contact information given below).
Statistical Graphics
After the great success of his poster session at JSM2002, Michael Friendly is looking at a session on “TheHistory of Statistical Graphics”. Naomi Robbins hassuggested a session on “Use of Graphs in Different In-dustries” and has so far lured speakers to talk on graph-ics in customer satisfaction studies, pharmaceuticals,telecommunications, and legal testimony. Finally, Gra-ham Wills and Paul Murrell have proposed papers inthe area of “Web Delivery of Statistical Graphics” andit would be great if a few others joined in so that wecould make a session of it.
Statistical ComputingWe have just one topic contributed session sponsoredby the Statistical Computing section. Wen-Hua Ju isorganizing a session entitled “Know Your Customer:User Profiling for Customer Relationship Management(CRM) and Intrusion Detection”. There may still besome openings in this session so if your contributed pa-per would fit in please contact him at [email protected]
The Program: Continuing EducationThere will be two introductory overview lectures spon-sored by Statistical Computing and two continuing ed-ucation activities in Statistical Graphics are currently atthe proposal stage.
Statistical ComputingIntroductory overview lectures are targeted at non-specialists who which to learn about a new area.
Christina Kendziorski will present an introductoryoverview lecture on “Statistical Methods and Applica-tions for Microarray Studies”. DNA microarrays al-low for large scale coordinate monitoring of gene ex-pression. This new technology has facilitated researchinto the complicated and orchestrated ways in whichmultiple genes interact to create life. With this shiftfrom individual to integrated analysis in molecular bi-ology comes a shift in the related statistical questionsposed and methods required. Such questions includethe normalization of measurements within and betweenarrays, the identification of expressed genes and estima-tion of true intensity, the estimation of differential ex-pression, the identification of genes which exhibit sig-nificant differential expression, and the classification ofgenes based on one or more features of interest in agiven experiment. We will review the principles andpractices that have played integral roles in addressingeach of these questions. Although the methodologiescommonly used in practice are developed from a widerange of fields and perspectives, unifying themes existand will be discussed.
Mary Lindstrom will present an introductory overviewlecture on “Self-modeling for Functional Data”. Func-tional data arise when the ideal observation for each ex-perimental unit is a curve or function. Typically, wedo not observe the actual curve but instead obtain noisyobservations at a number of points along the curve foreach individual. A functional data set is then made upof these data curves, one or more per individual. Self-modeling is a semi-parametric approach to modelingfunctional data which pools shape information acrosscurves by postulating a common (usually smooth) shapeor template function. Differences among individuals
18 Statistical Computing & Statistical Graphics Newsletter Vol.13 No.2
are accounted for by simple, individual-specific, ran-dom transformations of this common shape function.In practice, the shape function is modeled as using aflexible family of functions. Typical goals in analyzingfunctional data include estimating the common curveshape for the population from which the sample of indi-viduals was drawn, describing the between- and within-curve variability structure, estimating individual curves,and testing for differences between groups of curves.This lecture will address each of these goals in the self-modeling framework.
Statistical Graphics
Two short courses are being organized by the StatisticalGraphics section.
Jay Magidson and David Rindskopf have a submissionentitled “Introduction to Latent Class and Finite Mix-ture Models with New Visualization Graphics”. Theirabstract is as follows: “Use of latent class (LC) and fi-nite mixture models is growing rapidly because of 1)major developments in maximum likelihood computa-tional algorithms for these models and 2) the lack ofrestrictive assumptions underlying the general model.In this short course we introduce LC as a probabilitymodel and focus on 3 important special cases - cluster,factor and regression analysis for combinations of nom-inal, ordinal, and continuous variables. New graphicaldisplays of results will be included.”
The other proposal is from Antony Unwin and MartinTheus and is entitled “Interactive Visualization for DataMining”. Their abstract is as follows: “Analysing largedata sets is hard. You have to check the data quality, in-vestigate many different goals, identify global and localfeatures, focus on special subsets without losing con-text, and organise the large number of results obtainedeffectively. Visualisation can help with all these parts ofthe process but adding interaction makes it even morepowerful. This course explains how interactive visu-alisation can contribute to Data Mining and introducessome specific interactive graphical tools to support this,including mosaic plots, parallel coordinate plots and se-lection sequences.”
Important dates** FEBRUARY 1 ** Absolute, hard deadline for sub-mitting abstracts for all talks. See
http://www.amstat.org/meetings/jsm/2003/index.cfm?fuseaction=abstracts
for details.
Important deadlines:
February 1 Abstracts must be submittedfor all invited and contributedsessions.
March 1 Hotel reservation form availableonline.
April 1 Audiovisual requirements dead-line. Preliminary program avail-able on the JSM web site.
April 1 to May 1 Revisions can be made toabstracts.
May 15 Registration materials availableon JSM web site.
June 1 Draft manuscripts due to sessionchairs.
July 4 Early bird registration deadline(forms must arrive at ASA Officemidnight Eastern time).
July 18 Advanced Registration deadline.July 11 Hotel reservations deadline.
Statistical Graphics Program Chair
Paul MurrellDepartment of StatisticsThe University of AucklandPrivate Bag 92019AucklandNew Zealand64 9 3737599 [email protected]
Statistical Computing Program Chair
Mary LindstromDepartment of Biostatistics and MedicalInformaticsUniversity of Wisconsin - Madison600 Highland Ave. Rm K6/446Madison, Wisconsin 53792USA(608) [email protected]
Vol.13 No.2 Statistical Computing & Statistical Graphics Newsletter 19

Report on the 2002 InfoVisConference in BostonMartin Theus, University of AugsburgLeland Wilkinson, SPSS Inc.
This year’s InfoVis conference was held October 28-29in the Park Plaza Hotel in Boston. As usual, the con-ference was hosted by the parent Vis2002 conference.During the two days 25 talks were given, including akeynote address by William S. Cleveland and a capstonetalk by Stephen M. Kosslyn. Another 28 posters werepresented at the reception on the 28th. The poster ses-sion was the second after last year and again proved tobe a success.
Most of the participants were computer scientists, someengineers, some mathematicians and a few statisticians.This was reflected in the presented talks. Most ofthe talks presented tools rather than methods and didnot go very deeply into data exploration. But Cleve-land’s keynote address showed that the three steps –understanding the problem domain, using the rightmethod to visualize the data, and building a meaning-ful statistical model – are tightly coupled.
This year’s prize paper was “Multiscale Visualizationusing Data Cubes” by Chris Stolte, Diane Tang and PatHanrahan from Stanford University. They presented aselection of example datasets in their data visualizationsystem Polaris. The key elements of Polaris are the “ ta-ble algebra, ” the “visualization specification,” and the“multiscale visualization”. The algebra is based on the“The Grammar of Graphics” (Wilkinson, 1999). Thevisual specification follows Bertin. The multiscale vi-sualization follows what is called “logical zooming” inthe statistical graphics community.
Catherine Plaisant from the HCI-Lab, University ofMaryland, presented the SpaceTree Software, whichallows navigation in large trees in an impressivelysmooth way while conserving focus using dynamicrescaling methods. Martin Wattenberg from IBM Labsdemonstrated Arc Diagrams for visualizing structuresin strings - a brilliant example of an unconventional vi-sualization tailor-made for a specific problem.
Several other papers dealt with topics which were al-ready implemented or published in the statistical com-puting and graphics community, without knowing orreferencing this work. Angle selection in parallel co-ordinates (implemented in Sylvia Winkler’s ChambersAward winning Cassatt software discussed in Unwin,2002) was presented as a novelty. “Pixel-Barcharts”were introduced as a point plot version of mosaic plots.
Cluster analysis problems and density estimation prob-lems were discussed without reviewing the work ofstatisticians. A couple of other “statistical deja-vus”came up at the poster session.
I am not saying that statisticians working in graphics arebetter informed, but the conference raised the questionof why so little of the work of the statistical computingand graphics community is known in the informationvisualization community. One answer is the self con-tained nature of the IEEE InfoVis community. Almosthalf of the presentations dealt with either graphs or treesor treemaps, and half of the presenters came from Stan-ford, Virginia Tech, IBM or the University of Maryland- a phenomenon, we know quite well from this newslet-ter, where the majority of the contributions come fromeither the former AT&T Bell-Labs, GMU or Augsburg.
Nonetheless WE should pay more attention to what hap-pens in the information visualization community, bothto learn from their good ideas and to make our workmore visible there. (Or just to find a couple more do’sand don’ts for our next statistical graphics lecture.)
Do’s and don’ts was what Steve Kosslyn presented inhis capstone talk - nothing really new, but still inspir-ing, entertaining and provocative. For those who mightwant to get his out-of-print book “Elements of GraphDesign”: various online used book stores will send itfor a few.
The 2003 InfoVis conference will be held October 20-21, 2003 at the Doubletree Hotel Seattle Airport, inSeattle.
References:
Wilkinson, Leland, 1999, The Grammar of Graphics,Springer, NY
Unwin, Antony, 2001, COSADA Software Projects inAugsburg, SCGN Vol 12 No. 1
20 Statistical Computing & Statistical Graphics Newsletter Vol.13 No.2

Report on DataVisualisation III nearAugsburgAntony Unwin, University of Augsburg
Harry Potter, Lord of the Rings, Data Visualisationworkshops - all good things appear in series. DataVis III came first, in October this year near Augsburgin Germany. The main theme was the visualisation oflarge data sets, but it was also an opportunity to assessthe state of play in our field. Graphics is still a kind ofstepchild in the statistical world. Just about everyoneuses graphics, but few seem to take graphics seriouslyand many of the published displays, even in statisticaljournals would lead an objective observer to concludethat we haven’t made much progress, if any, since Play-fair. I like to compare the situation with how a fashiondesigner must feel - they go to a lot of trouble to de-sign attractive clothing, but on the one hand most peo-ple only talk about the excesses of Haute Couture andon the other they dress as if they were clothed by ......(fill in your own software company suggestion here).Ah well, no use grouching, let’s just get on with it.
The meeting was held in a small country hotel to cre-ate a relaxed atmosphere and to encourage plenty ofdiscussion between the participants. A couple of yearsago this would have meant doing without computer sup-port, but setting up a local network (including a wirelesscomponent) with a (reasonably) fast link to the outsideworld is now no problem. In fact this may have beenthe first meeting where the main computing room wasset up in a conservatory!
It would be invidious to pick out individual presenta-tions or topics in a short report, especially as it is likely,as always at workshops, that some of the most fruitfulwork took place in informal discussions. What was ap-parent was that the availability of software, or rather thelack of it, is a curb on progress. There is much im-pressive research software out there for graphics (and
we saw plenty of it at the workshop), but little thatis easily available either for practising statisticians or,more importantly, for young researchers. Given thelack of credit that is given for software developmentin academic circles, there is little motivation for doc-toral students to write their own. After all they couldbe spending their time more profitably proving some(immediately useful?) asymptotic result. The situationcould imrove if there was a development environmentfor graphics, which took the need away to rewrite somuch from scratch. Attempts have been made to dothis before, but one of the exciting pieces of news at theworkshop was that there may be progress on this frontboth in R and in a widely distributed traditional com-mercial software next year.
What might be the topics to tackle in Data Vis IV? Thereare much larger data sets out there than we can com-fortably handle and new ideas are required to deal withthem. There are many possibilities for binding graph-ics and statistical modelling closely together and thereneeds to be much more research carried out to combineand intertwine the two approaches. And there is stillhuge scope for research on usable user interfaces (well,he would say that, wouldn’t he?).
One of the features of the meeting was that two studentsfrom Augsburg, Ulrich Fahrner and Robert Schmied,filmed interviews with the participants. They had abluebox stand in the computer room and collected al-most everyone singly or in pairs at one point or another.These films are being edited and, subject to the par-ticipants’ approval, will be made available on the web.They convey very nicely the good-humoured yet inten-sive flavour of the meeting.
Astonishingly for a meeting on visualisation we nevergot round to taking a group photograph, but by takingstills from videos and putting in some diligent editingwork a photo was put together and you can see the re-sult on the meeting’s website along with the programmeand other information: http://stats.math.uni-augsburg.de/Workshop2002/WS.html
Vol.13 No.2 Statistical Computing & Statistical Graphics Newsletter 21

SECTION OFFICERS
Statistical Graphics Section - 2002Stephen G. Eick, Chair
(630) 778-0050CEO and Co-founder Visintuit, [email protected]
David A. James, Chair–Elect(908) 582-3082Lucent Bell [email protected]
Deborah F. Swayne,Past–Chair(973) 360-8423AT&T Labs - [email protected]
Mario Peruggia, Program Chair(614) 292-0963Ohio State [email protected]
Paul Murrell, Program Chair–Elect+64 9 373 7599 x5392Auckland University, New [email protected]
Dianne Cook, Newsletter Editor(515) 294-8865Iowa State [email protected]
Thomas Lumley, Secretary/Treasurer(206) 543-1044University of [email protected]
Graham J. Wills, Publications Liaison Officerand Electronic Communication Liaison(312) [email protected]
Jurgen Symanzik, Rep.(02-04) to Council of Sections(435) 797-0696Utah State [email protected]
Charles B. Roosen,Rep.(01-03) to Council of Sec-tionsMathSoft, [email protected]
Statistical Computing Section - 2002Susan Holmes,Chair
(650) 725-1925Stanford [email protected]
Leland Wilkinson, Chair-Elect(312) 651-3270
Mark Hansen, Past–Chair908-582-3869Bell [email protected]
Tim Hesterberg, Program Chair(206) [email protected]
Mary Lindstrom, Program Chair–Elect(608) 262-4812Wisconsin [email protected]
Ranjan Maitra, Newsletter Editor (00-02)(410) 445-2436University of [email protected]
Charles Kooperberg Secretary/Treasurer (02-03)(206) [email protected]
John F. Monahan, Publications Liaison Office919-737-2541North Carolina State [email protected]
Thomas F. Devlin, Electronic Communication Liaison(973) 655-7244Montclair State [email protected]
Lionel Galway, Awards Officer(310) 393-0411, ext. [email protected]
Ranjan Maitra, Education Liaison(410) 445-2436University of [email protected]
John J. Miller, Education Liaison(703) 993-1690George Mason [email protected]
David M. Allen, Rep.(00-02) Council of Sections(606) 257-6901University of [email protected]
Elizabeth H. Slate, Rep.(00-02) to Council of Sec-tions607-255-9148Cornell [email protected]
22 Statistical Computing & Statistical Graphics Newsletter Vol.13 No.2

INSIDE
A WORD FROM OUR CHAIRS . . . . . . . . . . . 1SPECIAL ARTICLE . . . . . . . . . . . . . . . . . . 2Editorial . . . . . . . . . . . . . . . . . . . . . . . . 7FROM OUR CHAIRS (Cont.). . . . . . . . . . . . . . . 8
Statistical Computing . . . . . . . . . . . . . . . . 8Statistical Graphics . . . . . . . . . . . . . . . . . 8
TOPICS IN BIOINFORMATICS . . . . . . . . . . . 8SOFTWARE PACKAGES . . . . . . . . . . . . . . .11NEWS CLIPPINGS AND SECTION NOTICES . . .16SECTION OFFICERS . . . . . . . . . . . . . . . . .22INSIDE . . . . . . . . . . . . . . . . . . . . . . . . . 23
The Statistical Computing & Statistical GraphicsNewsletteris a publication of the Statistical Comput-ing and Statistical Graphics Sections of the ASA. Allcommunications regarding this publication should be
addressed to:Ranjan MaitraEditor, Statistical Computing SectionDepartment of Mathematics and StatisticsUniversity of Maryland,Baltimore MD 21250(410) 445 2436• FAX: (410) 455 [email protected]://www.math.umbc.edu/∼maitra
Dianne CookEditor, Statistical Graphics SectionDepartment of StatisticsIowa State UniversityAmes, IA 50011-1210(515) 294 8865• FAX: (515) 294 [email protected]/∼dicook
All communications regarding ASA membership andthe Statistical Computing or Statistical Graphics Sec-tions, including change of address, should be sent to:
American Statistical Association1429 Duke StreetAlexandria, VA 22314-3402 USA(703) 684-1221• FAX (703) [email protected]