Embed Size (px)
Citation preview
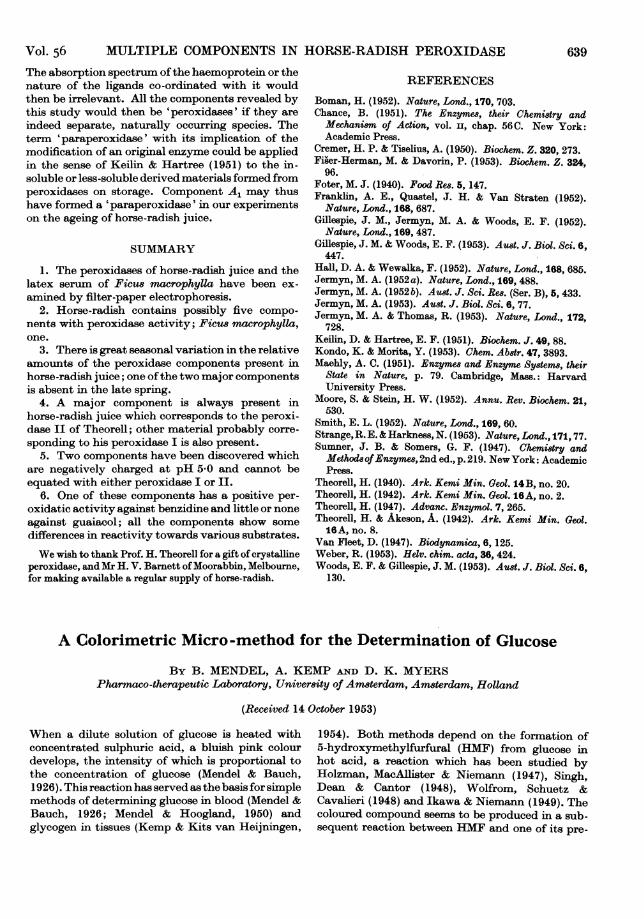
Vol. 56 MULTIPLE COMPONENTS IN HORSE-RADISH PEROXIDASE 639
The absorption spectrum ofthe haemoprotein or thenature of the ligands co-ordinated with it wouldthen be irrelevant. All the components revealed bythis study would then be 'peroxidases' if they areindeed separate, naturally occurring species. Theterm 'paraperoxidase' with its implication of themodification of an original enzyme could be appliedin the sense of Keilin & Hartree (1951) to the in-soluble or less-soluble derived materials formed fromperoxidases on storage. Component A1 may thushave formed a 'paraperoxidase' in our experimentson the ageing of horse-radish juice.
SUMMARY
1. The peroxidases of horse-radish juice and thelatex serum of Ficus macrophylla have been ex-amined by filter-paper electrophoresis.
2. Horse-radish contains possibly five compo-nents with peroxidase activity; Ficus macrophylla,one.
3. There is great seasonal variation in the relativeamounts of the peroxidase components present inhorse-radish juice; one ofthe two major componentsis absent in the late spring.
4. A major component is always present inhorse-radish juice which corresponds to the peroxi-dase II of Theorell; other material probably corre-sponding to his peroxidase I is also present.
5. Two components have been discovered whichare negatively charged at pH 5 0 and cannot beequated with either peroxidase I or II.
6. One of these components has a positive per-oxidatic activity against benzidine and little or noneagainst guaiacol; all the components show somedifferences in reactivity towards various substrates.
We wish to thank Prof. H. Theorell for a gift of crystallineperoxidase, and Mr H. V. Barnett ofMoorabbin, Melbourne,for making available a regular supply of horse-radish.
REFERENCES
Boman, H. (1952). Nature, Lond., 170, 703.Chance, B. (1951). The Enzymes, their Chemi8try andMechanism of Action, vol. iI, chap. 560. New York:Academic Press.
Cremer, H. P. & Tiselius, A. (1950). Biochem. Z. 320, 273.Fiser-Herman, M. & Davorin, P. (1953). Biochem. Z. 324,
96.Foter, M. J. (1940). Food Re8. 5, 147.Franklin, A. E., Quastel, J. H. & Van Straten (1952).
Nature, Lond., 168, 687.Gillespie, J. M., Jermyn, M. A. & Woods, E. F. (1952).
Nature, Lond., 169, 487.Gillespie, J. M. & Woods, E. F. (1953). Aust. J. Biol. Sci. 6,
447.Hall, D. A. & Wewalka, F. (1952). Nature, Lond., 168, 685.Jermyn, M. A. (1952a). Nature, Lond., 169, 488.Jermyn, M. A. (1952 b). Aust. J. Sci. Res. (Ser. B), 5, 433.Jermyn, M. A. (1953). Aust. J. Biol. Sci. 6, 77.Jermyn, M. A. & Thomas, R. (1953). Nature, Lond., 172,
728.Keilin, D. & Hartree, E. F. (1951). Biochem. J. 49, 88.Kondo, K. & Morita, Y. (1953). Chem. Ab8tr. 47, 3893.Maehly, A. C. (1951). Enzyme8 and Enzyme System8, their
State in Nature, p. 79. Cambridge, Mass.: HarvardUniversity Press.
Moore, S. & Stein, H. W. (1952). Annu. Rev. Biochem. 21,530.
Smith, E. L. (1952). Nature, Lond., 169, 60.Strange, R. E. & Harkness, N. (1953). Nature, Lond., 171,77.Sumner, J. B. & Somers, G. F. (1947). Chemistry and
MethodsofEnzymes,2nd ed., p.219. New York: AcademicPress.
Theorell, H. (1940). Ark. Kemi Min. Geol. 14B, no. 20.Theorell, H. (1942). Ark. Kemi Min. Geol. 16A, no. 2.Theorell, H. (1947). Advanc. Enzymol. 7, 265.Theorell, H. & Akeson, A. (1942). Ark. Kemi Min. Geol.16A, no. 8.
Van Fleet, D. (1947). Biodynamica, 6, 125.Weber, R. (1953). Helv. chim. aca, 36, 424.Woods, E. F. & Gillespie, J. M. (1953). Aust. J. Biol. Sci. 6,
130.
A Colorimetric Micro-method for the Determination of Glucose
BY B. MENDEL, A. KEMP AND D. K. MYERSPharmaco-therapeutic Laboratory, Univer8ity of Amwterdam, Am8terdam, Holland
(Received 14 October 1953)
When a dilute solution of glucose is heated withconcentrated sulphuric acid, a bluish pink colourdevelops, the intensity of which is proportional tothe concentration of glucose (Mendel & Bauch,1926). This reaction has served as the basis for simplemethods of determining glucose in blood (Mendel &Bauch, 1926; Mendel & Hoogland, 1950) andglycogen in tissues (Kemp & Kits van Heijningen,
1954). Both methods depend on the formation of5-hydroxymethylfurfural (HMF) from glucose inhot acid, a reaction which has been studied byHolzman, MacAllister & Niemann (1947), Singh,Dean & Cantor (1948), Wolfrom, Schuetz &Cavalieri (1948) and Ikawa & Niemann (1949). Thecoloured compound seems to be produced in a sub-sequent reaction between HMF and one of its pre-

B. MENDEL, A. KEMP AND D. K. MYERS
cursors. This reaction is highly dependent on theconcentration of sulphuric acid and appears to bespecific for glucose, fructose and related carbo-hydrates.
EXPERIMENTAL
Reagents
Sulphuric acid. The only reagent necessary for thedetermination of glucose in pure solution is concentratedH2S04. The samples of 96% (w/w) H2SO4 (sp.gr. 1-84)obtained from Canadian Industries Ltd. (Canada), Grasselli(U.S.A.), Brocades-Stheeman (Holland), Merck and Co.(Germany) and May and Baker (England) proved to besuitable. Samples supplied by anumber of other firms oftengave a yellowish pink instead of the bluish pink colour. Theconcentration of H2SO4 determined by titration should beapproximately 36N. If the concentration in commercialsamples is too high, the H2SO4 has to be diluted and shouldthen be allowed to stand 2-3 days in a stoppered bottlebefore use.
Deproteinizing 8olution. For determining the glucoseconcentration in blood samples, the blood is deproteinizedwith a 5% (w/v) solution of trichloroacetic acid (TCA)(AnalaR Reagent) containing 0.1% (w/v) Ag2SO4 (A.R.)(Mendel & Hoogland, 1950).
Procedure
One ml. of an aqueous glucose solution, containing notmore than 15 mg. glucose/100 ml., is added to 3 ml. of 96%H,504 in a wide test tube, the contents of which should bemixed immediately by vigorous shaking. After mixing, theconcentration of H2SO4 in the solution is 82% (w/w); thetemperature of the solution rises temporarily to about 85°.The mixture is heated for exactly 6 5 min. in a boiling-waterbath; the water should be boiling vigorously to preventa decrease in temperature when the test tubes are inserted.The test tubes are subsequently cooled under tap water andthe intensity of the pink colour is measured at 520 mni. in aBeckman Spectrophotometer, model DU. The method caneasily be adapted for the Coleman Junior or any othercolorimeter. Should it be inconvenient to measure theoptical density immediately, the tubes can be stoppered andallowed to stand at room temp. for several hours, since thepink colour is stable in 82% H2SO4.
Various modifications of this procedure have been testedbut they did not appear to offer any advantage. The samecolour intensity is obtained when (a) the H2SO4 is added tothe glucose solution, (b) the glucose solution and H2S04 arecooled to 0° while being mixed, and (c) the mixture is notheated at 1000 immediately but kept for 30 min. beforebeing heated.For determining the blood-sugar level, 0-1 ml. blood is
pipetted into 1-9 ml. of the TCA: Ag2SO4 solution. Thepipette should be rinsed well with the deproteinizing solu-tion and the suspension mixed briefly. The suspension iscentrifuged at 3000 rev./min. for 5 min. to obtain a clearsupernatant fluid. The precipitate can also be removed byfiltration through a small filter paper (cf. Mendel & Hoog-land, 1950), but special care must be taken to ensure thatthe paper is free of chlorides. One ml. of the clear super-natant fluid or filtrate is added to 3 ml. of conc. H2SO4 andthe colour reaction is carried out as described above.
I954The concentration of glucose in the TCA extract can be
read from a standard curve. Up to a concentration of15 mg./100 ml., the relationship between the glucose con-centration and colour intensity is linear, an extinction ofabout 0-160 at 520 mu. being obtained with an aqueoussolution containing 10 mg. glucose/100 ml. The samestandard curve can be used as long as the concentration andbrand of H2SO4 remain unchanged.
RESULTS
Absorption spectrum
Figs. 1 and 2 show the absorption spectrum of thecoloured solution which is obtained after heatinga dilute solution of glucose for 6-5 min. at 1000 in82% sulphuric acid. Absorption maxima arefound at 520 m,u. in the visible range (Fig. 1) and at318 and 255 m,u. in the ultraviolet (Fig. 2). Theabsorption peak at 520 m,u. is due to the bluish pinkcompound which is formed in the reaction. Themaxima at 318 and 255 m,u. are due to the formationofHMF from glucose in heated sulphuric acid, theirpositions and relative optical densities being almostidentical with those of HMF dissolved in sulphuricacid of the same concentration (Fig. 2).Upon dilution of the coloured reaction mixture
with water, the absorption maxima in the ultra-violet shift their positions in precisely the same wayas do the absorption maxima of HMF. The bluishpink colour diminishes when the sulphuric acid isdiluted, and disappears completely when the con-centration of sulphuric acid is decreased to approxi-mately 55%. Since the absorption spectrum ofHMF is still present under these conditions, it seemsprobable that the coloured compound dissociatesinto simpler molecules in less concentrated sulphuricacid.The bluish pink compound is not formed when
HMF is heated with concentrated sulphuric acid,though a slight yellowish colour with a maximalabsorption at 430 m,u. is produced. However, theintensity of the pink colour is not diminished whenup to 25% of the glucose is replaced by HMF(Fig. 3). It appears, therefore, that the formationofthe coloured compound in heated sulphuric acid isdependent on the presence ofHMF and a compoundintermediate between glucose and HMF.When the course of the reaction is followed by
means of the absorption spectra, the concentrationofHMF is found to reach a maximum after approxi-mately 2 min. at 1000, as judged by the opticaldensity at 318 m. (Fig. 4). It can be calculated thatabout 65% of the glucose originally present musthave been converted into HMF at this point. Withcontinued heating the HMF concentration de-creases. The bluish pink colour appears more slowlythan the HMF and reaches its maximum after about10 min. at 1000 (Fig. 4).
AO4A

MICRO-DETERMINATION OF GLUCOSE
Further heating fails to cause an appreciablechange in the intensity of the bluish pink colour;however, a brownish colour with an absorptionmaximum at 430 mi. appears, the intensity ofwhich increases the longer the glucose is heated withconcentrated sulphuric acid (Fig. 4). The heatingtime of 6-5 min. at 1000 was selected to permit a
400 450 500 550 600Wavelength (mit.)
Fig. 1. Visible spectrum obtained after heating 1 ml. of anaqueous glucose solution (0.01 %) with 3 ml. of96% (w/w)H2S04 at 1000 for 6-5 min. The extinctions were measuredin a 1 cm. cuvette with a Beckman Spectrophotometer.
400Wavelength (myz.)
F.ig. 2. Ultraviolet spectra obtained (A) after heating 1 ml.of an aqueous glucose solution (0-01%) with 3 ml. of96% (w/w) H2S04 at 100° for 6-5 min., and (B) aftermixing 1 ml. of an aqueous solution containing 29 6,ug.of 5-hydroxymethylfurfural with 3 ml. of 96% H2S04at 00.
Biochem. 1954, 56
maximal development of the bluish pink colourwith minimal interference by the brownish de-composition products.
Sulphuric acid concentrationFig. 5 shows the results obtained when a dilute
glucose solution is heated for 6-5 min. at 1000 insulphuric acid of different concentrations. Pro-
% glucose100 80 60 40 20 0
0115
.0 10 _
0-05L0 20 40 60 80 100
% HMF in glucose equivalentsFig. 3. The extinction of solutions containing glucose plus
5-hydroxymethylfurfural (HMF) in various proportionswas measured at 520 mju. after the solutions had beenheated with three times their volume of 96% (w/w)H2S04 at 1000 for 6-5 min. The total concentration ofglucose plus H[ME in the aqueous solutions was 5-56 x10-4M, equivalent to 0.01% glucose.
0-20 2-0
LUi 0-05z
-
00
0-15 t
0 5 ~~~~1015 200Time (min.)
Fig. 4. The extinctions obtained after heating 0-01%glucose solutions with three volumes of 96% H2S04 at1000 for various intervals of time were measured at520 m,u. (0-0), 430 mu. (0- ---0) and 318 mIA.( x --- x ). The figures obtained for the extinction at318 mp. are plotted on one-tenth of the scale for the-values at 520 and 430 m,u.
41
Vol. 56 641
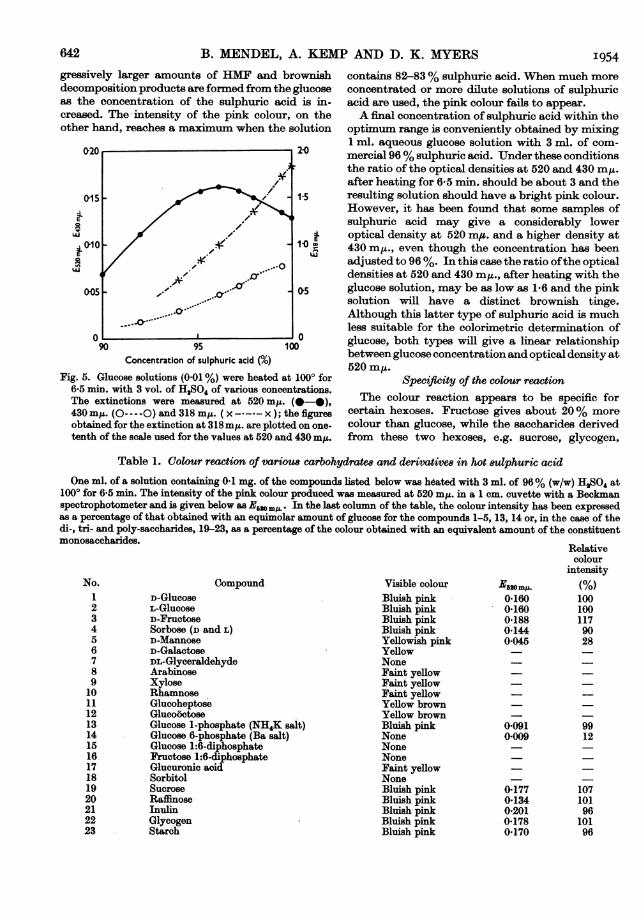
B. MENDEL, A. KEMgressively larger amounts of HMF and brownishdecomposition products are formed from the glucoseas the concentration of the sulphuric acid is in-creased. The-intensity of the pink colour, on theother hand, reaches a maximum when the solution
0,20 2-0
015 -
LAJ~~~~~~~~~~~~~~~L
i10 Ja '..-o1
0050- 5
0 090 95 100
Concentration of sulphuric acid (%/0)Fig. 5. Glucose solutions (0.01 %) were heated at 1000 for
6-5 min. with 3 vol. of HqS04 of various concentrations.The extinctions were measured at 520 mp. (0-0),430 my. (O----O) and 318 mp. ( x - ---x ); the figuresobtained for the extinction at 318 mI. are plotted on one-tenth of the scale used for the values at 520 and 430 myt.
[P AND D. K. MYERS 1954contains 82-83% sulphuric acid. When much moreconcentrated or more dilute solutions of sulphuricacid are used, the pink colour fails to appear.A final concentration of sulphuric acid within the
optimum range is conveniently obtained by mixing1 ml. aqueous glucose solution with 3 ml. of com-mercial 96% sulphuric acid. Under these conditionsthe ratio of the optical densities at 520 and 430 miz.after heating for 6-5 min. should be about 3 and theresulting solution should have a bright pink colour.However, it has been found that some samples ofsulphuric acid may give a considerably loweroptical density at 520 m,u. and a higher density at430 mIL., even though the concentration has beenadjusted to 96%. In this case the ratio ofthe opticaldensities at 520 and 430 m,., after heating with theglucose solution, may be as low as 1-6 and the pinksolution will have a distinct brownish tinge.Although this latter type of sulphuric acid is muchless suitable for the colorimetric determination ofglucose, both types will give a linear relationshipbetween glucose concentration and optical density at520 m,u.
Specificity of the colour reactionThe colour reaction appears to be specific for
certain hexoses. Fructose gives about 20% morecolour than glucose, while the saccharides derivedfrom these two hexoses, e.g. sucrose, glycogen,
Table 1. Colour reaction of various carbohydrates and derivatives in hot sulphuric acidOne ml. of a solution containing 0.1 mg. of the compounds listed below was heated with 3 ml. of 96% (w/w) H2S04 at
1000 for 6-5 min. The intensity of the pink colour produced was measured at 520 mg. in a 1 cm. cuvette with a Beckmanspectrophotometer and is given below as E620m,L. In the last column of the table, the colour intensity has been expressedas a percentage of that obtained with an equimolar amount of glucose for the compounds 1-5, 13, 14 or, in the case of thedi-, tri- and poly-saccharides, 19-23, as a percentage of the colour obtained with an equivalent amount of the constituentmonosaccharides.
CompoundD-GlucoseL-GlucoseD-FructoseSorbose (D and L)D-MannoseD-GalactoseDL-GlyceraldehydeArabinoseXyloseRhamnoseGlucoheptoseGlucooctoseGlucose 1-phosphate (NH4K salt)Glucose 6-phosphate (Ba salt)Glucose 1:6-diphosphateFructose 1:6-diphosphateGlucuronic acidSorbitolSucroseRaffinoseInulinGlycogenStarch
Visible colourBluish pinkBluish pinkBluish pinkBluish pinkYellowish pinkYellowNoneFaint yellowFaint yellowFaint yellowYellow brownYellow brownBluish pinkNoneNoneNoneFaint yellowNoneBluish pinkBluish pinkBluish pinkBluish pinkBluish pink
E520m.0-1600-1600-1880-1440*045
0-0910*009
01770-1340-2010*1780*170
Relativecolour
intensity(%)1001001179028
9912
10710196
10196
No.1234567891011121314151617181920212223
642

MICRO-DETERMINATION OF GLUCOSE
inulin and starch, give a pink colour of proportion-ate intensity (Table 1); little pink colour is developedfrom mannose. Glucose 1-phosphate is readilyhydrolysed in acid (cf. Umbreit, Burris & Stauffer,1945) and gives the same colour intensity as anequivalent amount ofglucose. Glucose 6-phosphate,on the other hand, is relatively resistant to acidhydrolysis (cf. Umbreit et al. 1945) and does notgive any pink colour under these conditions(Table 1), although the characteristic absorptionmaximum at 318 m,u. develops upon heating withsulphuric acid.A large number of non-carbohydrate substances
which might occur in deproteinized blood filtrateswere also heated in 82% sulphuric acid at 1000 for6-5 min.; in no case was a pink colour formed. Theeffect of these same compounds on the colourreaction given by glucose was investigated; little orno interference was observed in the presence ofurea (80 mg./100 ml.) uric acid, creatine, creatinine,ascorbic acid, P-hydroxybutyric acid (all in con-centrations of 10 mg./100 ml.), acetone (40 mg./100 ml.), alanine, arginine, aspartic acid, cystine,glutamic acid, glutamine, glycine, histidine, hydr-oxyproline, isoleucine, leucine, lysine, norleucine,phenylalanine, proline, serine, threonine and valine(all in concentrations of 25 mg./100 ml.). The onlysubstances tested which were found to interfereappreciably with the formation of the bluish pinkcompound from glucose were sodium chloride (cf.Mendel & Bauch, 1926), ergothioneine, glutathione,tryptophan, methionine and tyrosine (Table 2). Theconcentrations of the last three amino acids inblood are relatively low (Johnson & Bergeim, 1951)so that the amounts found in a 20-fold diluted bloodfiltrate would not interfere with the colorimetricdetermination of glucose.
Effect of chlorideMendel & Bauch (1926) reported that the presence
of chloride ion interfered with the production of the
pink colour from glucose in heated sulphuric acid.This effect is illustrated in Fig. 6. The formation ofthe bluish pink compound with an absorptionmaximum at 520 m,. is inhibited when the concen-tration of sodium chloride in the aqueous glucosesolution is greater than 2-5 mg./100 ml. The amountof HMF formed, on the other hand, is increased inthe presence ofchloride. Apparently more glucose isconverted into HMF in the presence of chloride,while the intermediary reaction leading to thecoloured compound is prevented.
0-15
0-10
005I-
20
1-5
I100J
0-5
o 1o0 25 50
Concentration of sodium chloride (mg./100 ml.)
Fig. 6. Glucose solutions (0 01 %) containing various con-centrations of NaCl were heated with three volumes of96% (w/w) H2SO4 at 100° for 6-5 min. The extinctionswere measured at 520 m!L. (0-0) and at 318 mA.(x - - - x ); the figures obtained for the extinction at318 m,. are plotted on one-tenth of the scale used forthe values at 520 mus.
Table 2. Effect of &ubstance found to interfere with the colour reaction
One ml. of an aqueous solution containing 0.1 mg. glucose and various concentrations of the substances listed belowwas heated with 3 ml. of H2SO4 at 100° for 6-5 min.; the intensity of the pink colour produced was measured at 520 m,.
Compound addedNoneSodium chlorideErgothioneineGlutathioneTryptophan
Methionine
Tyrosine
Amounts occurringin a 20-fold diluted
blood filtrate(mg./100 ml.)
28-310*156-060-82-0
0*024-0*05
0*017-0-035
0*04-0*07
s.,,
Amount addedto the glucose
solution(mg./100 ml.)
3001-5502*5050.1
25*00*5
25-00-5
E510 my.0'1600*1250-1500-1190*0930*1300*1600*0200*1610*0800*162
41-2
Vol. 56 643

B. MENDEL, A. KEMP AND D. K. MYERS
Experiments with blood samples
Since TCA was without influence on the produc-tion of the pink colour from glucose in heated sul-phuric acid, it was selected as deproteinizing agentinstead of the unstable 'metaphosphoric acid' usedby Mendel & Bauch (1926). By the addition ofsilversulphate to the TCA solution the chlorides in theblood sample are precipitated simultaneously withthe protein. When 0-1 ml. of blood is pipetted into1-9 ml. of TCA solution containing 0-1 % (w/v)silver sulphate, chlorides are only rarely detectablein the filtrate and never in concentrations higherthan 2 mg./100 ml. If desired, 0-2 ml. of blood canbe pipetted into 1-8 ml. of the 5% (w/v) TCAsolution; however, the concentration of silversulphate should then be increased to 0-2% (w/v).The excess of silver ions in the filtrate, amounting toless than one-fifth of the amount added, has noeffect on the intensity of the pink colour (Table 3).
It appeared that the silver sulphate in the de-proteinizing solution also removes the two otherinterfering substances in the blood, namely gluta-thione and ergothioneine. Addition of largeamounts ofglutathione and ergothioneine to normalblood failed to exert any significant influence on thecolour reaction (Table 4).
Table 3. Effect of silver ions on the colourreaction with glucose
The aqueous solution contained 10 mg. glucose/100 ml.and various concentrations of AggS04; the colour reactionwas carried out in the usual way.
Concn. of Ag&SO4in the glucose soln.
(mg./100 ml.)01050100200
-530m.0-1620-1620-1630-1650-171
Table 4. Determination of glucose in blood to whichglutathione or ergothioneine had been added
Glutathione or ergothioneine were added to defibrinatedhuman blood, and 0-2 ml. of the blood was deproteinizedwith 1-8 ml. of 5% (w/v) TCA containing 0-2% (w/v)Ag.S04. One ml. of the clear supernatant fluid obtainedafter centrifuging was added to 3 ml. of H2804 and thecolour reaction was carried out in the usual way.
AmoiSubstance to tiadded (mg.,
NoneGlutathioneGlutathioneErgothioneine
mnt addedhe blood/100 ml.) E53omgo- 0-15325 0-15250 0-15615 0-153
Blood glucosefound
(mg./100 ml.)94949694
Apart from the carbohydrates, other substancespresent in blood do not give the colour reactionwith hot sulphuric acid. No pink colour was formedafter the glucose in blood had been removed byfermentation with yeast.
Table 5 shows that the usual anticoagulants donot affect the colorimetric determination of bloodsugar. Sodium fluoride in a concentration of 10 mg./ml. appeared to be the most suitable anticoagulantsince it prevents glycolysis (Lovatt Evans, 1922) aswell as clotting.
Repeated determinations of the blood sugar onthe same sample of blood showed that the repro-ducibility of the results was very satisfactory. Theaverage of eight determinations on one sample ofnormal human blood was 85-1 mg. glucose/100 ml.(S.D. 1-63 mg./100 ml. or 1-9 %). Five determina-tions on a second sample of normal human bloodgave an average of 92-8 mg. glucose/100 ml. (S.D.1-65 mg./100 ml. or 1-8 %). Glucose added to bloodcould always be recovered completely from theblood filtrates (Table 6).
Table 5. Determination of the glucose in bloodto which anticoagulants had been added
The anticoagulants listed below were added to de-fibrinated human blood; 0-1 ml. of the blood was de-proteinized with 1-9 ml. of 5% (w/v) TCA containing0.1% (w/v) Ag2SO4. After centrifuging, the colour reactionwas carried out in the usual way.
Anti-coagulantadded
NoneSodium oxalateSodium fluorideSodium fluorideHeparin
Amount addedto the blood(ml -g./ml.) 0-0690mp
-0-0692 0-069
10 0-06825 0-06910 0-070
Blood glucosefound
(mg./100 ml.)8585848586
Table 6. Determination of the glucose in blood towhich known amounts of gluco8e had been added
Known amounts of glucose were dissolved in humanblood containing 10 mg. NaF/ml. as anticoagulant; 0-1 ml.of the blood was deproteinized with 1-9 ml. of TCA:Ag2SO4 solution, centrifuged, and the colour reactioncarried out in the usual way.
Amount ofglucose added
Blood to the bloodsample (mg./100 ml.)A 0
2550100250
B 050
C 050
Bloodglucosefound
(mg./100 ml.)65911131603157912971122
Glucoserecovered
(mg./100 ml.)
264895250
50
51
6,44 I954

Vol. 56 MICRO-DETERMINATION OF GLUCOSE 645
Table 7. Comparison of the blood-sugar values deter-mined by the methods of Somogyi and Mendel &Hoogland
Blood samples were taken from non-fasted experimentalanimals. Three of the samples were obtained from dogswhich had been rendered diabetic by pancreatectomy. Theblood-sugar value of each sample was determined by theiodometric method of Somogyi (1945) and by the colori-metric method of Mendel & Hoogland (1950) as describedin the text.
Blood sugar (mg./100 ml.), ~~~A
Sample Mendel &no. Species Somogyi Hoogland1 Rat 120 1212 Guinea pig 117 1153 Rabbit 106 1004 Sheep 39 395 Duck 130 1306 Diabetic dog A 284 2807 Diabetic dog B 302 3008 Diabetic dog C 324 312
Finally a comparison was made between theblood-sugar values determined by the presentmethod and the values found on the same samples ofblood by the iodometric macro-method of Somogyi(1945). The results obtained with blood from experi-mental animals are given in Table 7. It can be seenthat there is a good agreement between the twomethods in almost every case.
DISCUSSION
Most of the accepted methods for the determinationofblood sugar, e.g. Folin & Wu (1922) and Hagedorn& Jensen (1923), are based on the reducing pro-perties of glucose. Since blood also contains 'non-sugar' reducing substances, it is difficult to deter-mine its 'true glucose' content with these methods,though more reliable results have been obtainedwith the techniques developed by Somogyi (1937,1945, 1952). The colorimetric method describedhere, on the other hand, does not depend on thereducing power of glucose but on the formationof 5-hydroxymethylfurfural. The colour reactionappears to be specific for the hexoses which occur inblood, i.e. glucose and fructose (Bacon & Bell, 1948).'Non-sugar ' reducing substances arenot determinedby this method.
Another method which depends on the formationof furfural derivatives from carbohydrates in hotsulphuric acid has been described by Dische (1930,1947) (cf. Gurin & Hood, 1939, 1941). This methoddoes not appear to be specific for hexoses and inaddition requires very pure carbazole as a chromo-genic agent. No chromogenic agent is necessary forthe formation of the pink colour in the reactiondescribed by Mendel & Bauch (1926). Moreover, thenew method is simple, and requires only two re-
agents which can easily be obtained and which arestable over long periods.
After this paper was completed, Love (1953)reported studies on the spectra which are obtainedwhen carbohydrates are heated with concentratedsulphuric acid. It will be noted that Love (1953)used a higher concentration of sulphuric acid (98%)and high concentrations of glucose (40-100 mg.100 ml.) in his investigation of the visible spectra.Both factors lead to an early formation of humicsubstances which, by their yellow-brown colour,would mask the characteristic bluish pink coFlourobtained with glucose and fructose under the con-ditions described in the present paper. Since ourmethod can easily be adapted for measurementswith a colour scale (Kemp & Zuidweg, 1952) or withsimple colorimeters, it should be suitable for routinedeterminations of blood glucose or tissue glycogen.
SUMMARY
1. A colorimetric micro-method for the deter-mination of glucose has been described. Thismethod is based on the observation that a bluishpink colour develops when one volume of a dilutesolution of glucose is heated with three volumes of96% (w/w) sulphuric acid; the intensity of the pinkcolour is proportional to the concentration ofglucose.
2. The glucose is dehydrated in hot sulphuricacid to 5-hydroxymethylfurfural, which reacts witha compound intermediate between glucose andhydroxymethylfurfural to produce the pink colour.For practical purposes, this reaction appears to bespecific for glucose, fructose and saccharides con-taining these two hexoses.
3. The true glucose content of blood can bedetermined by this simple method after the bloodhas been deproteinized with a trichloroacetic acidsolution containing silver sulphate.Many of the experiments reported in this paper were
done together with Dr P. L. Hoogland in the Bantingand Best Department of Medical Research, University ofToronto, Canada; we are greatly indebted to Dr Hooglandfor his co-operation. We gratefully acknowledge gifts ofglucose 1-phosphate and glucose 6-phosphate from Dr D. M.Needham, F.R.S., Cambridge, of glucoheptose and gluco-octose from Prof. H. 0. L. Fischer, Berkeley, and of 5-hydroxymethylfurfural from Dr H. C. Beyerman, Amster-dam. We are also much indebted to Dr A. Neuberger, F.R.S.,London, for his kind help in finding a suitable brand ofsulphuric acid manufactured in Great Britain.
REFERENCES
Bacon, J. S. D. & Bell, D. J. (1948). Biochem. J. 42, 397.Dische, Z. (1930). Mikrochemse, 8, 4.Dische, Z. (1947). J. biol. Chem. 167, 189.Folin, 0. & Wu, H. (1922). J. biol. Chem. 51, 209.

646 B. MENDEL, A. KEMP AND D. K. MYERS I954Gurin, S. & Hood, D. B. (1939). J. biol. Chem. 181, 211.Gurin, S. & Hood, D. B. (1941). J. biol. Chem. 139, 775.Hagedorn, H. C. & Jensen, B. N. (1923). Biochem. Z. 135,46.Holzman, G., MacAallister, R. V. & Niemann, C. (1947).
J. biol. Chem. 171, 27.Ikawa, M. & Niemann, C. (1949). J. biol. Chem. 180, 923.Johnson, C. A. & Bergeim, 0. (1951). J. biol. Chem. 188,
833.Kemp, A. & KitsvanHeijningen, A. J. M. (1954). Biochem. J.
56, 646.Kemp, A. & Zuidweg, M. (1952). Acta physiol. pharmacol.
neerl. 2, 280.Lovatt Evans, C. (1922). J. Physi8. 56, 146.
Love, R. M. (1953). Biochem. J. 55, 126.Mendel, B. & Bauch, M. (1926). Klin. W8chr. 5, 1329.Mendel, B. & Hoogland, P. L. (1950). Lancet, 2, 16.Singh, B., Dean, G. R. & Cantor, S. M. (1948). J. Amer.
chem. Soc. 70, 517.Somogyi, M. (1937). J. biol. Chem. 117, 771.Somogyi, M. (1945). J. biol. Chem. 160, 69.Somogyi, M. (1952). J. biol. Chem. 195, 19.Umbreit, W. W., Burms, R. H. & Stauffer, J. F. (1945).
Manometric Techniques and Tissme Metabolism, 1st ed.pp. 164-9. Minneapolis: Burgess Publ. Co.
Wolfrom, M. L., Schuetz, R. D. & Cavalieri, L. F. (1948).J. Amer. chem. Soc. 70, 514.
A Colorimetric Micro-method for the Determination ofGlycogen in Tissues
BY A. KEMP AND ADRIENNE J. M. KITS VAN HEIJNINGENPharmaco-therapeutic Laboratory, Univer8ity of Am8terdam, Arnterdam, Holland
(Received 14 October 1953)
A new method for the determination of blood sugarhas recently been described by Mendel & Hoogland(1950) and Mendel, Kemp & Myers (1954). Thismethod is based on a colour reaction which occurswhen a dilute solution of glucose is heated withconcentrated sulphuric acid (Mendel & Bauch,1926). Since glycogen is hydrolysed to glucose inhot sulphuric acid, this reaction can also be used todetermine glycogen.The deproteinizing solution used by Mendel &
Hoogland (1950) contains trichloroacetic acid and,in addition, a small amount of silver sulphate toprecipitate free chloride and other interfering sub-stances. Although pure glycogen dissolves readilyin this deproteinizing solution, only part of theglycogen can be extracted from the tissues with acold solution of trichloroacetic acid (Willstatter &Rhodewald, 1934; Young, 1937; Bloom, Lewis,Schumpert & Shen, 1951; cf. Przylecki & Majmin,1934; Mystkowski, 1937). However, it was found inthe present investigation that all of the glycogencan be brought into solution by grinding the tissuewith trichloroacetic acid solution and then heatingthe suspension for 15 miD. at 1000.Any glucose present in the tissues will of course
be extracted and determined, together with theglycogen by this method. The amount of glucose inthe tissues is usually small in comparison with theamount of glycogen present, but under certainexperimental conditions it might be desirable toremove the glucose. Procedures will, therefore, bedescribed for the determination of both glycogenand glucose in muscle and liver. Of the glycogenmetabolites containing a hexose molecule, only
glucose 1 -phosphate gives the colour reaction(Mendel et al. 1954); however, the concentration ofglucose 1-phosphate in tissues (cf. Umbreit, Burrns &Stauffer, 1945) is within the limits of error of thisdetermination.
METHODS
Reagent8Deproteinizing solution. Trichloroacetic acid (5 g., A.R.)
and Ag,SO4 (100 mg., A.R.) are dissolved in water and madeup to 100 ml. (cf. Mendel et al. 1954). The solution is storedin an amber bottle in the cold.
Sulphuric acid, 96% (w/w, approx. 36N) (cf. Kemp &Zuidweg, 1952; Mendel et al. 1954).
Methanol, 80% (v/v).
ProcedureDetermination of glycogen plus glucose. Muscle or liver
(25-75 mg.) are ground with 5 ml. of the deproteinizingsolution in a centrifuge tube; a stainless-steel pestle withlongitudinal grooves which fits closely into a cylindricalcentrifuge tube has proved useful for this purpose. The fluidlevel is marked on the centrifuge tube and the tube, coveredwith a glass cap, is placed in a boiling-water bath for 15 min.Then the tube is cooled in running water, filled up to themark with deproteinizing solution to compensate forevaporation, and centrifuged at 3000 rev./min. for 5 mi.One ml. of the clear supernatant fluid is added to 3 ml. ofH2S04 in a wide test tube and mixed by vigorous shaking.The mixture is heated in a boiling-water bath for exactly6-5 min. and subsequently cooled in running tap water. Theintensity of the pink colour produced is measured spectro-photometrically at 520 m,. and the glycogen concentrationread from a standard curve in terms of glucose equivalents.As noted previously (Mendel et al. 1954), glycogen gives thesame colour intensity as does an equivalent amount ofglucose.