Embed Size (px)
Citation preview
Visualizing PI System Data
Version 2017

Visualizing PI System Data
Page ii
Visualizing PI System Data
Page iii
Table of Contents
PI System Basics ..................................................................................................... 5
1.1 What is a PI System? ..................................................................................... 5
1.2 The Basic Building Blocks in the PI System ............................................... 7
1.3 PI System Explorer ........................................................................................ 9
1.4 How Data Moves through the PI System ................................................... 14
1.5 Storing and Accessing “Future Data” in the PI System .......................... 16
1.6 Tracking Important Events with PI ............................................................. 17
1.7 The Fictitious Plant Used in This Course .................................................. 19
PI Time .................................................................................................................... 21
2.1 PI Time Expressions .................................................................................... 21
2.2 Some Rules to Remember .......................................................................... 24
2.3 Future Data ................................................................................................... 26
2.4 How does PI Adjust for time zones and DST? .......................................... 26
Building a Display Using PI Vision ...................................................................... 27
3.1 PI Vision: New Name ................................................................................... 27
3.2 PI Vision Displays ........................................................................................ 27
3.3 Enhance PI Vision Displays with Advanced Features ............................. 39
3.4 PI Vision Additional Features ..................................................................... 49
Using a Display to Monitor a Process ................................................................. 53
4.1 Dashboard Display Visual Indicators ........................................................ 53
4.2 Connecting to the PI System in PI ProcessBook ..................................... 55
4.3 Finding PI Points to be used in building PI ProcessBook displays ....... 61
4.4 Creating a Process Monitoring Display ..................................................... 64
4.5 Finding AF Elements and Attributes using AF Display Builder Add-In . 71
4.6 AF and Element Relative Displays ............................................................. 75
4.7 Working with a Trend .................................................................................. 80
4.8 Accessories for Use in PI ProcessBook Displays .................................... 83
Building a Simple Report ...................................................................................... 87
5.1 PI DataLink Introduction ............................................................................. 87
5.2 Connecting to the PI System in PI DataLink ............................................. 88
5.3 Finding Data Items using PI DataLink Search .......................................... 90
5.4 PI DataLink Data Extracting Functions ...................................................... 93
5.5 PI DataLink Single Value Queries............................................................... 94
Visualizing PI System Data
Page iv
5.6 PI DataLink Multiple Value Queries .......................................................... 103
5.7 Element Relative PI DataLink Reports ..................................................... 112
5.8 Arrays in PI DataLink ................................................................................. 117
5.9 Units of Measure and Descriptions as Context in Reports ................... 118
5.10 Group Recap Question ..................................... Error! Bookmark not defined.
Modeling a Plant with PI ProcessBook ............................................................. 119
6.1 Modeling Assets in a Plant ....................................................................... 119
6.2 Analyze PI ProcessBook Data Items in an Ad Hoc PI Vision Trend ..... 125
6.3 Navigating in PI ProcessBook .................................................................. 127
6.4 Creating Workbooks and Organizing Displays ....................................... 130
Viewing Events, Managing Displays and Viewing PI Processbook Displays in PI Vision ................................................................................................................ 135
7.1 Analyzing and Comparing Related Events .............................................. 135
7.2 Manage Role-Based User Access Level .................................................. 140
7.3 Managing PI Vision Displays .................................................................... 140
7.4 View PI ProcessBook Displays from Anywhere, on Any Device, at Any Time ............................................................................................................. 143
Production Summaries and Preventative Maintenance .................................. 145
8.1 A Word on the Events-related Features of PI DataLink ......................... 145
8.2 Production Summaries .............................................................................. 150
8.3 Performance Equations (PE) Syntax........................................................ 158
8.4 Preventative Maintenance ......................................................................... 161
8.5 Filtered Data Using Custom Expressions ............................................... 165
8.6 PI DataLink - Expression Data (Optional) ................................................ 169
The Support You Get at OSIsoft ......................................................................... 174
9.1 PI Square: The OSIsoft Community ......................................................... 174
9.2 Technical Support ...................................................................................... 176
9.3 Learning ...................................................................................................... 176
9.4 Enabling Multiple Languages on Client Applications ............................ 179
9.5 Further Questions ...................................................................................... 179
Final Exercise ....................................................................................................... 180
10.1 Wrapping up the Course ........................................................................... 180
Additional Material (Reference) .......................................................................... 187
11.1 Creating Pivot Charts and Pivot Tables in Microsoft Excel .................. 187
11.2 PI Calculations in PI ProcessBook........................................................... 193
Visualizing PI System Data
Page 5
PI System Basics
1.1 What is a PI System?
Objectives
Define the components of a PI System.
Draw a diagram of the architecture of a PI System.
The PI System Described
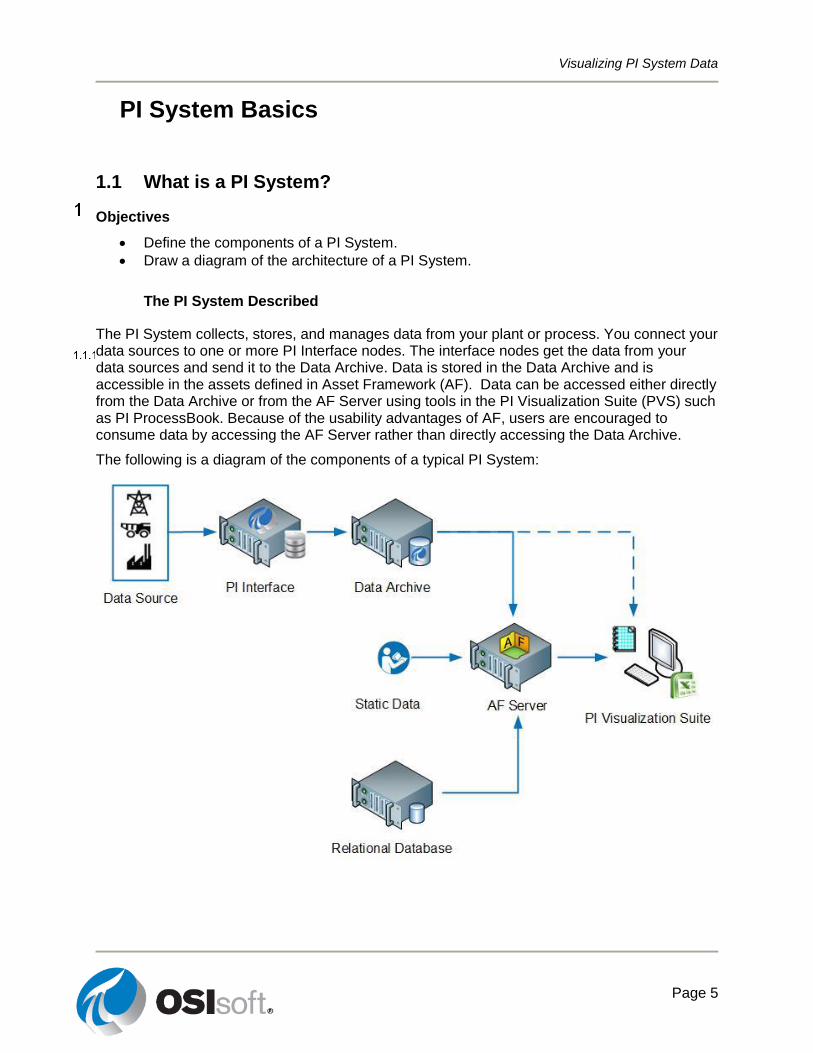
The PI System collects, stores, and manages data from your plant or process. You connect your data sources to one or more PI Interface nodes. The interface nodes get the data from your data sources and send it to the Data Archive. Data is stored in the Data Archive and is accessible in the assets defined in Asset Framework (AF). Data can be accessed either directly from the Data Archive or from the AF Server using tools in the PI Visualization Suite (PVS) such as PI ProcessBook. Because of the usability advantages of AF, users are encouraged to consume data by accessing the AF Server rather than directly accessing the Data Archive.
The following is a diagram of the components of a typical PI System:
Visualizing PI System Data
Page 6
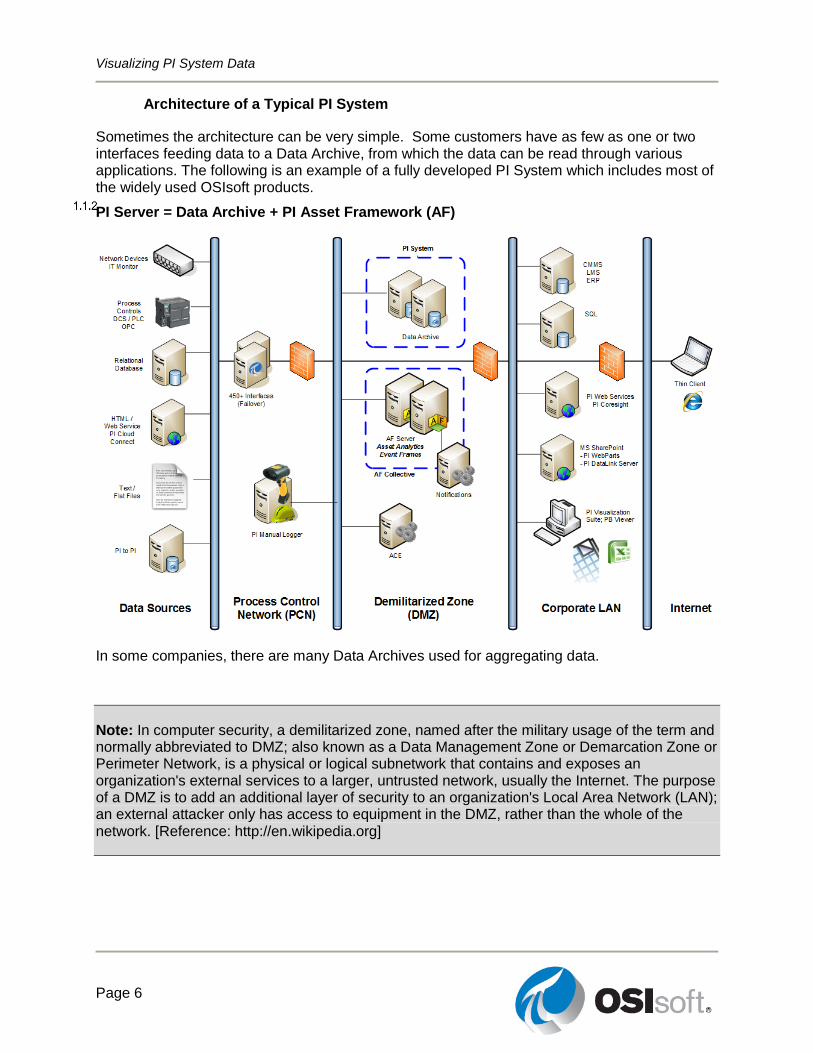
Architecture of a Typical PI System
Sometimes the architecture can be very simple. Some customers have as few as one or two interfaces feeding data to a Data Archive, from which the data can be read through various applications. The following is an example of a fully developed PI System which includes most of the widely used OSIsoft products.
PI Server = Data Archive + PI Asset Framework (AF)
In some companies, there are many Data Archives used for aggregating data.
Note: In computer security, a demilitarized zone, named after the military usage of the term and normally abbreviated to DMZ; also known as a Data Management Zone or Demarcation Zone or Perimeter Network, is a physical or logical subnetwork that contains and exposes an organization's external services to a larger, untrusted network, usually the Internet. The purpose of a DMZ is to add an additional layer of security to an organization's Local Area Network (LAN); an external attacker only has access to equipment in the DMZ, rather than the whole of the network. [Reference: http://en.wikipedia.org]
Visualizing PI System Data
Page 7
1.2 The Basic Building Blocks in the PI System
Objectives
Define the terms of PI Asset Framework (AF) Asset and its components: elements and attributes.
Define AF attribute types: static (none), PI Point, point array, formula, string builder, table lookup and Analysis.
What is a PI Point?
PI Point (or PI Tag) is a unique storage point for data in the Data Archive. It is simply a single point of measurement. It has been the traditional storage unit in the PI Server.
Data Archive points have a set of properties called point attributes that define the PI points. Some of these properties are commonly used in client tools for display or informational purposes and are briefly described in the following.
Point name
Unique name is required to create points for storage in the Data Archive. It is a common practice to name the PI Points based on the Control Systems point names. Since the point is the name that identifies the point to users, consistent point-naming convention should be used that is meaningful to people in your organization. Knowing the naming convention can be helpful in searching for points. For example, try to determine what the following point may refer to:
Point name: M03_E1P1_MOTDRV1202_RUNSTAT
________________________________________________________
It refers to: Machine3 Enclosure 1 Panel 1 Motor Drive 1202 Run Status which is not intuitive.
Some of the other common point attributes that are often used in client tools are listed in the following table.
Attributes Description
Descriptor This is the human-friendly description of the Data Archive Point. The descriptor is often a search criterion since the point name is not always intuitive. Often the point name is some sort of abbreviated convention and the descriptor captures the “full name.”
EngUnits Engineering units (units of measure)
Zero and Span
These define the minimum and maximum values and are used in a number of places. Most obvious are the upper and lower boundaries of object like the trend, bar graph, or multistate symbol.
Point source Allows grouping of PI points by their interfaces that collect data and is occasionally used in point searching. It requires the knowledge of data source, which is instruments that generate the data of interest (e.g. DCS, PLC, or other sources).
Visualizing PI System Data
Page 8
What is an Asset?
In AF, each piece of equipment or process or company locations and sites is represented by an Element (Asset). It organizes all equipment into a structure that makes it easy to find information. AF can be helpful to users of the Data Archive who know the assets and processes, but are not familiar with attribute nomenclature. With assets, data can be located without understanding the technical details of each piece of equipment as the assets are organized hierarchically and logically.
What is a AF Attribute?
Attributes represent a unique property associated with an asset. Attributes can hold simple values, representing fixed information, such as the diameter of a tank. An attribute can reference a PI point, a formula, a value from a relational database and more. All relevant data about an asset is tied to the element representing that asset.
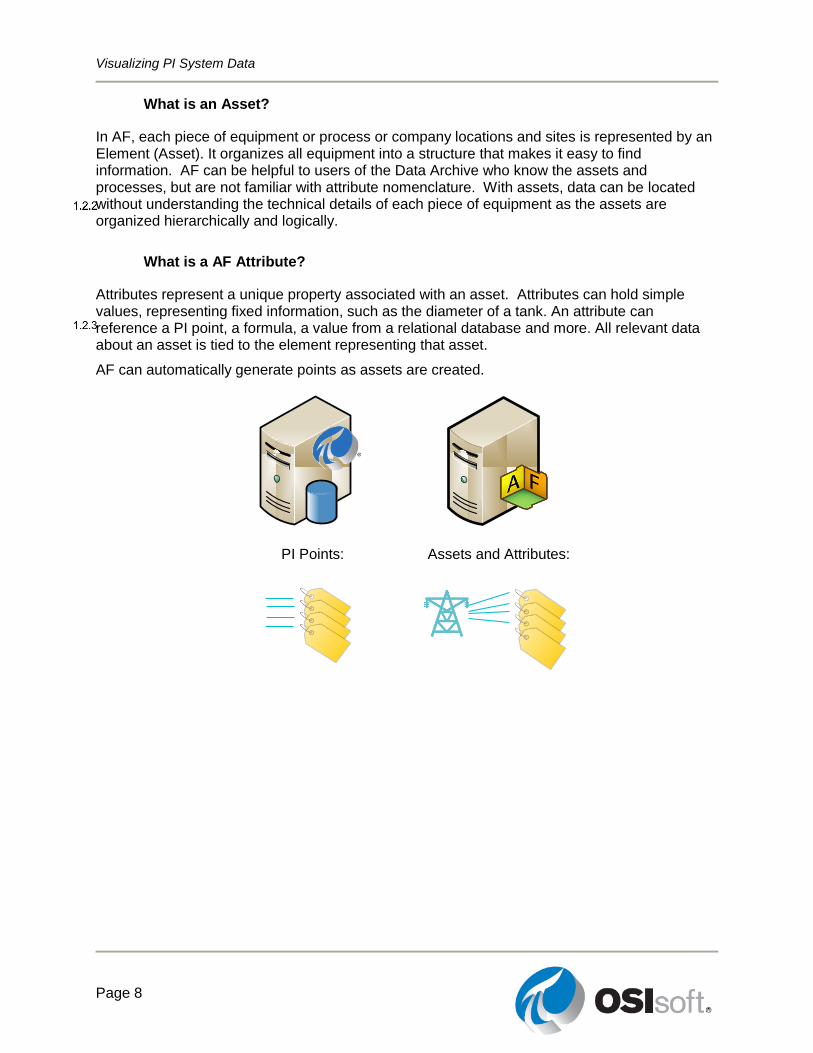
AF can automatically generate points as assets are created.
PI Points: Assets and Attributes:
Visualizing PI System Data
Page 9
1.3 PI System Explorer
PI System Explorer, or sometimes referred to as PSE or AF Client, is the AF user interface and allows users to find information about their equipment and processes. It also has a rich range of features, making it the configuration and management tool for AF, PI Notifications and Event Frames.
PSE is installed as part of the PI ProcessBook and PI DataLink installations. The client component of the PI Notifications install kit will add extra sections to the Navigator Panel of PSE (MyPI, Notifications and Contacts) in order to configure notifications.
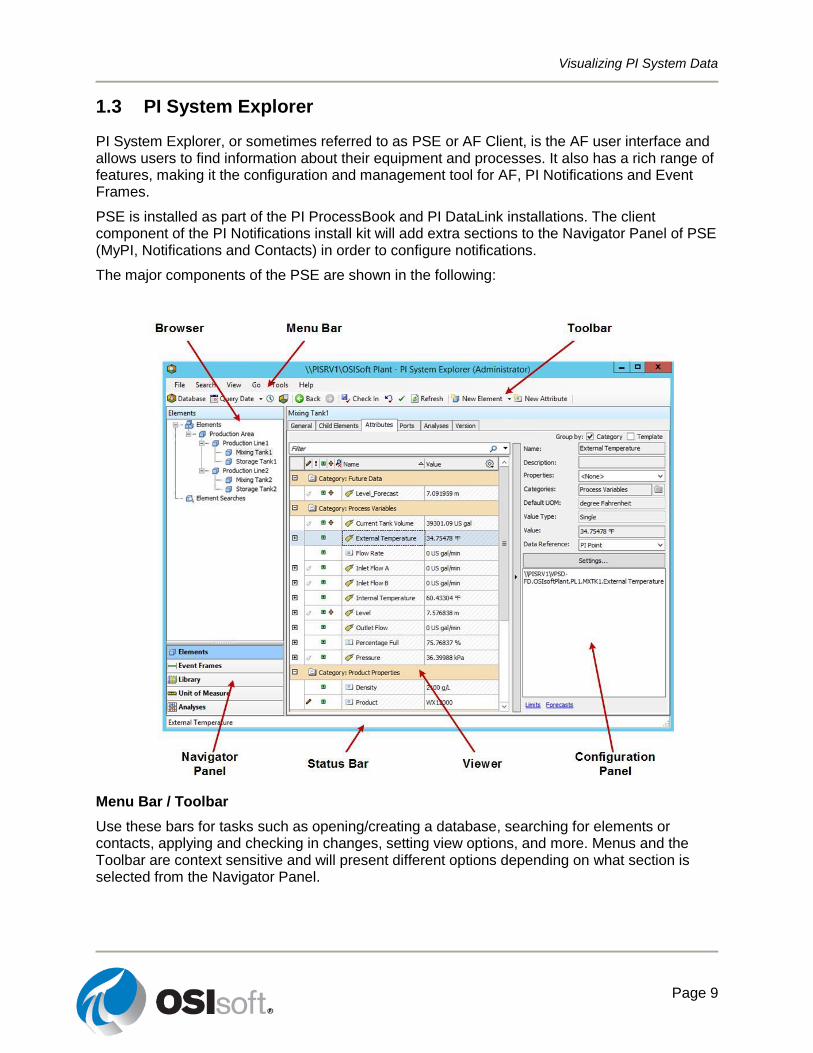
The major components of the PSE are shown in the following:
Menu Bar / Toolbar
Use these bars for tasks such as opening/creating a database, searching for elements or contacts, applying and checking in changes, setting view options, and more. Menus and the Toolbar are context sensitive and will present different options depending on what section is selected from the Navigator Panel.
Visualizing PI System Data
Page 10
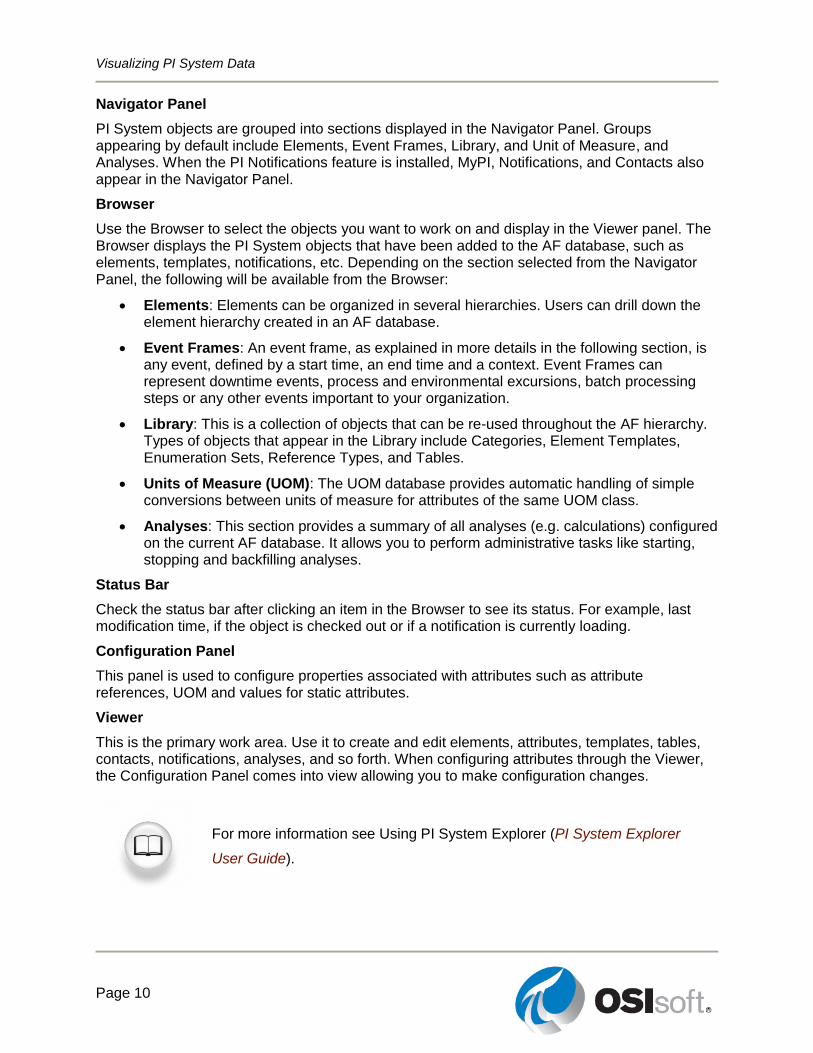
Navigator Panel
PI System objects are grouped into sections displayed in the Navigator Panel. Groups appearing by default include Elements, Event Frames, Library, and Unit of Measure, and Analyses. When the PI Notifications feature is installed, MyPI, Notifications, and Contacts also appear in the Navigator Panel.
Browser
Use the Browser to select the objects you want to work on and display in the Viewer panel. The Browser displays the PI System objects that have been added to the AF database, such as elements, templates, notifications, etc. Depending on the section selected from the Navigator Panel, the following will be available from the Browser:
Elements: Elements can be organized in several hierarchies. Users can drill down the element hierarchy created in an AF database.
Event Frames: An event frame, as explained in more details in the following section, is any event, defined by a start time, an end time and a context. Event Frames can represent downtime events, process and environmental excursions, batch processing steps or any other events important to your organization.
Library: This is a collection of objects that can be re-used throughout the AF hierarchy. Types of objects that appear in the Library include Categories, Element Templates, Enumeration Sets, Reference Types, and Tables.
Units of Measure (UOM): The UOM database provides automatic handling of simple conversions between units of measure for attributes of the same UOM class.
Analyses: This section provides a summary of all analyses (e.g. calculations) configured on the current AF database. It allows you to perform administrative tasks like starting, stopping and backfilling analyses.
Status Bar
Check the status bar after clicking an item in the Browser to see its status. For example, last modification time, if the object is checked out or if a notification is currently loading.
Configuration Panel
This panel is used to configure properties associated with attributes such as attribute references, UOM and values for static attributes.
Viewer
This is the primary work area. Use it to create and edit elements, attributes, templates, tables, contacts, notifications, analyses, and so forth. When configuring attributes through the Viewer, the Configuration Panel comes into view allowing you to make configuration changes.
For more information see Using PI System Explorer (PI System Explorer
User Guide).
Visualizing PI System Data
Page 11
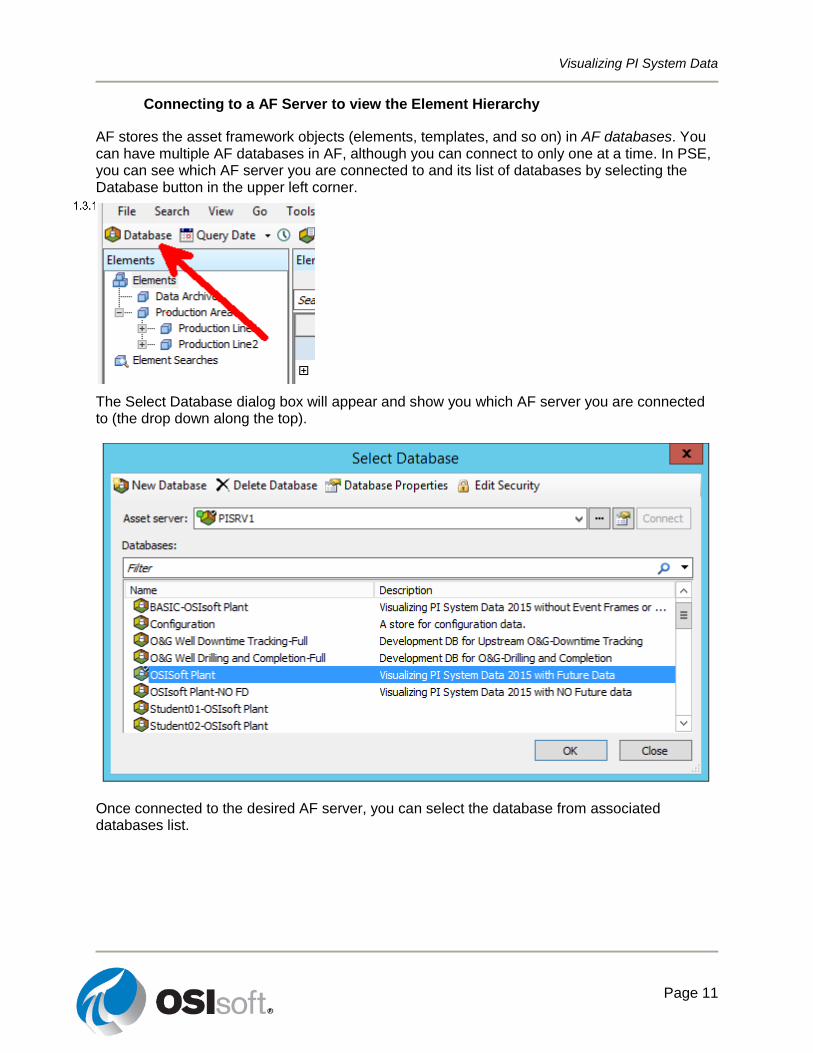
Connecting to a AF Server to view the Element Hierarchy
AF stores the asset framework objects (elements, templates, and so on) in AF databases. You can have multiple AF databases in AF, although you can connect to only one at a time. In PSE, you can see which AF server you are connected to and its list of databases by selecting the Database button in the upper left corner.
The Select Database dialog box will appear and show you which AF server you are connected to (the drop down along the top).
Once connected to the desired AF server, you can select the database from associated databases list.
Visualizing PI System Data
Page 12
Directed Activity – Accessing the AF Database
You are invited to watch what the instructor is doing or perform the same steps at the same time to explore the different concepts presented in this chapter or section.
Problem Description
You would like to view and drill down the hierarchy of Elements within the AF database named OSIsoft Plant to see what types of Tanks you have. This database is associated with the AF Server named PISRV1.
Approach
Step 1 : From PI System Explorer (PSE), click on Database.
Step 2 : From the Asset Server dropdown list, select PISRV1 and if it is not already
connected, click on Connect.
Step 3 : From the list of the Databases associated with this AF Server, select OSIsoft Plant.
Visualizing PI System Data
Page 13
Directed Activity – Assets Defined
You are invited to watch what the instructor is doing or perform the same steps at the same time to explore the different concepts presented in this chapter or section.
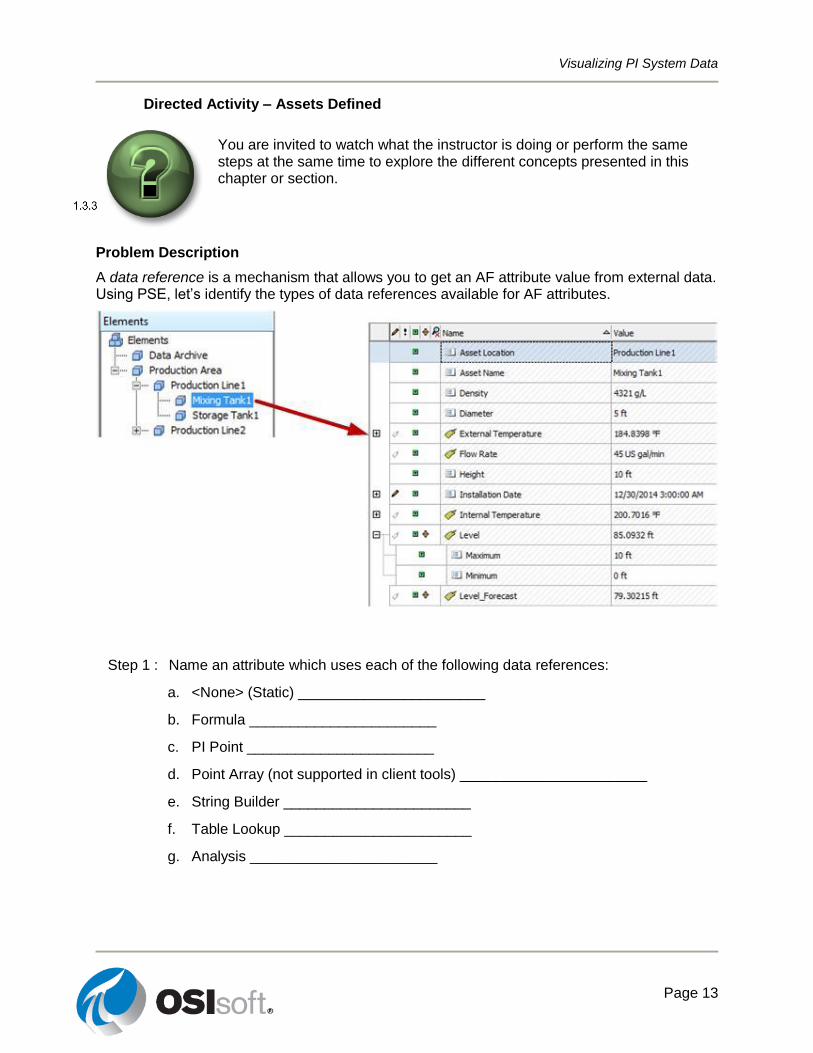
Problem Description
A data reference is a mechanism that allows you to get an AF attribute value from external data. Using PSE, let’s identify the types of data references available for AF attributes.
Step 1 : Name an attribute which uses each of the following data references:
a. <None> (Static) _______________________
b. Formula _______________________
c. PI Point _______________________
d. Point Array (not supported in client tools) _______________________
e. String Builder _______________________
f. Table Lookup _______________________
g. Analysis _______________________
Visualizing PI System Data
Page 14
1.4 How Data Moves through the PI System
Objectives
Explain how the Interfaces filter noise and define noise.
Explain how the Data Archive applies compression to store only meaningful data
You can tune your PI Points for maximum efficiency with the configurable attributes that specify compression and exception reporting. The configuration of these specifications impacts the flow of data from the interface node to the server for that point (exception reporting) and the efficiency of data storage in the archive for that point (compression testing).
The settings of these two testing and reporting mechanisms have default values set in PI. However, since every organization is unique, your PI Administrator would need to modify these settings according to your data collection needs.
The following YouTube video, from OSIsoft YouTube learning channel, gives a brief summary of the above-mentioned mechanisms.
“OSIsoft: Exception and Compression Quick Summary” http://youtu.be/6-scv3oQ7Kk
Note: Interested in learning more? Watch the following YouTube video:
“OSIsoft: Exception and Compression Full Details” http://youtu.be/89hg2mme7S0
Below is a brief description of each of these two testing and reporting mechanisms.
Exception Reporting (filtering noise)
In an ideal world, the interface would apply some sort of logic to data collection. This is often referred to as “Reporting by Exception”. The exception test filters all values considered noise.
This process filters out noise, and thereby reduces the communication (I/O) burden between the Data Archive and the interface node. OSIsoft recommends that the exception deviation is set to slightly smaller than the precision of the instrument. Exception reporting is a simple linear test that occurs on the interface node.
Noise: Insignificant changes, are defined as those below the instrument’s accuracy threshold, as set by the person creating PI Points, and identical values, such as a valve that is reading
OPEN repeatedly.
The value passing the exception reporting and sent to Data Archive is called the Snapshot value, or current value.
Visualizing PI System Data
Page 15
For more information, see the "Exception Reporting and Compression Testing" section of the PI Server System Management Guide.
Compression Testing (Storing only meaningful data)
Compression testing is performed on the Data Archive to enhance data storage efficiency and thereby conserve disk space. The compression test uses a sophisticated algorithm, sometimes called the swinging door compression algorithm, to determine which events should be stored in the PI archives. The Data Archive needs to store only those events deemed meaningful by the compression test; it can essentially recreate other events through interpolation of surrounding events.
The value passing the compression testing gets archived and therefore is called the Archive value.
Note: Detailed explanations on compression algorithm can be found in KB Article “KB00699 – Compression Explained”:
http://techsupport.osisoft.com/Troubleshooting/KB/KB00699
Visualizing PI System Data
Page 16
1.5 Storing and Accessing “Future Data” in the PI System
Many businesses rely on the use of forecast data to predict resource requirements or maintenance activities, find differences between predicted and actual production yields, and so on.
Prior to version 2015, Data Archive only supported data in real time, not the data from forecast or predictions with a timestamp beyond the current time (i.e. the “Future Data”). With Data Archive 2015, however, this type of time-series data is differentiated from future data giving users the capability of storing and accessing future data. For the two types of data combined, Data Archive 2015 allows storage and retrieval of data with time stamps within the range of January, 1970 through January, 2038.
How is future data managed differently from historical data?
Data Archive differentiates future data from traditional real-time data by the newly available PI Point attribute of “future”. This attribute is enabled for the future data PI Point. The future attribute cannot be modified after the PI Point has been created. Therefore, existing historical PI Points cannot be converted to future PI Points.
To store future data, Data Archive uses separate archives called “future archives” that are created automatically. This is in contrast with the traditional archives used to store time-series data referred to as “historical archives”. Future archives have pre-determined time ranges and are created only when data is received. Every future archive has an initial size of 1 MB, grows dynamically, and has a time range always bound to one calendar month. For example, if a new PI value comes in on December 7th at 09:00 AM and an archive file does not already exist for the month of December, Data Archive creates one automatically. Historical and future archives can be managed independently based on specific needs for data retention, availability, performance, and reliability.
Choosing between historical or future PI Points is a key decision that depends on whether the data that must be stored is real-time data, that is, from sensors collecting continuous measurements, or data that may not be close to current time or may be frequently revised (for example, forecasts or predictions). Such critical distinction in stored values is unlikely to change in the life of a PI Point.
Note: Any historical, non-future, PI Points will reject any data with time stamps that are greater than 10 minutes beyond current time.
Can future data be accessed by PI tools?
Typically, future data is generated over a specific time range, for example, a day or week ahead of the current time, and is periodically refreshed when a new set of predictions becomes available. The data forecasts stored in PI can be compared against actual measurements either visually (for example, using graphical PI trends) or analytically (for example, using PI DataLink spreadsheets). Preserving the history of your forecasts may also be useful for model optimizations and “what-if” analyses.
Visualizing PI System Data
Page 17
1.6 Tracking Important Events with PI
Events are important process or business time periods that represent something happening that affects your operations. Capturing important events in your process and collecting relevant data around those events can help analyze why they occurred. For example, you can closely monitor the following events to identify possible causes or potential points of failure.
Asset downtime Environmental monitoring excursions
Process excursions Product tracking batches
Equipment startups and shutdowns
Operator shifts
In the PI System, events are known as Event Frames. With Event Frames, you can capture, store, find, compare and analyze the important events and their related data. The power of Event Frames is that you are able to analyze your PI data in the context of these events rather than by continuous time periods. Instead of searching by time, Event Frames enables users to easily search the PI System for the specific events they are trying to analyze or report on.
An Event Frame is defined by three characteristics:
1. Name: each event frame name must be unique and often includes a time stamp
2. Start time and End time: defines the event’s time range
3. Context: one or more event attributes and referenced AF elements
There are two categories of trackable events that would fit an event frame profile:
Good events: Events that you want to track as a normal part of business such as product tracking, shifts, and so on.
Bad events: Events that are unexpected and need to be analyzed and perhaps fixed quickly if they ever occur such as unexpected shutdowns or excursions. These are events that you want to track and report in aggregate, over time.
Asking questions such as these can help identify events or conditions that must be tracked, which will be later utilized in doing event analysis:
Q1. What are all the times that event X occurred on this type of asset?
Q2. Can I associate data from different points for a time-range, or for a single point in time?
Q3. What is the associated data for a particular time period when a problem occurred or may occur in the future?
Q4. What are the critical process events that someone needs to be notified on?
How to Generate Event Frames
There are different ways to generate event frames: PI Interfaces for Batch Execution Systems, the Event Frame Generator and AF SDK custom applications are some of them. Furthermore, with the release of PI Analytics you can generate event frames directly from AF. Once event frames are generated in AF, client tools such as PI DataLink and PI Vision could be used in visualizing and analyzing them.
Visualizing PI System Data
Page 18
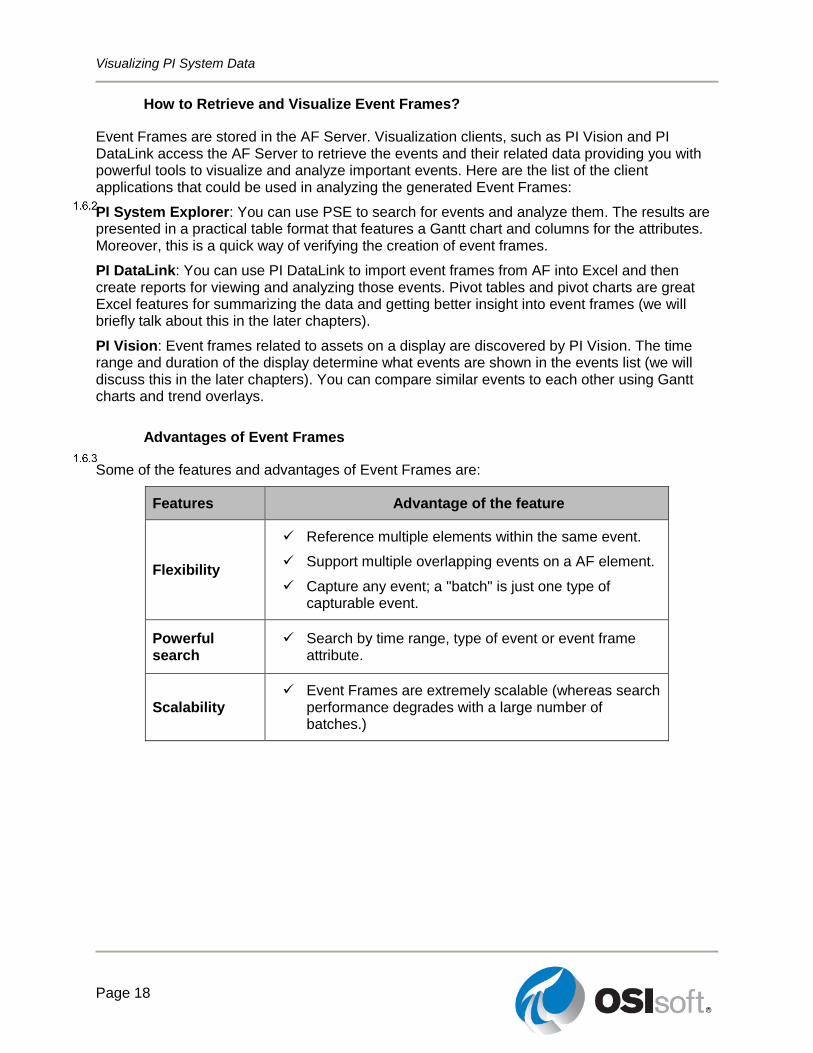
How to Retrieve and Visualize Event Frames?
Event Frames are stored in the AF Server. Visualization clients, such as PI Vision and PI DataLink access the AF Server to retrieve the events and their related data providing you with powerful tools to visualize and analyze important events. Here are the list of the client applications that could be used in analyzing the generated Event Frames:
PI System Explorer: You can use PSE to search for events and analyze them. The results are presented in a practical table format that features a Gantt chart and columns for the attributes. Moreover, this is a quick way of verifying the creation of event frames.
PI DataLink: You can use PI DataLink to import event frames from AF into Excel and then create reports for viewing and analyzing those events. Pivot tables and pivot charts are great Excel features for summarizing the data and getting better insight into event frames (we will briefly talk about this in the later chapters).
PI Vision: Event frames related to assets on a display are discovered by PI Vision. The time range and duration of the display determine what events are shown in the events list (we will discuss this in the later chapters). You can compare similar events to each other using Gantt charts and trend overlays.
Advantages of Event Frames
Some of the features and advantages of Event Frames are:
Features Advantage of the feature
Flexibility
Reference multiple elements within the same event.
Support multiple overlapping events on a AF element.
Capture any event; a "batch" is just one type of capturable event.
Powerful search
Search by time range, type of event or event frame attribute.
Scalability Event Frames are extremely scalable (whereas search
performance degrades with a large number of batches.)
Visualizing PI System Data
Page 19
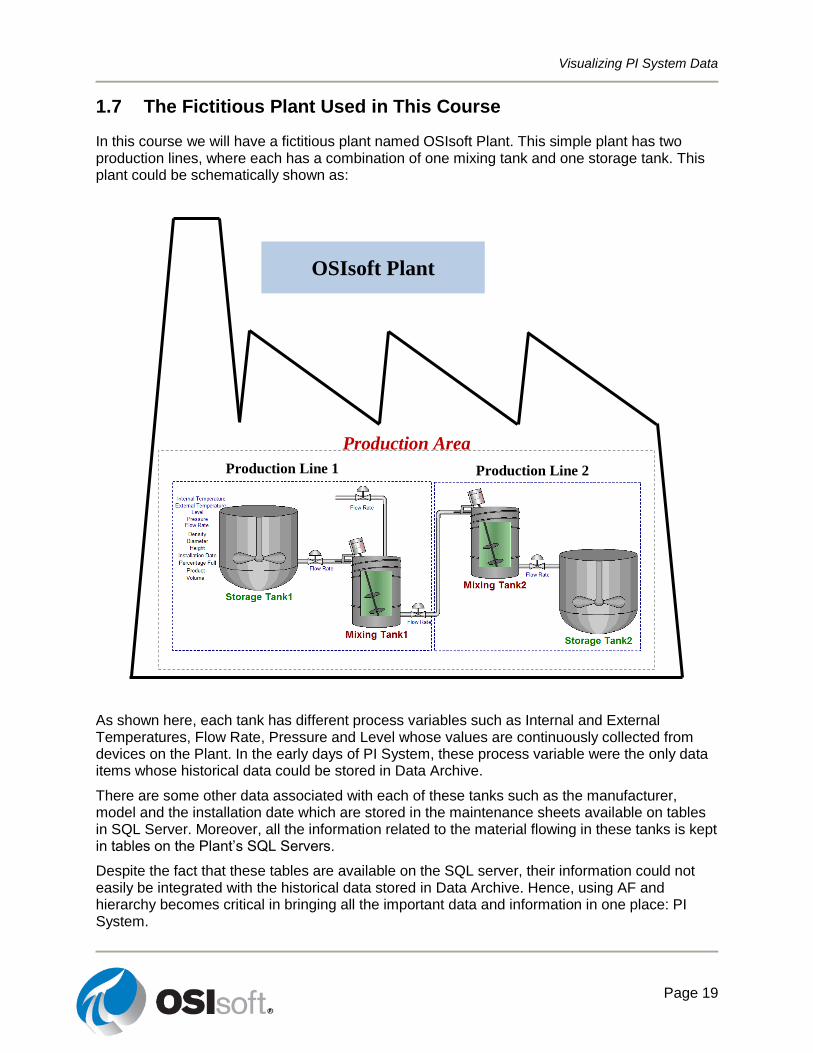
1.7 The Fictitious Plant Used in This Course
In this course we will have a fictitious plant named OSIsoft Plant. This simple plant has two production lines, where each has a combination of one mixing tank and one storage tank. This plant could be schematically shown as:
As shown here, each tank has different process variables such as Internal and External Temperatures, Flow Rate, Pressure and Level whose values are continuously collected from devices on the Plant. In the early days of PI System, these process variable were the only data items whose historical data could be stored in Data Archive.
There are some other data associated with each of these tanks such as the manufacturer, model and the installation date which are stored in the maintenance sheets available on tables in SQL Server. Moreover, all the information related to the material flowing in these tanks is kept in tables on the Plant’s SQL Servers.
Despite the fact that these tables are available on the SQL server, their information could not easily be integrated with the historical data stored in Data Archive. Hence, using AF and hierarchy becomes critical in bringing all the important data and information in one place: PI System.
Production Line 1 Production Line 2
Production Area
OSIsoft Plant
Visualizing PI System Data
Page 20
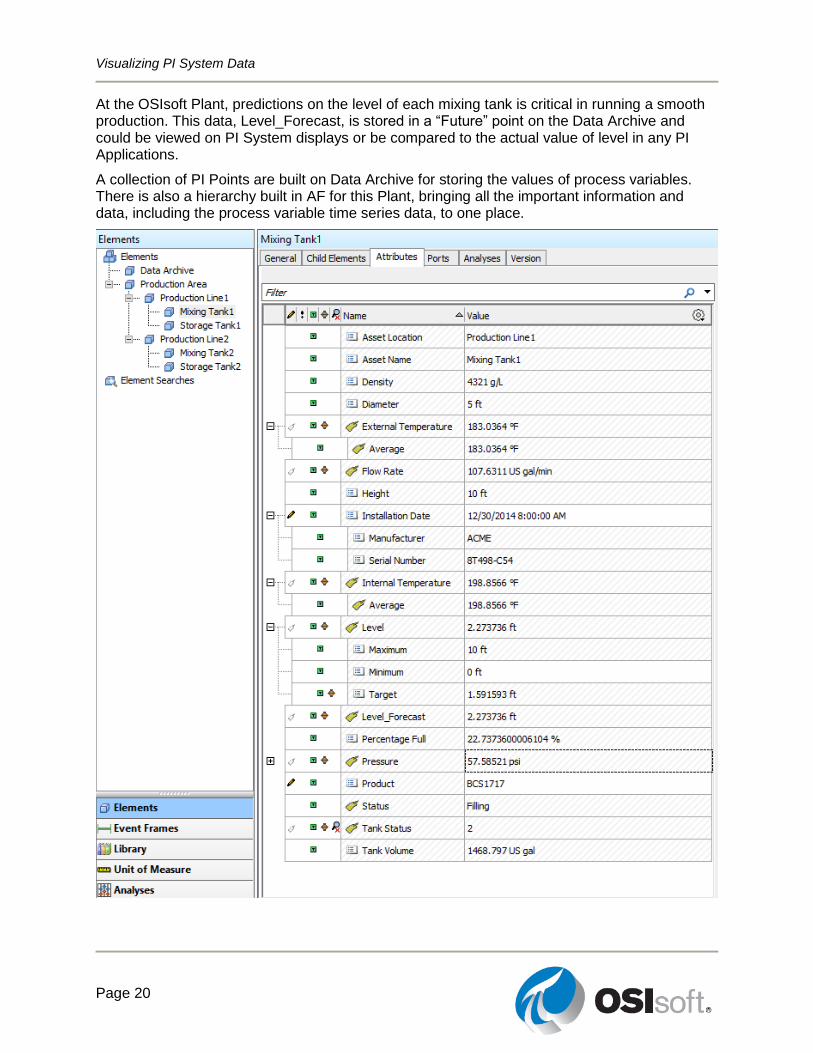
At the OSIsoft Plant, predictions on the level of each mixing tank is critical in running a smooth production. This data, Level_Forecast, is stored in a “Future” point on the Data Archive and could be viewed on PI System displays or be compared to the actual value of level in any PI Applications.
A collection of PI Points are built on Data Archive for storing the values of process variables. There is also a hierarchy built in AF for this Plant, bringing all the important information and data, including the process variable time series data, to one place.
Visualizing PI System Data
Page 21
PI Time
You can use a special syntax, called PI time, to specify inputs for timestamps and time intervals in PI client applications, for example PI Vision. PI time uses specific abbreviations and rules in building valid time expressions.
2.1 PI Time Expressions
There are two categories of time specification within the PI system:
Fixed Time: An expression that signifies a specific date and time, which will never change.
When to use it: When you want to save a view of your PI System data for a specific time in history.
Example: A user is creating a report that analyzes an equipment failure event which occurred on the 5th of January.
Reference Time: An expression that signifies a date and time relative to the current date and time.
When to use it: When you want to create a dynamic view of your data, which can be used to view data in real-time, or re-used on a periodic basis to create periodic reports.
Example: A user is creating a report that summarizes the weekly production totals. By using relative time expressions, the user will be able to re-use this report every week.
Both Fixed Time and Reference Time can be used with Time Offsets. Time Offsets can also be used alone.
Fixed Time Syntax
A fixed time expression is an expression which includes a date, and optionally a time. If the time is omitted, midnight is assumed.
Expression Meaning
23-aug-12 15:00:00 3:00 p.m. on August 23, 2012
25-sep-12 00:00:00 (midnight) on September 25, 2012
The PI System can interpret many different formats for fixed time. In the event of an ambiguous input, the Windows Region and Language settings of the computer where the PI Visualization Tool is installed take precedence. For example:
Expression Region and Language Format
Meaning
1/5/2015 English (United States) 00:00:00 (midnight) on January 5th 2015
Visualizing PI System Data
Page 22
Expression Region and Language Format
Meaning
1/5/2015 English (Canada) 00:00:00 (midnight) on May 1st 2015
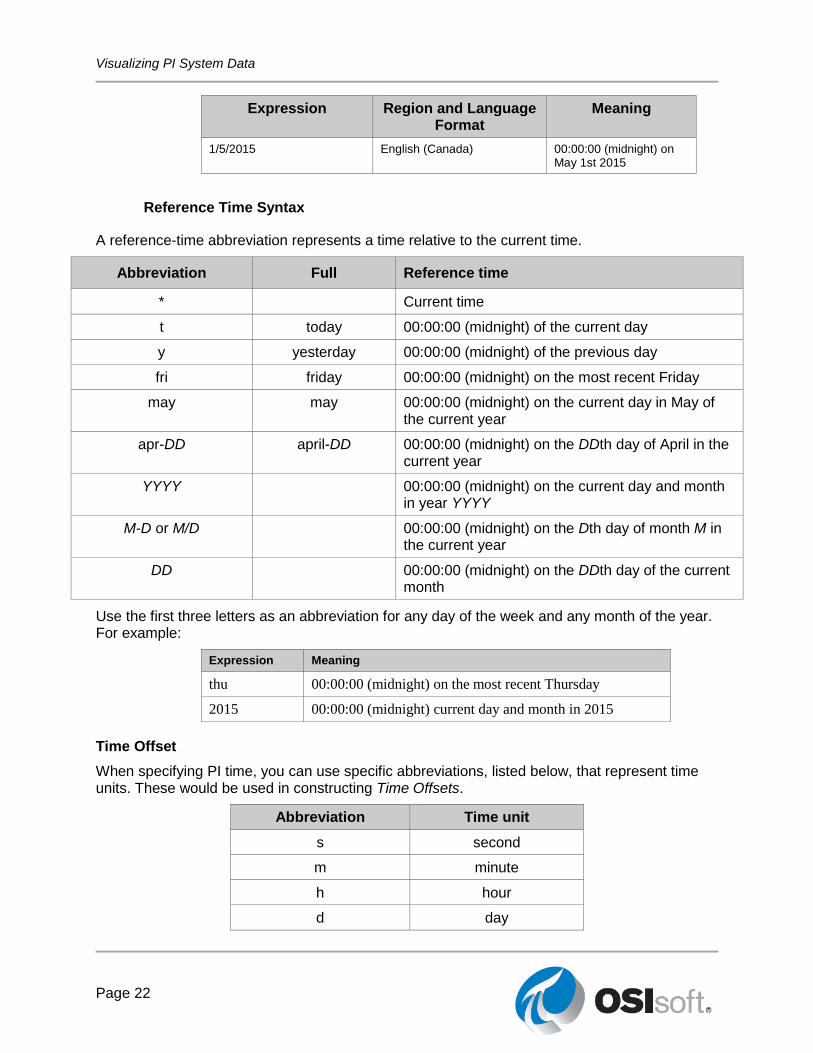
Reference Time Syntax
A reference-time abbreviation represents a time relative to the current time.
Abbreviation Full Reference time
* Current time
t today 00:00:00 (midnight) of the current day
y yesterday 00:00:00 (midnight) of the previous day
fri friday 00:00:00 (midnight) on the most recent Friday
may may 00:00:00 (midnight) on the current day in May of the current year
apr-DD april-DD 00:00:00 (midnight) on the DDth day of April in the current year
YYYY 00:00:00 (midnight) on the current day and month in year YYYY
M-D or M/D 00:00:00 (midnight) on the Dth day of month M in the current year
DD 00:00:00 (midnight) on the DDth day of the current month
Use the first three letters as an abbreviation for any day of the week and any month of the year. For example:
Expression Meaning
thu 00:00:00 (midnight) on the most recent Thursday
2015 00:00:00 (midnight) current day and month in 2015
Time Offset
When specifying PI time, you can use specific abbreviations, listed below, that represent time units. These would be used in constructing Time Offsets.
Abbreviation Time unit
s second
m minute
h hour
d day
Visualizing PI System Data
Page 23
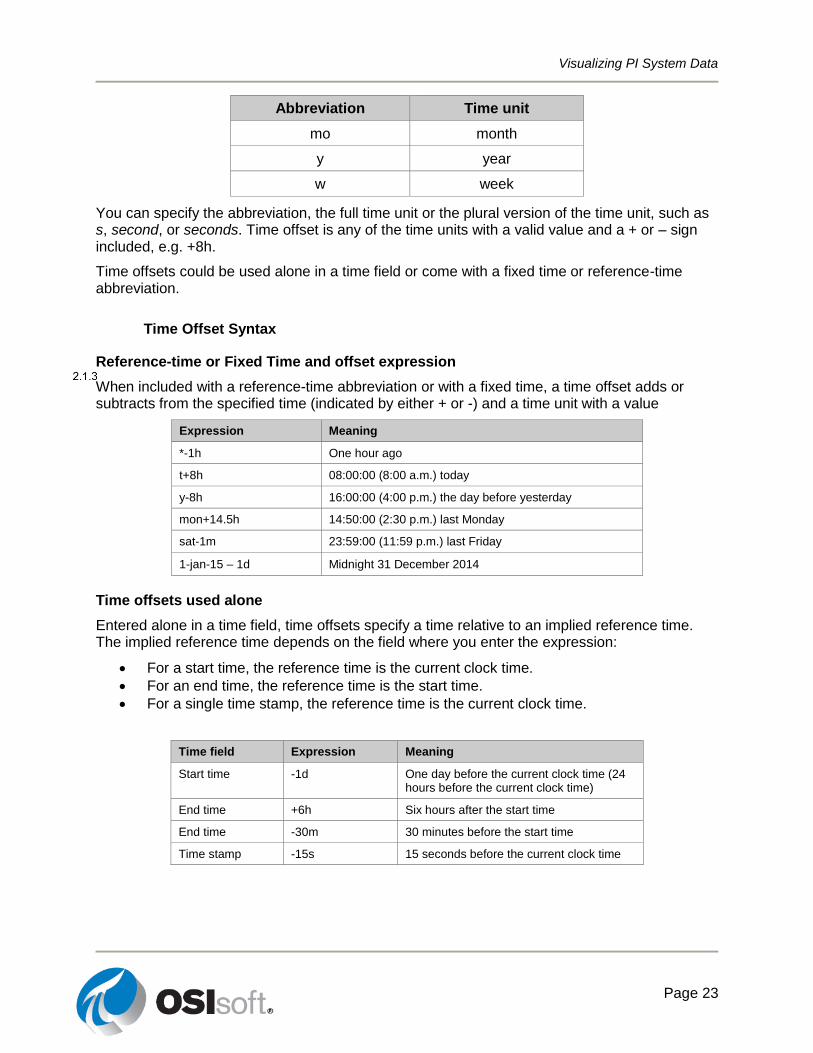
Abbreviation Time unit
mo month
y year
w week
You can specify the abbreviation, the full time unit or the plural version of the time unit, such as s, second, or seconds. Time offset is any of the time units with a valid value and a + or – sign included, e.g. +8h.
Time offsets could be used alone in a time field or come with a fixed time or reference-time abbreviation.
Time Offset Syntax
Reference-time or Fixed Time and offset expression
When included with a reference-time abbreviation or with a fixed time, a time offset adds or subtracts from the specified time (indicated by either + or -) and a time unit with a value
Expression Meaning
*-1h One hour ago
t+8h 08:00:00 (8:00 a.m.) today
y-8h 16:00:00 (4:00 p.m.) the day before yesterday
mon+14.5h 14:50:00 (2:30 p.m.) last Monday
sat-1m 23:59:00 (11:59 p.m.) last Friday
1-jan-15 – 1d Midnight 31 December 2014
Time offsets used alone
Entered alone in a time field, time offsets specify a time relative to an implied reference time. The implied reference time depends on the field where you enter the expression:
For a start time, the reference time is the current clock time.
For an end time, the reference time is the start time.
For a single time stamp, the reference time is the current clock time.
Time field Expression Meaning
Start time -1d One day before the current clock time (24 hours before the current clock time)
End time +6h Six hours after the start time
End time -30m 30 minutes before the start time
Time stamp -15s 15 seconds before the current clock time
Visualizing PI System Data
Page 24
2.2 Some Rules to Remember
Rule 1: You can only include a single time offset in an expression. Including multiple offsets can lead to unpredictable results. For example, the following time expressions are not valid:
*+1d+4h
t-1d+12h
Rule 2: To define a time offset you must include a valid value with any time unit. Only for
seconds, minutes or hours, you can specify a fractional value. You cannot specify
fractional values for other time units.
Rule 3: A fixed timestamp consists of the fields of Year, Month, Day and Time (hours,
minutes and seconds). If any of these fields are not specified in the PI time expression,
the following values will be assumed by default:
If Time is not specified, then the default value would be Midnight.
If Day is not specified, then the default value would be Current Day.
If Month is not specified, then the default value would be Current Month.
If Year is not specified, then the default value would be Current Year.
Visualizing PI System Data
Page 25
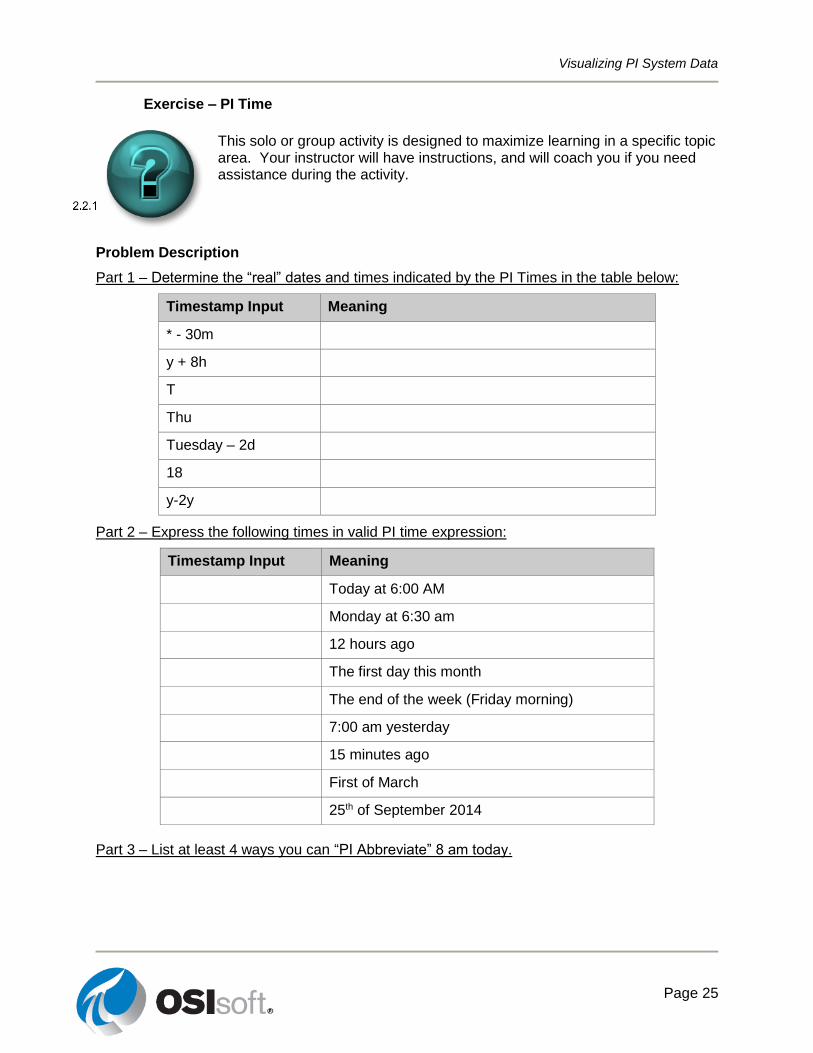
Exercise – PI Time
This solo or group activity is designed to maximize learning in a specific topic area. Your instructor will have instructions, and will coach you if you need assistance during the activity.
Problem Description
Part 1 – Determine the “real” dates and times indicated by the PI Times in the table below:
Timestamp Input Meaning
* - 30m
y + 8h
T
Thu
Tuesday – 2d
18
y-2y
Part 2 – Express the following times in valid PI time expression:
Timestamp Input Meaning
Today at 6:00 AM
Monday at 6:30 am
12 hours ago
The first day this month
The end of the week (Friday morning)
7:00 am yesterday
15 minutes ago
First of March
25th of September 2014
Part 3 – List at least 4 ways you can “PI Abbreviate” 8 am today.
Visualizing PI System Data
Page 26
2.3 Future Data
Future data is data associated with a future time stamp. Data Archive 2015 allows storage and
retrieval of data with time stamps beyond current time, allowing you to store data within a time
range of January, 1970 through January, 2038. With Data Archive 2015 you can capture and
analyze data with future time stamps, and use PI visualization tools to graphically create
possible forecasts or predictions for your business.
Just as with historical data, to specify inputs for timestamps, you can enter time expressions
previous discussed fixed time, reference times, and reference-time abbreviations or fixed times
with a time offset. The difference being the timestamp will be in the future. Some example
expressions are:
Input Meaning
*+1h An hour from now
t+3d Three days from today at
midnight
Y+1y A year from yesterday
2.4 How does PI Adjust for time zones and DST?
The short answer is, it doesn’t!
When Data Archive collects data it converts the time to UTC (Universal Coordinated Time), or
what used to be called Greenwich Mean Time (GMT). This means that each day has exactly 24
hours. The local machine clock of the user looking at the data makes any adjustments for time,
such as time zone or Daylight Saving Time (DST).
So once a year the day will look like it has 23 hours and another 25, but the Data Archive never
knows anything other than 24-hour days.
Also, because the clients and Data Archive know what time zone they are in, the data can be
viewed in either Server Time or Client Time. This is determined by a setting in the client tool.
Visualizing PI System Data
Page 27
Building a Display Using PI Vision
PI Vision is a web browser-based application that enables you to easily retrieve, monitor, and
analyze process engineering information. PI Vision allows you to:
Search for and visualize time-series or other PI System data.
Save displays for easy retrieval and further analysis.
Reuse displays for multiple assets.
View PI ProcessBook displays.
Share displays with other members of a group or anyone with access to PI Vision.
PI Vision is supported by most modern browsers on a wide variety of computers, including
tablets and phones running iOS or Android operating systems.
3.1 PI Vision: New Name
OSIsoft is embarking on creating a unified visualization infrastructure to support customer needs for the enterprise and their wider community ecosystem. The new name better captures the direction of our visualization strategy. PI Vision represents the start of a new path and the next phase of OSIsoft visualization to deliver a unified, powerful, extensible experience.
3.2 PI Vision Displays
Objectives
Create a new display.
Explain the search mechanism and the data items included in the search.
List the dynamic and static symbols available.
Create and configure symbols.
Configure multi-state symbols.
Explain how to change the time range of a display.
Explain the options in the Design Mode toolbar.
Introduce visualization and comparison of Event Frames using PI Vision.
To start using PI Vision, navigate to the PI Vision application server set up by your administrator. By default installation, the address is: https://webServer/PIVision where webServer is the name of the PI Vision web server.
Drill Down Through the Assets in Your Plant
From the PI Vision homepage, you want to be able to quickly and easily get insight into your
operational data stored in your PI System. Once at the homepage of PI Vision, you are able to
view the thumbnail of All Displays that you can access; this includes the displays that you
created as well as the ones that your colleagues created and shared with the rest of the users
Visualizing PI System Data
Page 28
within your organization. In a later chapter, we will learn how to navigate through the homepage.
In this section, our focus is on working with the native PI Vision displays; these are the
traditional PI Vision displays that use HTML5.
Note: Displays built using PI Coresight 2015 and earlier will automatically be converted to the new format following the upgrade to PI Vision
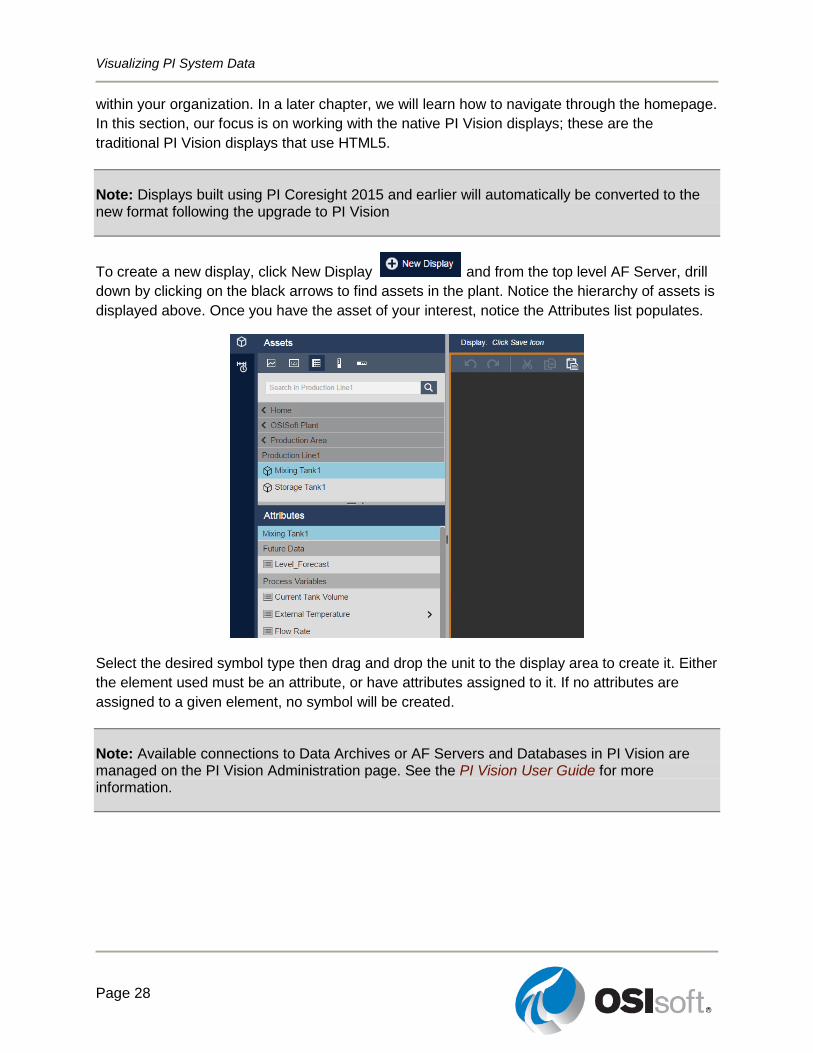
To create a new display, click New Display and from the top level AF Server, drill
down by clicking on the black arrows to find assets in the plant. Notice the hierarchy of assets is
displayed above. Once you have the asset of your interest, notice the Attributes list populates.
Select the desired symbol type then drag and drop the unit to the display area to create it. Either
the element used must be an attribute, or have attributes assigned to it. If no attributes are
assigned to a given element, no symbol will be created.
Note: Available connections to Data Archives or AF Servers and Databases in PI Vision are managed on the PI Vision Administration page. See the PI Vision User Guide for more information.
Visualizing PI System Data
Page 29
Directed Activity – Get to Know PI System Data Through PI Vision
You are invited to watch what the instructor is doing or perform the same steps at the same time to explore the different concepts presented in this chapter or section.
Objectives
Create components of a PI Vision display
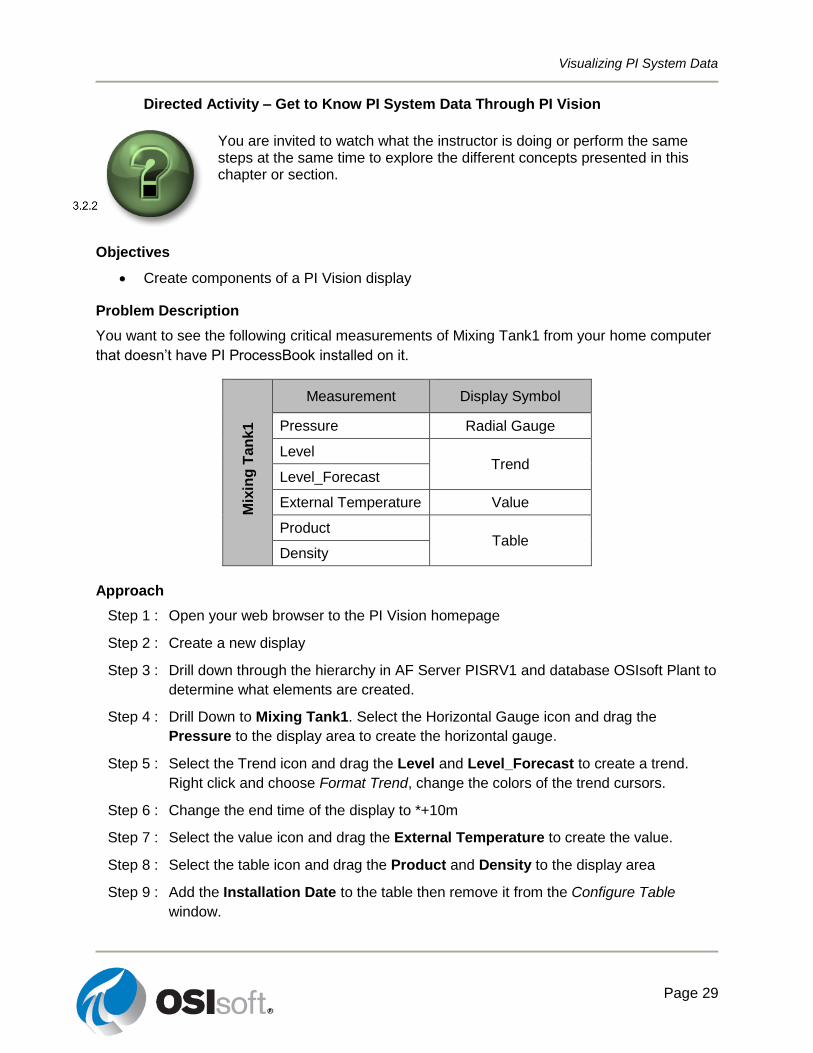
Problem Description
You want to see the following critical measurements of Mixing Tank1 from your home computer
that doesn’t have PI ProcessBook installed on it.
Mix
ing
Tan
k1
Measurement Display Symbol
Pressure Radial Gauge
Level Trend
Level_Forecast
External Temperature Value
Product Table
Density
Approach
Step 1 : Open your web browser to the PI Vision homepage
Step 2 : Create a new display
Step 3 : Drill down through the hierarchy in AF Server PISRV1 and database OSIsoft Plant to
determine what elements are created.
Step 4 : Drill Down to Mixing Tank1. Select the Horizontal Gauge icon and drag the
Pressure to the display area to create the horizontal gauge.
Step 5 : Select the Trend icon and drag the Level and Level_Forecast to create a trend.
Right click and choose Format Trend, change the colors of the trend cursors.
Step 6 : Change the end time of the display to *+10m
Step 7 : Select the value icon and drag the External Temperature to create the value.
Step 8 : Select the table icon and drag the Product and Density to the display area
Step 9 : Add the Installation Date to the table then remove it from the Configure Table
window.
Visualizing PI System Data
Page 30
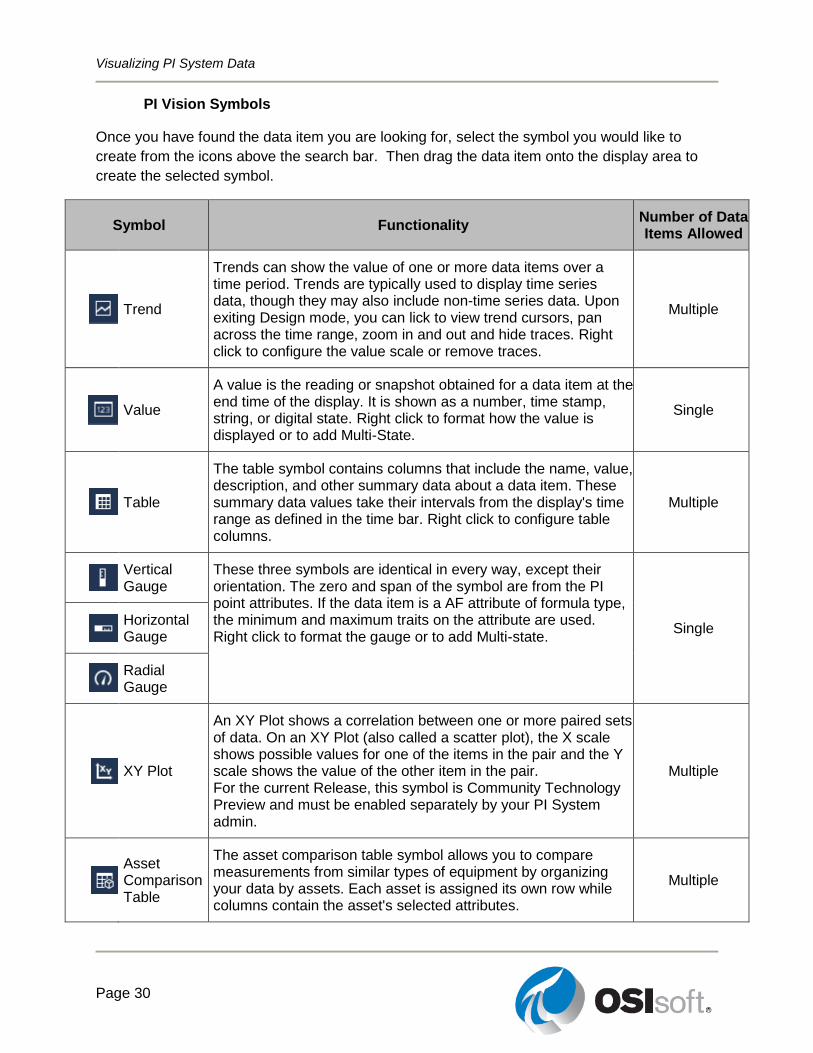
PI Vision Symbols
Once you have found the data item you are looking for, select the symbol you would like to
create from the icons above the search bar. Then drag the data item onto the display area to
create the selected symbol.
Symbol Functionality Number of Data Items Allowed
Trend
Trends can show the value of one or more data items over a time period. Trends are typically used to display time series data, though they may also include non-time series data. Upon exiting Design mode, you can lick to view trend cursors, pan across the time range, zoom in and out and hide traces. Right click to configure the value scale or remove traces.
Multiple
Value
A value is the reading or snapshot obtained for a data item at the end time of the display. It is shown as a number, time stamp, string, or digital state. Right click to format how the value is displayed or to add Multi-State.
Single
Table
The table symbol contains columns that include the name, value, description, and other summary data about a data item. These summary data values take their intervals from the display's time range as defined in the time bar. Right click to configure table columns.
Multiple
Vertical Gauge
These three symbols are identical in every way, except their orientation. The zero and span of the symbol are from the PI point attributes. If the data item is a AF attribute of formula type, the minimum and maximum traits on the attribute are used. Right click to format the gauge or to add Multi-state.
Single
Horizontal Gauge
Radial Gauge
XY Plot
An XY Plot shows a correlation between one or more paired sets of data. On an XY Plot (also called a scatter plot), the X scale shows possible values for one of the items in the pair and the Y scale shows the value of the other item in the pair. For the current Release, this symbol is Community Technology Preview and must be enabled separately by your PI System admin.
Multiple
Asset Comparison Table
The asset comparison table symbol allows you to compare measurements from similar types of equipment by organizing your data by assets. Each asset is assigned its own row while columns contain the asset's selected attributes.
Multiple
Visualizing PI System Data
Page 31
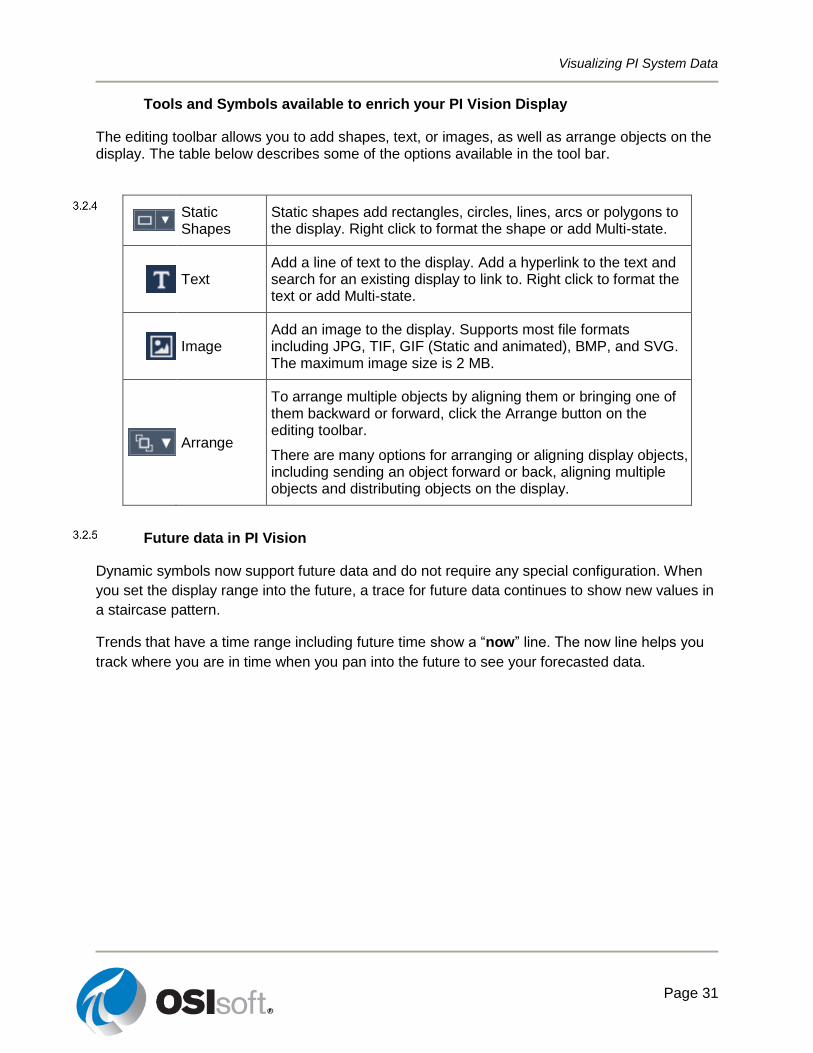
Tools and Symbols available to enrich your PI Vision Display
The editing toolbar allows you to add shapes, text, or images, as well as arrange objects on the display. The table below describes some of the options available in the tool bar.
Static Shapes
Static shapes add rectangles, circles, lines, arcs or polygons to the display. Right click to format the shape or add Multi-state.
Text
Add a line of text to the display. Add a hyperlink to the text and search for an existing display to link to. Right click to format the text or add Multi-state.
Image
Add an image to the display. Supports most file formats including JPG, TIF, GIF (Static and animated), BMP, and SVG. The maximum image size is 2 MB.
Arrange
To arrange multiple objects by aligning them or bringing one of them backward or forward, click the Arrange button on the editing toolbar.
There are many options for arranging or aligning display objects, including sending an object forward or back, aligning multiple objects and distributing objects on the display.
Future data in PI Vision
Dynamic symbols now support future data and do not require any special configuration. When
you set the display range into the future, a trace for future data continues to show new values in
a staircase pattern.
Trends that have a time range including future time show a “now” line. The now line helps you
track where you are in time when you pan into the future to see your forecasted data.
Visualizing PI System Data
Page 32
Exercise – Exploring the Components of PI Vision Display Design
This solo or group activity is designed to maximize learning in a specific topic area. Your instructor will have instructions, and will coach you if you need assistance during the activity.
Objectives
Identify the location of the tools required to build a PI Vision display
Problem Description
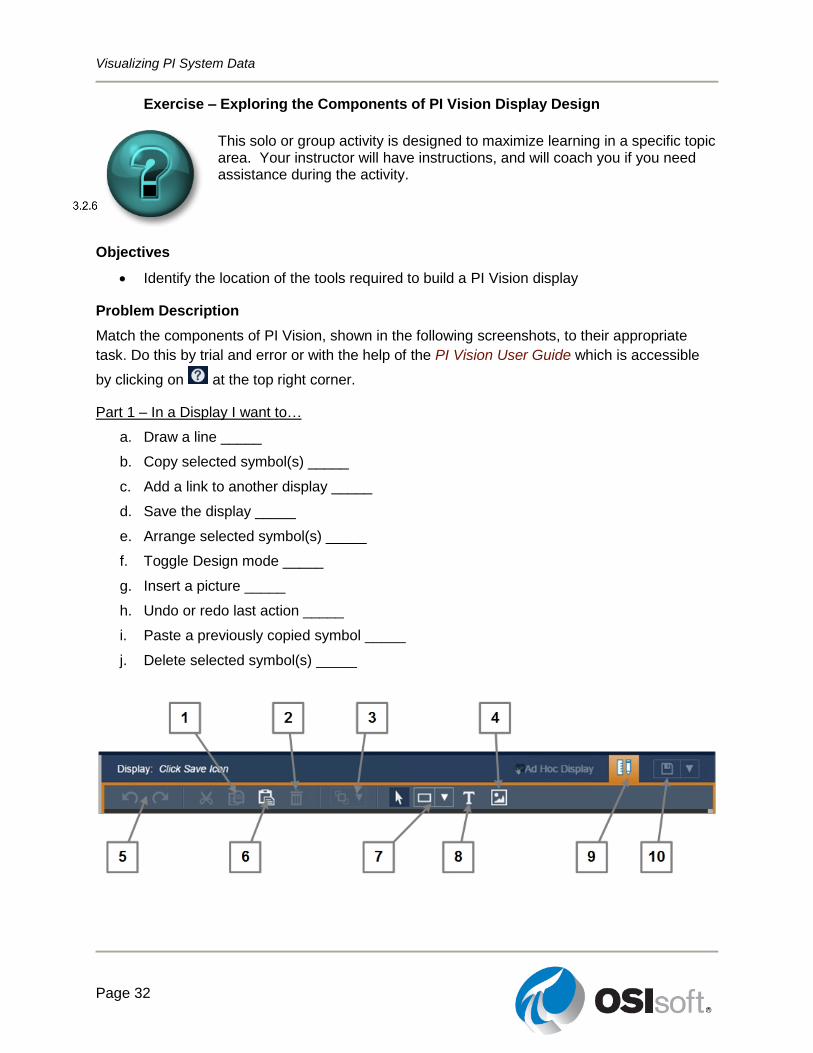
Match the components of PI Vision, shown in the following screenshots, to their appropriate
task. Do this by trial and error or with the help of the PI Vision User Guide which is accessible
by clicking on at the top right corner.
Part 1 – In a Display I want to…
a. Draw a line _____
b. Copy selected symbol(s) _____
c. Add a link to another display _____
d. Save the display _____
e. Arrange selected symbol(s) _____
f. Toggle Design mode _____
g. Insert a picture _____
h. Undo or redo last action _____
i. Paste a previously copied symbol _____
j. Delete selected symbol(s) _____
Visualizing PI System Data
Page 33
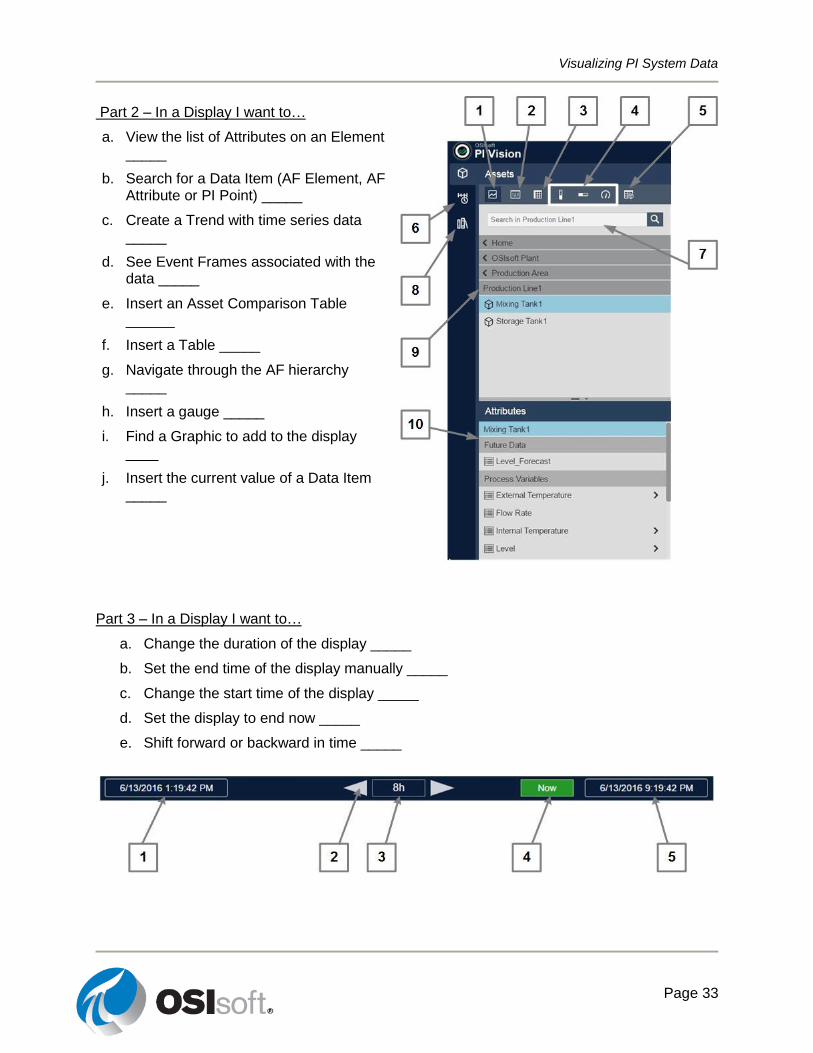
Part 2 – In a Display I want to…
a. View the list of Attributes on an Element _____
b. Search for a Data Item (AF Element, AF Attribute or PI Point) _____
c. Create a Trend with time series data _____
d. See Event Frames associated with the data _____
e. Insert an Asset Comparison Table ______
f. Insert a Table _____
g. Navigate through the AF hierarchy _____
h. Insert a gauge _____
i. Find a Graphic to add to the display ____
j. Insert the current value of a Data Item _____
Part 3 – In a Display I want to…
a. Change the duration of the display _____
b. Set the end time of the display manually _____
c. Change the start time of the display _____
d. Set the display to end now _____
e. Shift forward or backward in time _____
Visualizing PI System Data
Page 34
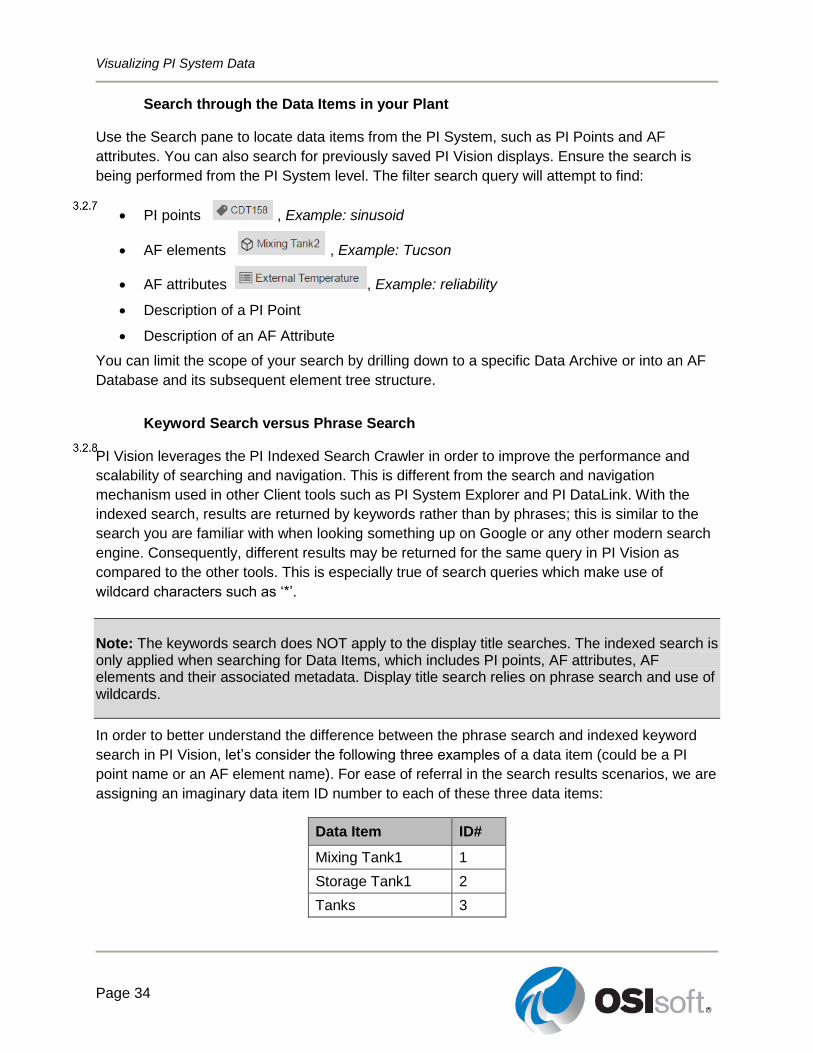
Search through the Data Items in your Plant
Use the Search pane to locate data items from the PI System, such as PI Points and AF
attributes. You can also search for previously saved PI Vision displays. Ensure the search is
being performed from the PI System level. The filter search query will attempt to find:
PI points , Example: sinusoid
AF elements , Example: Tucson
AF attributes , Example: reliability
Description of a PI Point
Description of an AF Attribute
You can limit the scope of your search by drilling down to a specific Data Archive or into an AF
Database and its subsequent element tree structure.
Keyword Search versus Phrase Search
PI Vision leverages the PI Indexed Search Crawler in order to improve the performance and
scalability of searching and navigation. This is different from the search and navigation
mechanism used in other Client tools such as PI System Explorer and PI DataLink. With the
indexed search, results are returned by keywords rather than by phrases; this is similar to the
search you are familiar with when looking something up on Google or any other modern search
engine. Consequently, different results may be returned for the same query in PI Vision as
compared to the other tools. This is especially true of search queries which make use of
wildcard characters such as ‘*’.
Note: The keywords search does NOT apply to the display title searches. The indexed search is only applied when searching for Data Items, which includes PI points, AF attributes, AF elements and their associated metadata. Display title search relies on phrase search and use of wildcards.
In order to better understand the difference between the phrase search and indexed keyword
search in PI Vision, let’s consider the following three examples of a data item (could be a PI
point name or an AF element name). For ease of referral in the search results scenarios, we are
assigning an imaginary data item ID number to each of these three data items:
Data Item ID#
Mixing Tank1 1
Storage Tank1 2
Tanks 3
Visualizing PI System Data
Page 35
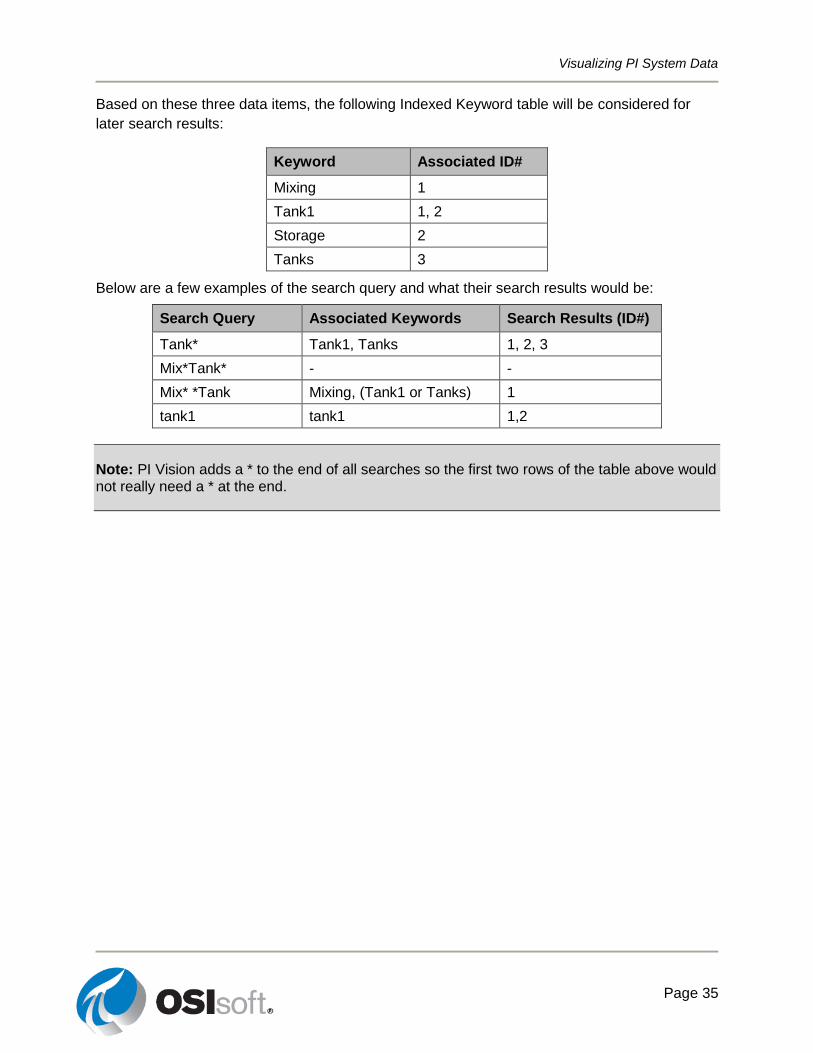
Based on these three data items, the following Indexed Keyword table will be considered for
later search results:
Keyword Associated ID#
Mixing 1
Tank1 1, 2
Storage 2
Tanks 3
Below are a few examples of the search query and what their search results would be:
Search Query Associated Keywords Search Results (ID#)
Tank* Tank1, Tanks 1, 2, 3
Mix*Tank* - -
Mix* *Tank Mixing, (Tank1 or Tanks) 1
tank1 tank1 1,2
Note: PI Vision adds a * to the end of all searches so the first two rows of the table above would not really need a * at the end.
Visualizing PI System Data
Page 36
Directed Activity – Search in PI Vision
You are invited to watch what the instructor is doing or perform the same steps at the same time to explore the different concepts presented in this chapter or section.
Objectives
Search for PI Points and AF Attributes in PI Vision
Problem Description
Building a display in PI Vision starts with finding the data items in PI System. We want to build a display to include the Flow Rates of all tanks. We also want to see what other displays are built for the Mixing Tanks (assuming Mixing Tank1 or Mixing Tank2 is in the title of the display.
Approach
Step 1 : Open PI Vision homepage and create a new display.
Step 2 : Select the AF database named OSIsoft Plant.
Step 3 : Try the following combinations of search queries (for Flow Rate) and see how it
changes the search results
a. Flow
b. F*Rate
c. F* Rate
Step 4 : Try the following combinations of search queries (for Mixing Tank) and see how it
changes the search results
a. Mixing Tank
b. *Mixing tank
c. *mix*tank
Visualizing PI System Data
Page 37
Exercise –Monitoring All Vital Measurements
This solo or group activity is designed to maximize learning in a specific topic area. Your instructor will have instructions, and will coach you if you need assistance during the activity.
Objectives
Search for data item in PI Vision.
Add symbols to display in bulk.
Problem Description
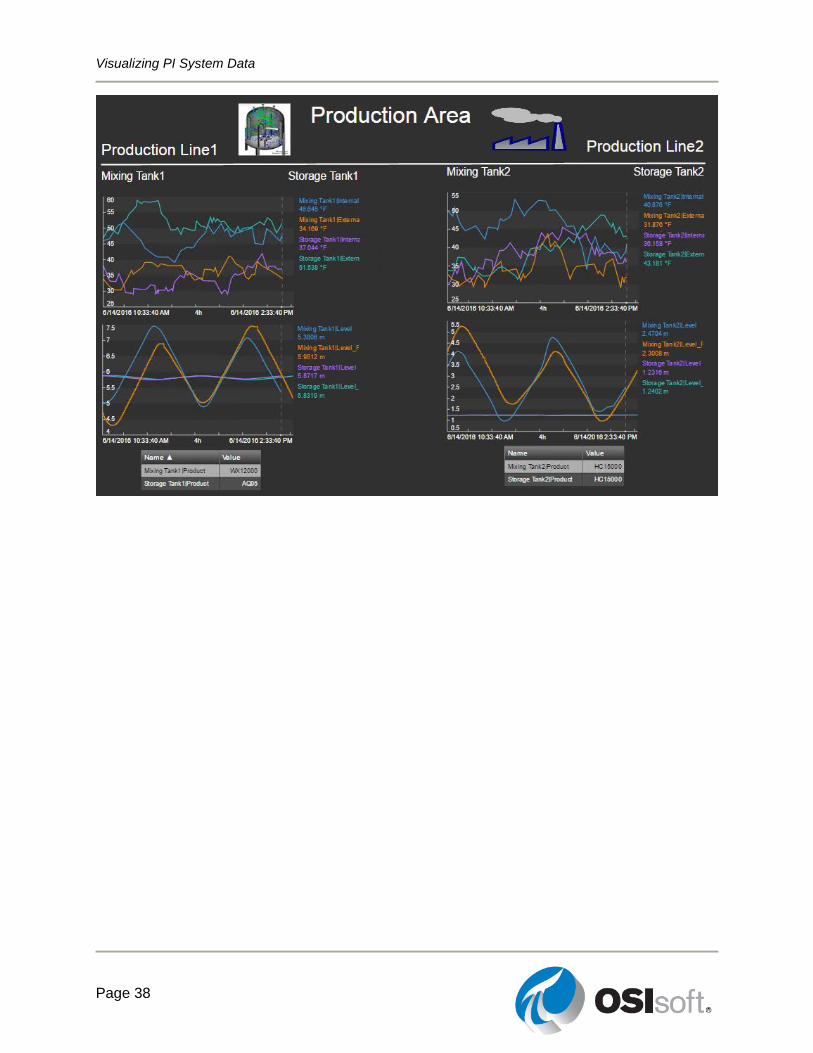
You are interested in building a PI Vision display that shows all the vital measurements of the four tanks of OSIsoft plant in one place, for the past 4 hours until the next 15 minutes.
Approach
Step 1 : Build a PI Vision display including the following symbols for the key measurements
of each of the four tanks:
For both Mixing Tank1
and Storage Tank1
Measurement Display Symbol
Internal and external temperatures
A single Trend
Levels and Level_Forecasts A single Trend
Products Table
Asset Names Values
Production Area
Asset Name Values
Production Lines
Asset Names Values
Step 2 : Repeat the procedure for Production Line2
Step 3 : Add shapes and images to complete the display (perform a quick Google search to
find some images if needed)
Step 4 : Change the start and end time of the display to the desired values mentioned above.
Step 5 : Remember to save your display as <Initials>_Production Area Dashboard
One example of what your Display might look like is below. There are many possible solutions – yours does not have to look exactly like it!
Visualizing PI System Data
Page 38
Visualizing PI System Data
Page 39
3.3 Enhance PI Vision Displays with Advanced Features
Reusing Displays for Multiple Assets
PI Vision automatically finds and shows all assets related to the assets in a display. You can
swap out these related Assets to reuse displays. Related assets are assets that are built on a
common template.
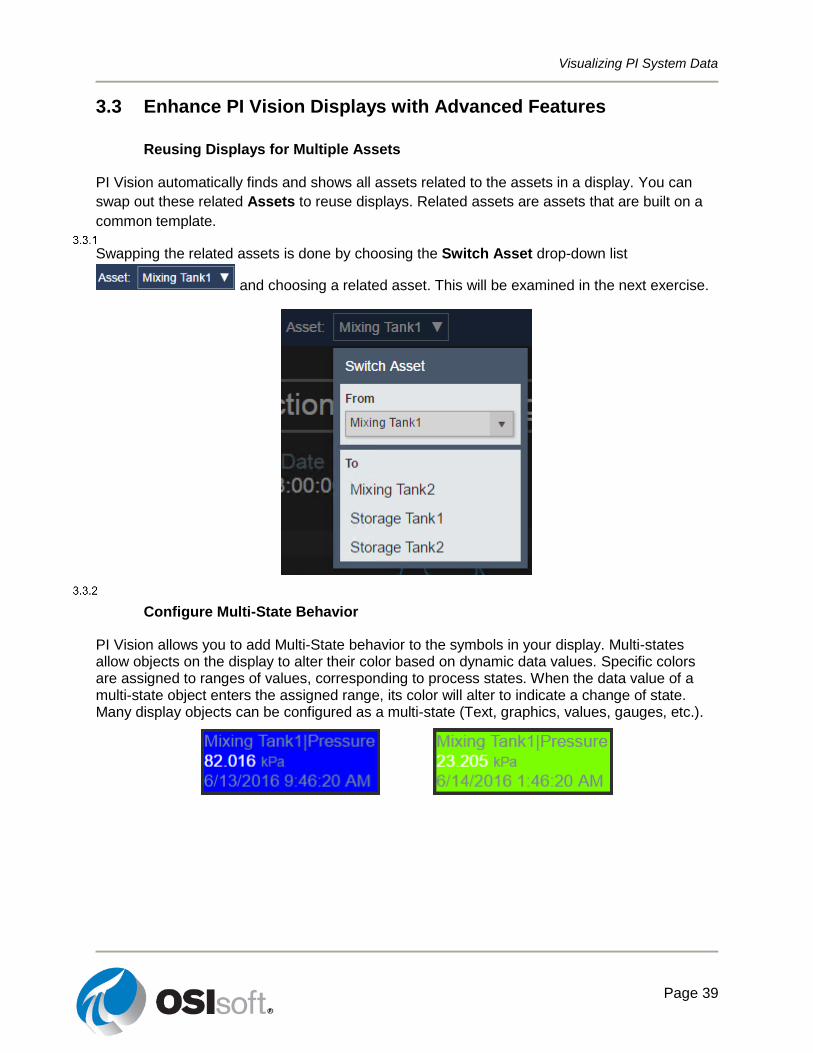
Swapping the related assets is done by choosing the Switch Asset drop-down list
and choosing a related asset. This will be examined in the next exercise.
Configure Multi-State Behavior
PI Vision allows you to add Multi-State behavior to the symbols in your display. Multi-states allow objects on the display to alter their color based on dynamic data values. Specific colors are assigned to ranges of values, corresponding to process states. When the data value of a multi-state object enters the assigned range, its color will alter to indicate a change of state. Many display objects can be configured as a multi-state (Text, graphics, values, gauges, etc.).
Visualizing PI System Data
Page 40
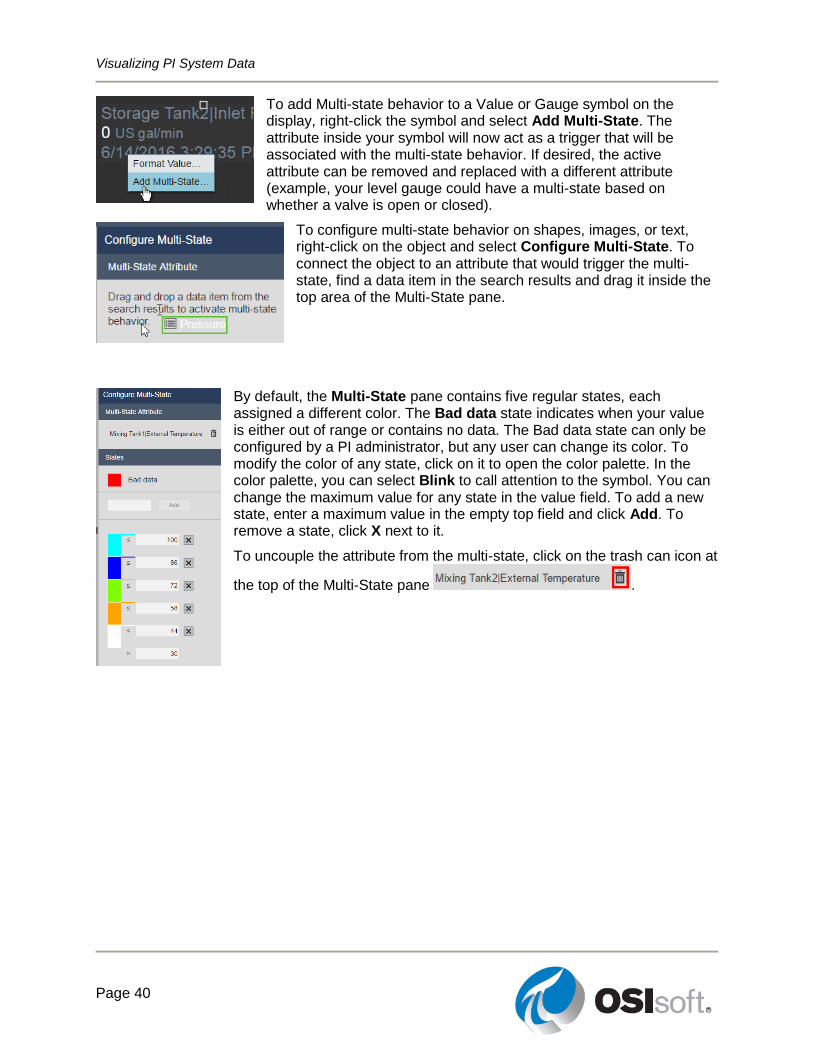
To add Multi-state behavior to a Value or Gauge symbol on the display, right-click the symbol and select Add Multi-State. The attribute inside your symbol will now act as a trigger that will be associated with the multi-state behavior. If desired, the active attribute can be removed and replaced with a different attribute (example, your level gauge could have a multi-state based on whether a valve is open or closed).
To configure multi-state behavior on shapes, images, or text, right-click on the object and select Configure Multi-State. To connect the object to an attribute that would trigger the multi-state, find a data item in the search results and drag it inside the top area of the Multi-State pane.
By default, the Multi-State pane contains five regular states, each assigned a different color. The Bad data state indicates when your value is either out of range or contains no data. The Bad data state can only be configured by a PI administrator, but any user can change its color. To modify the color of any state, click on it to open the color palette. In the color palette, you can select Blink to call attention to the symbol. You can change the maximum value for any state in the value field. To add a new state, enter a maximum value in the empty top field and click Add. To remove a state, click X next to it.
To uncouple the attribute from the multi-state, click on the trash can icon at
the top of the Multi-State pane .
Visualizing PI System Data
Page 41
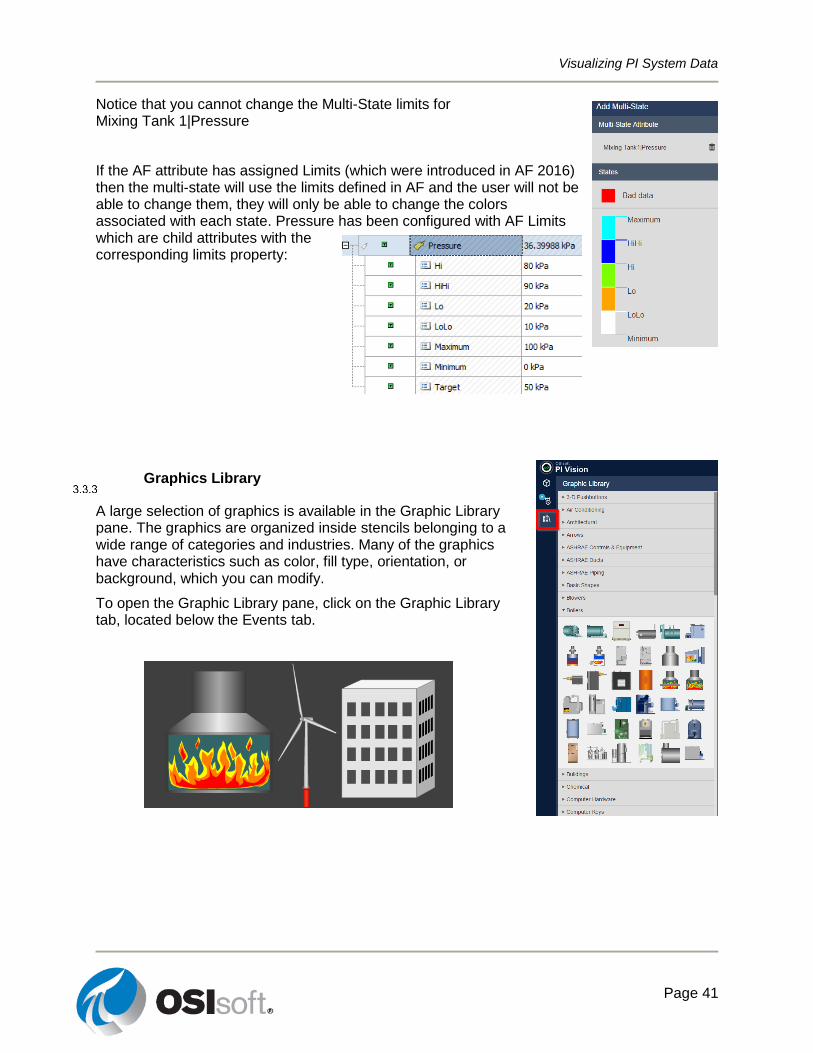
Notice that you cannot change the Multi-State limits for Mixing Tank 1|Pressure
If the AF attribute has assigned Limits (which were introduced in AF 2016) then the multi-state will use the limits defined in AF and the user will not be able to change them, they will only be able to change the colors associated with each state. Pressure has been configured with AF Limits which are child attributes with the corresponding limits property:
Graphics Library
A large selection of graphics is available in the Graphic Library pane. The graphics are organized inside stencils belonging to a wide range of categories and industries. Many of the graphics have characteristics such as color, fill type, orientation, or background, which you can modify.
To open the Graphic Library pane, click on the Graphic Library tab, located below the Events tab.
Visualizing PI System Data
Page 42
Collections
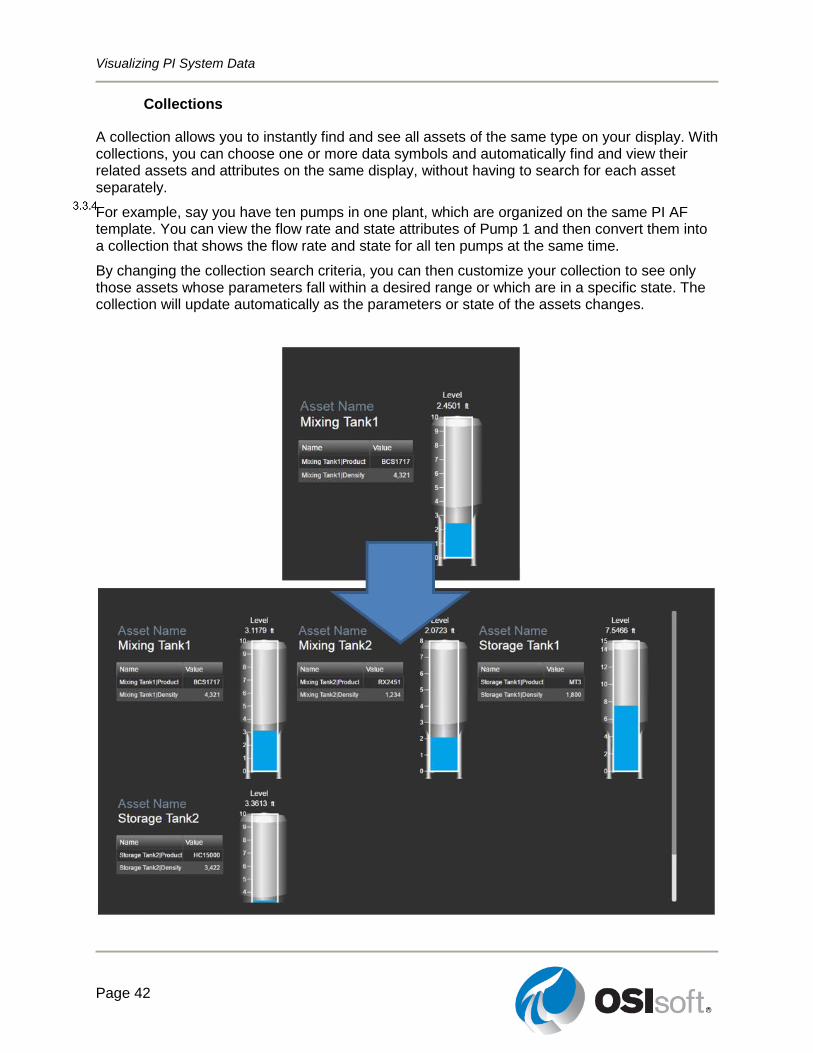
A collection allows you to instantly find and see all assets of the same type on your display. With collections, you can choose one or more data symbols and automatically find and view their related assets and attributes on the same display, without having to search for each asset separately.
For example, say you have ten pumps in one plant, which are organized on the same PI AF template. You can view the flow rate and state attributes of Pump 1 and then convert them into a collection that shows the flow rate and state for all ten pumps at the same time.
By changing the collection search criteria, you can then customize your collection to see only those assets whose parameters fall within a desired range or which are in a specific state. The collection will update automatically as the parameters or state of the assets changes.
Visualizing PI System Data
Page 43
Directed Activity – Graphics, Multi-State Behavior, Collections and Asset Tables in PI Vision
You are invited to watch what the instructor is doing or perform the same steps at the same time to explore the different concepts presented in this chapter or section.
Objectives
Add Graphics to the PI Vision display
Add Multi-State behavior in PI Vision
Create a Collection
Create an Asset Comparison Table
Problem Description
You need to have a dashboard to display key level information regarding all of your tanks.
Approach
Step 1 : Create a New Display
Step 2 : Open the Graphics Library view and find a tank graphic from the tank stencil group.
Select a graphic then drag a rectangle on the display to create the symbol.
Step 3 : Add a Vertical Gauge for the Mixing Tank1 Level overlaid on the tank graphic.
Step 4 : Right-click on the Gauge, choose Add Multi-State…
Step 5 : Navigate in the Assets pane to Mixing Tank1 and find the External Temperature,
drag and drop it onto the Multi-State Attribute pane
Step 6 : Change the state maximum values, Set the top state to blink by opening the color
palette and selecting Blink
Step 7 : Add a Value symbol to the display above the tank graphic and the gauge for the
Name of Mixing Tank1
Step 8 : Select all symbols on the display and Right Click choose Convert to Collection
Visualizing PI System Data
Page 44
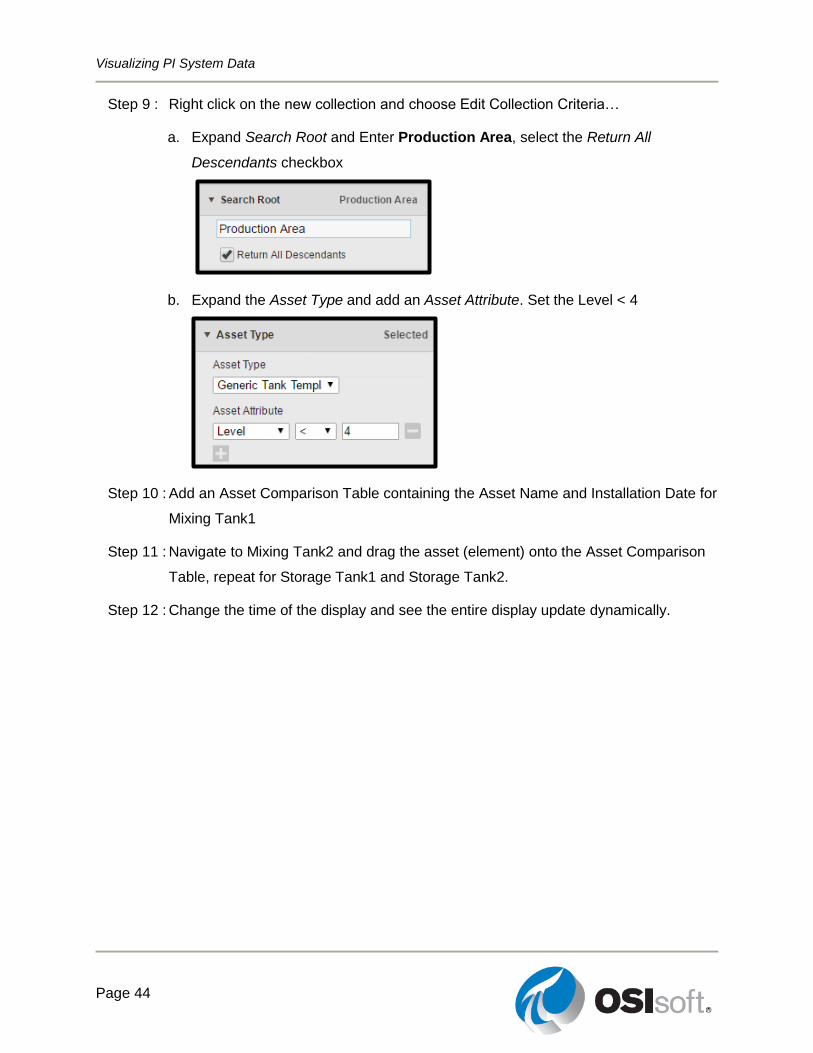
Step 9 : Right click on the new collection and choose Edit Collection Criteria…
a. Expand Search Root and Enter Production Area, select the Return All
Descendants checkbox
b. Expand the Asset Type and add an Asset Attribute. Set the Level < 4
Step 10 : Add an Asset Comparison Table containing the Asset Name and Installation Date for
Mixing Tank1
Step 11 : Navigate to Mixing Tank2 and drag the asset (element) onto the Asset Comparison
Table, repeat for Storage Tank1 and Storage Tank2.
Step 12 : Change the time of the display and see the entire display update dynamically.
Visualizing PI System Data
Page 45
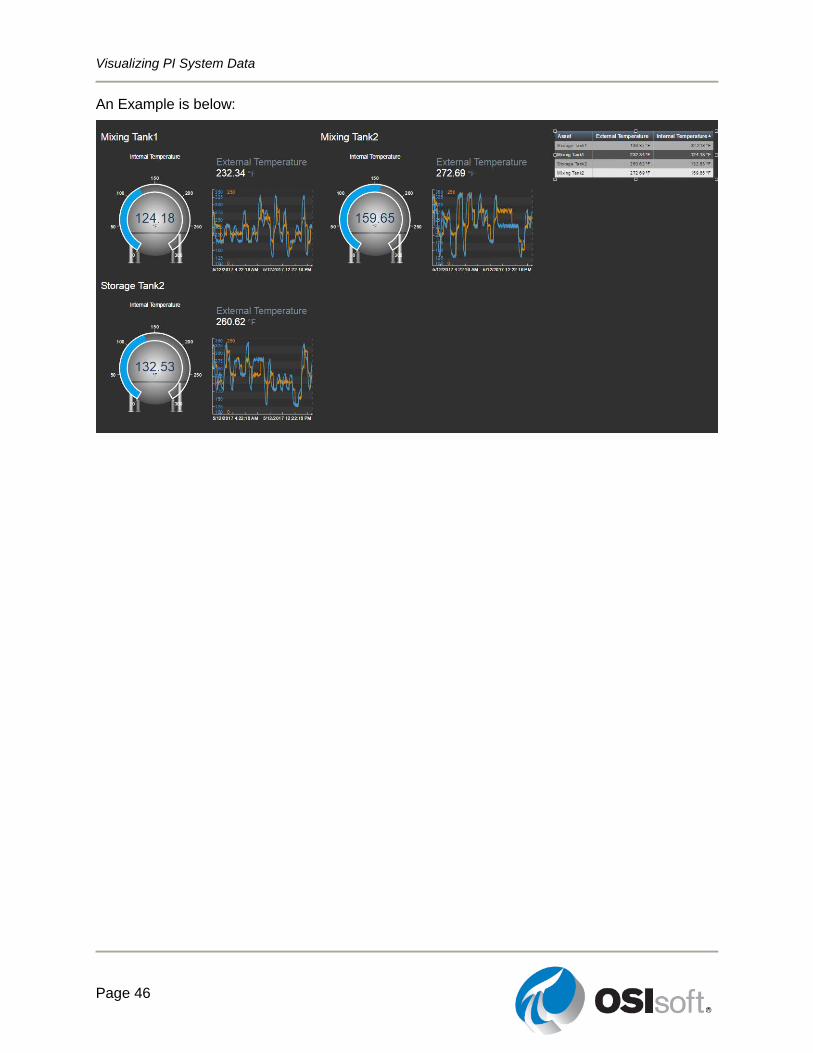
Exercise – Create a Dynamic Dashboard to Monitor Your Tanks
This solo or group activity is designed to maximize learning in a specific topic area. Your instructor will have instructions, and will coach you if you need assistance during the activity.
Objectives
Create a PI Vision dashboard using dynamic symbols.
Create a collection with symbols
Problem Description
You would like to have a dashboard which shows the key pieces of information for our tanks. The operator would like to see only tanks that are overheated at any given time. They also need a summary table that lists the installation dates and asset locations for all of their tanks.
Approach
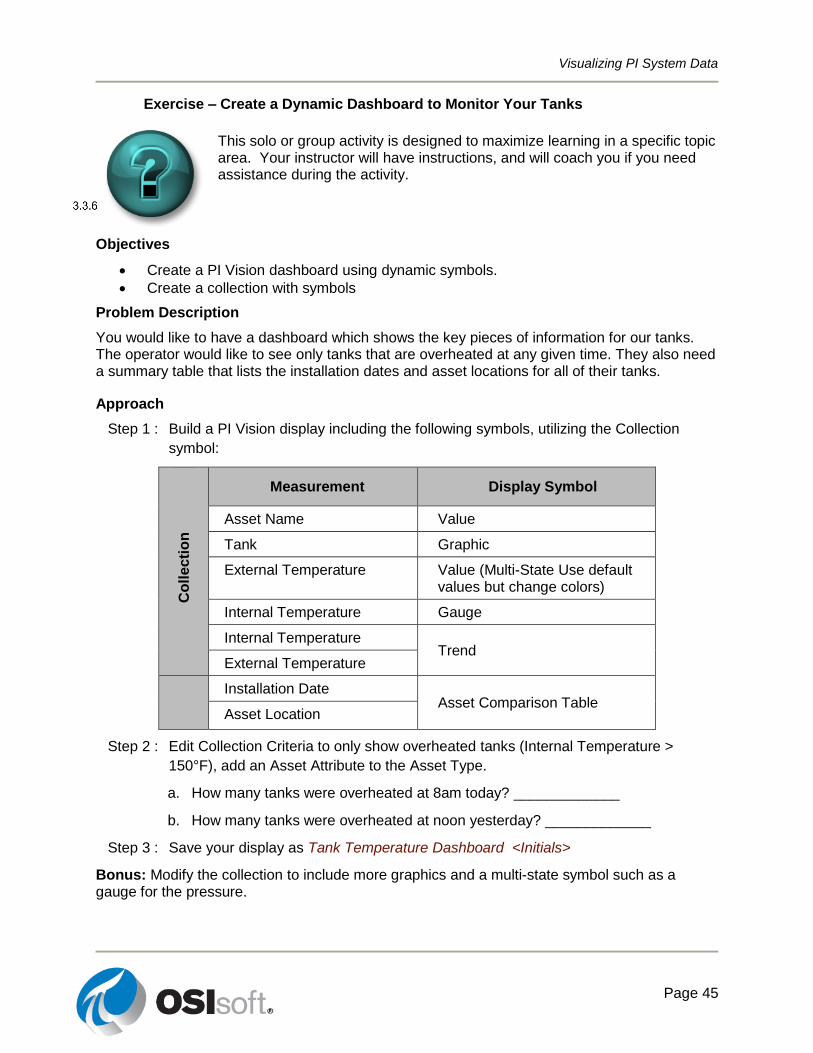
Step 1 : Build a PI Vision display including the following symbols, utilizing the Collection
symbol:
Co
lle
cti
on
Measurement Display Symbol
Asset Name Value
Tank Graphic
External Temperature Value (Multi-State Use default values but change colors)
Internal Temperature Gauge
Internal Temperature Trend
External Temperature
Installation Date Asset Comparison Table
Asset Location
Step 2 : Edit Collection Criteria to only show overheated tanks (Internal Temperature >
150°F), add an Asset Attribute to the Asset Type.
a. How many tanks were overheated at 8am today? _____________
b. How many tanks were overheated at noon yesterday? _____________
Step 3 : Save your display as Tank Temperature Dashboard <Initials>
Bonus: Modify the collection to include more graphics and a multi-state symbol such as a gauge for the pressure.
Visualizing PI System Data
Page 46
An Example is below:
Visualizing PI System Data
Page 47
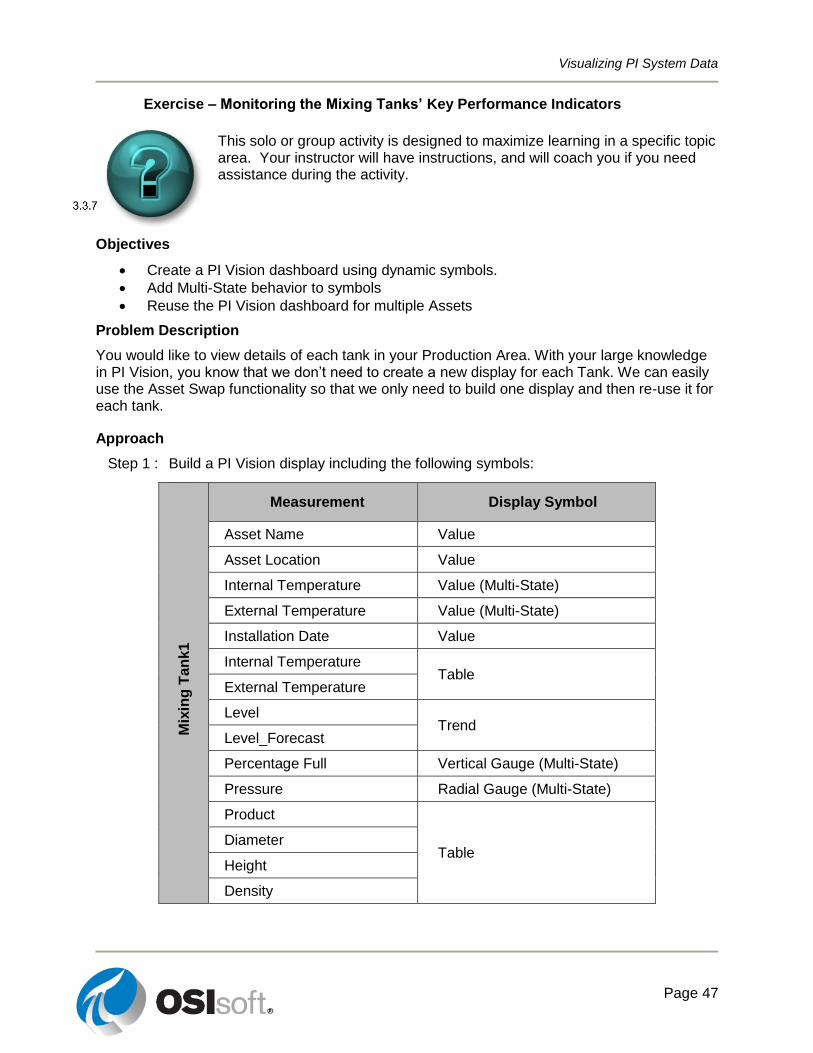
Exercise – Monitoring the Mixing Tanks’ Key Performance Indicators
This solo or group activity is designed to maximize learning in a specific topic area. Your instructor will have instructions, and will coach you if you need assistance during the activity.
Objectives
Create a PI Vision dashboard using dynamic symbols.
Add Multi-State behavior to symbols
Reuse the PI Vision dashboard for multiple Assets
Problem Description
You would like to view details of each tank in your Production Area. With your large knowledge in PI Vision, you know that we don’t need to create a new display for each Tank. We can easily use the Asset Swap functionality so that we only need to build one display and then re-use it for each tank.
Approach
Step 1 : Build a PI Vision display including the following symbols:
Mix
ing
Tan
k1
Measurement Display Symbol
Asset Name Value
Asset Location Value
Internal Temperature Value (Multi-State)
External Temperature Value (Multi-State)
Installation Date Value
Internal Temperature Table
External Temperature
Level Trend
Level_Forecast
Percentage Full Vertical Gauge (Multi-State)
Pressure Radial Gauge (Multi-State)
Product
Table Diameter
Height
Density
Visualizing PI System Data
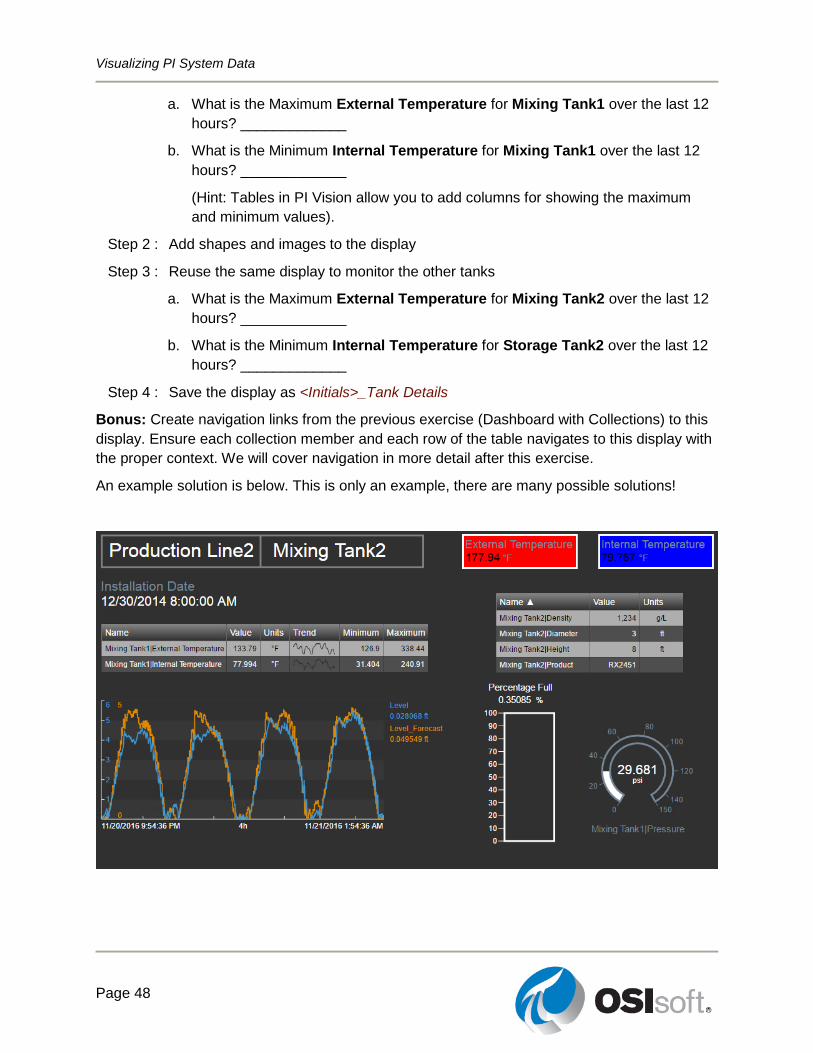
Page 48
a. What is the Maximum External Temperature for Mixing Tank1 over the last 12
hours? _____________
b. What is the Minimum Internal Temperature for Mixing Tank1 over the last 12
hours? _____________
(Hint: Tables in PI Vision allow you to add columns for showing the maximum
and minimum values).
Step 2 : Add shapes and images to the display
Step 3 : Reuse the same display to monitor the other tanks
a. What is the Maximum External Temperature for Mixing Tank2 over the last 12
hours? _____________
b. What is the Minimum Internal Temperature for Storage Tank2 over the last 12
hours? _____________
Step 4 : Save the display as <Initials>_Tank Details
Bonus: Create navigation links from the previous exercise (Dashboard with Collections) to this
display. Ensure each collection member and each row of the table navigates to this display with
the proper context. We will cover navigation in more detail after this exercise.
An example solution is below. This is only an example, there are many possible solutions!
Visualizing PI System Data
Page 49
3.4 PI Vision Additional Features
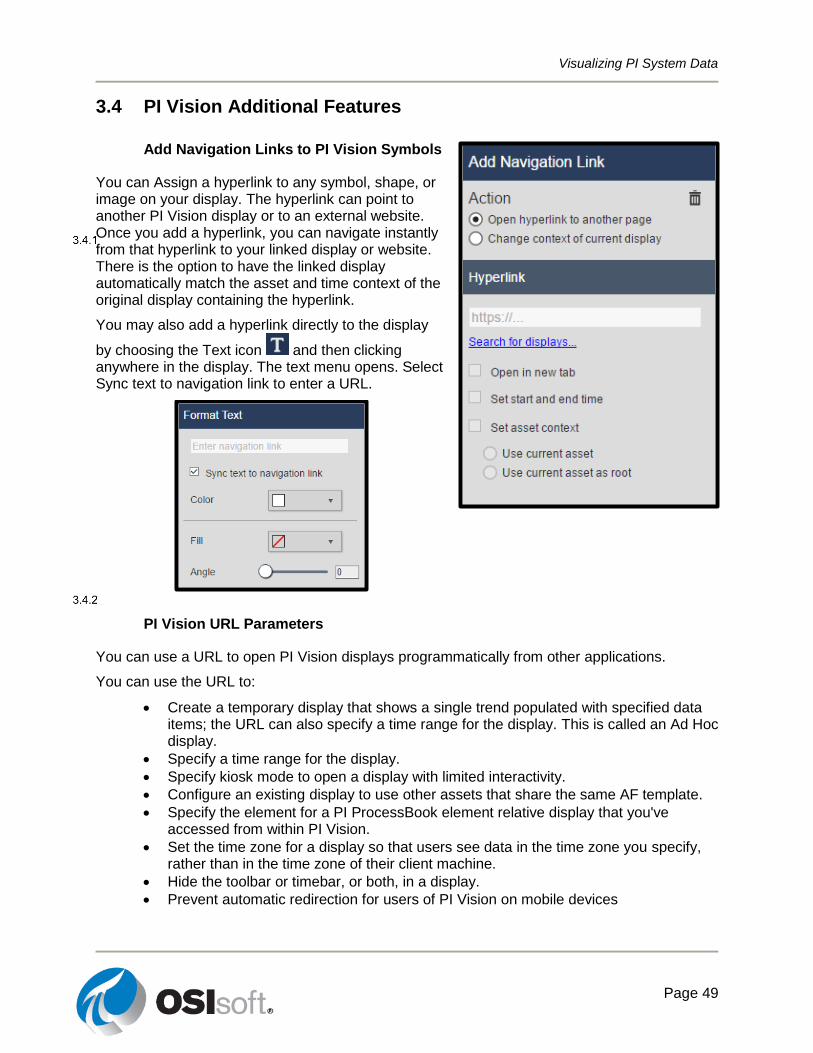
Add Navigation Links to PI Vision Symbols
You can Assign a hyperlink to any symbol, shape, or image on your display. The hyperlink can point to another PI Vision display or to an external website. Once you add a hyperlink, you can navigate instantly from that hyperlink to your linked display or website. There is the option to have the linked display automatically match the asset and time context of the original display containing the hyperlink.
You may also add a hyperlink directly to the display
by choosing the Text icon and then clicking anywhere in the display. The text menu opens. Select Sync text to navigation link to enter a URL.
PI Vision URL Parameters
You can use a URL to open PI Vision displays programmatically from other applications.
You can use the URL to:
Create a temporary display that shows a single trend populated with specified data items; the URL can also specify a time range for the display. This is called an Ad Hoc display.
Specify a time range for the display.
Specify kiosk mode to open a display with limited interactivity.
Configure an existing display to use other assets that share the same AF template.
Specify the element for a PI ProcessBook element relative display that you've accessed from within PI Vision.
Set the time zone for a display so that users see data in the time zone you specify, rather than in the time zone of their client machine.
Hide the toolbar or timebar, or both, in a display.
Prevent automatic redirection for users of PI Vision on mobile devices
Visualizing PI System Data
Page 50
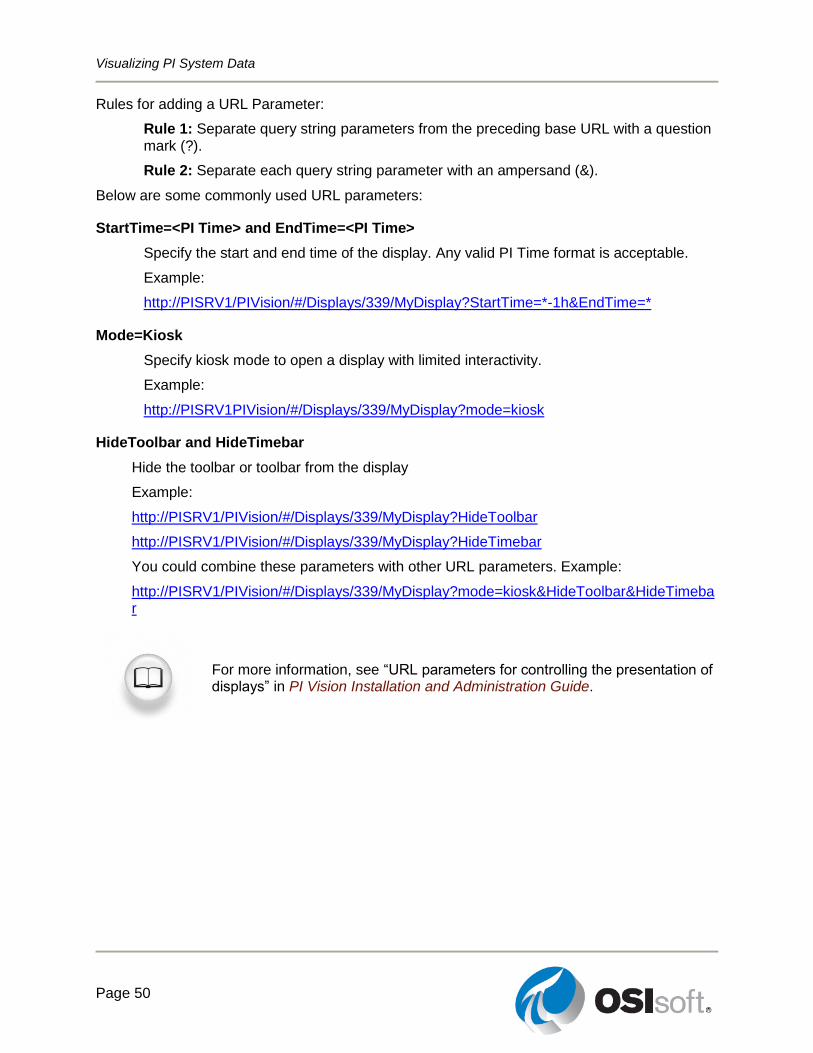
Rules for adding a URL Parameter:
Rule 1: Separate query string parameters from the preceding base URL with a question mark (?).
Rule 2: Separate each query string parameter with an ampersand (&).
Below are some commonly used URL parameters:
StartTime=<PI Time> and EndTime=<PI Time>
Specify the start and end time of the display. Any valid PI Time format is acceptable.
Example:
http://PISRV1/PIVision/#/Displays/339/MyDisplay?StartTime=*-1h&EndTime=*
Mode=Kiosk
Specify kiosk mode to open a display with limited interactivity.
Example:
http://PISRV1PIVision/#/Displays/339/MyDisplay?mode=kiosk
HideToolbar and HideTimebar
Hide the toolbar or toolbar from the display
Example:
http://PISRV1/PIVision/#/Displays/339/MyDisplay?HideToolbar
http://PISRV1/PIVision/#/Displays/339/MyDisplay?HideTimebar
You could combine these parameters with other URL parameters. Example:
http://PISRV1/PIVision/#/Displays/339/MyDisplay?mode=kiosk&HideToolbar&HideTimebar
For more information, see “URL parameters for controlling the presentation of displays” in PI Vision Installation and Administration Guide.
Visualizing PI System Data
Page 51
Directed Activity – Using URL Parameters and Hyperlinks
You are invited to watch what the instructor is doing or perform the same steps at the same time to explore the different concepts presented in this chapter or section
Objectives
Use URL Parameters to create links to PI Vision displays
Problem Description
The operations team reports that there was an issue early this morning from noon yesterday until midnight today with Mixing Tank1. They need to visualize the data during this time period.
Approach
Step 1 : Open your Tank Temperature Dashboard <Initials> display.
Step 2 : Enter Design mode and right-click and choose Modify Collection.
Step 3 : Right click on the Tank Graphic and choose Add Navigation Link…
Step 4 : Leave the Action as Open hyperlink to another page and click the Search for
displays… link. Search for your <Initials>_Tank Details display
Step 5 : Save your display.
Step 6 : Test the link.
Step 7 : Make the display read only by placing it in Kiosk mode. Append &mode=Kiosk to
the end of the URL.
Visualizing PI System Data
Page 52
Exercise – Navigating Between PI Vision Displays
This solo or group activity is designed to maximize learning in a specific topic area. Your instructor will have instructions, and will coach you if you need assistance during the activity.
Objectives
Create a link from your overview dashboard to a more detailed display.
Problem Description
You would like to quickly link from your Production Area Dashboard display to your Tank Dashboard display.
Approach
Step 1 : Add Navigation Links to the Asset Name values on the Production Area Dashboard
to the Tank Details
Step 2 : Save your display then test your links.
Step 3 : Add Text symbols to the Tank Details display that navigate back to the Production
Area Dashboard and the Tank Temperature Dashboard.
Bonus
Step 4 : Create an Asset Comparison Table on the Tank Details page that can change the
context of the current display
Step 5 : Save your display and test each link
Visualizing PI System Data
Page 53
Using a Display to Monitor a Process
4.1 Dashboard Display Visual Indicators
Objectives
Identify invalid symbols using the status report.
Show statistics information added to tooltips.
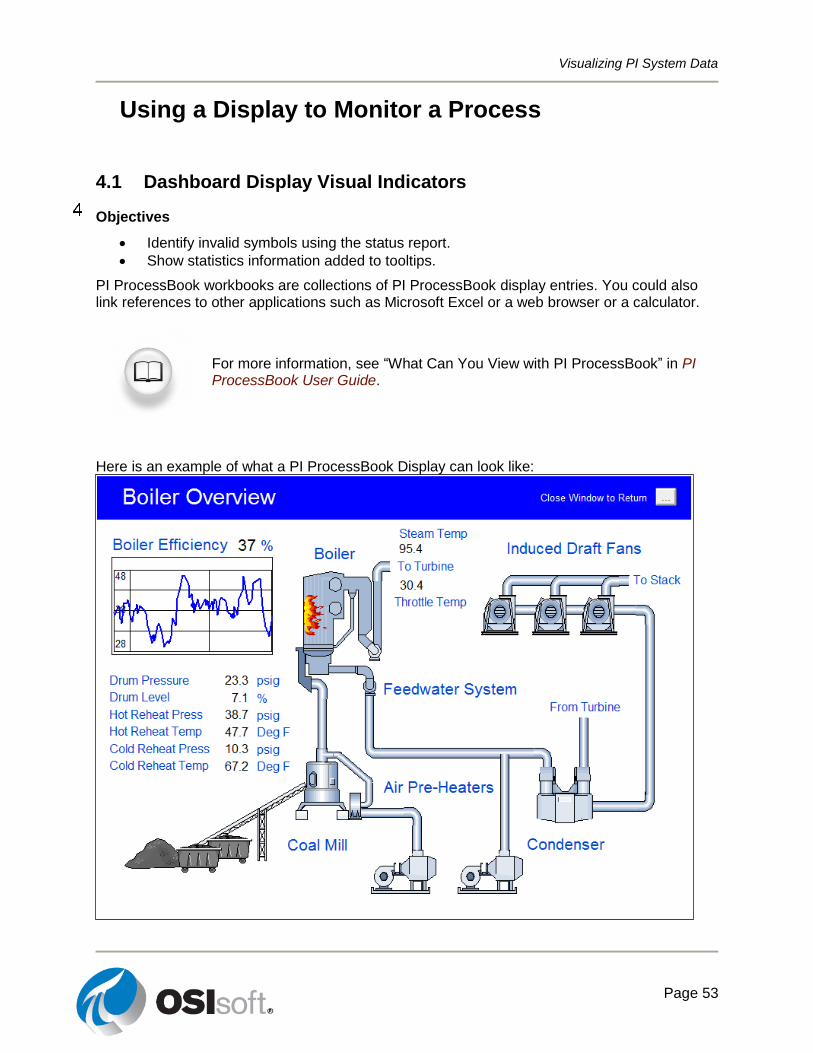
PI ProcessBook workbooks are collections of PI ProcessBook display entries. You could also link references to other applications such as Microsoft Excel or a web browser or a calculator.
For more information, see “What Can You View with PI ProcessBook” in PI ProcessBook User Guide.
Here is an example of what a PI ProcessBook Display can look like:
Visualizing PI System Data
Page 54
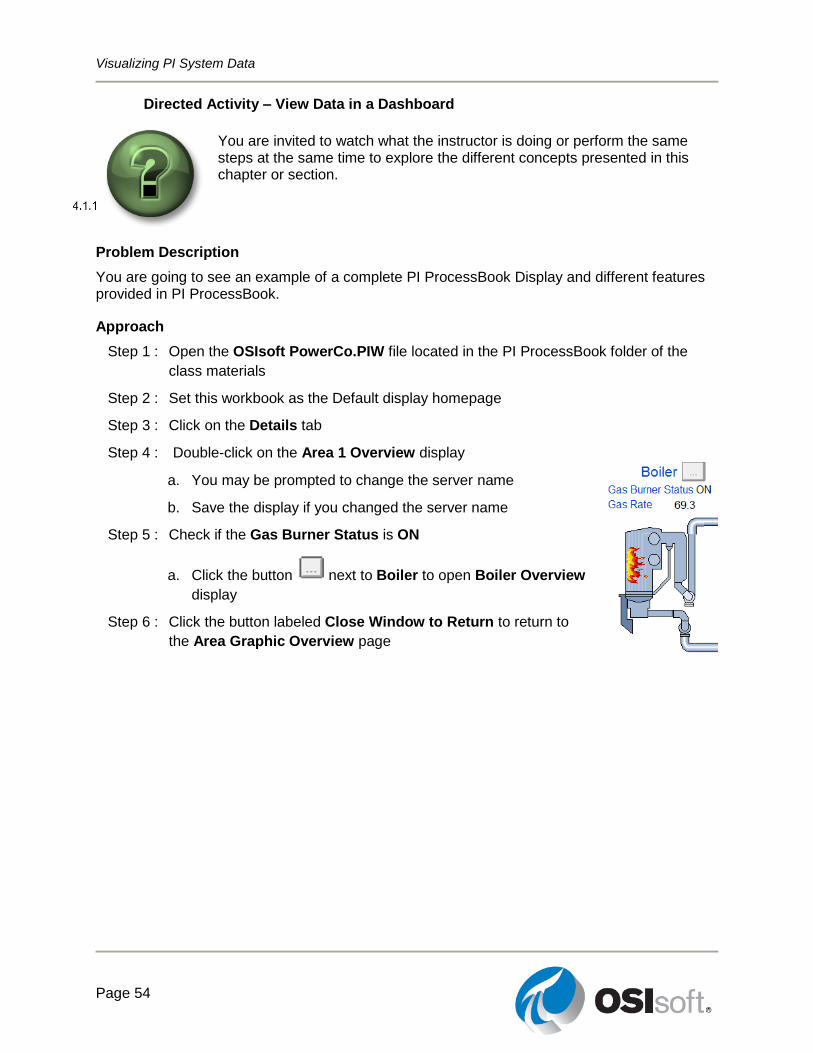
Directed Activity – View Data in a Dashboard
You are invited to watch what the instructor is doing or perform the same steps at the same time to explore the different concepts presented in this chapter or section.
Problem Description
You are going to see an example of a complete PI ProcessBook Display and different features provided in PI ProcessBook.
Approach
Step 1 : Open the OSIsoft PowerCo.PIW file located in the PI ProcessBook folder of the
class materials
Step 2 : Set this workbook as the Default display homepage
Step 3 : Click on the Details tab
Step 4 : Double-click on the Area 1 Overview display
a. You may be prompted to change the server name
b. Save the display if you changed the server name
Step 5 : Check if the Gas Burner Status is ON
a. Click the button next to Boiler to open Boiler Overview
display
Step 6 : Click the button labeled Close Window to Return to return to
the Area Graphic Overview page
Visualizing PI System Data
Page 55
4.2 Connecting to the PI System in PI ProcessBook
Objectives
Examine the connection to a Data Archive from PI ProcessBook
Create a new connection to a Data Archive.
Connect to an AF Server from PI ProcessBook.
Examine the connected credentials.
What do we connect to?
You will be looking for data in the PI System exposed through the AF Server or for point data in a Data Archive.
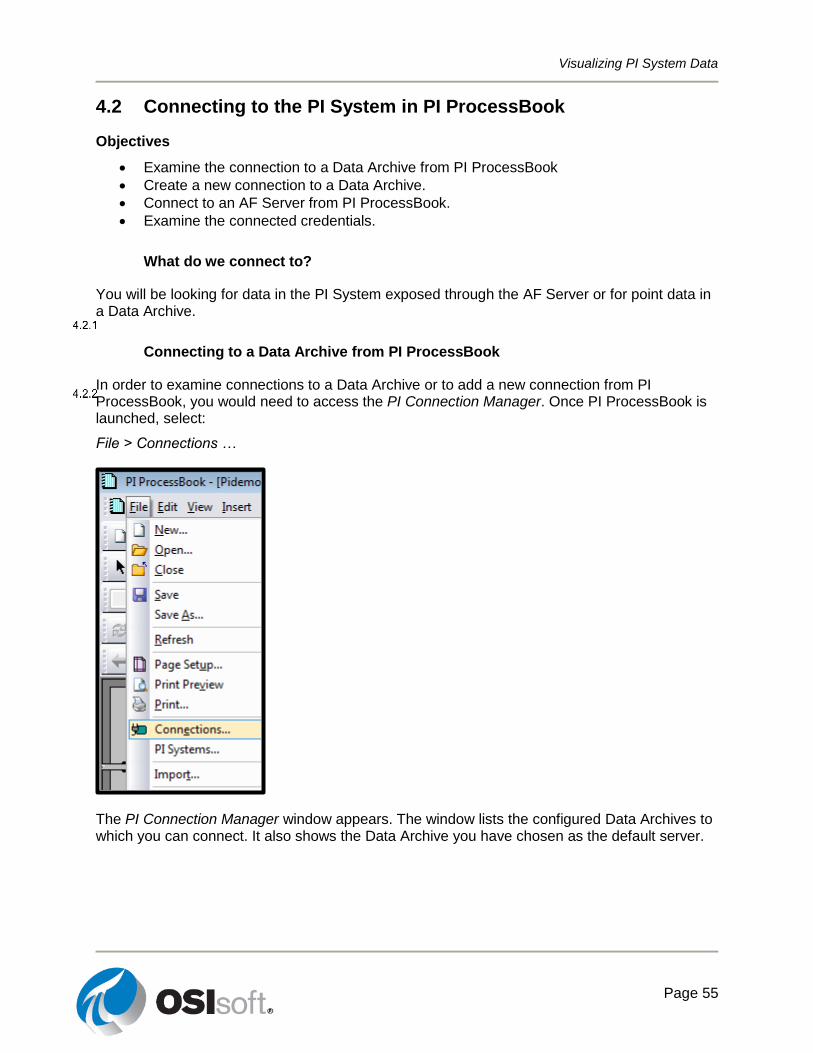
Connecting to a Data Archive from PI ProcessBook
In order to examine connections to a Data Archive or to add a new connection from PI ProcessBook, you would need to access the PI Connection Manager. Once PI ProcessBook is launched, select:
File > Connections …
The PI Connection Manager window appears. The window lists the configured Data Archives to which you can connect. It also shows the Data Archive you have chosen as the default server.
Visualizing PI System Data
Page 56
Note: The first time a PI System application is installed a default Data Archive is selected. This is why, even if you have never configured a Data Archive, at least one should appear in your PI Connection Manager.
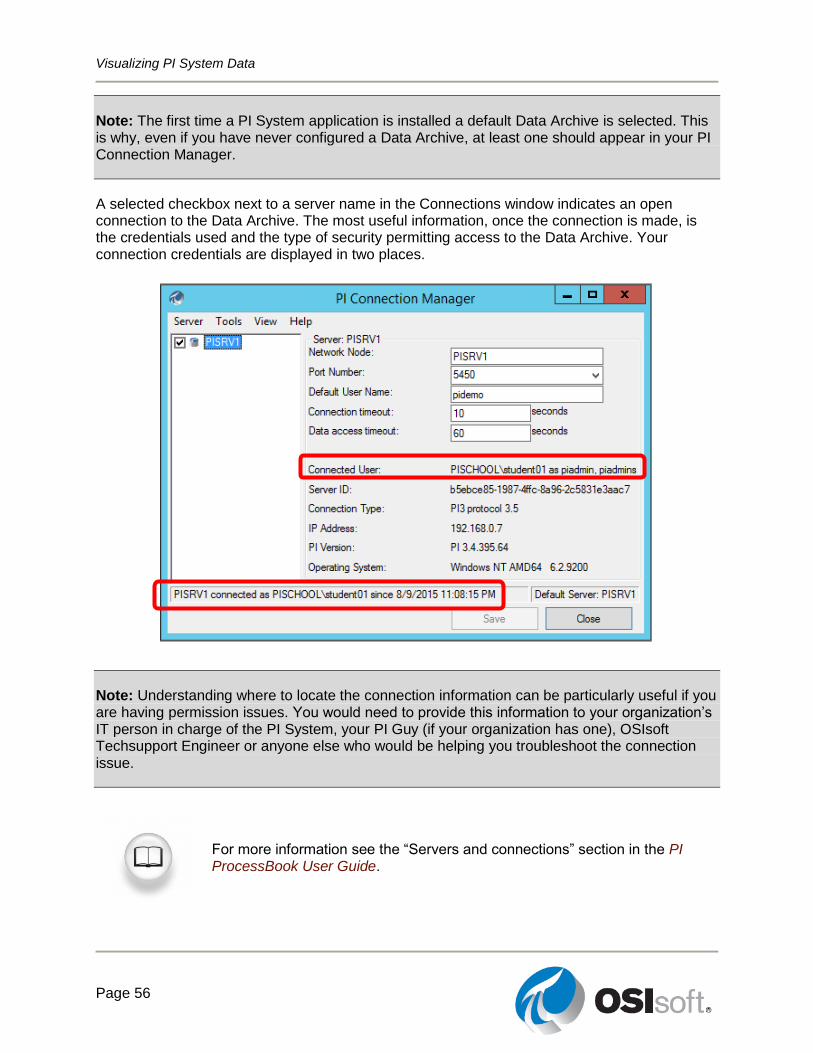
A selected checkbox next to a server name in the Connections window indicates an open connection to the Data Archive. The most useful information, once the connection is made, is the credentials used and the type of security permitting access to the Data Archive. Your connection credentials are displayed in two places.
Note: Understanding where to locate the connection information can be particularly useful if you are having permission issues. You would need to provide this information to your organization’s IT person in charge of the PI System, your PI Guy (if your organization has one), OSIsoft Techsupport Engineer or anyone else who would be helping you troubleshoot the connection issue.
For more information see the “Servers and connections” section in the PI ProcessBook User Guide.
Visualizing PI System Data
Page 57
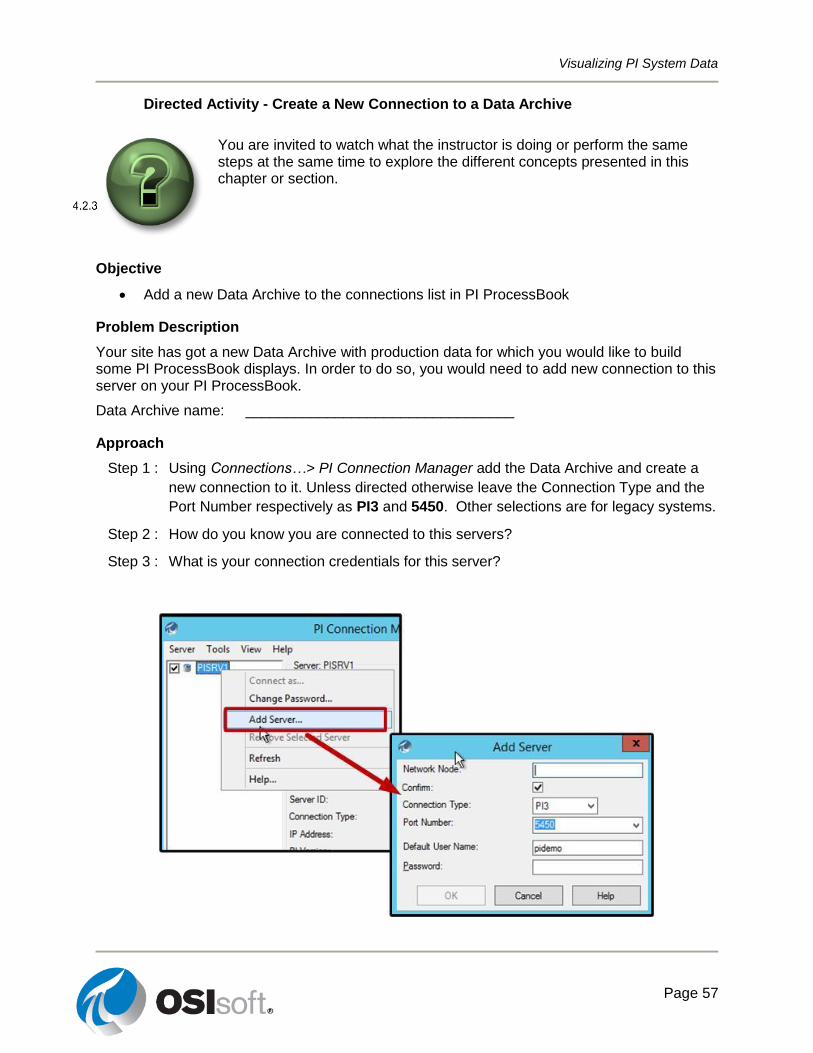
Directed Activity - Create a New Connection to a Data Archive
You are invited to watch what the instructor is doing or perform the same steps at the same time to explore the different concepts presented in this chapter or section.
Objective
Add a new Data Archive to the connections list in PI ProcessBook
Problem Description
Your site has got a new Data Archive with production data for which you would like to build some PI ProcessBook displays. In order to do so, you would need to add new connection to this server on your PI ProcessBook.
Data Archive name: _________________________________
Approach
Step 1 : Using Connections…> PI Connection Manager add the Data Archive and create a
new connection to it. Unless directed otherwise leave the Connection Type and the
Port Number respectively as PI3 and 5450. Other selections are for legacy systems.
Step 2 : How do you know you are connected to this servers?
Step 3 : What is your connection credentials for this server?
Visualizing PI System Data
Page 58
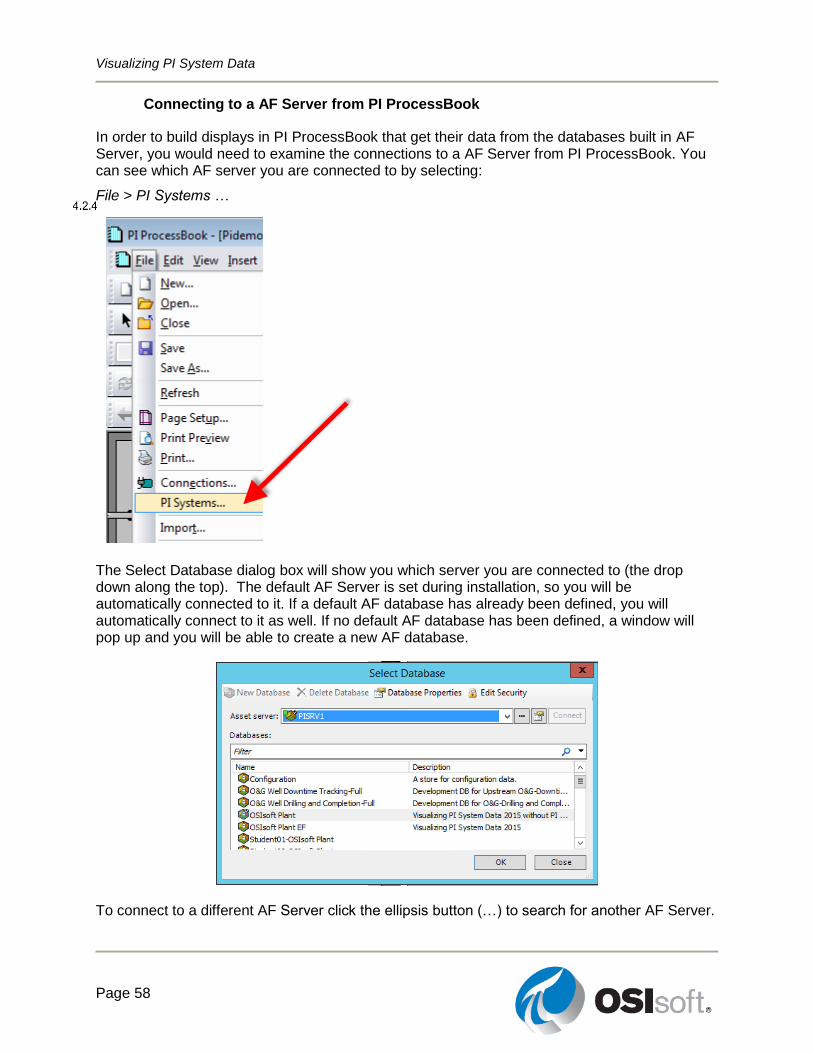
Connecting to a AF Server from PI ProcessBook
In order to build displays in PI ProcessBook that get their data from the databases built in AF Server, you would need to examine the connections to a AF Server from PI ProcessBook. You can see which AF server you are connected to by selecting:
File > PI Systems …
The Select Database dialog box will show you which server you are connected to (the drop down along the top). The default AF Server is set during installation, so you will be automatically connected to it. If a default AF database has already been defined, you will automatically connect to it as well. If no default AF database has been defined, a window will pop up and you will be able to create a new AF database.
To connect to a different AF Server click the ellipsis button (…) to search for another AF Server.
Visualizing PI System Data
Page 59
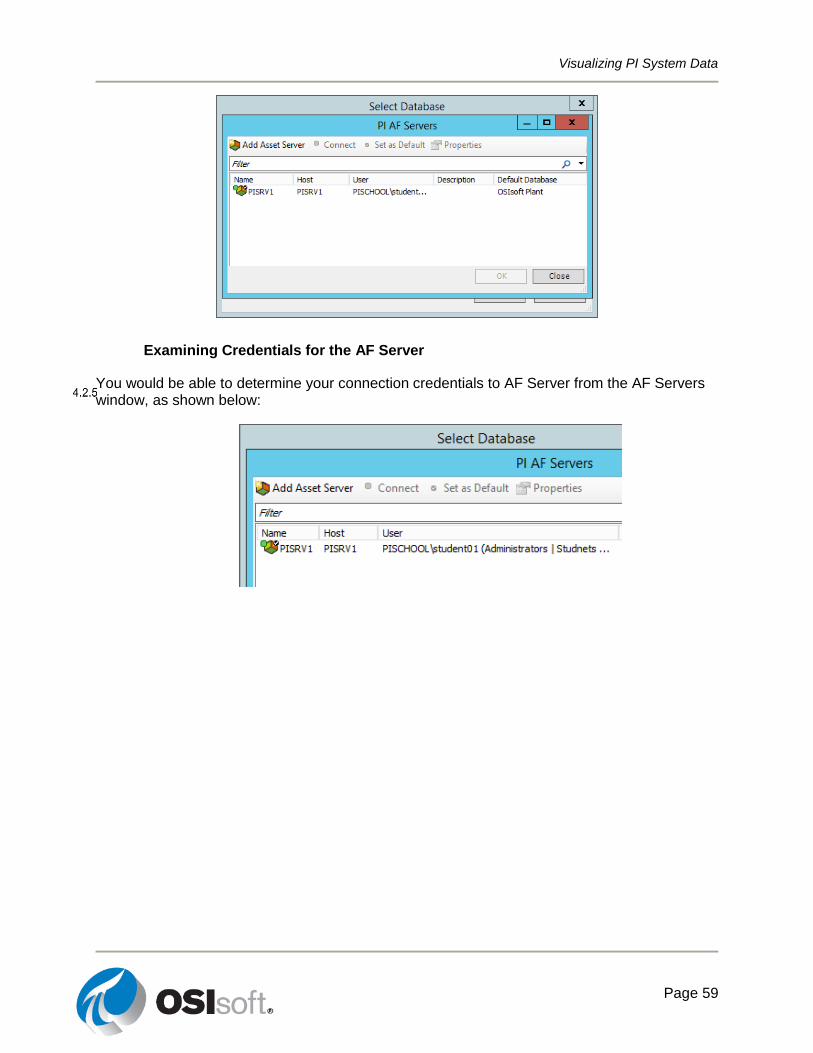
Examining Credentials for the AF Server
You would be able to determine your connection credentials to AF Server from the AF Servers window, as shown below:
Visualizing PI System Data
Page 60
Directed Activity – Create a New Connection to an AF Server
You are invited to watch what the instructor is doing or perform the same steps at the same time to explore the different concepts presented in this chapter or section.
Objectives
Add an AF Server to the connections list in PI ProcessBook
Problem Description
Your site has got a new AF Server with production data for which you would like to build some PI ProcessBook displays. In order to do so, you would need to add new connection to this server on your PI ProcessBook.
AF Server name: _________________________________
Approach
Step 1 : Using PI Systems…> Select Database add the AF Server and create a new
connection to it.
Step 2 : How do you know you are connected to this server?
Step 3 : What are your connection credentials for this server?
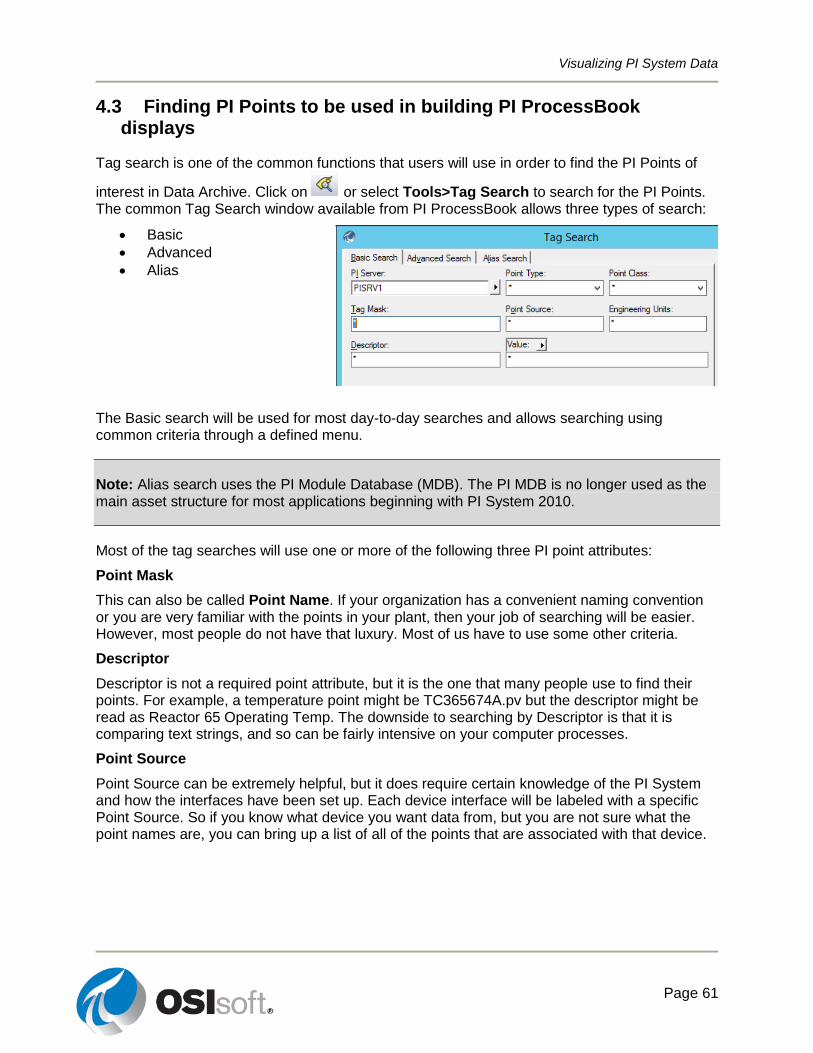
Visualizing PI System Data
Page 61
4.3 Finding PI Points to be used in building PI ProcessBook displays
Tag search is one of the common functions that users will use in order to find the PI Points of
interest in Data Archive. Click on or select Tools>Tag Search to search for the PI Points. The common Tag Search window available from PI ProcessBook allows three types of search:
Basic
Advanced
Alias
The Basic search will be used for most day-to-day searches and allows searching using common criteria through a defined menu.
Note: Alias search uses the PI Module Database (MDB). The PI MDB is no longer used as the main asset structure for most applications beginning with PI System 2010.
Most of the tag searches will use one or more of the following three PI point attributes:
Point Mask
This can also be called Point Name. If your organization has a convenient naming convention or you are very familiar with the points in your plant, then your job of searching will be easier. However, most people do not have that luxury. Most of us have to use some other criteria.
Descriptor
Descriptor is not a required point attribute, but it is the one that many people use to find their points. For example, a temperature point might be TC365674A.pv but the descriptor might be read as Reactor 65 Operating Temp. The downside to searching by Descriptor is that it is comparing text strings, and so can be fairly intensive on your computer processes.
Point Source
Point Source can be extremely helpful, but it does require certain knowledge of the PI System and how the interfaces have been set up. Each device interface will be labeled with a specific Point Source. So if you know what device you want data from, but you are not sure what the point names are, you can bring up a list of all of the points that are associated with that device.

Visualizing PI System Data
Page 62
Variations
Remember that wildcards can be used in the above searches.
Use * to replace any number of characters like in this example:
cd*158 = CDEP158, CDM158, CDT158
Use ? to replace one character like in this example:
cd?158 = CDM158, CDT158
cd??158 = CDEP158
Visualizing PI System Data
Page 63
Directed Activity – Discover PI Points in the Data Archive
You are invited to watch what the instructor is doing or perform the same steps at the same time to explore the different concepts presented in this chapter or section.
Objectives
Discover PI Points in the Data Archive.
Problem Description
Answer the following questions using PI Tag Search in PI ProcessBook.
Part 1
How many points begin with the letters ba:? _______________________________________
Part 2
How many points have a point source of R? ______________________________________
Part 3
How many are associated with the Tanks on the OSIsoft Plant’s Data Archive? _______
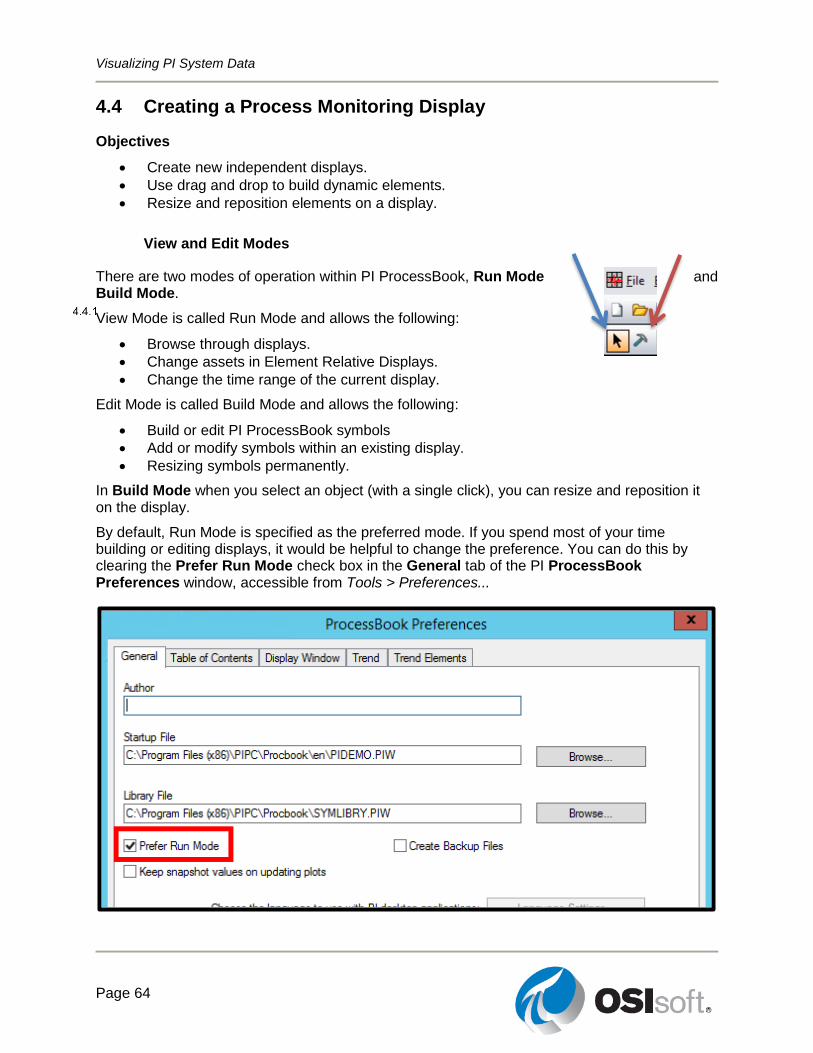
Visualizing PI System Data
Page 64
4.4 Creating a Process Monitoring Display
Objectives
Create new independent displays.
Use drag and drop to build dynamic elements.
Resize and reposition elements on a display.
View and Edit Modes
There are two modes of operation within PI ProcessBook, Run Mode and Build Mode.
View Mode is called Run Mode and allows the following:
Browse through displays.
Change assets in Element Relative Displays.
Change the time range of the current display.
Edit Mode is called Build Mode and allows the following:
Build or edit PI ProcessBook symbols
Add or modify symbols within an existing display.
Resizing symbols permanently.
In Build Mode when you select an object (with a single click), you can resize and reposition it on the display.
By default, Run Mode is specified as the preferred mode. If you spend most of your time building or editing displays, it would be helpful to change the preference. You can do this by clearing the Prefer Run Mode check box in the General tab of the PI ProcessBook Preferences window, accessible from Tools > Preferences...
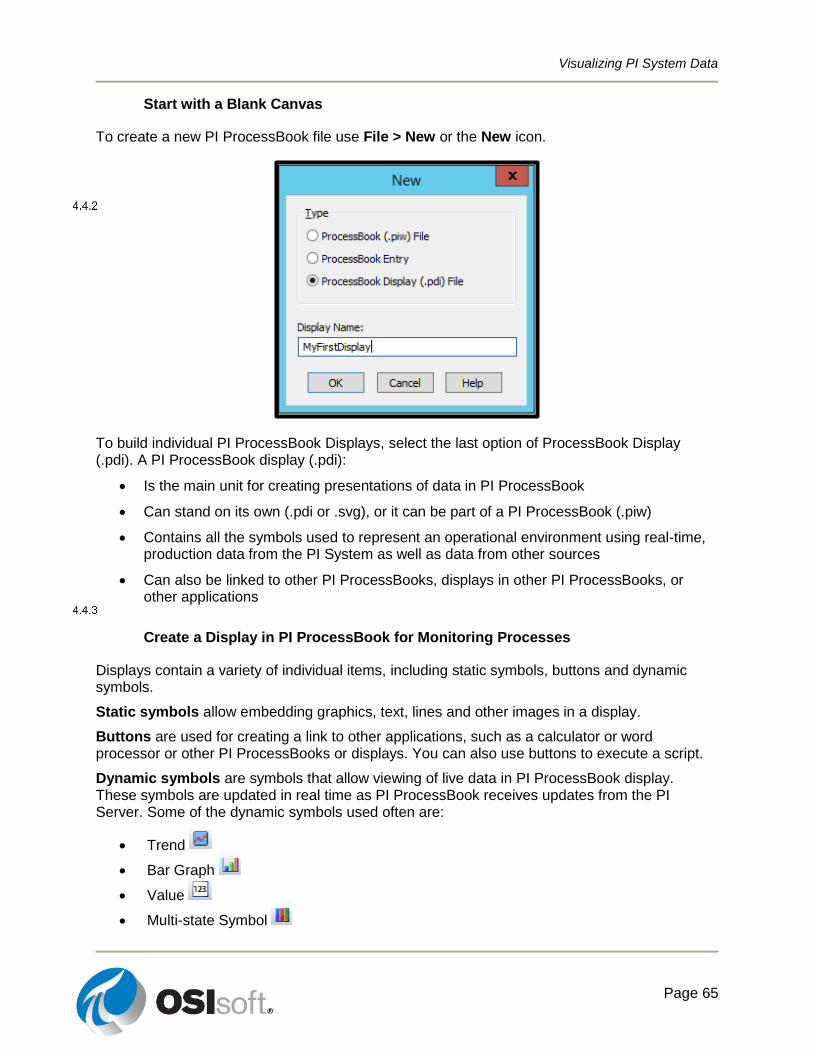
Visualizing PI System Data
Page 65
Start with a Blank Canvas
To create a new PI ProcessBook file use File > New or the New icon.
To build individual PI ProcessBook Displays, select the last option of ProcessBook Display (.pdi). A PI ProcessBook display (.pdi):
Is the main unit for creating presentations of data in PI ProcessBook
Can stand on its own (.pdi or .svg), or it can be part of a PI ProcessBook (.piw)
Contains all the symbols used to represent an operational environment using real-time, production data from the PI System as well as data from other sources
Can also be linked to other PI ProcessBooks, displays in other PI ProcessBooks, or other applications
Create a Display in PI ProcessBook for Monitoring Processes
Displays contain a variety of individual items, including static symbols, buttons and dynamic symbols.
Static symbols allow embedding graphics, text, lines and other images in a display.
Buttons are used for creating a link to other applications, such as a calculator or word processor or other PI ProcessBooks or displays. You can also use buttons to execute a script.
Dynamic symbols are symbols that allow viewing of live data in PI ProcessBook display. These symbols are updated in real time as PI ProcessBook receives updates from the PI Server. Some of the dynamic symbols used often are:
Trend
Bar Graph
Value
Multi-state Symbol
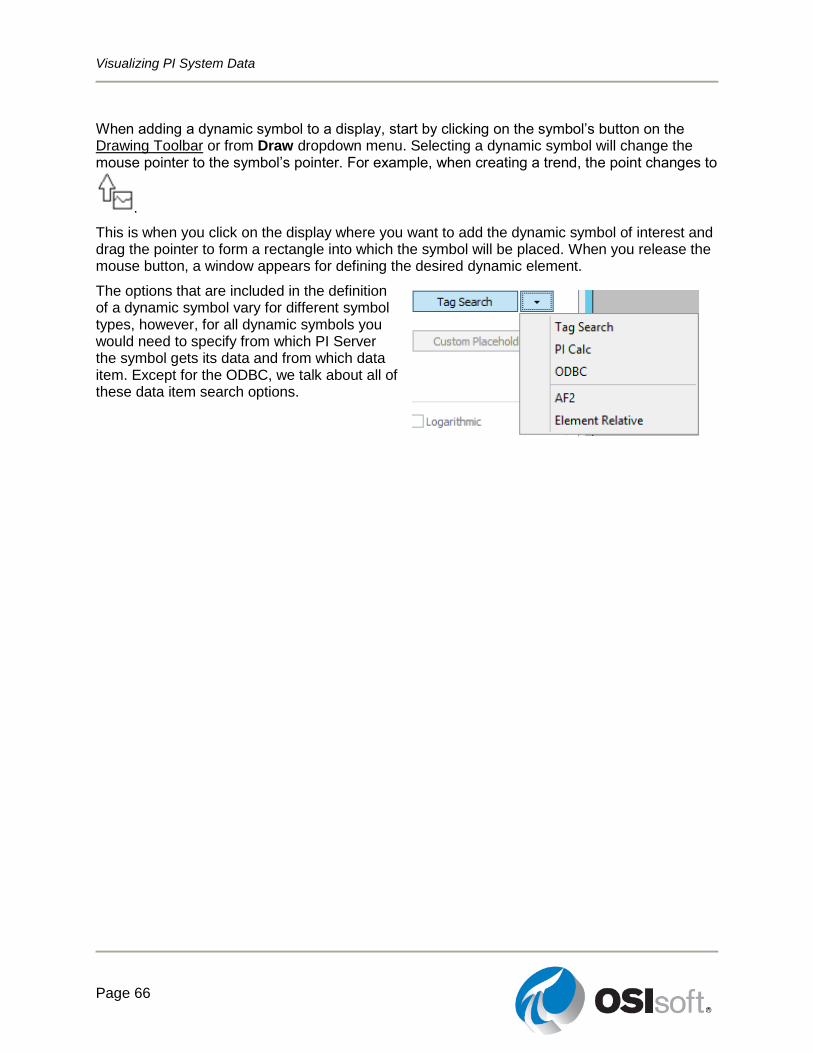
Visualizing PI System Data
Page 66
When adding a dynamic symbol to a display, start by clicking on the symbol’s button on the Drawing Toolbar or from Draw dropdown menu. Selecting a dynamic symbol will change the mouse pointer to the symbol’s pointer. For example, when creating a trend, the point changes to
.
This is when you click on the display where you want to add the dynamic symbol of interest and drag the pointer to form a rectangle into which the symbol will be placed. When you release the mouse button, a window appears for defining the desired dynamic element.
The options that are included in the definition of a dynamic symbol vary for different symbol types, however, for all dynamic symbols you would need to specify from which PI Server the symbol gets its data and from which data item. Except for the ODBC, we talk about all of these data item search options.
Visualizing PI System Data
Page 67
Directed Activity – Building a Display that Has Dynamic Elements for PI Points
You are invited to watch what the instructor is doing or perform the same steps at the same time to explore the different concepts presented in this chapter or section.
Objectives
Create a new display.
Build several dynamic elements.
Problem Description
We want to build a PI ProcessBook display for monitoring some of the measurements done for Mixing Tank2 in Production Line2. This table lists these measurements, their PI point and the associated dynamic symbol that we would like to have on the PI ProcessBook display:
Mix
ing
Tan
k2 Measured Value Associated PI Point Dynamic Symbol
Internal Temperature VPSD.OSIsoftPlant.PL2.MXTK2.Internal Temperature
Value
Pressure VPSD.OSIsoftPlant.PL2.MXTK2.Pressure Trend
Level VPSD.OSIsoftPlant.PL2.MXTK2.Level Trend, Bar
Hint: Use Descriptor in searching for points
Approach
Step 4 : Open the PI ProcessBook application. Create a new PI ProcessBook Display file
*.pdi
Step 5 : Ensure you are in Build Mode.
Step 6 : Click on the Trend button or select Draw ->Trend.
Step 7 : Draw one large box for the trend. Once the Define Trend window opens, click on
Tag Search and find the points storing Pressure data and the values of the tank
Level
a. Point Mask: *Pressure*
b. Descriptor: *Mixing Tank2*
c. (click OK, click on Tag Search again)
d. Point Mask: *Level*
e. Descriptor: *Mixing Tank2*
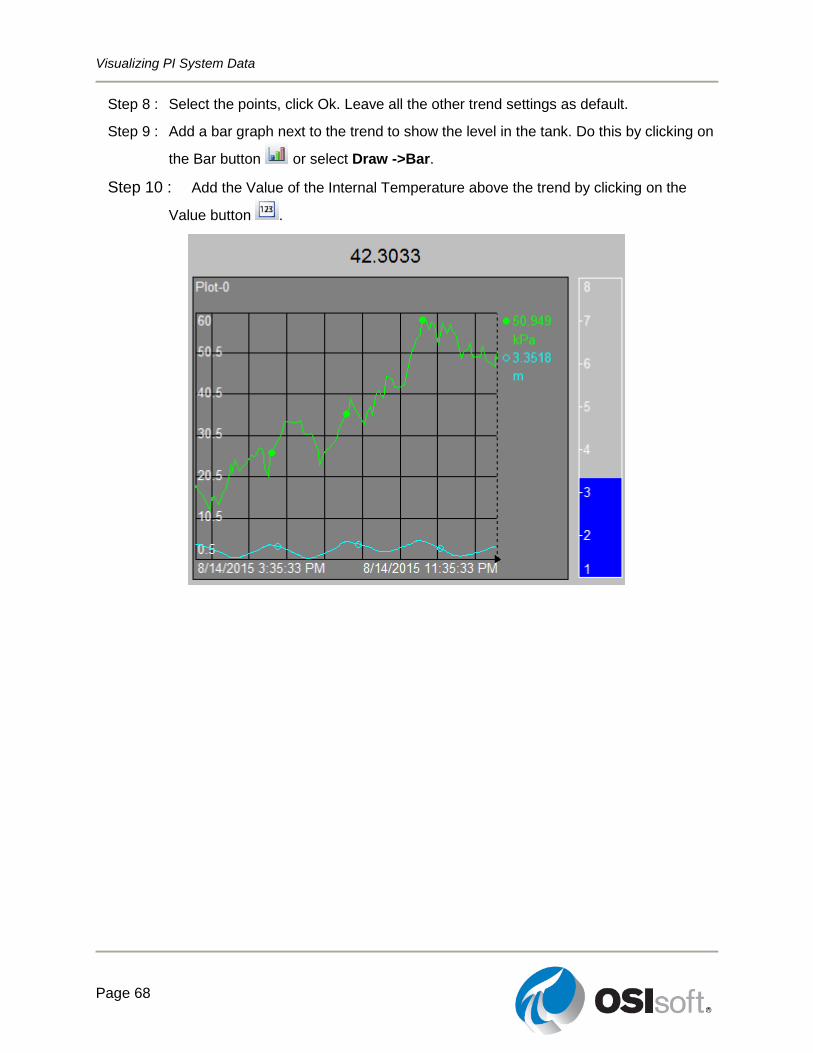
Visualizing PI System Data
Page 68
Step 8 : Select the points, click Ok. Leave all the other trend settings as default.
Step 9 : Add a bar graph next to the trend to show the level in the tank. Do this by clicking on
the Bar button or select Draw ->Bar.
Step 10 : Add the Value of the Internal Temperature above the trend by clicking on the
Value button .
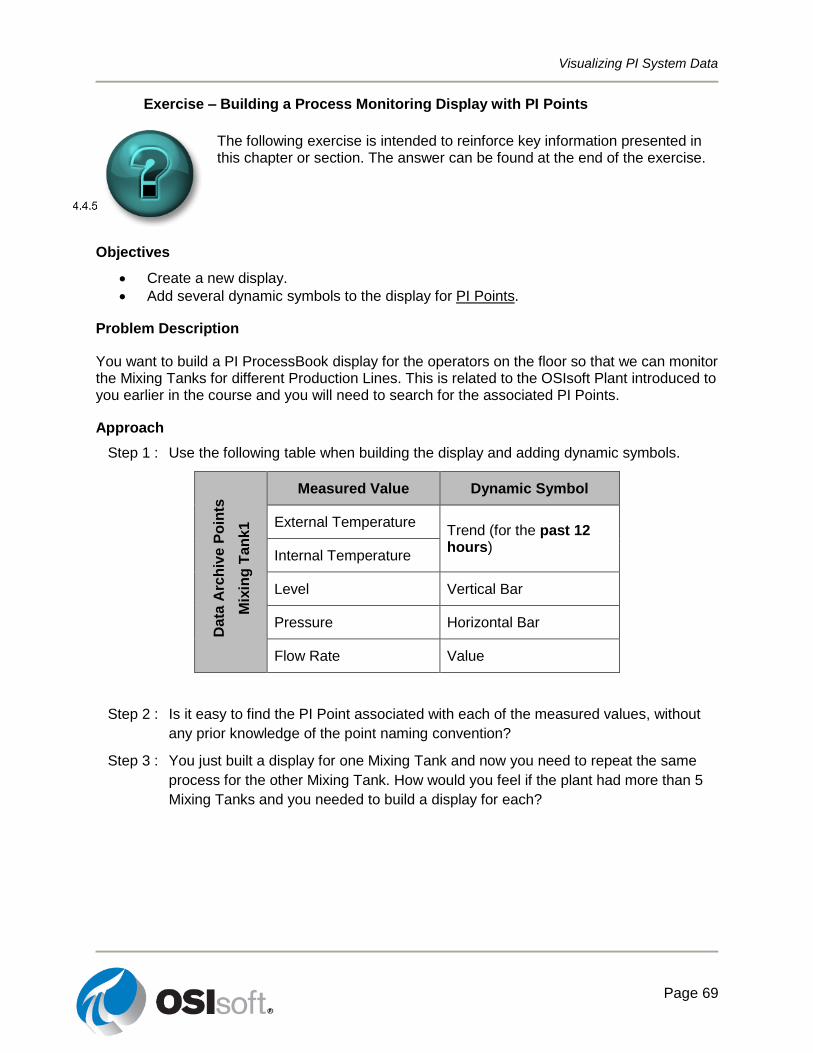
Visualizing PI System Data
Page 69
Exercise – Building a Process Monitoring Display with PI Points
The following exercise is intended to reinforce key information presented in this chapter or section. The answer can be found at the end of the exercise.
Objectives
Create a new display.
Add several dynamic symbols to the display for PI Points.
Problem Description
You want to build a PI ProcessBook display for the operators on the floor so that we can monitor the Mixing Tanks for different Production Lines. This is related to the OSIsoft Plant introduced to you earlier in the course and you will need to search for the associated PI Points.
Approach
Step 1 : Use the following table when building the display and adding dynamic symbols.
Da
ta A
rch
ive P
oin
ts
Mix
ing
Tan
k1
Measured Value Dynamic Symbol
External Temperature Trend (for the past 12 hours)
Internal Temperature
Level Vertical Bar
Pressure Horizontal Bar
Flow Rate Value
Step 2 : Is it easy to find the PI Point associated with each of the measured values, without
any prior knowledge of the point naming convention?
Step 3 : You just built a display for one Mixing Tank and now you need to repeat the same
process for the other Mixing Tank. How would you feel if the plant had more than 5
Mixing Tanks and you needed to build a display for each?
Visualizing PI System Data
Page 70
Directed Activity – What is Missing in our Process Monitoring Display?
You are invited to watch what the instructor is doing or perform the same steps at the same time to explore the different concepts presented in this chapter or section.
Objectives
Evaluate whether the PI ProcessBook display is sufficient
Problem Description
You just created a display for your operators to use in monitoring the process. This is the display that the operators will have in front of them and look at, all day, every day.
Part 1
Do you think the display has everything you want to put on it?
Part 2
What kind of items would you add to this display to make it resemble the actual process in a more realistic way?
Part 3
What other information and useful values would you add to this display?
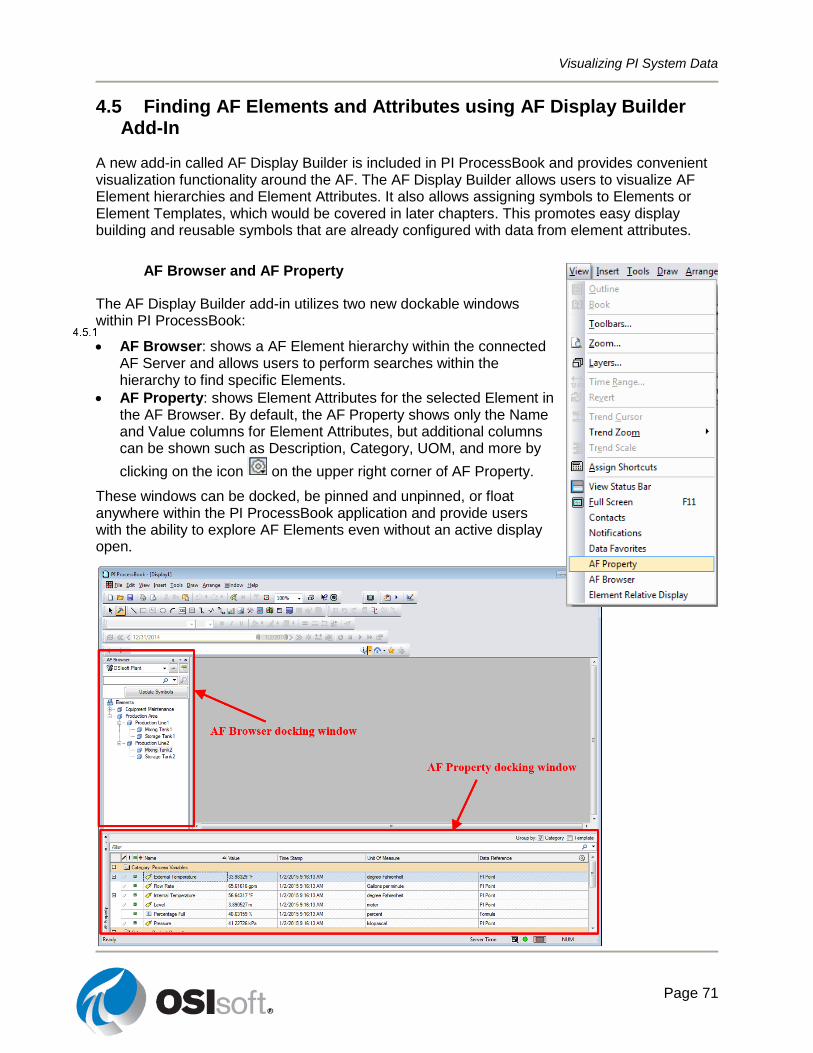
Visualizing PI System Data
Page 71
4.5 Finding AF Elements and Attributes using AF Display Builder Add-In
A new add-in called AF Display Builder is included in PI ProcessBook and provides convenient visualization functionality around the AF. The AF Display Builder allows users to visualize AF Element hierarchies and Element Attributes. It also allows assigning symbols to Elements or Element Templates, which would be covered in later chapters. This promotes easy display building and reusable symbols that are already configured with data from element attributes.
AF Browser and AF Property
The AF Display Builder add-in utilizes two new dockable windows within PI ProcessBook:
AF Browser: shows a AF Element hierarchy within the connected AF Server and allows users to perform searches within the hierarchy to find specific Elements.
AF Property: shows Element Attributes for the selected Element in the AF Browser. By default, the AF Property shows only the Name and Value columns for Element Attributes, but additional columns can be shown such as Description, Category, UOM, and more by
clicking on the icon on the upper right corner of AF Property.
These windows can be docked, be pinned and unpinned, or float anywhere within the PI ProcessBook application and provide users with the ability to explore AF Elements even without an active display open.
Visualizing PI System Data
Page 72
Directed Activity – Exploring AF hierarchy in PI ProcessBook
You are invited to watch what the instructor is doing or perform the same steps at the same time to explore the different concepts presented in this chapter or section.
Objectives
Get visibility to the AF hierarchy, the elements the attributes and their current values.
Problem Description
Answer the following questions using AF Browser and AF Property. This activity is written using the OSIsoft Plant Database.
Part 1
What is the current pressure of Mixing Tank2? _______________________________
Part 2
What production line is it associated to? _____________________________________
Part 3
Is the average external temperature of Storage Tank2 below 75? __________________
(Hint: Expand the + sign next to External Temperature. The average is listed as an attribute.)
Part 4
Which production line has the newest equipment? _____________________________
(Hint: There is an attribute named Installation Date)

Visualizing PI System Data
Page 73
Drag and drop AF attributes onto PI ProcessBook displays
The AF Display Builder add-in offers convenient new Drag and Drop features relating to Element Attributes. From the AF Property window, you can drag an Attribute to:
a blank area of a display to create an instant Value symbol or
a Trend symbol to add a trace to that Trend
Note that you will need to be in Build mode when using this functionality.
Visualizing PI System Data
Page 74
Directed Activity – Drag and drop AF attributes for building a PI ProcessBook display
You are invited to watch what the instructor is doing or perform the same steps at the same time to explore the different concepts presented in this chapter or section.
Objectives
Create a display using AF Attributes
Problem Description
You want to build a display in PI ProcessBook that has a trend showing the past 2 hours of Internal and External Temperatures of Mixing Tank1 as well as a Value showing the tank’s Installation Date. You are aware of the limitations of Data Archive and would like to use AF attributes when building this display.
Approach
Step 1 : Open the PI ProcessBook application. Create a new PI ProcessBook Display file
*.pdi
Step 2 : Ensure you are in Build Mode.
Step 3 : Enable the AF Browser and AF Property windows if not done already
Step 4 : Click on the Trend button or select Draw >Trend.
Step 5 : Draw one large box for the trend. Once the Define Trend window opens, Change the
Start Plot Time to *-2h. Do not select any data items and click OK to build an empty
trend for the past two hours.
Step 6 : On AF Browser, Drill down to Mixing Tank1 and click on it.
Step 7 : From the AF Property, select the attribute External Temperature then drag and drop
it on to the empty trend. Repeat for the Internal Temperature.
Step 8 : From the AF Property, select the attribute Installation Date then drag and drop it
anywhere on the PI ProcessBook display you like.
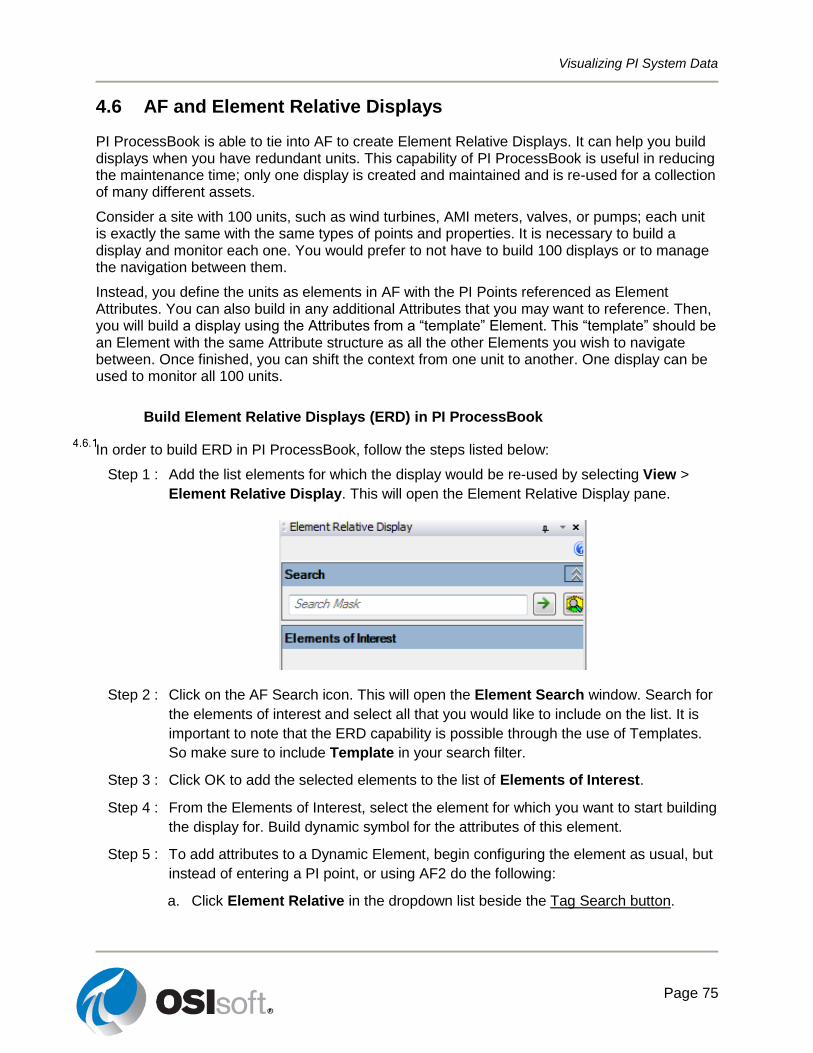
Visualizing PI System Data
Page 75
4.6 AF and Element Relative Displays
PI ProcessBook is able to tie into AF to create Element Relative Displays. It can help you build displays when you have redundant units. This capability of PI ProcessBook is useful in reducing the maintenance time; only one display is created and maintained and is re-used for a collection of many different assets.
Consider a site with 100 units, such as wind turbines, AMI meters, valves, or pumps; each unit is exactly the same with the same types of points and properties. It is necessary to build a display and monitor each one. You would prefer to not have to build 100 displays or to manage the navigation between them.
Instead, you define the units as elements in AF with the PI Points referenced as Element Attributes. You can also build in any additional Attributes that you may want to reference. Then, you will build a display using the Attributes from a “template” Element. This “template” should be an Element with the same Attribute structure as all the other Elements you wish to navigate between. Once finished, you can shift the context from one unit to another. One display can be used to monitor all 100 units.
Build Element Relative Displays (ERD) in PI ProcessBook
In order to build ERD in PI ProcessBook, follow the steps listed below:
Step 1 : Add the list elements for which the display would be re-used by selecting View >
Element Relative Display. This will open the Element Relative Display pane.
Step 2 : Click on the AF Search icon. This will open the Element Search window. Search for
the elements of interest and select all that you would like to include on the list. It is
important to note that the ERD capability is possible through the use of Templates.
So make sure to include Template in your search filter.
Step 3 : Click OK to add the selected elements to the list of Elements of Interest.
Step 4 : From the Elements of Interest, select the element for which you want to start building
the display for. Build dynamic symbol for the attributes of this element.
Step 5 : To add attributes to a Dynamic Element, begin configuring the element as usual, but
instead of entering a PI point, or using AF2 do the following:
a. Click Element Relative in the dropdown list beside the Tag Search button.
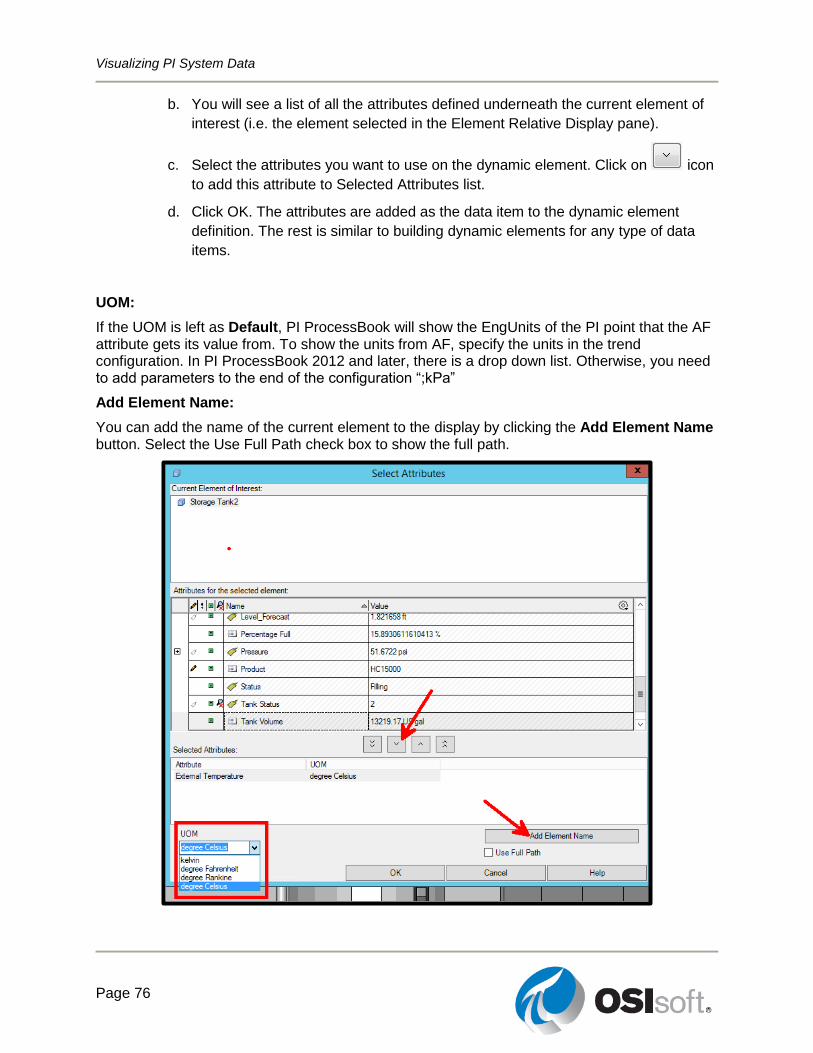
Visualizing PI System Data
Page 76
b. You will see a list of all the attributes defined underneath the current element of
interest (i.e. the element selected in the Element Relative Display pane).
c. Select the attributes you want to use on the dynamic element. Click on icon
to add this attribute to Selected Attributes list.
d. Click OK. The attributes are added as the data item to the dynamic element
definition. The rest is similar to building dynamic elements for any type of data
items.
UOM:
If the UOM is left as Default, PI ProcessBook will show the EngUnits of the PI point that the AF attribute gets its value from. To show the units from AF, specify the units in the trend configuration. In PI ProcessBook 2012 and later, there is a drop down list. Otherwise, you need to add parameters to the end of the configuration “;kPa”
Add Element Name:
You can add the name of the current element to the display by clicking the Add Element Name button. Select the Use Full Path check box to show the full path.
Visualizing PI System Data
Page 77
Directed Activity – Creating an Element Relative Display
You are invited to watch what the instructor is doing or perform the same steps at the same time to explore the different concepts presented in this chapter or section.
Objectives
Create an element relative PI ProcessBook display
Problem Description
You have four tanks, you can create 4 displays. However, if you use Element Relative Displays, you can create 1 display, and still monitor all four tanks.
Approach
Step 1 : Create a new *.PDI file.
Step 2 : Select View > Element Relative Display.
Step 3 : Add the Tanks Element.
a. The four tanks will be added as child elements.
Step 4 : Single Click on the Mixing Tank1.
Step 5 : Draw a trend.
a. Select Element Relative.
Step 6 : Add the Flow Rate and Pressure.
Step 7 : Now change contexts to switch to Mixing Tank2.
Step 8 : Add the Element Name
Visualizing PI System Data
Page 78
Exercise – Reuse a Single Process Monitoring Display for multiple Assets
This solo or group activity is designed to maximize learning in a specific topic area. Your instructor will have instructions, and will coach you if you need assistance during the activity.
Objectives
Create an element relative display in PI ProcessBook.
Use unit conversion in the display.
Problem Description
Previously, we built a process monitoring display for Mixing Tank1 that had dynamic symbols. Since there are four tanks on the plant, we would like to be able to build one display and use it for all 4 tanks to minimize the PI ProcessBook display maintenance effort. We know that these tanks are built from the same AF Template, so ERD is applicable to them all!
Approach
Step 1 : In this Exercise, we will build the display from scratch, and will use Element Relative
Display capability. Below is the list of the items to include on the display:
Attribute/Object Element Display
UOM
External
Temperature Trend
deg C
Internal
Temperature deg C
Level Trend (from 1 hour ago to 10
minutes in the future)
Meter
Level Forcast meter
Level Vertical Bar meter
Pressure Horizontal Bar kilopascal
Flow Rate Value US gal/min
Installation Date Value -
Product Value -
Diameter Value feet
Name of the Tank Value -
Step 2 : Once the display is created, switch between different tanks and watch the display
get updated.
Step 3 : Remember to save your display on the desktop as ElementRelativeTankDisplay.PDI.
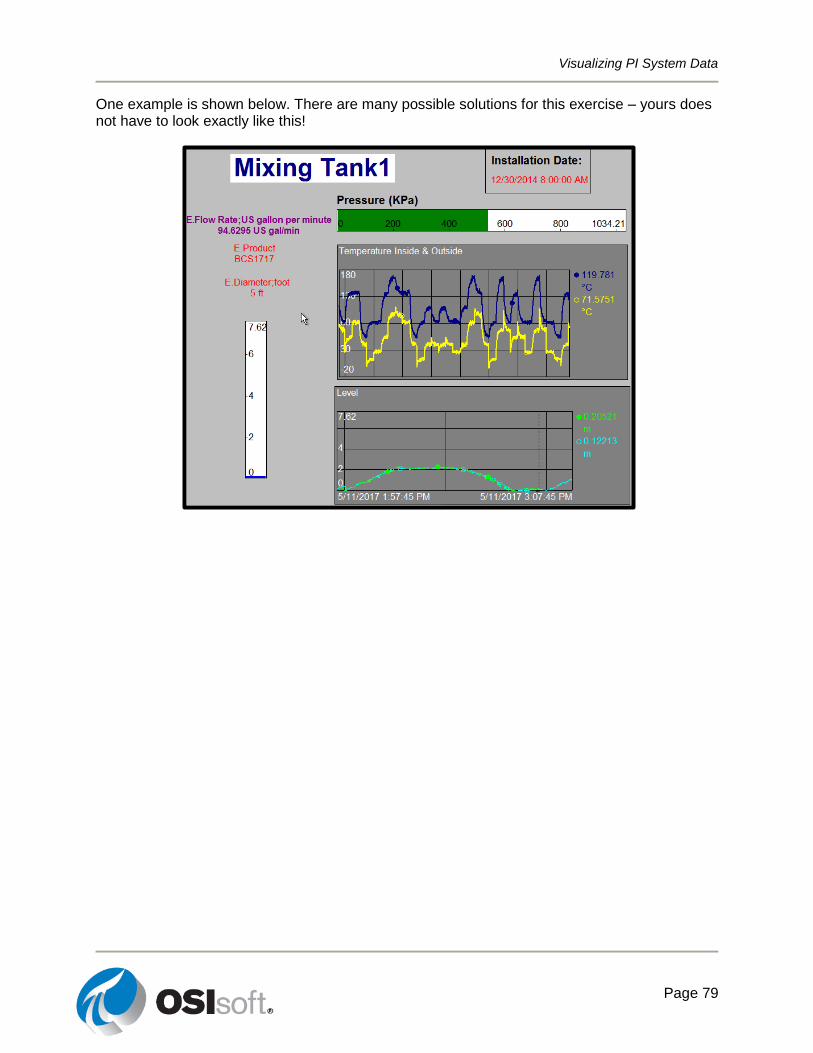
Visualizing PI System Data
Page 79
One example is shown below. There are many possible solutions for this exercise – yours does not have to look exactly like this!
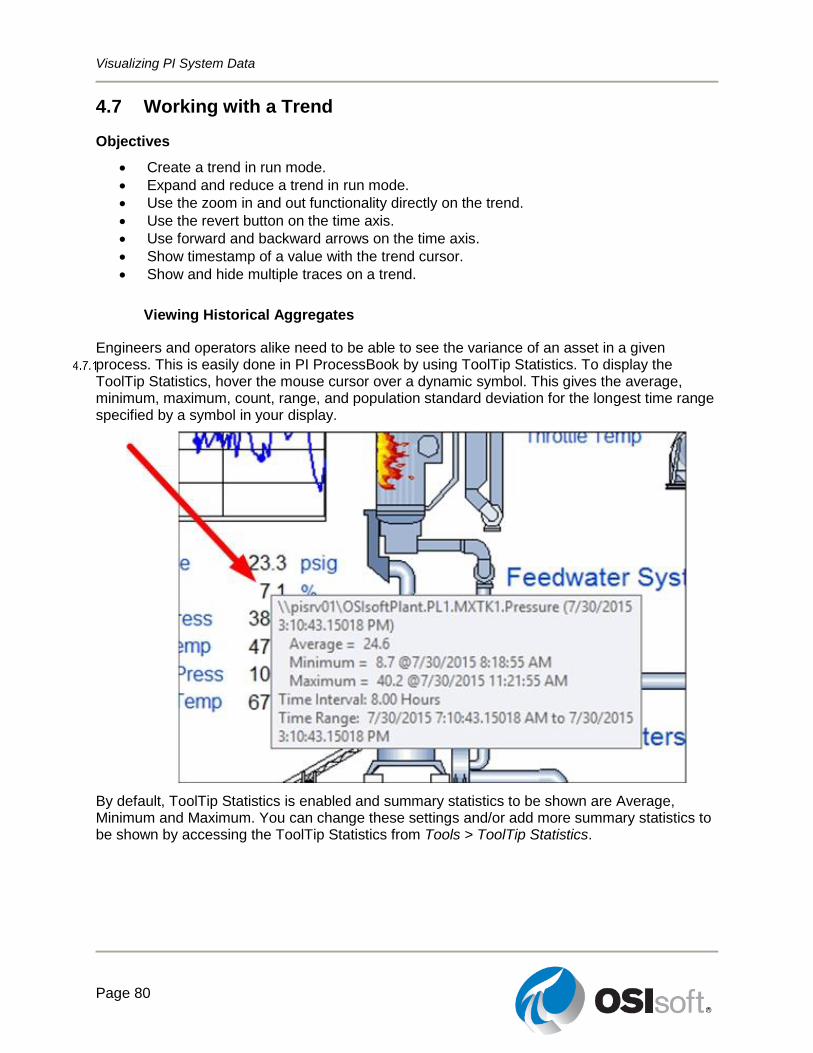
Visualizing PI System Data
Page 80
4.7 Working with a Trend
Objectives
Create a trend in run mode.
Expand and reduce a trend in run mode.
Use the zoom in and out functionality directly on the trend.
Use the revert button on the time axis.
Use forward and backward arrows on the time axis.
Show timestamp of a value with the trend cursor.
Show and hide multiple traces on a trend.
Viewing Historical Aggregates
Engineers and operators alike need to be able to see the variance of an asset in a given process. This is easily done in PI ProcessBook by using ToolTip Statistics. To display the ToolTip Statistics, hover the mouse cursor over a dynamic symbol. This gives the average, minimum, maximum, count, range, and population standard deviation for the longest time range specified by a symbol in your display.
By default, ToolTip Statistics is enabled and summary statistics to be shown are Average, Minimum and Maximum. You can change these settings and/or add more summary statistics to be shown by accessing the ToolTip Statistics from Tools > ToolTip Statistics.
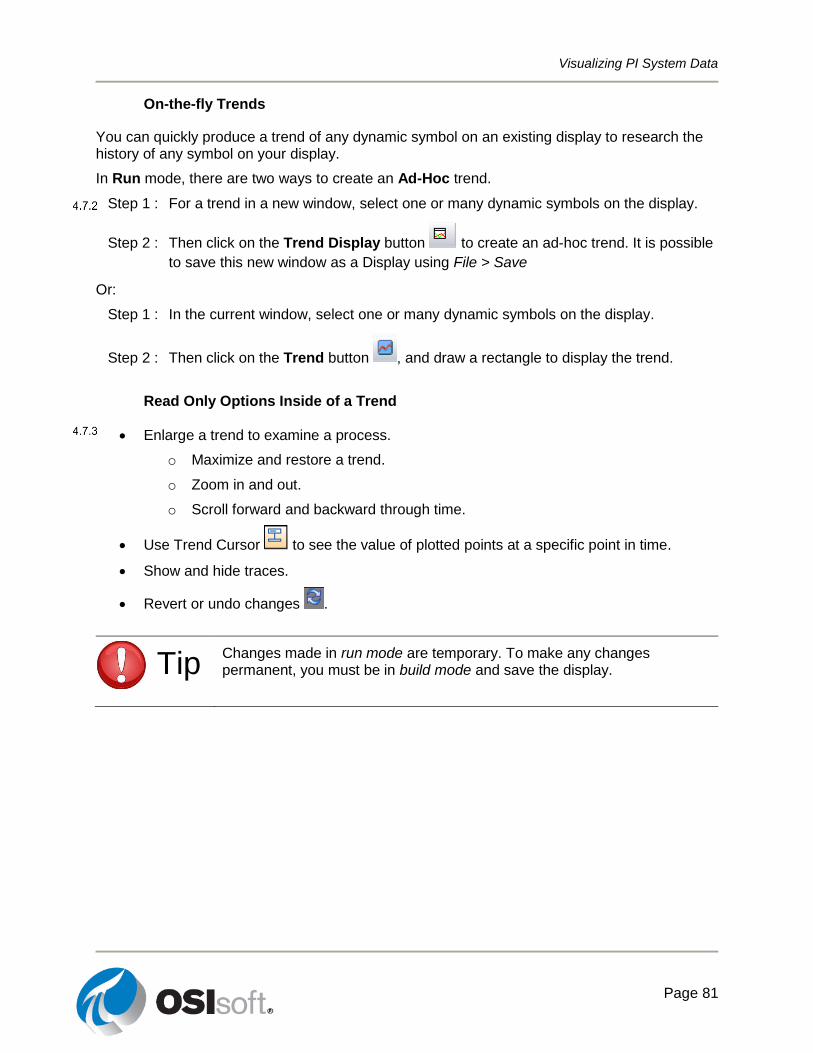
Visualizing PI System Data
Page 81
On-the-fly Trends
You can quickly produce a trend of any dynamic symbol on an existing display to research the history of any symbol on your display.
In Run mode, there are two ways to create an Ad-Hoc trend.
Step 1 : For a trend in a new window, select one or many dynamic symbols on the display.
Step 2 : Then click on the Trend Display button to create an ad-hoc trend. It is possible
to save this new window as a Display using File > Save
Or:
Step 1 : In the current window, select one or many dynamic symbols on the display.
Step 2 : Then click on the Trend button , and draw a rectangle to display the trend.
Read Only Options Inside of a Trend
Enlarge a trend to examine a process.
o Maximize and restore a trend.
o Zoom in and out.
o Scroll forward and backward through time.
Use Trend Cursor to see the value of plotted points at a specific point in time.
Show and hide traces.
Revert or undo changes .
Tip
Changes made in run mode are temporary. To make any changes permanent, you must be in build mode and save the display.
Visualizing PI System Data
Page 82
Directed Activity –Ad-hoc Analysis of data on a PI ProcessBook
You are invited to watch what the instructor is doing or perform the same steps at the same time to explore the different concepts presented in this chapter or section.
Objectives
Use PI ProcessBook in Run Mode
Problem Description
You just created a process monitoring display ElementRelativeTankDisplay.PDI. On this display, Level and Pressure are displayed using bar graphs. We would like to see the history of these two data items for the past 16 hours and also add a new trend to the display, plotting their historical values.
Approach
Open ElementRelativeTankDisplay.PDI if it is not already open.
Step 1 : Use the tooltip to find the average Pressure over the last 8 hours.
Step 2 : In Run mode, click on the horizontal bar for Pressure then click on the Trend Display
button . This will open an ad-hoc trend for pressure for the past 8 hours. Click on
the negative magnifying glass to change the display time rage to 16 hours.
Step 3 : Click on the on the top right corner to close the ad-hoc display.
Step 4 : In Run mode, click on the horizontal bar for Pressure then while holding the Ctrl key,
click on the vertical bar for Level. This way, both dynamic symbols are selected.
Then click on the Trend Display button to build an ad-hoc trend for both data items.
Step 5 : Change the display range to 16 hours. Close the ad-hoc display.
Step 6 : Again select both data items of Level and Pressure on the display. This time click on
the Trend button to add a trend to your PI ProcessBook display.
Step 7 : Do NOT save the modified PI ProcessBook display.
Step 8 : Double-click on the trend displaying the Temperatures to maximize the trend.
Step 9 : Change the display time range to cover the past 16 hours.
Step 10 : Click on the Revert button to change the time range back to 8 hours.
Step 11 : Bring a trend cursor to see the exact value of these two temperatures at about two
hours ago. After noting the trend cursor, remove it from your trend. Hide the Internal
Temperature trace, temporarily, from the trend to view the External Temperature
only.
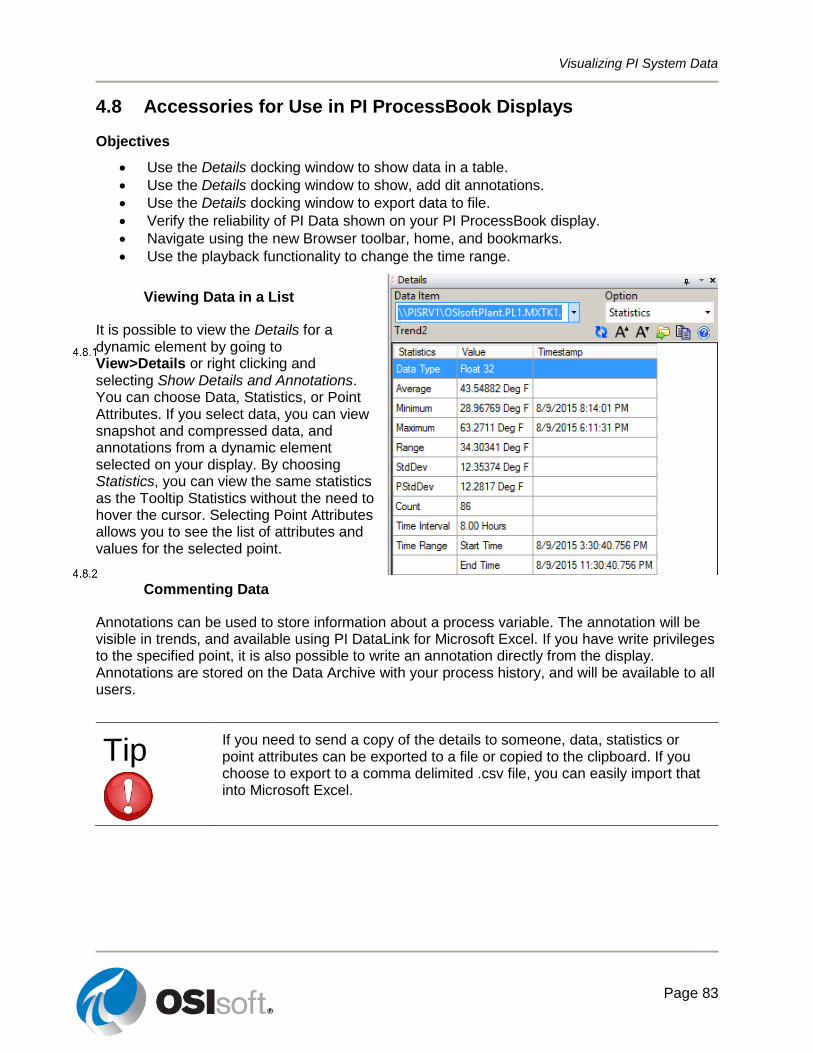
Visualizing PI System Data
Page 83
4.8 Accessories for Use in PI ProcessBook Displays
Objectives
Use the Details docking window to show data in a table.
Use the Details docking window to show, add dit annotations.
Use the Details docking window to export data to file.
Verify the reliability of PI Data shown on your PI ProcessBook display.
Navigate using the new Browser toolbar, home, and bookmarks.
Use the playback functionality to change the time range.
Viewing Data in a List
It is possible to view the Details for a dynamic element by going to View>Details or right clicking and selecting Show Details and Annotations. You can choose Data, Statistics, or Point Attributes. If you select data, you can view snapshot and compressed data, and annotations from a dynamic element selected on your display. By choosing Statistics, you can view the same statistics as the Tooltip Statistics without the need to hover the cursor. Selecting Point Attributes allows you to see the list of attributes and values for the selected point.
Commenting Data
Annotations can be used to store information about a process variable. The annotation will be visible in trends, and available using PI DataLink for Microsoft Excel. If you have write privileges to the specified point, it is also possible to write an annotation directly from the display. Annotations are stored on the Data Archive with your process history, and will be available to all users.
Tip
If you need to send a copy of the details to someone, data, statistics or point attributes can be exported to a file or copied to the clipboard. If you choose to export to a comma delimited .csv file, you can easily import that into Microsoft Excel.
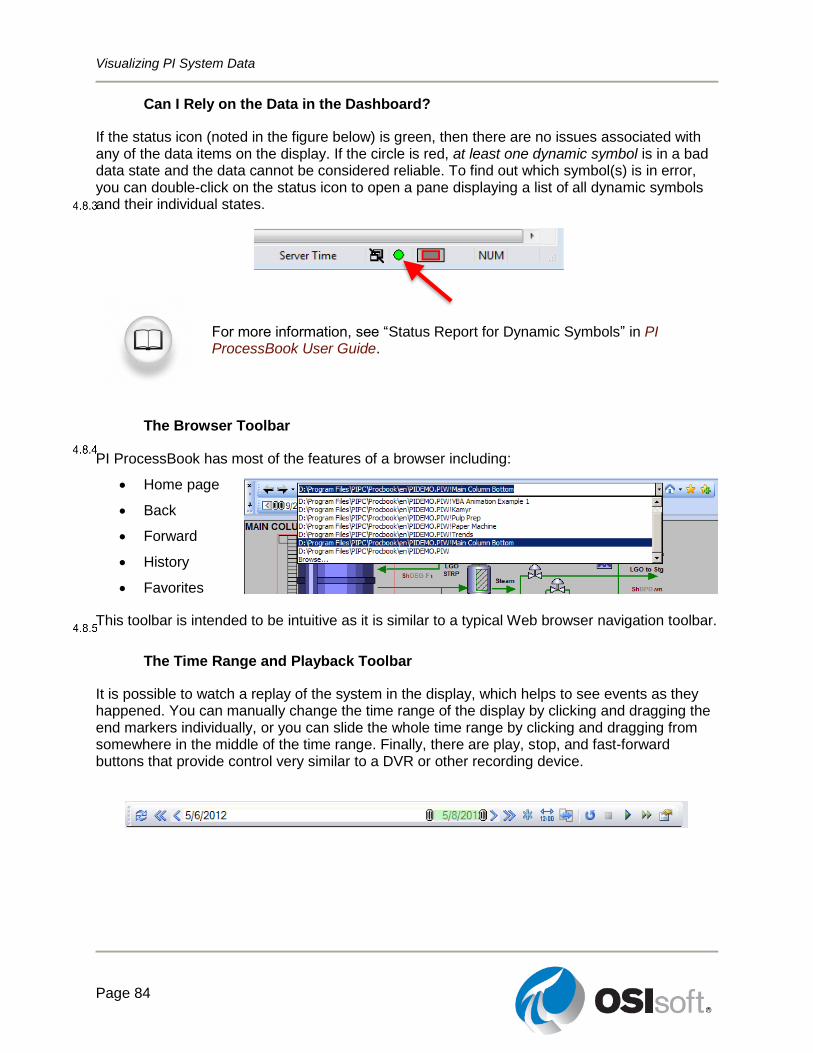
Visualizing PI System Data
Page 84
Can I Rely on the Data in the Dashboard?
If the status icon (noted in the figure below) is green, then there are no issues associated with any of the data items on the display. If the circle is red, at least one dynamic symbol is in a bad data state and the data cannot be considered reliable. To find out which symbol(s) is in error, you can double-click on the status icon to open a pane displaying a list of all dynamic symbols and their individual states.
For more information, see “Status Report for Dynamic Symbols” in PI ProcessBook User Guide.
The Browser Toolbar
PI ProcessBook has most of the features of a browser including:
Home page
Back
Forward
History
Favorites
This toolbar is intended to be intuitive as it is similar to a typical Web browser navigation toolbar.
The Time Range and Playback Toolbar
It is possible to watch a replay of the system in the display, which helps to see events as they happened. You can manually change the time range of the display by clicking and dragging the end markers individually, or you can slide the whole time range by clicking and dragging from somewhere in the middle of the time range. Finally, there are play, stop, and fast-forward buttons that provide control very similar to a DVR or other recording device.
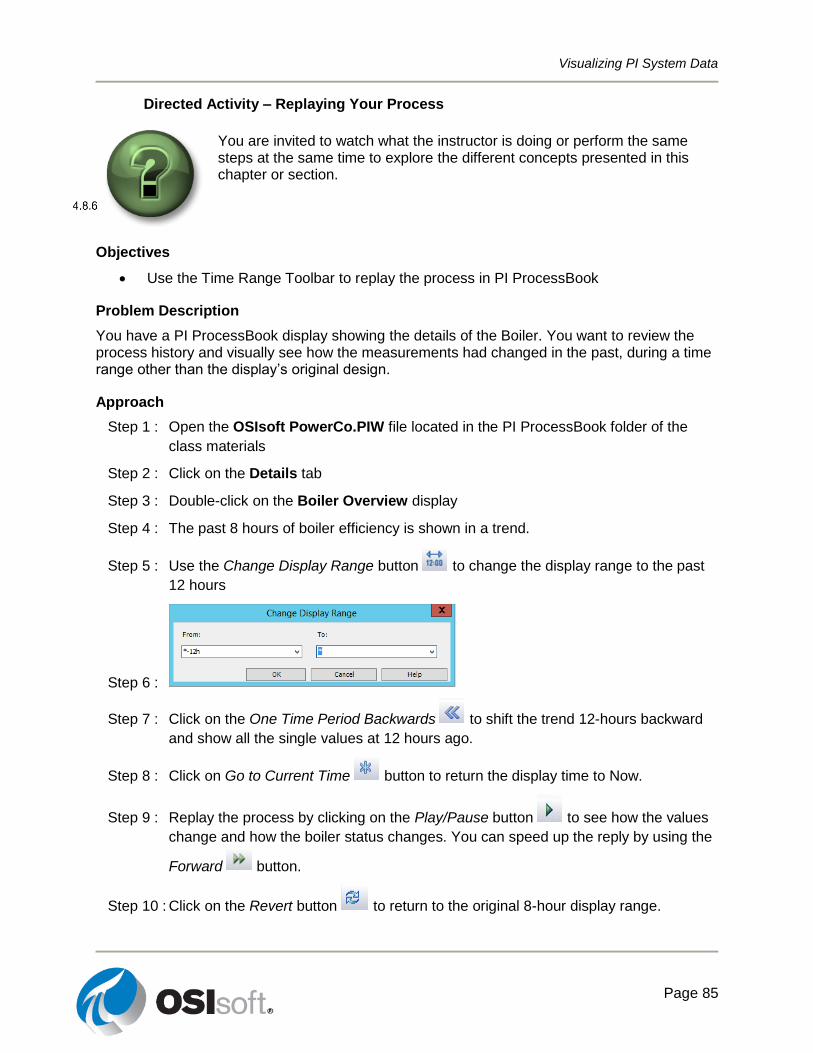
Visualizing PI System Data
Page 85
Directed Activity – Replaying Your Process
You are invited to watch what the instructor is doing or perform the same steps at the same time to explore the different concepts presented in this chapter or section.
Objectives
Use the Time Range Toolbar to replay the process in PI ProcessBook
Problem Description
You have a PI ProcessBook display showing the details of the Boiler. You want to review the process history and visually see how the measurements had changed in the past, during a time range other than the display’s original design.
Approach
Step 1 : Open the OSIsoft PowerCo.PIW file located in the PI ProcessBook folder of the
class materials
Step 2 : Click on the Details tab
Step 3 : Double-click on the Boiler Overview display
Step 4 : The past 8 hours of boiler efficiency is shown in a trend.
Step 5 : Use the Change Display Range button to change the display range to the past
12 hours
Step 6 :
Step 7 : Click on the One Time Period Backwards to shift the trend 12-hours backward
and show all the single values at 12 hours ago.
Step 8 : Click on Go to Current Time button to return the display time to Now.
Step 9 : Replay the process by clicking on the Play/Pause button to see how the values
change and how the boiler status changes. You can speed up the reply by using the
Forward button.
Step 10 : Click on the Revert button to return to the original 8-hour display range.
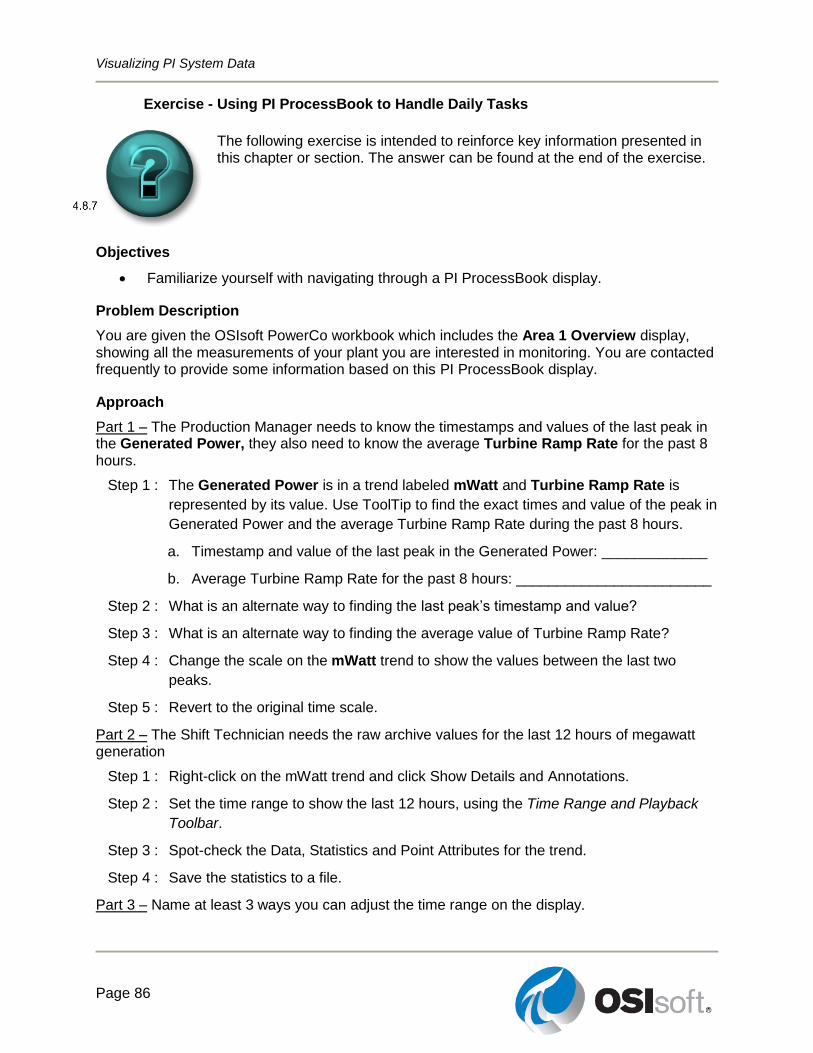
Visualizing PI System Data
Page 86
Exercise - Using PI ProcessBook to Handle Daily Tasks
The following exercise is intended to reinforce key information presented in this chapter or section. The answer can be found at the end of the exercise.
Objectives
Familiarize yourself with navigating through a PI ProcessBook display.
Problem Description
You are given the OSIsoft PowerCo workbook which includes the Area 1 Overview display, showing all the measurements of your plant you are interested in monitoring. You are contacted frequently to provide some information based on this PI ProcessBook display.
Approach
Part 1 – The Production Manager needs to know the timestamps and values of the last peak in the Generated Power, they also need to know the average Turbine Ramp Rate for the past 8 hours.
Step 1 : The Generated Power is in a trend labeled mWatt and Turbine Ramp Rate is
represented by its value. Use ToolTip to find the exact times and value of the peak in
Generated Power and the average Turbine Ramp Rate during the past 8 hours.
a. Timestamp and value of the last peak in the Generated Power: _____________
b. Average Turbine Ramp Rate for the past 8 hours: ________________________
Step 2 : What is an alternate way to finding the last peak’s timestamp and value?
Step 3 : What is an alternate way to finding the average value of Turbine Ramp Rate?
Step 4 : Change the scale on the mWatt trend to show the values between the last two
peaks.
Step 5 : Revert to the original time scale.
Part 2 – The Shift Technician needs the raw archive values for the last 12 hours of megawatt generation
Step 1 : Right-click on the mWatt trend and click Show Details and Annotations.
Step 2 : Set the time range to show the last 12 hours, using the Time Range and Playback
Toolbar.
Step 3 : Spot-check the Data, Statistics and Point Attributes for the trend.
Step 4 : Save the statistics to a file.
Part 3 – Name at least 3 ways you can adjust the time range on the display.
Visualizing PI System Data
Page 87
Building a Simple Report
5.1 PI DataLink Introduction
Objectives:
Learn what PI DataLink is used for and the common terms used when working with it.
Introduction
PI DataLink is an OSIsoft add-in for Microsoft Excel. It enables you to retrieve information from your PI System directly into a worksheet. Combined with the computational, graphic, and formatting capabilities of Microsoft Excel, PI DataLink offers powerful tools for gathering, monitoring, analyzing, and reporting PI System data.
For more information see "Introduction" in PI DataLink User Guide
PI DataLink has different functions for extracting PI System data into Excel. It is important to understand the following nomenclature when working with PI DataLink and its data retrieval functions.
Term What it means
Data item A PI Point name or AF attribute name, for which the PI DataLink function returns property values.
Root path
The common path to specified data items within PI System. It is optional for PI DataLink functions. Valid entries include:
Data Archive name if the data item is a PI Point.
AF server and database if the data item is a AF attribute. For a data item of AF Attribute, root path could also include the name of parent elements.
Blank if the data item is on the default Data Archive or the default AF Server and default database.
Output cell
The worksheet cell where the function writes the result.
If you select a cell before you open the function task pane, PI DataLink inserts the selected cell into the output cell field.
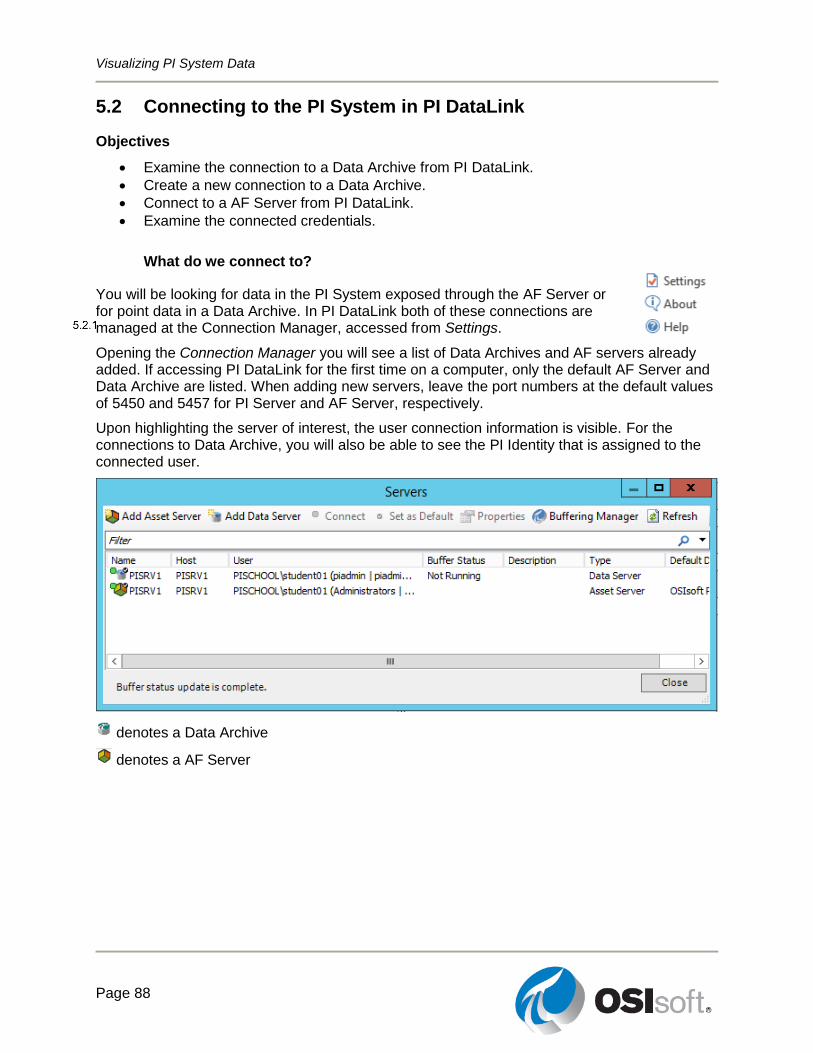
Visualizing PI System Data
Page 88
5.2 Connecting to the PI System in PI DataLink
Objectives
Examine the connection to a Data Archive from PI DataLink.
Create a new connection to a Data Archive.
Connect to a AF Server from PI DataLink.
Examine the connected credentials.
What do we connect to?
You will be looking for data in the PI System exposed through the AF Server or for point data in a Data Archive. In PI DataLink both of these connections are managed at the Connection Manager, accessed from Settings.
Opening the Connection Manager you will see a list of Data Archives and AF servers already added. If accessing PI DataLink for the first time on a computer, only the default AF Server and Data Archive are listed. When adding new servers, leave the port numbers at the default values of 5450 and 5457 for PI Server and AF Server, respectively.
Upon highlighting the server of interest, the user connection information is visible. For the connections to Data Archive, you will also be able to see the PI Identity that is assigned to the connected user.
denotes a Data Archive
denotes a AF Server
Visualizing PI System Data
Page 89
Directed Activity – Add New Data Archive and AF Server to the Connection Manager
You are invited to watch what the instructor is doing or perform the same steps at the same time to explore the different concepts presented in this chapter or section.
Objectives
Add a new Data Archive to the connections list in PI DataLink
Add a new AF Server to the connections list in PI DataLink
Problem Description
Your site has a new Data Archive and AF Server with production data you would like to use in your PI DataLink report. In order to do so, you would first need to add these servers to the servers list in PI DataLink and then test the connection to them
Data Archive name: _________________________________
AF Server name: _________________________________
Approach
Step 1 : Using Settings > Connection Manager… add the Data Archive and AF Server and
create a new connection to them.
Step 2 : How do you know you are connected to these servers?
Step 3 : What are your connection credentials for each of these servers?
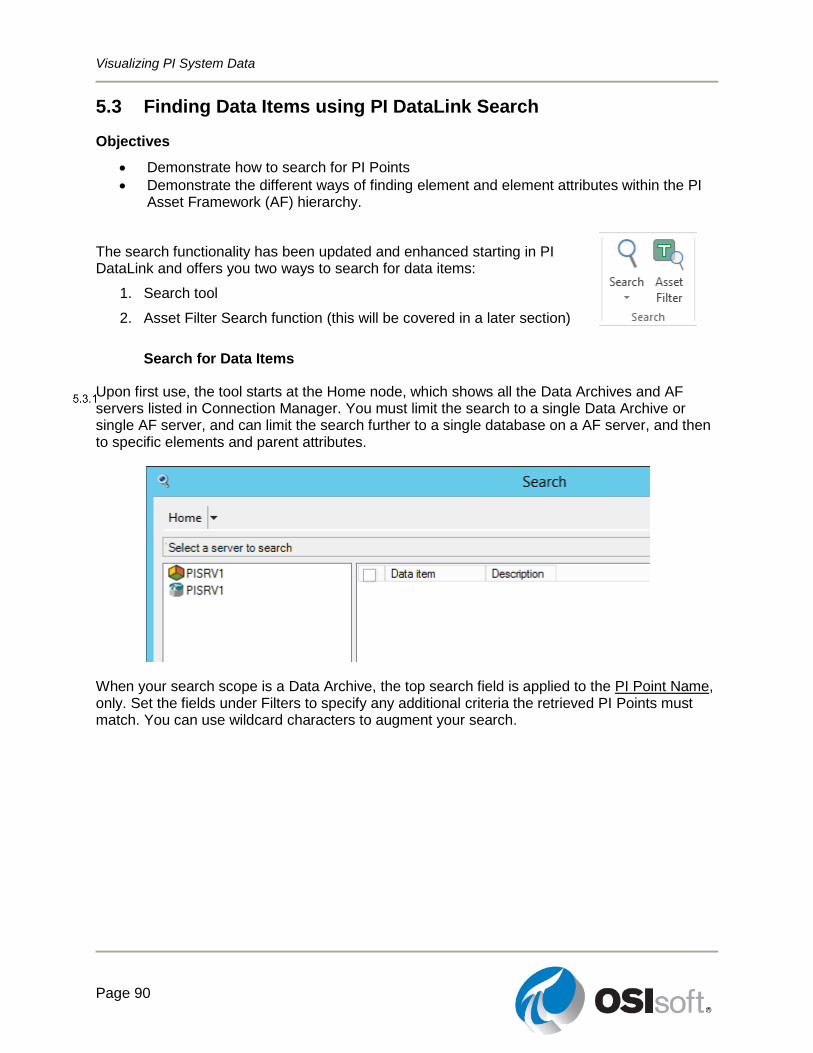
Visualizing PI System Data
Page 90
5.3 Finding Data Items using PI DataLink Search
Objectives
Demonstrate how to search for PI Points
Demonstrate the different ways of finding element and element attributes within the PI Asset Framework (AF) hierarchy.
The search functionality has been updated and enhanced starting in PI DataLink and offers you two ways to search for data items:
1. Search tool
2. Asset Filter Search function (this will be covered in a later section)
Search for Data Items
Upon first use, the tool starts at the Home node, which shows all the Data Archives and AF servers listed in Connection Manager. You must limit the search to a single Data Archive or single AF server, and can limit the search further to a single database on a AF server, and then to specific elements and parent attributes.
When your search scope is a Data Archive, the top search field is applied to the PI Point Name, only. Set the fields under Filters to specify any additional criteria the retrieved PI Points must match. You can use wildcard characters to augment your search.
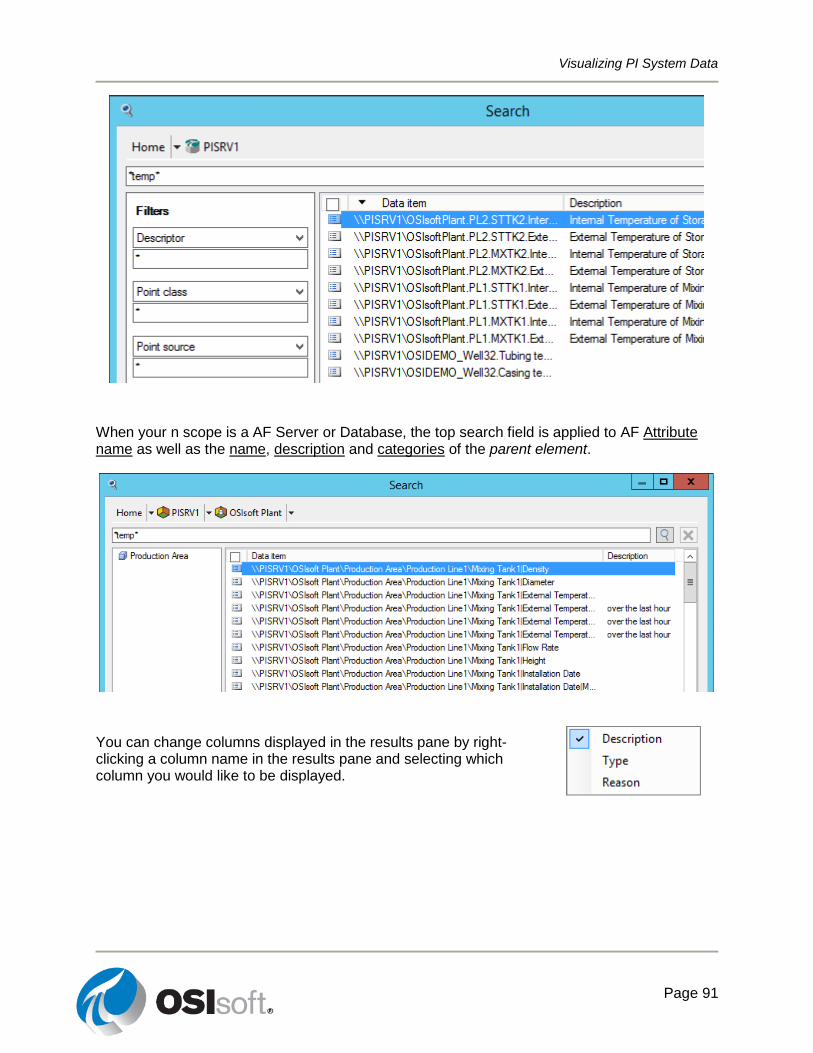
Visualizing PI System Data
Page 91
When your n scope is a AF Server or Database, the top search field is applied to AF Attribute name as well as the name, description and categories of the parent element.
You can change columns displayed in the results pane by right-clicking a column name in the results pane and selecting which column you would like to be displayed.
Visualizing PI System Data
Page 92
Directed Activity – Searching in PI DataLink
You are invited to watch what the instructor is doing or perform the same steps at the same time to explore the different concepts presented in this chapter or section.
Objectives
Perform a search for PI Points and AF Attributes in PI DataLink
Problem Description
We will need to demonstrate how to use the search functionalities.
Approach
Step 1 : Open Microsoft Excel.
Step 2 : On the PI DataLink ribbon, select Search.
Step 3 : Select a Data Archive
a. Search for sinu*
b. Choose SINUSOID and Select OK.
Step 4 : Select the AF Server >
a. Search for flow*.
b. Choose all items in the list.
Step 5 : Select OK
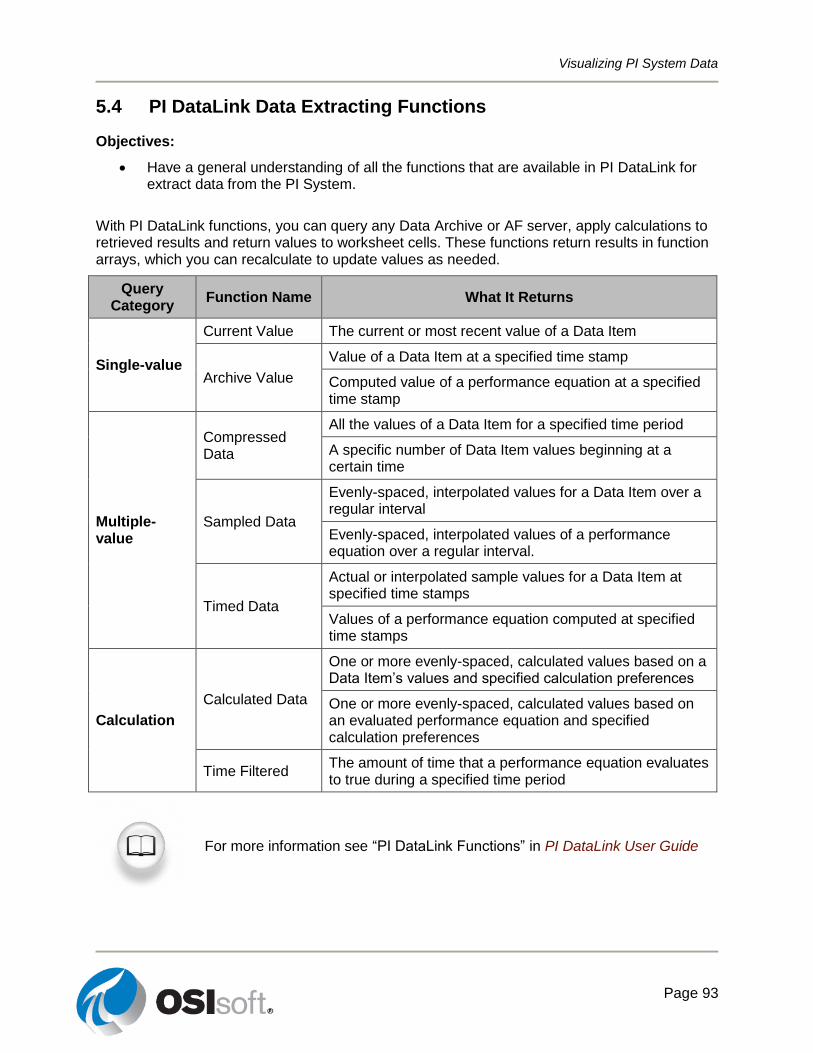
Visualizing PI System Data
Page 93
5.4 PI DataLink Data Extracting Functions
Objectives:
Have a general understanding of all the functions that are available in PI DataLink for extract data from the PI System.
With PI DataLink functions, you can query any Data Archive or AF server, apply calculations to retrieved results and return values to worksheet cells. These functions return results in function arrays, which you can recalculate to update values as needed.
Query Category
Function Name What It Returns
Single-value
Current Value The current or most recent value of a Data Item
Archive Value
Value of a Data Item at a specified time stamp
Computed value of a performance equation at a specified time stamp
Multiple-value
Compressed Data
All the values of a Data Item for a specified time period
A specific number of Data Item values beginning at a certain time
Sampled Data
Evenly-spaced, interpolated values for a Data Item over a regular interval
Evenly-spaced, interpolated values of a performance equation over a regular interval.
Timed Data
Actual or interpolated sample values for a Data Item at specified time stamps
Values of a performance equation computed at specified time stamps
Calculation
Calculated Data
One or more evenly-spaced, calculated values based on a Data Item’s values and specified calculation preferences
One or more evenly-spaced, calculated values based on an evaluated performance equation and specified calculation preferences
Time Filtered The amount of time that a performance equation evaluates to true during a specified time period
For more information see “PI DataLink Functions” in PI DataLink User Guide
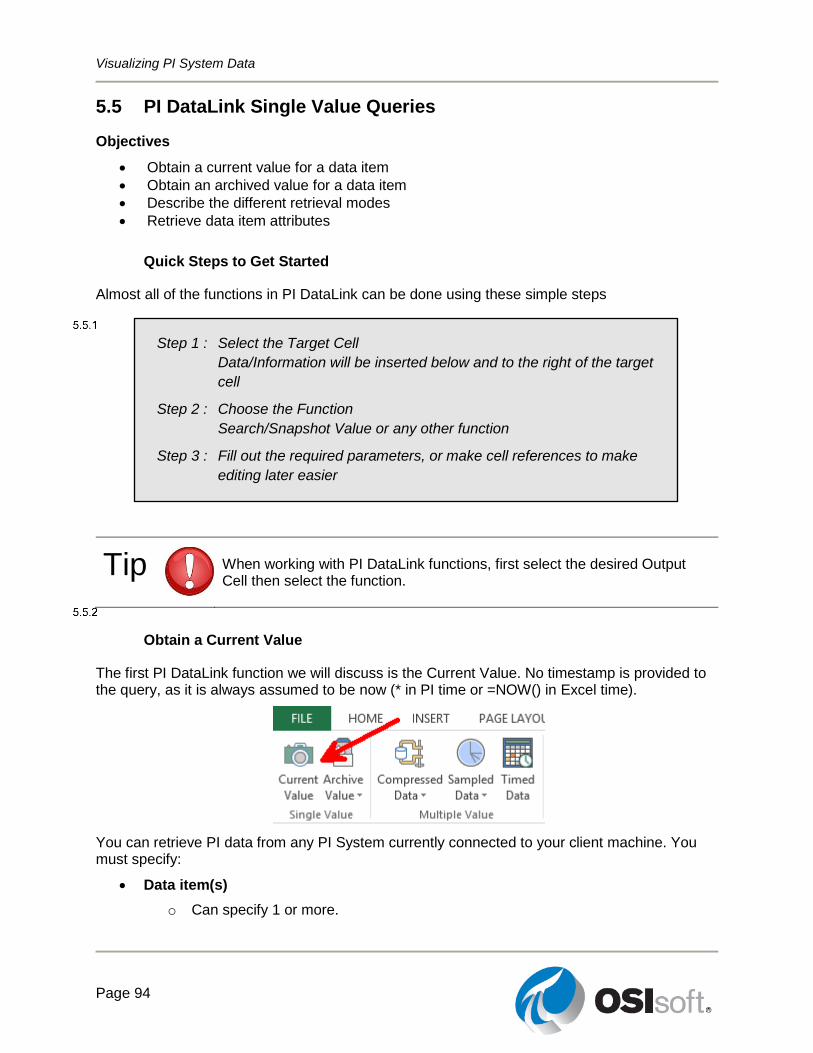
Visualizing PI System Data
Page 94
5.5 PI DataLink Single Value Queries
Objectives
Obtain a current value for a data item
Obtain an archived value for a data item
Describe the different retrieval modes
Retrieve data item attributes
Quick Steps to Get Started
Almost all of the functions in PI DataLink can be done using these simple steps
Tip
When working with PI DataLink functions, first select the desired Output Cell then select the function.
Obtain a Current Value
The first PI DataLink function we will discuss is the Current Value. No timestamp is provided to the query, as it is always assumed to be now (* in PI time or =NOW() in Excel time).
You can retrieve PI data from any PI System currently connected to your client machine. You must specify:
Data item(s)
o Can specify 1 or more.
Step 1 : Select the Target Cell
Data/Information will be inserted below and to the right of the target
cell
Step 2 : Choose the Function
Search/Snapshot Value or any other function
Step 3 : Fill out the required parameters, or make cell references to make
editing later easier
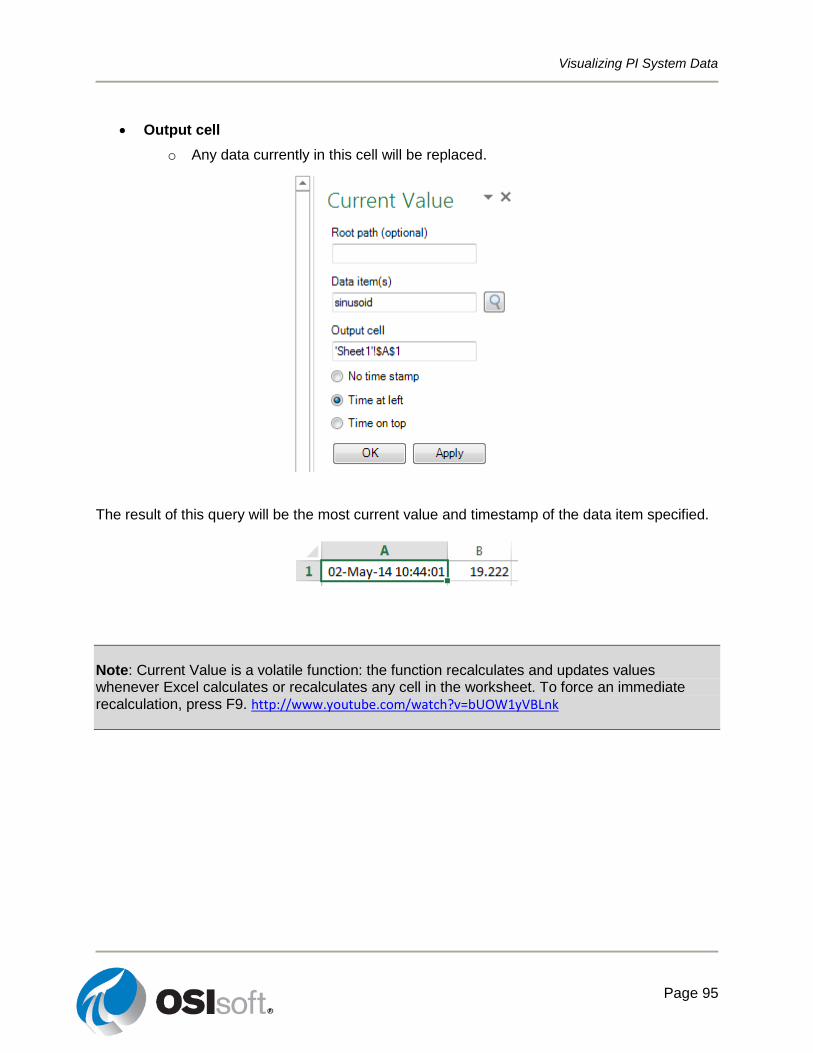
Visualizing PI System Data
Page 95
Output cell
o Any data currently in this cell will be replaced.
The result of this query will be the most current value and timestamp of the data item specified.
Note: Current Value is a volatile function: the function recalculates and updates values whenever Excel calculates or recalculates any cell in the worksheet. To force an immediate recalculation, press F9. http://www.youtube.com/watch?v=bUOW1yVBLnk
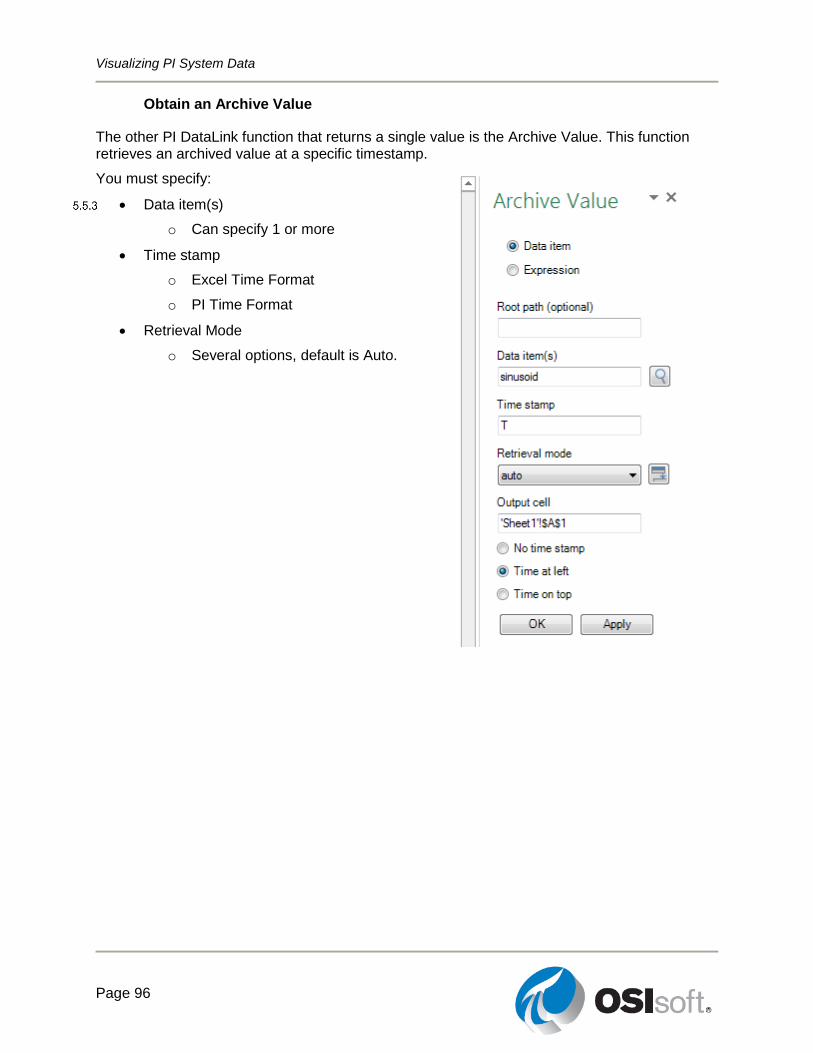
Visualizing PI System Data
Page 96
Obtain an Archive Value
The other PI DataLink function that returns a single value is the Archive Value. This function retrieves an archived value at a specific timestamp.
You must specify:
Data item(s)
o Can specify 1 or more
Time stamp
o Excel Time Format
o PI Time Format
Retrieval Mode
o Several options, default is Auto.
Visualizing PI System Data
Page 97
Directed Activity – Single Value Query
You are invited to watch what the instructor is doing or perform the same steps at the same time to explore the different concepts presented in this chapter or section.
Objectives
Perform a Single Value Query in PI DataLink
Problem Description
We would like to prepare a report that shows the current value of External Temperature, Pressure and Flow Rate of Mixing Tank2. You are also interested in knowing the value of these measurements at 7 am yesterday.
Approach
Part 1 – Get Current Values
Step 1 : Open Microsoft Excel.
Step 2 : In Cell A1 type Current Values.
Step 3 : Click on Cell A2. Select Current Value function.
Step 4 : Click on the magnifying glass next to Data Item(s) box.
Step 5 : Search for the External Temperature of Mixing Tank2.
Step 6 : Select Time at Left and click OK.
Step 7 : Repeat these steps for Pressure and Flow Rate in cells A3 and A4, respectively.
Part 2 – Add Archive Values
Step 1 : In Cell C1 type Archive Values.
Step 2 : Click on Cell C2. Select Archive Value function.
Step 3 : Click on the magnifying glass next to Data Item(s) box.
Step 4 : Search for the External Temperature of Mixing Tank2.
Step 5 : Type Y+7h in the Time stamp box.
Step 6 : Select Time at Left and click OK.
Step 7 : Repeat these steps for Pressure and Flow Rate in cells C3 and C4, respectively.
Part 3 – Do you think it is an efficient way to search for the data item every time a value is
retrieved?
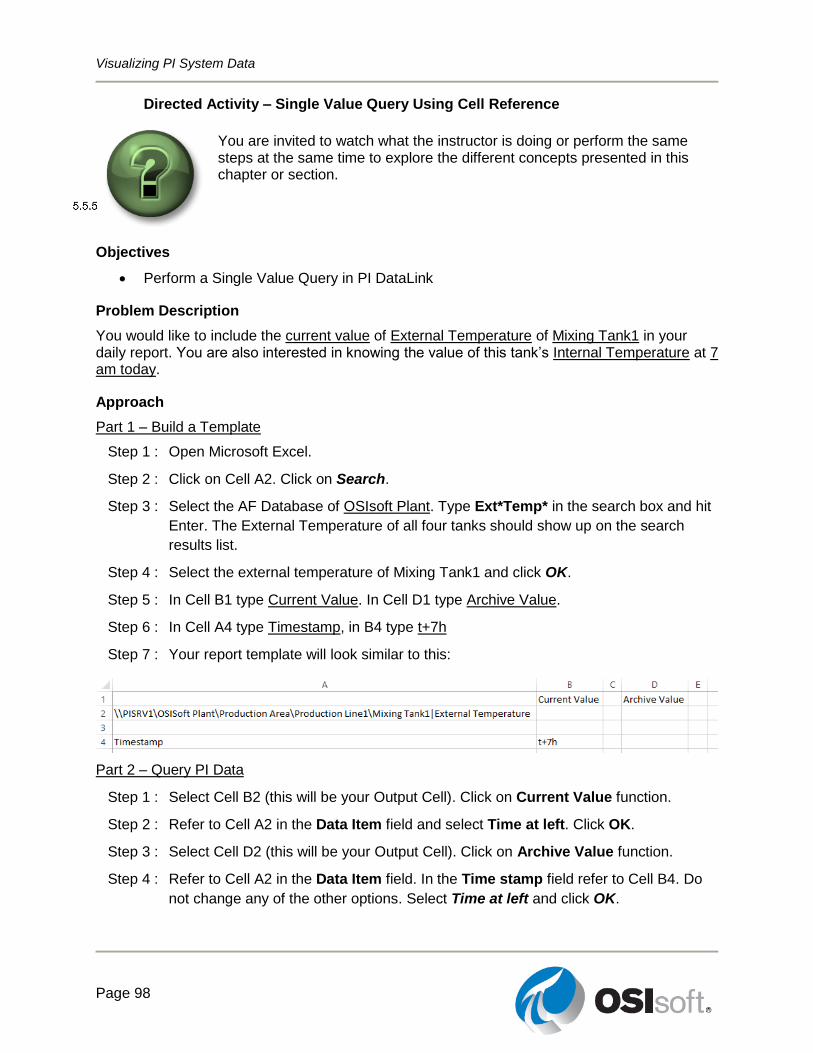
Visualizing PI System Data
Page 98
Directed Activity – Single Value Query Using Cell Reference
You are invited to watch what the instructor is doing or perform the same steps at the same time to explore the different concepts presented in this chapter or section.
Objectives
Perform a Single Value Query in PI DataLink
Problem Description
You would like to include the current value of External Temperature of Mixing Tank1 in your daily report. You are also interested in knowing the value of this tank’s Internal Temperature at 7 am today.
Approach
Part 1 – Build a Template
Step 1 : Open Microsoft Excel.
Step 2 : Click on Cell A2. Click on Search.
Step 3 : Select the AF Database of OSIsoft Plant. Type Ext*Temp* in the search box and hit
Enter. The External Temperature of all four tanks should show up on the search
results list.
Step 4 : Select the external temperature of Mixing Tank1 and click OK.
Step 5 : In Cell B1 type Current Value. In Cell D1 type Archive Value.
Step 6 : In Cell A4 type Timestamp, in B4 type t+7h
Step 7 : Your report template will look similar to this:
Part 2 – Query PI Data
Step 1 : Select Cell B2 (this will be your Output Cell). Click on Current Value function.
Step 2 : Refer to Cell A2 in the Data Item field and select Time at left. Click OK.
Step 3 : Select Cell D2 (this will be your Output Cell). Click on Archive Value function.
Step 4 : Refer to Cell A2 in the Data Item field. In the Time stamp field refer to Cell B4. Do
not change any of the other options. Select Time at left and click OK.
Visualizing PI System Data
Page 99
Exercise –Temperature at a Glance
This solo or group activity is designed to maximize learning in a specific topic area. Your instructor will have instructions, and will coach you if you need assistance during the activity.
Objectives
Extract values and attributes from the PI System using the following functions:
o Current value. o Archive value.
Problem Description
You would like to include the current value of the External Temperature of all Tanks in your daily report. You are also interested in knowing the value of the tanks’ Internal Temperature at 7 am today.
Approach
Step 1 : Open the file PI_DataLink-Exercises.xlsx.
Step 2 : Save it as PI_DataLink-Exercises_<YourInitials>.xlsx then work on sheet
Temperature at a Glance and fill in data into all of the fields.
Step 3 : Use the Current Value and Archive Value queries to fill in the template. We should
base our PI DataLink queries on cell references whenever possible.
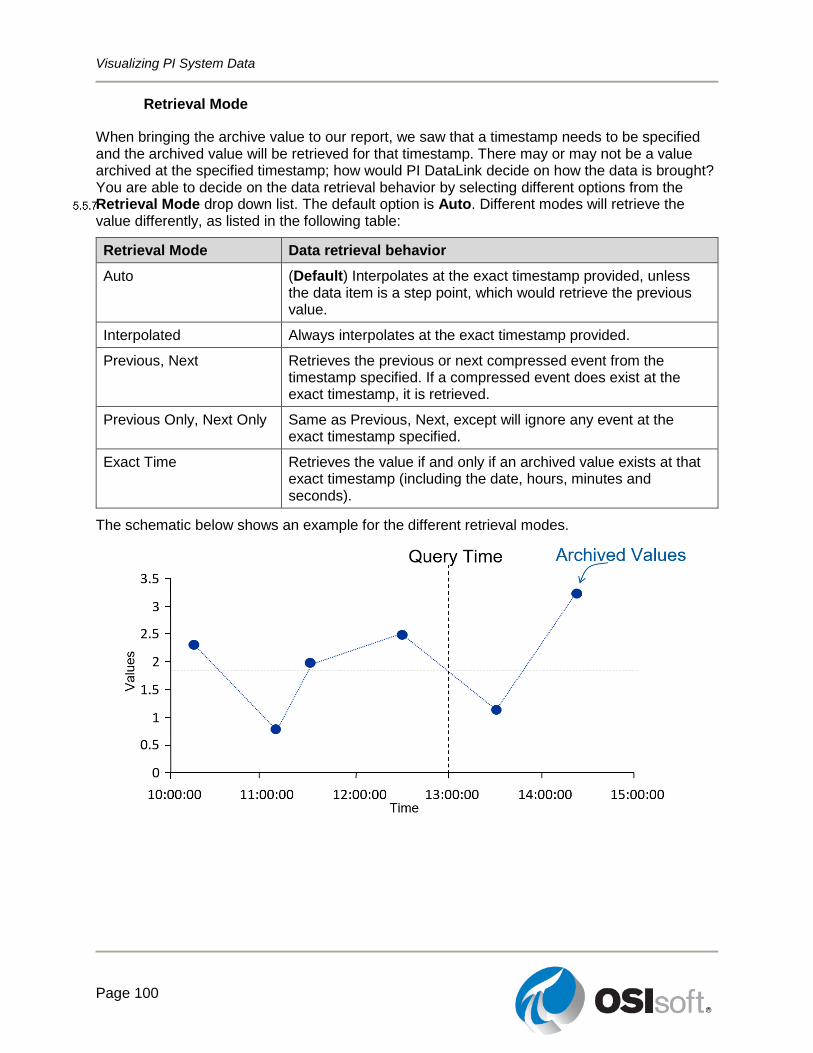
Visualizing PI System Data
Page 100
Retrieval Mode
When bringing the archive value to our report, we saw that a timestamp needs to be specified and the archived value will be retrieved for that timestamp. There may or may not be a value archived at the specified timestamp; how would PI DataLink decide on how the data is brought? You are able to decide on the data retrieval behavior by selecting different options from the Retrieval Mode drop down list. The default option is Auto. Different modes will retrieve the value differently, as listed in the following table:
Retrieval Mode Data retrieval behavior
Auto (Default) Interpolates at the exact timestamp provided, unless the data item is a step point, which would retrieve the previous value.
Interpolated Always interpolates at the exact timestamp provided.
Previous, Next Retrieves the previous or next compressed event from the timestamp specified. If a compressed event does exist at the exact timestamp, it is retrieved.
Previous Only, Next Only Same as Previous, Next, except will ignore any event at the exact timestamp specified.
Exact Time Retrieves the value if and only if an archived value exists at that exact timestamp (including the date, hours, minutes and seconds).
The schematic below shows an example for the different retrieval modes.
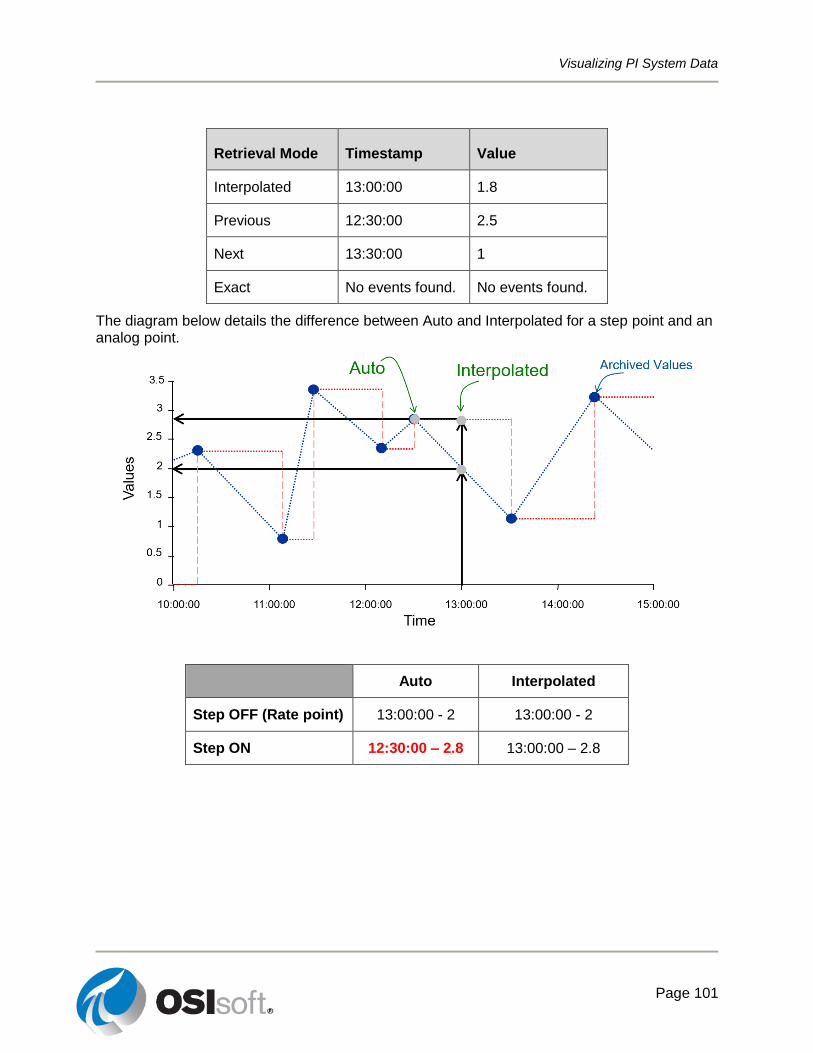
Visualizing PI System Data
Page 101
Retrieval Mode Timestamp Value
Interpolated 13:00:00 1.8
Previous 12:30:00 2.5
Next 13:30:00 1
Exact No events found. No events found.
The diagram below details the difference between Auto and Interpolated for a step point and an analog point.
Auto Interpolated
Step OFF (Rate point) 13:00:00 - 2 13:00:00 - 2
Step ON 12:30:00 – 2.8 13:00:00 – 2.8
Visualizing PI System Data
Page 102
Exercise – Activity Report
This solo or group activity is designed to maximize learning in a specific topic area. Your instructor will have instructions, and will coach you if you need assistance during the activity.
Objective
Extract values and attributes from the PI System using the following functions:
o Current value. o Archive value.
Problem Description
Your manager needs a report they can open each afternoon to see the current values of KPI’s for Mixing Tank2, which are:
External Temperature
Internal Temperature
Level
Flow Rate
Your manager needs to see the KPIs values at 9 AM this morning. Not trusting this new “PI Thing” your manager wants to see archive values around 9 AM as well as be able to type in a timestamp and see if there is an archive value at an exact time.
Approach
Step 1 : Open PI_DataLink-Exercises_<YourInitials>.xlsx then work on sheet Activity Report
and fill in data into all of the fields.
Step 2 : Use the Current Value and Archive Value queries to fill in a template.
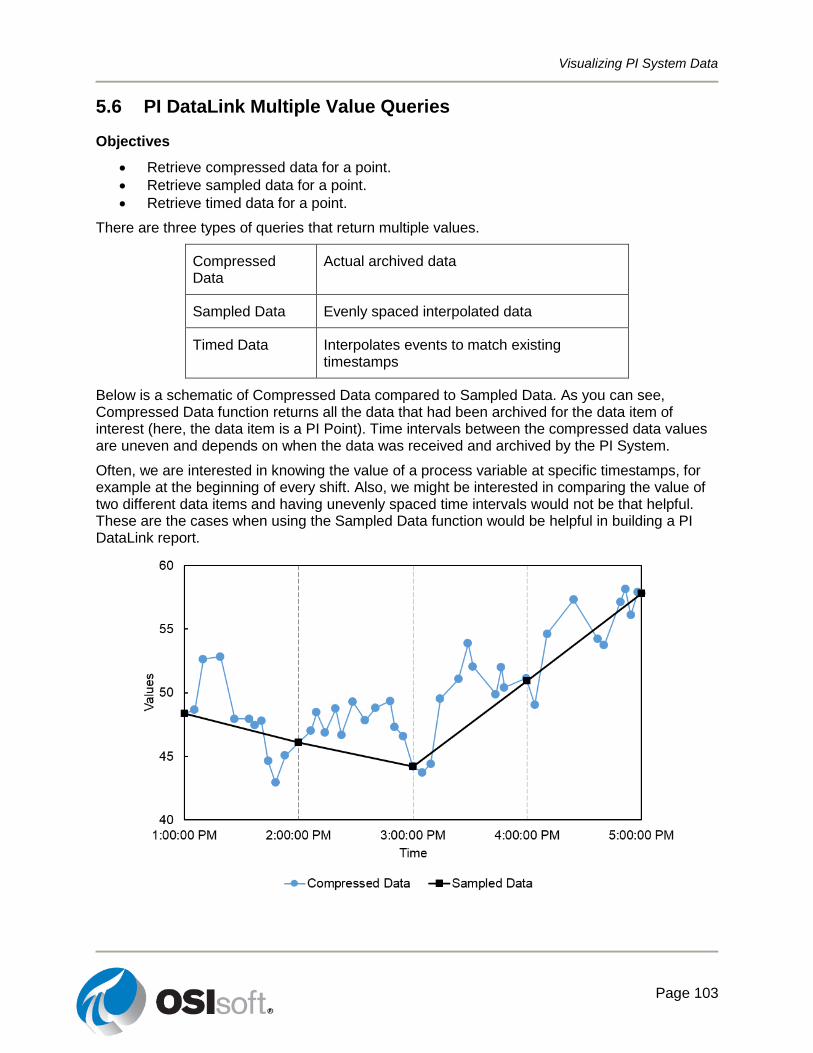
Visualizing PI System Data
Page 103
5.6 PI DataLink Multiple Value Queries
Objectives
Retrieve compressed data for a point.
Retrieve sampled data for a point.
Retrieve timed data for a point.
There are three types of queries that return multiple values.
Compressed Data
Actual archived data
Sampled Data Evenly spaced interpolated data
Timed Data Interpolates events to match existing timestamps
Below is a schematic of Compressed Data compared to Sampled Data. As you can see, Compressed Data function returns all the data that had been archived for the data item of interest (here, the data item is a PI Point). Time intervals between the compressed data values are uneven and depends on when the data was received and archived by the PI System.
Often, we are interested in knowing the value of a process variable at specific timestamps, for example at the beginning of every shift. Also, we might be interested in comparing the value of two different data items and having unevenly spaced time intervals would not be that helpful. These are the cases when using the Sampled Data function would be helpful in building a PI DataLink report.
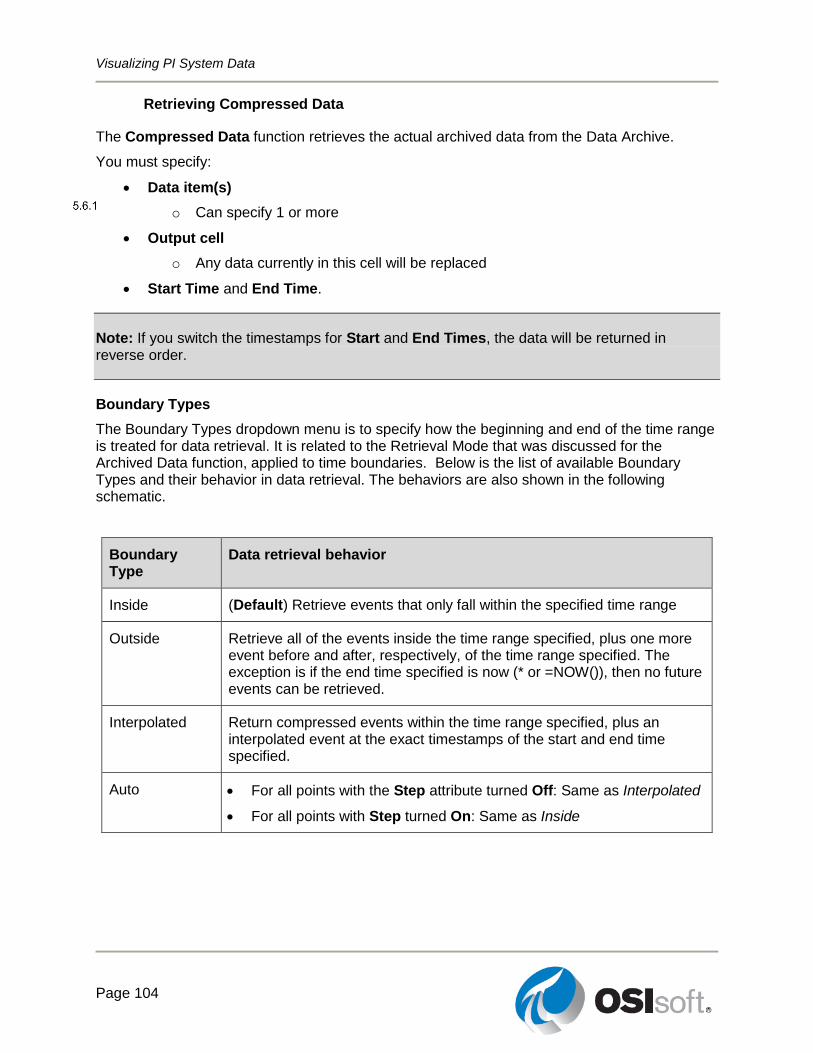
Visualizing PI System Data
Page 104
Retrieving Compressed Data
The Compressed Data function retrieves the actual archived data from the Data Archive.
You must specify:
Data item(s)
o Can specify 1 or more
Output cell
o Any data currently in this cell will be replaced
Start Time and End Time.
Note: If you switch the timestamps for Start and End Times, the data will be returned in reverse order.
Boundary Types
The Boundary Types dropdown menu is to specify how the beginning and end of the time range is treated for data retrieval. It is related to the Retrieval Mode that was discussed for the Archived Data function, applied to time boundaries. Below is the list of available Boundary Types and their behavior in data retrieval. The behaviors are also shown in the following schematic.
Boundary Type
Data retrieval behavior
Inside (Default) Retrieve events that only fall within the specified time range
Outside Retrieve all of the events inside the time range specified, plus one more event before and after, respectively, of the time range specified. The exception is if the end time specified is now (* or =NOW()), then no future events can be retrieved.
Interpolated Return compressed events within the time range specified, plus an interpolated event at the exact timestamps of the start and end time specified.
Auto For all points with the Step attribute turned Off: Same as Interpolated
For all points with Step turned On: Same as Inside
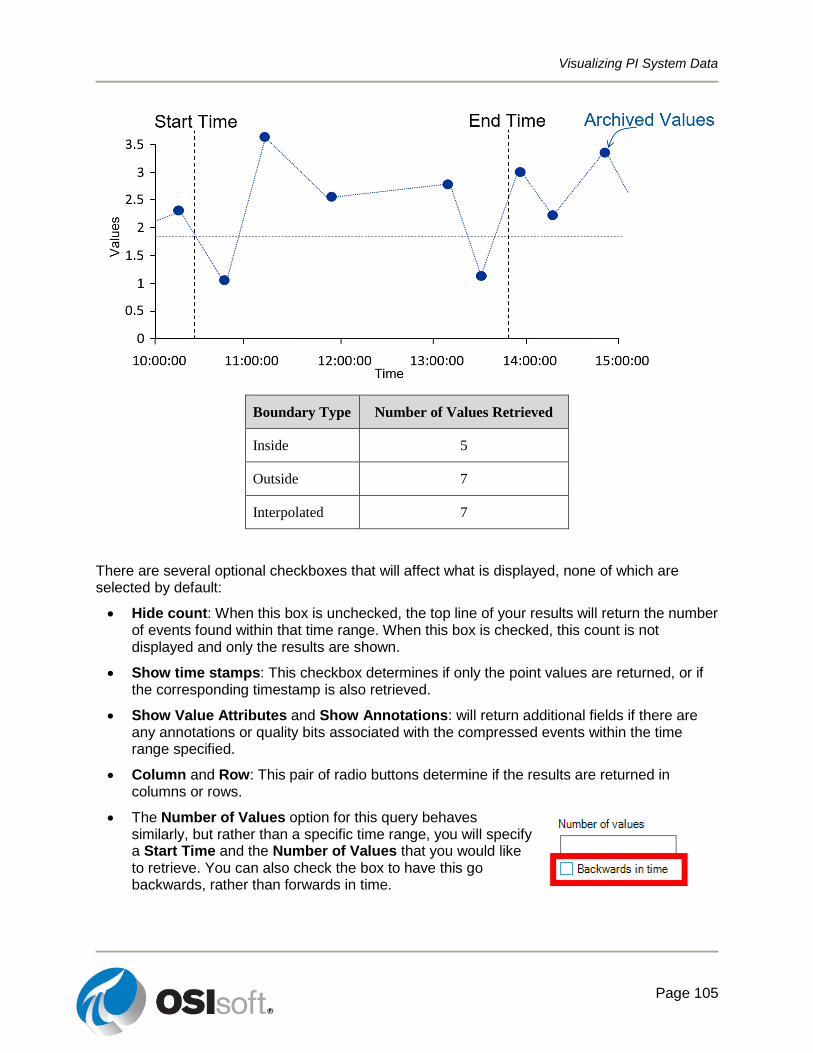
Visualizing PI System Data
Page 105
Boundary Type Number of Values Retrieved
Inside 5
Outside 7
Interpolated 7
There are several optional checkboxes that will affect what is displayed, none of which are selected by default:
Hide count: When this box is unchecked, the top line of your results will return the number of events found within that time range. When this box is checked, this count is not displayed and only the results are shown.
Show time stamps: This checkbox determines if only the point values are returned, or if the corresponding timestamp is also retrieved.
Show Value Attributes and Show Annotations: will return additional fields if there are any annotations or quality bits associated with the compressed events within the time range specified.
Column and Row: This pair of radio buttons determine if the results are returned in columns or rows.
The Number of Values option for this query behaves similarly, but rather than a specific time range, you will specify a Start Time and the Number of Values that you would like to retrieve. You can also check the box to have this go backwards, rather than forwards in time.
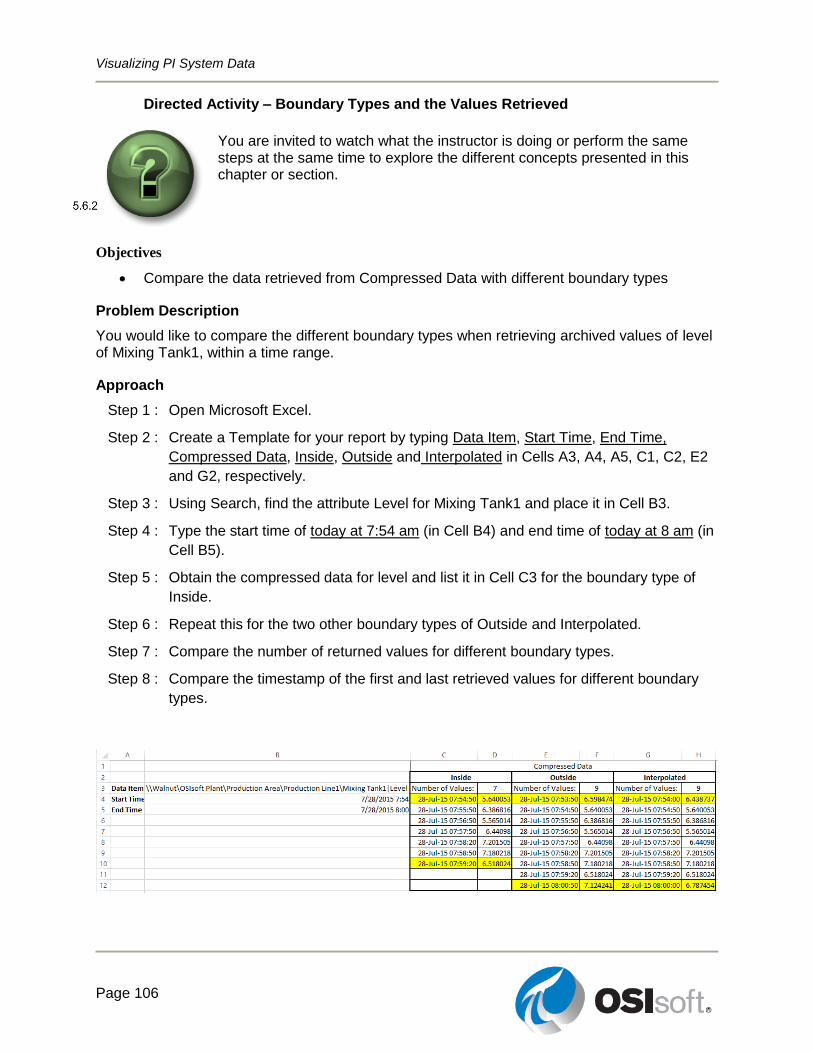
Visualizing PI System Data
Page 106
Directed Activity – Boundary Types and the Values Retrieved
You are invited to watch what the instructor is doing or perform the same steps at the same time to explore the different concepts presented in this chapter or section.
Objectives
Compare the data retrieved from Compressed Data with different boundary types
Problem Description
You would like to compare the different boundary types when retrieving archived values of level of Mixing Tank1, within a time range.
Approach
Step 1 : Open Microsoft Excel.
Step 2 : Create a Template for your report by typing Data Item, Start Time, End Time,
Compressed Data, Inside, Outside and Interpolated in Cells A3, A4, A5, C1, C2, E2
and G2, respectively.
Step 3 : Using Search, find the attribute Level for Mixing Tank1 and place it in Cell B3.
Step 4 : Type the start time of today at 7:54 am (in Cell B4) and end time of today at 8 am (in
Cell B5).
Step 5 : Obtain the compressed data for level and list it in Cell C3 for the boundary type of
Inside.
Step 6 : Repeat this for the two other boundary types of Outside and Interpolated.
Step 7 : Compare the number of returned values for different boundary types.
Step 8 : Compare the timestamp of the first and last retrieved values for different boundary
types.
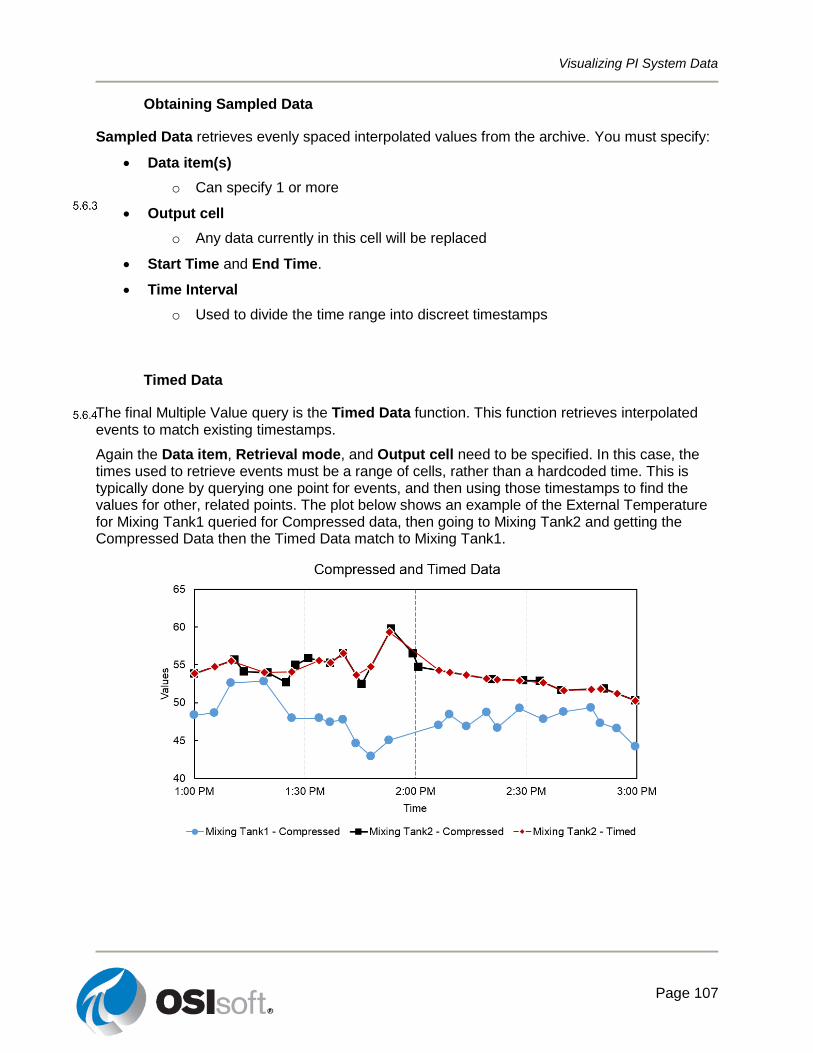
Visualizing PI System Data
Page 107
Obtaining Sampled Data
Sampled Data retrieves evenly spaced interpolated values from the archive. You must specify:
Data item(s)
o Can specify 1 or more
Output cell
o Any data currently in this cell will be replaced
Start Time and End Time.
Time Interval
o Used to divide the time range into discreet timestamps
Timed Data
The final Multiple Value query is the Timed Data function. This function retrieves interpolated events to match existing timestamps.
Again the Data item, Retrieval mode, and Output cell need to be specified. In this case, the times used to retrieve events must be a range of cells, rather than a hardcoded time. This is typically done by querying one point for events, and then using those timestamps to find the values for other, related points. The plot below shows an example of the External Temperature for Mixing Tank1 queried for Compressed data, then going to Mixing Tank2 and getting the Compressed Data then the Timed Data match to Mixing Tank1.
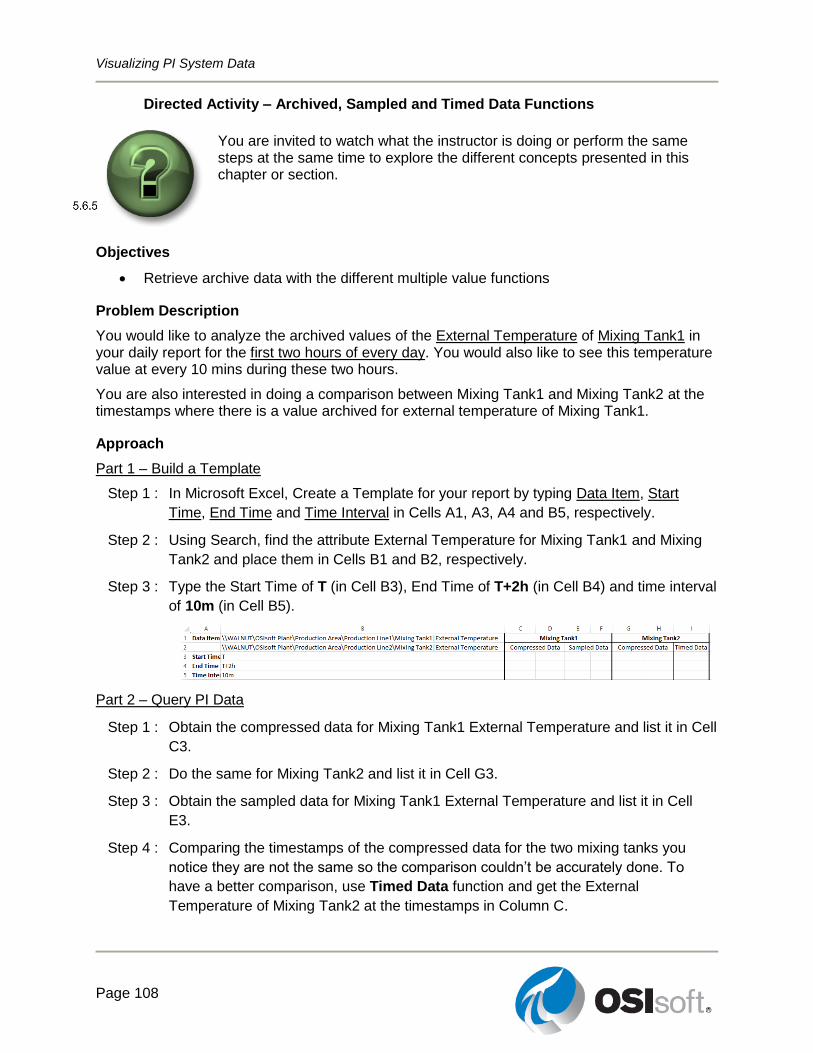
Visualizing PI System Data
Page 108
Directed Activity – Archived, Sampled and Timed Data Functions
You are invited to watch what the instructor is doing or perform the same steps at the same time to explore the different concepts presented in this chapter or section.
Objectives
Retrieve archive data with the different multiple value functions
Problem Description
You would like to analyze the archived values of the External Temperature of Mixing Tank1 in your daily report for the first two hours of every day. You would also like to see this temperature value at every 10 mins during these two hours.
You are also interested in doing a comparison between Mixing Tank1 and Mixing Tank2 at the timestamps where there is a value archived for external temperature of Mixing Tank1.
Approach
Part 1 – Build a Template
Step 1 : In Microsoft Excel, Create a Template for your report by typing Data Item, Start
Time, End Time and Time Interval in Cells A1, A3, A4 and B5, respectively.
Step 2 : Using Search, find the attribute External Temperature for Mixing Tank1 and Mixing
Tank2 and place them in Cells B1 and B2, respectively.
Step 3 : Type the Start Time of T (in Cell B3), End Time of T+2h (in Cell B4) and time interval
of 10m (in Cell B5).
Part 2 – Query PI Data
Step 1 : Obtain the compressed data for Mixing Tank1 External Temperature and list it in Cell
C3.
Step 2 : Do the same for Mixing Tank2 and list it in Cell G3.
Step 3 : Obtain the sampled data for Mixing Tank1 External Temperature and list it in Cell
E3.
Step 4 : Comparing the timestamps of the compressed data for the two mixing tanks you
notice they are not the same so the comparison couldn’t be accurately done. To
have a better comparison, use Timed Data function and get the External
Temperature of Mixing Tank2 at the timestamps in Column C.
Visualizing PI System Data
Page 109
Exercise – Tank Analysis Report
This solo or group activity is designed to maximize learning in a specific topic area. Your instructor will have instructions, and will coach you if you need assistance during the activity.
Objective
Extract values and attributes from the PI System using the following functions:
o Compressed Data. o Sampled Data.
Problem Description
You would like to have the archived values of the Pressure of the two Mixing Tanks listed in your daily report for the period of the past 24 hours. Getting all of the raw archived data for this process variable, you would prefer to see one value each hour for the past 24 hrs.
You will use this report to do some analysis on this critical process variable of the mixing tanks.
Approach
Step 1 : Spend a few minutes and fill out the following table:
Data Item
Start Time
End Time
Time Interval
Step 2 : Open PI_DataLink-Exercises_<YourInitials>.xlsx then work on sheet Tank Analysis
Report and fill in data into all of the fields.
Step 3 : We will use the Compressed Data and Sampled Data queries to fill in a template.
Bonus
Using Excel functions, modify your report such that you get one value at the top of each hour for
the past 24 hours.
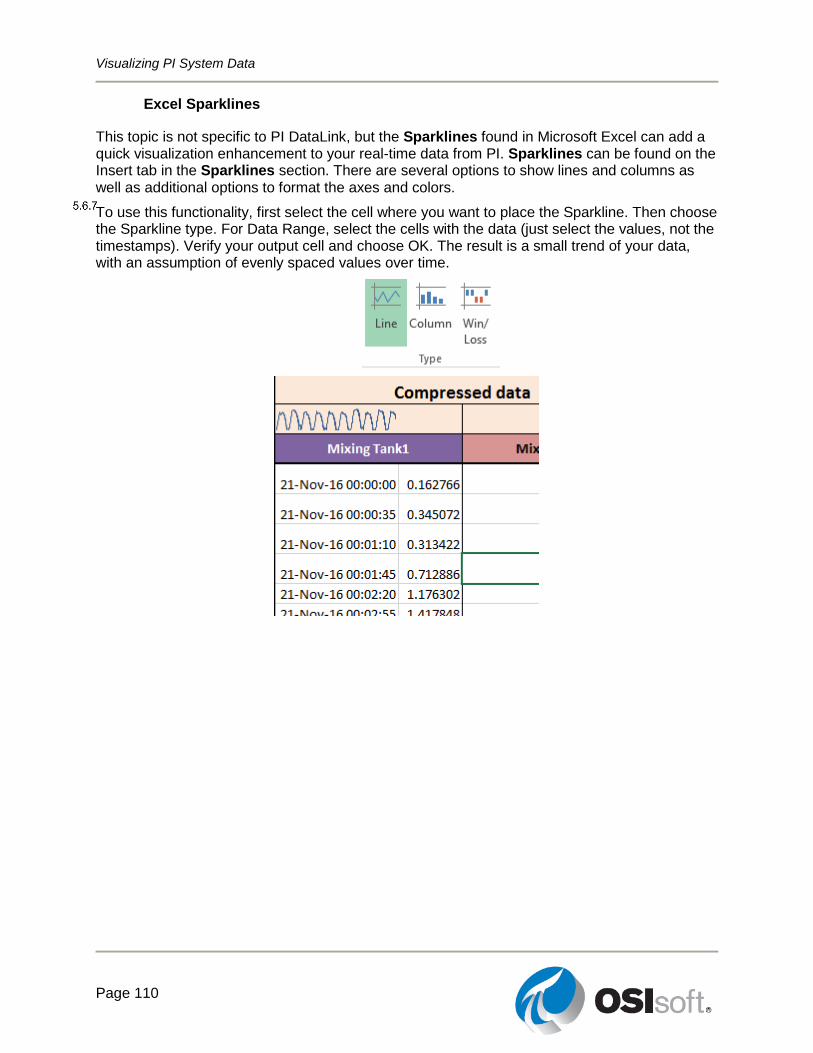
Visualizing PI System Data
Page 110
Excel Sparklines
This topic is not specific to PI DataLink, but the Sparklines found in Microsoft Excel can add a quick visualization enhancement to your real-time data from PI. Sparklines can be found on the Insert tab in the Sparklines section. There are several options to show lines and columns as well as additional options to format the axes and colors.
To use this functionality, first select the cell where you want to place the Sparkline. Then choose the Sparkline type. For Data Range, select the cells with the data (just select the values, not the timestamps). Verify your output cell and choose OK. The result is a small trend of your data, with an assumption of evenly spaced values over time.
Visualizing PI System Data
Page 111
Directed Activity – Multiple Value Queries
You are invited to watch what the instructor is doing or perform the same steps at the same time to explore the different concepts presented in this chapter or section.
Objectives
Determine the best multiple value query for the job
Problem Description
You just built a report to look at and analyze the values of external and internal temperatures of all mixing tanks in your plant for the past 24 hours.
Approach
Part 1
Do you think the report you built is efficient? Since the same analysis would be done on the values retrieved for the internal and external temperatures of each of the mixing tanks, do you think your report could be built in a better way?
Part 2
What if there were tens of mixing tanks in your plant and you needed to repeat the same process for each of them?
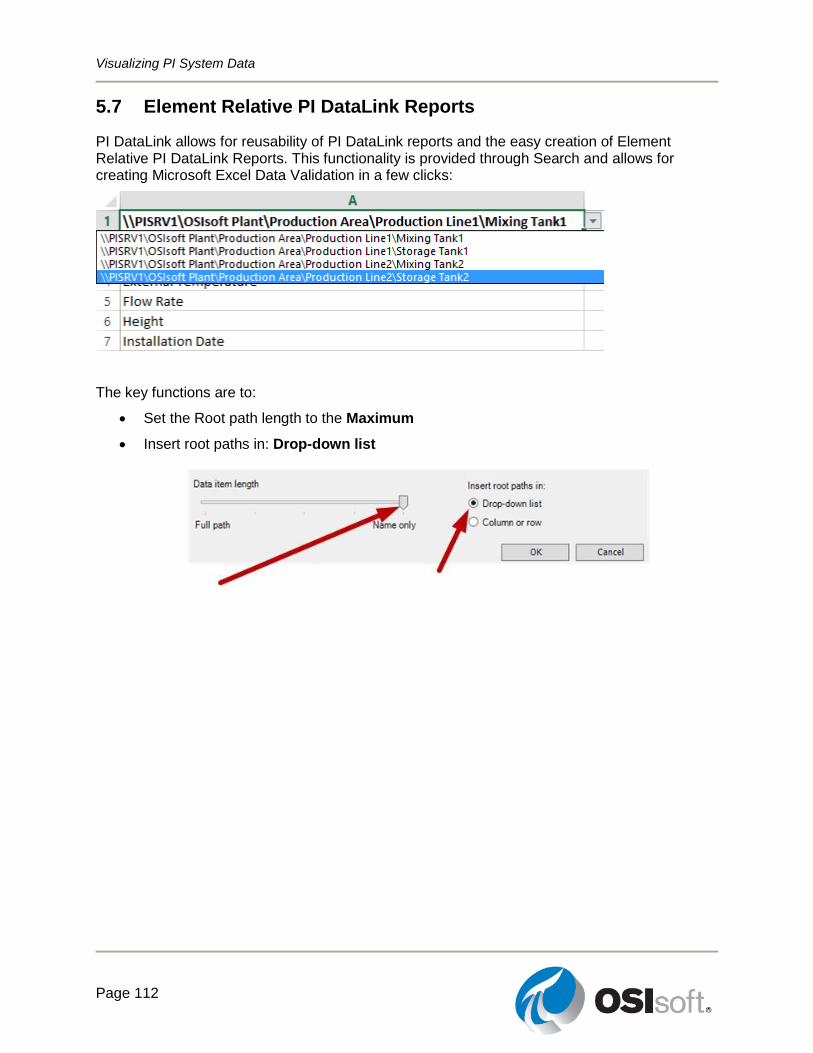
Visualizing PI System Data
Page 112
5.7 Element Relative PI DataLink Reports
PI DataLink allows for reusability of PI DataLink reports and the easy creation of Element Relative PI DataLink Reports. This functionality is provided through Search and allows for creating Microsoft Excel Data Validation in a few clicks:
The key functions are to:
Set the Root path length to the Maximum
Insert root paths in: Drop-down list
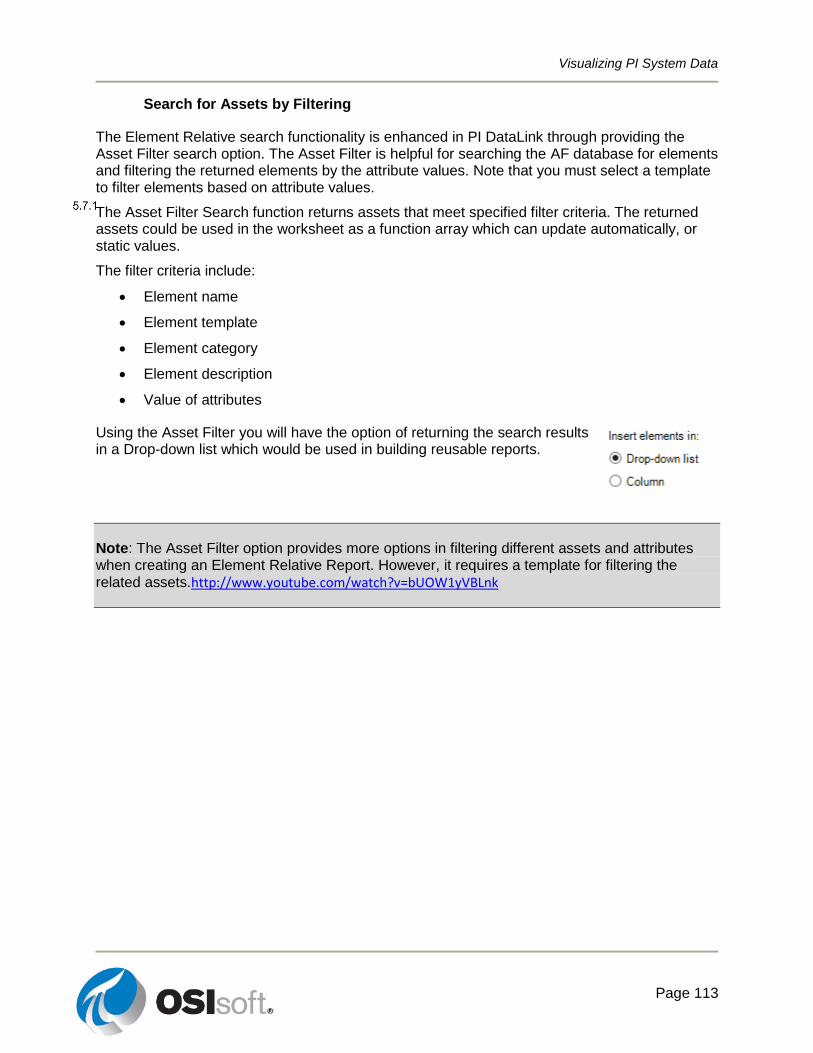
Visualizing PI System Data
Page 113
Search for Assets by Filtering
The Element Relative search functionality is enhanced in PI DataLink through providing the Asset Filter search option. The Asset Filter is helpful for searching the AF database for elements and filtering the returned elements by the attribute values. Note that you must select a template to filter elements based on attribute values.
The Asset Filter Search function returns assets that meet specified filter criteria. The returned assets could be used in the worksheet as a function array which can update automatically, or static values.
The filter criteria include:
Element name
Element template
Element category
Element description
Value of attributes
Using the Asset Filter you will have the option of returning the search results in a Drop-down list which would be used in building reusable reports.
Note: The Asset Filter option provides more options in filtering different assets and attributes when creating an Element Relative Report. However, it requires a template for filtering the related assets.http://www.youtube.com/watch?v=bUOW1yVBLnk
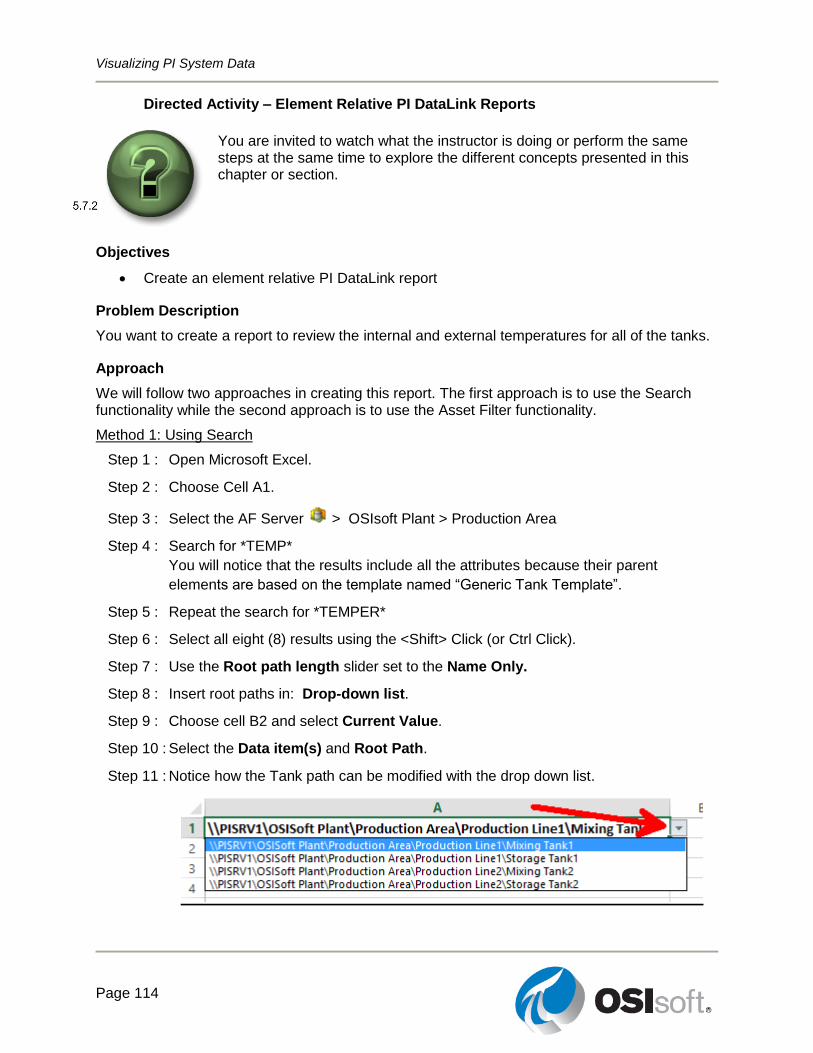
Visualizing PI System Data
Page 114
Directed Activity – Element Relative PI DataLink Reports
You are invited to watch what the instructor is doing or perform the same steps at the same time to explore the different concepts presented in this chapter or section.
Objectives
Create an element relative PI DataLink report
Problem Description
You want to create a report to review the internal and external temperatures for all of the tanks.
Approach
We will follow two approaches in creating this report. The first approach is to use the Search functionality while the second approach is to use the Asset Filter functionality.
Method 1: Using Search
Step 1 : Open Microsoft Excel.
Step 2 : Choose Cell A1.
Step 3 : Select the AF Server > OSIsoft Plant > Production Area
Step 4 : Search for *TEMP*
You will notice that the results include all the attributes because their parent
elements are based on the template named “Generic Tank Template”.
Step 5 : Repeat the search for *TEMPER*
Step 6 : Select all eight (8) results using the <Shift> Click (or Ctrl Click).
Step 7 : Use the Root path length slider set to the Name Only.
Step 8 : Insert root paths in: Drop-down list.
Step 9 : Choose cell B2 and select Current Value.
Step 10 : Select the Data item(s) and Root Path.
Step 11 : Notice how the Tank path can be modified with the drop down list.
Visualizing PI System Data
Page 115
Method 2: Using Asset Filter
Step 1 : Add a new sheet.
a. Choose Cell A2.
Important
When working with Asset Filter and selecting the Drop-down list, the drop-down list will appear in the Cell above your Output Cell. The selected Output Cell is where the selected attributes will start being listed.
Step 2 : Click on Asset Filter from the Search section.
Step 3 : Under the Root path specify the path to the Production Area Element in the form of
\\PISRV1\OSIsoft Plant.
Step 4 : Under the Element template, select “Generic Tank Template”.
Step 5 : Under the Attributes to display, select External Temperature and Internal
Temperature.
Step 6 : Select Drop-down list.
Step 7 : Click Apply.
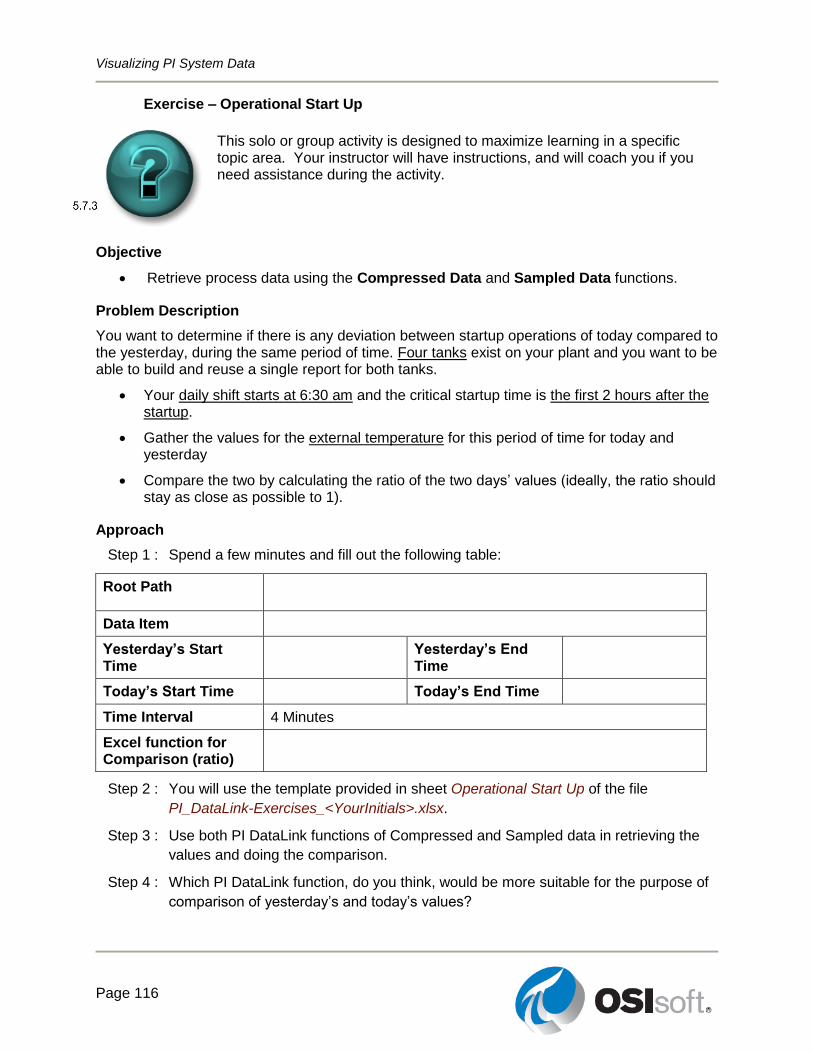
Visualizing PI System Data
Page 116
Exercise – Operational Start Up
This solo or group activity is designed to maximize learning in a specific topic area. Your instructor will have instructions, and will coach you if you need assistance during the activity.
Objective
Retrieve process data using the Compressed Data and Sampled Data functions.
Problem Description
You want to determine if there is any deviation between startup operations of today compared to the yesterday, during the same period of time. Four tanks exist on your plant and you want to be able to build and reuse a single report for both tanks.
Your daily shift starts at 6:30 am and the critical startup time is the first 2 hours after the startup.
Gather the values for the external temperature for this period of time for today and yesterday
Compare the two by calculating the ratio of the two days’ values (ideally, the ratio should stay as close as possible to 1).
Approach
Step 1 : Spend a few minutes and fill out the following table:
Root Path
Data Item
Yesterday’s Start Time
Yesterday’s End Time
Today’s Start Time Today’s End Time
Time Interval 4 Minutes
Excel function for Comparison (ratio)
Step 2 : You will use the template provided in sheet Operational Start Up of the file
PI_DataLink-Exercises_<YourInitials>.xlsx.
Step 3 : Use both PI DataLink functions of Compressed and Sampled data in retrieving the
values and doing the comparison.
Step 4 : Which PI DataLink function, do you think, would be more suitable for the purpose of
comparison of yesterday’s and today’s values?
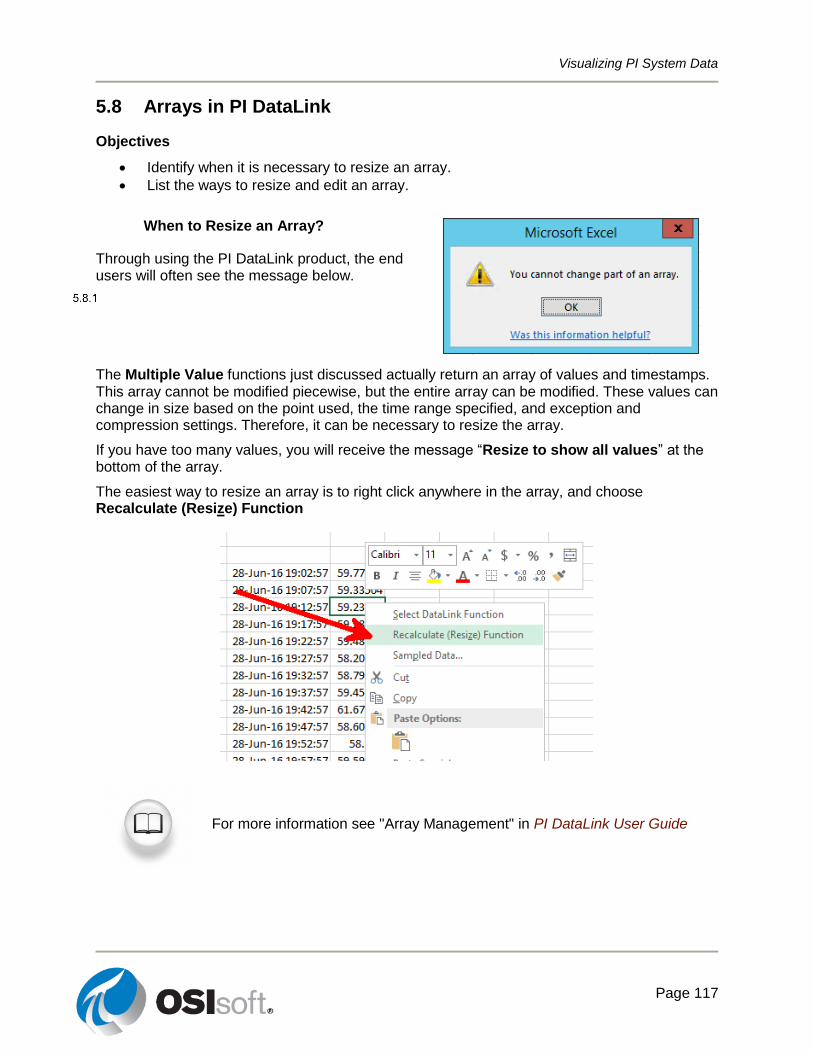
Visualizing PI System Data
Page 117
5.8 Arrays in PI DataLink
Objectives
Identify when it is necessary to resize an array.
List the ways to resize and edit an array.
When to Resize an Array?
Through using the PI DataLink product, the end users will often see the message below.
The Multiple Value functions just discussed actually return an array of values and timestamps. This array cannot be modified piecewise, but the entire array can be modified. These values can change in size based on the point used, the time range specified, and exception and compression settings. Therefore, it can be necessary to resize the array.
If you have too many values, you will receive the message “Resize to show all values” at the bottom of the array.
The easiest way to resize an array is to right click anywhere in the array, and choose Recalculate (Resize) Function
For more information see "Array Management" in PI DataLink User Guide
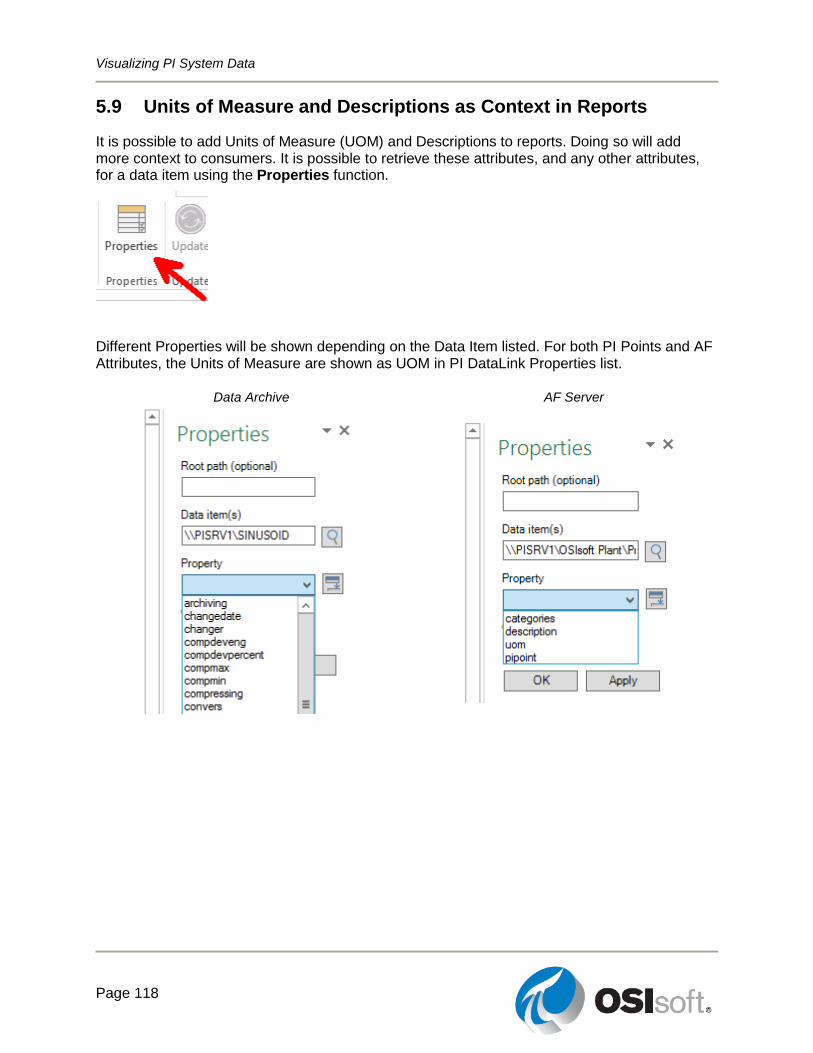
Visualizing PI System Data
Page 118
5.9 Units of Measure and Descriptions as Context in Reports
It is possible to add Units of Measure (UOM) and Descriptions to reports. Doing so will add more context to consumers. It is possible to retrieve these attributes, and any other attributes, for a data item using the Properties function.
Different Properties will be shown depending on the Data Item listed. For both PI Points and AF Attributes, the Units of Measure are shown as UOM in PI DataLink Properties list.
Data Archive AF Server
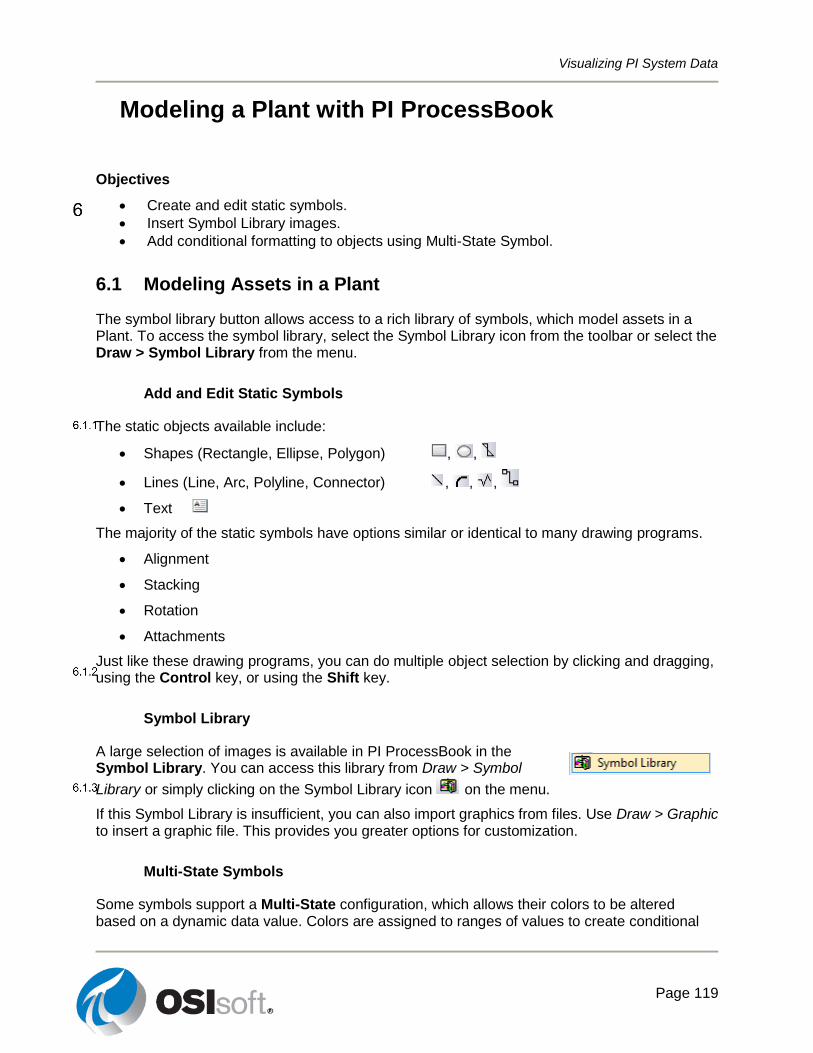
Visualizing PI System Data
Page 119
Modeling a Plant with PI ProcessBook
Objectives
Create and edit static symbols.
Insert Symbol Library images.
Add conditional formatting to objects using Multi-State Symbol.
6.1 Modeling Assets in a Plant
The symbol library button allows access to a rich library of symbols, which model assets in a Plant. To access the symbol library, select the Symbol Library icon from the toolbar or select the Draw > Symbol Library from the menu.
Add and Edit Static Symbols
The static objects available include:
Shapes (Rectangle, Ellipse, Polygon) , ,
Lines (Line, Arc, Polyline, Connector) , , ,
Text
The majority of the static symbols have options similar or identical to many drawing programs.
Alignment
Stacking
Rotation
Attachments
Just like these drawing programs, you can do multiple object selection by clicking and dragging, using the Control key, or using the Shift key.
Symbol Library
A large selection of images is available in PI ProcessBook in the Symbol Library. You can access this library from Draw > Symbol
Library or simply clicking on the Symbol Library icon on the menu.
If this Symbol Library is insufficient, you can also import graphics from files. Use Draw > Graphic to insert a graphic file. This provides you greater options for customization.
Multi-State Symbols
Some symbols support a Multi-State configuration, which allows their colors to be altered based on a dynamic data value. Colors are assigned to ranges of values to create conditional

Visualizing PI System Data
Page 120
formatting states. Any symbol except a trend, XY Plot, graphic or button, or OLE object can have a Multi-State configuration
Note that, while in the Build mode, the multi-state symbol’s icon becomes available after you have selected an eligible item on your display (eg, a Value).
For more information see the "Multi-State Symbols" section in the PI ProcessBook User Guide.
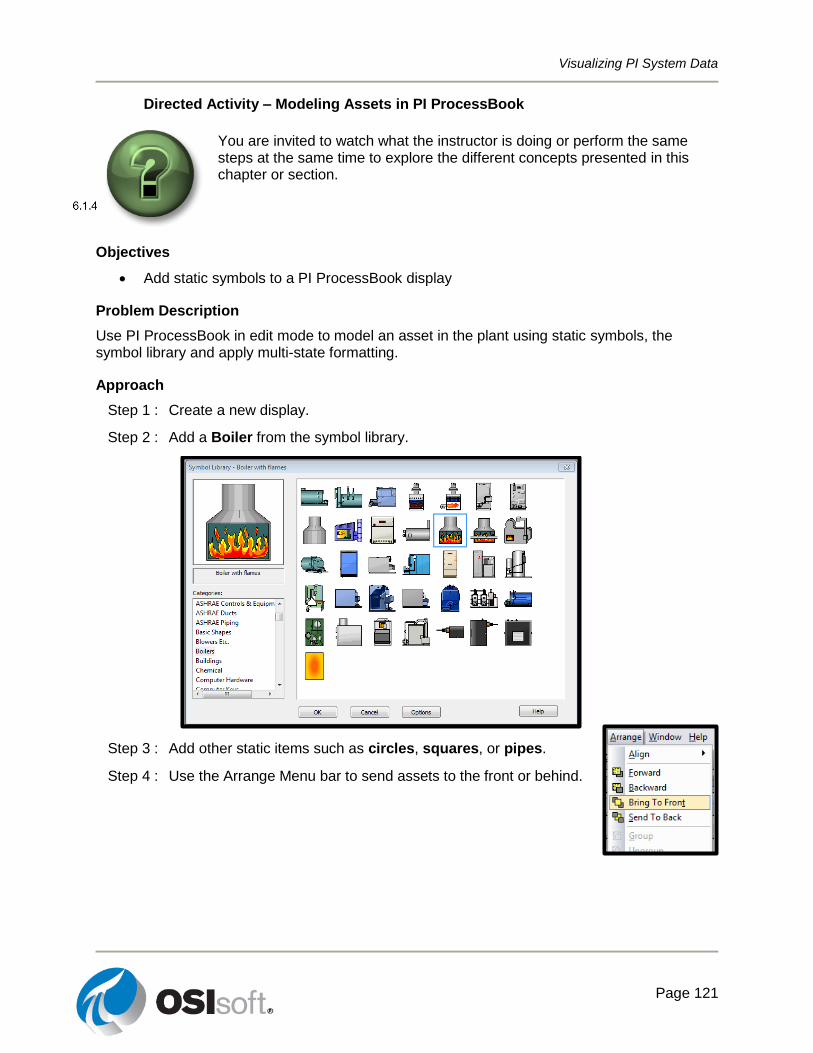
Visualizing PI System Data
Page 121
Directed Activity – Modeling Assets in PI ProcessBook
You are invited to watch what the instructor is doing or perform the same steps at the same time to explore the different concepts presented in this chapter or section.
Objectives
Add static symbols to a PI ProcessBook display
Problem Description
Use PI ProcessBook in edit mode to model an asset in the plant using static symbols, the symbol library and apply multi-state formatting.
Approach
Step 1 : Create a new display.
Step 2 : Add a Boiler from the symbol library.
Step 3 : Add other static items such as circles, squares, or pipes.
Step 4 : Use the Arrange Menu bar to send assets to the front or behind.
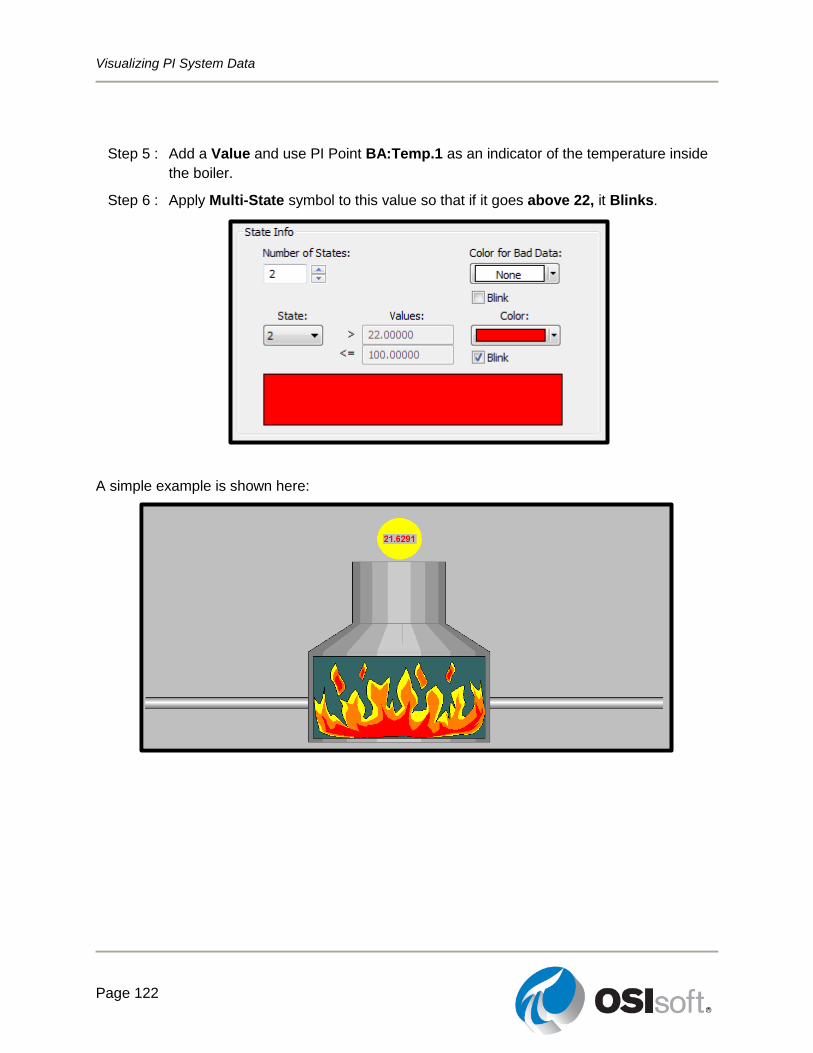
Visualizing PI System Data
Page 122
Step 5 : Add a Value and use PI Point BA:Temp.1 as an indicator of the temperature inside
the boiler.
Step 6 : Apply Multi-State symbol to this value so that if it goes above 22, it Blinks.
A simple example is shown here:
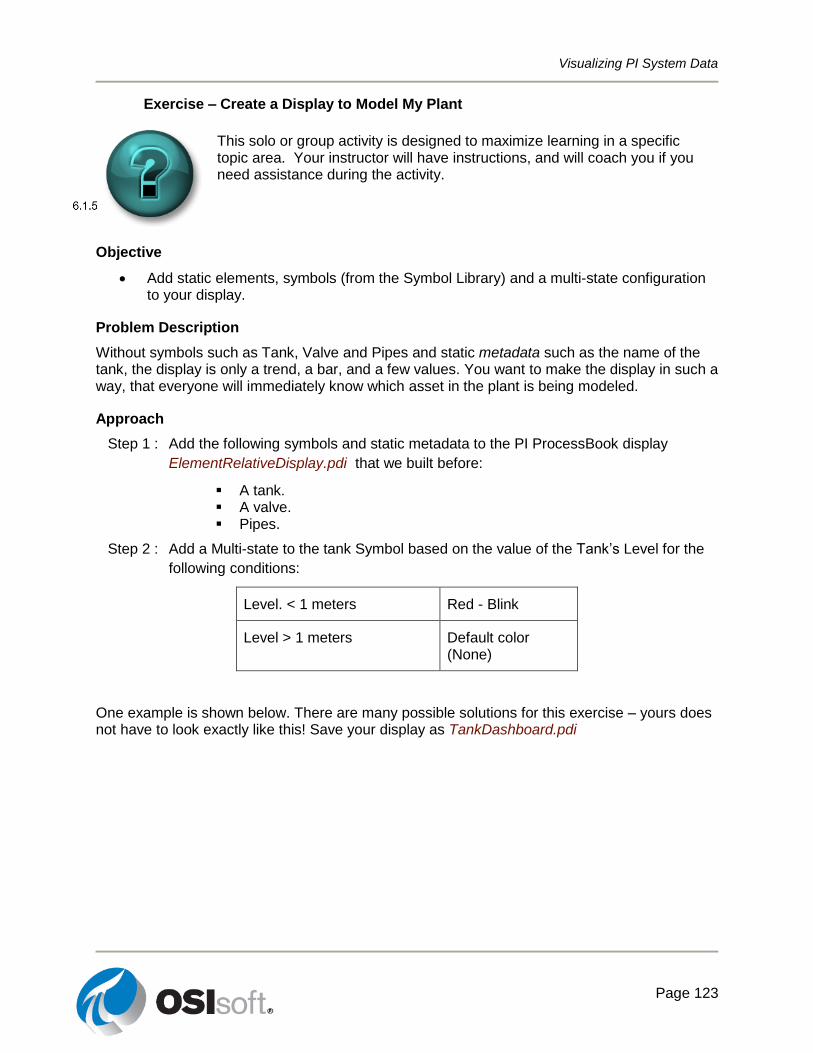
Visualizing PI System Data
Page 123
Exercise – Create a Display to Model My Plant
This solo or group activity is designed to maximize learning in a specific topic area. Your instructor will have instructions, and will coach you if you need assistance during the activity.
Objective
Add static elements, symbols (from the Symbol Library) and a multi-state configuration to your display.
Problem Description
Without symbols such as Tank, Valve and Pipes and static metadata such as the name of the tank, the display is only a trend, a bar, and a few values. You want to make the display in such a way, that everyone will immediately know which asset in the plant is being modeled.
Approach
Step 1 : Add the following symbols and static metadata to the PI ProcessBook display
ElementRelativeDisplay.pdi that we built before:
A tank. A valve. Pipes.
Step 2 : Add a Multi-state to the tank Symbol based on the value of the Tank’s Level for the
following conditions:
Level. < 1 meters Red - Blink
Level > 1 meters Default color (None)
One example is shown below. There are many possible solutions for this exercise – yours does not have to look exactly like this! Save your display as TankDashboard.pdi
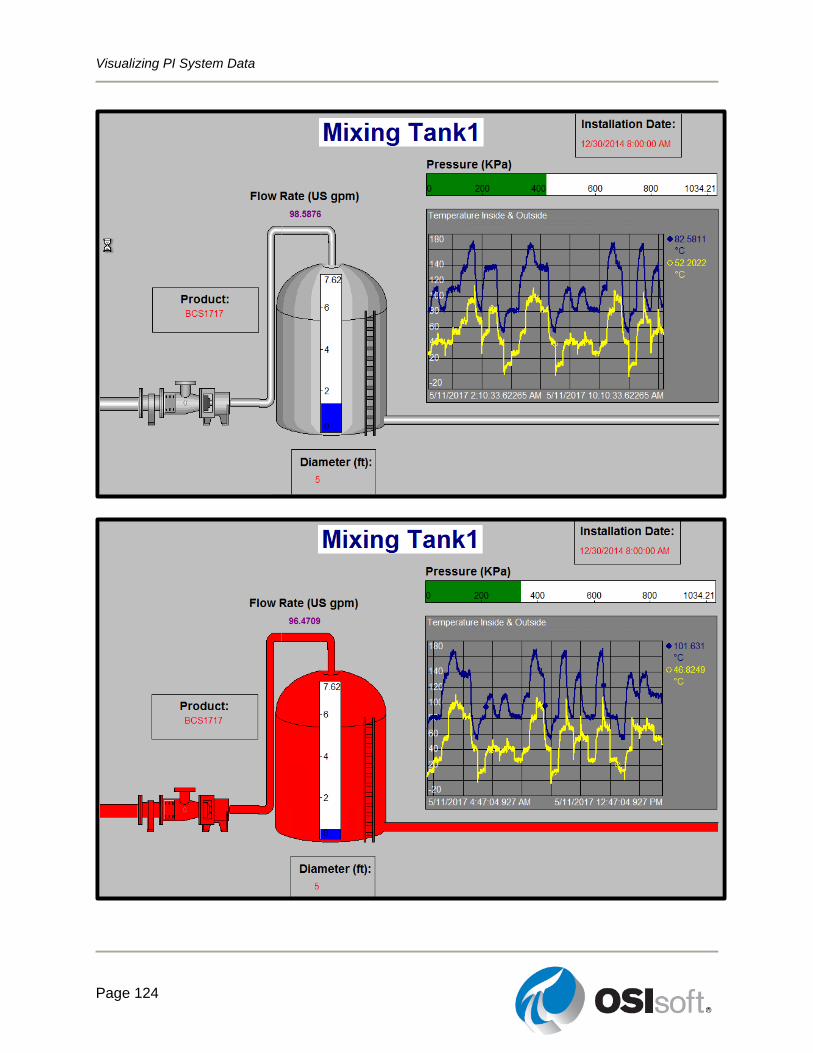
Visualizing PI System Data
Page 124
Visualizing PI System Data
Page 125
6.2 Analyze PI ProcessBook Data Items in an Ad Hoc PI Vision Trend
You can launch a PI Vision ad hoc display directly from a PI ProcessBook display. This capability is associated with the PI Vision Addin for PI ProcessBook. The other add-in, which will be discussed in a later chapter is AF Display Builder Add-in.
Note: You can check the list of your PI ProcessBook Add-ins from Tools->Add-In Manager …
To create an ad hoc display, open your PI ProcessBook dashboard and select the symbol you want to use in a PI Vision analysis. Once the symbol is selected, click the Explore in PI Vision
button , located on the Standard Toolbar. If you do not select any symbol, an ad hoc PI Vision display will be created with a trend of all the data items on your PI ProcessBook display.
The created display is an Ad Hoc display. If you are interested in saving this display, simply
choose Save Saving the PI Vision ad hoc display, the URL can be shared with anyone in your organization.
Visualizing PI System Data
Page 126
Directed Activity – Ad Hoc analysis of PI ProcessBook data
You are invited to watch what the instructor is doing or perform the same steps at the same time to explore the different concepts presented in this chapter or section.
Objectives
Explore data from a PI ProcessBook display in PI Vision
Problem Description
Looking at your ElementRelativeTankDisplay_<your initials>.PDI display, the pressure of mixing tank1 doesn’t seem normal. You want to quickly build an ad-hoc display on PI Vision and email the URL to your process engineer to troubleshoot.
Approach
Step 1 : Open ElementRelativeTankDisplay_<your initials>.PDI
Step 2 : Click on the Bar graph indicator for Level.
Step 3 : Click on the Explore in PI Vision button .
Step 4 : Once the AdHoc display is opened in PI Vision, choose the Save option and
save the display as Level-Mixing Tank1 <Initials>
Step 5 : Copy the URL and include it in a text file to be emailed later.
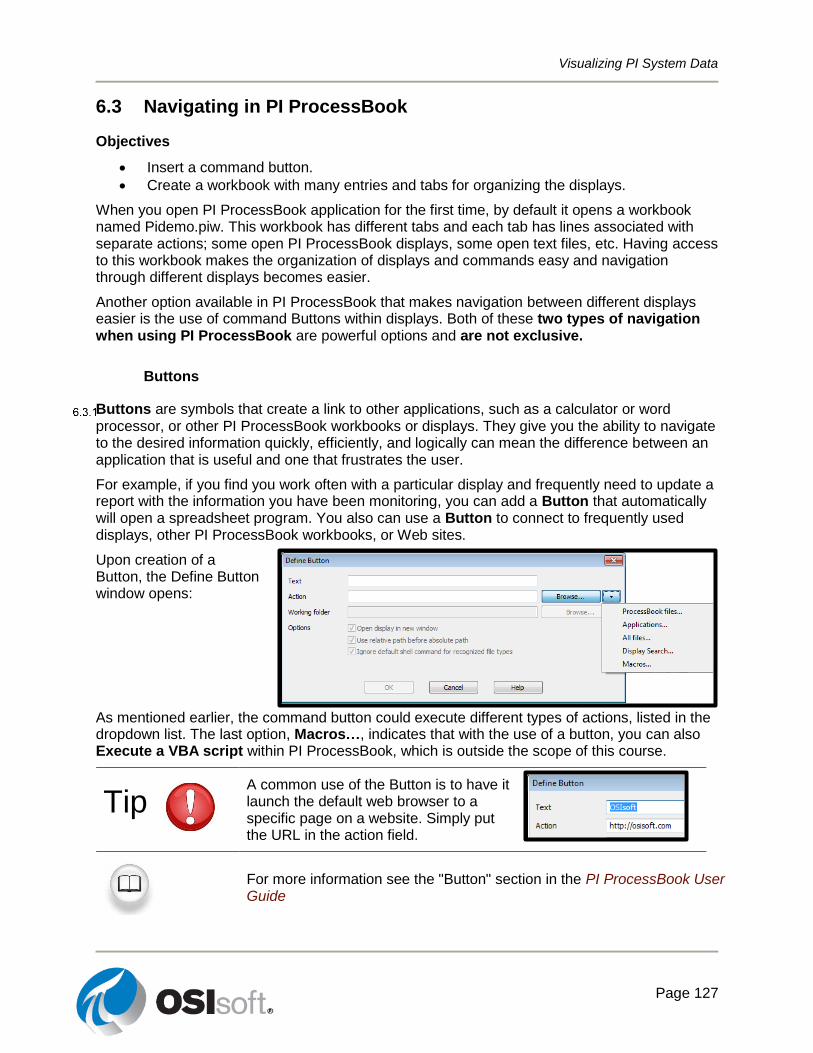
Visualizing PI System Data
Page 127
6.3 Navigating in PI ProcessBook
Objectives
Insert a command button.
Create a workbook with many entries and tabs for organizing the displays.
When you open PI ProcessBook application for the first time, by default it opens a workbook named Pidemo.piw. This workbook has different tabs and each tab has lines associated with separate actions; some open PI ProcessBook displays, some open text files, etc. Having access to this workbook makes the organization of displays and commands easy and navigation through different displays becomes easier.
Another option available in PI ProcessBook that makes navigation between different displays easier is the use of command Buttons within displays. Both of these two types of navigation when using PI ProcessBook are powerful options and are not exclusive.
Buttons
Buttons are symbols that create a link to other applications, such as a calculator or word processor, or other PI ProcessBook workbooks or displays. They give you the ability to navigate to the desired information quickly, efficiently, and logically can mean the difference between an application that is useful and one that frustrates the user.
For example, if you find you work often with a particular display and frequently need to update a report with the information you have been monitoring, you can add a Button that automatically will open a spreadsheet program. You also can use a Button to connect to frequently used displays, other PI ProcessBook workbooks, or Web sites.
Upon creation of a Button, the Define Button window opens:
As mentioned earlier, the command button could execute different types of actions, listed in the dropdown list. The last option, Macros…, indicates that with the use of a button, you can also Execute a VBA script within PI ProcessBook, which is outside the scope of this course.
Tip
A common use of the Button is to have it launch the default web browser to a specific page on a website. Simply put the URL in the action field.
For more information see the "Button" section in the PI ProcessBook User Guide
Visualizing PI System Data
Page 128
Directed Activity – The Button
You are invited to watch what the instructor is doing or perform the same steps at the same time to explore the different concepts presented in this chapter or section.
Objectives
Add a button to a PI ProcessBook display
Problem Description
You want to add a button to launch a program called “Notepad”.
Approach
Step 1 : Add a button.
Step 2 : In the Text box put any name that you want to be the label of the button.
Step 3 : Configure the button use the command notepad.exe (in the Action box)
Tip
The secret key for making the rest of the options accessible is the Tab key.
Visualizing PI System Data
Page 129
Exercise – Linking Tank Reports to PI Processbook
This solo or group activity is designed to maximize learning in a specific topic area. Your instructor will have instructions, and will coach you if you need assistance during the activity.
Objectives
Link to a webpage from PI Processbook
Link to another file from PI Processbook
Problem Description
We want to use our Element Relative Tank Display as a dashboard for our other reports and displays so it is easy to reference them.
Approach
Open your ElementRelativeTankDisplay.PDI. file:
Step 1 : Add a button to the display that links to the PI Vision Asset Relative display you
created earlier (<Initials>_Production Area Dashboard)
Step 2 : Add an additional button that opens your PI Datalink sheet: PI_DataLink-
Exercises_<YourInitials>.xlsx
Step 3 : Save your file
Step 4 : Test the links
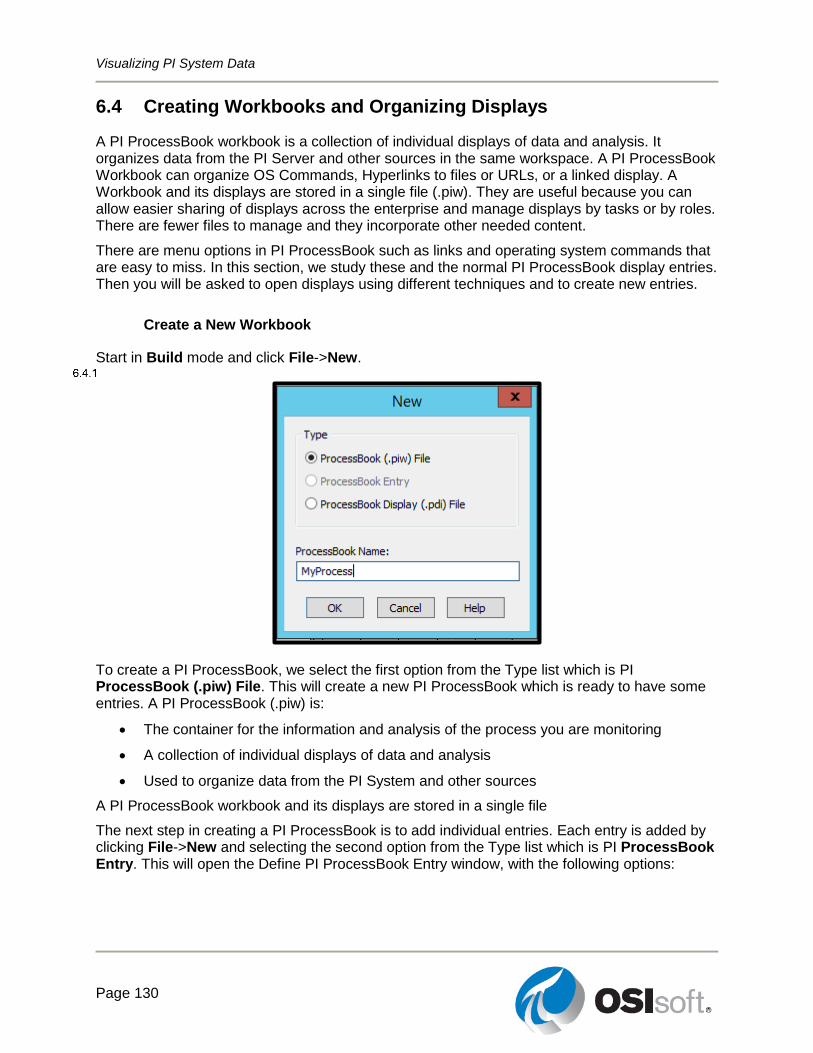
Visualizing PI System Data
Page 130
6.4 Creating Workbooks and Organizing Displays
A PI ProcessBook workbook is a collection of individual displays of data and analysis. It organizes data from the PI Server and other sources in the same workspace. A PI ProcessBook Workbook can organize OS Commands, Hyperlinks to files or URLs, or a linked display. A Workbook and its displays are stored in a single file (.piw). They are useful because you can allow easier sharing of displays across the enterprise and manage displays by tasks or by roles. There are fewer files to manage and they incorporate other needed content.
There are menu options in PI ProcessBook such as links and operating system commands that are easy to miss. In this section, we study these and the normal PI ProcessBook display entries. Then you will be asked to open displays using different techniques and to create new entries.
Create a New Workbook
Start in Build mode and click File->New.
To create a PI ProcessBook, we select the first option from the Type list which is PI ProcessBook (.piw) File. This will create a new PI ProcessBook which is ready to have some entries. A PI ProcessBook (.piw) is:
The container for the information and analysis of the process you are monitoring
A collection of individual displays of data and analysis
Used to organize data from the PI System and other sources
A PI ProcessBook workbook and its displays are stored in a single file
The next step in creating a PI ProcessBook is to add individual entries. Each entry is added by clicking File->New and selecting the second option from the Type list which is PI ProcessBook Entry. This will open the Define PI ProcessBook Entry window, with the following options:
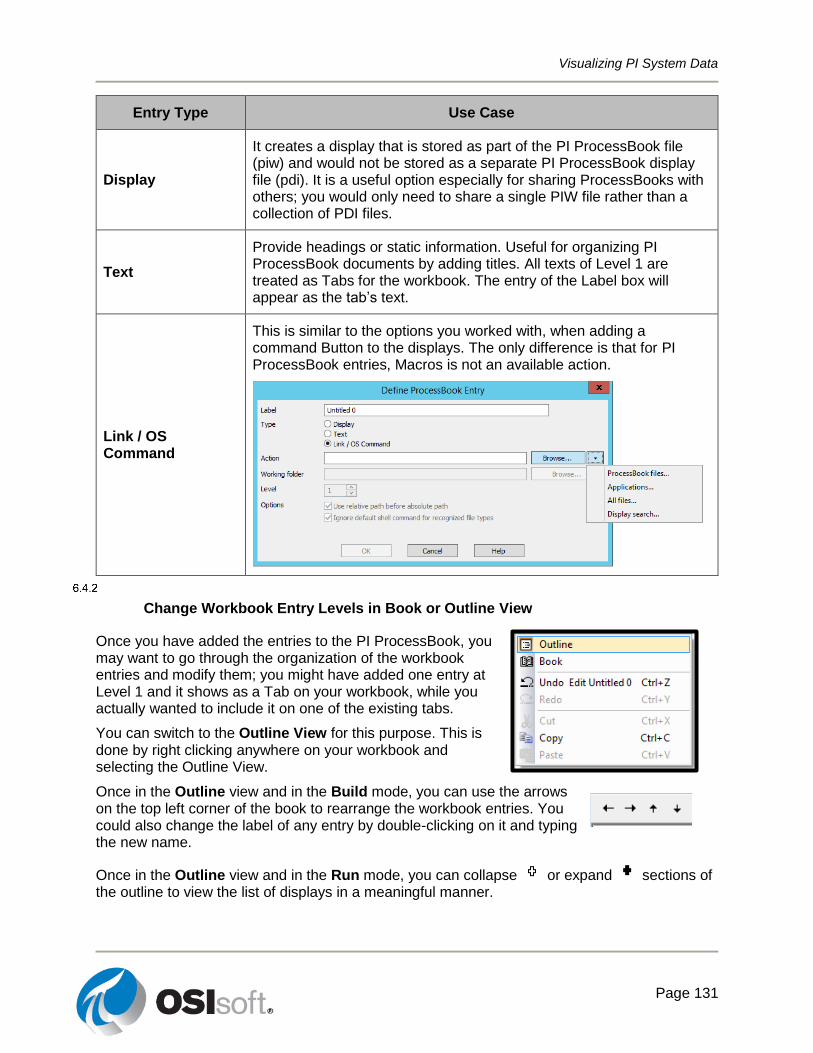
Visualizing PI System Data
Page 131
Entry Type Use Case
Display
It creates a display that is stored as part of the PI ProcessBook file (piw) and would not be stored as a separate PI ProcessBook display file (pdi). It is a useful option especially for sharing ProcessBooks with others; you would only need to share a single PIW file rather than a collection of PDI files.
Text
Provide headings or static information. Useful for organizing PI ProcessBook documents by adding titles. All texts of Level 1 are treated as Tabs for the workbook. The entry of the Label box will appear as the tab’s text.
Link / OS Command
This is similar to the options you worked with, when adding a command Button to the displays. The only difference is that for PI ProcessBook entries, Macros is not an available action.
Change Workbook Entry Levels in Book or Outline View
Once you have added the entries to the PI ProcessBook, you may want to go through the organization of the workbook entries and modify them; you might have added one entry at Level 1 and it shows as a Tab on your workbook, while you actually wanted to include it on one of the existing tabs.
You can switch to the Outline View for this purpose. This is done by right clicking anywhere on your workbook and selecting the Outline View.
Once in the Outline view and in the Build mode, you can use the arrows on the top left corner of the book to rearrange the workbook entries. You could also change the label of any entry by double-clicking on it and typing the new name.
Once in the Outline view and in the Run mode, you can collapse or expand sections of the outline to view the list of displays in a meaningful manner.
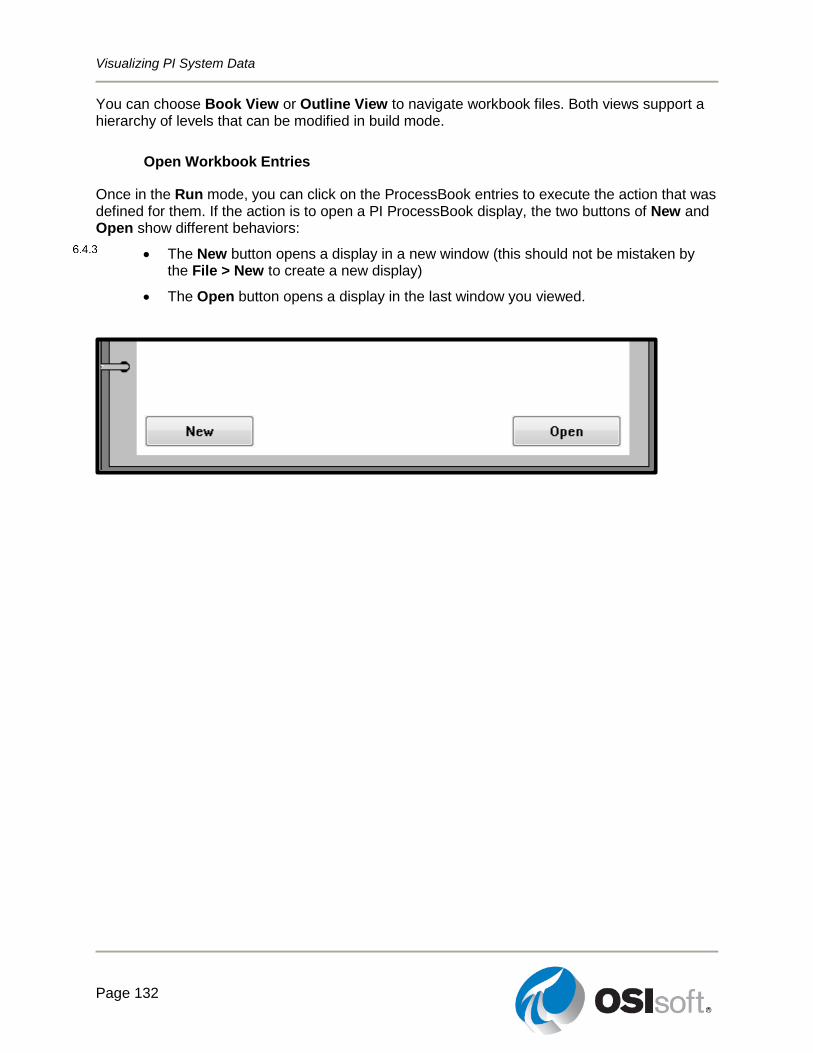
Visualizing PI System Data
Page 132
You can choose Book View or Outline View to navigate workbook files. Both views support a hierarchy of levels that can be modified in build mode.
Open Workbook Entries
Once in the Run mode, you can click on the ProcessBook entries to execute the action that was defined for them. If the action is to open a PI ProcessBook display, the two buttons of New and Open show different behaviors:
The New button opens a display in a new window (this should not be mistaken by the File > New to create a new display)
The Open button opens a display in the last window you viewed.
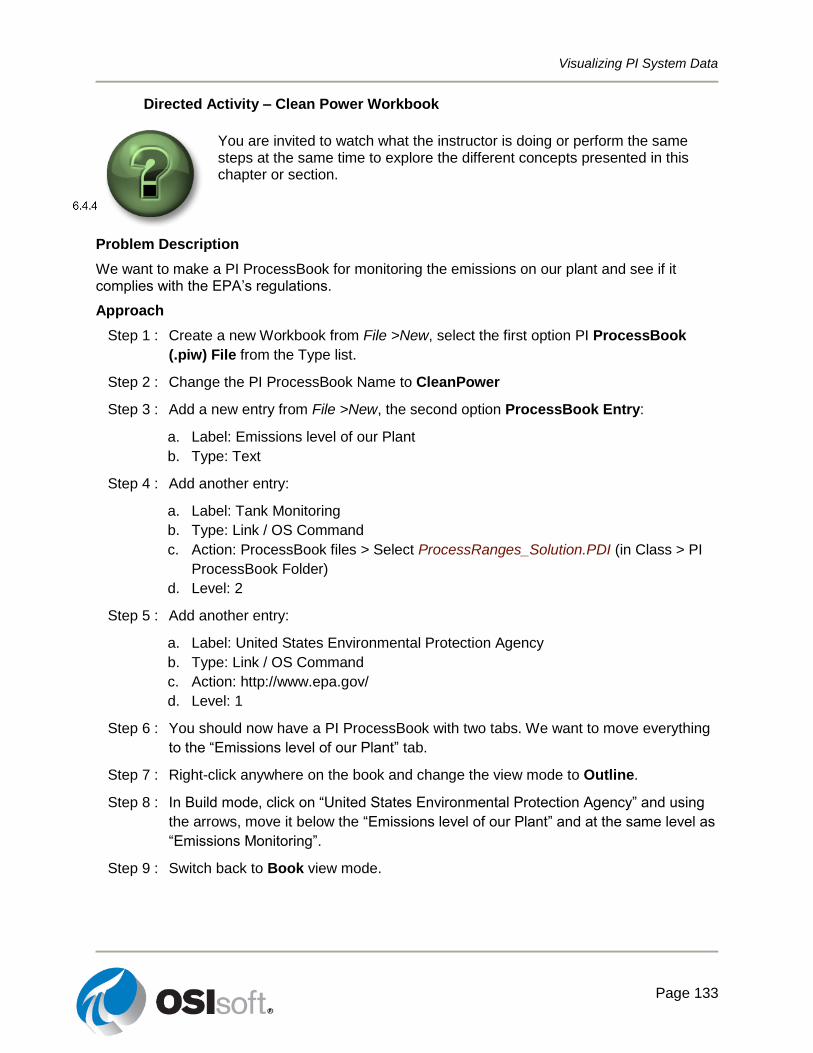
Visualizing PI System Data
Page 133
Directed Activity – Clean Power Workbook
You are invited to watch what the instructor is doing or perform the same steps at the same time to explore the different concepts presented in this chapter or section.
Problem Description
We want to make a PI ProcessBook for monitoring the emissions on our plant and see if it complies with the EPA’s regulations.
Approach
Step 1 : Create a new Workbook from File >New, select the first option PI ProcessBook
(.piw) File from the Type list.
Step 2 : Change the PI ProcessBook Name to CleanPower
Step 3 : Add a new entry from File >New, the second option ProcessBook Entry:
a. Label: Emissions level of our Plant
b. Type: Text
Step 4 : Add another entry:
a. Label: Tank Monitoring
b. Type: Link / OS Command
c. Action: ProcessBook files > Select ProcessRanges_Solution.PDI (in Class > PI
ProcessBook Folder)
d. Level: 2
Step 5 : Add another entry:
a. Label: United States Environmental Protection Agency
b. Type: Link / OS Command
c. Action: http://www.epa.gov/
d. Level: 1
Step 6 : You should now have a PI ProcessBook with two tabs. We want to move everything
to the “Emissions level of our Plant” tab.
Step 7 : Right-click anywhere on the book and change the view mode to Outline.
Step 8 : In Build mode, click on “United States Environmental Protection Agency” and using
the arrows, move it below the “Emissions level of our Plant” and at the same level as
“Emissions Monitoring”.
Step 9 : Switch back to Book view mode.
Visualizing PI System Data
Page 134
Exercise – Organize Your Displays
This solo or group activity is designed to maximize learning in a specific topic area. Your instructor will have instructions, and will coach you if you need assistance during the activity.
Objectives
Build and modify a PI ProcessBook.
Understand the PI ProcessBook entries hierarchy.
Use the Book and Outline views to visualize and modify a PI ProcessBook.
Problem Description
You would like to build a PI ProcessBook for the plant we introduced in this book (which has 2 production lines and different tanks) and organize the displays and reports you built throughout the class. Below is the list of the items you would include in your PI ProcessBook.
Page 1: Troubleshooting
PI ProcessBook Display ElementRelativeTankDisplay.PDI.
Calculator (calc.exe)
Link to My support on OSIsoft Techsupport website (https://techsupport.osisoft.com/My-Support/)
Page 2: Analysis
PI DataLink reports (PI_DataLink-Exercises_<YourInitials>.xlsx)
Performance Equations Reference Manual (C:\Program Files (x86)\PIPC\HELP\PEReference.chm)
Link to OSIsoft YouTube Channel (https://www.youtube.com/user/OSIsoftLearning)
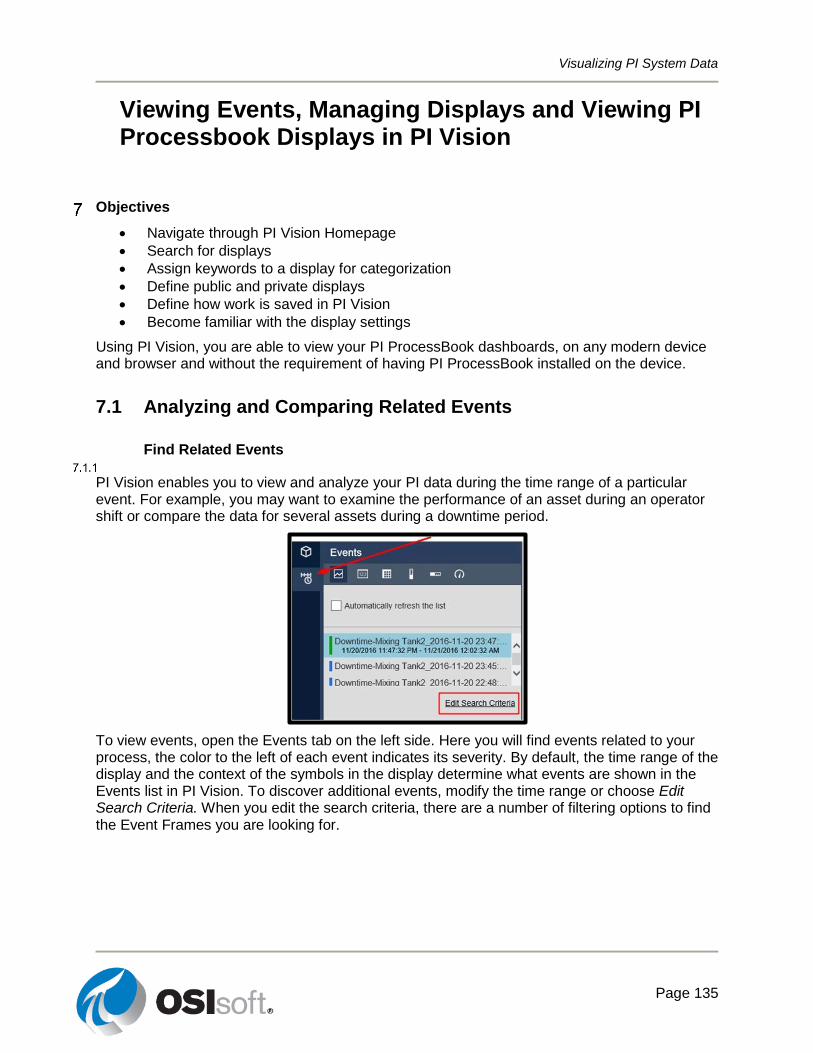
Visualizing PI System Data
Page 135
Viewing Events, Managing Displays and Viewing PI Processbook Displays in PI Vision
Objectives
Navigate through PI Vision Homepage
Search for displays
Assign keywords to a display for categorization
Define public and private displays
Define how work is saved in PI Vision
Become familiar with the display settings
Using PI Vision, you are able to view your PI ProcessBook dashboards, on any modern device and browser and without the requirement of having PI ProcessBook installed on the device.
7.1 Analyzing and Comparing Related Events
Find Related Events
PI Vision enables you to view and analyze your PI data during the time range of a particular event. For example, you may want to examine the performance of an asset during an operator shift or compare the data for several assets during a downtime period.
To view events, open the Events tab on the left side. Here you will find events related to your process, the color to the left of each event indicates its severity. By default, the time range of the display and the context of the symbols in the display determine what events are shown in the Events list in PI Vision. To discover additional events, modify the time range or choose Edit Search Criteria. When you edit the search criteria, there are a number of filtering options to find the Event Frames you are looking for.
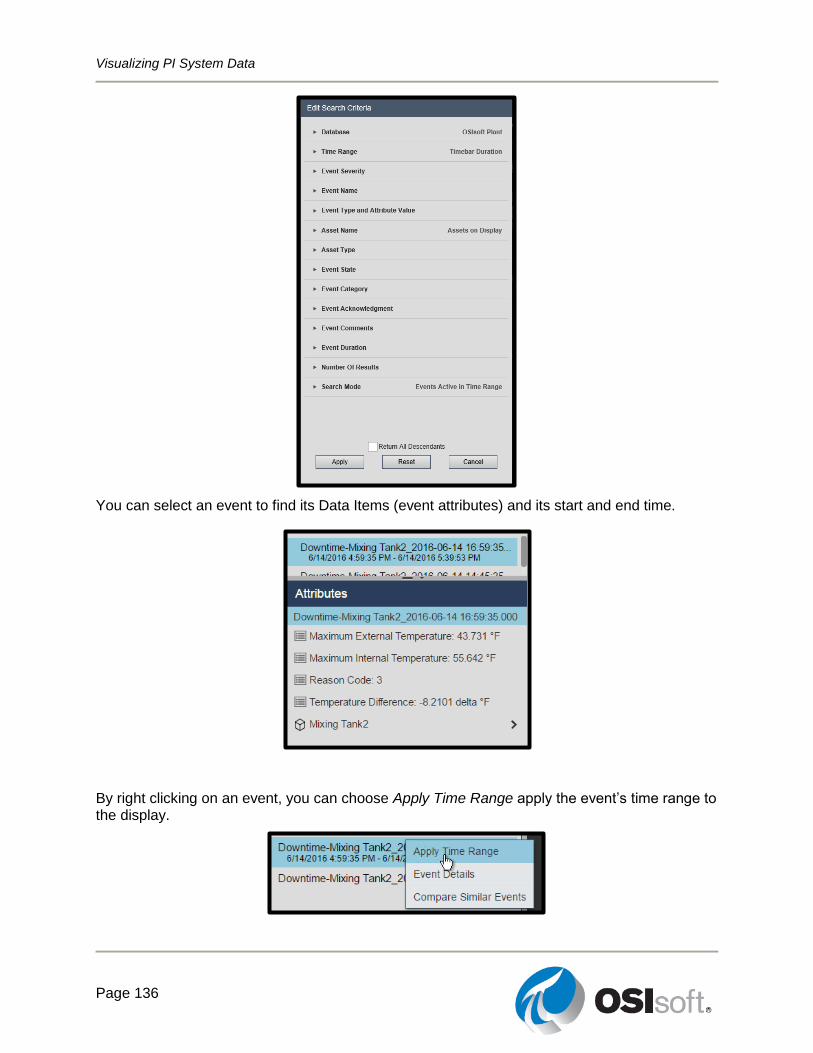
Visualizing PI System Data
Page 136
You can select an event to find its Data Items (event attributes) and its start and end time.
By right clicking on an event, you can choose Apply Time Range apply the event’s time range to the display.
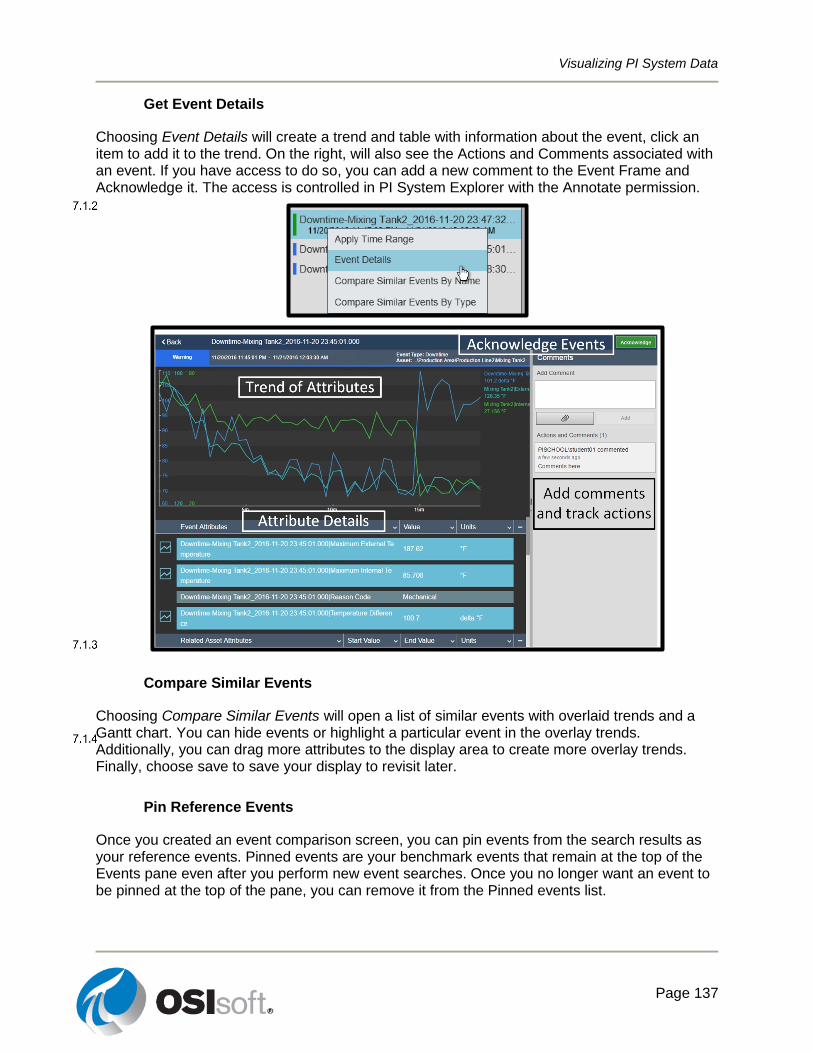
Visualizing PI System Data
Page 137
Get Event Details
Choosing Event Details will create a trend and table with information about the event, click an item to add it to the trend. On the right, will also see the Actions and Comments associated with an event. If you have access to do so, you can add a new comment to the Event Frame and Acknowledge it. The access is controlled in PI System Explorer with the Annotate permission.
Compare Similar Events
Choosing Compare Similar Events will open a list of similar events with overlaid trends and a Gantt chart. You can hide events or highlight a particular event in the overlay trends. Additionally, you can drag more attributes to the display area to create more overlay trends. Finally, choose save to save your display to revisit later.
Pin Reference Events
Once you created an event comparison screen, you can pin events from the search results as your reference events. Pinned events are your benchmark events that remain at the top of the Events pane even after you perform new event searches. Once you no longer want an event to be pinned at the top of the pane, you can remove it from the Pinned events list.
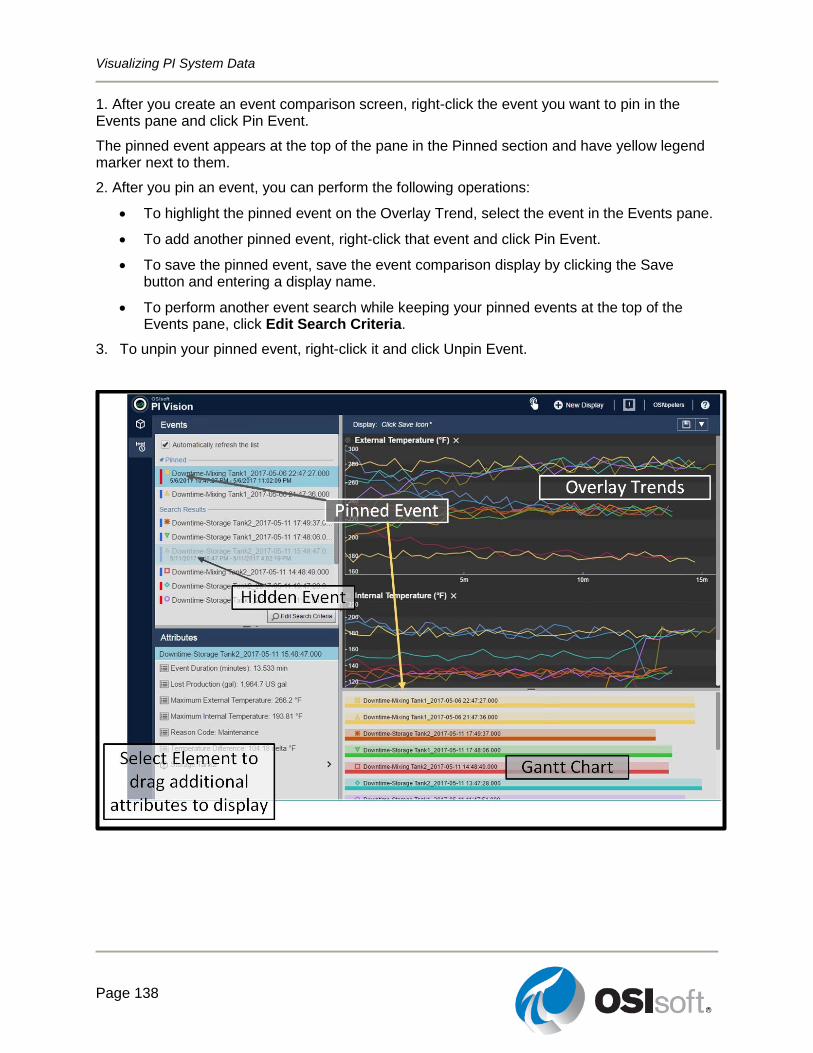
Visualizing PI System Data
Page 138
1. After you create an event comparison screen, right-click the event you want to pin in the Events pane and click Pin Event.
The pinned event appears at the top of the pane in the Pinned section and have yellow legend marker next to them.
2. After you pin an event, you can perform the following operations:
To highlight the pinned event on the Overlay Trend, select the event in the Events pane.
To add another pinned event, right-click that event and click Pin Event.
To save the pinned event, save the event comparison display by clicking the Save button and entering a display name.
To perform another event search while keeping your pinned events at the top of the Events pane, click Edit Search Criteria.
3. To unpin your pinned event, right-click it and click Unpin Event.
Visualizing PI System Data
Page 139
Directed Activity – Process Downtime
You are invited to watch what the instructor is doing or perform the same steps at the same time to explore the different concepts presented in this chapter or section
Objectives
Find an asset’s related events.
Use PI Vision to analyze important events.
Problem Description
Build a display in PI Vision to analyze the out of control events.
Approach
Step 1 : Open your <Initials> Tank Dashboard display.
Step 2 : Click on the Events button to find all related events to Mixing Tank1
Step 3 : Select the most recent closed event for Mixing Tank1. Note what the Reason Code
of this event is. ______________
Step 4 : Right-click on the name of the most recent Downtime event, select Event Details to
see the end values of the Attributes. What was the Flow Rate when the Event
Frame ended? ___________
Step 5 : Based on the list of the values of the data items find the temperature difference
related to the most recent downtime event. ________________
Step 6 : Right-click on the name of the most recent downtime event again, select Compare
Similar Events by Type. Which event was the longest? What time did it start?
______________
Step 7 : Pin a reference event and change the search criteria to include all tanks.
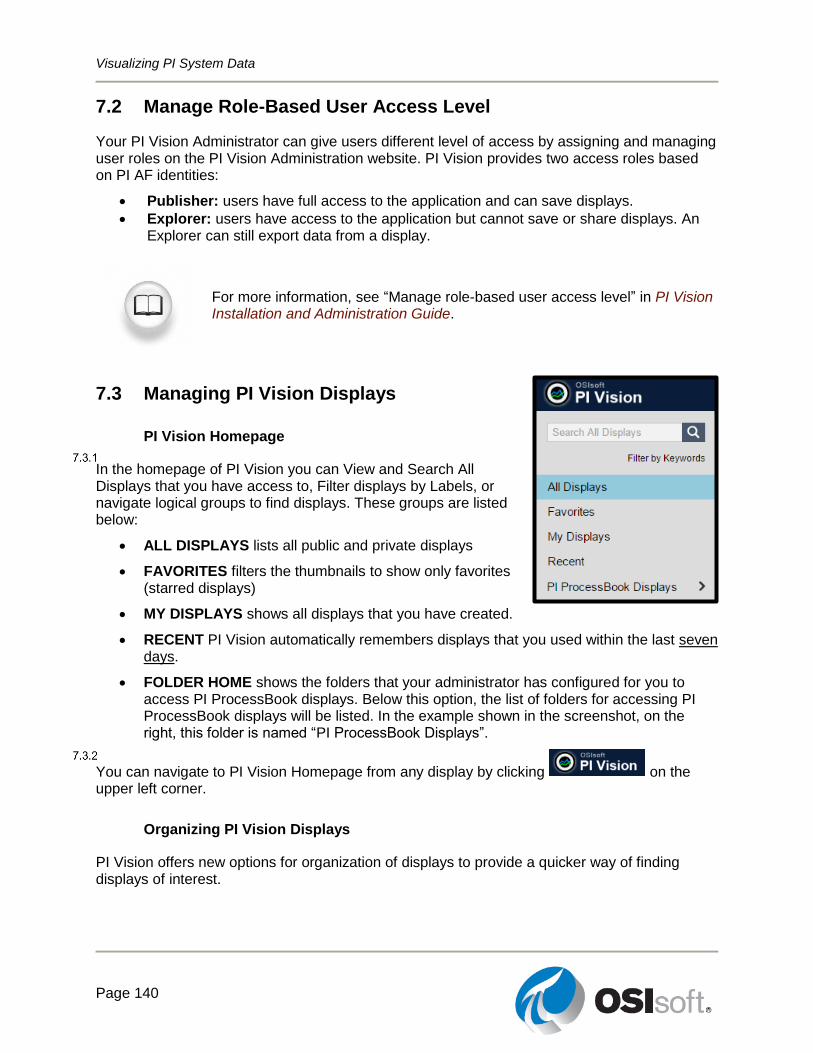
Visualizing PI System Data
Page 140
7.2 Manage Role-Based User Access Level
Your PI Vision Administrator can give users different level of access by assigning and managing user roles on the PI Vision Administration website. PI Vision provides two access roles based on PI AF identities:
Publisher: users have full access to the application and can save displays.
Explorer: users have access to the application but cannot save or share displays. An Explorer can still export data from a display.
For more information, see “Manage role-based user access level” in PI Vision Installation and Administration Guide.
7.3 Managing PI Vision Displays
PI Vision Homepage
In the homepage of PI Vision you can View and Search All Displays that you have access to, Filter displays by Labels, or navigate logical groups to find displays. These groups are listed below:
ALL DISPLAYS lists all public and private displays
FAVORITES filters the thumbnails to show only favorites (starred displays)
MY DISPLAYS shows all displays that you have created.
RECENT PI Vision automatically remembers displays that you used within the last seven days.
FOLDER HOME shows the folders that your administrator has configured for you to access PI ProcessBook displays. Below this option, the list of folders for accessing PI ProcessBook displays will be listed. In the example shown in the screenshot, on the right, this folder is named “PI ProcessBook Displays”.
You can navigate to PI Vision Homepage from any display by clicking on the upper left corner.
Organizing PI Vision Displays
PI Vision offers new options for organization of displays to provide a quicker way of finding displays of interest.
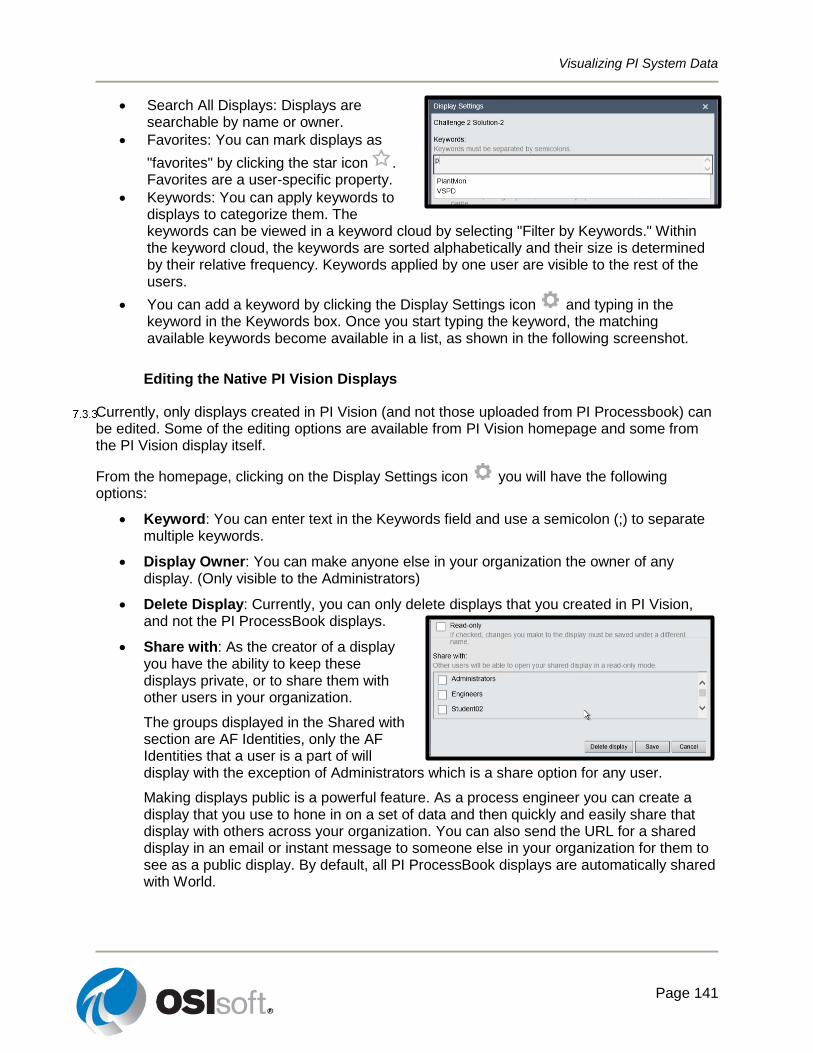
Visualizing PI System Data
Page 141
Search All Displays: Displays are searchable by name or owner.
Favorites: You can mark displays as
"favorites" by clicking the star icon . Favorites are a user-specific property.
Keywords: You can apply keywords to displays to categorize them. The keywords can be viewed in a keyword cloud by selecting "Filter by Keywords." Within the keyword cloud, the keywords are sorted alphabetically and their size is determined by their relative frequency. Keywords applied by one user are visible to the rest of the users.
You can add a keyword by clicking the Display Settings icon and typing in the keyword in the Keywords box. Once you start typing the keyword, the matching available keywords become available in a list, as shown in the following screenshot.
Editing the Native PI Vision Displays
Currently, only displays created in PI Vision (and not those uploaded from PI Processbook) can be edited. Some of the editing options are available from PI Vision homepage and some from the PI Vision display itself.
From the homepage, clicking on the Display Settings icon you will have the following options:
Keyword: You can enter text in the Keywords field and use a semicolon (;) to separate multiple keywords.
Display Owner: You can make anyone else in your organization the owner of any display. (Only visible to the Administrators)
Delete Display: Currently, you can only delete displays that you created in PI Vision, and not the PI ProcessBook displays.
Share with: As the creator of a display you have the ability to keep these displays private, or to share them with other users in your organization.
The groups displayed in the Shared with section are AF Identities, only the AF Identities that a user is a part of will display with the exception of Administrators which is a share option for any user.
Making displays public is a powerful feature. As a process engineer you can create a display that you use to hone in on a set of data and then quickly and easily share that display with others across your organization. You can also send the URL for a shared display in an email or instant message to someone else in your organization for them to see as a public display. By default, all PI ProcessBook displays are automatically shared with World.
Visualizing PI System Data
Page 142
Exercise – Manage and share your PI Vision Displays
This solo or group activity is designed to maximize learning in a specific topic area. Your instructor will have instructions, and will coach you if you need assistance during the activity.
Objectives
Work with different options available in managing PI Vision displays
Problem Description
Your corporate PI Vision homepage has a long list of displays shared by others. You also have a lot of wonderful displays that you would like to share with your team members. You want to make the management of your displays and displays of your interest easy and label your displays in a way that your team members could find them easily.
Approach
Earlier, you built a PI Vision display and named it <initials> Tank Dashboard. Find it from the homepage by searching for it.
Step 1 : Share your display with everyone (World), so that everyone else can view it. If your
user ID ends in an odd number (ex. Student05) then also share your display with
Operators. If your user ID ends in an even number (ex. Student08) then also share
your display with Engineers.
Step 2 : Add the keyword of VPSD to it (stands for Visualizing PI System Data)
Step 3 : Choose 2 or 3 colors of the rainbow (Red, Orange, Yellow, Green, Blue, or Purple)
and add those as keywords. Be sure to separate keywords with a semicolon (;).
Step 4 : Find all of the displays that have the label of VPSD or that match one of the colors
you chose. Pick your favorites and add them to your favorites list.
Visualizing PI System Data
Page 143
7.4 View PI ProcessBook Displays from Anywhere, on Any Device, at Any Time
Having access to the PI ProcessBook displays built so far from any device and at any time could be a valuable timesaver when communicating with the plant. So far we had only been able to view these displays from PCs with the PI ProcessBook application installed on them.
You can import PDI, SVG and PIW display files created in PI ProcessBook to PI Vision and view them using any modern browser, from anywhere and at any time. You can:
zoom in on a PI ProcessBook display
adjust the time range of a display with the Timebar
tap any data value on the PI ProcessBook display to open a full screen “pop-up” trend
use the feature to transfer all the visible data items on the PI ProcessBook display to a native PI Vision display that can be used for further analysis
Note: PI Vision does not support Visual Basic for Applications (VBA) scripts or third-party ActiveX controls when viewing PI ProcessBook displays.http://www.youtube.com/watch?v=bUOW1yVBLnk
Your PI administrator specifies which folders you want PI Vision to monitor for PI ProcessBook displays. When the monitoring service detects a new, modified, or deleted PI ProcessBook file in these folders, it automatically adds, updates, or deletes it from PI Vision. All PDI, SVG and PIW files in the directory are automatically imported into PI Vision.
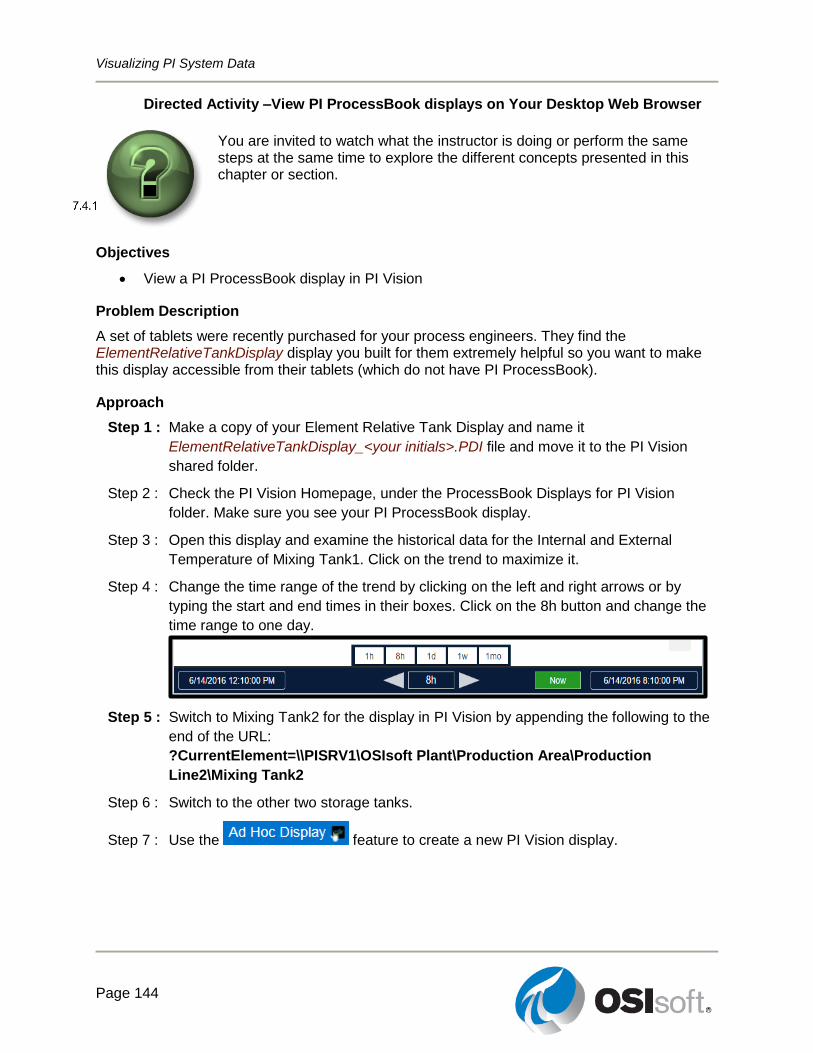
Visualizing PI System Data
Page 144
Directed Activity –View PI ProcessBook displays on Your Desktop Web Browser
You are invited to watch what the instructor is doing or perform the same steps at the same time to explore the different concepts presented in this chapter or section.
Objectives
View a PI ProcessBook display in PI Vision
Problem Description
A set of tablets were recently purchased for your process engineers. They find the ElementRelativeTankDisplay display you built for them extremely helpful so you want to make this display accessible from their tablets (which do not have PI ProcessBook).
Approach
Step 1 : Make a copy of your Element Relative Tank Display and name it
ElementRelativeTankDisplay_<your initials>.PDI file and move it to the PI Vision
shared folder.
Step 2 : Check the PI Vision Homepage, under the ProcessBook Displays for PI Vision
folder. Make sure you see your PI ProcessBook display.
Step 3 : Open this display and examine the historical data for the Internal and External
Temperature of Mixing Tank1. Click on the trend to maximize it.
Step 4 : Change the time range of the trend by clicking on the left and right arrows or by
typing the start and end times in their boxes. Click on the 8h button and change the
time range to one day.
Step 5 : Switch to Mixing Tank2 for the display in PI Vision by appending the following to the
end of the URL:
?CurrentElement=\\PISRV1\OSIsoft Plant\Production Area\Production
Line2\Mixing Tank2
Step 6 : Switch to the other two storage tanks.
Step 7 : Use the feature to create a new PI Vision display.
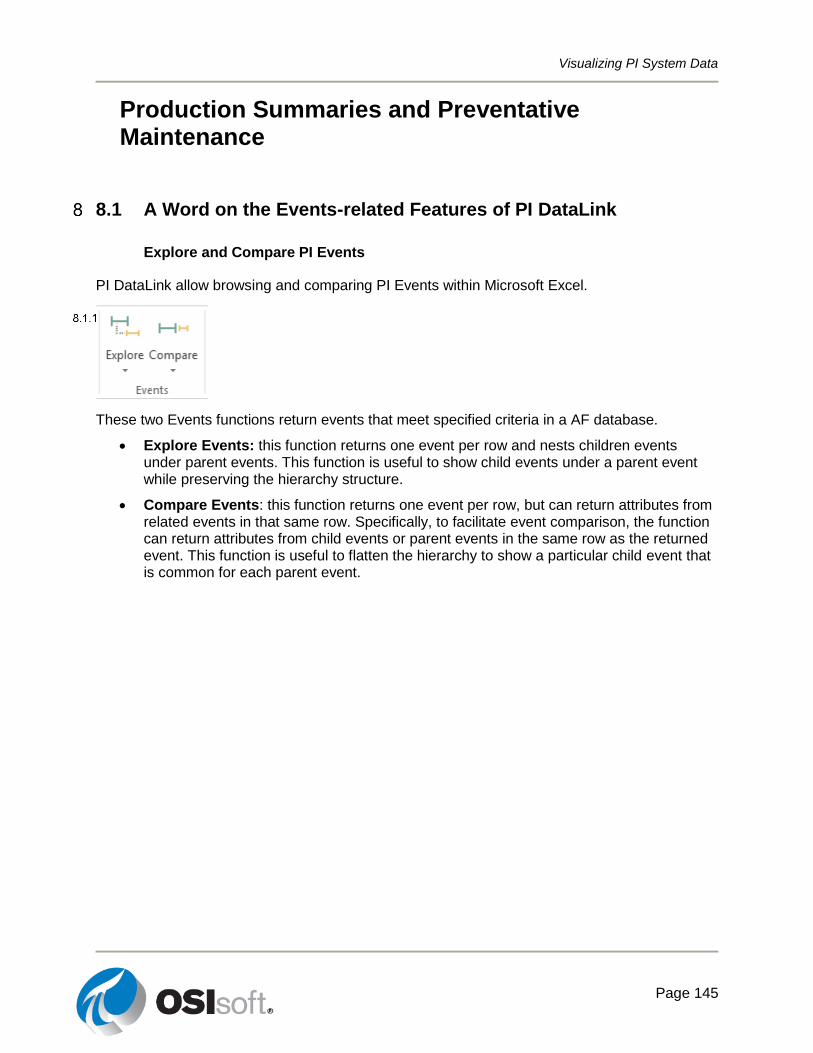
Visualizing PI System Data
Page 145
Production Summaries and Preventative Maintenance
8.1 A Word on the Events-related Features of PI DataLink
Explore and Compare PI Events
PI DataLink allow browsing and comparing PI Events within Microsoft Excel.
These two Events functions return events that meet specified criteria in a AF database.
Explore Events: this function returns one event per row and nests children events under parent events. This function is useful to show child events under a parent event while preserving the hierarchy structure.
Compare Events: this function returns one event per row, but can return attributes from related events in that same row. Specifically, to facilitate event comparison, the function can return attributes from child events or parent events in the same row as the returned event. This function is useful to flatten the hierarchy to show a particular child event that is common for each parent event.
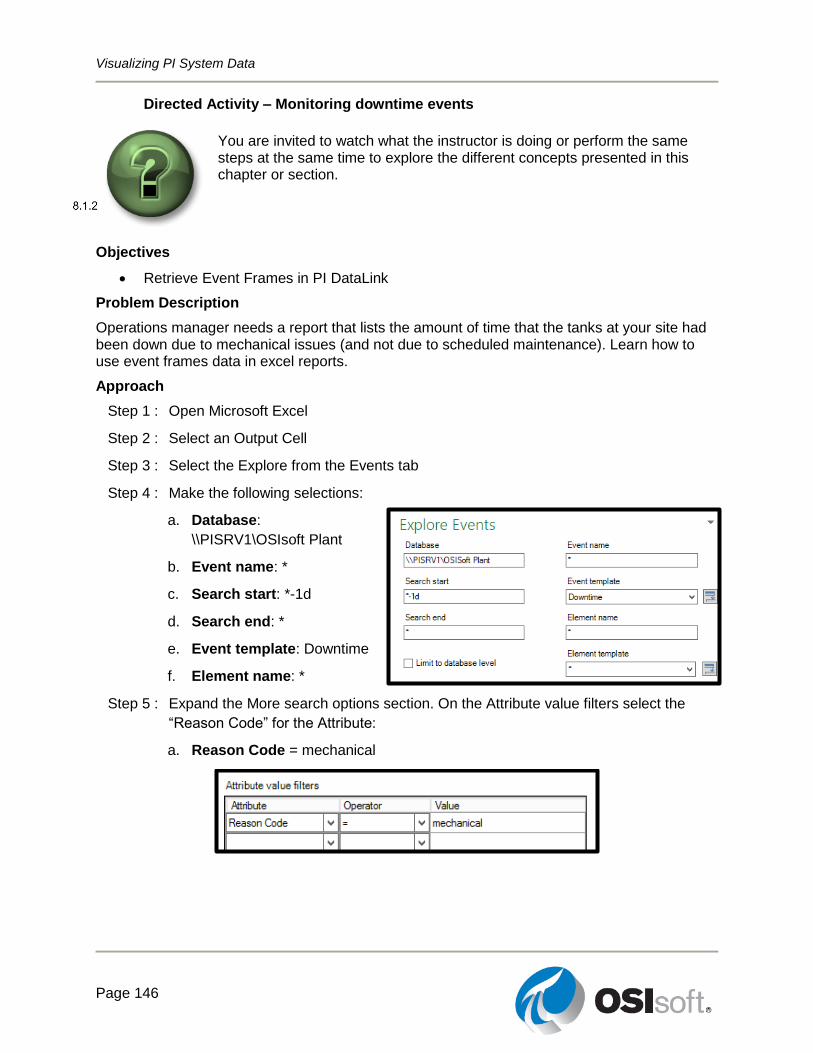
Visualizing PI System Data
Page 146
Directed Activity – Monitoring downtime events
You are invited to watch what the instructor is doing or perform the same steps at the same time to explore the different concepts presented in this chapter or section.
Objectives
Retrieve Event Frames in PI DataLink
Problem Description
Operations manager needs a report that lists the amount of time that the tanks at your site had been down due to mechanical issues (and not due to scheduled maintenance). Learn how to use event frames data in excel reports.
Approach
Step 1 : Open Microsoft Excel
Step 2 : Select an Output Cell
Step 3 : Select the Explore from the Events tab
Step 4 : Make the following selections:
a. Database:
\\PISRV1\OSIsoft Plant
b. Event name: *
c. Search start: *-1d
d. Search end: *
e. Event template: Downtime
f. Element name: *
Step 5 : Expand the More search options section. On the Attribute value filters select the
“Reason Code” for the Attribute:
a. Reason Code = mechanical
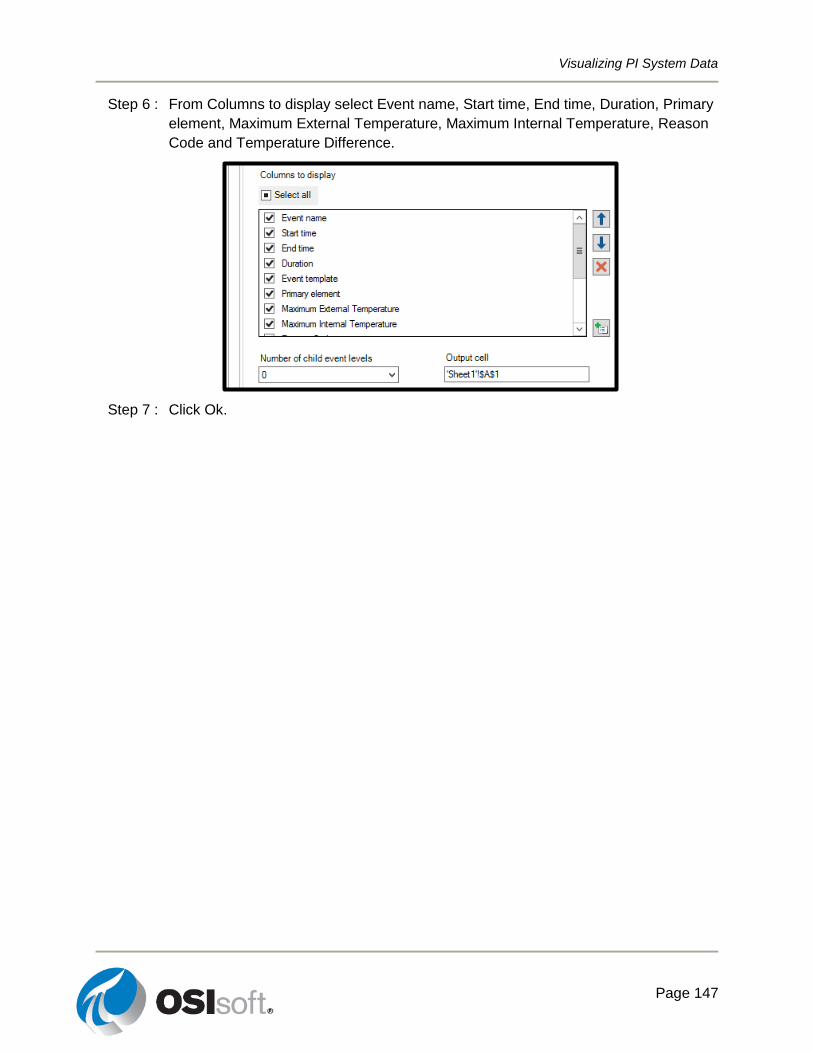
Visualizing PI System Data
Page 147
Step 6 : From Columns to display select Event name, Start time, End time, Duration, Primary
element, Maximum External Temperature, Maximum Internal Temperature, Reason
Code and Temperature Difference.
Step 7 : Click Ok.
Visualizing PI System Data
Page 148
Exercise – Analyzing downtime events
This solo or group activity is designed to maximize learning in a specific topic area. Your instructor will have instructions, and will coach you if you need assistance during the activity.
Objectives
Analyze Event Frames retrieved from PI DataLink using PivotChart and PivotTable
Problem Description
The operations manager now needs a report that shows which downtime reason is most prevalent and a comparison showing which tanks are the most problematic. He also would like to see information about the total production loss from the tanks.
Approach
Step 1 : You will use the template provided in sheets Downtime Raw Data and Evaluating
Tank Downtime of the file PI_DataLink-Exercises_<YourInitials>.xlsx.
Step 2 : Open the Downtime Raw Data Tab Select cell A7 as your Output Cell
Step 3 : Select the Compare from the Events tab
Step 4 : Make the following selections:
a. Database:
\\PISRV1\OSIsoft Plant
b. Event name: *
c. Search start: T-7d
d. Search end: *
e. Event template: Downtime
f. Element name: *
Step 5 : From Columns to display select Event name, Start time, End time, Duration, Event
Template, Primary element, Event Duration (min), Maximum External Temperature,
Maximum Internal Temperature, Reason Code, Production Loss (gal), and
Temperature Difference.
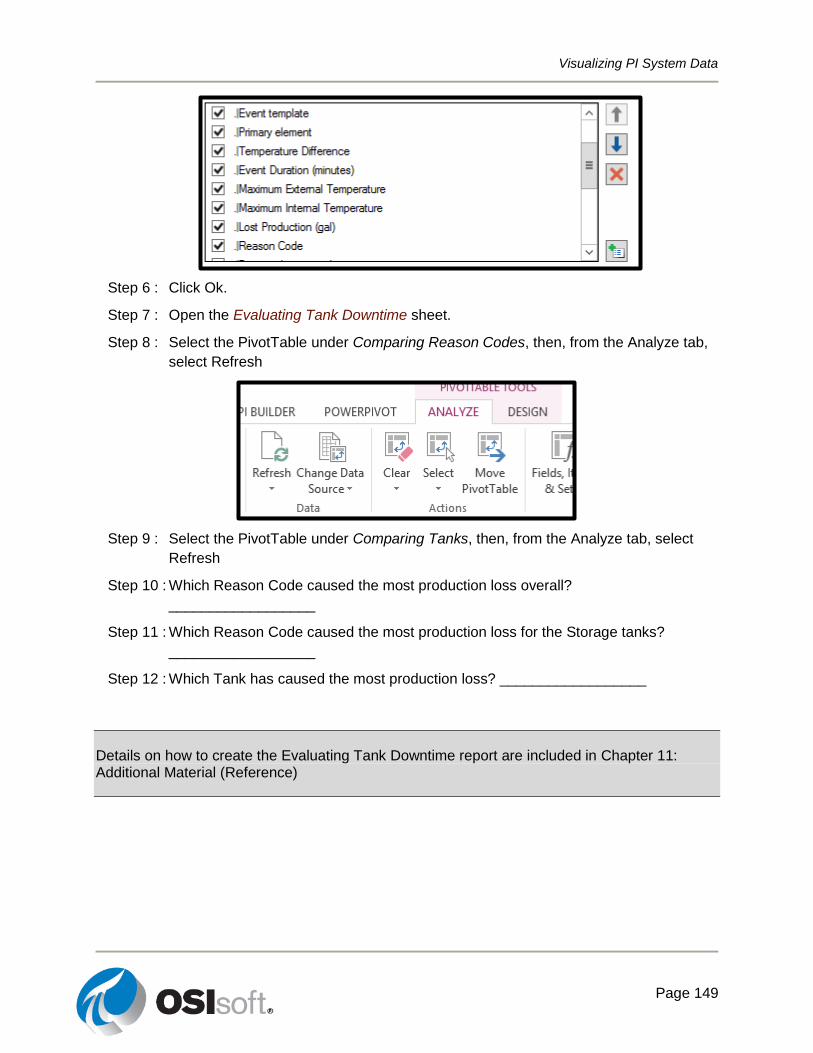
Visualizing PI System Data
Page 149
Step 6 : Click Ok.
Step 7 : Open the Evaluating Tank Downtime sheet.
Step 8 : Select the PivotTable under Comparing Reason Codes, then, from the Analyze tab,
select Refresh
Step 9 : Select the PivotTable under Comparing Tanks, then, from the Analyze tab, select
Refresh
Step 10 : Which Reason Code caused the most production loss overall?
__________________
Step 11 : Which Reason Code caused the most production loss for the Storage tanks?
__________________
Step 12 : Which Tank has caused the most production loss? __________________
Details on how to create the Evaluating Tank Downtime report are included in Chapter 11: Additional Material (Reference)
Visualizing PI System Data
Page 150
8.2 Production Summaries
Objectives
Obtain calculated values.
Obtain filtered values.
Use Excel conditional formatting to improve PI DataLink report functionality.
In the previous chapters, we used different PI DataLink functions to bring the raw data that is stored in PI Server. However, you may not be interested in bringing all the raw data and instead apply calculations on these raw values as they are retrieved from PI Server. PI DataLink offers two ways for bringing in calculated value:
1. Using different predefined calculation modes in PI DataLink as part of the Calculated Data function. These are some of the commonly used PI functions: Total, Minimum, Maximum, Standard Deviation, Range, Average, Count and Mean.
2. Using custom expressions in defining your desired calculation. The syntax used in these calculations is the same as Performance Equations syntax which is explained later in this chapter.
Calculated Data
The Calculated Data function returns a single calculated value or evenly spaced calculated values for a PI Point or a AF Attribute. Calculation modes are:
Total
Minimum
Maximum
Standard deviation
Range
Average
Count
Mean
These summary calculations provide statistical information for a point over a specified time period.
Selecting the Data Item radio button of the Calculated Data Function, most of the fields are similar to the other PI DataLink functions you have already worked with. Some of the fields specific to this function are:
Time interval: This is an optional field. If used, allows the behavior to be similar to the Sampled Data function and the calculations will be done for the evenly-spaced time intervals.
Calculation mode: The available modes are the ones listed above.
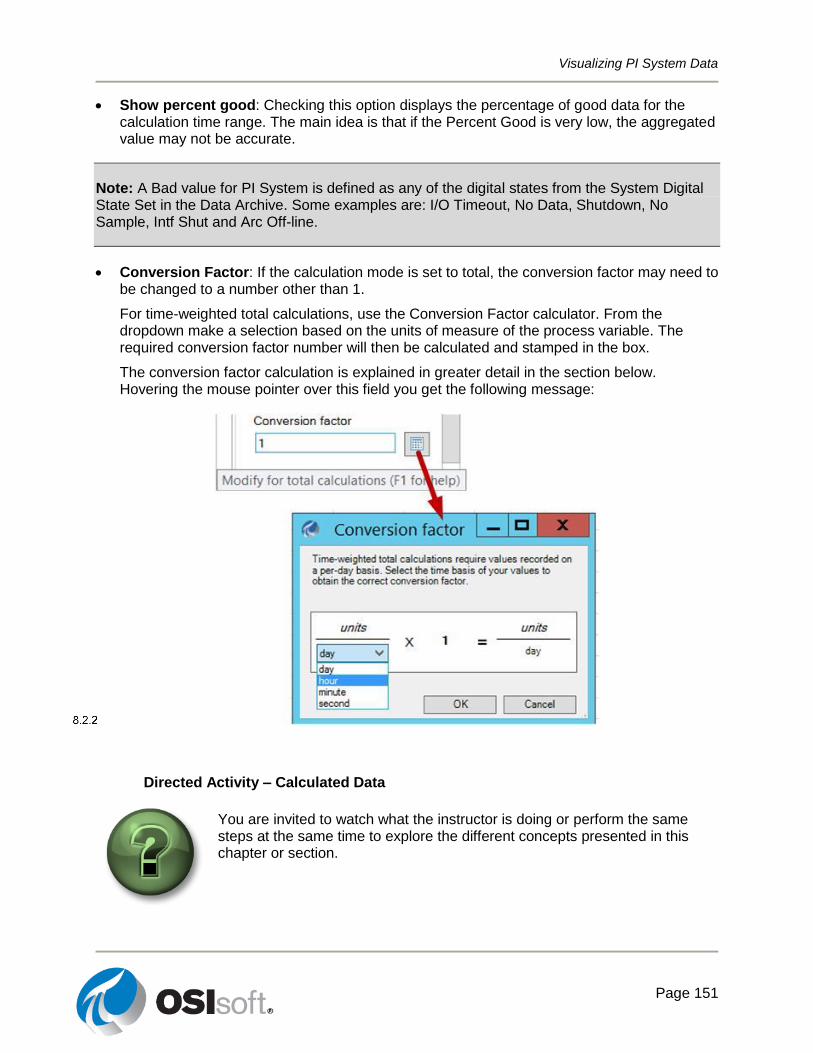
Visualizing PI System Data
Page 151
Show percent good: Checking this option displays the percentage of good data for the calculation time range. The main idea is that if the Percent Good is very low, the aggregated value may not be accurate.
Note: A Bad value for PI System is defined as any of the digital states from the System Digital State Set in the Data Archive. Some examples are: I/O Timeout, No Data, Shutdown, No Sample, Intf Shut and Arc Off-line.
Conversion Factor: If the calculation mode is set to total, the conversion factor may need to be changed to a number other than 1.
For time-weighted total calculations, use the Conversion Factor calculator. From the dropdown make a selection based on the units of measure of the process variable. The required conversion factor number will then be calculated and stamped in the box.
The conversion factor calculation is explained in greater detail in the section below. Hovering the mouse pointer over this field you get the following message:
Directed Activity – Calculated Data
You are invited to watch what the instructor is doing or perform the same steps at the same time to explore the different concepts presented in this chapter or section.
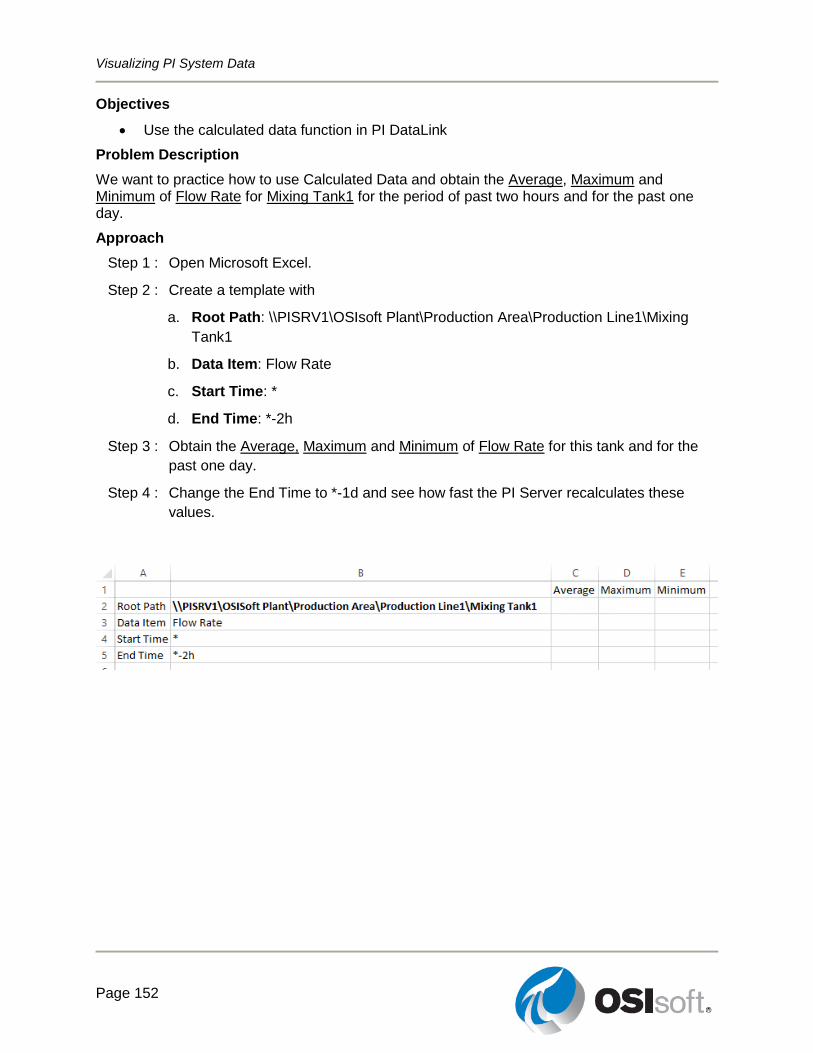
Visualizing PI System Data
Page 152
Objectives
Use the calculated data function in PI DataLink
Problem Description
We want to practice how to use Calculated Data and obtain the Average, Maximum and Minimum of Flow Rate for Mixing Tank1 for the period of past two hours and for the past one day.
Approach
Step 1 : Open Microsoft Excel.
Step 2 : Create a template with
a. Root Path: \\PISRV1\OSIsoft Plant\Production Area\Production Line1\Mixing
Tank1
b. Data Item: Flow Rate
c. Start Time: *
d. End Time: *-2h
Step 3 : Obtain the Average, Maximum and Minimum of Flow Rate for this tank and for the
past one day.
Step 4 : Change the End Time to *-1d and see how fast the PI Server recalculates these
values.
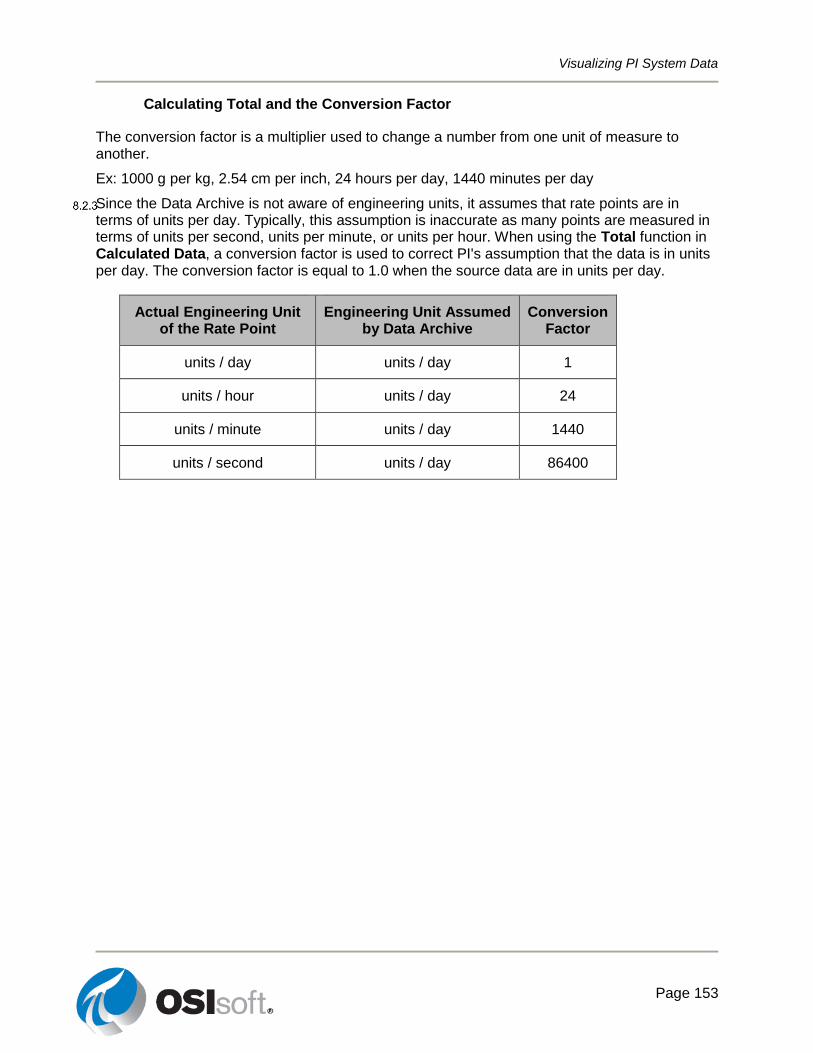
Visualizing PI System Data
Page 153
Calculating Total and the Conversion Factor
The conversion factor is a multiplier used to change a number from one unit of measure to another.
Ex: 1000 g per kg, 2.54 cm per inch, 24 hours per day, 1440 minutes per day
Since the Data Archive is not aware of engineering units, it assumes that rate points are in terms of units per day. Typically, this assumption is inaccurate as many points are measured in terms of units per second, units per minute, or units per hour. When using the Total function in Calculated Data, a conversion factor is used to correct PI's assumption that the data is in units per day. The conversion factor is equal to 1.0 when the source data are in units per day.
Actual Engineering Unit of the Rate Point
Engineering Unit Assumed by Data Archive
Conversion Factor
units / day units / day 1
units / hour units / day 24
units / minute units / day 1440
units / second units / day 86400
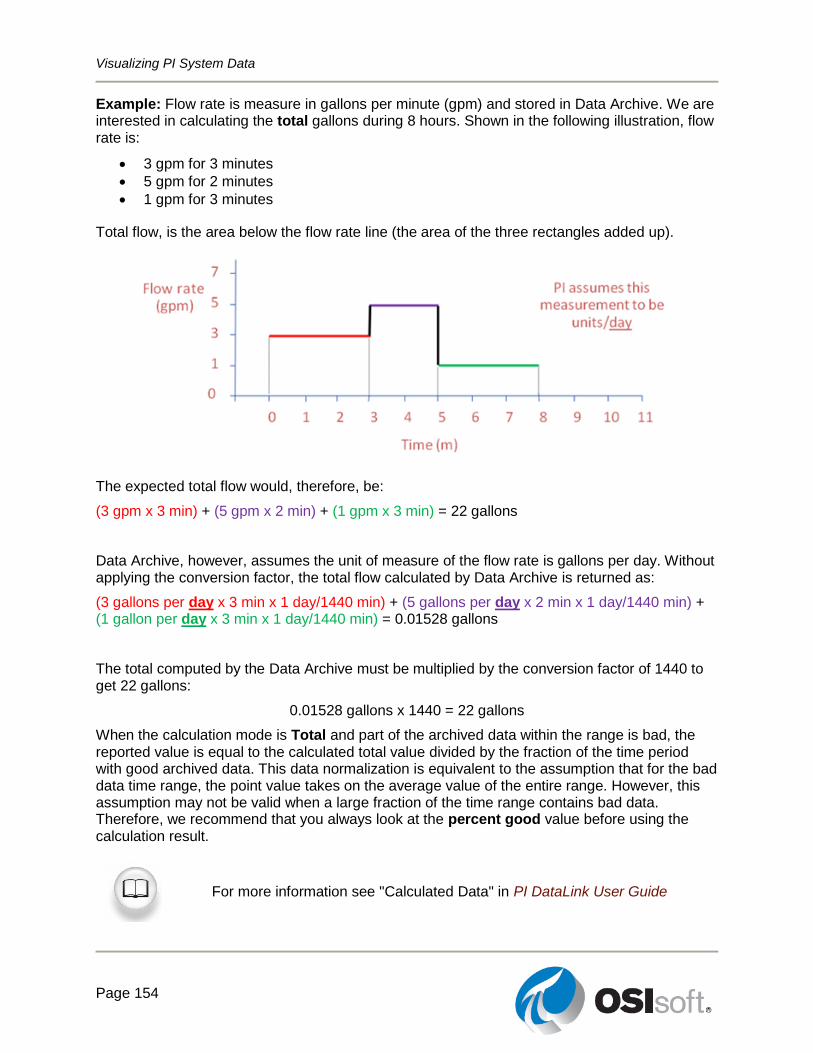
Visualizing PI System Data
Page 154
Example: Flow rate is measure in gallons per minute (gpm) and stored in Data Archive. We are interested in calculating the total gallons during 8 hours. Shown in the following illustration, flow rate is:
3 gpm for 3 minutes
5 gpm for 2 minutes
1 gpm for 3 minutes
Total flow, is the area below the flow rate line (the area of the three rectangles added up).
The expected total flow would, therefore, be:
(3 gpm x 3 min) + (5 gpm x 2 min) + (1 gpm x 3 min) = 22 gallons
Data Archive, however, assumes the unit of measure of the flow rate is gallons per day. Without applying the conversion factor, the total flow calculated by Data Archive is returned as:
(3 gallons per day x 3 min x 1 day/1440 min) + (5 gallons per day x 2 min x 1 day/1440 min) + (1 gallon per day x 3 min x 1 day/1440 min) = 0.01528 gallons
The total computed by the Data Archive must be multiplied by the conversion factor of 1440 to get 22 gallons:
0.01528 gallons x 1440 = 22 gallons
When the calculation mode is Total and part of the archived data within the range is bad, the reported value is equal to the calculated total value divided by the fraction of the time period with good archived data. This data normalization is equivalent to the assumption that for the bad data time range, the point value takes on the average value of the entire range. However, this assumption may not be valid when a large fraction of the time range contains bad data. Therefore, we recommend that you always look at the percent good value before using the calculation result.
For more information see "Calculated Data" in PI DataLink User Guide
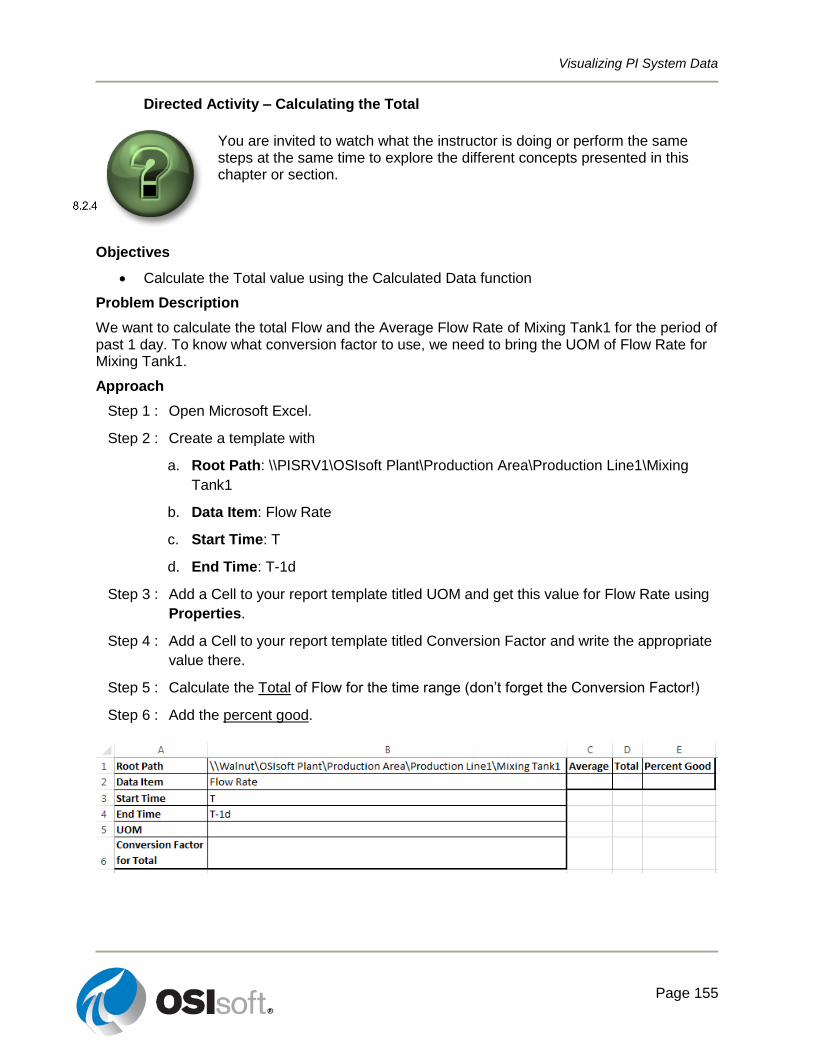
Visualizing PI System Data
Page 155
Directed Activity – Calculating the Total
You are invited to watch what the instructor is doing or perform the same steps at the same time to explore the different concepts presented in this chapter or section.
Objectives
Calculate the Total value using the Calculated Data function
Problem Description
We want to calculate the total Flow and the Average Flow Rate of Mixing Tank1 for the period of past 1 day. To know what conversion factor to use, we need to bring the UOM of Flow Rate for Mixing Tank1.
Approach
Step 1 : Open Microsoft Excel.
Step 2 : Create a template with
a. Root Path: \\PISRV1\OSIsoft Plant\Production Area\Production Line1\Mixing
Tank1
b. Data Item: Flow Rate
c. Start Time: T
d. End Time: T-1d
Step 3 : Add a Cell to your report template titled UOM and get this value for Flow Rate using
Properties.
Step 4 : Add a Cell to your report template titled Conversion Factor and write the appropriate
value there.
Step 5 : Calculate the Total of Flow for the time range (don’t forget the Conversion Factor!)
Step 6 : Add the percent good.
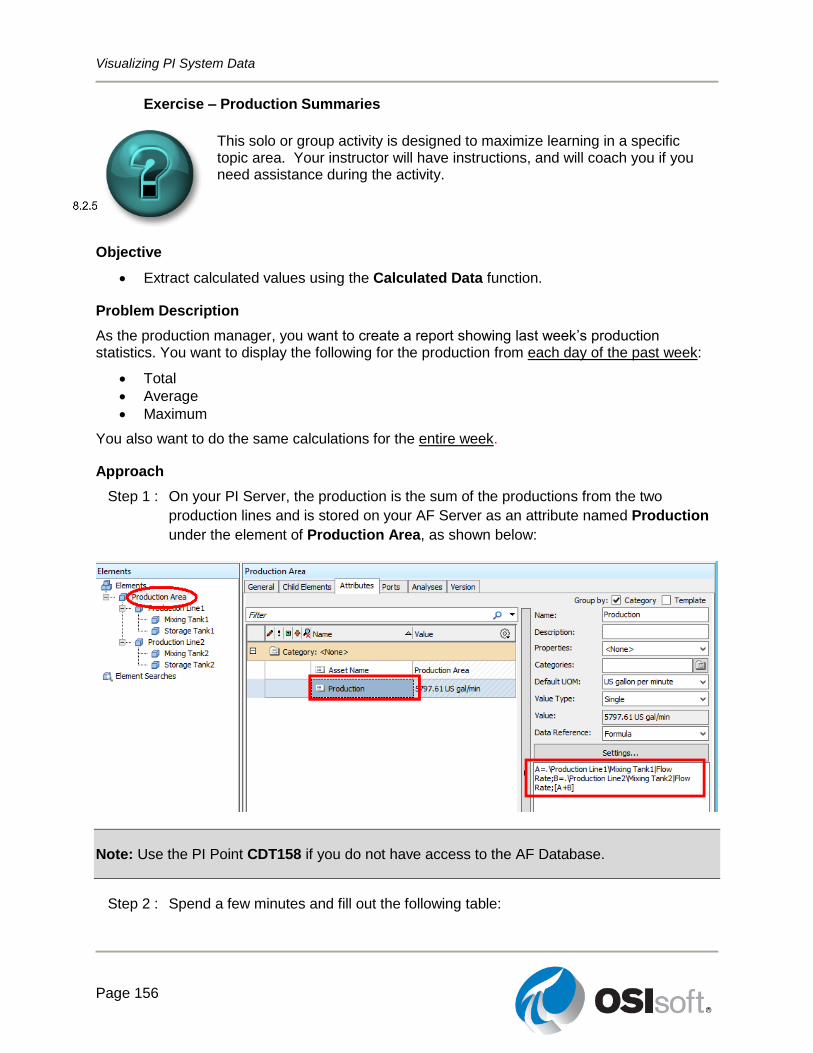
Visualizing PI System Data
Page 156
Exercise – Production Summaries
This solo or group activity is designed to maximize learning in a specific topic area. Your instructor will have instructions, and will coach you if you need assistance during the activity.
Objective
Extract calculated values using the Calculated Data function.
Problem Description
As the production manager, you want to create a report showing last week’s production statistics. You want to display the following for the production from each day of the past week:
Total
Average
Maximum
You also want to do the same calculations for the entire week.
Approach
Step 1 : On your PI Server, the production is the sum of the productions from the two
production lines and is stored on your AF Server as an attribute named Production
under the element of Production Area, as shown below:
Note: Use the PI Point CDT158 if you do not have access to the AF Database.
Step 2 : Spend a few minutes and fill out the following table:
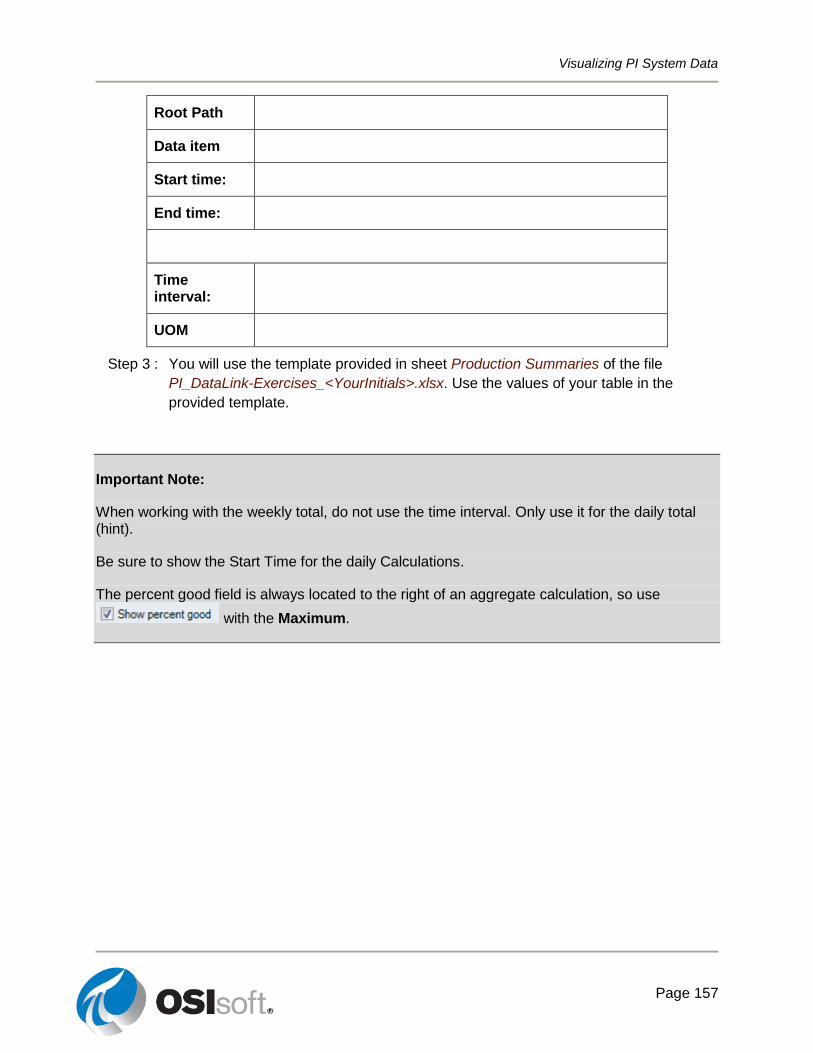
Visualizing PI System Data
Page 157
Root Path
Data item
Start time:
End time:
Time interval:
UOM
Step 3 : You will use the template provided in sheet Production Summaries of the file
PI_DataLink-Exercises_<YourInitials>.xlsx. Use the values of your table in the
provided template.
Important Note:
When working with the weekly total, do not use the time interval. Only use it for the daily total (hint).
Be sure to show the Start Time for the daily Calculations.
The percent good field is always located to the right of an aggregate calculation, so use
with the Maximum.
Visualizing PI System Data
Page 158
8.3 Performance Equations (PE) Syntax
Objectives
List the three rules of the PI PE syntax.
List and be able to find PE Functions.
Introduction
Performance Equations (PE) are special points in the PI Server that perform calculations using other PI Points as the data source and record the calculation results as the values of the PE point. These PE points require a specific syntax, known as the PE Syntax. This syntax is important because, while it originated with the PE points, it is now used in multiple places. These include Asset Analytics for PI Server, PI ProcessBook Calculation Datasets, PI DataLink Expressions, and PI WebParts PI Calculation Datasets. They are also used in filter expressions, found throughout these client tools.
The Three Rules of PE
The three rules of PE Syntax are:
Rule 1: Numbers and mathematical operators are written as is: 10, 0.125, 34.56, +, -, *, /, ^
Rule 2: Point names and timestamps, whether absolute or combined time format, are written in single quotes: 'CDT158', 'Temp_Tank_1', 'FIC5821.PV', '*', 't+6h', '13-Jun-2009'
Rule 3: Strings are written in double quotes: "This is a string"
In many places, the single and double quotes will be automatically filled in for you. This is most common when using a PI Tag Search window. However, you should always double check to ensure the proper syntax has been used. In addition, when looking at the state of a digital point, you will want to use the string value of the point, not the number from the digital set.
PE Functions
There is also a rich library of mathematical functions available. These are the typical
mathematical functions like sin(), cos(), log(), exp(), abs(), etc. There are many PI
functions that apply specifically to PI data beyond typical mathematical functions. These include things like:
PctGood() Percent of time point has good values.
TagAvg() Time-weighted average.
TagTot() Time integral over a period.
TimeGT() Total time, within a range, when a point is greater than a given value.
Month() Extract the month from a timestamp.
An expression can use If-Then-Else, relational and logical operators.
Syntax: IF expr0 THEN expr1 ELSE expr2

Visualizing PI System Data
Page 159
Example: IF 'Tag1'>=50 AND 'Tag2'<125 THEN "under limit" ELSE "good"
Notes: You must include the IF, THEN and ELSE keywords. The NoOutput() PE function can
be used in the THEN or ELSE clause. It is possible to nest if-then-else expressions.
For a complete list of built-in functions that can be used, consult the PEReference.chm document. You will find it under the PIPC\HELP folder, usually located at:
C:\Program Files (x86)\PIPC\HELP\PEReference.chm.
You can also search for it on OSIsoft techsupport website.
Visualizing PI System Data
Page 160
Exercise – PE Syntax
This solo or group activity is designed to maximize learning in a specific topic area. Your instructor will have instructions, and will coach you if you need assistance during the activity.
Objective
Apply the PI PE syntax to different calculation and filtering problems.
Problem Description
Instead of getting all the raw data into your report, you want to use the following custom calculations and filtering options. You will use PE functions and follow the PE rules in building these expressions.
Approach
Step 1 : Use the PEReference.chm help file to fill out the table below.
Calculation/Filter Your PE expression Applicable PE
functions
Level of the tank at 8 am this morning (level is measured in BA:LEVEL.1 point)
TagVal()
Time-weighted total for the point SINUSOID over the last 12 hours, but only if at least 85% of the values used in the calculation are considered good
TagTot()
Display OVERHEATED when the point BA:TEMP.1 is greater than 45.
If…then…else
The amount of time the controller mode, measured in CDM158 point, was Manual, during the past 4 days
TimeEQ()
Visualizing PI System Data
Page 161
8.4 Preventative Maintenance
Time Filtered Data
You have a Pump and would like to implement a Preventative Maintenance program, which is to determine the time period the pump was running. These total hours could then be checked against the data that the pump manufacturer has, on when to oil the bearings or replace them, every 10,000 hours, for example.
If you have a PI Point recording the status of the pump (if it is ON or OFF) you would be able to perform your Preventative Maintenance program by using the Time Filtered function. The Time Filtered function returns the amount of time that a performance equation evaluates to true during a specified time period. You would, therefore, need to specify the following fields for this function:
Expression(s)
o Can specify 1 or more and it would follow the Performance Equation format discussed in section 9.2. Data items permitted in expressions are:
PI points
AF attributes that store data references to PI points
AF attributes that store constant values
Start Time and End Time.
Time Unit
o i.e. The pump was running for 5 seconds/minutes/hours/days
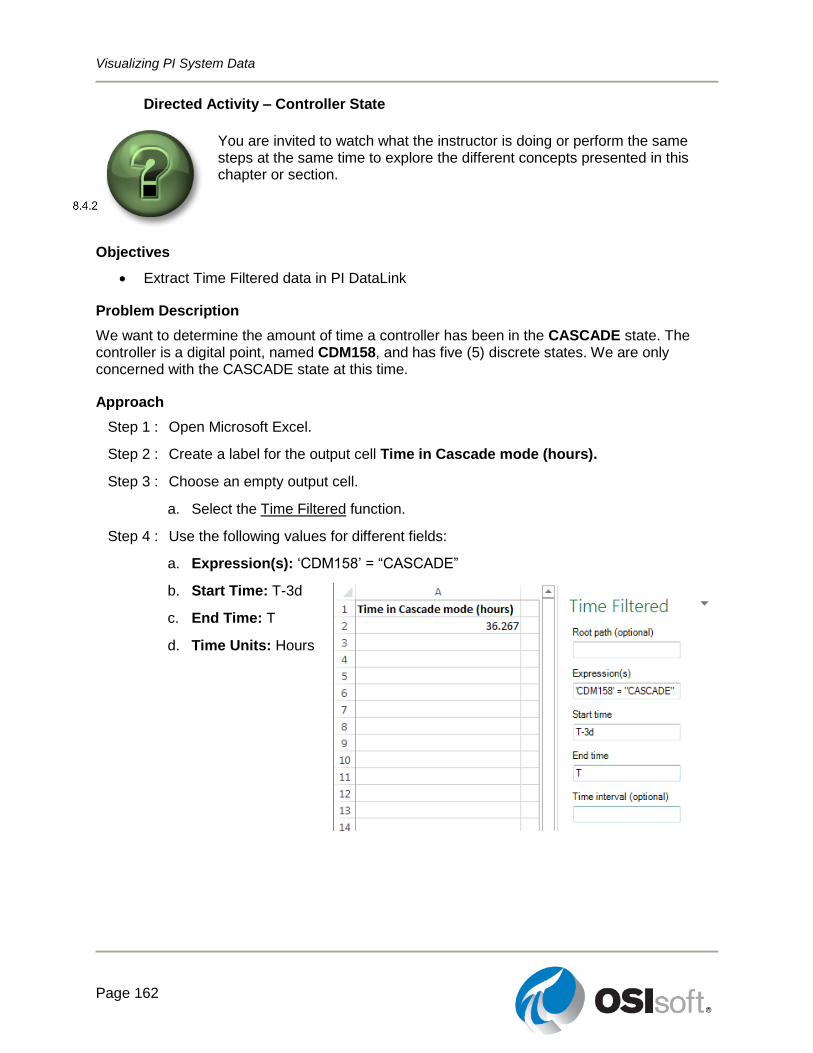
Visualizing PI System Data
Page 162
Directed Activity – Controller State
You are invited to watch what the instructor is doing or perform the same steps at the same time to explore the different concepts presented in this chapter or section.
Objectives
Extract Time Filtered data in PI DataLink
Problem Description
We want to determine the amount of time a controller has been in the CASCADE state. The controller is a digital point, named CDM158, and has five (5) discrete states. We are only concerned with the CASCADE state at this time.
Approach
Step 1 : Open Microsoft Excel.
Step 2 : Create a label for the output cell Time in Cascade mode (hours).
Step 3 : Choose an empty output cell.
a. Select the Time Filtered function.
Step 4 : Use the following values for different fields:
a. Expression(s): ‘CDM158’ = “CASCADE”
b. Start Time: T-3d
c. End Time: T
d. Time Units: Hours
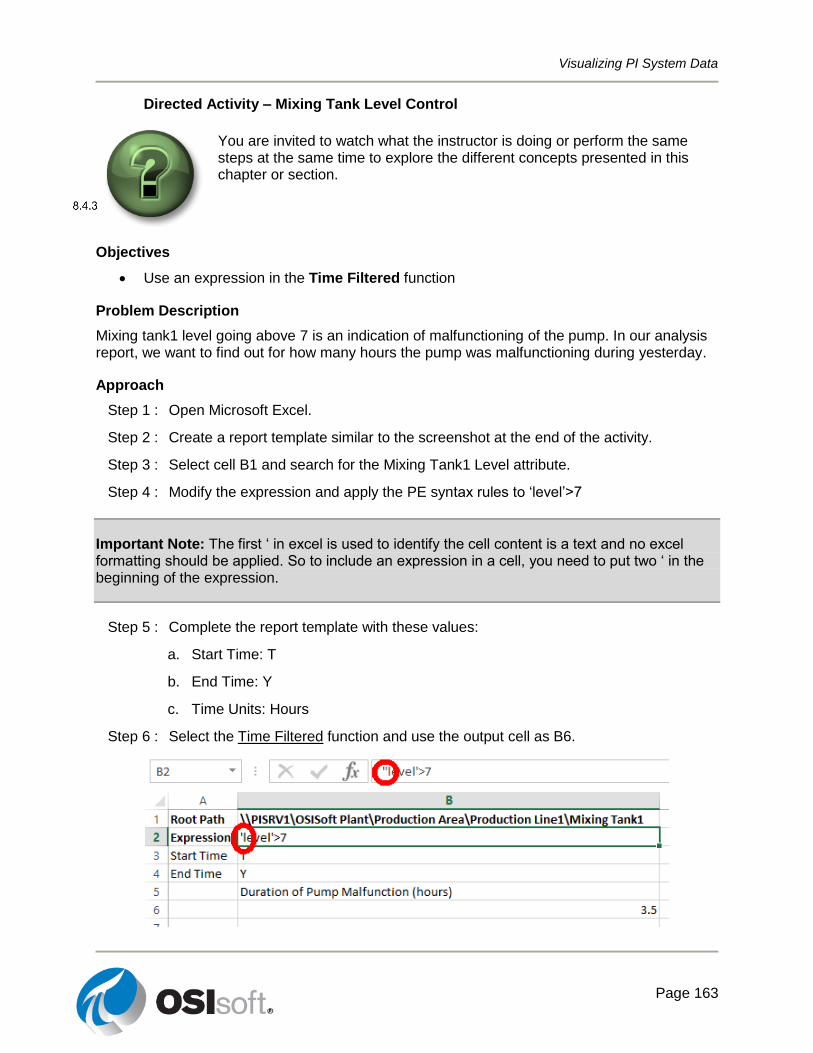
Visualizing PI System Data
Page 163
Directed Activity – Mixing Tank Level Control
You are invited to watch what the instructor is doing or perform the same steps at the same time to explore the different concepts presented in this chapter or section.
Objectives
Use an expression in the Time Filtered function
Problem Description
Mixing tank1 level going above 7 is an indication of malfunctioning of the pump. In our analysis report, we want to find out for how many hours the pump was malfunctioning during yesterday.
Approach
Step 1 : Open Microsoft Excel.
Step 2 : Create a report template similar to the screenshot at the end of the activity.
Step 3 : Select cell B1 and search for the Mixing Tank1 Level attribute.
Step 4 : Modify the expression and apply the PE syntax rules to ‘level’>7
Important Note: The first ‘ in excel is used to identify the cell content is a text and no excel formatting should be applied. So to include an expression in a cell, you need to put two ‘ in the beginning of the expression.
Step 5 : Complete the report template with these values:
a. Start Time: T
b. End Time: Y
c. Time Units: Hours
Step 6 : Select the Time Filtered function and use the output cell as B6.
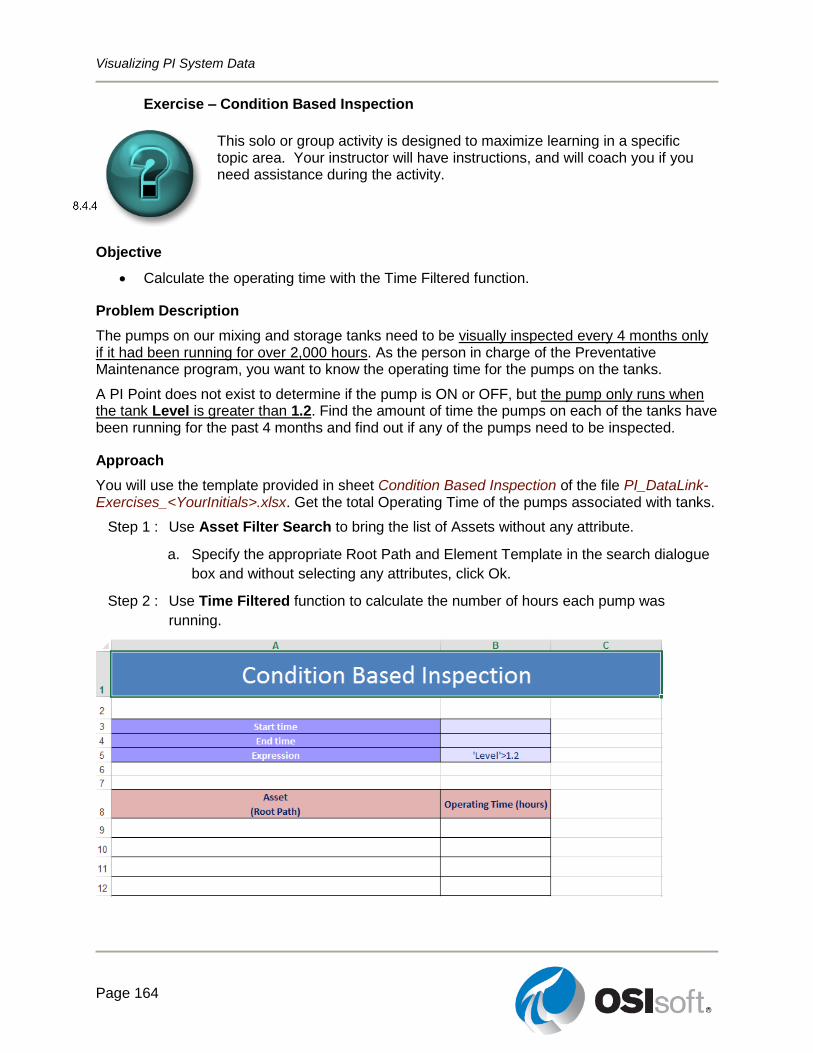
Visualizing PI System Data
Page 164
Exercise – Condition Based Inspection
This solo or group activity is designed to maximize learning in a specific topic area. Your instructor will have instructions, and will coach you if you need assistance during the activity.
Objective
Calculate the operating time with the Time Filtered function.
Problem Description
The pumps on our mixing and storage tanks need to be visually inspected every 4 months only if it had been running for over 2,000 hours. As the person in charge of the Preventative Maintenance program, you want to know the operating time for the pumps on the tanks.
A PI Point does not exist to determine if the pump is ON or OFF, but the pump only runs when the tank Level is greater than 1.2. Find the amount of time the pumps on each of the tanks have been running for the past 4 months and find out if any of the pumps need to be inspected.
Approach
You will use the template provided in sheet Condition Based Inspection of the file PI_DataLink-Exercises_<YourInitials>.xlsx. Get the total Operating Time of the pumps associated with tanks.
Step 1 : Use Asset Filter Search to bring the list of Assets without any attribute.
a. Specify the appropriate Root Path and Element Template in the search dialogue
box and without selecting any attributes, click Ok.
Step 2 : Use Time Filtered function to calculate the number of hours each pump was
running.
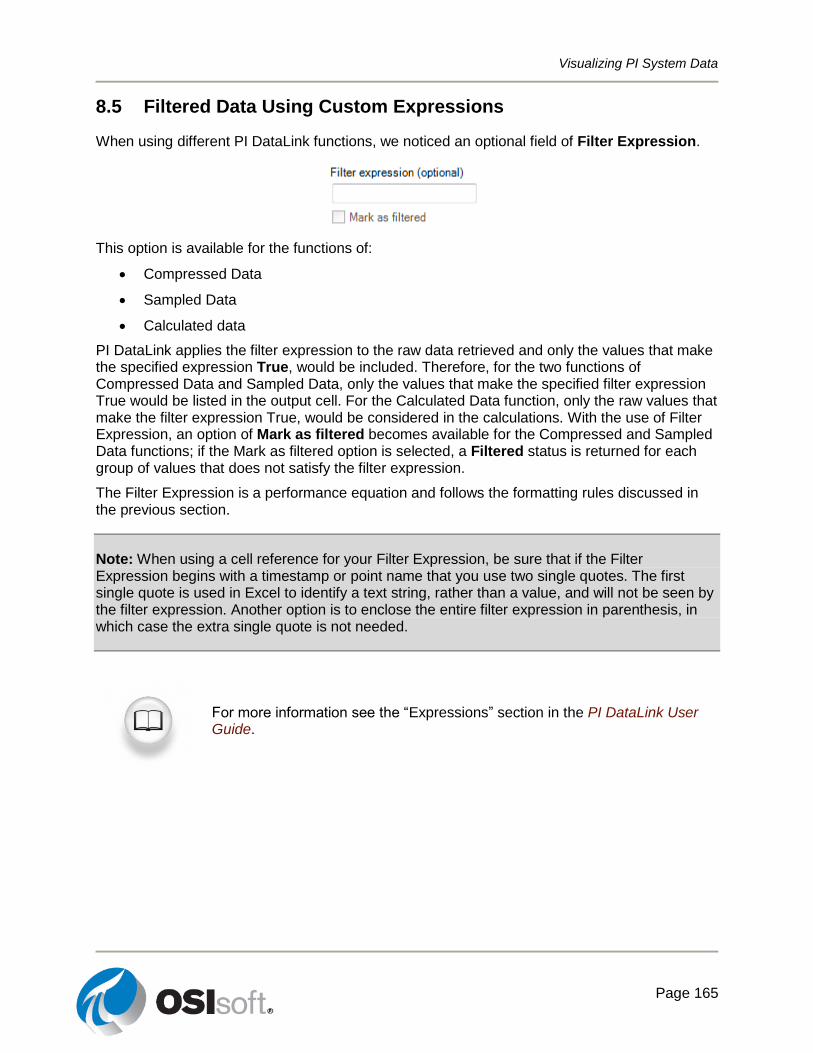
Visualizing PI System Data
Page 165
8.5 Filtered Data Using Custom Expressions
When using different PI DataLink functions, we noticed an optional field of Filter Expression.
This option is available for the functions of:
Compressed Data
Sampled Data
Calculated data
PI DataLink applies the filter expression to the raw data retrieved and only the values that make the specified expression True, would be included. Therefore, for the two functions of Compressed Data and Sampled Data, only the values that make the specified filter expression True would be listed in the output cell. For the Calculated Data function, only the raw values that make the filter expression True, would be considered in the calculations. With the use of Filter Expression, an option of Mark as filtered becomes available for the Compressed and Sampled Data functions; if the Mark as filtered option is selected, a Filtered status is returned for each group of values that does not satisfy the filter expression.
The Filter Expression is a performance equation and follows the formatting rules discussed in the previous section.
Note: When using a cell reference for your Filter Expression, be sure that if the Filter Expression begins with a timestamp or point name that you use two single quotes. The first single quote is used in Excel to identify a text string, rather than a value, and will not be seen by the filter expression. Another option is to enclose the entire filter expression in parenthesis, in which case the extra single quote is not needed.
For more information see the “Expressions” section in the PI DataLink User Guide.
Visualizing PI System Data
Page 166
Excel Conditional Formatting
This topic is not specific to PI DataLink, but the Conditional Formatting found in Microsoft Excel can give your PI DataLink reports a great look and a comprehensive perspective. It is useful for visually comparing values extracted from PI. Conditional Formatting is found in the Home Ribbon in the Styles section. You can use this functionality to provide highlighted maxima or minima, bar graph backgrounds, and many other visual cues about the data being displayed.
To use this functionality, first highlight the group of cells you wish to format. Then click on the Conditional Formatting button and choose a group and rule. For the Highlight Cells Rules and Top/Bottom Rules, you will see a preview of the formatting once you configure the appropriate limits. For Data Bars, Color Scales and Icon Sets, simply hover the mouse over each preconfigured option to preview its effect on the cells you selected. Click the desired rule to select it.
If none of the preconfigured rules suit your needs, you can configure additional rules using Conditional Formatting > New Rule. Multiple rules can be applied in configurable order using Conditional Formatting > Manage Rules.
Note: The MS Excel TODAY() function returns the serial number of the current date. The serial
number is the date-time code used by Microsoft Excel for date and time calculations. Microsoft Excel stores dates as whole number of days starting at 1900. Dates and times are values and therefore can be added, subtracted, and included in other calculations.
Syntax: =TODAY()
Example: =(TODAY() - 10 + 16/24) is today minus 10 days at 4 PM
When you enter a date in Microsoft Excel 97 and you enter only two digits for the year, Microsoft Excel enters the year as follows: The years 2000 through 2029 if you type 00 through 29 for the year. For example, if you type 5/28/19, Microsoft Excel assumes the date is May 28, 2019.The years 1930 through 1999 if you type 30 through 99 for the year. For example, if you type 5/28/91, Microsoft Excel assumes the date is May 28, 1991.
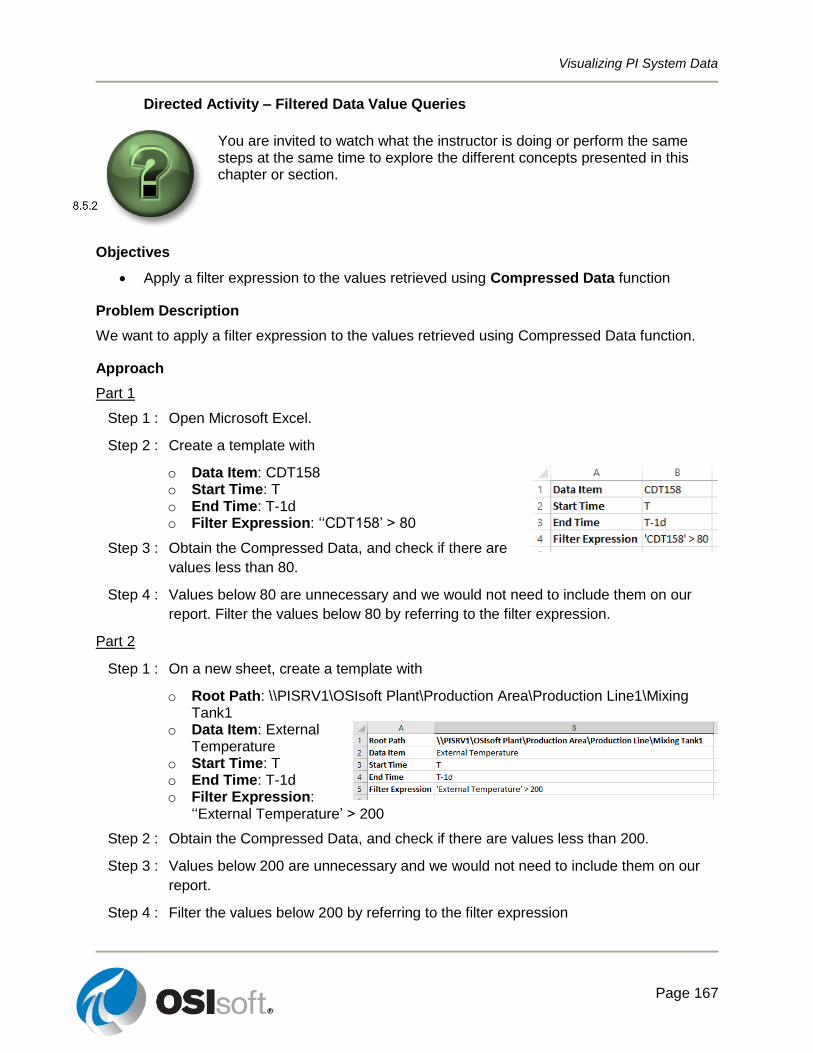
Visualizing PI System Data
Page 167
Directed Activity – Filtered Data Value Queries
You are invited to watch what the instructor is doing or perform the same steps at the same time to explore the different concepts presented in this chapter or section.
Objectives
Apply a filter expression to the values retrieved using Compressed Data function
Problem Description
We want to apply a filter expression to the values retrieved using Compressed Data function.
Approach
Part 1
Step 1 : Open Microsoft Excel.
Step 2 : Create a template with
o Data Item: CDT158 o Start Time: T o End Time: T-1d o Filter Expression: ‘‘CDT158’ > 80
Step 3 : Obtain the Compressed Data, and check if there are
values less than 80.
Step 4 : Values below 80 are unnecessary and we would not need to include them on our
report. Filter the values below 80 by referring to the filter expression.
Part 2
Step 1 : On a new sheet, create a template with
o Root Path: \\PISRV1\OSIsoft Plant\Production Area\Production Line1\Mixing Tank1
o Data Item: External Temperature
o Start Time: T o End Time: T-1d o Filter Expression:
‘‘External Temperature’ > 200
Step 2 : Obtain the Compressed Data, and check if there are values less than 200.
Step 3 : Values below 200 are unnecessary and we would not need to include them on our
report.
Step 4 : Filter the values below 200 by referring to the filter expression
Visualizing PI System Data
Page 168
Exercise – Production Level Report
This solo or group activity is designed to maximize learning in a specific topic area. Your instructor will have instructions, and will coach you if you need assistance during the activity.
Objectives
Use the Filter Expression option of the Sampled Data function to constrain the values that are extracted.
Problem Description
As a quality control manager, you want to examine the level of product in Mixing Tank1. Since there are many values getting archived, it is better to perform a Sampled Data query rather than a Compressed Data query.
You want to build a report for the level yesterday over the intervals of 10 minute. The report filters out mean tank levels, which is defined as a level between 4 and 6.
Approach
Step 1 : Spend a few minutes and fill out the following table:
Root Path
Data Item
Start Time
End Time
Interval
Upper Limit
Lower Limit
Filter Expression
Step 2 : You will use the template provided in sheet Production Level Report of the file
PI_DataLink-Exercises_<YourInitials>.xlsx.
Note: Are you familiar with the Excel function of CONCATENATE?
Visualizing PI System Data
Page 169
8.6 PI DataLink - Expression Data (Optional)
As we saw earlier, some PI DataLink functions accept either a data item or an expression as input. These functions have Data item and Expression options at the top of the task pane. So far, we only worked with the Data Item option. In PI DataLink, expressions are performance equations that you can use to incorporate mathematical operations and calculations based on PI System data items.
PI DataLink functions that can use Expressions (as well as Data Item) include:
Archive Value function
Sampled Data function
Timed Data function
PI Expressions behave much the same way that PI PE do. They follow the same expression syntax and can use one or many of the following Data items:
PI points
AF attributes that store data references to PI points
AF attributes that store constant values
The benefit to PI Expressions is that they only calculate on demand. However, the downside is that, unlike PI PE, there is no history of these calculations stored on the PI Server, so it is more difficult to see historical trends.
How is Calculated Data Function Different from PI Expressions?
One difference between PI Calculated Data and PI Expressions is shown in an example below. The PI Calculated Data computes the maximum of the point over each 1-day period for the last 7 days. The PI Expression shown computes the maximum of the Sampled Data of point for the most recent 8 hours of every 1-day period, for the last 7 days.
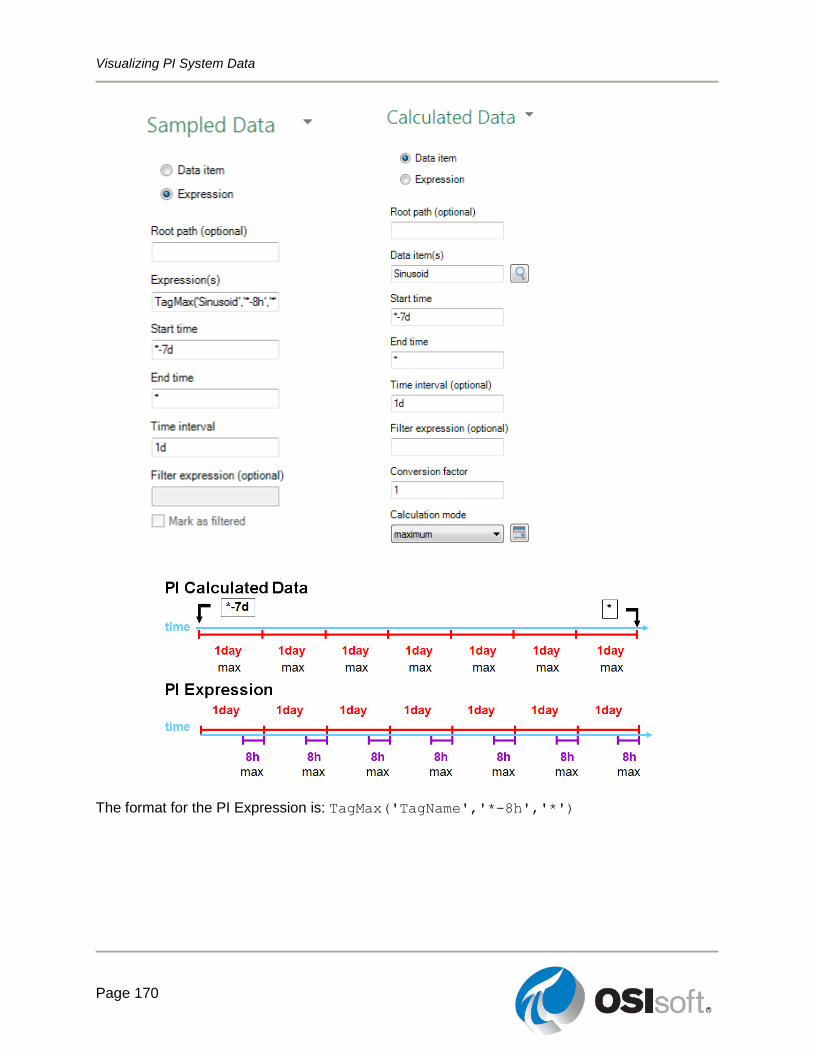
Visualizing PI System Data
Page 170
The format for the PI Expression is: TagMax('TagName','*-8h','*')

Visualizing PI System Data
Page 171
Just like the PI Calculated Data, it would be configured with a start time of *-7d, an end time of *, and an interval of 1 day (1d). Keep in mind that the ‘*’ in the expression does not always go to the current time of the machine, the ‘*’ in this case is represented by the right side of the 8 hour
bar below. If the PI expression was changed to TagMax('tag','*-1d','*'), the results of
the PI Calculated Data and the PI Expression would be identical. However, the PI Expression will contain an extra interval at the start time of the expression when compared directly with PI Calculated Data.
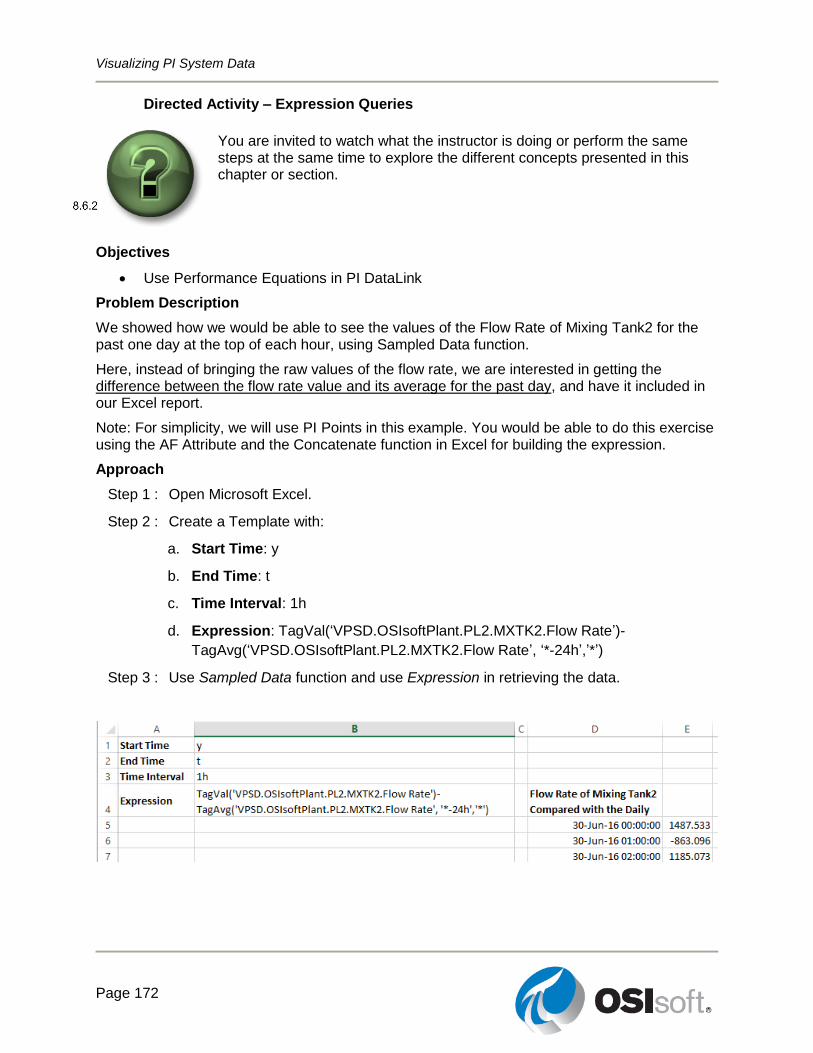
Visualizing PI System Data
Page 172
Directed Activity – Expression Queries
You are invited to watch what the instructor is doing or perform the same steps at the same time to explore the different concepts presented in this chapter or section.
Objectives
Use Performance Equations in PI DataLink
Problem Description
We showed how we would be able to see the values of the Flow Rate of Mixing Tank2 for the past one day at the top of each hour, using Sampled Data function.
Here, instead of bringing the raw values of the flow rate, we are interested in getting the difference between the flow rate value and its average for the past day, and have it included in our Excel report.
Note: For simplicity, we will use PI Points in this example. You would be able to do this exercise using the AF Attribute and the Concatenate function in Excel for building the expression.
Approach
Step 1 : Open Microsoft Excel.
Step 2 : Create a Template with:
a. Start Time: y
b. End Time: t
c. Time Interval: 1h
d. Expression: TagVal(‘VPSD.OSIsoftPlant.PL2.MXTK2.Flow Rate’)-
TagAvg(‘VPSD.OSIsoftPlant.PL2.MXTK2.Flow Rate’, ‘*-24h’,’*’)
Step 3 : Use Sampled Data function and use Expression in retrieving the data.
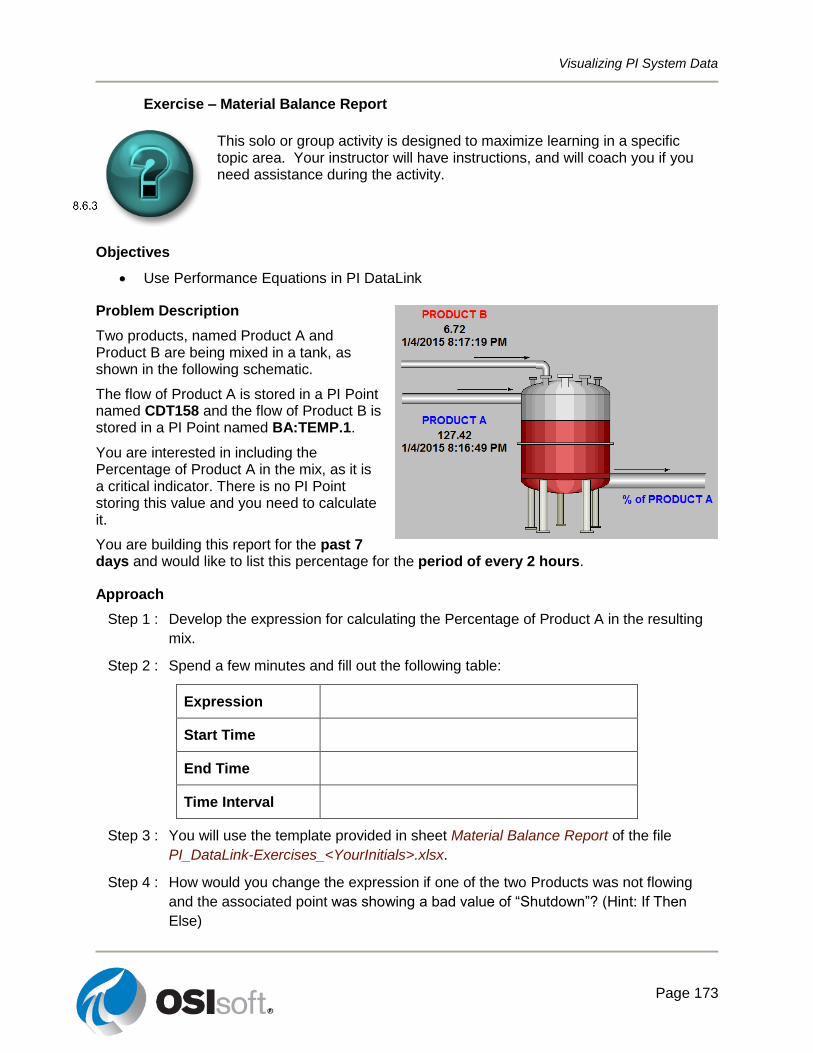
Visualizing PI System Data
Page 173
Exercise – Material Balance Report
This solo or group activity is designed to maximize learning in a specific topic area. Your instructor will have instructions, and will coach you if you need assistance during the activity.
Objectives
Use Performance Equations in PI DataLink
Problem Description
Two products, named Product A and Product B are being mixed in a tank, as shown in the following schematic.
The flow of Product A is stored in a PI Point named CDT158 and the flow of Product B is stored in a PI Point named BA:TEMP.1.
You are interested in including the Percentage of Product A in the mix, as it is a critical indicator. There is no PI Point storing this value and you need to calculate it.
You are building this report for the past 7 days and would like to list this percentage for the period of every 2 hours.
Approach
Step 1 : Develop the expression for calculating the Percentage of Product A in the resulting
mix.
Step 2 : Spend a few minutes and fill out the following table:
Expression
Start Time
End Time
Time Interval
Step 3 : You will use the template provided in sheet Material Balance Report of the file
PI_DataLink-Exercises_<YourInitials>.xlsx.
Step 4 : How would you change the expression if one of the two Products was not flowing
and the associated point was showing a bad value of “Shutdown”? (Hint: If Then
Else)

Visualizing PI System Data
Page 174
The Support You Get at OSIsoft
9.1 PI Square: The OSIsoft Community
PI Square, https://pisquare.osisoft.com, is the new OSIsoft community where you can get Technical Support for your questions, access the PI Developers Club (PI DevClub) for your coding projects, and connect to PI users worldwide to get more value out of your PI System.
PI Square uses the same login as the technical support site. If you have an OSIsoft login already, you do not need to register.
If you do not have an OSIsoft account and need to create one, go to PI Square homepage and click Log In at the top right. Click Register to go to the registration page.
PI Square community has places you go to collaborate, called Spaces. These spaces are generally named for a specific topic or purpose. Each space can contain multiple types of content, including discussions, documents, blog posts, polls, and more. Currently, PI Square has the following four spaces:
All Things PI
This is the general forum and is where OSIsoft Technical Support will keep watch to help answer questions and contribute to discussions. You can also find product spaces where you can get information on the PI Server, PI Interfaces and PI Connectors, PI Visualization, and other OSIsoft product families.
PI Developers Club
This provides developers with tools and support they need to create applications for the PI System. While support and content is offered within this community, links to some other external resources such as install kits are available here also.
Master PI
This allows you to take Online Learning courses, ask questions about online and in-person courses, and view webinars to provide you with tools to continue building your PI knowledge.
Welcome to PI Square!
This is where you can find out how to navigate around the community, learn about community functionality, and ask questions if you don't know where to go.
Visualizing PI System Data
Page 175
Exercise – Navigating PI Square
This solo or group activity is designed to maximize learning in a specific topic area. Your instructor will have instructions, and will coach you if you need assistance during the activity.
Objectives
Create a PI Square SSO Account and find answers about Visualization topics
Problem Description
You want to find a post about the following topics:
Future Data in PI DataLink
URL Parameters in PI Vision
Approach
Step 1 : Using a web browser, navigate to the PI Square website:
https://pisquare.osisoft.com
Step 2 : Log in to the PI Square community
a. If you do not have an OSIsoft SSO account, create one now. You will use the
same account to log into PI Square and the OSIsoft TechSupport website.
Step 3 : Search for a post for each of the topics:
a. Future Data in PI DataLink
b. URL Parameters in PI Vision
Step 4 : Read the various posts, add comments, or create your own posts if you have an
unanswered question.
Visualizing PI System Data
Page 176
9.2 Technical Support
Visit the technical support website, https://techsupport.osisoft.com often. You will be able to download any PI product your company is licensed for using. PI System Roadmap can be viewed to get information about the most current releases and predicated release dates and features for new version or products. You can login and view your Support Cases, both currently open and previously closed. You can also search through our Knowledge Base to try and troubleshoot any issues you may be having by referring to the rich collection of available KB Articles.
Here are the general phone number and email address for the OSIsoft Technical Support:
Phone: +1 510 297-5828
E-mail: [email protected]
Support may be provided in languages other than English in certain centers based on availability of attendants. If you select a local language option, we will make best efforts to connect you with an available Technical Support Engineer with that language skill. If no local language techsupport engineer is available to assist you, you will be routed to the first available attendant.
Before you contact Technical Support, it is helpful to have certain information readily available. OSIsoft technical support engineers will ask:
name of the product
version number
the time that the difficulty started
the computer platform (CPU type, operating system, and version number)
9.3 Learning
The OSIsoft Learning website, http://learning.osisoft.com, provides a variety of resources to the PI users to learn more about PI and educate themselves to gain more value out of their PI System. From here you can see our current training offerings and upcoming events.
Instructor Led Training
Instructor led training at our public training site - Our classic offering - Learn about the PI System at OSIsoft Training Centers with classes in several languages and growing!
Instructor led training at your site - Our personalized offering - Learn with customized curriculum and get coaching at your site, at your time, with your data!

Visualizing PI System Data
Page 177
OnLine Training
Small Private Online Courses - Our latest offering - Learn about the PI System from your own office or home, on your own schedule, with your own data! For more information go to https://pisquare.osisoft.com/community/Master-PI
On Demand Learning: YouTube Channel - Learning Anywhere, Everywhere - Learn about the PI system by watching any of our 1000+ free videos on You Tube! Playlist for various topics are available to help guide you through your training topic.
VLE – Virtual Learning Environment - is a fully functional PI System running in our Microsoft Azure cloud. We have a wide array of defined labs, from PI ProcessBook to AF to developer technologies.
Visualizing PI System Data
Page 178
Exercise – The OSIsoft Learning Channel
This solo or group activity is designed to maximize learning in a specific topic area. Your instructor will have instructions, and will coach you if you need assistance during the activity.
Objectives
Find a video on the OSIsoft YouTube Learning Channel to learn about a topic not covered in the Visualizing PI System Data Course
Problem Description
You want to learn how to build a PI ProcessBook display that has an XY Plot.
Approach
Step 1 : Use a web browser to navigate to YouTube.com
Step 2 : Search for the OSIsoft Learning Channel
Step 3 : Run a search to find a video about XY plots in PI ProcessBook, sample search: “XY
Plot Processbook”
Step 4 : One good video that explains XY Plots is the video: “OSIsoft: The xy plot in PI
ProcessBook. v3.0”
Step 5 : You may watch this video now or wait for another time.

Visualizing PI System Data
Page 179
9.4 Enabling Multiple Languages on Client Applications
All of the OSIsoft client tools, including PI Vision, PI ProcessBook and PI DataLink, support Multiple Languages. This is done through installing the MUI Language Pack of the client tool of interest.
The MUI Language Packs of PI Vision, PI ProcessBook and PI DataLink are provided in:
Japanese
Simplified Chinese
Korea
French
Spanish
Brazilian Portuguese
Russian
German
9.5 Further Questions
For questions about Licensing you can find your account manager listed at http://www.osisoft.com/ > Contact Us > Account Management.
For questions about existing Support Issues, contact technical support at 510 297-5828 or visit https://techsupport.osisoft.com > My Support > My Cases.
For questions about unresolved training issues, contact your instructor or email [email protected].
For all other questions, please contact our Customer Service group via email at [email protected].
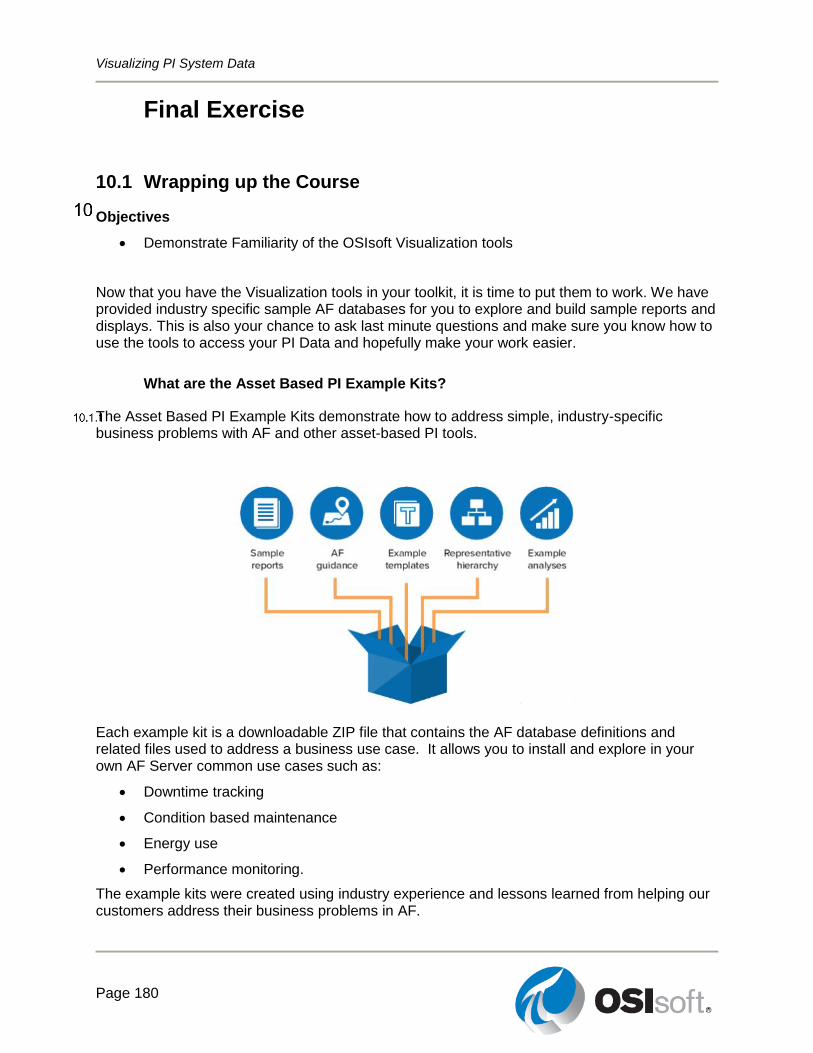
Visualizing PI System Data
Page 180
Final Exercise
10.1 Wrapping up the Course
Objectives
Demonstrate Familiarity of the OSIsoft Visualization tools
Now that you have the Visualization tools in your toolkit, it is time to put them to work. We have provided industry specific sample AF databases for you to explore and build sample reports and displays. This is also your chance to ask last minute questions and make sure you know how to use the tools to access your PI Data and hopefully make your work easier.
What are the Asset Based PI Example Kits?
The Asset Based PI Example Kits demonstrate how to address simple, industry-specific business problems with AF and other asset-based PI tools.
Each example kit is a downloadable ZIP file that contains the AF database definitions and related files used to address a business use case. It allows you to install and explore in your own AF Server common use cases such as:
Downtime tracking
Condition based maintenance
Energy use
Performance monitoring.
The example kits were created using industry experience and lessons learned from helping our customers address their business problems in AF.

Visualizing PI System Data
Page 181
Each kit contains:
AF database definitions that include element, event frame, and analysis templates
A small representative hierarchy
A PI ProcessBook display and/or PI DataLink spreadsheet
Written and video guidance for installation and use
Visit the Asset Based PI Example Kits page on PI Square for more information about the kits, including links for download as well as videos to help you get started.
https://pisquare.osisoft.com/community/all-things-pi/asset-based-pi-example-kits
Visualizing PI System Data
Page 182
Exercise – Global Recap Exercise
This solo or group activity is designed to maximize learning in a specific topic area. Your instructor will have instructions, and will coach you if you need assistance during the activity.
Objectives
Demonstrate understanding of the fundamentals of the PI System technology
Access data in the PI System
Demonstrate the use of PI Vision, PI ProcessBook and PI DataLink client applications
Problem Description
You will work to design a set of displays and reports, using the skills you learned in this class. Creativity is highly encouraged. This is intended as a fun, open-ended exercise and a friendly competition to wrap up the class. You may work in teams of 2-3. At the end of the session, all groups will give a brief presentation of their displays.
Work will be graded on:
1. Conveying your understanding of as many skills/concepts as possible.
2. Using all of the products, including PI ProcessBook, PI DataLink and PI Vision.
3. Creativity in your design.
4. Your presentation to the class.
You may use any aspects of PI ProcessBook, PI DataLink, and PI Vision that we discussed in class. This is open-book, so feel free to consult the rest of the workbook as well as relevant documentation (all of the relevant user guides are available on the VLE). You are highly encouraged, but not required, to use all three products in your final design. Good luck!
Approach
Step 1 : Select one of the Asset Based PI Example Kits from the list below and review the
business case that the kit addresses (included at the end of the exercise).
Alternatively, if you have access to your own production data, develop a use case
and complete the final project with your own data.
Condition Based Maintenance for Pumps
Distillation Column Operation
Mill Specific Power Consumption
Mineral Processing
Mobile Asset Performance Monitoring
O&G Well Downtime Tracking
O&G Well Drilling and Completion
Power Generation Load Forecasting
Reactor OEE
T&D Substation Transformer Monitoring
T&D Feeder Voltage Monitoring
Turbine Efficiency
Utilities Cost Management
Visualizing PI System Data
Page 183
Step 2 : The FULL database for each of the kits has been installed on the Virtual Learning
Environment for the course. Explore the AF Structure and Example Kit
documentation and see what data is available. You may also choose to watch the
introduction video for the Example Kit on PI Square. If you are using your own PI
System, learn what data is available surrounding your job role or your ideal business
use case.
Step 3 : Build visualization using the tools we learned about in this course to show potential
solutions or monitoring of the Example Kit or business case you chose. Below are
some of the things you should be able to implement in each tool.
PI Vision
a. Build a display with Tables, Trends, Values and Gauges
b. Re-use displays for similar assets and add text, images, links and multi-state
behavior to enrich your PI Vision Display.
c. Share the display with others in your organization, add keywords to sort displays
and find your favorite displays.
PI DataLink
a. Display Current Values and archived data for PI Points and AF Attributes
b. Calculate totals, averages and other statistical values for your data
c. Create advanced calculations on your data using Performance Equations
d. Re-use reports for multiple assets using drop-down lists
PI ProcessBook
a. Build an element relative display including dynamic and static symbols
b. Add multi-state symbols, images and pre-defined symbols from the symbol
library
c. Add buttons to navigate to web pages, applications, or other displays; or use a PI
ProcessBook (PIW) file to organize your PI ProcessBook displays.
d. Upload PI ProcessBook displays to PI Vision
Step 4 : Share your displays and reports with the class, explaining how each fulfills the
business case the Example Kit (or your own use case). Additionally, share how what
you have learned throughout the course will help you when you return to your normal
job role.

Visualizing PI System Data
Page 184
Asset Based PI Example Kit Brief Descriptions
Condition Based Maintenance for Pumps
You are responsible for scheduling the maintenance on the pumps in your plant. You currently use calendar based scheduling and add in extra maintenance if you get a call that something is broken. This is to reactionary for your taste so you want to be able to proactively determine maintenance based on the equipment usage and a comparison of the efficiency to other similar units. You need to be able to see when each pump was last maintained as well as how it’s stats compare to the other pieces of equipment.
Distillation Operation
Your distillation column needs to be closely monitored to continue to provide quality product. You want to be able to visualize the KPIs of the distillation column in real time. Additionally, you want a report that shows the conditions under which the distillation column floods and how frequently this event occurs.
Mobile Asset Performance Monitoring
Your company has many mobile assets (Trucks, buses, loaders, etc.) and you are interested in reducing fuel consumption and performing condition-based maintenance. These tasks are accomplished using separate metrics. For tracking of fuel efficiency, you are interested in seeing the payload weight, the fuel used and the trip distance among other factors. For maintenance, you want to know the engine runtime, filter conditions, oil contamination, alarms, etc. You need a display or report which shows this information. (You can choose to build displays or reports for only one business case or both for this exercise.)
O&G Well Downtime Tracking
At an upstream oil and gas company, it is your job to monitor the wells. During periods of downtime, you are interested in the reason, length and frequency. In between those periods, you are interested in aggregation of key measures such as power consumption and production. You need a report or display that provides information about the downtime events with the ability to compare downtime events to each other. You also need a display or report that provides information about the production.
O&G Well Drilling and Completion
Your department is responsible for monitoring the drilling and completion of oil and gas wells. You would like to be able to quickly view the status of a well and determine which stage of the drilling process it is in. Additionally, you would like to be able to monitor how the progress of one drilling cycle compares to others by comparing attributes such as ROP and drill string volume and events such as stick slip. You need a report or display that can provide this information.
Mill Specific Power Consumption
In your mill, you have many processors, each consuming energy. You want to be able to provide insight into the current electrical usage. Also you need to be able to generate a report showing how each plant compares on a daily basis.
Visualizing PI System Data
Page 185
Mineral Processing:
You work in a mineral processing plant and you want to be able to quickly monitor aspects of the process. You need to see the Energy, Reagent, and Water consumption. You also need to be able to monitor when there are downtimes of the process and when the toll ore is being delivered so that you can accurately monitor the supply in the facility.
Power Generation Load Forecasting
At an energy producing company, you produce power from both solar and gas. You want to optimize the amount of energy you use to minimize the gas usage. You have weather forecast information with solar load models to help you determine how much gas energy production you need based on the forecasted solar production. You need to be able to see what you are currently producing and how much you expect to need later today and tomorrow.
Reactor OEE:
You want to determine the overall equipment effectiveness (OEE) of a reaction line at your plant. You want to be able to easily monitor each component of the overall equipment effectiveness (Quality, Performance, and Availability) individually to see areas you may be able to improve for each production line. You also want to be able to track when each line is down and develop a report for your manager.
T&D Feeder Voltage Monitoring
At a distribution company, you are responsible for monitoring the voltage phase balance in substation transformers. The substation data provides information about power consumption and voltage phase. You need to easily display the transformer voltage phases and report when there has been a limit violation. Additionally, you would like to see the total power generated in each district.
T&D Substation Transformer Monitoring:
You are responsible for monitoring substation transformers at a distribution company. You monitor for hot-spot temperatures and Load Tap Changer (LTC) position changes. You are interested in information about the load and top-oil temperatures when the temperature gets too high. You need a report that can tell you when the temperature limit has been exceeded and for how long. Additionally, you monitor the transformers for the LTC Position change, and you need a display to tell you how frequently the changes occur and a quick check if the frequency is too high or too low. (You can choose to build displays or reports for only one business case or both for this exercise.)
Turbine Efficiency:
You are in charge of monitoring the efficiency of the turbines in your facility. You want to be able to monitor the efficiency of each unit. You have information such as Gas Flow, Generation and Calculated heat rates.
Utilities Cost Management:
You are tasked with finding areas to reduce utility usage. You have meters which report the usage of gas, water and electricity in your plant. You may also be interested in looking at equipment downtime or periods with excessive electricity use. You want to easily monitor the

Visualizing PI System Data
Page 186
usage and cost of the utilities with a display and have a report which shows the times of high usage.
Turbine Efficiency:
You are in charge of monitoring the efficiency of the turbines in your facility. You want to be able to monitor the efficiency of each unit. You have information such as Gas Flow, Generation and Calculated heat rates.
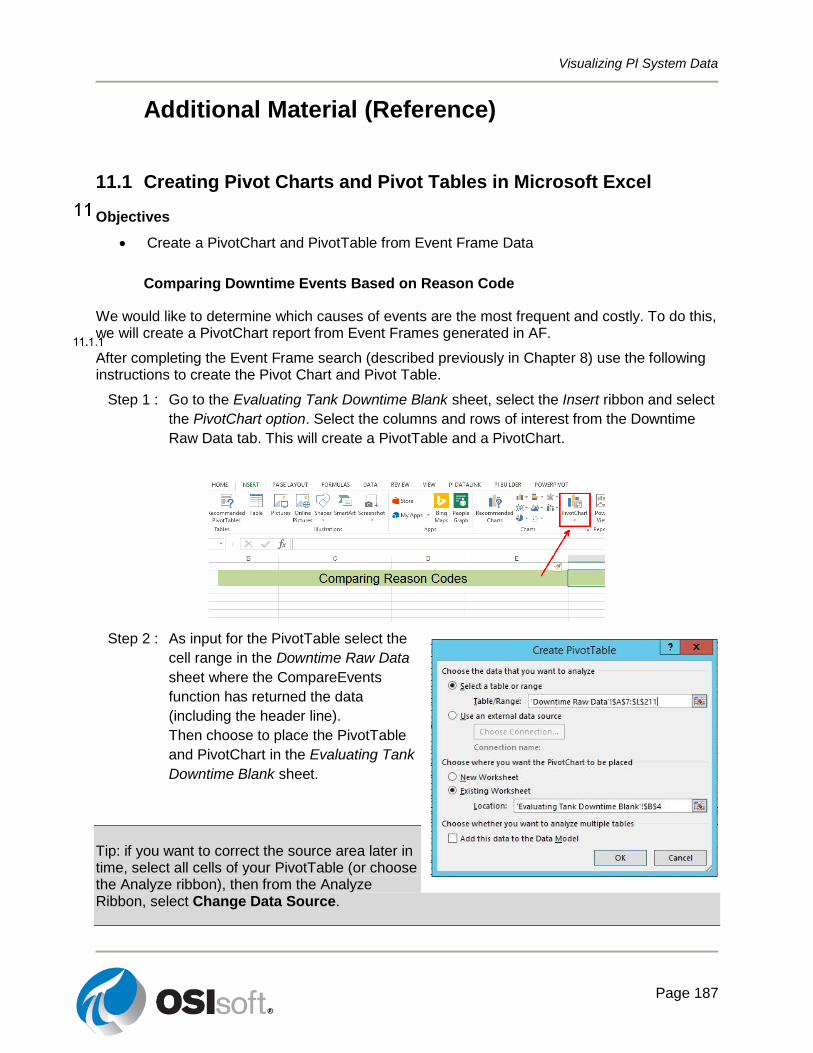
Visualizing PI System Data
Page 187
Additional Material (Reference)
11.1 Creating Pivot Charts and Pivot Tables in Microsoft Excel
Objectives
Create a PivotChart and PivotTable from Event Frame Data
Comparing Downtime Events Based on Reason Code
We would like to determine which causes of events are the most frequent and costly. To do this, we will create a PivotChart report from Event Frames generated in AF.
After completing the Event Frame search (described previously in Chapter 8) use the following instructions to create the Pivot Chart and Pivot Table.
Step 1 : Go to the Evaluating Tank Downtime Blank sheet, select the Insert ribbon and select
the PivotChart option. Select the columns and rows of interest from the Downtime
Raw Data tab. This will create a PivotTable and a PivotChart.
Step 2 : As input for the PivotTable select the
cell range in the Downtime Raw Data
sheet where the CompareEvents
function has returned the data
(including the header line).
Then choose to place the PivotTable
and PivotChart in the Evaluating Tank
Downtime Blank sheet.
Tip: if you want to correct the source area later in time, select all cells of your PivotTable (or choose the Analyze ribbon), then from the Analyze Ribbon, select Change Data Source.
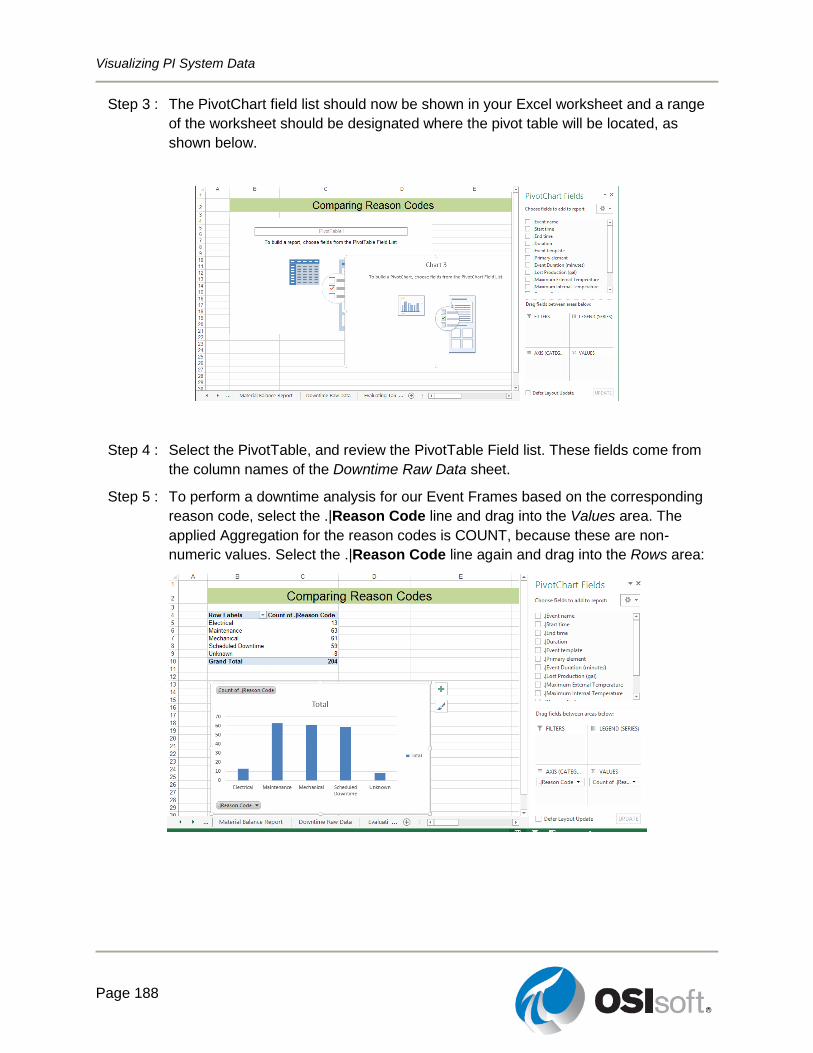
Visualizing PI System Data
Page 188
Step 3 : The PivotChart field list should now be shown in your Excel worksheet and a range
of the worksheet should be designated where the pivot table will be located, as
shown below.
Step 4 : Select the PivotTable, and review the PivotTable Field list. These fields come from
the column names of the Downtime Raw Data sheet.
Step 5 : To perform a downtime analysis for our Event Frames based on the corresponding
reason code, select the .|Reason Code line and drag into the Values area. The
applied Aggregation for the reason codes is COUNT, because these are non-
numeric values. Select the .|Reason Code line again and drag into the Rows area:
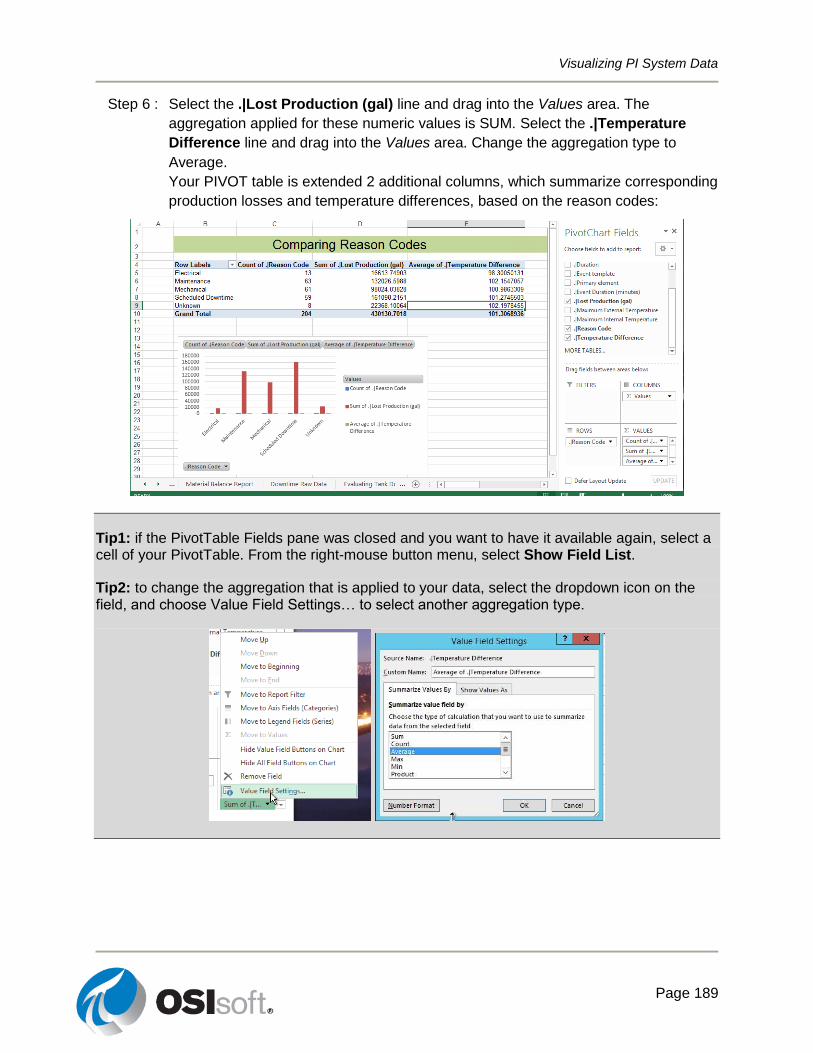
Visualizing PI System Data
Page 189
Step 6 : Select the .|Lost Production (gal) line and drag into the Values area. The
aggregation applied for these numeric values is SUM. Select the .|Temperature
Difference line and drag into the Values area. Change the aggregation type to
Average.
Your PIVOT table is extended 2 additional columns, which summarize corresponding
production losses and temperature differences, based on the reason codes:
Tip1: if the PivotTable Fields pane was closed and you want to have it available again, select a cell of your PivotTable. From the right-mouse button menu, select Show Field List.
Tip2: to change the aggregation that is applied to your data, select the dropdown icon on the field, and choose Value Field Settings… to select another aggregation type.
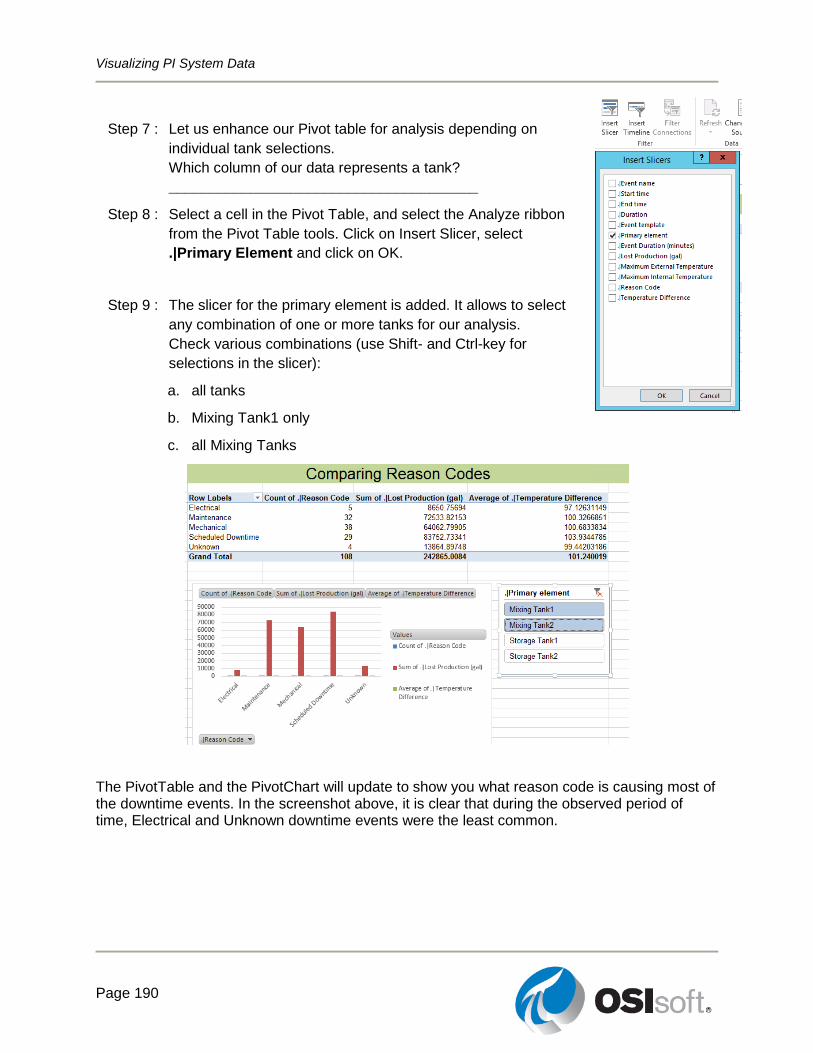
Visualizing PI System Data
Page 190
Step 7 : Let us enhance our Pivot table for analysis depending on
individual tank selections.
Which column of our data represents a tank?
______________________________________
Step 8 : Select a cell in the Pivot Table, and select the Analyze ribbon
from the Pivot Table tools. Click on Insert Slicer, select
.|Primary Element and click on OK.
Step 9 : The slicer for the primary element is added. It allows to select
any combination of one or more tanks for our analysis.
Check various combinations (use Shift- and Ctrl-key for
selections in the slicer):
a. all tanks
b. Mixing Tank1 only
c. all Mixing Tanks
The PivotTable and the PivotChart will update to show you what reason code is causing most of the downtime events. In the screenshot above, it is clear that during the observed period of time, Electrical and Unknown downtime events were the least common.
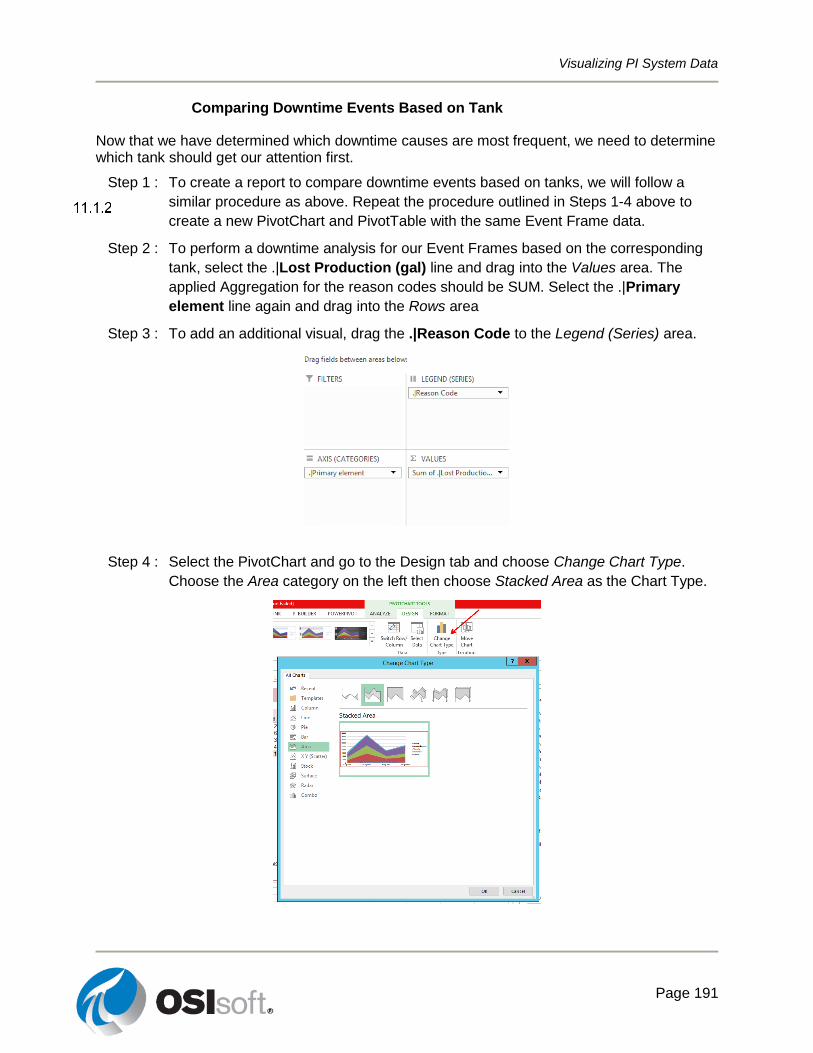
Visualizing PI System Data
Page 191
Comparing Downtime Events Based on Tank
Now that we have determined which downtime causes are most frequent, we need to determine which tank should get our attention first.
Step 1 : To create a report to compare downtime events based on tanks, we will follow a
similar procedure as above. Repeat the procedure outlined in Steps 1-4 above to
create a new PivotChart and PivotTable with the same Event Frame data.
Step 2 : To perform a downtime analysis for our Event Frames based on the corresponding
tank, select the .|Lost Production (gal) line and drag into the Values area. The
applied Aggregation for the reason codes should be SUM. Select the .|Primary
element line again and drag into the Rows area
Step 3 : To add an additional visual, drag the .|Reason Code to the Legend (Series) area.
Step 4 : Select the PivotChart and go to the Design tab and choose Change Chart Type.
Choose the Area category on the left then choose Stacked Area as the Chart Type.
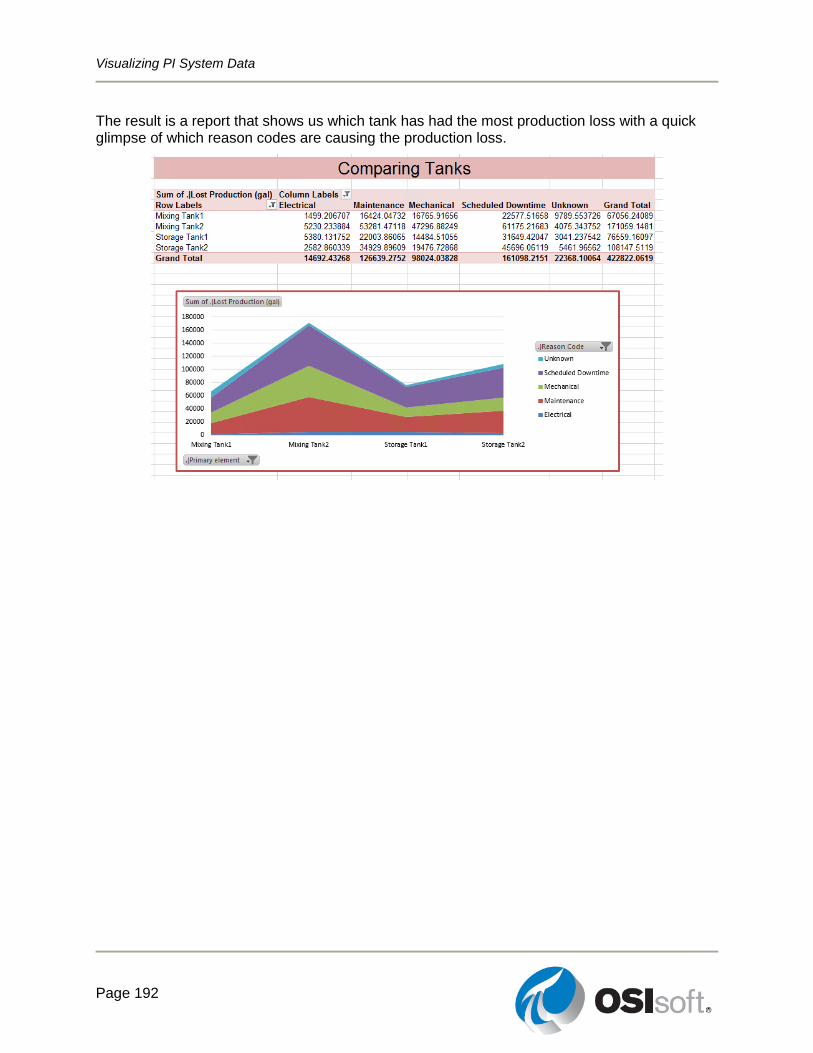
Visualizing PI System Data
Page 192
The result is a report that shows us which tank has had the most production loss with a quick glimpse of which reason codes are causing the production loss.
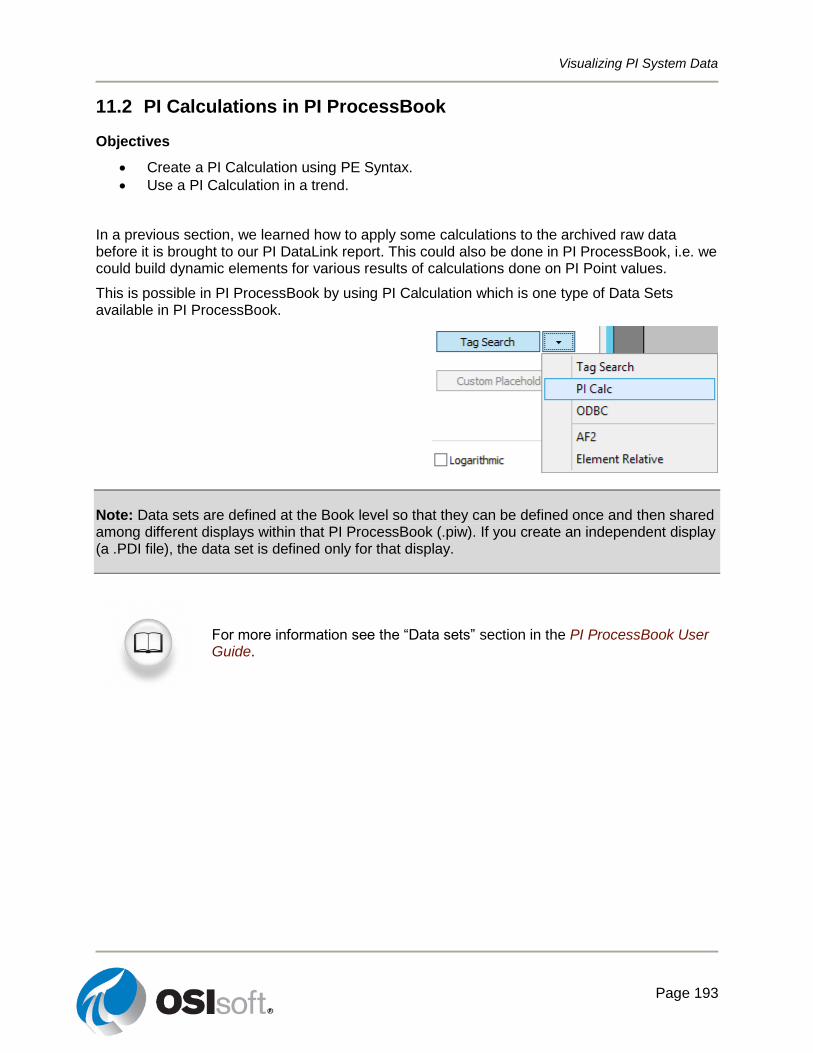
Visualizing PI System Data
Page 193
11.2 PI Calculations in PI ProcessBook
Objectives
Create a PI Calculation using PE Syntax.
Use a PI Calculation in a trend.
In a previous section, we learned how to apply some calculations to the archived raw data before it is brought to our PI DataLink report. This could also be done in PI ProcessBook, i.e. we could build dynamic elements for various results of calculations done on PI Point values.
This is possible in PI ProcessBook by using PI Calculation which is one type of Data Sets available in PI ProcessBook.
Note: Data sets are defined at the Book level so that they can be defined once and then shared among different displays within that PI ProcessBook (.piw). If you create an independent display (a .PDI file), the data set is defined only for that display.
For more information see the “Data sets” section in the PI ProcessBook User Guide.
Visualizing PI System Data
Page 194
Similar to PI DataLink, in PI ProcessBook you can work with PI Calculation data sets in two ways:
1. One is to use pre-defined functions to retrieve aggregated PI data for a point. This is called PI Summary data sets and is similar to Calculated Data function in PI DataLink. These pre-determined functions are:
o Total o Average o Minimum o Maximum o Percent Good (PctGood) o Range o Standard Deviation (StdDev) o Population Standard Deviation (PstdDev) o Count
2. The other way is to create your own function or expression in using PI Performance Equation syntax. This is called PI Expression data sets and is similar to using Expressions, instead of Data Item, when retrieving data using PI DataLink functions. In this case, the function you return from the data set is:
o Value
Using either of the above-mentioned two ways, there are two steps to follow in using PI Calculation in PI ProcessBook:
Step 1 : Create/define PI Calculation Data Set
Step 2 : Use/view PI Calculation Data Set
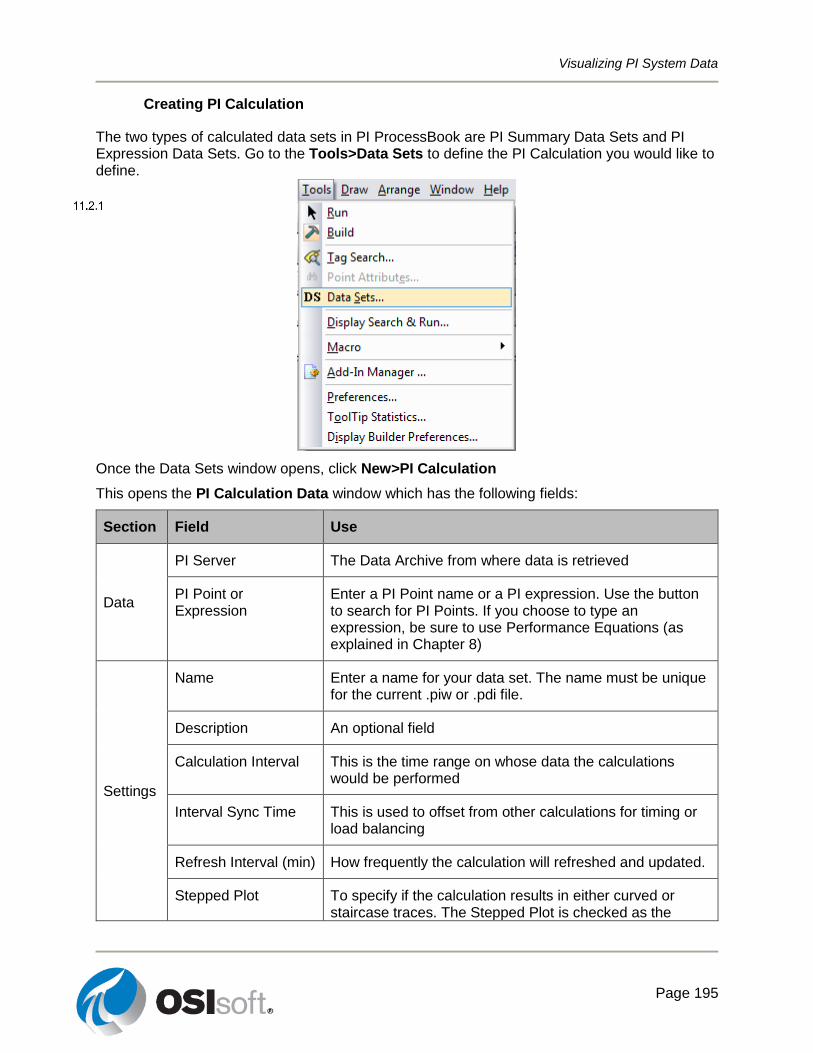
Visualizing PI System Data
Page 195
Creating PI Calculation
The two types of calculated data sets in PI ProcessBook are PI Summary Data Sets and PI Expression Data Sets. Go to the Tools>Data Sets to define the PI Calculation you would like to define.
Once the Data Sets window opens, click New>PI Calculation
This opens the PI Calculation Data window which has the following fields:
Section Field Use
Data
PI Server The Data Archive from where data is retrieved
PI Point or Expression
Enter a PI Point name or a PI expression. Use the button to search for PI Points. If you choose to type an expression, be sure to use Performance Equations (as explained in Chapter 8)
Settings
Name Enter a name for your data set. The name must be unique for the current .piw or .pdi file.
Description An optional field
Calculation Interval This is the time range on whose data the calculations would be performed
Interval Sync Time This is used to offset from other calculations for timing or load balancing
Refresh Interval (min) How frequently the calculation will refreshed and updated.
Stepped Plot To specify if the calculation results in either curved or staircase traces. The Stepped Plot is checked as the
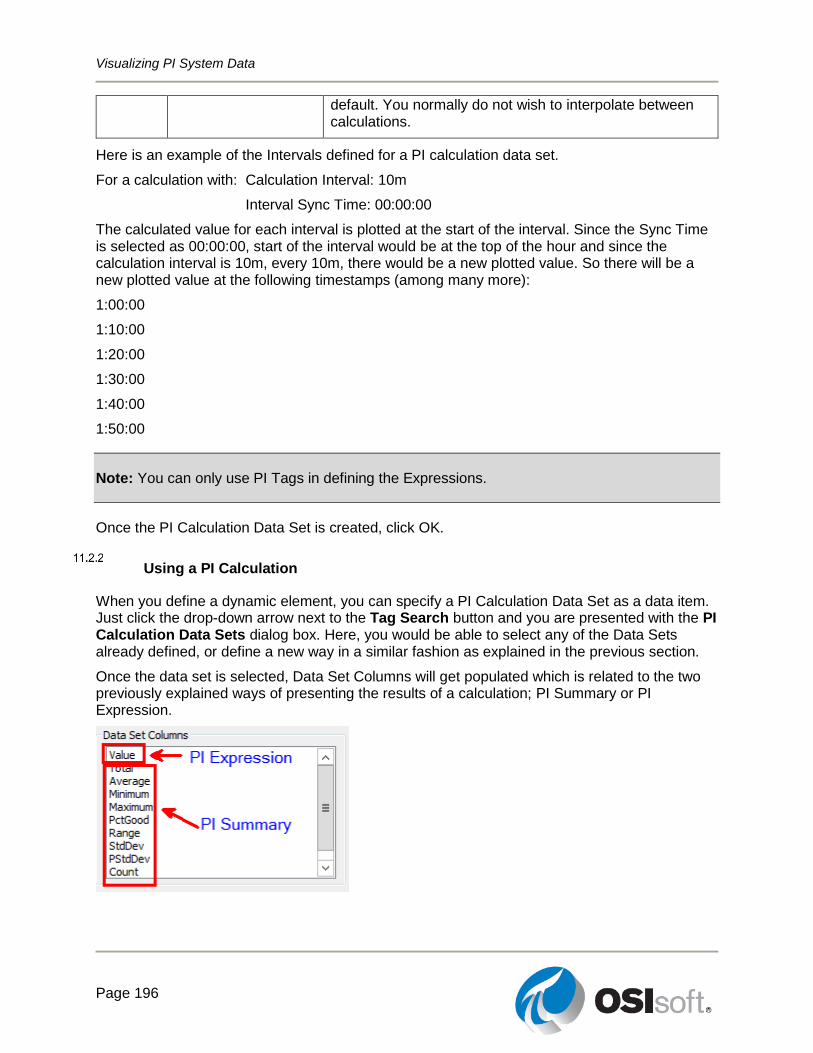
Visualizing PI System Data
Page 196
default. You normally do not wish to interpolate between calculations.
Here is an example of the Intervals defined for a PI calculation data set.
For a calculation with: Calculation Interval: 10m
Interval Sync Time: 00:00:00
The calculated value for each interval is plotted at the start of the interval. Since the Sync Time is selected as 00:00:00, start of the interval would be at the top of the hour and since the calculation interval is 10m, every 10m, there would be a new plotted value. So there will be a new plotted value at the following timestamps (among many more):
1:00:00
1:10:00
1:20:00
1:30:00
1:40:00
1:50:00
Note: You can only use PI Tags in defining the Expressions.
Once the PI Calculation Data Set is created, click OK.
Using a PI Calculation
When you define a dynamic element, you can specify a PI Calculation Data Set as a data item. Just click the drop-down arrow next to the Tag Search button and you are presented with the PI Calculation Data Sets dialog box. Here, you would be able to select any of the Data Sets already defined, or define a new way in a similar fashion as explained in the previous section.
Once the data set is selected, Data Set Columns will get populated which is related to the two previously explained ways of presenting the results of a calculation; PI Summary or PI Expression.

Visualizing PI System Data
Page 197
Value will present the value of the PI Expression defined for the data set, while the rest of column options would apply the listed functions to the PI Point or defined PI Expression and provide a PI Summary.
Visualizing PI System Data
Page 198
Directed Activity – PI Calculation
You are invited to watch what the instructor is doing or perform the same steps at the same time to explore the different concepts presented in this chapter or section.
Objectives
Use a PI Calc in PI ProcessBook
Problem Description
You want to normalize the data for a noisy point.
Approach
Step 1 : Add a trend.
Step 2 : Choose PI Calc as the data source.
Step 3 : Add a New data set.
Step 4 : Configure it for the CDT158 Point using the “Tag Search”. Note how using the point
search, the ‘ are added automatically
Step 5 : Name it Normalized Flow.
Step 6 : Choose Save.
Step 7 : Pick the Average column, and press OK.
Step 8 : Add the actual point as a trace to the plot.
Step 9 : Compare the average with the actual point data.
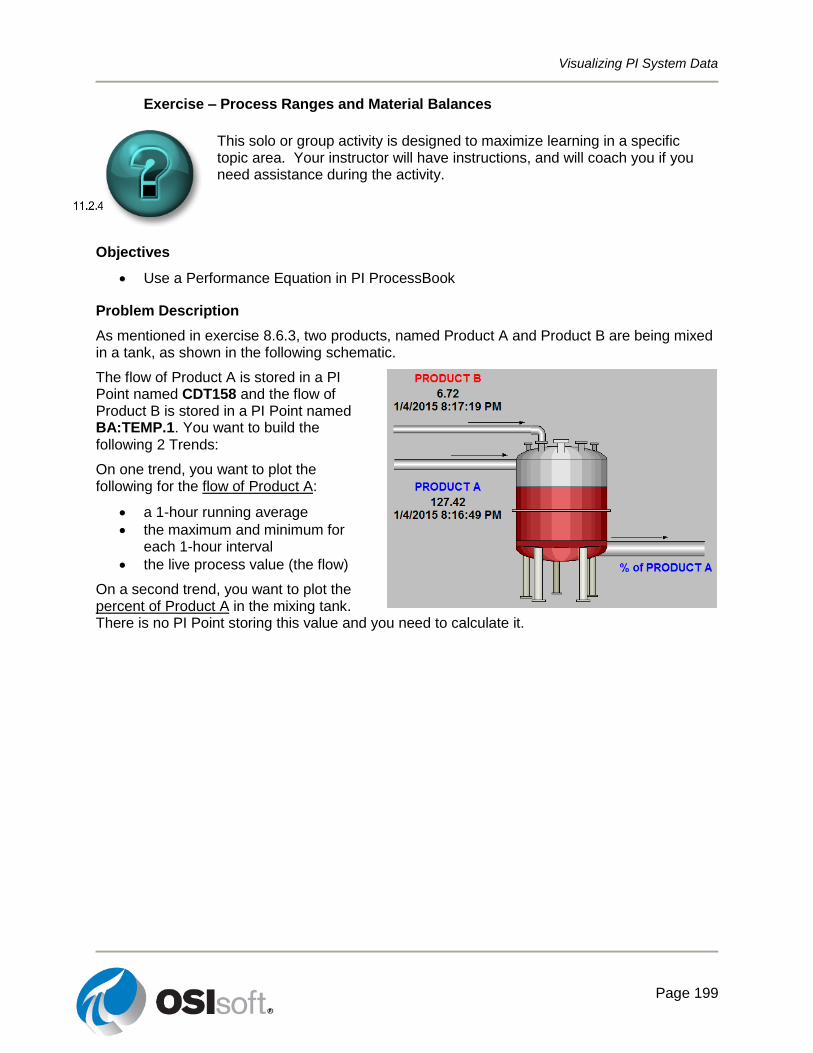
Visualizing PI System Data
Page 199
Exercise – Process Ranges and Material Balances
This solo or group activity is designed to maximize learning in a specific topic area. Your instructor will have instructions, and will coach you if you need assistance during the activity.
Objectives
Use a Performance Equation in PI ProcessBook
Problem Description
As mentioned in exercise 8.6.3, two products, named Product A and Product B are being mixed in a tank, as shown in the following schematic.
The flow of Product A is stored in a PI Point named CDT158 and the flow of Product B is stored in a PI Point named BA:TEMP.1. You want to build the following 2 Trends:
On one trend, you want to plot the following for the flow of Product A:
a 1-hour running average
the maximum and minimum for each 1-hour interval
the live process value (the flow)
On a second trend, you want to plot the percent of Product A in the mixing tank. There is no PI Point storing this value and you need to calculate it.
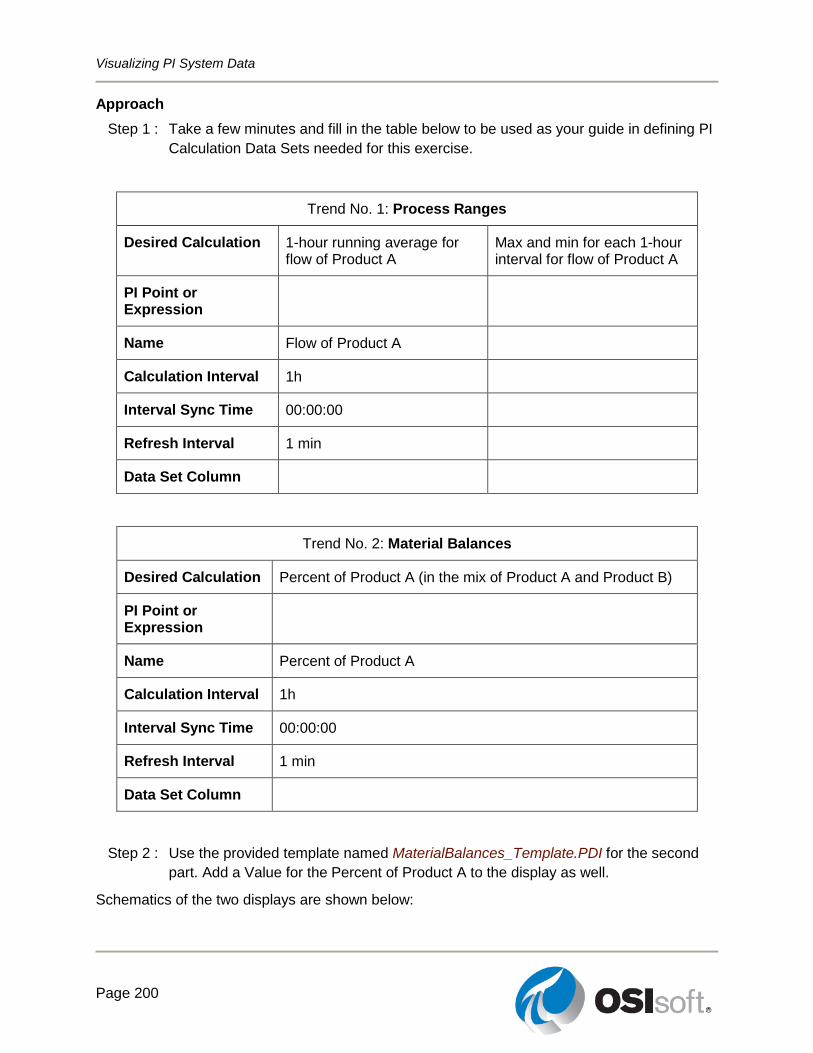
Visualizing PI System Data
Page 200
Approach
Step 1 : Take a few minutes and fill in the table below to be used as your guide in defining PI
Calculation Data Sets needed for this exercise.
Trend No. 1: Process Ranges
Desired Calculation 1-hour running average for flow of Product A
Max and min for each 1-hour interval for flow of Product A
PI Point or Expression
Name Flow of Product A
Calculation Interval 1h
Interval Sync Time 00:00:00
Refresh Interval 1 min
Data Set Column
Trend No. 2: Material Balances
Desired Calculation Percent of Product A (in the mix of Product A and Product B)
PI Point or Expression
Name Percent of Product A
Calculation Interval 1h
Interval Sync Time 00:00:00
Refresh Interval 1 min
Data Set Column
Step 2 : Use the provided template named MaterialBalances_Template.PDI for the second
part. Add a Value for the Percent of Product A to the display as well.
Schematics of the two displays are shown below:
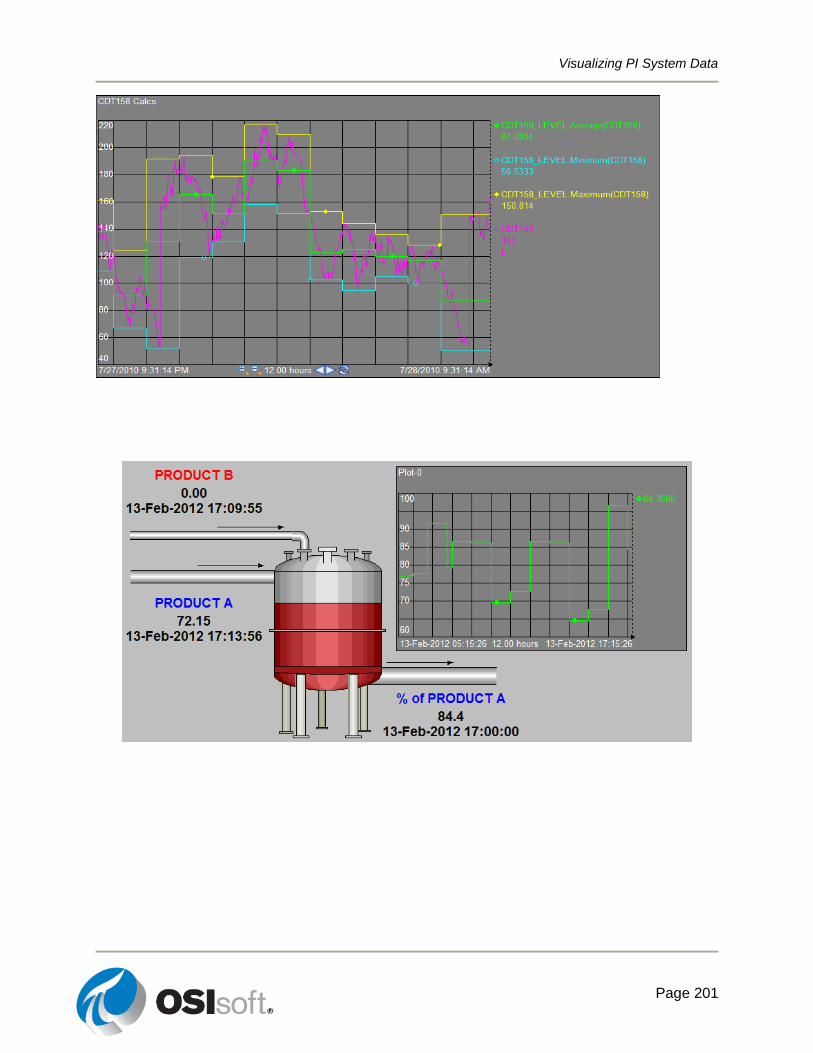
Visualizing PI System Data
Page 201