Embed Size (px)
Citation preview
Visualizing Linked Data as Habitable Cities
Klaas Andries de Graaf1 and Ali Khalili1
Department of Computer Science, Vrije Universiteit Amsterdam, NL{ka.de.graaf,a.khalili}@vu.nl
Abstract. The comprehension of linked data, consisting of classes, individuals,attributes, relationships, and other elements, is challenging yet important for ef-fective use of linked data. An approach to improve software program comprehen-sion is through the code city metaphor, in which object-oriented source code isvisualized as a habitable city in 3D. We propose the linked-data city metaphorto support comprehension of linked data. Through improved linked data compre-hension we in turn aim to support users in browsing linked data and in analyzingthe structure of linked data. We discuss how different mappings and visualizationof properties in the city metaphor may support users in browsing and structuralanalysis of linked data. A prototype implementation of linked data city in LD-R,a linked data-aware faceted browser, is presented.
1 IntroductionThe comprehension of linked data, consisting of ontology classes, individuals, attributes,relationships, and other elements, is challenging yet important for effective use of theserepositories. The size and complexity of linked data repositories makes it difficult forusers to get an overview, and feel a sense of locality of the objects in a link data repos-itory. In this paper we propose an approach to improve linked data comprehension ofusers via 3D visualization of linked data objects in a habitable, i.e., livable real-world,environment.
The code city metaphor [14] visualizes object-oriented source code as a habitablecity in 3D to improve program comprehension. This in turn supports developers inbrowsing through code repositories and also supports software designers to discoverflaws and improvements in the structure of software systems. Multiple source code el-ements are visualized; the districts of a city represent packages, the buildings representclasses, the building height (Y-axis) represents the number of methods in a class, andthe building width (X-axis) and depth (Z-Axis) represent the number of class attributes.
The goal of the code city approach is to create a visual ’habitable’ environment,where one feels at home, in order to improve program comprehension through familiar-ity [13]. With ’habitable’ we mean; ”a home-like environment that is familiar to users”.A city metaphor is intuitive to users because cities are found in the real world [10].
Wettel et al. argue in [13] that users of many existing code visualization approacheslack the notion of habitability. In 2D approaches the users lack a sense of physicalspace and in 3D approaches users lack a sense of locality, leading to disorientationand lowering program comprehension [13]. This disorientation is also a problem in 3Dvisualization of linked data [7].
Visualizing a habitable environment, to which users can relate and orientate them-selves in, addresses these challenges. The code city metaphor also improves compre-hension compared to non-visual tools; empirical evidence from an experiment with 41industry and academic participants shows that increased program comprehension viathe code city metaphor results in a significant increase in task correctness and comple-tion time compared to non-visual exploration tools [17].
We believe that this solution is transferable to linked data visualization, as the struc-ture of linked data and object-oriented source code is similar in many aspects. Code cityvisualizes object-oriented source code, which contains classes, properties, relationships,and instances. Similarly, linked data contains ontology classes, properties, relationships,and instances, and this similarity allows us to apply the code city metaphor to linkeddata. We can visualize these dimensions of Linked Data using the three dimensions (X,Y, Z) of buildings in a linked data city. Using various mappings, e.g., instances mappedto building height, and properties mapped to building width, the various elements oflinked data can be visualized according to the users’ needs when browsing and evalu-ating the structure of linked data. Use of information landscapes, such as a code city, isalso proposed by Katifori et al. in [7] as a promising research direction in visualizationof linked data.
We propose a Linked Data City (LD-city) approach, based on the code city metaphor,which aims to support users in browsing linked data repositories and in analyzing thestructure of linked data. We discuss how different mappings and visualization of linkeddata properties in the city metaphor support users in browsing and structural analysis oflinked data. A prototype implementation of LD-city in LD-R [8], a Linked Data-awarefaceted browser, is presented, and we discuss how possible anti-patterns and designflaws in Linked Data can be detected, inspired by the detection of design flaws in visu-alized software code.
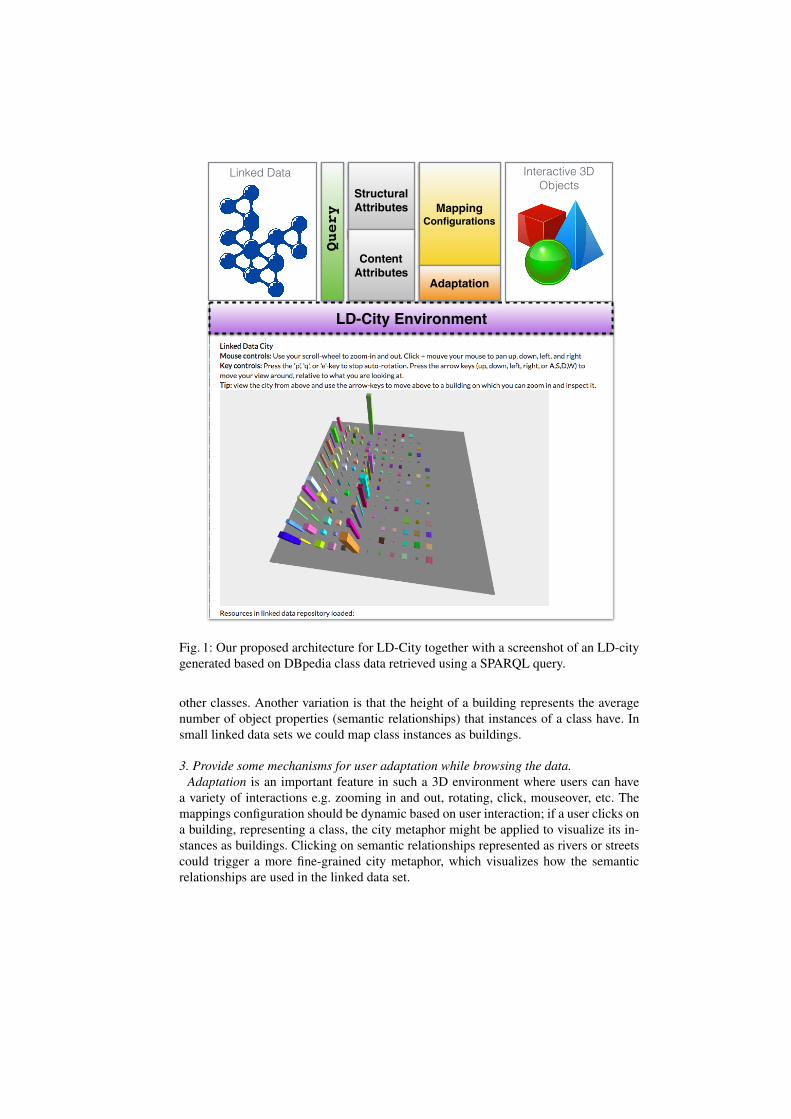
2 The Proposed Architecture for LD-CityAs depicted in Figure 1, there are three main requirements to create an LD-City envi-ronment:
1. Identifying a set of content and structural attributes of interest.Structural attributes allow to represent a dataset in a general form (e.g. the number
of distinct classes or properties, or the number of instances per class) while contentattributes focus on features which are specific to a dataset and are not necessarily gen-eralizable to other datasets (e.g. age or gender property). It is the task of an ontologyengineer or data scientist to define those attributes of interest. SPARQL queries can bethen used to collect the values for the designated attributes.
2. Map the selected attributes to a set of predefined 3D objects which represent a city.This is the core-task for building an LD-City environment which deals with defining
the right metaphors to represent the extracted attributes using real-world city objectswhich are familiar to users. As an example mapping, one can configure the environ-ment so that the height of a building represents the number of class instances, and thewidth+depth of the building represents the number of class attributes. Or for example,instead of building height representing the number of instances, it could also representthe number of object properties to show that a class has many semantic relationships to
LD-City Environment
Linked Data
Query
StructuralAttributes
ContentAttributes
MappingConfigurations
Adaptation
Interactive 3D Objects
Fig. 1: Our proposed architecture for LD-City together with a screenshot of an LD-citygenerated based on DBpedia class data retrieved using a SPARQL query.
other classes. Another variation is that the height of a building represents the averagenumber of object properties (semantic relationships) that instances of a class have. Insmall linked data sets we could map class instances as buildings.
3. Provide some mechanisms for user adaptation while browsing the data.Adaptation is an important feature in such a 3D environment where users can have
a variety of interactions e.g. zooming in and out, rotating, click, mouseover, etc. Themappings configuration should be dynamic based on user interaction; if a user clicks ona building, representing a class, the city metaphor might be applied to visualize its in-stances as buildings. Clicking on semantic relationships represented as rivers or streetscould trigger a more fine-grained city metaphor, which visualizes how the semanticrelationships are used in the linked data set.
Automatic adaptation is possibly by automatically providing data-aware mappingsfor users based on the content of a linked data repository, i.e., content-based mappings.For example, when several classes have attribute ’age’, we can use the height of a build-ing to represent the average age of class instances. Another example is to map buildingsin a linked data city based on the geo-coordinates of class-instances, possibly combinedwith the Google maps or earth API.
Visualizing and browsing data based on multiple mappings, and support for userinteraction and data-aware mappings, enables serendipitous data discovery - the dis-covery of interesting and valuable facts not initially sought for. This is valuable for thefield of data science. A user can switch between different mappings and visualizationsto see different patterns in a linked data city, focused on, e.g., the number of instance,data and object properties of classes and instances, class restrictions, class axioms, etcetera.
Providing Polymorphic Shapes is another mechanism for adaptation. For example,as described before, the building height can represent the number of instances a classcontains, compared to the class with the most instances. For example, a class with 50instances will have height 50% if the largest class in the dataset has 100 instances.This is a linear mapping of height. In [13] Wettel et al. propose a boxplot-based and athreshold-based mapping to produce different building types; houses, mansions, apart-ment blocks, office buildings, and skyscrapers. The motivation behind the mappingsin [13] is to improve habitability - the building types are recognizable and represen-tative of buildings in a real city - and thereby improve program comprehension. Thismapping to a predefined set of building shapes in [13] is supported by the gestalt princi-ple [4] - which is that human recognition is optimal with a maximum of 4 to 6 differentshapes. In future work we also want to implement mappings to different building typesto further improve comprehension of linked data.
The mappings of classes to buildings could also be extended to include mappingsto other objects in the city, such as parks, hotels, rivers, roads, and nested buildings(buildings on top of other buildings), e.g., to visualize super-subclass relationships. Thismay further improve habitability of linked data cities, by making linked data cities lookmore like a photograph or map of a real-life city. Moreover, it provides more optionsfor mappings, allowing a linked data city to convey more information about differentelements and dimensions of a linked data repository. In [10] Panas et al. propose tovisualize the flow of data between components as moving cars in a code city to, andsimilarly we could use (moving) cars to represent the (usage of) semantic relationshipsbetween classes.
Using a specific color mapping may again convey more information about a linkeddata set, e.g., classes that are internally defined in a linked data repository are shown asgreen buildings, whilst classes defined in other repositories are shown as blue buildings.Using more realistic colors will improve habitability, and thereby comprehension oflinked data repositories, e.g., colors that occur most often in cities; gray representingconcrete buildings, glass-blue for windowed buildings, and brown or red for bricks andmortar buildings. Panas et al. even use realistic textures on buildings in their code cityin [10].
3 A Proof-of-Concept Implementation for LD-City
We implemented a proof-of-concept version of linked data city using Node.js 1 (client-side and server-side JavaScript), Three.js 2 (an abstraction of WebGL in the OpenGLstack), and React 3 (Facebook’s library for building user interfaces). Our code is avail-able at https://github.com/ali1k/ld-r/tree/Linked-Data-City andis open source. The main logic of linked data city is implemented in a single datasetcomponent 4.
The current implementation expects a JavaScript Object Notation (JSON) file withinformation about classes and instances in a linked data repository. A city with buildingsis generated based on this file. This file contains the results of SPARQL queries toextract content and structural attributes of a given dataset. In Figure 1 buildings areclasses used on DBpedia, with height representing the amount of class instances.
In our initial implementation the height of buildings visualizes the number of classinstances, and the width and depth of the buildings (its base) visualizes the number ofclass attributes, as depicted in Figure 1. We think this representation is fairly intuitive;a class that has many instances and many attributes results in a tall wide building thattakes up much space because its instances with a lot of attributes represent a lot ofdata in a linked data set. Conversely, a class that has few attributes and many instancesresults in a tall slender building, as its instances and attributes take up relative little data.
The code city metaphor has previously been adopted to e.g. visualize JavaScriptcode repositories in JScity 5 in 3D in a browser using JavaScript and Three.js. Theunderlying technology is similar to ours, which also visualizes the city metaphor inmodern web-browsers using JavaScript and three.js.
Our linked data city implementation is part of the Linked Data Reactor (LD-R) 6 [8].LD-R is currently used in the SMS7 platform as a technical core element within theRISIS.eu project to view, browse, and edit linked data related for Science, Technologyand Innovation (STI) studies.
In future work we plan to further integrate linked data city with LD-R, to allowusers to select different mappings. Moreover, we want to allow users to show detailsof classes, instances, relationships, by clicking on the classes, and support navigationto information pages on different classes and instances. We also plan to make a stand-alone version of linked data city which makes use of connections to SPARQL queryendpoints. We envision that this version makes use of predefined or user-defined queriesto retrieve and visualize the linked data repositories behind the SPARQL query endpointas a linked data city.
1 https://nodejs.org/2 https://threejs.org/3 https://facebook.github.io/react/4 https://github.com/ali1k/ld-r/blob/Linked-Data-City/components/dataset/Dataset3D.js
5 https://github.com/aserg-ufmg/JSCity6 http://ld-r.org7 http://sms.risis.eu
4 Potential Applications of the LD-City Metaphor
Wettel et al. used the code city metaphor in [16] to visualize design flaws and ’badsmells’ [5] (signs of decline in code quality) in a code repository using metric-baseddetection strategies. For example, god classes (a class with many methods) can be eas-ily detected and visualized as buildings that are very tall, and data classes (a class withmany attributes and few methods) can be detected and visualized as buildings that arevery broad. Such classes may indicate a monolithic code structure, which negates thebenefits of detailed fine-grained object-oriented design. Similarly, possible god classesare already visualized in our prototype implementation of linked data city as tall build-ings, which have many instances, and data classes are visualized as broad buildings,containing many attributes. An ontology engineer might consider splitting identifiedgod and data classes up into multiple classes, to have a detailed and fine-granularitydefinition of classes and instantiated linked data.
The detection strategies in [16] use logical conditions and code metrics to highlightbuildings (i.e., code structures) that might be flawed. Similarly, LD-City can be utilizedto highlight buildings (ontology classes) and other elements in a linked data city basedon conditions and metrics. To determine what these conditions and metrics should be,one needs to investigate existing ontology and knowledge engineering design princi-ples, e.g., work on ontology design principles in [6] and ontology anti-patterns in [11].
Next to data and god classes, other design flaws identified in software engineeringmight be applicable to linked data. For example, feature envy, where instances of a classuse a lot of attributes of other classes (in software: many methods from another classare used). Another example is detection of lazy or freeloader classes - classes that seemto do little and might not be necessary - and we can already detect these in linked datacity as very small buildings, with little to no instances. Using appropriate conditionsand metrics, such as the number of object properties (semantic relationships) referringto candidate lazy classes, we could effectively highlight these for the user who performsstructural analysis.
Visualizing linked data evolution in the city metaphor using a time dimension isalso a promising direction. In [15] the visualization of software evolution over timein the city metaphor, via age maps (where different colors indicates timestamps), timetravel, and a timeline, allows for retracing software design decisions and possible de-sign anti-patterns. Similarly, visualizing the time evolution of a linked data repositoryshows valuable insights for ontology engineers [7], e.g., ontology design decisions intime, ontology refactoring events, and design anti-patterns over time. Moreover, timevisualization may provide valuable insights for domain experts [7] and data scientist,e.g., events that mark large-scale adoption of a linked data repository, class usage overtime, and events that show linking of data sets and classes from linked data repositoriesin different domains.
LD-City can also be exploited to compare multiple linked data repositories and datasets. This may, for example, be used for analogical reasoning by comparing linked datasets that are used for a similar or different domain but which differ in structure, in orderto discover best practices. Moreover, comparing different ontologies seems valuablefor ontology alignment as the linked data city visualizes the usage and significance ofdifferent classes in terms of instances and attributes,
5 Related Work
Wettel et al. proposed a habitable code city for program comprehension in [14], andPanas et al. more recently proposed a code city for software product visualization in [10]with a more habitable environment (compared to [14]), including clouds, roads, trees,lamp-posts, bodies of water, and realistically building textures. Other uses of the codecity metaphor are software world, proposed by Knight et al. in [9], and Component Cityby Charter et al. in [2].
Existing 3D visualization approaches for ontology visualization, which includesvisualization of linked data, make use of cones, cubes, (disk) tree(map)s, spheres, pyra-mids, and nodes [7]. Two data visualization approaches use a landscape (but not a city)metaphor, namely, Strasnick et al. in [12] to visualize a UNIX file system structure,and Eyi to visualize hypertext documents in [3]. Katifori et al. argue in [7] that hyper-text document visualization as a landscape in [3] is useful for ontology visualization.In this paper we propose a similar approach in detail, though using a city instead of thelandscape metaphor.
Very related work was recently done by Baumeister et al. who proposed a linkeddata city for Visualization of Linked Enterprise Data in [1]. Thus we are not the first topropose a linked data city metaphor. Their work is also based on Wettel et al. in [14],and technically more mature than ours, but applied to the specific domain of Enterprisedata and a case study in which annotations of a technical documentation corpus are vi-sualized. Our focus on a more generic linked data city and our discussion of habitability,mappings, and detecting design flaws are major differentiation.
6 Conclusions and Future Work
Visualizing source code as a habitable city in 3D provides users with a sense of localityand orientation and thereby improves program comprehension. Similarly, we propose tovisualize linked data as a habitable city in 3D, to improve comprehension of data whenbrowsing and analyzing linked data. We present a proof-of-concept implementation oflinked data city, and discuss possible mappings and visualizations of linked data objectsand properties in the city metaphor.
Future work to our prototype implementation includes, among other things, user in-teractions to support navigation, further integration with LD-R, generation of differentbuilding types and realistic colors to increase habitability, support for connecting withSPARQL endpoints, and creation of a stand-alone version that can be easily adopted andintegrated into other systems. We also want to define and support different mappingsof linked data objects, properties, and metrics to a city, e.g., data-driven mappings thatvisualize age or geo-location of class instances in a city, and mappings to objects otherthan buildings, e.g., to districts, parks, roads, train-tracks, and other real-life elementsin a city. Next to a city metaphor, the use of a landscape metaphor, and a visualizationof a time-dimension to show linked data evolution seems promising future work.
Acknowledgement. This study was supported by the EU FP7 project ’RISIS’ (nr.313082) and by the EU Horizon H2020-ICT-2015 project ’SlideWiki’ (nr. 688095).
References
1. J. Baumeister, S. Furth, L. Roth, and V. Belli. Linked data city - visualization of linkedenterprise data. pages 145–152.
2. S. M. Charters, C. Knight, N. Thomas, and M. Munro. Visualisation for informed decisionmaking; from code to components. In SEKE 02: Intl. Conference on Software engineeringand knowledge engineering, pages 765–772. ACM Press, 2002.
3. M. Eyl. The harmony information landscape: Interactive, three dimensional navigationthrough an information space, 1995.
4. S. Few. Show Me the Numbers: Designing Tables and Graphs to Enlighten. Analytics Press,1st edition, 2004.
5. M. Fowler, K. Beck, J. Brant, W. Opdyke, and D. Roberts. Refactoring: Improving theDesign of Existing Code. Addison-Wesley Professional, 1st edition, 1999.
6. T. R. Gruber. Toward principles for the design of ontologies used for knowledge sharing.Int. J. Hum.-Comput. Stud., 43(5-6):907–928, 1995.
7. A. Katifori, C. Halatsis, G. Lepouras, C. Vassilakis, and E. Giannopoulou. Ontology visual-ization methods - a survey. ACM Comput. Surv., 39(4), Nov. 2007.
8. A. Khalili. Linked data reactor: a framework for building reactive linked data applications.In Joint Proceedings of the 4th International Workshop on Linked Media and the 3rd Devel-opers Hackshop co-located with the 13th Extended Semantic Web Conference ESWC 2016,Heraklion, Crete, Greece, May 30, 2016., 2016.
9. C. Knight and M. Munro. Virtual but visible software. In IEEE International Conference onInformation Visualization, pages 198–205. IEEE, 2000.
10. T. Panas, R. Berrigan, and J. Grundy. A 3d metaphor for software production visualization.In Intl. Conference on Information Visualization, page 314, 2003.
11. C. Roussey, O. Corcho, and L. M. V. Blazquez. A catalogue of OWL ontology antipatterns.In International Conference on Knowledge Capture (K-CAP 2009), September 1-4, 2009,Redondo Beach, California, USA, pages 205–206, 2009.
12. S. Strasnick and J. Tesler. Method and apparatus for displaying data within a three-dimensional information landscape, June 18 1996. US Patent 5,528,735.
13. R. Wettel and M. Lanza. Program comprehension through software habitability. In 15th In-ternational Conference on Program Comprehension (ICPC 2007), June 26-29, 2007, Banff,Alberta, Canada, pages 231–240, 2007.
14. R. Wettel and M. Lanza. Visualizing software systems as cities. In Proceedings of the4th IEEE International Workshop on Visualizing Software for Understanding and Analysis,VISSOFT 2007, June, 2007, pages 92–99, 2007.
15. R. Wettel and M. Lanza. Visual exploration of large-scale system evolution. In WCRE 2008,Proceedings of the 15th Working Conference on Reverse Engineering, Antwerp, Belgium,October 15-18, 2008, pages 219–228, 2008.
16. R. Wettel and M. Lanza. Visually localizing design problems with disharmony maps. InProceedings of the ACM 2008 Symposium on Software Visualization, Ammersee, Germany,September 16-17, 2008, pages 155–164, 2008.
17. R. Wettel, M. Lanza, and R. Robbes. Software systems as cities: a controlled experiment. InICSE, pages 551–560, 2011.