Embed Size (px)
Citation preview
Visual Analytics for Narrative TextVisualizing Characters and their Relationships as Extracted from Novels
Markus John, Steffen Lohmann, Steffen Koch, Michael Worner and Thomas Ertl
Institute for Visualization and Interactive Systems, University of Stuttgart, Universitatsstraße 38, Stuttgart, Germany
{markus.john, steffen.lohmann, steffen.koch, michael.woerner, thomas.ertl}@vis.uni-stuttgart.de
Keywords: Text Visualization, Visual Text Analytics, Digital Humanities, Distant Reading.
Abstract: The study of novels and the analysis of their plot, characters and other entities are time-consuming and com-
plex tasks in literary science. The digitization of literature and the proliferation of electronic books provide
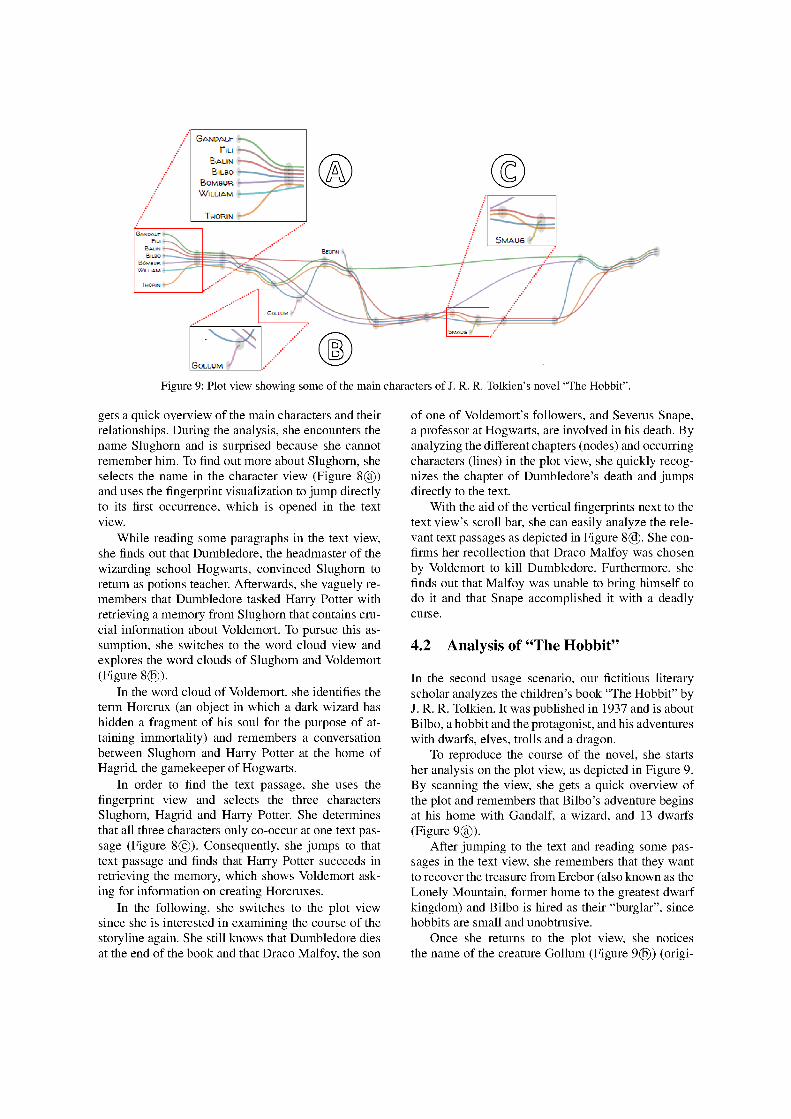
new opportunities to support these tasks with visual abstractions. Methods from the fields of computational lin-
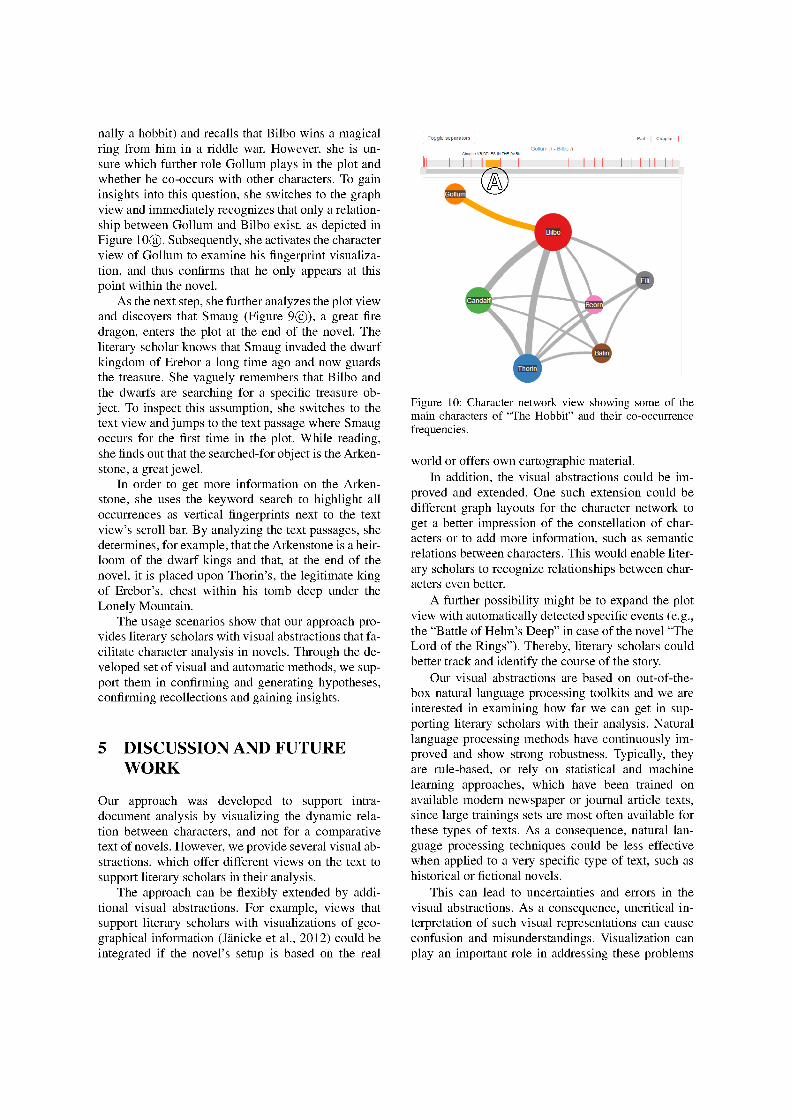
guistics can be used to automatically extract entities and their relations from digitized novels, which can then
be visualized to ease exploration and analysis tasks. This paper presents a web-based approach that combines
automatic analysis methods with effective visualization techniques. Different views on the extracted entities
are provided and relations between them across the plot are indicated. Two usage scenarios show successful
applications of the approach and demonstrate its benefits and limitations.
1 INTRODUCTION
Common tasks in literary science are studying novels
and analyzing their plot, characters and other entities.
Literary scholars are interested in getting an overview
of the plot and its characters, the relationships be-
tween them and their evolution during the plot (Phe-
lan, 1989). The digitization of literature and the pro-
liferation of electronic books (ebooks) provide new
means to support these tasks with visual abstractions
that are automatically generated from ebooks.
Traditionally, literary scholars read and analyze
novels in a sequential way by using so-called close
reading. In contrast to this, Moretti introduced the
idea of distant reading (Moretti, 2005). Instead of
carefully reading and analyzing a literary work, dis-
tant reading abstracts the text by providing visualiza-
tions such as graphs that depict the genre change of
historical novels, maps to represent geographical as-
pects of the plot, or trees to classify various types of
detective stories (Janicke et al., 2015). These visual
abstractions can convey useful information and as-
sist in exploring and understanding complex relation-
ships, verifying hypotheses as well as forming new
research ideas.
In order to provide visual abstractions for lit-
erary works, a combination of automatic methods
and interactive visualization techniques is required.
When dealing with ebooks, natural language process-
ing methods are the first choice for automatic analy-
sis. Using these methods, entities such as characters
and places can be extracted from the ebooks. This en-
ables the development of visual abstractions that al-
low to explore these entities and their relationships in
more detail. In particular, a large interest has grown in
web-based systems for literature analysis that are easy
to use and do not require any skills in computational
linguistics (Plaisant et al., 2006).
This paper presents a web-based approach that
aims to provide literary scholars with visual abstrac-
tions to facilitate character analysis in novels. It uti-
lizes automatic named entity extraction and visualizes
relationships between characters and places based on
co-occurrence analyses. The basic idea of the ap-
proach is to highlight patterns, such as specific char-
acters and places or groups of characters that interact
with each other at certain places over time. By offer-
ing several views, such patterns are made easily rec-
ognizable with our approach and provide the starting
point for a deeper analysis. This can result in a better
understanding of the plot, in particular related to the
characters and their relationships.
The main contributions of this work are: 1) A web-
based approach that offers a wide range of interac-
tive features to facilitate character analysis in nov-
els. 2) Several interrelated visual abstractions that en-
able the interactive switching to the corresponding
text sources in the document.
The rest of the paper is structured as follows: Sec-
tion 2 summarizes related work before our approach
Preprint of a paper that will appear as:
John, M., Lohmann, S., Koch, S., Wörner, M., Ertl, T. Visual Analytics for Narrative Text: Visualizing
Characters and their Relationships as Extracted from Novels. Proceedings of the 7th International
Conference on Information Visualization Theory and Applications (IVAPP '16). SciTePress, 2016.
is detailed in Section 3. This is followed by two use
cases demonstrating the applicability and usefulness
of the approach in Section 4. Section 5 provides a dis-
cussion of the approach and Section 6 concludes the
paper with a summary and outlook on future work.
2 RELATED WORK
Since our approach is concerned with the visual ab-
straction of text, we first summarize existing work in
this area. Next, we report on visual analytics attempts
in the field of literary science and review the systems
that are most closely related to our approach.
2.1 Visual Text Abstraction
Several techniques for visually abstracting and sum-
marizing text documents have been developed over
the last years. One compact visualization method
related to our approach is literature fingerprinting
(Keim and Oelke, 2007), which uses a pixel-based
technique that represents each text unit as a single
pixel and visually groups them into higher level units.
A related technique is used in Seesoft (Eick et al.,
1992), which has been designed as a visual finger-
print summarization of source code to graphically
represent software statistics. The intention of Tilebars
(Hearst, 1995) is the visual representation of search
results similar to the fingerprint idea, while Feature-
Lens (Don et al., 2007) also uses a pixel-based at-
tempt to explore interesting text patterns and to find
co-occurrences in texts.
Another popular technique to visually summa-
rize text are word clouds (Viegas and Wattenberg,
2008; Clement et al., 2009). They usually depict the
most frequently used words of a text with the font
size scaled according to the word frequencies. Word
clouds enable literature scholars to get a first impres-
sion of the main terms and topics of a text (Heimerl
et al., 2014).
To visualize relational information of a text doc-
ument, approaches such as WordTrees (Wattenberg
and Viegas, 2008) and PhraseNets (Van Ham et al.,
2009) were suggested. They depict either syntactic,
lexical or hierarchical relationships that exist between
the words of a text as node-link diagrams. In contrast,
(Oelke et al., 2013) use an adjacency matrix to encode
the development of relations between entities across a
text document.
Inspired by Munroe’s hand-drawn illustration
“Movie Narrative Charts” (Munroe, 2009), a new vi-
sual technique has emerged as so-called storyline or
plot view visualization (Liu et al., 2013). It aims to
portray the dynamic relationship between entities in a
story over time. (Tanahashi and Ma, 2012) as well as
(Liu et al., 2013) propose design considerations and
an efficient optimization approach for generating aes-
thetically appealing storyline visualizations.
2.2 Visual Text Analytics
In recent years, several approaches for visual text an-
alytics have been introduced in different domains.
Examples can be found in social media (Dou et al.,
2012), opinion mining (Oelke et al., 2009) or patent
analysis (Koch et al., 2011), among others.
There are also quite a number of visual analytics
approaches in the field of literary science. (Janicke
et al., 2014) propose several techniques for the visu-
alization and comparison of text that is reused in dif-
ferent documents in order to support literary scholars
in discovering and exploring intertextual similarities.
(Abdul-Rahman et al., 2013) present a rule-based so-
lution for poetry visualization allowing for high-level
interactions with the end users in a closed loop. They
use glyphs to encode phonetic units and visual links
to show phonetic and semantic relationships.
The VarifocalReader (Koch et al., 2014) sup-
ports literary scholars by combining distant and close
reading and by enabling intra-document explorations
through advanced navigation concepts. It integrates
machine learning techniques, search mechanisms and
several visual abstractions.
(Oelke et al., 2013) discuss the analysis of prose
literature by using the aforementioned literature fin-
gerprinting technique. Their approach visually ab-
stracts implicit relationships between characters and,
at the same time, encodes their development within
the analyzed novel. However, it does not allow to di-
rectly work with the text resource.
(Vuillemot et al., 2009) present the system
POSvis, which extracts named entities from literary
text and focuses on the exploration of networks of
characters. POSvis offers multiple coordinated views,
including word clouds and self-organizing graphs,
equipped with filter methods to review the vocabu-
lary of novels. While this is closely related to our
work, we do not pursue the goal to review the vocab-
ulary in the context of one or more entities filtered by
part of speech. Instead, we aim to support the analy-
sis of characters and their relationships in the story-
line of a novel, based on named entity extraction and
co-occurrence analyses.
Another system closely related to our work is Jig-
saw (Stasko et al., 2008), which has been designed
to support analysts during foraging and sense-making
activities in collections of textual reports and other

sets of documents. It provides multiple coordinated
views including lists, scatter plots, word clouds and
graph visualizations that allow tracking entities and
exploring their relationships across the document col-
lections.
Jigsaw has been designed primarily for inter-
document analysis, whereas we are interested in intra-
document analysis, i.e., we support the analysis of a
single text document at a time. Apart from that, Jig-
saw follows a rather generic approach that does not
focus on fictional literature and the analysis of char-
acters but provides general-purpose visualizations for
different kinds of entities extracted from the docu-
ments.
3 VISUAL ANALYSIS
Our approach has been implemented as a web appli-
cation that is easily available to literary scholars and
other user groups, as it does not require any installa-
tion on the user’s side. The implementation is based
on standard web technologies and can be run with a
modern web browser supporting HTML5, SVG, CSS,
and JavaScript.1 It provides different visual abstrac-
tions representing specific characteristics of the ana-
lyzed novel and highlighting search results that illus-
trate the development of characters in a storyline.
The web application offers automatic methods for
importing novels, extracting characters and places
and visualizing them. The developed visualizations
include word clouds, fingerprints of characters and
places, a graph representation indicating connections
between characters and a plot view that illustrates the
relationships between characters and places in a story
over time.
3.1 Text Processing
There are a variety of formats for the digital represen-
tation of novels. One widely used format is EPUB,
which is a free and open standard that encodes struc-
ture and layout information besides the actual text
of the novel. Many digital libraries, such as Project
Gutenberg2, offer ebooks in EPUB format or alterna-
tively as plain text.
EPUB and plain text are also the two formats sup-
ported by our approach. It does not require the plain
text to be structured in a specific way. However, if
the structure of chapters or other metadata should be
1A public demo of the web application is available at:http://textvis.visualdataweb.org
2http://www.gutenberg.org
considered in the analysis, this information must be
given in the text file. We therefore utilize some sim-
ple markup to structure ebooks provided in plain text,
such as those by Project Gutenberg. The markup can
be used to add chapter headings, line breaks and com-
ments as well as other metadata (e.g., the title, au-
thor(s), publication date, publisher, edition or genre
of a book) manually or automatically.
Once the ebook is loaded into the system, it is
processed in a linguistic analysis pipeline, consisting
of tokenization, sentence splitting and named-entity
recognition. The implementation offers three differ-
ent analysis tools that users can choose from: Stan-
ford CoreNLP3, OpenNLP4 and ANNIE5. All three
tools perform state-of-the-art natural language pro-
cessing (NLP) but use different techniques that each
have their benefits and limitations. Depending on the
use case and type of novel, users can select the NLP
tool that is most suitable for the analysis. As this is
often not clear from the start, they can also run the
linguistic analysis several times with all three tools,
compare the different outputs and choose the one that
produces the best results. The current implementation
only supports the processing of English texts; how-
ever, it can be extended to other languages if required.
The users can set several other parameters for the
analysis and visualization. Most importantly, they can
control whether stop words are removed and whether
person and place names starting with a lowercase let-
ter should be considered. However, these parameters
are only shown on demand and are intended for the
experienced user. By default, ANNIE is used for NLP
processing and unlikely character and place names
are removed, as these settings, in our experience, pro-
duced the best results for most of the novels we tested.
3.2 Overview Page
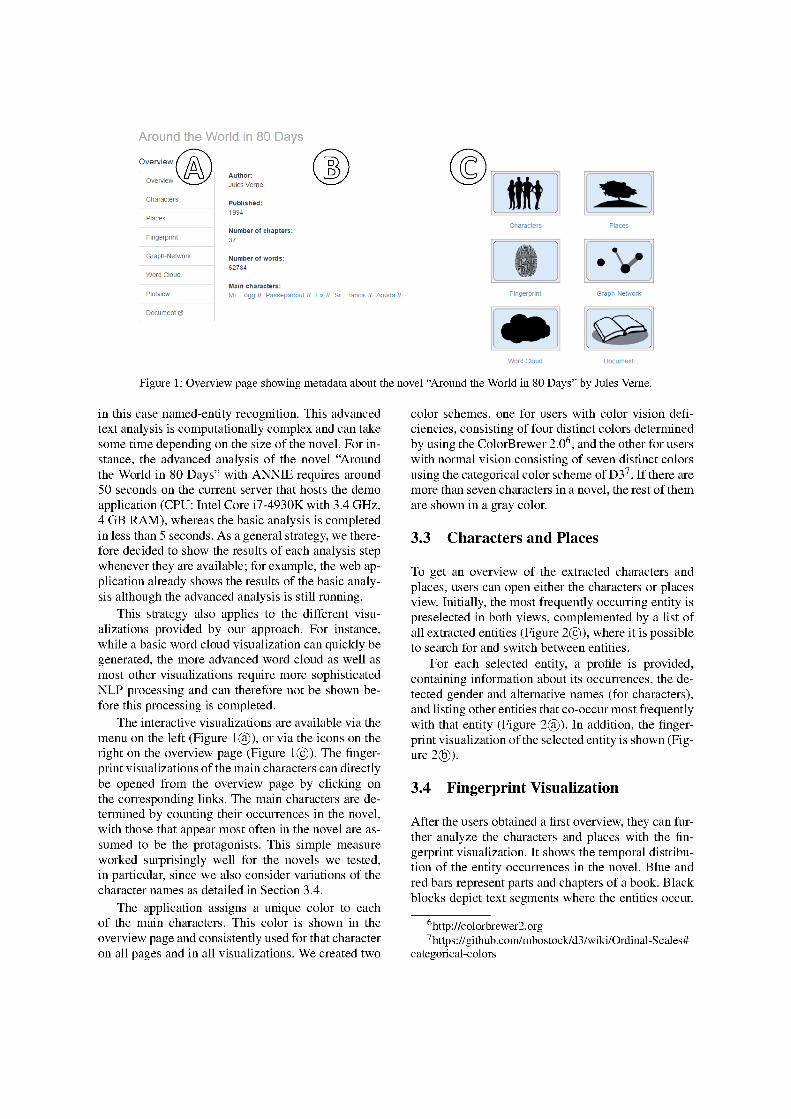
After an ebook has been linguistically analyzed, an
overview page is shown, listing metadata about the
book and providing links to the visual abstractions.
As an example, the overview page of the classic ad-
venture novel “Around the World in 80 Days” by Jules
Verne is shown in Figure 1 b©.
Some of the metadata (e.g., the title, author, and
release date) is directly taken from the text source
(if provided), while the determination other meta-
data (e.g., the number of words and chapters) requires
some basic text analysis. Yet other metadata, such as
the main characters listed on the overview page, can
only be determined by using advanced text analysis,
3http://nlp.stanford.edu/software/corenlp.shtml4http://opennlp.apache.org/5https://gate.ac.uk/ie/annie.html
in the future. We intend to provide visual clues on the
quality of automatic analyses (if available), for exam-
ple, through color and opacity. This could help literary
scholars to interpret automatically generated results.
Furthermore, we want to let users steer and adapt
techniques interactively according to their needs. As
a result, automatic methods can be improved and ap-
plied to similar texts.
The current implementation of the detection of co-
occurrences between entities is based on named en-
tity recognition. We determine that two entities co-
occur if they both appear at least in one sentence.
This approach works well in many cases. However, it
can be improved in various aspects. One option could
be to let the literary scholars set the co-occurrences
range variable, for example, several sentences or a
whole paragraph. Additionally, methods for corefer-
ence resolution might be integrated, to detect more
instances and compute more precise frequency val-
ues for entities. Coreference resolution is the task of
resolving noun phrases to the entities that they re-
fer to and there already exist robust methods (Raghu-
nathan et al., 2010; Stoyanov et al., 2010). Existing
approaches are usually trained on non-fictional texts
and have to be adapted (where appropriate) to the
users’ needs.
In the future, we plan to take the semantics of the
text into account in order to better investigate the re-
lationships between entities. Again, already existing
approaches (Gildea and Jurafsky, 2002; Ruiz-Casado
et al., 2007) could be integrated into our approach
to provide the literary scholars with more informa-
tion for their analysis. In general, we aim at support-
ing a broader spectrum of natural language processing
methods in the future.
Another issue is the challenge of scalability when
working with arbitrarily long novels. Most of our vi-
sual abstractions scale very well. However, the finger-
print visualization and the plot view become less use-
ful with longer text. Since the available screen space
remains the same, they are increasingly compressed
until they overlap. To address this problem in the fu-
ture, we could integrate a focus+context technique,
such as fisheye distortion (Bederson, 2000), to present
detailed information in context, or an overview+detail
approach to present multiple views with different lev-
els of abstractions (Cockburn et al., 2009).
6 CONCLUSION
In this work, we presented an easily accessible web-
based approach for visualizing the relation of charac-
ters and places in a novel. Our approach includes dif-
ferent natural language processing toolkits to extract
named entities and possibilities to set parameters for
variable analyses. Furthermore, we provide several vi-
sual abstractions, which support literary scholars with
a flexible and comprehensive analysis of the novel
characters. In particular, our approach facilitate dis-
tant reading and provide a starting point for new ideas,
hypotheses and further analyses. All views enable lit-
erary scholars to jump to the corresponding text pas-
sage and thus allow for working with the text directly.
We presented an implementation of the approach and
provided two usage scenarios that illustrate its appli-
cability and usefulness.
ACKNOWLEDGEMENTS
We would like to thank our students Sanjeev Balakr-
ishnan, Felix Do, Sebastian Frank, Paul Kuznecov,
Vincent Link, Eduard Marbach, Jan Melcher, Chris-
tian Richter, Marc Weise, and Marvin Wyrich who
implemented the approach in a student project. This
work has partly been funded by the German Federal
Ministry of Education and Research (BMBF) as part
of the ‘ePoetics’ project.
REFERENCES
Abdul-Rahman, A., Lein, J., Coles, K., Maguire, E., Meyer,M., Wynne, M., Johnson, C. R., Trefethen, A., andChen, M. (2013). Rule-based visual mappings – with acase study on poetry visualization. Computer Graph-ics Forum, 32(3pt4):381–390.
Bederson, B. (2000). Fisheye menus. In Proceedings ofthe 13th Annual ACM Symposium on User interfaceSoftware and Technology, pages 217–225. ACM.
Clement, T., Plaisant, C., and Vuillemot, R. (2009). Thestory of one: Humanity scholarship with visualizationand text analysis. In Proceedings of the Digital Hu-manities Conference, DH ’09.
Cockburn, A., Karlson, A., and Bederson, B. (2009). A re-view of overview+detail, zooming, and focus+contextinterfaces. ACM Computing Surveys, 41(1):1–31.
Don, A., Zheleva, E., Gregory, M., Tarkan, S., Auvil, L.,Clement, T., Shneiderman, B., and Plaisant, C. (2007).Discovering interesting usage patterns in text collec-tions: Integrating text mining with visualization. InProceedings of the 16th ACM Conference on Con-ference on Information and Knowledge Management,CIKM ’07, pages 213–222. ACM.
Dou, W., Wang, X., Skau, D., Ribarsky, W., and Zhou, M.(2012). Leadline: Interactive visual analysis of textdata through event identification and exploration. InProceedings of the IEEE Conference on Visual Ana-lytics Science and Technology, VAST ’12, pages 93–102.
Eick, S., Steffen, J., and Sumner, E.E., J. (1992). Seesoft– a tool for visualizing line oriented software statis-tics. IEEE Transactions on Software Engineering,18(11):957–968.
Gildea, D. and Jurafsky, D. (2002). Automatic labeling ofsemantic roles. Computational linguistics, 28(3):245–288.
Hearst, M. A. (1995). Tilebars: Visualization of term dis-tribution information in full text information access.In Proceedings of the SIGCHI Conference on HumanFactors in Computing Systems, CHI ’95, pages 59–66.ACM/Addison-Wesley.
Heimerl, F., Lohmann, S., Lange, S., and Ertl, T. (2014).Word cloud explorer: Text analytics based on wordclouds. In 47th Hawaii International Conferenceon System Sciences, HICCS ’14, pages 1833–1842.IEEE.
Janicke, S., Franzini, G., Cheema, M. F., and Scheuermann,G. (2015). On Close and Distant Reading in Digi-tal Humanities: A Survey and Future Challenges. InEurographics Conference on Visualization – STARs,EuroVis ’15. Eurographics Association.
Janicke, S., Geßner, A., Buchler, M., and Scheuermann, G.(2014). Visualizations for text re-use. In Proceedingsof the 5th International Conference on InformationVisualization Theory and Applications, IVAPP ’14,pages 59–70. INSTICC.
Janicke, S., Heine, C., Stockmann, R., and Scheuermann,G. (2012). Comparative visualization of geospatial-temporal data. In Proceedings of the 3rd InternationalConference on Information Visualization Theory andApplications, IVAPP ’14, pages 613–625. INSTICC.
Keim, D. and Oelke, D. (2007). Literature fingerprinting:A new method for visual literary analysis. In Pro-ceedings of the IEEE Symposium on Visual AnalyticsScience and Technology, VAST ’07, pages 115–122.
Koch, S., Bosch, H., Giereth, M., and Ertl, T. (2011). It-erative integration of visual insights during scalablepatent search and analysis. IEEE Transactions on Vi-sualization and Computer Graphics, 17(5):557–569.
Koch, S., John, M., Worner, M., Muller, A., and Ertl, T.(2014). Varifocalreader – in-depth visual analysis oflarge text documents. IEEE Transactions on Visual-ization and Computer Graphics, 20(12):1723–1732.
Liu, S., Wu, Y., Wei, E., Liu, M., and Liu, Y. (2013).Storyflow: Tracking the evolution of stories. IEEETransactions on Visualization and Computer Graph-ics, 19(12):2436–2445.
McNaught, C. and Lam, P. (2010). Using wordle as asupplementary research tool. The qualitative report,15(3):630–643.
Moretti, F. (2005). Graphs, maps, trees: abstract models fora literary history. Verso.
Munroe, R. (2009). Movie narrative charts.http://xkcd.com/657/.
Oelke, D., Hao, M., Rohrdantz, C., Keim, D., Dayal, U.,Haug, L., and Janetzko, H. (2009). Visual opinionanalysis of customer feedback data. In Proceedingsof the IEEE Symposium on Visual Analytics Scienceand Technology, VAST ’09, pages 187–194.
Oelke, D., Kokkinakis, D., and Keim, D. A. (2013). Fin-gerprint matrices: Uncovering the dynamics of socialnetworks in prose literature. Computer Graphics Fo-rum, 32(3pt4):371–380.
Phelan, J. (1989). Reading people, reading plots: Charac-ter, progression, and the interpretation of narrative.University of Chicago Press.
Plaisant, C., Rose, J., Yu, B., Auvil, L., Kirschenbaum,M. G., Smith, M. N., Clement, T., and Lord, G.(2006). Exploring erotics in emily dickinson’s corre-spondence with text mining and visual interfaces. InProceedings of the 6th ACM/IEEE-CS Joint Confer-ence on Digital libraries, pages 141–150. ACM.
Raghunathan, K., Lee, H., Rangarajan, S., Chambers, N.,Surdeanu, M., Jurafsky, D., and Manning, C. (2010).A multi-pass sieve for coreference resolution. In Pro-ceedings of the 2010 Conference on Empirical Meth-ods in Natural Language Processing, EMNLP ’10,pages 492–501. ACL.
Ruiz-Casado, M., Alfonseca, E., and Castells, P. (2007).Automatising the learning of lexical patterns: An ap-plication to the enrichment of wordnet by extract-ing semantic relationships from wikipedia. Data &Knowledge Engineering, 61(3):484–499.
Stasko, J., Gorg, C., and Liu, Z. (2008). Jigsaw: Support-ing investigative analysis through interactive visual-ization. Information Visualization, 7(2):118–132.
Stoyanov, V., Cardie, C., Gilbert, N., Riloff, E., Buttler, D.,and Hysom, D. (2010). Coreference resolution withreconcile. In Proceedings of the ACL 2010 ConferenceShort Papers, pages 156–161. ACL.
Tanahashi, Y. and Ma, K.-L. (2012). Design considera-tions for optimizing storyline visualizations. IEEETransactions on Visualization and Computer Graph-ics, 18(12):2679–2688.
Van Ham, F., Wattenberg, M., and Viegas, F. (2009). Map-ping text with phrase nets. IEEE Transactions on Visu-alization and Computer Graphics, 15(6):1169–1176.
Viegas, F. B. and Wattenberg, M. (2008). Tag clouds andthe case for vernacular visualization. interactions,15(4):49–52.
Vuillemot, R., Clement, T., Plaisant, C., and Kumar, A.(2009). What’s being said near “martha”? exploringname entities in literary text collections. In Proceed-ings of the IEEE Symposium on Visual Analytics Sci-ence and Technology, 2009, VAST ’09, pages 107–114.
Wattenberg, M. and Viegas, F. (2008). The word tree, an in-teractive visual concordance. IEEE Transactions onVisualization and Computer Graphics, 14(6):1221–1228.