Embed Size (px)
Citation preview

VISION —Monthly Economic and Financial Monitor
April 2015

Research Analysts—
Ihor Danyliuk 416-869-7522Head of Research
Greg Colman 416-869-6775Deputy Head of Research
Caroline Jukes 416-869-8039Administrative Manager
Tanya Bouchard 416-869-7934Supervisory Analyst
Research PublicationsVanda Bright 416-869-7141Manager, Publishing Services
Wayne Chau 416-869-7140Publishing Associate
Information and Distribution Institutional Clients
Giuseppe Saltarelli [email protected]
Retail Branches
Anoochka Gokhool [email protected]
Economics and Strategy Stéfane Marion 514-879-3781Chief Economist and Strategist Paul-André Pinsonnault 514-879-3795Senior Fixed Income EconomistKrishen Rangasamy 514-879-3140Senior EconomistMarc Pinsonneault 514-879-2589Senior EconomistMatthieu Arseneau 514-879-2252Senior Economist
Communications, Media and TelecomAdam Shine 514-879-2302Associate: Peter Stusio 514-879-2564Associate: Kevin Krishnaratne 416-869-6585
Energy Agriculture and Energy Services
Greg Colman 416-869-6775Associate: Andrew Jacklin 416-869-7571Associate: Sean Wetmore 416-869-6763Associate: Michael Storry-Robertson 416-507-8007
Junior and Intermediate Oil and Gas
Dan Payne 403-290-5441Brian Milne 403-290-5625Associate: Tim Sargeant 403-441-0952Associate: Mark Hirsch 403-441-0928
Senior and Intermediate Yield Oil and Gas
Kyle Preston 403-290-5102Associate: Jason Wai 403-355-6643
Pipelines, Utilities and Energy Infrastructure
Patrick Kenny 403-290-5451Associate: Michael Nguyen 403-290-5447
Financial Services Banking and Insurance
Peter Routledge 416-869-7442Associate: Parham Fini 416-869-6515Associate: Paul Poon 416-507-8006
Diversified Financials
Shubha Khan 416-869-6425Associate: Jaeme Gloyn 416-869-8042
Merchandising and Consumer ProductsVishal Shreedhar 416-869-7930Associate: Ryan Li 416-869-6767
Metals and MiningShane Nagle 416-869-7936Associate: Raj Udayan Ray 416-507-8105Associate: Gregory Doyle 416-869-6538
Steve Parsons 416-869-6766Associate: Don DeMarco 416-869-7572
Adam Melnyk 604-643-2864Associate: David Lee 416-869-8045
Real EstateMatt Kornack 416-507-8104Associate: Dawoon Chung 416-507-8102
Trevor Johnson 416-869-8511Associate: Endri Leno 416-869-8047Associate: Kyle Stanley 416-507-8108
Special SituationsLeon Aghazarian 514-879-2574Associate: Frédéric Tremblay 514-412-0021Associate: Jean-François Bourdon 514-390-7825
Trevor Johnson 416-869-8511Associate: Endri Leno 416-869-8047Associate: Kyle Stanley 416-507-8108
Chris Bowes 416-869-7375Associate: John Xu 416-507-9115
Sustainability and Clean Tech Rupert Merer 416-869-8008Associate: Jeremy Mersereau 416-869-6768Associate: Mark Vernest 416-869-7476
Technology Kris Thompson 416-869-8049Associate: Auritro Kundu 416-869-7495Associate: Steven Walt 416-869-7938
Transportation and Industrials Cameron Doerksen 514-879-2579Associate: Umayr Allem 416-869-8577
Technical AnalysisDennis Mark 416-869-7427
ETF Research and Strategy Associate: Daniel Straus 416-869-8020Associate: Ling Zhang 416-869-7942
Geopolitical AnalysisPierre Fournier 514-879-2423Associate: Angelo Katsoras 514-879-6458

Table of Contents—Highlights . . . . . . . . . . . . . . . . . . . . . . . . . . . . . . . . . . . . . . . . . . . . . . . . . . . . . . . . . . . . . . . . . . . . . . . 02
The Economy . . . . . . . . . . . . . . . . . . . . . . . . . . . . . . . . . . . . . . . . . . . . . . . . . . . . . . . . . . . . . . . . . . . . . 05
Interest Rates and Bond Markets . . . . . . . . . . . . . . . . . . . . . . . . . . . . . . . . . . . . . . . . . . . . . . . . . 15
Stock Market and Portfolio Strategy . . . . . . . . . . . . . . . . . . . . . . . . . . . . . . . . . . . . . . . . . . . . . . 21
Technical Analysis . . . . . . . . . . . . . . . . . . . . . . . . . . . . . . . . . . . . . . . . . . . . . . . . . . . . . . . . . . . . . . . 29
NBF Action List . . . . . . . . . . . . . . . . . . . . . . . . . . . . . . . . . . . . . . . . . . . . . . . . . . . . . . . . . . . . . . . . . . . 33
Sector Analysis . . . . . . . . . . . . . . . . . . . . . . . . . . . . . . . . . . . . . . . . . . . . . . . . . . . . . . . . . . . . . . . . . . 35
Analyst Recommendations . . . . . . . . . . . . . . . . . . . . . . . . . . . . . . . . . . . . . . . . . . . . . . . . . . . . . . . 36
Alphabetical Listing . . . . . . . . . . . . . . . . . . . . . . . . . . . . . . . . . . . . . . . . . . . . . . . . . . . . . . . . . . . . . 56
NBF Disclosures, please visit URL: http://www.nbcn.ca/contactus/disclosures.html
For a paper copy of the disclosures, please send a written request (indicating the name and date of the product) to:National Bank Financialc/o Giuseppe Saltarelli1155, Metcalfe Street 5th Floor Montreal (Quebec), CanadaH3B 4S9

VISIONApril 2015
02
—
Economy
Thanks in part to a weakening euro, the eurozone economy is finally showing some promising signs . We have, accordingly, raised our growth forecasts for the common currency area . Newly announced stimulus by Beijing also gives a boost to China’s prospects . However, those are more than offset by a downgrade to our U .S . outlook, which prompts us to trim by two ticks our 2015 global growth forecast to 3 .3% .
It’s déjà vu in the U .S ., as a harsh winter again wrecked Q1 economic activity . The poor start of the year forces us to cut our 2015 forecast for GDP growth to 2 .9% . That said, fundamentals for domestic demand remain strong, including a consumer that’s being lifted by the best labour market in years . The Fed remains on track to hike interest rates later this year, but don’t expect it to get aggressive when it starts tightening . The strong U .S . dollar is not only hindering exports, but is also making it more difficult for inflation to reach the Fed’s 2% target .
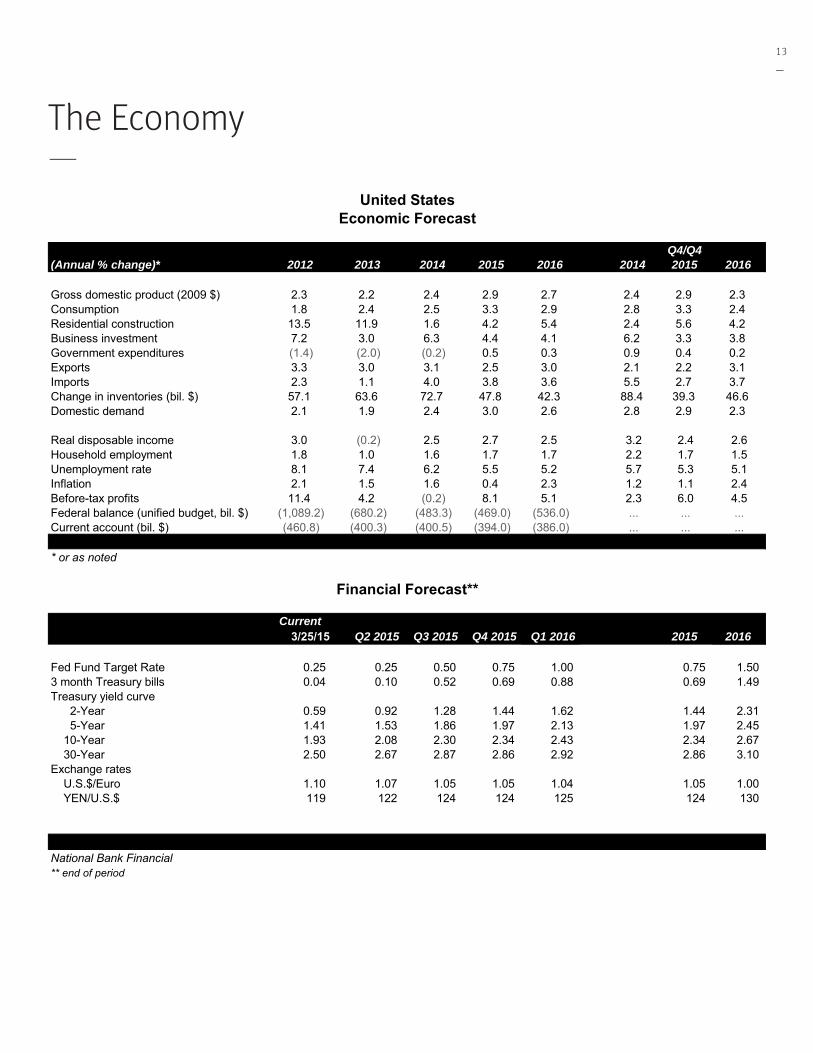
Like the U .S ., Canada struggled in the first quarter of the year in part due to weather-related disruptions to economic activity . GDP growth in Q1 is pacing below 1% annualized, the worst performance in years . Growth should pick up from here, but we’re not expecting stellar results considering the full impact of the oil price collapse has yet to be felt, e .g . anticipated decline in investment and employment particularly in the oil patch . We continue to forecast 2% growth this year, expecting Central provinces to make the most of a cheap currency and offset weakness in Western Canada .
Interest Rates and Currency
With the Fed no longer committed to patience, but clearly stating that its policy stance will be data-dependent, the sensitivity of the yield curve to economic indicators is likely to step up a notch . We accordingly expect greater market volatility in the months ahead . That said, since the FOMC participants’ view of the appropriate path of the target fed funds rate in 2015 is closely aligned with our own, we are leaving our year-end forecast for 10-year Treasuries unchanged at 2 .34% .
Although uncertainty about the price of oil and the path of Canadian monetary policy is relatively high, we are inclined to think the overnight rate will end the year unchanged at 0 .75% . However, our conviction that the Bank of Canada will lag the Fed in rate hikes is much stronger . We continue to see the BoC target rate at 1% in Q4 2016 .
The Canadian dollar, like several other major currencies, went on a roller coaster ride in March, courtesy of USD-related gyrations . The USD’s initial ascent was fueled by expectations the Fed would remove the word “patient” from its forward guidance and hence open the door to rate hikes . The Fed did just that, but it also downgraded its forecasts for GDP growth, inflation, and even the fed funds rate, which prompted a subsequent USD selloff . So, while the greenback should continue to benefit from diverging monetary policy in the U .S . and the rest of the world, there could be some short-term volatility if there are any hints the Fed may delay rate hikes to later, or if improving eurozone data prompts markets to question the necessity of the ECB’s QE program . We remain comfortable with our view that USDCAD will trade in the 1 .20-1 .30 range over the near to medium term .
Recommended Asset Mix and Stock Market
After a very good performance in February, global equities hit new records in March . The MSCI AC index remains on track for a record 11th consecutive quarterly increase . Although the forward P/E of the MSCI AC is close to its historical average, equities remain an attractive asset class .
Equity markets should be supported by the fall of oil and food prices in many parts of the world which allows central banks to inject more liquidity and/or to delay the process of normalization toward higher interest rates . Moreover, we see earnings still rising as the expansion phase of the U .S . economic cycle is still young and the euro zone seems to be recovering, to judge by upticks not just in industrial output but in domestic demand, as labour markets show signs of improving .
Our asset mix is unchanged this month . We remain comfortable with our current recommendation to overweight equities relative to our benchmark, with a slight preference for non-U .S . assets to reflect our view that the U .S . dollar is likely to stabilize somewhat . Our year-end targets are 16,200 for the S&P/TSX and 2,220 for the S&P 500 .
Our sector rotation is also unchanged this month with its slight preference for non-interest-sensitive sectors . We are staying with our overweight recommendation for the Canadian Energy sector . A rise in energy prices due to the combined effect of U .S . production cutbacks and a tamer greenback could reignite interest in this sector .
Highlights—
Stéfane Marion Chief Economist and Strategist 514-879-3781

03
—
Highlights—
Benchmark (%)
NBF Recommendation (%)
Change (pp)
EquitiesCanadian Equities 30 33U.S. Equities 10 12Foreign Equities (EAFE) 10 9Emerging markets 5 8
Fixed IncomeCanadian Bonds 30 28Foreign Pay Bonds 0 0Real Return Bonds 10 5
Cash 5 5Total 100 100NBF Economics and Strategy
NBF Asset AllocationActual ForecastLevel Q4 2015 (Est.)
INTEREST RATES
3-month US 0.04 0.69 CA 0.53 0.63
10 yrs US 1.92 2.34 CA 1.34 1.89
STOCK MARKET Q4 2015 (Est.)Target
S&P 500 2,061 2,220S&P/TSX 14,929 16,200
S&P/TSX Sectors Weight* Recommendation Change
Energy 21.4 Overweight
Materials 11.0 Market Weight
Industrials 8.4 Market Weight
Consumer Discretionary 6.5 Underweight
Consumer Staples 3.8 Underweight
Healthcare 4.9 Market Weight
Financials 34.6 Market Weight
Information Technology 2.4 Overweight
Telecommunication Services 4.7 Underweight
Utilities 2.2 Underweight
Total 100.0* As of March 25, 2015
NBF Sector Rotation

This page intentionally left blank .

The Economy—

VISIONApril 2015
06
—
World: Hope in Europe
Thanks in part to a weakening euro, the eurozone economy is finally showing some promising signs. We have, accordingly, raised our growth forecasts for the common currency area. Newly announced stimulus by Beijing also gives a boost to China’s prospects. However, those are more than offset by a downgrade to our U.S. outlook, which prompts us to trim by two ticks our 2015 global growth forecast to 3.3%.
The global economy ended 2014 like a lion according to latest data from the CPB . In the final quarter last year, industrial production grew at the fastest pace since 2013 as advanced economies bounced back with solid contributions from the U .S ., Japan and even the euro area . The healthy state of the world economy was further reflected by solid trade data — the value of trade fell with plunging oil prices, but more importantly volumes continued to rise, reaching a new record in December .
Unlike the prior quarter when growth was broad-based, the economic picture for Q1 is mixed . Advanced economies as a group are slowing down, but that’s largely due to disappointing data in the U .S . The prior quarter’s inventory build as well as bad weather, like last year, promise to significantly weigh on Q1 growth in the world’s largest economy (see U .S . section) . Japanese data hasn’t been great either . Besides continuing softness in housing investment, tepid demand together with lower energy prices have caused inflation to fall towards zero, moving further away from the Bank of Japan’s 2% target . The central bank, however, took no further action at its March meeting, saying it felt confident that longer term inflation expectations were rising . The economy should improve later this year considering the diminished fiscal drag (i .e . no sales tax slated for 2015), and as the trade sector continues to recover, helped by a competitive yen .
But weakness wasn’t widespread in advanced economies in Q1 . The Eurozone provided some upside surprises, helped perhaps by low expectations brought by serial disappointments earlier . The common currency area seems to be recovering based on the uptick not just for industrial output but also for domestic demand . Construction is slowly coming back, as is consumption spending as evidenced by rising new car registrations and higher retail volumes . The latter is being helped by an improvement in the labour market . The job vacancy rate in Q4 last year
climbed to 1 .8%, the highest since 2011, and the jobless rate fell to 11 .2% in January this year, the lowest since 2012 . Better credit may also be helping . Note that loans to households, while still down on a year-on-year basis, have now risen in the last two months .
-4-3-2-10123456789
1011
2011 2012 2013 2014
World: A good handoff to 2015 Global industrial production
NBF Economics and Strategy (data via CPB)
Q4
Emerging
Advanced
WORLD
q/q % chg. saar
96
100
104
108
112
116
120
124
128
132
136
140
144
2009 2010 2011 2012 2013 2014
World: Trade volumes at record high Global trade value and volumes
NBF Economics and Strategy (source CPB)
index
Volumes
Value
Dec.
-100
-80
-60
-40
-20
0
20
40
60
80
14Q1 14Q2 14Q3 14Q4 15Q1-30-25-20-15-10-505
10152025303540
14Q1 14Q2 14Q3 14Q4 15Q1
World: Mixed picture for Q1
NBF Economics and Strategy (data via Datastream)
Economic surprise index
Eurozone
U.S.
Recent drop in index for G10 … … largely due to the U.S.
G10
Emerging
Japan
Economic surprise index
The Economy—
Krishen Rangasamy Senior Economist 514-879-3140
07
—
-8
-6
-4
-2
0
2
4
6
8
10
12
2005 2006 2007 2008 2009 2010 2011 2012 2013 2014 201596
97
98
99
100
101
102
103
104
105
106
107
108
109
2005 2006 2007 2008 2009 2010 2011 2012 2013 2014 2015
Eurozone: Consumption starting to come back
NBF Economics and Strategy (data via Datastream)
Retail volumes Retail volumes and Loans to households
Retail volumes
Loans
index y/y % chg.
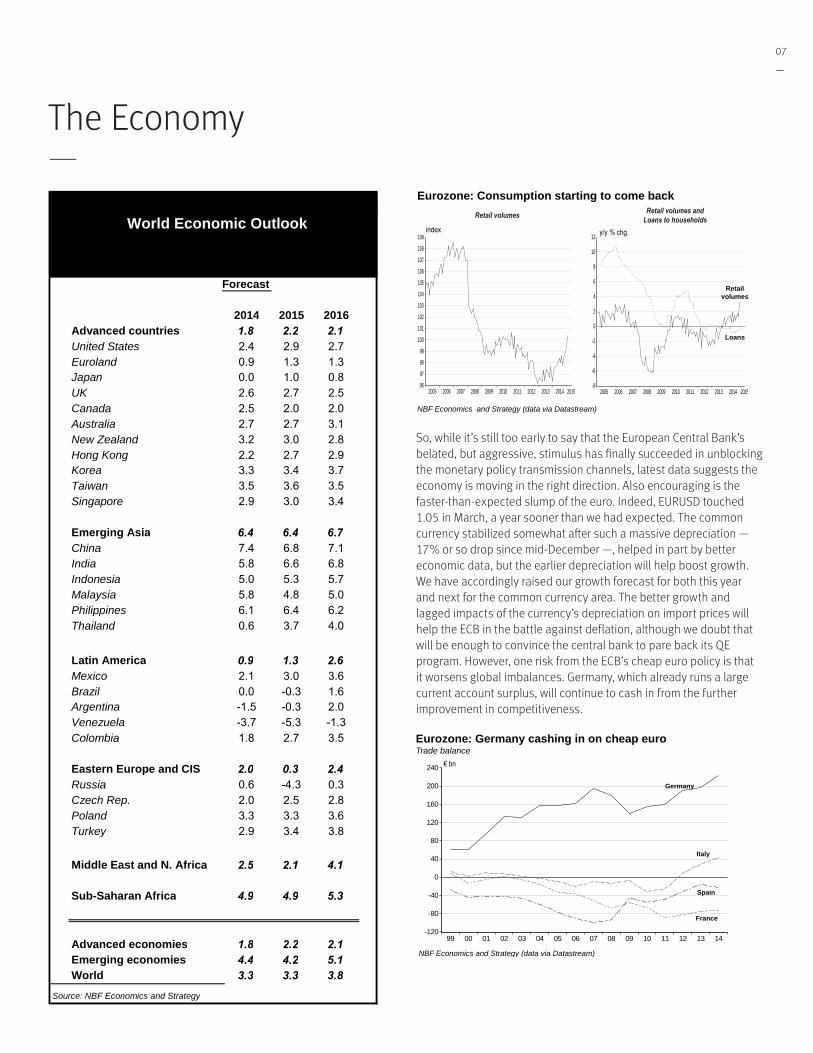
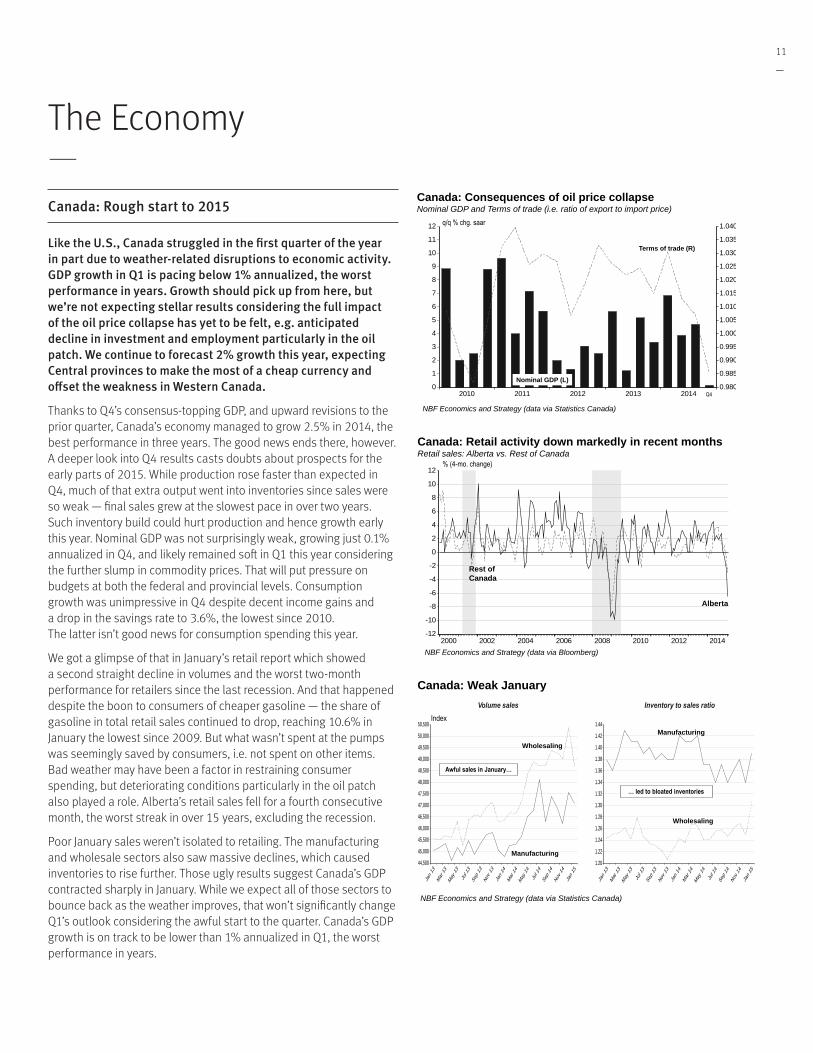
So, while it’s still too early to say that the European Central Bank’s belated, but aggressive, stimulus has finally succeeded in unblocking the monetary policy transmission channels, latest data suggests the economy is moving in the right direction . Also encouraging is the faster-than-expected slump of the euro . Indeed, EURUSD touched 1 .05 in March, a year sooner than we had expected . The common currency stabilized somewhat after such a massive depreciation — 17% or so drop since mid-December —, helped in part by better economic data, but the earlier depreciation will help boost growth . We have accordingly raised our growth forecast for both this year and next for the common currency area . The better growth and lagged impacts of the currency’s depreciation on import prices will help the ECB in the battle against deflation, although we doubt that will be enough to convince the central bank to pare back its QE program . However, one risk from the ECB’s cheap euro policy is that it worsens global imbalances . Germany, which already runs a large current account surplus, will continue to cash in from the further improvement in competitiveness .
-120
-80
-40
0
40
80
120
160
200
240
99 00 01 02 03 04 05 06 07 08 09 10 11 12 13 14
Eurozone: Germany cashing in on cheap euro Trade balance
NBF Economics and Strategy (data via Datastream)
€ bn
Germany
France
Spain
Italy
The Economy—
World Economic Outlook
Forecast
2014 2015 2016 Advanced countries 1.8 2.2 2.1 United States 2.4 2.9 2.7 Euroland 0.9 1.3 1.3 Japan 0.0 1.0 0.8 UK 2.6 2.7 2.5 Canada 2.5 2.0 2.0 Australia 2.7 2.7 3.1 New Zealand 3.2 3.0 2.8 Hong Kong 2.2 2.7 2.9 Korea 3.3 3.4 3.7 Taiwan 3.5 3.6 3.5 Singapore 2.9 3.0 3.4
Emerging Asia 6.4 6.4 6.7 China 7.4 6.8 7.1 India 5.8 6.6 6.8 Indonesia 5.0 5.3 5.7 Malaysia 5.8 4.8 5.0 Philippines 6.1 6.4 6.2 Thailand 0.6 3.7 4.0
Latin America 0.9 1.3 2.6 Mexico 2.1 3.0 3.6 Brazil 0.0 -0.3 1.6 Argentina -1.5 -0.3 2.0 Venezuela -3.7 -5.3 -1.3 Colombia 1.8 2.7 3.5
Eastern Europe and CIS 2.0 0.3 2.4 Russia 0.6 -4.3 0.3 Czech Rep. 2.0 2.5 2.8 Poland 3.3 3.3 3.6 Turkey 2.9 3.4 3.8
Middle East and N. Africa 2.5 2.1 4.1
Sub-Saharan Africa 4.9 4.9 5.3
Advanced economies 1.8 2.2 2.1 Emerging economies 4.4 4.2 5.1 World 3.3 3.3 3.8
Source: NBF Economics and Strategy

VISIONApril 2015
08
—
Unfortunately, that erases part of the work done by the oil collapse in reducing savings imbalances across the globe — cheaper oil helps in rebalancing global savings by improving the current account balance of oil importing countries, which are often in deficit territory, at the expense of big oil exporters which usually enjoy large surpluses . As we’ve mentioned before, the global economy would be in better shape if Germany does its part by bringing down its excess savings via some fiscal stimulus which would not only help raise its own growth and inflation outlook, but also allow other eurozone members to improve relative competitiveness without having to put themselves through deflation .
Another risk brought by the ECB’s QE program, or equivalently the USD’s surge, is the impact on global financial stability . The trade-weighted USD has gained 16% since June, the fastest nine-month appreciation ever outside of the global financial crisis . That cannot be good for USD borrowers outside America . According to the Bank for International Settlements, the stock of dollar-denominated debt held by non-financial entities outside the U .S . has grown from around $6 trillion in 2008 to roughly $9 trillion . Emerging markets have seen their share of USD-denominated debt outside America rise to 40% . There is evidence that some over-extended borrowers are already under pressure, particularly in China which accounts for over $1 trillion of USD-denominated debt .
In addition to unfavourable currency movements, some debt issuers in China are also having to deal with a cash crunch as their investments sour, e .g . in the real estate sector . Sinking property prices are indeed hurting developers and their lenders, many of whom operate in the unregulated shadow banking sector . But not all is bleak . Beijing has taken action to reduce the economy’s overall exposure to the shadow sector by cracking down on that type of credit . That has led to a decline in social financing, the aggregate measure of credit, allowing conventional bank loans to increase their share of overall credit to the highest in almost three years . That’s good for sustainability of growth in China . Another positive for growth is the recent round of fiscal stimulus . In addition to increasing its budget deficit to roughly 1 .6 trillion yuan this year, or 2 .3% of GDP, Beijing has also decided to relax borrowing rules for local governments by increasing the quota for bond sales, which should help boost infrastructure spending . Low inflation has also allowed the People’s Bank of China to again cut its benchmark interest rate in March . Altogether, the new stimulus allows us to raise our growth forecast for China to 6 .8% this year and 7 .1% in 2016, both not far from Beijing’s newly-stated 7% target .
The upgrades to the Eurozone and China are, however, more than offset by a downgrade to our U .S . outlook, which prompts us to trim by two ticks our 2015 global growth forecast to 3 .3% .
-16
-12
-8
-4
0
4
8
12
16
20
1996 1998 2000 2002 2004 2006 2008 2010 2012 2014
Fastest appreciation of USD since the global financial crisis … Trade-weighted U.S. dollar
NBF Economics and Strategy (data via Datastream)
9-month % chg.
Mar. 2015
0
1
2
3
4
5
6
7
8
9
10
1996 1998 2000 2002 2004 2006 2008 2010 2012 2014
… will hurt those who borrowed in USD Credit denominated in USD to non-banks outside the U.S.
NBF Economics and Strategy (data via Bank of International Settlements)
US$ trillion
TOTAL
Emerging
Euro area
Other advanced UK
40
45
50
55
60
65
70
75
80
85
90
2006 2007 2008 2009 2010 2011 2012 2013 2014 2015
China: Share of bank loans back to 2012 levels Share of bank loans in aggregate social financing, 12-month cumulative
NBF Economics and Strategy (data via Datastream)
%
Shadow loans take off
Crackdown on shadow banking starts
The Economy—

09
—
U.S.: Winter blues
It’s déjà vu in the U.S., as a harsh winter again wrecked Q1 economic activity. The poor start of the year forces us to cut our 2015 forecast for GDP growth to 2.9%. That said, fundamentals for domestic demand remain strong, including a consumer that’s being lifted by the best labour market in years. The Fed remains on track to hike interest rates later this year, but don’t expect it to get aggressive when it starts tightening. The strong U.S. dollar is not only hindering exports, but is also making it more difficult for inflation to reach the Fed’s 2% target.
Americans are getting a feeling of déjà vu . Like last year, the world’s largest economy is off to a difficult start, restrained again by awful weather . It was indeed the coldest February in over 80 years, and the deep freeze had a clear negative impact on consumer spending which accounts for nearly 70% of the U .S . economy . Retail weakness was widespread with declining sales in most of the broad categories . Discretionary spending, usually a good gauge of consumer sentiment, saw its worst performance in thirteen months in February . In addition to the frigid temperatures, snowstorms were also a nuisance, as is usually the case at this time of the year in the Northeastern U .S ., except that this time, they even battered the southern parts of the country . Residential construction took a beating as a result, with housing starts plunging in February to the lowest in over a year .
But the moderation in economic activity wasn’t all about Mother Nature . As we had pointed out last month, there was some inventory accumulation in Q4 last year, and that may have reduced the need to produce more, particularly with demand temporarily curtailed by weather . Indeed, growth in industrial production in Q1 is on track to be the worst since the 2009 recession, after February’s below-consensus increase and sharp downward revisions to January output . All in all, the poor start of the year forces us to cut our 2015 forecast for U .S . GDP growth to 2 .9%, from our initial forecast of 3 .3% .
The tepid production in Q1 may also have been a function of diminished trade volumes . On a three-month annualized basis, export volumes are contracting at the fastest pace since the recession . While bad weather may have played a role in disrupting shipments, strikes on West Coast ports were probably the major contributors to those weak trade results . With the strike and bad weather extending for yet another month, February trade volumes could be soft as well . A rebound in exports is likely in March, thanks to a tentative deal in place between management and port labour unions . But considering the U .S . dollar’s surge, we expect a return to tepid export growth, particularly in the second half of the year .
230,000
240,000
250,000
260,000
270,000
280,000
290,000
300,000
310,000
320,000
330,000
340,000
128,000
130,000
132,000
134,000
136,000
138,000
140,000
142,000
2008 2009 2010 2011 2012 2013 2014 201510
12
14
16
18
20
22
24
26
28
30
32
1900 1925 1950 1975 2000
U.S.: February shopping dented by cold snap
*Retail sales excluding excluding gasoline, groceries and health care products
NBF Economics and Strategy (data via NCDC and Datastream)
Non-farm payroll and discretionary spending* Northeast average temperature in February (1895 to 2015)
Jobs (R)
°F
Discretionary spending (L)
Coldest February since 1934…
…may have kept consumers at home
thousands thousands
-25.0-22.5-20.0-17.5-15.0-12.5-10.0-7.5-5.0-2.50.02.55.07.5
10.012.515.0
2009 2010 2011 2012 2013 2014 2015
U.S.: Rough start to 2015 Industrial production
* Assuming no change in March
NBF Economics and Strategy (data via Datastream)
Q1 est.*
q/q % chg. saar
Manufacturing
TOTAL
Worst since the 2009 recession
U.S.: Exporters have struggled lately Real exports of non-petroleum goods
NBF Economics and Strategy (data via Datastream)
-60
-50
-40
-30
-20
-10
0
10
20
30
40
1994 1996 1998 2000 2002 2004 2006 2008 2010 2012 2014
3-month annualized change (%)
Jan. 2015
The Economy—

VISIONApril 2015
10
—
In contrast, the expected rebound in domestic demand will be more sustainable . Investment spending should improve as corporations make better use of their record profits to boost productivity which has been declining in recent quarters . That is crucial in some industries like manufacturing, which compete globally and which have been under pressure to adapt to the U .S . dollar’s surge . The investment boost should offset the expected decline in outlays in the energy sector . Consumption spending should also bounce back as warmer temperatures allow Americans to leave the comfort of their homes to go shopping again . Consumer fundamentals are indeed the best they’ve been in years . The labour market is on fire as evidenced by non farm payrolls which have risen nearly 300K/month on average in the last six months, and that is boosting household incomes and confidence . Cheap gasoline should also help . While pump prices rose in February and March, they are still down roughly 30% on a year-on-year basis courtesy of the oil price collapse . Moreover, the personal savings rate, at 5 .5% in January, was the highest since 2013, something that will further help support spending if needed .
The good economic fundamentals do not mean the Fed will aggressively hike interest rates this year . At its March meeting, while it opened the door to rate hikes by removing the word “patient” from its forward guidance, the Fed made clear that it was in no rush to hike . The FOMC said that it will be appropriate to raise rates when it has seen further improvement in the labor market and is reasonably confident that inflation will move back to its 2% objective . In other words, the decision to hike rates is now entirely data dependent . There’s arguably still a lot of room for improvement for both employment and inflation . Note that despite solid job creation in the last few years, wage inflation (which feeds into broader consumer inflation) remains very tame . That may be due to persistent slack in the labour market as evidenced by the wide measure of the unemployment rate — includes marginally attached, and those employed part time for economic reasons — which remains roughly three percentage points above what it was before the recession .
So, while the Fed will likely hike interest rates this year for the first time since 2006, that’s not to say it will do so imminently — an April hike has already been ruled out by the Fed itself . There’s an outside chance of a June hike, but a September move is more likely in our view . Even then, we don’t expect the Fed to get aggressive on rates . While the USD surge wasn’t explicitly mentioned, its impact is apparent in the Fed’s downgrades to both its GDP growth and inflation forecasts . The latter explains perhaps why there are now just four FOMC participants, compared to last December’s nine, expecting rates to be above 1% at the end of the year . Also, there are now as many as eleven participants who see rates remaining below 2% by the end of 2016, versus four last December .
-200-150-100-50
050
100150200250300350400450500550
Jan 10 Jan 11 Jan 12 Jan 13 Jan 14 Jan 15
U.S.: Labour market best in years … Non farm payrolls
NBF Economics and Strategy (data via Datastream)
m/m chg. thousands
6-month average
0.81.01.21.41.61.82.02.22.42.62.83.03.23.43.63.84.0
2007 2008 2009 2010 2011 2012 2013 2014 2015456789
101112131415161718
2006 2007 2008 2009 2010 2011 2012 2013 2014 2015
… but Fed will be very cautious when hiking rates
NBF Economics and Strategy (data via Datastream)
NFP hourly earnings and Core PCE deflator Unemployment rate %
U-6 (includes marginally attached, employed part time for economic reasons)
U-3 (conventional measure)
y/y % chg.
Core PCE deflator
Hourly earnings
Labour market slack is larger than what is suggested by conventional
measure of jobless rate …
… and that partly explains the disappointment on
wage growth and inflation
15500
16000
16500
17000
17500
18000
2014Q4 2015Q4 2016Q4 2017Q4 0
1
2
3
4
5
6
7
8
9
10
U.S.: Fed downgrades growth outlook
NBF Economics and Strategy (data via Federal Reserve)
Upper and lower bound projections in December 2014
Central tendency forecasts by the Fed for U.S. real GDP
Number of FOMC participants expecting the fed funds rate to be 1.00% or more at the end of 2015
December 2014 March 2015
Billions of chained (2009) dollars
Upper and lower bound projections in March 2015
The Economy—
11
—
Canada: Rough start to 2015
Like the U.S., Canada struggled in the first quarter of the year in part due to weather-related disruptions to economic activity. GDP growth in Q1 is pacing below 1% annualized, the worst performance in years. Growth should pick up from here, but we’re not expecting stellar results considering the full impact of the oil price collapse has yet to be felt, e.g. anticipated decline in investment and employment particularly in the oil patch. We continue to forecast 2% growth this year, expecting Central provinces to make the most of a cheap currency and offset the weakness in Western Canada.
Thanks to Q4’s consensus-topping GDP, and upward revisions to the prior quarter, Canada’s economy managed to grow 2 .5% in 2014, the best performance in three years . The good news ends there, however . A deeper look into Q4 results casts doubts about prospects for the early parts of 2015 . While production rose faster than expected in Q4, much of that extra output went into inventories since sales were so weak — final sales grew at the slowest pace in over two years . Such inventory build could hurt production and hence growth early this year . Nominal GDP was not surprisingly weak, growing just 0 .1% annualized in Q4, and likely remained soft in Q1 this year considering the further slump in commodity prices . That will put pressure on budgets at both the federal and provincial levels . Consumption growth was unimpressive in Q4 despite decent income gains and a drop in the savings rate to 3 .6%, the lowest since 2010 . The latter isn’t good news for consumption spending this year .
We got a glimpse of that in January’s retail report which showed a second straight decline in volumes and the worst two-month performance for retailers since the last recession . And that happened despite the boon to consumers of cheaper gasoline — the share of gasoline in total retail sales continued to drop, reaching 10 .6% in January the lowest since 2009 . But what wasn’t spent at the pumps was seemingly saved by consumers, i .e . not spent on other items . Bad weather may have been a factor in restraining consumer spending, but deteriorating conditions particularly in the oil patch also played a role . Alberta’s retail sales fell for a fourth consecutive month, the worst streak in over 15 years, excluding the recession .
Poor January sales weren’t isolated to retailing . The manufacturing and wholesale sectors also saw massive declines, which caused inventories to rise further . Those ugly results suggest Canada’s GDP contracted sharply in January . While we expect all of those sectors to bounce back as the weather improves, that won’t significantly change Q1’s outlook considering the awful start to the quarter . Canada’s GDP growth is on track to be lower than 1% annualized in Q1, the worst performance in years .
0
1
2
3
4
5
6
7
8
9
10
11
12
0.980
0.985
0.990
0.995
1.000
1.005
1.010
1.015
1.020
1.025
1.030
1.035
1.040
2010 2011 2012 2013 2014
Canada: Consequences of oil price collapse Nominal GDP and Terms of trade (i.e. ratio of export to import price)
Nominal GDP (L)
Terms of trade (R)
q/q % chg. saar
Q4
NBF Economics and Strategy (data via Statistics Canada)
-12
-10
-8
-6
-4
-2
0
2
4
6
8
10
12
2000 2002 2004 2006 2008 2010 2012 2014
Canada: Retail activity down markedly in recent months Retail sales: Alberta vs. Rest of Canada
NBF Economics and Strategy (data via Bloomberg)
Alberta
% (4-mo. change)
Rest of Canada
44,500
45,000
45,500
46,000
46,500
47,000
47,500
48,000
48,500
49,000
49,500
50,000
50,500
Jan 13
Mar 13
May 13
Jul 13
Sep 13
Nov 13
Jan 14
Mar 14
May 14
Jul 14
Sep 14
Nov 14
Jan 15
1.20
1.22
1.24
1.26
1.28
1.30
1.32
1.34
1.36
1.38
1.40
1.42
1.44
Jan 13
Mar 13
May
13
Jul 1
3
Sep 13
Nov 1
3
Jan 14
Mar 14
May
14
Jul 1
4
Sep 14
Nov 1
4
Jan 15
Canada: Weak January
NBF Economics and Strategy (data via Statistics Canada)
Index Volume sales Inventory to sales ratio
Manufacturing
Wholesaling
Manufacturing
Wholesaling
Awful sales in January…
… led to bloated inventories
The Economy—

VISIONApril 2015
12
—
Softer growth usually translates into a weaker labour market, and this time is no different . The last three months have averaged less than 8K jobs/month, with gains in the public sector and self-employment offsetting sharp declines in the private sector . Alberta and Saskatchewan are starting to feel the pinch of the oil price collapse, with both provinces seeing job losses since the start of the year . Shrinking job opportunities on the oil patch are, not surprisingly, having repercussion on the housing market, particularly in Alberta’s two largest cities . Over the December-February period, Edmonton has seen a 17% drop in sales compared to a similar three-month period a year earlier, while Calgary sales were down a stunning 29% . In sharp contrast, new listings have surged more than 25% in both cities over that period, causing a sudden shift from sellers’ market to buyers’ market in Alberta . Five of the ten provinces are now in buyers’ market territory, while the other five, including Ontario and BC, are still balanced . Can there be contagion from the weak housing markets to the stronger ones? After all, a portion of mortgages in Alberta are non-recourse, i .e . some lenders would bear the brunt of related losses . And if those lenders also service other provinces, they could restrict credit to the latter as they attempt to repair their balance sheets .
But, in our view, odds of such an outcome are quite low . For one, home prices would have to fall more than 20% before households start to think of strategic defaults — only uninsured mortgage loans are non-recourse in Alberta, and such loans usually required a down payment of at least 20%, which borrowers would have to forfeit if they opt to default . And even if they eventually choose to default, the overall impact is likely to be muted considering that only about 5% of the aggregate portfolio of residential mortgage loans of the six largest Canadian chartered banks are non-recourse (for more information, see our special report: “The oil price shock and the Canadian housing market”) . We continue to expect housing strength in Central Canada, buoyed by employment prospects, to offset weakness in the West, leaving home prices roughly flat at the national level .
That, of course, depends on the ability, in Central Canada, of the private sector to offset the expected fiscal drag from provincial governments . We’re reasonably optimistic on that front considering that the much-depreciated Canadian dollar and a strengthening U .S . economy should both help manufacturers boost sales stateside . There’s certainly room for improvement given that non-energy exports are still around 10% below peak levels reached eight years ago . All told, we continue to expect GDP growth of 2% this year, with exports offsetting anticipated weakness in domestic demand, particularly investment spending . Under such a scenario, expect the Bank of Canada to keep monetary policy highly stimulative, more so considering that inflation remains soft .
-10
-8
-6
-4
-2
0
2
4
6
8
10
TOTAL Privatesector
QC AB ON MB NB PE BC NS NL SK
Canada: Private sector employment has been weak Average net employment creation in last three months (i.e. Dec-Feb)
NBF Economics and Strategy (data via Statistics Canada)
Thousands/month
1.4
1.6
1.8
2.0
2.2
2.4
2.6
2.8
3.0
CA NL PE NS NB QC ON MB SK AB BC
NBF Economics and Strategy (data from CREA)
Alberta housing now in buyer’s market territory, and
deteriorating fast …
Canada: Housing market still balanced at national level
ratio
Rest of Canada
84.7
Alberta uninsured/non recourse 5.3
Alberta insured 10.0
New-listings-to-sales ratio in February 2015, seasonally adjusted
Residential mortgage loans originated by big 6 banks (%)
… but odds of contagion to the rest of the country are capped somewhat by low share of non-recourse mortgages
Buyers’ market Balanced
Sellers
65
70
75
80
85
90
95
100
105
110
115
120
125
130
2007 2008 2009 2010 2011 2012 2013 2014
Canada: Non-energy export volumes still below 2007 peak Real exports
NBF Economics and Strategy (data via Statistics Canada)
Index=100 in April 2007
Jan. 2015
Energy
Non-energy
TOTAL
The Economy—
13
—
Q4/Q4(Annual % change)* 2012 2013 2014 2015 2016 ### 2014 2015 2016
Gross domestic product (2009 $) 2.3 2.2 2.4 2.9 2.7 2.4 2.9 2.3Consumption 1.8 2.4 2.5 3.3 2.9 2.8 3.3 2.4Residential construction 13.5 11.9 1.6 4.2 5.4 2.4 5.6 4.2Business investment 7.2 3.0 6.3 4.4 4.1 6.2 3.3 3.8Government expenditures (1.4) (2.0) (0.2) 0.5 0.3 0.9 0.4 0.2Exports 3.3 3.0 3.1 2.5 3.0 2.1 2.2 3.1Imports 2.3 1.1 4.0 3.8 3.6 5.5 2.7 3.7Change in inventories (bil. $) 57.1 63.6 72.7 47.8 42.3 88.4 39.3 46.6Domestic demand 2.1 1.9 2.4 3.0 2.6 2.8 2.9 2.3
Real disposable income 3.0 (0.2) 2.5 2.7 2.5 3.2 2.4 2.6Household employment 1.8 1.0 1.6 1.7 1.7 2.2 1.7 1.5Unemployment rate 8.1 7.4 6.2 5.5 5.2 5.7 5.3 5.1Inflation 2.1 1.5 1.6 0.4 2.3 1.2 1.1 2.4Before-tax profits 11.4 4.2 (0.2) 8.1 5.1 2.3 6.0 4.5Federal balance (unified budget, bil. $) (1,089.2) (680.2) (483.3) (469.0) (536.0) ... ... ...Current account (bil. $) (460.8) (400.3) (400.5) (394.0) (386.0) ... ... ...
-304* or as noted
Current Q4 Q4 2015 Q4 20163/25/15 Q2 2015 Q3 2015 Q4 2015 Q1 2016 2015 2016
Fed Fund Target Rate 0.25 0.25 0.50 0.75 1.00 0.75 1.50 3 month Treasury bills 0.04 0.10 0.52 0.69 0.88 0.69 1.49 Treasury yield curve 2-Year 0.59 0.92 1.28 1.44 1.62 1.44 2.31 5-Year 1.41 1.53 1.86 1.97 2.13 1.97 2.45 10-Year 1.93 2.08 2.30 2.34 2.43 2.34 2.67 30-Year 2.50 2.67 2.87 2.86 2.92 2.86 3.10 Exchange rates U.S.$/Euro 1.10 1.07 1.05 1.05 1.04 1.05 1.00 YEN/U.S.$ 119 122 124 124 125 124 130
National Bank Financial** end of period
United StatesEconomic Forecast
Financial Forecast**
The Economy—

VISIONApril 2015
14
—
Q4/Q4(Annual % change)* 2012 2013 2014 2015 2016 2014 2015 2016
Gross domestic product (2007 $) 1.9 2.0 2.5 2.0 2.0 2.6 1.6 1.9Consumption 1.9 2.5 2.8 2.2 2.1 2.6 2.0 1.9Residential construction 5.7 (0.4) 2.8 1.3 (0.1) 5.2 (1.3) 0.0Business investment 9.0 2.6 0.1 (1.7) (0.3) 0.5 (2.2) 0.5Government expenditures 0.2 0.1 (0.1) 0.3 (0.0) 0.6 (0.3) 0.2Exports 2.6 2.0 5.4 5.1 7.0 6.5 6.2 5.7Imports 3.7 1.3 1.7 2.9 3.2 2.6 2.5 3.0Change in inventories (millions $) 7,437 12,368 7,433 6,968 4,094 8,017 4,445 3,226Domestic demand 2.5 1.5 1.6 1.4 1.1 2.0 0.9 1.2
Real disposable income 2.8 2.5 1.5 1.7 1.9 1.2 1.9 1.9Employment 1.3 1.4 0.6 0.8 1.0 0.7 0.7 1.0Unemployment rate 7.3 7.1 6.9 6.8 6.7 6.7 6.8 6.6Inflation 1.5 0.9 1.9 0.7 2.2 1.9 1.3 2.3Before-tax profits (4.2) (0.6) 9.0 (2.0) 4.2 6.7 (0.7) 5.0Current account (bil. $) (59.9) (56.3) (43.5) (52.6) (44.5) .... .... ....
* or as noted
Current Q4 Q4 2015 Q4 20163/25/15 Q2 2015 Q3 2015 Q4 2015 Q1 2016 2015 2016
Overnight rate 0.75 0.75 0.75 0.75 0.75 0.75 1.00 3 month T-Bills 0.54 0.63 0.63 0.63 0.68 0.63 1.02 Treasury yield curve 2-Year 0.51 0.83 0.88 1.00 1.06 1.00 1.80 5-Year 0.77 1.17 1.39 1.54 1.59 1.54 2.02 10-Year 1.34 1.67 1.81 1.89 1.94 1.89 2.20 30-Year 1.98 2.30 2.41 2.47 2.50 2.47 2.67
CAD per USD 1.25 1.25 1.27 1.28 1.28 1.28 1.23 Oil price (WTI), U.S.$ 49 53 55 60 62 60 70
National Bank Financial** end of period
CanadaEconomic Forecast
Financial Forecast**
The Economy—

Interest Rates and Bond Markets—

VISIONApril 2015
16
—
Last call? Not yet!
The FOMC surprised markets with a stance more dovish than expected at its March rate-setting meeting .
Going into the meeting, the market expected the FOMC to drop the word “patient,” and it did . But Fed chair Janet Yellen was quick to calm any fear that rate hikes were coming soon . Early in her press conference – in her sixth sentence – she said: “just because we removed the word ‘patient’ from the statement doesn’t mean we are going to be impatient” (our emphasis) . And she noted more than once that “the modification in the forward guidance should not be read as indicating that the committee has decided on the timing of the initial increase in the target range for the federal funds rate … the decision to raise the target range will depend on our assessment of realized and expected progress toward our objectives of maximum employment and 2 percent inflation .”
Those words turned all eyes to the updated Summary of Economic Projections released by the FOMC . It shows participants’ projections of 2015 economic growth (Q4/Q4) revised down 0 .3 percentage points to a range of 2 .3%-2 .7% . Ms . Yellen said many participants cited a weaker outlook for exports . Participants also saw inflation remaining quite low in 2015 – 0 .6% to 0 .8% .
Having lowered their economic projections, most of the 17 FOMC participants also revised down their path for the fed funds rate, as can be seen in the dot plot of their projections of the midpoint of the appropriate target range for the policy rate at each of the next three year ends:
FOMC participants’ views of appropriate year-end rates
NBF Economics and Strategy (data from Federal Reserve Board)
Many participants now share our January 28 forecast that the appropriate target range for the fed funds rate at year end 2015 would be 0 .50% to 0 .75%, up 50 basis points from the current zero-to-0 .25% target range .
Although the pace of monetary policy normalization looks smoother than was suggested by the previous FOMC dot plot, it is also clear from the Fed’s communications that the U .S . central bank plans to take away the proverbial punch bowl in 2015 . But it has not yet said when it will announce “Last call!” With job creation consistently solid and the unemployment rate low, the decision clearly depends on the inflation clock .
Retail prices
Inflation expectations
Labour costs
Producer prices
Materials and commodities
Money and credit
The Atlanta Fed’s “Inflation Dashboard” Current inflation picture reflecting 30 series grouped in 6 categories
NBF Economics and Strategy (data via Federal Reserve Bank of Atlanta)
Typical
Typical
Typical
Typical
Typical
Typical
For a snapshot of the inflation picture, the Atlanta Fed groups 30 data series into six broad categories . From its resulting Inflation Dashboard, it is clear that the current picture does not call the Fed to action this spring . Of the readings for the six categories, four are rather weak, one is moderately hot and one may be flashing caution .
In the case of labour costs, what is driving the arrow toward the upper end of its typical range is an NFIB Survey that reports a percentage of small businesses raising wages over the past three months that exceeds the 12-month trend . Falling unemployment and low jobless claims are also pushing up the labour cost inflation indicator, while average hourly earnings in private industry are moderating it . If hourly earnings were to accelerate, the FOMC would obviously gain confidence that inflation was heading in the right direction . The high reading of the Money and Credit category is probably more a comfort to the FOMC than a cause for concern . It reflects strength in bank credit and growth in the money supply . These are indications that monetary policy has had traction .
In our outlook, it will be late this summer before the Inflation Dashboard shows enough momentum for the FOMC to feel confident enough about inflation to begin normalizing its policy rate . In the meantime the bond market will remain quite sensitive to the price of crude . A dovish Fed and a new fall of WTI oil below US$50 were enough to push the 10-year Treasury yield from a year-to-date high of 2 .26% on March 6 to 1 .93% at the March 20 close . Moreover, with export growth softening
Interest Rates and Bond Markets—
Paul-André Pinsonnault Senior Fixed Income Economist 514-879-3795

17
—
in response to the strength of the U .S . dollar, the FOMC and market participants will keep an eye on the greenback and its dampening effect on the economy and the inflation outlook .
0.0
0.5
1.0
1.5
2.0
2.5
3.0
3.5
4.0
4.5
5.0
5.5
2005 2006 2007 2008 2009 2010 2011 2012 2013 2014
NBF Economics and Strategy (data via Bloomberg) 2015-03-20
U.S. interest rates Weekly observations and quarter-end forecasts
%
U.S. 2-year
U.S. 10-year
Target fed funds – upper bound
Interest rate forecast03/20/15 Q2 Q3 Q4 Q1/16 Q2 Q3 Q4 Q1/17
F.F. - upper bound 0.25 0.25 0.50 0.75 1.00 1.25 1.50 1.50 1.75 2-YR 0.58 0.92 1.28 1.44 1.62 1.76 1.89 2.31 2.46 10-YR 1.93 2.08 2.30 2.34 2.43 2.47 2.57 2.67 2.72Forward 10-yr rate 2.00 2.06 2.11 2.16 2.21 2.25 2.28 2.31
With the Fed no longer committed to patience, but clearly stating that its policy stance will be data-dependent, the sensitivity of the yield curve to economic indicators is likely to step up a notch . We accordingly expect greater market volatility in the months ahead . That said, since the FOMC participants’ view of the appropriate path of the target fed funds rate in 2015 is closely aligned with our own, we are leaving our year-end forecast for 10-year Treasuries unchanged at 2 .34% .
100150200250300350400450500550600
2345678910
1996 1998 2000 2002 2004 2006 2008 2010 2012 2014
U.S.: Spread of corporate bonds to Treasuries Yield of Moody’s BAA corporate bond index minus yield of 30-year Treasuries
NBF Economics and Strategy (data via Bloomberg) 2015-03-20
U.S. 30-year
Moody’s BAA
Spread (Left)
Basis points
%
We expect the FOMC to take a gradual approach in normalizing its policy stance, an approach that would over time support economic growth while avoiding a disorderly acceleration of inflation . In this scenario the economic expansion will have legs, favouring a further narrowing of corporate spreads .
... and in Canada
In early March the Bank of Canada kept its target overnight rate unchanged at 0 .75% . To justify this decision the Bank noted that crude prices were close to its assumptions and financial conditions had eased materially . The Canadian dollar had weakened and the yield curve had
shifted down over the year to date . In light of these developments the Bank seemed confident that no further action was justified .
NBF Economics and Strategy (data via Bloomberg) 2015-03-20
Price of crude somewhat lower than projected Bank of Canada MPR assumption was US$60 for Brent
45
50
55
60
65
70
75
80
85
90
95
100
Sep 14 Oct 14 Nov 14 Dec 14 Jan 15 Feb 15 Mar 15
USD/bbl.
Since then the price of oil has moved down somewhat from the Bank’s assumption . At this writing it is trading close to US$55, versus the $60 projected by the Bank . In our view this variance is not large enough to justify another central bank rate cut .
On the currency front, the picture is mixed . Among the currencies of our competitors for market share of U .S . imports, the euro has weakened much more than the Canadian dollar . Against the Mexican peso, however, the loonie now plays on a field that is more level than it was four months ago .
As for interest rates, the Canadian yield curve has shifted down since March 4 .
If the Bank had had to make its rate announcement on March 20, we think it would have left its overnight rate unchanged . But if the next rate announcement were to be preceded by an Ontario budget more austere than expected, the scales could tip in the other direction .
0.4
0.6
0.8
1.0
1.2
1.4
1.6
1.8
2.0
2.2
2 4 6 8 10 12 14 16 18 20 22 24 26 28 30 321-Year 5 10 20 30 95.097.5100.0102.5105.0107.5110.0112.5115.0117.5120.0122.5125.0127.5130.0
14Q1 14Q2 14Q3 14Q4 15Q1
The USD is up: 23% against the euro 17% against the yen 12% against the CAD 12% against the peso
Jan 2014 = 100
The Canadian yield curve has moved down since March 4
Canadian financial conditions: No grounds for panic
EUR
JPY
CAD
MXN
NBF Economics and Strategy (data via Bloomberg) 2015-03-20
March 20, 2015
March 4, 2015
%
While we recognize that uncertainty about the Canadian monetary policy path is relatively high, we are inclined to think the overnight rate
Interest Rates and Bond Markets—

VISIONApril 2015
18
—
will end the year at 0 .75% . However, our conviction that the Bank of Canada will lag the Fed in rate hikes is much stronger . We continue to see the BoC target rate at 1% in Q4 2016 .
0.0
0.5
1.0
1.5
2.0
2.5
3.0
3.5
4.0
4.5
5.0
2005 2006 2007 2008 2009 2010 2011 2012 2013 2014
NBF Economics and Strategy (data via Bloomberg)
Canadian interest rates Weekly observations and quarter-end forecasts
Canada 10-year
Canada 2-year
BoC overnight target
%
Interest rate forecast03/20/15 Q2 Q3 Q4 Q1/16 Q2 Q3 Q4 Q1/17
Overnight 0.75 0.75 0.75 0.75 0.75 0.75 0.75 1.00 1.25 2-YR 0.45 0.83 0.88 1.00 1.06 1.40 1.59 1.80 1.95 10-YR 1.30 1.67 1.81 1.89 1.94 2.07 2.12 2.20 2.26Forward 10-yr rate 1.35 1.39 1.43 1.47 1.51 1.56 1.61 1.66
Given our expectation of a less-aggressive Bank of Canada, we have revised up our projection for the front end of the yield curve . We expect bonds maturing in 2 years to trade at about 1 .00% at year end, up from 0 .78% in our previous projection . We now see Canada 10-years at 1 .89% in December 2015 and at about 2 .20% a year later . Given our forecast for higher rates along the yield curve, we are reducing the portfolio duration below benchmark .
As we noted last month, the Bank of Canada’s January rate cut gave the domestic search for yield a shot in the arm, supporting narrower provincial spreads . International demand for provincials was also pretty strong, with net purchases of $9 .2 billion in January . Although much of the foreign investment in Canadian bonds was in new instru-ments denominated in foreign currencies, these issues supported domestic spreads by reducing the required volume of domestic issuance .
8486889092949698100102104106108110112
13Q1 13Q2 13Q3 13Q4 14Q1 14Q2 14Q3 14Q4 15Q1
Weighted average spread of long provincials Maturing 2040 to 2042
Basis points
NBF Economics and Strategy (data via Bloomberg) 2015-03-20
-4-3-2-1012345678910
2006 2007 2008 2009 2010 2011 2012 2013 2014
NBF Economics and Strategy (data via Statistics Canada)
Net foreign purchases of provincial bonds C$ billion
–
As a result of lower yields for Canadas, narrower provincial spreads and the relatively long duration of the provincial sub-index, provincial bonds have generated a year-to-date total return of 5 .99%, compared to 3 .65% for Canadas and 2 .26% for Canadian equities .
Interest Rates and Bond Markets—

19
—
Interest Rates and Bond Markets—
Recommended bond allocation Recommended duration 7.27 vs.7.57 for the benchmark Reduce duration below benchmark
Long 31.8%
Short 42.0%
Mid 24.7%
Federal 33.0%
Corporate 32.0%
Provinces 35.0%
Benchmark Allocation
Short 42.0%, Mid 24.7%, Long 33.3% Federal 36.9%, Provinces 34.5%
Corporations 28.6%
Cash 1.5%
0
1
2
3
4
5
6
7
8
9
10
03 04 05 06 07 08 09 10 11 12 13 14 15
U.S. interest rates Last observation March 20, 2015
%
NBF Economics and Strategy (data via Bloomberg)
Long corporate
U.S. 10-year
U.S. 2-year
Target fed funds
30-year mortgage
Canadian Bond Market – Total Returns
NBF Economics and Strategy (data via Datastream)
Total Returns 3/20/2015Since Since Since Since
2/20/2015 12/19/2014 9/19/2014 3/21/2014Cash 0.03 0.27 0.49 0.94
CanadaShort 0.07 1.93 2.92 3.67Mid 0.66 4.79 7.96 10.36Long 2.02 7.45 14.75 19.96Universe 0.65 3.80 6.56 8.57
Provincial 1.20 6.44 11.01 15.16Municipal 0.91 5.39 9.42 13.57
CorporateAA 0.27 2.69 3.81 5.23A 1.31 4.94 7.70 10.71BBB 1.08 4.33 6.66 9.66Universe 0.93 4.09 6.23 8.76
Total 0.91 4.75 7.91 10.76
S&P/TSX -1.24 4.03 -0.67 7.26
0
1
2
3
4
5
6
7
8
03 04 05 06 07 08 09 10 11 12 13 14 15
Canadian interest rates Weekly, last observation March 20, 2015
% Long corporate A
Long provincial
Canada 10-year Canada 2-year
BoC overnight target
NBF Economics and Strategy (data via Bloomberg)
Bond Market - Canada
Close-on 3/20/2015 2/20/2015 12/19/2014 9/19/2014 3/21/2014
Interest Rates 90-day (B/A's) 0.99 0.92 1.29 1.27 1.26 2 years 0.46 0.40 1.01 1.17 1.07 5 years 0.72 0.79 1.37 1.71 1.73 10 years 1.31 1.42 1.81 2.25 2.49 30 years 1.94 2.06 2.34 2.76 2.96 Spreads 90 d - 2 years -54 -52 -28 -10 -19 2 - 5 years 27 39 36 54 66 2 - 10 years 85 102 80 108 141 10 - 30 years 63 64 53 51 47 Currencies CAD / USD 1.2552 1.2531 1.1604 1.0964 1.1221 EUR / CAD 0.7362 0.7010 0.7048 0.7112 0.6458
Source: NBF Economics and Strategy (data via Bloomberg)

This page intentionally left blank .

Stock Market and Portfolio Strategy—

VISIONApril 2015
22
—
Central banks still pro-growth
After a very good performance in February, global equities hit new records in March . The MSCI AC index remains on track for a record 11th consecutive quarterly increase . Although the forward P/E of the MSCI AC is close to its historical average, equities remain an attractive asset class .
80
120
160
200
240
280
320
360
400
440
480
520
1990 1995 2000 2005 2010 2015
World equities: A new record MSCI AC index
NBF Economics and Strategy (data via Bloomberg)
Importantly, the gains remain broad-based across regions and industry groups .
MSCI indexes: Price performance
NBF Economics and Strategy (data via Datastream)
Month to date Quarter to
date Year to date MSCI AC World -0.4 4.6 4.6 MSCI World -0.4 4.7 4.7 MSCI USA -2.0 0.5 0.5 MSCI Canada -2.0 2.3 2.3 MSCI Europe 1.7 11.9 11.9 MSCI Pacific ex Jp 0.3 7.5 7.5 MSCI Japan 4.6 13.2 13.2 MSCI EM -0.5 4.1 4.1 MSCI EM EMEA -2.7 4.3 4.3 MSCI EM Latin America -1.0 0.9 0.9 MSCI EM Asia 0.2 4.8 4.8 3/25/2015
Although the forward P/E of the MSCI AC is close to its historical average, equities remain an attractive asset class .
For one thing, the expansion phase of the U .S . economic cycle is still young (17 months – chart), which helps explain why wage inflation is low .
3.5
3.6
3.7
3.8
3.9
4.0
4.1
4.2
4.3
4.4
4.5
4.6
4.7
4.8
1965 1970 1975 1980 1985 1990 1995 2000 2005 2010
U.S.: The expansion phase is still young Contractions, recoveries and expansions based on the coincident economic indicator
19
log. scale
32
25
23
33 68 Shaded area: Contraction and recovery (months) Between the arrows: Expansion (months)
30 61 82 104 50 17
NBF Economics and Strategy (data via Datastream)
For another, the fall of oil and food prices in many parts of the world allows central banks to inject more liquidity and/or to delay the process of normalization toward higher interest rates . As this juncture, we note that the dividend yield of the MSCI AC index is still higher than the yield of global corporate bonds .
1.01.52.02.53.03.54.04.55.05.56.06.57.07.58.08.5
1998 2000 2002 2004 2006 2008 2010 2012 2014
World: Dividend yield remains attractive MSCI AC index dividend yield and global corporate bond yield*
* Effective yield of BofA ML Global Large Cap Corporate Index NBF Economics and Strategy (data via Bloomberg)
index
MSCI AC dividend yield
Global corporate bond yield
Stock Market and Portfolio Strategy—
Matthieu Arseneau Senior Economist 514-879-2252
Stéfane Marion Chief Economist and Strategist 514-879-3781
23
—
We argued last month that future equity gains would depend increasingly on earnings . The developments of recent weeks have not changed our outlook of better days ahead on that front .
The euro zone seems to be recovering, to judge by upticks not just in industrial output but in domestic demand, as labour markets show signs of improving . This is crucial for the transmission of monetary policy: loans to households, while still down from a year earlier, have been rising for two months running . With the European Central Bank still in the early stages of its quantitative easing program, the euro economy (and earnings) could surprise on the upside .
In China, meanwhile, the authorities have announced some growth stimulus . In addition to increasing its budget deficit this year to roughly 1 .6 trillion yuan, or 2 .3% of GDP, Beijing has relaxed borrowing rules for local governments by increasing their quota for bond issues, a move likely to boost infrastructure spending . In addition, low inflation allowed the People’s Bank of China to cut its benchmark interest rate again in March . Altogether, the new stimulus prompts us to raise our growth forecast for China to 6 .8% this year and 7 .1% in 2016 . Both rates are close to Beijing’s newly stated target of 7% .
-100
-80
-60
-40
-20
0
20
40
60
80
14Q1 14Q2 14Q3 14Q4 15Q1-30-25-20-15-10-505
10152025303540
14Q1 14Q2 14Q3 14Q4 15Q1
World: Positive for Eurozone and emerging countries
NBF Economics and Strategy (data via Datastream)
Economic surprise index
Eurozone
U.S.
Recent drop in index for G10 … … largely due to the U.S.
G10
Emerging
Japan
Economic surprise index
A Fed to be feared?
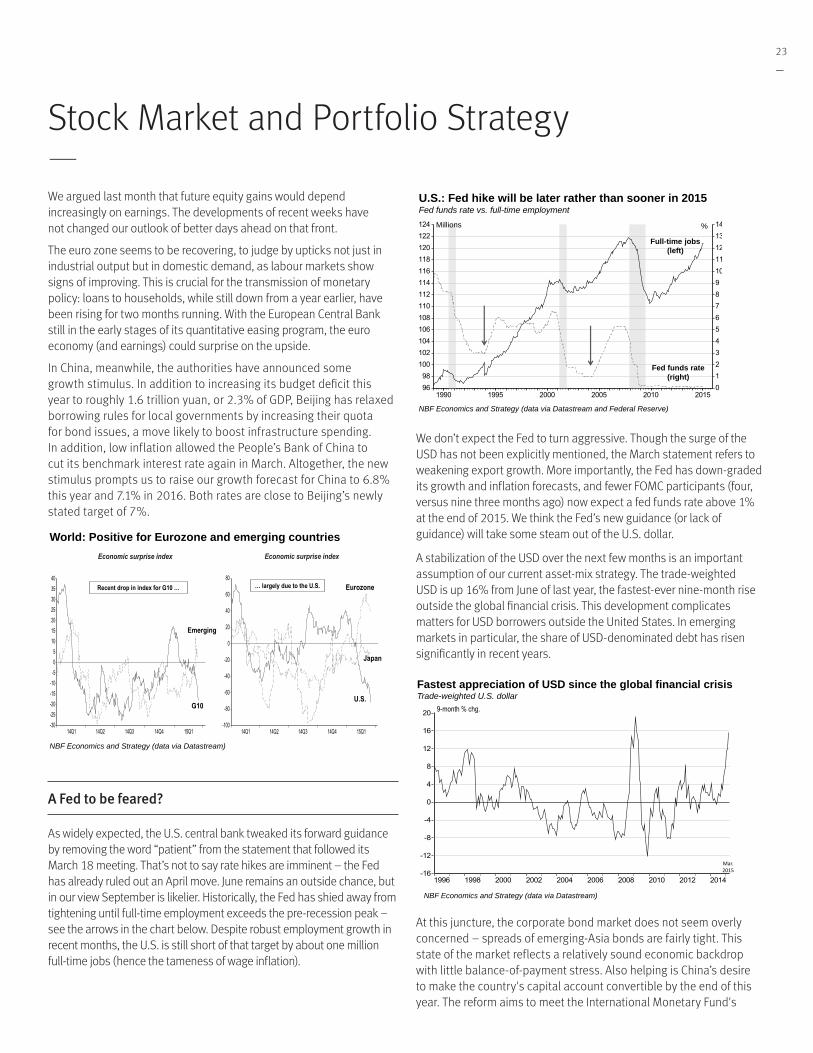
As widely expected, the U .S . central bank tweaked its forward guidance by removing the word “patient” from the statement that followed its March 18 meeting . That’s not to say rate hikes are imminent – the Fed has already ruled out an April move . June remains an outside chance, but in our view September is likelier . Historically, the Fed has shied away from tightening until full-time employment exceeds the pre-recession peak – see the arrows in the chart below . Despite robust employment growth in recent months, the U .S . is still short of that target by about one million full-time jobs (hence the tameness of wage inflation) .
9698
100102104106108110112114116118120122124
01234567891011121314
1990 1995 2000 2005 2010 2015
U.S.: Fed hike will be later rather than sooner in 2015 Fed funds rate vs. full-time employment
NBF Economics and Strategy (data via Datastream and Federal Reserve)
Millions %
Fed funds rate (right)
Full-time jobs (left)
We don’t expect the Fed to turn aggressive . Though the surge of the USD has not been explicitly mentioned, the March statement refers to weakening export growth . More importantly, the Fed has down-graded its growth and inflation forecasts, and fewer FOMC participants (four, versus nine three months ago) now expect a fed funds rate above 1% at the end of 2015 . We think the Fed’s new guidance (or lack of guidance) will take some steam out of the U .S . dollar .
A stabilization of the USD over the next few months is an important assumption of our current asset-mix strategy . The trade-weighted USD is up 16% from June of last year, the fastest-ever nine-month rise outside the global financial crisis . This development complicates matters for USD borrowers outside the United States . In emerging markets in particular, the share of USD-denominated debt has risen significantly in recent years .
-16
-12
-8
-4
0
4
8
12
16
20
1996 1998 2000 2002 2004 2006 2008 2010 2012 2014
Fastest appreciation of USD since the global financial crisis Trade-weighted U.S. dollar
NBF Economics and Strategy (data via Datastream)
9-month % chg.
Mar. 2015
At this juncture, the corporate bond market does not seem overly concerned – spreads of emerging-Asia bonds are fairly tight . This state of the market reflects a relatively sound economic backdrop with little balance-of-payment stress . Also helping is China’s desire to make the country's capital account convertible by the end of this year . The reform aims to meet the International Monetary Fund's
Stock Market and Portfolio Strategy—

VISIONApril 2015
24
—
(IMF’s) requirements before its evaluation on whether the yuan could be a part of Special Drawing Rights . This means the yuan would join the US dollar, euro, British pound and Japanese yen as part of the supplementary foreign exchange reserve maintained by the IMF .
0
100
200
300
400
500
600
700
800
900
1,000
2000 2002 2004 2006 2008 2010 2012 2014
World: So far so good, but keep an eye on this one Yield spread of emerging-Asia bonds to U.S. Treasuries
NBF Economics and Strategy (data via Federal Reserve)
Basis points
Energy volatility
We argued last month that a tamer USD would tend to put a floor under commodity prices, as the negative correlation between the two asset classes is currently extreme (chart) . Our view has not changed .
-1.0-0.9-0.8-0.7-0.6-0.5-0.4-0.3-0.2-0.10.00.10.20.30.40.5
1996 1998 2000 2002 2004 2006 2008 2010 2012 2014
150
1301201101009080
70
60
50
40
30
116
114
112
110
108
106
104
102
100
98
96
94
922006 2007 2008 2009 2010 2011 2012 2013 2014 2015
World: Greenback appreciation has precipitated WTI drop
* Broad dollar index (26 currencies) NBF Economics and Strategy (data via Datastream)
Correlation between monthly changes in the USD* and WTI
USD and the price of oil (WTI)
$/barrel (log scale) 12-month moving correlation
Current
Period average
WTI (left)
USD (right)
Index (log scale)
That said, supply-demand dynamics remain the most important influence on the oil price outlook .
On the demand side, global industrial production is currently on track to expand 4% this year . In the past, that pace of growth has been accompanied by an annual rise in oil demand of at least 1% (chart) .
-10
-8
-6
-4
-2
0
2
4
6
8
10
2002 2004 2006 2008 2010 2012 201428
30
32
34
36
38
40
42
44
46
48
50
52
2002 2004 2006 2008 2010 2012 2014
23% of non-OECD
is China
World: Industrial production and demand for oil Shares of OECD and non-OECD economies
in global oil demand Change in global IP and change in global oil demand
% y/y Milions of BPD Non-
OECD
OECD
Oil demand
IP
NBF Economics and Strategy (data via Eikon)
With the bulk of the increase in oil consumption coming from emerging economies, it is little wonder that the cooling of the Chinese economy has been blamed for the recent fall of oil prices . Yet despite a slowing of industrial production growth, China’s volume imports of crude oil are still expanding at a relatively robust rate of 8% (chart) .
-30
-20
-10
0
10
20
30
40
50
2002 2004 2006 2008 2010 2012 2014
0
5
10
15
20
25
2/1/2006
9/1/2006
4/1/2007
11/1/2007
6/1/2008
1/1/2009
8/1/2009
3/1/2010
10/1/2010
5/1/2011
12/1/2011
7/1/2012
2/1/2013
9/1/2013
4/1/2014
11/1/2014
% y/y %(y/y)
NBF Economics and Strategy (data via Datastream)
China: Slowing yes, but still growing Chinese volume oil imports China industrial output
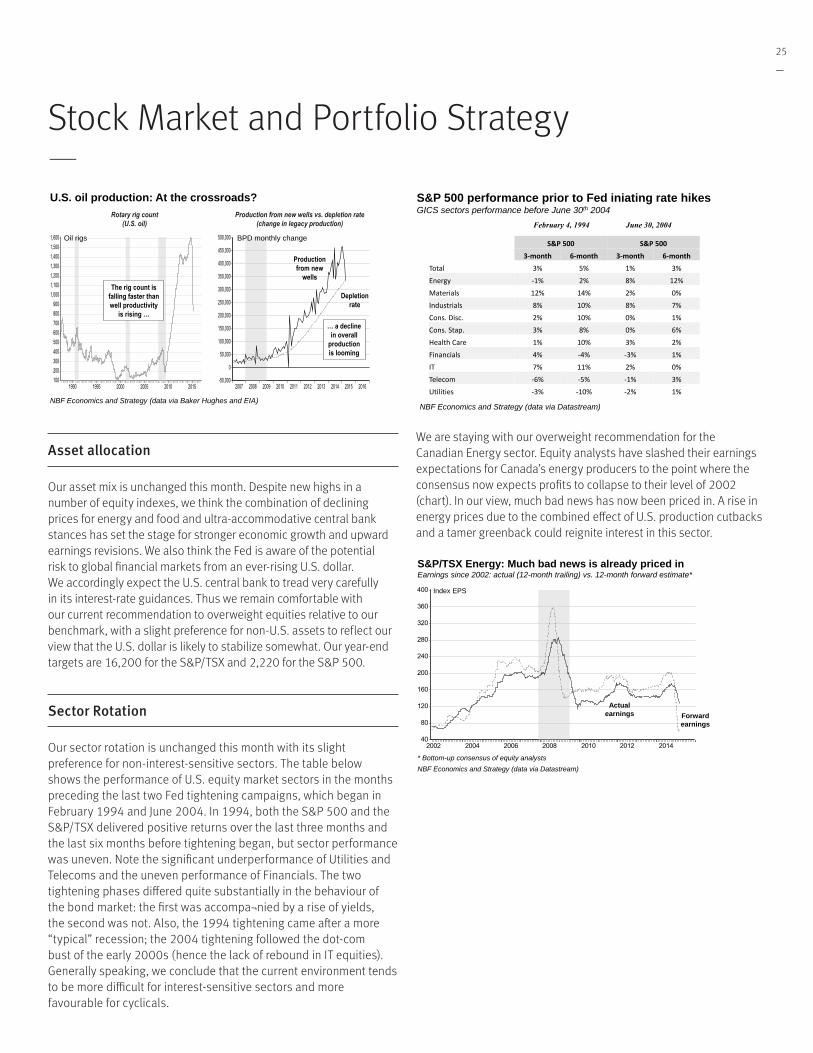
If demand is holding up, then it is supply forces that are more likely to dictate the future direction of prices . Recent data show the number of U .S . oil rigs falling to a new multi-year low of 825 in March . So far, the lower rig count has been more than offset by higher productivity at existing wells, lifting U .S . crude oil production to new highs . A change may be just around the corner . The U .S . department of energy reports that the drop in rig counts is such that production from new wells in April is likely to be, at best, hardly more than the ever-rising depletion rate of existing wells (about 325,000 barrels a day) .
If the energy department is right, it will be the first time in more than four years that U .S . crude production has failed to increase .
Stock Market and Portfolio Strategy—
25
—
100200300400500600700800900
1,0001,1001,2001,3001,4001,5001,600
1990 1995 2000 2005 2010 2015
U.S. oil production: At the crossroads?
NBF Economics and Strategy (data via Baker Hughes and EIA)
Production from new wells vs. depletion rate (change in legacy production)
Oil rigs
-50,000
0
50,000
100,000
150,000
200,000
250,000
300,000
350,000
400,000
450,000
500,000
2007 2008 2009 2010 2011 2012 2013 2014 2015 2016
BPD monthly change
Rotary rig count (U.S. oil)
The rig count is falling faster than well productivity
is rising … … a decline
in overall production is looming
Production from new
wells
Depletion rate
Asset allocation
Our asset mix is unchanged this month . Despite new highs in a number of equity indexes, we think the combination of declining prices for energy and food and ultra-accommodative central bank stances has set the stage for stronger economic growth and upward earnings revisions . We also think the Fed is aware of the potential risk to global financial markets from an ever-rising U .S . dollar . We accordingly expect the U .S . central bank to tread very carefully in its interest-rate guidances . Thus we remain comfortable with our current recommendation to overweight equities relative to our benchmark, with a slight preference for non-U .S . assets to reflect our view that the U .S . dollar is likely to stabilize somewhat . Our year-end targets are 16,200 for the S&P/TSX and 2,220 for the S&P 500 .
Sector Rotation
Our sector rotation is unchanged this month with its slight preference for non-interest-sensitive sectors . The table below shows the performance of U .S . equity market sectors in the months preceding the last two Fed tightening campaigns, which began in February 1994 and June 2004 . In 1994, both the S&P 500 and the S&P/TSX delivered positive returns over the last three months and the last six months before tightening began, but sector performance was uneven . Note the significant underperformance of Utilities and Telecoms and the uneven performance of Financials . The two tightening phases differed quite substantially in the behaviour of the bond market: the first was accompa¬nied by a rise of yields, the second was not . Also, the 1994 tightening came after a more “typical” recession; the 2004 tightening followed the dot-com bust of the early 2000s (hence the lack of rebound in IT equities) . Generally speaking, we conclude that the current environment tends to be more difficult for interest-sensitive sectors and more favourable for cyclicals .
S&P 500 performance prior to Fed iniating rate hikes GICS sectors performance before June 30th 2004
NBF Economics and Strategy (data via Datastream)
S&P 500 S&P 500 3-month 6-month 3-month 6-month Total 3% 5% 1% 3% Energy -1% 2% 8% 12% Materials 12% 14% 2% 0% Industrials 8% 10% 8% 7% Cons. Disc. 2% 10% 0% 1% Cons. Stap. 3% 8% 0% 6% Health Care 1% 10% 3% 2% Financials 4% -4% -3% 1% IT 7% 11% 2% 0% Telecom -6% -5% -1% 3% Utilities -3% -10% -2% 1%
February 4, 1994 June 30, 2004
We are staying with our overweight recommendation for the Canadian Energy sector . Equity analysts have slashed their earnings expectations for Canada’s energy producers to the point where the consensus now expects profits to collapse to their level of 2002 (chart) . In our view, much bad news has now been priced in . A rise in energy prices due to the combined effect of U .S . production cutbacks and a tamer greenback could reignite interest in this sector .
40
80
120
160
200
240
280
320
360
400
2002 2004 2006 2008 2010 2012 2014
S&P/TSX Energy: Much bad news is already priced in Earnings since 2002: actual (12-month trailing) vs. 12-month forward estimate*
Index EPS
Forward earnings
Actual earnings
* Bottom-up consensus of equity analysts NBF Economics and Strategy (data via Datastream)
Stock Market and Portfolio Strategy—

VISIONApril 2015
26
—
Stock Market and Portfolio Strategy—
NBF Fundamental Sector Rotation - April 2015
Name (Sector/Industry) Recommendation S&P/TSX weight
Energy Overweight 21.4%Energy Equipment & Services Overweight 0.8%Oil, Gas & Consumable Fuels Overweight 20.6%
Materials Market Weight 11.0%Chemicals Underweight 3.3%Containers & Packaging Market Weight 0.3%Metals & Mining * Market Weight 2.6%Gold Market Weight 4.5%Paper & Forest Products Overweight 0.5%
Industrials Market Weight 8.4%Capital Goods Overweight 1.6%Commercial & Professional Services Underweight 0.7%Transportation Market Weight 6.1%
Consumer Discretionary Underweight 6.5%Automobiles & Components Underweight 1.7%Consumer Durables & Apparel Overweight 0.6%Consumer Services Underweight 0.8%Media Market Weight 2.2%Retailing Underweight 1.2%
Consumer Staples Underweight 3.8%Food & Staples Retailing Underweight 3.1%Food, Beverage & Tobacco Underweight 0.7%
Health Care Market Weight 4.9%Health Care Equipment & Services Market Weight 0.7%Pharmaceuticals, Biotechnology & Life Sciences Market Weight 4.2%
Financials Market Weight 34.6%Banks Market Weight 21.0%Diversified Financials Market Weight 1.4%Insurance Overweight 7.0%Real Estate Market Weight 5.1%
Information Technology Overweight 2.4%Software & Services Overweight 1.9%Technology Hardware & Equipment Market Weight 0.5%
Telecommunication Services Underweight 4.7%Utilities Underweight 2.2%
* Metals & Mining excluding the Gold Sub-Industry.

27
—
Stock Market and Portfolio Strategy—
-5.
2%
-2.
1%
-0.
9%
2.8%
19
.6%
-150%
-100%
-50%
0%
50%
100%
150%
Q1-99 Q1-00 Q1-01 Q1-02 Q1-03 Q1-04 Q1-05 Q1-06 Q1-07 Q1-08 Q1-09 Q1-10 Q1-11 Q1-12 Q1-13 Q1-14 Q1-15
S&P 500 Quarterly Operating Earnings Growth (YoY)
Realized
n.a.
Actual Q4 2015 (Est.) Actual Q4 2015 (Est.)Index Level Mar-25-15 Target Index Level Mar-25-15 Target S&P/TSX 14,929 16,200 S&P 500 2,061 2,220
Assumptions Q4 2015 (Est.) Assumptions Q4 2015 (Est.) Level: Earnings * 883 900 Level: Earnings * 118 126
Dividend 433 441 Dividend 41 44PE Trailing (implied) 16.9 18.0 PE Trailing (implied) 17.5 17.6
Q4 2015 (Est.) Q4 2015 (Est.) Treasury Bills (91 days) 0.53 0.63 Treasury Bills (91 days) 0.04 0.69 10-year Bond Yield 1.34 1.89 10-year Bond Yield 1.92 2.34* Before extraordinary items, source Thomson * S&P operating earnings, bottom up.NBF Economics and Strategy
NBF Market Forecast NBF Market ForecastCanada United States

VISIONApril 2015
28
—
Stock Market and Portfolio Strategy—
Local Currency (MSCI Indices are in US$) Canadian Dollar Correlation *
Close on with S&P 50003/25/2015 M-T-D Y-T-D 1-Yr 3-Yr Y-T-D 1-Yr 3-Yr
North America - MSCI Index 2118 -2.0% 0.1% 9.5% 43.4% 8.2% 22.6% 79.7% 1.00 United States - S&P 500 2061 -2.1% 0.1% 10.5% 47.5% 8.1% 23.7% 84.9% 1.00 Canada - TSE 300 14929 -2.0% 2.0% 4.4% 19.8% 2.0% 4.4% 19.8% 0.95Europe - MSCI Index 1695 -0.6% 5.4% -3.4% 22.2% 13.9% 8.1% 53.2% 0.86 United Kingdom - FTSE 100 6991 0.6% 6.5% 5.9% 19.4% 10.0% 7.1% 40.7% 0.89 Germany - DAX 30 11865 4.1% 21.0% 27.1% 69.6% 18.7% 13.5% 76.1% 0.95 France - CAC 40 5021 1.4% 17.5% 15.6% 44.4% 15.3% 3.2% 50.0% 0.94 Switzerland - SMI 9188 1.9% 2.3% 10.7% 47.2% 14.6% 14.7% 75.1% 0.94 Italy - Milan Comit 30 246 3.3% 20.3% 12.5% 36.5% 18.0% 0.5% 41.7% 0.93 Netherlands - Amsterdam Exchanges 492 1.6% 15.8% 25.1% 50.7% 13.6% 11.7% 56.5% 0.95Pacific - MSCI Index 2542 3.2% 10.3% 10.9% 21.8% 19.2% 24.2% 52.7% 0.84 Japan - Nikkei 225 19746 5.0% 13.2% 36.9% 97.2% 22.8% 31.4% 70.6% 0.95 Australia - All ordinaries 5937 0.7% 10.2% 11.0% 36.1% 14.3% 6.7% 28.2% 0.92 Hong Kong - Hang Seng 24528 -1.2% 3.9% 12.9% 18.7% 12.3% 26.4% 49.0% 0.79World - MSCI Index 1756 -0.9% 2.7% 6.1% 34.3% 11.0% 18.8% 68.3% 0.98World Ex. U.S.A. - MSCI Index 1896 0.5% 5.9% 0.6% 19.5% 14.4% 12.6% 49.7% 0.87EAFE - MSCI Index 1900 0.7% 7.1% 1.2% 22.1% 15.7% 13.3% 53.0% 0.87Emerging markets (free) - MSCI Index 976 -1.4% 2.1% 1.8% -6.3% 10.3% 14.0% 17.4% 0.25
* Correlation of monthly returns (3 years).
Global Stock Market Performance Summary
Returns Returns
S&P 500 Sectoral Earnings- Consensus*3/25/2015
Weight Index 5 year PEG RevisionS&P 500 Level 3-m D 12-m D 2015 2016 12-m 2015 2016 12-m Growth Ratio Index**
% forward forward Forecast
S&P 500 100 2061 -1.00 10.48 1.29 13.12 4.62 17.69 15.64 17.04 10.41 3.69 -5.72
Energy 8.05 565 -4.89 -12.00 -55.67 45.54 -42.63 29.21 20.07 26.24 0.65 neg. -41.71
Materials 3.15 305 -1.18 2.16 2.64 20.11 7.25 18.09 15.06 17.14 11.14 2.36 -8.78
Industrials 10.35 477 -3.35 6.60 6.26 9.80 7.38 16.81 15.31 16.42 10.51 2.22 -2.76
Consumer Discretionary 12.59 595 4.47 16.18 11.85 14.90 12.98 19.90 17.32 19.11 14.89 1.47 -2.13
Consumer Staples 9.70 500 -1.68 13.97 1.08 9.20 4.12 20.10 18.41 19.49 7.73 4.74 -4.40
Healthcare 14.98 841 5.77 25.18 7.52 12.98 8.98 18.49 16.37 17.91 11.20 1.99 -1.42
Financials 16.20 324 -3.84 7.32 15.54 10.85 14.27 14.51 13.09 14.13 11.54 0.99 -1.96
Information Technology 19.66 690 -2.23 14.98 8.28 11.64 10.03 16.34 14.63 15.56 12.34 1.55 -1.56
Telecom Services 2.30 153 -1.10 0.21 4.45 4.89 4.56 14.11 13.46 13.94 6.10 3.06 -2.23
Utilities 3.02 224 -8.46 7.81 0.95 4.09 1.74 16.84 16.18 16.67 4.98 9.56 -1.76* Source I/B/E/S** Three-month change in the 12-month forward earnings
Variation EPS Growth P/E

Technical Analysis—

VISIONApril 2015
30
—
In this edition of Vision, we highlight a number of Asian markets that have favourable long-term chart formations . Investors can gain exposure to these markets through an ETF . Our preference is to use a U .S . dollar denominated ETF to also take advantage of a strong U .S . dollar .
Topix
The Topix (TPX) is a capitalization-weighted index of 1,858 Japanese stocks . We made the case in early 2013 for a new secular bull market in Japan as the market character was similar to the August 1982 action on the New York market as it began its secular bull market . Technical action so far continues to support our thesis . An initial leg up on the TPX was followed by a consolidation of the move for a number of months with 1300 resistance . A recent breakout across 1300 sets up a test of key long-term chart resistance at 1750 to 1800 . This will be the fourth challenge of this key level . An upside breakout from here completes a huge 20-year base with very bullish long-term implications and potential of 1000 points up .
Nikkei 225
The Nikkei is leading way higher as it has already broken out across resistance at 18,000 into multi-year highs . An earlier breakout from a multi-month consolidation at 16,400 kicked off the current leg up . A challenge of next important resistance at 22,000 to 23,000 is in the cards . Long-term objectives are 24,000 and 28,000 to 30,000 .
Shanghai
The Shanghai market ended its bear market a number of months ago when it broke out of a multi-year triangle bottom around 2200 . While the market has made substantial gains, there is more to play out in terms of time and price . The recent breakout at 3400 from several weeks of consolidation also takes this index into multi-year highs . Thin overhead resistance suggests there is good potential for retracing the lost ground of the previous bear market .
Technical Analysis—
Dennis Mark, cfa 416-869-7427 dennis .mark@nbc .ca
Source: Reuters
Source: Reuters
Source: Reuters

31
—
Technical Analysis—
Hang Seng
The Hang Seng index is carving out a large six-year base structure that has potential to break out to the upside . An ascending triangle formation indicates a series of higher lows with chart resistance at 25,000 . Overall, the bulls are winning but the bears are holding at resistance . Breaking the 25,000 chart resistance completes a major base that sets up a challenge of the highs near 32,000 .
Source: Reuters
Source: Reuters
Source: Reuters
Bombay Sensex
The Bombay Sensex index broke out of a seven-year base at 21200 last year and continues to play out to the upside striking new all-time highs . Use pullbacks or corrections as a buying opportunity . Target is in the mid-30,000s .
Straits Times Index
The Singapore Straits Times index chart is carving out a multi-year ascending triangle base very similar to the Bombay chart . The key breakout level at approximately 3,400 is being challenged but not broken yet . A gradual declining volume trend is constructive and may be setting up for an expansion in volume on an upside breakout . An initial objective of 4,200 can be expected on the first leg after the upside breakout .

This page intentionally left blank .
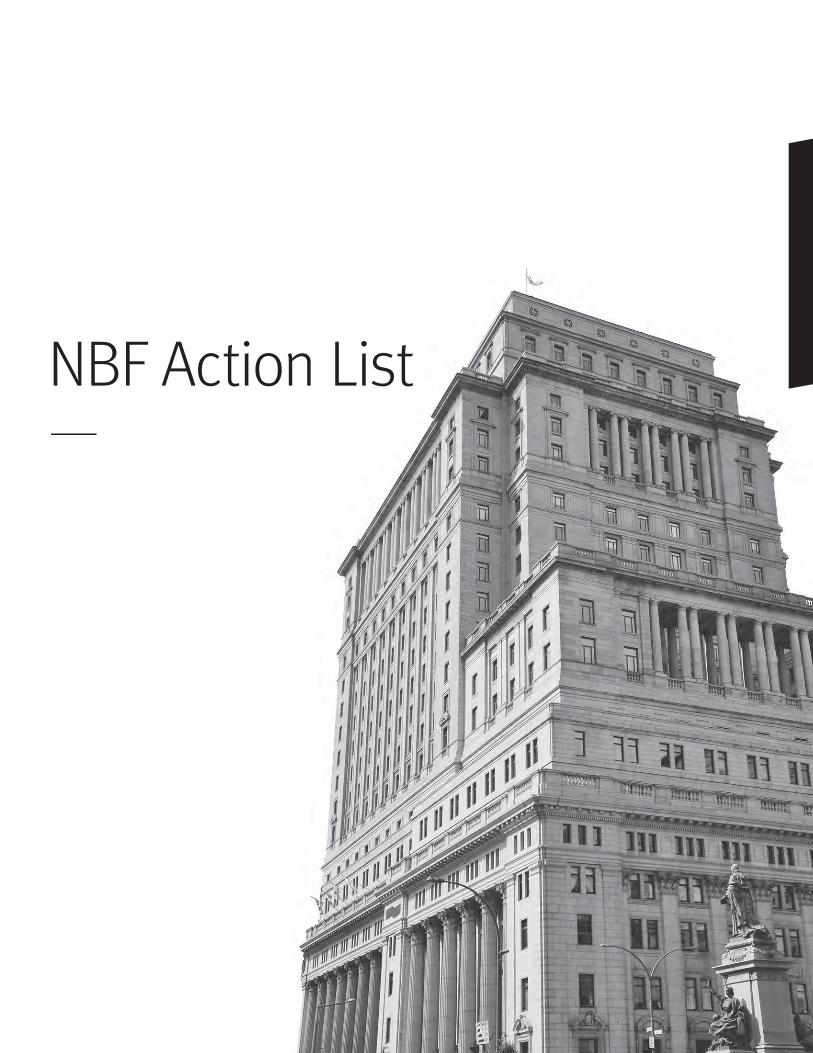
NBF Action List—
VISIONApril 2015
34
—
Company Symbol AdditionDate
AdditionPrice
CurrentPrice
AdditionTarget Price
CurrentTarget Price
Est.Total
ReturnRating
MarketCap.
(Mln C$)Analyst
American Hotel Income Properties REIT LP HOT.UN 04/16/2014 C$10.21 C$11.08 C$12.50 C$12.50 20.90% Outperform 270 Trevor Johnson
Canam Group Inc. CAM 05/14/2014 C$13.52 C$12.18 C$17.50 C$16.50 36.80% Outperform 512 Leon Aghazarian
DIRTT Environmental Solutions Ltd. DRT 04/21/2014 C$3.56 C$6.42 C$4.25 C$9.00 40.20% Outperform 492 Rupert Merer
Element Financial Corp. EFN 09/25/2014 C$13.41 C$15.74 C$19.00 C$21.00 33.40% Outperform 4157 Shubha Khan
Gildan Activewear Inc. GIL 12/05/2014 C$62.48 C$74.65 C$71.00 C$80.00 8.10% Outperform 9100 Vishal Shreedhar
Milestone Apartments REIT MST.UN 01/15/2015 C$12.21 C$13.61 C$14.25 C$15.00 16.30% Outperform 838 Matt Kornack
Quebecor Inc. QBR.B 12/16/2014 C$31.14 C$33.74 C$38.00 C$41.00 21.80% Outperform 4147 Adam Shine
Sandvine Corporation SVC 09/09/2014 C$3.04 C$3.45 C$4.50 C$4.50 30.40% Outperform 511 Kris Thompson
Tamarack Valley Energy Ltd. TVE 09/26/2014 C$6.51 C$3.80 C$9.00 C$5.00 31.60% Outperform 296 Dan Payne
Tourmaline Oil Corp. TOU 08/07/2014 C$50.43 C$38.20 C$68.00 C$50.00 30.90% Outperform 7751 Dan Payne
Whitecap Resources Inc. WCP 11/21/2012 C$12.22 C$13.14 C$15.50 C$17.50 38.90% Outperform 3328 Brian MilneOvernight US Exchange rate: 1.2803. Exchange rate and last prices as of 2015/03/13. Source: NBF
NBF Action List—
The NBF Action List highlights our Analysts’ most compelling investment ideas .
In developing The NBF Action List, we’ve followed these guidelines:
A short list of Names: We’ve kept the number of securities on the Action List small, allowing only 10% of an Analyst’s coverage on the list at any time . This means many Analysts can only have a single name on the Action List .
We do not require that an Analyst always have a name on The Action List. This way we can ensure that only the most compelling ideas are presented .
The Decision Making Resides with our Equity Analysts: Our Action List is not managed by a committee: instead, the decision is solely our Equity Analysts - those individuals who know the names better than anyone .
Strong Opinions - Either Bullish or Bearish: Recognizing that identifying stocks that should be sold can be as valuable to an Investor as names that should be bought, we’ve allowed Analysts to include names on the Action List they strongly believe should be sold .
There are No Market Cap or Liquidity Requirements: Some of the best returns can come from small and mid-cap stocks . As such, we want to ensure they are included on The Action List when appropriate .
Restricted Stocks: Stocks placed under restriction while on The NBF Action List will remain on the list, but with the rating changed to Restricted and target price and estimated total return removed in accordance with compliance requirements .

Sector Analysis—In this section, commentaries and stock closing prices are based on the information available up to March 17, 2015 . Information in this section is based on NBF analysis and estimates and ThomsonOne .

VISIONApril 2015
36
—
Agriculture
Near futures for agri-complex components down across the board. The past four weeks have been challenging for the agri-complex, illustrated by monthly losses for near futures in Wheat (-4%), Corn (-1 .0%), Soybeans (-1%) and Canola (-1%) . We remain cautious on both grain prices and farmer income in 2015 as global stocks-to-use is on the rise - typically limiting the upside for grain prices . As we are seeing leading indicators of continuing growth in global grain volumes, we continue to favour stocks driven by grain volumes as opposed to grain prices (and farmer income) in 2015 .
On the equities side, our top performer for the period is Ag Growth International Inc. (AFN: TSX; Outperform, $57.00 Target). Despite a Q4 miss, AFN gained 1% over the last month - outpacing all other agricultural companies in our coverage universe . While backlogs for domestic orders are down y/y, we note that Q4/13 was abnormally strong and that quoting activity remains robust . Meanwhile, the international backlog increased 150%, growing from $16 million a year ago to $40 million today, with almost half the growth from outside the Ukraine/Russian region - including $9 million in Latin America . As we roll out our 2016 estimates, we also move our estimated
Westeel closing date to May 1st (was March 1st) and update our FX assumptions (now ~$0 .80 USD/CAD rate for 2015) to arrive at a $108 million EBITDA forecast for 2015e . As AFN is driven primarily by grain volumes, this top pick is consistent with our overall macroeconomic view for the agricultural sector .
Agriculture and Energy ServicesSector Analysis
— Greg Colman
Analyst 416-869-6775 —
Associates: Andrew Jacklin: 416-869-7571 Sean Wetmore, CA, CFA: 416-869-6763
Michael Storry-Robertson: 416-507-8007
Shares Stock Last FDEPS EBITDA(min) Net Y1 Net 12-MthStock Stock Risk O/S Price Year (A) est. est. (A) est. est. Debt Debt/ PriceSym. Rating Rating (Mln) 03/17 Reported Last FY FY1 FY2 FY1 FY2 Last FY FY1 FY2 FY1 FY2 (min) EBITDA Target
Ag Growth International Inc. AFN-T OP AA 14.2 51.40$ Dec-14 0.23$ 3.98$ 4.48$ 12.9x 11.5x 78.23$ 107.79$ 121.54$ 9.7x 8.4x 273.56$ 2.5x 57.00$ AGT Food and Ingredients Inc. AGT OP AA 23.1 30.65$ Dec-14 0.95$ 1.95$ 2.14$ 15.7x 14.3x 87.00$ 99.78$ 111.51$ 10.0x 9.1x 307.14$ 3.1x 33.00$ Cervus Equipment Corporation CVL-T SP AA 16.0 19.17$ Dec-14 1.49$ 1.16$ 1.37$ 16.5x 14.0x 51.88$ 46.96$ 62.26$ 9.1x 6.6x 104.15$ 2.2x 20.00$ Input Capital Corp INP-V OP AA 87.3 2.60$ Mar-14 nmf (0.10)$ (0.01)$ n/a n/a nmf -$ 12.50$ nmf 15.1x (56.41)$ nmf 3.50$ Vicwest Inc. VIC-T T AA 17.6 12.41$ Dec-14 (0.26)$ T T nmf T 13.60$ T T 13.4x 8.1x 108.77$ T 12.70$
Rating System: OP = Outperform; SP = Sector Perform; UP = Underperform; T = Tender; UR = Under Review; R = Restricted Risk Rating: BA = Below Average; A = Average; AA = Above Average; S = Speculative
P/E EV/EBITDA
Shares Shares O/S O/S Stock Last Market Est. Est. Est. Est. 12-Mth
Stock Stock Risk (Min) (Min) Price Year Cap Cash Cash Price/ NAV NAVPS PriceSym. Rating Rating f.d. (f.d.,f.f) 03/17 Reported (Min) EV (Mln) per Sh. Cash (Mln) (f.d.,f.f.) P/NAV P/NAVPS EV/NAV Target
Arianne Phosphate Inc. DAN-V OP AA 92.7 360.70 0.74$ Dec-13 73.22$ 78.74$ 6.40$ 0.07$ 10.7x 704.34$ 1.95$ 0.0x 0.4x 0.1x 1.95$ 101.6 725.68 0.23 Dec-12 23.38 9.38Rating System: OP = Outperform; SP = Sector Perform; UP = Underperform; T = Tender; UR = Under Review; R = Restricted Risk Rating: BA = Below Average; A = Average; AA = Above Average; S = Speculative

37
—
Agriculture and Energy ServicesSector Analysis
— Greg Colman
Analyst 416-869-6775 —
Associates: Andrew Jacklin: 416-869-7571 Sean Wetmore, CA, CFA: 416-869-6763
Michael Storry-Robertson: 416-507-8007
Energy Services
Management guidance illustrates cautionary outlook for 2015. The TSX Energy Services Sub-index (STENRE) lost 10% over the past four weeks as component companies reported Q4 2014 results and updated capital budgets accompanied by management outlook for 2015 . While in many cases Q4 results met or beat consensus expectations, in general management guidance for the year was tepid at best, typically highlighting a cautious and conservative business plan to weather lower commodity prices and Exploration & Production (E&P) spending levels throughout 2015 . We continue to see 2015 E&P capital budgets being cut and ultimately expect capital programs to be down in the range of 35%-40% from 2014 levels (our E&P capex tracker is currently pointing to a 37% decrease in 2015 capital spending relative to 2014) . Although North American rig counts are decreasing at record rates (indicating a decrease in oil supply is on the way), we maintain our belief that 2015 - especially the first half - will be a very challenging year for energy services .
This belief has been reinforced by the tempered expectations iterated by the management teams of our coverage universe over the past few weeks .
Finding shelter from the storm? While few companies in energy services will emerge from the current commodity price environment unscathed, some are better positioned than others . Our top performer for the last month (up 23%) is Lonestar West Inc. (LSI: TSX .V; Outperform, $4 .00 Target) which we estimate has approximately 103 trucks (or 70% of its entire fleet) exposed to non-energy sectors . Q4 results for High Arctic Energy Services Inc. (HWO: TSX; Outperform, $5 .25 Target) impressed as operations in PNG have not felt the effect of the decline in oil field activity as PNG operators continue to focus on LNG development . Some of our other top picks include Canadian Energy Services (CEU: TSX; Outperform, $9 .00 Target), CanElson Drilling Inc. (CDI: TSX; Outperform, $5 .00 Target) and Xtreme Drilling and Coil Services Corp. (XDC: TSX; Outperform, $6 .00 Target) .
Shares StockStock Stock Risk O/S PriceSym. Rating Rating (Mln) 03/17 2014e 2015e 2016e 2014e 2015e 2014e 2015e 2016e 2014e 2015e Target Return
Black Diamond Group Ltd. BDI SP AA 41.0 13.85 141.31 104.72 126.63 11.0 29.3 5.16 6.77 5.95 1.3 1.6 15.50 12%Calfrac Well Services Ltd. CFW SP AA 94.8 7.87 361.35 154.82 233.63 9.6 -15.7 3.89 9.18 6.85 1.8 4.4 10.00 27%Canadian Energy Services & Tech CEU OP AA 215.5 5.21 178.82 125.78 173.29 50.3 20.7 8.38 11.31 8.42 2.1 2.4 9.00 73%CanElson Drilling Inc. CDI OP AA 93.0 3.58 110.25 50.87 81.83 8.8 21.7 4.06 8.13 4.69 0.4 0.3 5.00 40%Canyon Services Group Inc. FRC SP AA 68.6 5.97 121.67 38.29 100.42 n/m n/m 4.07 13.38 5.73 n/m n/m 9.50 59%Cathedral Energy Services Ltd. CET SP AA 36.3 2.04 35.10 12.37 29.56 5.3 -45.9 3.67 8.25 3.37 1.5 2.1 3.00 47%ENTREC Corp. ENT SP AA 107.4 0.41 45.33 32.69 32.86 3.6 n/m 5.11 6.40 6.74 3.9 4.8 0.75 85%Essential Energy Services Ltd. ESN OP AA 125.8 1.04 67.60 28.21 50.11 6.7 24.0 3.01 6.55 3.92 0.8 1.3 1.75 68%High Arctic Energy Services Inc. HWO OP AA 55.8 3.60 49.30 52.30 58.54 6.8 10.3 3.35 3.09 2.62 n/m n/m 5.25 46%Horizon North Logistics Inc. HNL OP AA 110.3 2.21 92.87 72.95 92.99 10.3 94.4 4.29 4.94 4.15 1.7 1.6 3.75 70%Lonestar West LSI OP AA 29.2 2.35 8.34 10.77 16.33 24.5 11.3 10.77 9.20 5.91 2.6 2.8 4.00 70%Mullen Group Ltd. MTL SP AA 91.6 19.71 286.41 239.28 303.93 19.7 28.8 7.89 10.30 8.19 1.3 2.4 23.50 19%Pason Systems Corp. PSI OP AA 83.4 18.53 269.70 121.95 199.11 65.3 21.2 5.19 11.21 6.76 n/m n/m 22.50 21%PHX Energy Services Corp. PHX SP AA 35.2 6.61 80.82 38.93 57.15 11.9 37.8 4.59 8.67 6.03 1.3 1.9 7.50 13%Savanna Energy Services Corp. SVY OP AA 90.1 1.85 157.89 80.98 134.39 n/m n/m 3.63 6.70 3.55 2.2 3.8 4.00 79%Secure Energy Services Inc. SES R R R R R R R R R R R R R R R RStudent Transportation Inc. STB OP BA 82.1 6.82 87.89 102.26 n/a n/m n/m 10.92 9.04 n/a 3.0 2.8 8.50 25%Trican Well Services TCW SP AA 149.6 3.73 260.68 138.25 192.61 133.1 n/m 5.37 8.51 6.73 2.7 3.5 6.75 81%Trinidad Drilling Ltd. TDG OP AA 135.2 3.96 252.05 151.66 215.76 22.8 9.4 4.12 6.81 4.37 1.8 3.0 6.50 64% Xtreme Drilling and Coil Services Corp. XDC OP AA 87.6 1.60 76.89 58.91 97.50 10.1 3.4 3.52 4.16 2.01 1.5 1.5 4.25 166%
Risk Rating: BA = Below Average; A = Average; AA = Above Average; S = Speculative
EBITDA (mm) EV/EBITDAP/E
12-Mth PriceNet Debt / EBITDA
Rating System: OP = Outperform; SP = Sector Perform; UP = Underperform; T = Tender; UR = Under Review; R = Restricted

VISIONApril 2015
38
—
Oil and GasSector Analysis
—
Dan Payne Analyst 403-290-5441 —
Associates: Tim Sargeant: 403-441-0952
Mark Hirsch: 403-441-0928
Brian Milne Analyst 403-290-5625 —
Associates: Tim Sargeant: 403-441-0952
Mark Hirsch: 403-441-0928
Kyle Preston, CFA, CMA Analyst 403-290-5102 —
Associate: Jason Wai: 403-355-6643
Junior and Intermediate Oil and Gas
Senior and Intermediate Yield Oil and Gas
Crude – Crude inventories continue to build, with U .S . inventories advancing 4 .5 mmbbl, to a total stockpile of 448 .9 mmbbl, the highest level since data started being compiled by the Energy Information Administration (EIA) in 1982 . Inventories are now 15 .1% above last year’s levels, and 10 .4% above the five-year average . The EIA released its Short-Term Energy Outlook last week and they expect that the supply/demand imbalance will worsen over the first six months of 2015, flatten in the third quarter and then exhibit some modest tightening to the tune of 220,000 bbl/d by the time we get to the fourth quarter . Crude hit its lowest point since January last Friday as the IEA reiterated that the United States may soon run out of storage capacity . We now forecast a WTI and Brent oil price of US$56 .75/bbl and US$64 .50/bbl in 2015, and US$70/bbl and US$75/bbl in 2016, respectively .
Natural Gas – The EIA reported a 198 Bcf withdrawal last week, compared with market expectations of a 190 Bcf withdrawal (per Bloomberg) . Total U .S . gas storage sits at 1,512 Bcf, 47% above last year and 13% below the five-year average . For the next three weeks, early expectations (per Bentek) are calling for a withdrawal of 42 Bcf (compared with a 69 Bcf withdrawal last year and a five-year average withdrawal of 45 Bcf), a build of 29 Bcf (compared with a 56 Bcf withdrawal last year and a five-year average withdrawal of 19 Bcf), and a build of 9 Bcf (compared with a 71 Bcf withdrawal last year and a five-year average withdrawal of 22 Bcf), respectively . Natural gas fell again last week on expectations of warmer weather . We continue to forecast a NYMEX and AECO gas prices of US$3 .00/Mcf and $2 .90/Mcf in 2015, and US$3 .50/Mcf and $3 .50/Mcf in 2016, respectively .
NBF Energy Selections
Seniors: Canadian Natural Resources (CNQ)
Intermediate Yield: Prairie Sky Royalty (PSK), Vermilion (VET) and Whitecap (WCP)
Junior Yield: Cardinal Energy (CJ) and TORC Oil & Gas (TOG)
Intermediate Non-Yield/Juniors: Raging River (RRX), Spartan (SPE), Storm Resources (SRX), Tourmaline (TOU) and Tamarack Valley (TVE)
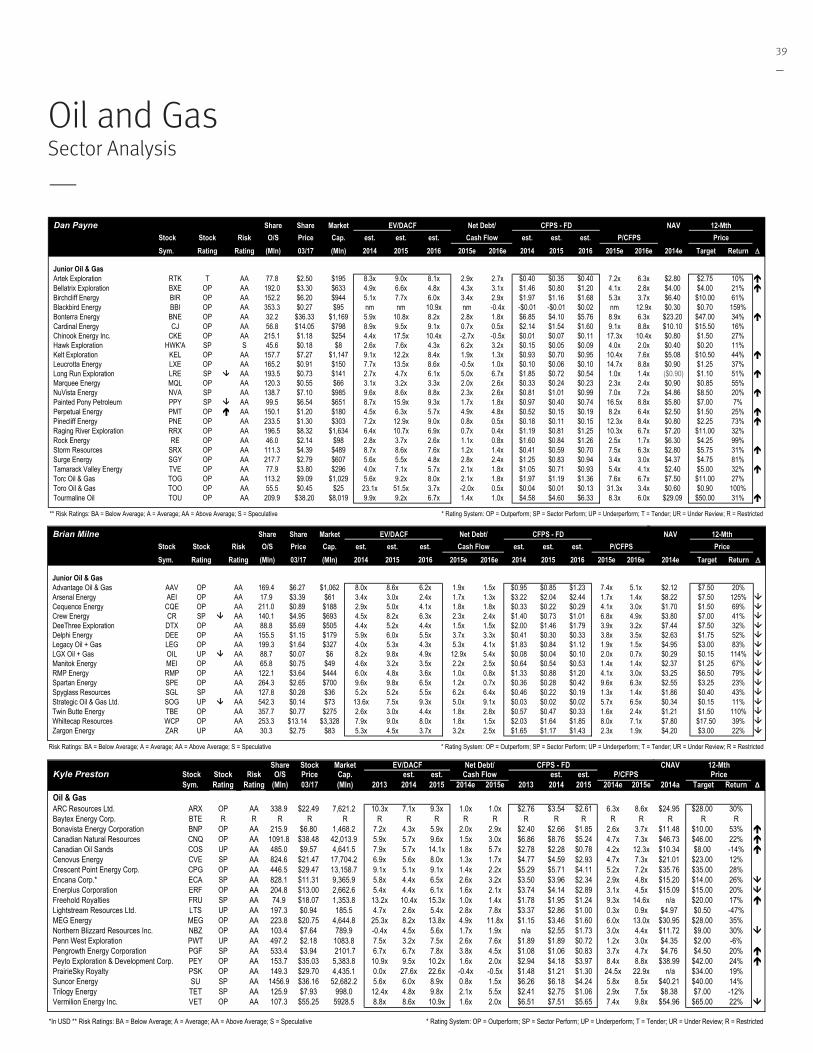
39
—
Oil and GasSector Analysis
—Dan Payne Share Share Market NAV
Stock Stock Risk O/S Price Cap. est. est. est. est. est. est.Sym. Rating Rating (Mln) 03/17 (Mln) 2014 2015 2016 2015e 2016e 2014 2015 2016 2015e 2016e 2014e Target Return D
Junior Oil & GasArtek Exploration RTK T AA 77.8 $2.50 $195 8.3x 9.0x 8.1x 2.9x 2.7x $0.40 $0.35 $0.40 7.2x 6.3x $2.80 $2.75 10% Bellatrix Exploration BXE OP AA 192.0 $3.30 $633 4.9x 6.6x 4.8x 4.3x 3.1x $1.46 $0.80 $1.20 4.1x 2.8x $4.00 $4.00 21% Birchcliff Energy BIR OP AA 152.2 $6.20 $944 5.1x 7.7x 6.0x 3.4x 2.9x $1.97 $1.16 $1.68 5.3x 3.7x $6.40 $10.00 61%Blackbird Energy BBI OP AA 353.3 $0.27 $95 nm nm 10.9x nm -0.4x -$0.01 -$0.01 $0.02 nm 12.9x $0.30 $0.70 159%Bonterra Energy BNE OP AA 32.2 $36.33 $1,169 5.9x 10.8x 8.2x 2.8x 1.8x $6.85 $4.10 $5.76 8.9x 6.3x $23.20 $47.00 34% Cardinal Energy CJ OP AA 56.8 $14.05 $798 8.9x 9.5x 9.1x 0.7x 0.5x $2.14 $1.54 $1.60 9.1x 8.8x $10.10 $15.50 16%Chinook Energy Inc. CKE OP AA 215.1 $1.18 $254 4.4x 17.5x 10.4x -2.7x -0.5x $0.01 $0.07 $0.11 17.3x 10.4x $0.80 $1.50 27%Hawk Exploration HWK'A SP S 45.6 $0.18 $8 2.6x 7.6x 4.3x 6.2x 3.2x $0.15 $0.05 $0.09 4.0x 2.0x $0.40 $0.20 11%Kelt Exploration KEL OP AA 157.7 $7.27 $1,147 9.1x 12.2x 8.4x 1.9x 1.3x $0.93 $0.70 $0.95 10.4x 7.6x $5.08 $10.50 44% Leucrotta Energy LXE OP AA 165.2 $0.91 $150 7.7x 13.5x 8.6x -0.5x 1.0x $0.10 $0.06 $0.10 14.7x 8.8x $0.90 $1.25 37%Long Run Exploration LRE SP AA 193.5 $0.73 $141 2.7x 4.7x 6.1x 5.0x 6.7x $1.85 $0.72 $0.54 1.0x 1.4x ($0.90) $1.10 51% Marquee Energy MQL OP AA 120.3 $0.55 $66 3.1x 3.2x 3.3x 2.0x 2.6x $0.33 $0.24 $0.23 2.3x 2.4x $0.90 $0.85 55%NuVista Energy NVA SP AA 138.7 $7.10 $985 9.6x 8.6x 8.8x 2.3x 2.6x $0.81 $1.01 $0.99 7.0x 7.2x $4.86 $8.50 20% Painted Pony Petroleum PPY SP AA 99.5 $6.54 $651 8.7x 15.9x 9.3x 1.7x 1.8x $0.97 $0.40 $0.74 16.5x 8.8x $5.80 $7.00 7%Perpetual Energy PMT OP AA 150.1 $1.20 $180 4.5x 6.3x 5.7x 4.9x 4.8x $0.52 $0.15 $0.19 8.2x 6.4x $2.50 $1.50 25% Pinecliff Energy PNE OP AA 233.5 $1.30 $303 7.2x 12.9x 9.0x 0.8x 0.5x $0.18 $0.11 $0.15 12.3x 8.4x $0.80 $2.25 73% Raging River Exploration RRX OP AA 196.5 $8.32 $1,634 6.4x 10.7x 6.9x 0.7x 0.4x $1.19 $0.81 $1.25 10.3x 6.7x $7.20 $11.00 32%Rock Energy RE OP AA 46.0 $2.14 $98 2.8x 3.7x 2.6x 1.1x 0.8x $1.60 $0.84 $1.26 2.5x 1.7x $6.30 $4.25 99%Storm Resources SRX OP AA 111.3 $4.39 $489 8.7x 8.6x 7.6x 1.2x 1.4x $0.41 $0.59 $0.70 7.5x 6.3x $2.80 $5.75 31% Surge Energy SGY OP AA 217.7 $2.79 $607 5.6x 5.5x 4.8x 2.8x 2.4x $1.25 $0.83 $0.94 3.4x 3.0x $4.37 $4.75 81%Tamarack Valley Energy TVE OP AA 77.9 $3.80 $296 4.0x 7.1x 5.7x 2.1x 1.8x $1.05 $0.71 $0.93 5.4x 4.1x $2.40 $5.00 32% Torc Oil & Gas TOG OP AA 113.2 $9.09 $1,029 5.6x 9.2x 8.0x 2.1x 1.8x $1.97 $1.19 $1.36 7.6x 6.7x $7.50 $11.00 27%Toro Oil & Gas TOO OP AA 55.5 $0.45 $25 23.1x 51.5x 3.7x -2.0x 0.5x $0.04 $0.01 $0.13 31.3x 3.4x $0.60 $0.90 100%Tourmaline Oil TOU OP AA 209.9 $38.20 $8,019 9.9x 9.2x 6.7x 1.4x 1.0x $4.58 $4.60 $6.33 8.3x 6.0x $29.09 $50.00 31%
** Risk Ratings: BA = Below Average; A = Average; AA = Above Average; S = Speculative * Rating System: OP = Outperform; SP = Sector Perform; UP = Underperform; T = Tender; UR = Under Review; R = Restricted
EV/DACF Net Debt/Cash Flow
CFPS - FDP/CFPS
12-MthPrice
Share Stock Market CNAVKyle Preston Stock Stock Risk O/S Price Cap. est. est. est. est.
Sym. Rating Rating (Mln) 03/17 (Mln) 2013 2014 2015 2014e 2015e 2013 2014 2015 2014e 2015e 2014a Target Return ∆
Oil & GasARC Resources Ltd. ARX OP AA 338.9 $22.49 7,621.2 10.3x 7.1x 9.3x 1.0x 1.0x $2.76 $3.54 $2.61 6.3x 8.6x $24.95 $28.00 30%Baytex Energy Corp. BTE R R R R R R R R R R R R R R R R R RBonavista Energy Corporation BNP OP AA 215.9 $6.80 1,468.2 7.2x 4.3x 5.9x 2.0x 2.9x $2.40 $2.66 $1.85 2.6x 3.7x $11.48 $10.00 53% Canadian Natural Resources CNQ OP AA 1091.8 $38.48 42,013.9 5.9x 5.7x 9.6x 1.5x 3.0x $6.86 $8.76 $5.24 4.7x 7.3x $46.73 $46.00 22% Canadian Oil Sands COS UP AA 485.0 $9.57 4,641.5 7.9x 5.7x 14.1x 1.8x 5.7x $2.78 $2.28 $0.78 4.2x 12.3x $10.34 $8.00 -14% Cenovus Energy CVE SP AA 824.6 $21.47 17,704.2 6.9x 5.6x 8.0x 1.3x 1.7x $4.77 $4.59 $2.93 4.7x 7.3x $21.01 $23.00 12%Crescent Point Energy Corp. CPG OP AA 446.5 $29.47 13,158.7 9.1x 5.1x 9.1x 1.4x 2.2x $5.29 $5.71 $4.11 5.2x 7.2x $35.76 $35.00 28%Encana Corp.* ECA SP AA 828.1 $11.31 9,365.9 5.8x 4.4x 6.5x 2.6x 3.2x $3.50 $3.96 $2.34 2.9x 4.8x $15.20 $14.00 26% Enerplus Corporation ERF OP AA 204.8 $13.00 2,662.6 5.4x 4.4x 6.1x 1.6x 2.1x $3.74 $4.14 $2.89 3.1x 4.5x $15.09 $15.00 20% Freehold Royalties FRU SP AA 74.9 $18.07 1,353.8 13.2x 10.4x 15.3x 1.0x 1.4x $1.78 $1.95 $1.24 9.3x 14.6x n/a $20.00 17% Lightstream Resources Ltd. LTS UP AA 197.3 $0.94 185.5 4.7x 2.6x 5.4x 2.8x 7.8x $3.37 $2.86 $1.00 0.3x 0.9x $4.97 $0.50 -47%MEG Energy MEG OP AA 223.8 $20.75 4,644.8 25.3x 8.2x 13.8x 4.9x 11.8x $1.15 $3.46 $1.60 6.0x 13.0x $30.95 $28.00 35%Northern Blizzard Resources Inc. NBZ OP AA 103.4 $7.64 789.9 -0.4x 4.5x 5.6x 1.7x 1.9x n/a $2.55 $1.73 3.0x 4.4x $11.72 $9.00 30% Penn West Exploration PWT UP AA 497.2 $2.18 1083.8 7.5x 3.2x 7.5x 2.6x 7.6x $1.89 $1.89 $0.72 1.2x 3.0x $4.35 $2.00 -6%Pengrowth Energy Corporation PGF SP AA 533.4 $3.94 2101.7 6.7x 6.7x 7.8x 3.8x 4.5x $1.08 $1.06 $0.83 3.7x 4.7x $4.76 $4.50 20% Peyto Exploration & Development Corp. PEY OP AA 153.7 $35.03 5,383.8 10.9x 9.5x 10.2x 1.6x 2.0x $2.94 $4.18 $3.97 8.4x 8.8x $38.99 $42.00 24% PrairieSky Royalty PSK OP AA 149.3 $29.70 4,435.1 0.0x 27.6x 22.6x -0.4x -0.5x $1.48 $1.21 $1.30 24.5x 22.9x n/a $34.00 19%Suncor Energy SU SP AA 1456.9 $36.16 52,682.2 5.6x 6.0x 8.9x 0.8x 1.5x $6.26 $6.18 $4.24 5.8x 8.5x $40.21 $40.00 14%Trilogy Energy TET SP AA 125.9 $7.93 998.0 12.4x 4.8x 9.8x 2.1x 5.5x $2.41 $2.75 $1.06 2.9x 7.5x $8.38 $7.00 -12%Vermilion Energy Inc. VET OP AA 107.3 $55.25 5928.5 8.8x 8.6x 10.9x 1.6x 2.0x $6.51 $7.51 $5.65 7.4x 9.8x $54.96 $65.00 22%
*In USD ** Risk Ratings: BA = Below Average; A = Average; AA = Above Average; S = Speculative * Rating System: OP = Outperform; SP = Sector Perform; UP = Underperform; T = Tender; UR = Under Review; R = Restricted
12-MthPrice
Net Debt/Cash Flow
CFPS - FDP/CFPS
EV/DACF
Brian Milne Share Share Market NAVStock Stock Risk O/S Price Cap. est. est. est. est. est. est.Sym. Rating Rating (Mln) 03/17 (Mln) 2014 2015 2016 2015e 2016e 2014 2015 2016 2015e 2016e 2014e Target Return D
Junior Oil & GasAdvantage Oil & Gas AAV OP AA 169.4 $6.27 $1,062 8.0x 8.6x 6.2x 1.9x 1.5x $0.95 $0.85 $1.23 7.4x 5.1x $2.12 $7.50 20%Arsenal Energy AEI OP AA 17.9 $3.39 $61 3.4x 3.0x 2.4x 1.7x 1.3x $3.22 $2.04 $2.44 1.7x 1.4x $8.22 $7.50 125% Cequence Energy CQE OP AA 211.0 $0.89 $188 2.9x 5.0x 4.1x 1.8x 1.8x $0.33 $0.22 $0.29 4.1x 3.0x $1.70 $1.50 69% Crew Energy CR SP AA 140.1 $4.95 $693 4.5x 8.2x 6.3x 2.3x 2.4x $1.40 $0.73 $1.01 6.8x 4.9x $3.80 $7.00 41% DeeThree Exploration DTX OP AA 88.8 $5.69 $505 4.4x 5.2x 4.4x 1.5x 1.5x $2.00 $1.46 $1.79 3.9x 3.2x $7.44 $7.50 32% Delphi Energy DEE OP AA 155.5 $1.15 $179 5.9x 6.0x 5.5x 3.7x 3.3x $0.41 $0.30 $0.33 3.8x 3.5x $2.63 $1.75 52% Legacy Oil + Gas LEG OP AA 199.3 $1.64 $327 4.0x 5.3x 4.3x 5.3x 4.1x $1.83 $0.84 $1.12 1.9x 1.5x $4.95 $3.00 83% LGX Oil + Gas OIL UP AA 88.7 $0.07 $6 8.2x 9.8x 4.9x 12.9x 5.4x $0.08 $0.04 $0.10 2.0x 0.7x $0.29 $0.15 114% Manitok Energy MEI OP AA 65.8 $0.75 $49 4.6x 3.2x 3.5x 2.2x 2.5x $0.64 $0.54 $0.53 1.4x 1.4x $2.37 $1.25 67% RMP Energy RMP OP AA 122.1 $3.64 $444 6.0x 4.8x 3.6x 1.0x 0.8x $1.33 $0.88 $1.20 4.1x 3.0x $3.25 $6.50 79% Spartan Energy SPE OP AA 264.3 $2.65 $700 9.6x 9.8x 6.5x 1.2x 0.7x $0.36 $0.28 $0.42 9.6x 6.3x $2.55 $3.25 23% Spyglass Resources SGL SP AA 127.8 $0.28 $36 5.2x 5.2x 5.5x 6.2x 6.4x $0.46 $0.22 $0.19 1.3x 1.4x $1.86 $0.40 43% Strategic Oil & Gas Ltd. SOG UP AA 542.3 $0.14 $73 13.6x 7.5x 9.3x 5.0x 9.1x $0.03 $0.02 $0.02 5.7x 6.5x $0.34 $0.15 11% Twin Butte Energy TBE OP AA 357.7 $0.77 $275 2.6x 3.0x 4.4x 1.8x 2.8x $0.57 $0.47 $0.33 1.6x 2.4x $1.21 $1.50 110% Whiltecap Resources WCP OP AA 253.3 $13.14 $3,328 7.9x 9.0x 8.0x 1.8x 1.5x $2.03 $1.64 $1.85 8.0x 7.1x $7.80 $17.50 39% Zargon Energy ZAR UP AA 30.3 $2.75 $83 5.3x 4.5x 3.7x 3.2x 2.5x $1.65 $1.17 $1.43 2.3x 1.9x $4.20 $3.00 22%
Risk Ratings: BA = Below Average; A = Average; AA = Above Average; S = Speculative * Rating System: OP = Outperform; SP = Sector Perform; UP = Underperform; T = Tender; UR = Under Review; R = Restricted
EV/DACF Net Debt/Cash Flow
CFPS - FDP/CFPS
12-MthPrice
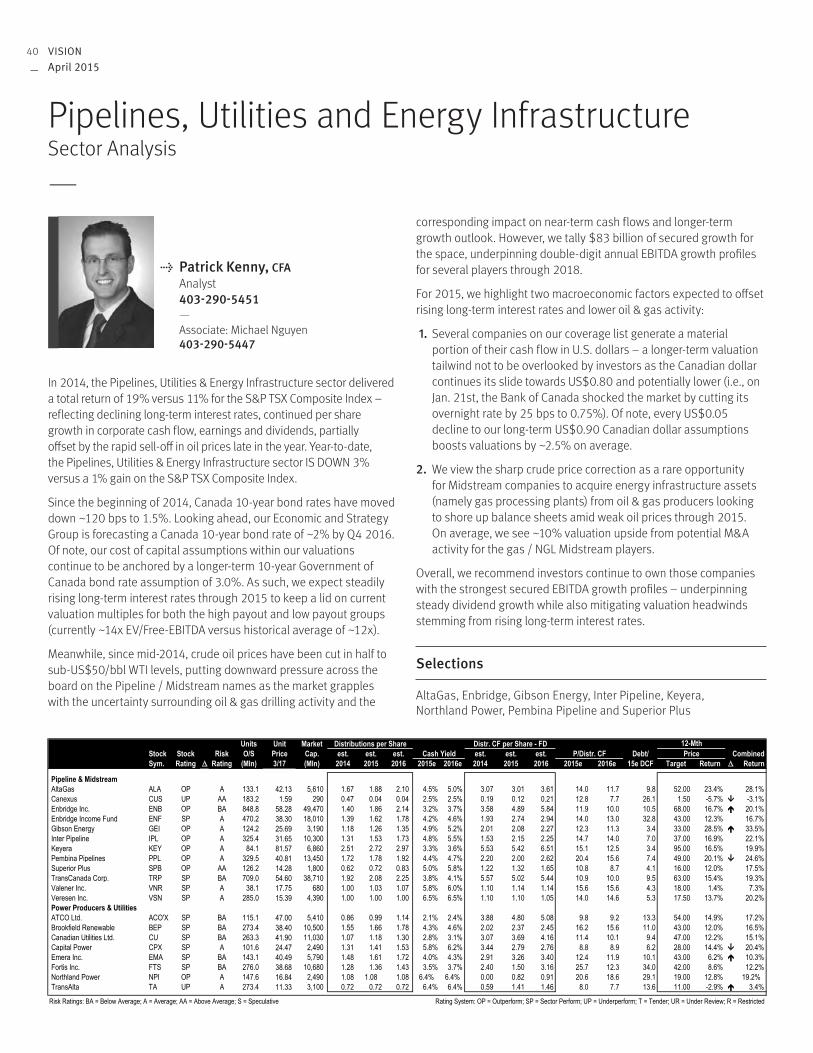
VISIONApril 2015
40
—
In 2014, the Pipelines, Utilities & Energy Infrastructure sector delivered a total return of 19% versus 11% for the S&P TSX Composite Index – reflecting declining long-term interest rates, continued per share growth in corporate cash flow, earnings and dividends, partially offset by the rapid sell-off in oil prices late in the year . Year-to-date, the Pipelines, Utilities & Energy Infrastructure sector IS DOWN 3% versus a 1% gain on the S&P TSX Composite Index .
Since the beginning of 2014, Canada 10-year bond rates have moved down ~120 bps to 1 .5% . Looking ahead, our Economic and Strategy Group is forecasting a Canada 10-year bond rate of ~2% by Q4 2016 . Of note, our cost of capital assumptions within our valuations continue to be anchored by a longer-term 10-year Government of Canada bond rate assumption of 3 .0% . As such, we expect steadily rising long-term interest rates through 2015 to keep a lid on current valuation multiples for both the high payout and low payout groups (currently ~14x EV/Free-EBITDA versus historical average of ~12x) .
Meanwhile, since mid-2014, crude oil prices have been cut in half to sub-US$50/bbl WTI levels, putting downward pressure across the board on the Pipeline / Midstream names as the market grapples with the uncertainty surrounding oil & gas drilling activity and the
corresponding impact on near-term cash flows and longer-term growth outlook . However, we tally $83 billion of secured growth for the space, underpinning double-digit annual EBITDA growth profiles for several players through 2018 .
For 2015, we highlight two macroeconomic factors expected to offset rising long-term interest rates and lower oil & gas activity:
1. Several companies on our coverage list generate a material portion of their cash flow in U .S . dollars – a longer-term valuation tailwind not to be overlooked by investors as the Canadian dollar continues its slide towards US$0 .80 and potentially lower (i .e ., on Jan . 21st, the Bank of Canada shocked the market by cutting its overnight rate by 25 bps to 0 .75%) . Of note, every US$0 .05 decline to our long-term US$0 .90 Canadian dollar assumptions boosts valuations by ~2 .5% on average .
2. We view the sharp crude price correction as a rare opportunity for Midstream companies to acquire energy infrastructure assets (namely gas processing plants) from oil & gas producers looking to shore up balance sheets amid weak oil prices through 2015 . On average, we see ~10% valuation upside from potential M&A activity for the gas / NGL Midstream players .
Overall, we recommend investors continue to own those companies with the strongest secured EBITDA growth profiles – underpinning steady dividend growth while also mitigating valuation headwinds stemming from rising long-term interest rates .
Selections
AltaGas, Enbridge, Gibson Energy, Inter Pipeline, Keyera, Northland Power, Pembina Pipeline and Superior Plus
Pipelines, Utilities and Energy InfrastructureSector Analysis
—
Patrick Kenny, CFA Analyst 403-290-5451 —
Associate: Michael Nguyen 403-290-5447
Units Unit MarketStock Stock Risk O/S Price Cap. est. est. est. est. est. est. Debt/ Price CombinedSym. Rating Rating (Mln) 3/17 (Mln) 2014 2015 2016 2015e 2016e 2014 2015 2016 2015e 2016e 15e DCF Target Return Return
Pipeline & MidstreamAltaGas ALA OP A 133.1 42.13 5,610 1.67 1.88 2.10 4.5% 5.0% 3.07 3.01 3.61 14.0 11.7 9.8 52.00 23.4% 28.1%Canexus CUS UP AA 183.2 1.59 290 0.47 0.04 0.04 2.5% 2.5% 0.19 0.12 0.21 12.8 7.7 26.1 1.50 -5.7% -3.1%Enbridge Inc. ENB OP BA 848.8 58.28 49,470 1.40 1.86 2.14 3.2% 3.7% 3.58 4.89 5.84 11.9 10.0 10.5 68.00 16.7% 20.1%Enbridge Income Fund ENF SP A 470.2 38.30 18,010 1.39 1.62 1.78 4.2% 4.6% 1.93 2.74 2.94 14.0 13.0 32.8 43.00 12.3% 16.7%Gibson Energy GEI OP A 124.2 25.69 3,190 1.18 1.26 1.35 4.9% 5.2% 2.01 2.08 2.27 12.3 11.3 3.4 33.00 28.5% 33.5%Inter Pipeline IPL OP A 325.4 31.65 10,300 1.31 1.53 1.73 4.8% 5.5% 1.53 2.15 2.25 14.7 14.0 7.0 37.00 16.9% 22.1%Keyera KEY OP A 84.1 81.57 6,860 2.51 2.72 2.97 3.3% 3.6% 5.53 5.42 6.51 15.1 12.5 3.4 95.00 16.5% 19.9%Pembina Pipelines PPL OP A 329.5 40.81 13,450 1.72 1.78 1.92 4.4% 4.7% 2.20 2.00 2.62 20.4 15.6 7.4 49.00 20.1% 24.6%Superior Plus SPB OP AA 126.2 14.28 1,800 0.62 0.72 0.83 5.0% 5.8% 1.22 1.32 1.65 10.8 8.7 4.1 16.00 12.0% 17.5%TransCanada Corp. TRP SP BA 709.0 54.60 38,710 1.92 2.08 2.25 3.8% 4.1% 5.57 5.02 5.44 10.9 10.0 9.5 63.00 15.4% 19.3%Valener Inc. VNR SP A 38.1 17.75 680 1.00 1.03 1.07 5.8% 6.0% 1.10 1.14 1.14 15.6 15.6 4.3 18.00 1.4% 7.3%Veresen Inc. VSN SP A 285.0 15.39 4,390 1.00 1.00 1.00 6.5% 6.5% 1.10 1.10 1.05 14.0 14.6 5.3 17.50 13.7% 20.2%Power Producers & UtilitiesATCO Ltd. ACO'X SP BA 115.1 47.00 5,410 0.86 0.99 1.14 2.1% 2.4% 3.88 4.80 5.08 9.8 9.2 13.3 54.00 14.9% 17.2%Brookfield Renewable BEP SP BA 273.4 38.40 10,500 1.55 1.66 1.78 4.3% 4.6% 2.02 2.37 2.45 16.2 15.6 11.0 43.00 12.0% 16.5%Canadian Utilities Ltd. CU SP BA 263.3 41.90 11,030 1.07 1.18 1.30 2.8% 3.1% 3.07 3.69 4.16 11.4 10.1 9.4 47.00 12.2% 15.1%Capital Power CPX SP A 101.6 24.47 2,490 1.31 1.41 1.53 5.8% 6.2% 3.44 2.79 2.76 8.8 8.9 6.2 28.00 14.4% 20.4%Emera Inc. EMA SP BA 143.1 40.49 5,790 1.48 1.61 1.72 4.0% 4.3% 2.91 3.26 3.40 12.4 11.9 10.1 43.00 6.2% 10.3%Fortis Inc. FTS SP BA 276.0 38.68 10,680 1.28 1.36 1.43 3.5% 3.7% 2.40 1.50 3.16 25.7 12.3 34.0 42.00 8.6% 12.2%Northland Power NPI OP A 147.6 16.84 2,490 1.08 1.08 1.08 6.4% 6.4% 0.00 0.82 0.91 20.6 18.6 29.1 19.00 12.8% 19.2%TransAlta TA UP A 273.4 11.33 3,100 0.72 0.72 0.72 6.4% 6.4% 0.59 1.41 1.46 8.0 7.7 13.6 11.00 -2.9% 3.4%
Risk Ratings: BA = Below Average; A = Average; AA = Above Average; S = Speculative Rating System: OP = Outperform; SP = Sector Perform; UP = Underperform; T = Tender; UR = Under Review; R = Restricted
12-MthDistributions per Share Distr. CF per Share - FDCash Yield P/Distr. CF

41
—
Top Pick Updates
Element Financial Corp. (EFN: TSX)
EFN reported strong Q4 2014 results, up 19% q/q, driven by robust organic growth in earning assets of 9% q/q, as well as very strong syndication fee revenue . We are forecasting enviable asset growth of 38% in 2015, for which there is excellent visibility, given robust origination pipelines across all four of EFN’s verticals .
Management indicated that its recently-updated operating EPS guidance for 2015 (increased to $1 .05 from $0 .99) was based entirely on recent currency hedging transactions made possible by the predictable earnings flow from the Fleet and Rail businesses, which accounted for 68% of EFN’s earnings assets at the end of 2014 .
Although this outlook is in line with our forecasts, we see significant upside to our estimates coming from:
Launch of managed and advisory funds consisting of transportation lease assets for investors
Further portfolio purchases that will be funded entirely through additional debt;
Growth in fleet management services fees;
Integration synergies in excess of the $25 million already identified; and,
Additional investment grade credit ratings, which could reduce funding costs by 10-15 bps in 2015 .
Callidus Capital Corp. (CBL: TSX)
We are abundantly aware of the recent wave of negative speculation surrounding the credit quality of the loan portfolio and the outlook for growth and financing .
Based on our most recent conversation with management in early March, we believe that CBL’s underwriting and monitoring processes are rigorous and that our loan loss assumptions remain prudent . We are not concerned by recent speculation surrounding six to seven specific loans, particularly worries that certain borrowers are undergoing CCAA restructuring, or that collateral values are lower than loan amounts . We note that debtor-in-possession financing is a normal part of CBL’s business and there is no evidence of collateral deficiency .
In addition to growth areas such as i) expanded U .S . markets, ii) increased average loan size, iii) extended loan duration, iv) origination of Callidus Lite product, and v) portfolio acquisitions, recent regulatory changes (Basel III and Dodd-Frank) have created a market opportunity of about $4 billion versus management’s estimate of $1 billion at the time of the IPO . We forecast loan growth of 36% in each of the next two years . We believe the company’s access to capital, whether credit facilities from major financial institutions or bridge facilities from Catalyst Funds, will support CBL’s growth profile .
Selections
Element Financial, Equitable Group, Home Capital Group and Callidus
Financials (Diversified)Sector Analysis
—
Shubha Rahman Khan Analyst 416-869-6425 —
Associate: Jaeme Gloyn 416-869-8042
Shares Stock Last FDEPS Book Value per Share 12-MthStock Stock Risk O/S Price Year Last est. est. P/E Last est. est. P/BV Div. PriceSym. Rating Rating (Mln) 3/17 Reported FY FY1 FY2 FY1 FY2 Quarter FY1 FY2 FY1 FY2 % Target
BankingCanadian Western Bank CWB SP AA 80.4 26.27 Oct-14 2.59 2.73 3.01 9.6 8.7 19.99 22.76 24.90 1.2 1.1 3.0% 30.00 Laurentian Bank LB SP BA 28.9 47.72 Oct-14 5.31 5.58 5.90 8.5 8.1 46.34 48.55 52.08 1.0 0.9 4.4% 50.00 Mortgage FinanceEquitable Group EQB OP A 15.4 55.46 Dec-14 5.82 6.53 7.29 8.5 7.6 40.90 40.90 47.62 1.4 1.2 1.2% 71.00 First National Financial FN SP A 60.0 20.51 Dec-14 2.24 2.04 2.31 10.1 8.9 5.90 5.90 6.76 3.5 3.0 7.3% 22.00Genworth MI Canada MIC SP A 93.1 29.45 Dec-14 3.87 3.71 3.33 7.9 8.8 35.12 37.25 39.02 0.8 0.8 4.8% 35.00Home Capital Group HCG OP A 70.1 40.24 Dec-14 4.10 4.44 5.03 9.1 8.0 20.67 24.23 28.23 1.7 1.4 1.6% 53.00MCAN Mortgage Corp. MKP SP BA 20.8 13.35 Dec-14 1.44 1.22 1.33 10.9 10.0 10.83 10.83 11.04 1.2 1.2 8.4% 15.00Equipment FinanceElement Financial EFN OP A 264.1 15.93 Dec-14 0.34 0.55 1.05 29.1 15.2 9.34 9.34 10.37 1.7 1.5 0.0% 21.00 Callidus Capital Corp. CBL OP AA 48.7 17.47 Dec-13 -0.27 0.76 1.95 23.1 8.9 8.13 9.16 11.19 1.9 1.6 0.0% 33.00Securities ExchangeTMX Group X SP BA 54.3 53.65 Dec-14 3.84 3.87 4.37 13.9 12.3 53.55 55.82 58.60 1.0 0.9 3.0% 52.00InsuranceIntact Financial Corp. IFC SP BA 131.5 94.38 Dec-14 5.68 6.20 6.56 15.2 14.4 37.75 41.93 46.38 2.3 2.0 2.0% 93.00Asset ManagersAGF Management Ltd. AGF'B SP AA 85.7 8.00 Nov-14 0.68 0.64 0.70 12.5 11.4 10.85 11.08 11.56 0.7 0.7 13.5% 8.50CI Financial Corp CIX SP BA 281.7 35.55 Dec-14 1.83 2.18 2.50 16.3 14.2 6.75 7.65 8.88 4.6 4.0 3.4% 36.00Fiera Capital Corp. FSZ OP A 68.0 13.39 Dec-13 0.72 0.87 0.99 15.4 13.5 6.28 6.35 6.88 2.1 1.9 3.6% 16.00Gluskin Sheff + Assoc. GS OP AA 31.7 26.26 Jun-14 1.87 2.83 3.27 9.3 8.0 4.14 4.15 4.75 6.3 5.5 3.0% 36.00IGM Financial Inc. IGM SP BA 251.5 44.84 Dec-14 3.27 3.33 3.70 13.5 12.1 18.65 19.76 21.24 2.3 2.1 4.8% 48.00
Rating System: OP = Outperform; SP = Sector Perform; UP = Underperform; T=Tender; UR= Under Review; R=RestrictedRisk Rating: BA = Below Average, A = Average, AA = Above Average, S = Speculative

VISIONApril 2015
42
—
Sun Life Financial – SLF Investor Day 2015 – MFS Under Pressure, but Undervalued
On March 5, 2015, SLF held its 2015 investor day, during which the company articulated its medium-term strategies and financial targets . In light of the investor day, we found it fitting to renew our sum-of-the-parts (SOTP) valuation for SLF . Based on our SOTP valuation, we raise our price target on SLF and upgrade its rating to Outperform . Our Outperform thesis rests on two pillars: (1) we believe that the market currently undervalues MFS and (2) shareholders will benefit from improved cash flow to the holding company .
1. We believe that the market currently undervalues MFS. After completing our SOTP valuation, we find that the implied market EV/EBITDA valuation for Massachusetts Financial Services Company (MFS) is below the vast majority of its North American asset manager peers .
While MFS will have much weaker sales than in the recent past and still faces a major strategic challenge in adapting to intensified investor preferences for passively managed products, we believe the company will maintain, and perhaps improve, its market presence in actively managed fund management . This market may shrink in relative size, but it will still generate very attractive earnings . We expect MFS to earn its way through its strategic challenge, and quite handily at that . On that basis, we believe the valuation for MFS will increase over the next three years .
2. Improved Holding Company Cash Flow. At investor day, management stated that SLF’s cash position at the holding company was Cdn$1 .8 billion with Cdn$500 million ear-marked as a necessary cash cushion on a continuing basis; meaning that SLF has a net cash surplus of Cdn$1 .3 billion . More importantly, over the next three years, we forecast additional cash flow of $500 million per year to SLF from its two franchises, Sun Life Assurance Company (SLA) and MFS .
The broader insight is that SLF possesses two franchises which are, for the first time since at least the mid-2000s, simultaneously throwing off excess cash at a fairly reliable clip . Not only does this give SLF the financial flexibility to consider adding to its franchises via acquisitions but also to repurchase common shares and increase its dividend . We believe SLF has entered a new era in which return of capital to shareholders becomes a reliable basis for owning the stock .
No Outperform rating is risk-free, however . We think the greatest risk comes from the stability of SLF’s life insurance contract liabilities . Over the past couple of years, SLF has performed fairly well on this dimension with net assumption changes remaining within ± 1% of the company’s insurance contract liabilities . But lapse and mortality experience have fallen short of SLF’s assumptions of late and a sizable re-statement of the company’s insurance contract liabilities (greater than 3%) could sap investor confidence in SLF’s balance sheet and, therefore, valuation . In addition, an equity market shock would pressure SLF’s asset management revenues and would send SLF’s beta well above 1 .0x in a down-market . In short, SLF could underperform if the equity market crashes .
Financial ServicesSector Analysis
—
Peter Routledge Analyst 416-869-7442 —
Associates: Parham Fini, J .D ./MBA,BBA: 416-869-6515 Paul Poon: 416-507-8006
Shares Stock Last FDEPS Book Value per Share 12-MthStock Stock Risk O/S Price Year Last est. est. P/E Last est. est. P/BV Div. PriceSym. Rating Rating (Mln) 3/17 Reported FY FY1 FY2 FY1 FY2 Quarter FY1 FY2 FY1 FY2 % Target
BankingBank of Montreal BMO SP BA 647.0 76.25 Oct-14 6.59 6.81 7.15 11.2 10.7 52.98 56.58 61.40 1.3 1.2 4.2% 82.00 Bank of Nova Scotia BNS SP BA 1,210.0 63.33 Oct-14 5.46 5.55 5.93 11.4 10.7 38.75 41.56 45.26 1.5 1.4 4.3% 70.00CIBC CM SP BA 397.0 91.81 Oct-14 8.94 9.34 9.46 9.8 9.7 45.99 52.11 57.44 1.8 1.6 4.6% 100.00National Bank NA NR A 329.0 46.26 Oct-14 4.45 4.62 5.02 10.0 9.2 26.33 28.35 31.01 1.6 1.5 4.3% N/ARoyal Bank of Canada RY SP BA 1,443.0 76.16 Oct-14 6.19 6.54 6.81 11.6 11.2 35.59 38.54 43.55 2.0 1.7 4.0% 82.00 Toronto-Dominion Bank TD OP BA 1,849.0 54.12 Oct-14 4.27 4.52 4.97 12.0 10.9 31.60 34.09 37.63 1.6 1.4 3.8% 59.00InsuranceGreat-West Lifeco GWO SP BA 997.0 36.67 Dec-14 2.33 2.54 2.75 14.4 13.3 16.80 19.67 21.85 1.9 1.7 3.6% 38.00Industrial Alliance IAG SP A 101.0 42.28 Dec-14 3.55 3.97 3.93 10.6 10.8 33.83 37.39 40.52 1.1 1.0 2.6% 44.00Manulife Financial MFC OP A 1,970.0 21.83 Dec-14 1.43 1.80 2.09 12.1 10.4 16.42 18.79 20.56 1.2 1.1 2.8% 26.00Sun Life Financial SLF OP A 613.0 40.49 Dec-14 2.79 2.86 3.37 14.2 12.0 26.87 29.59 31.97 1.4 1.3 3.6% 45.00 Rating System: OP = Outperform; SP = Sector Perform; UP = Underperform; T = Tender; UR = Under Review; R = Restricted; NR = Not RatedRisk Rating: BA = Below Average; A = Average; AA = Above Average; S = Speculative

43
—
Alimentation Couche-Tard Inc.
Q3 F2015 Results: Driving future growth through acquisitions
Q3/F15 adj. EPS of $0.51 vs. NBF at $0.61 and consensus at $0.56; lastyear was $0.31. The EPS shortfall relative to NBF was largely due to lower than forecast fuel gross profit and a higher than expected effective tax rate; merchandising performance and SG&A were better than forecast . Total revenue was $9 .1 billion vs . NBF at $10 .9 billion; last year was $11 .1 billion . Total merchandise gross profit was $784 million vs . NBF at $781 million; last year was also $781 million . Fuel and Other gross profit was $747 million vs . NBF at $827 million; last year was $670 million . Total consolidated gross profit was $1 .53 billion vs . NBF at $1 .61 billion; last year was $1 .45 billion . SG&A was $979 million vs . NBF at $1,007 million; last year was $1,038 million . The effective tax rate was 24 .5% vs . NBF at 18 .0%; the higher effective tax rate reduced EPS by ~$0 .05 relative to forecast .
Thoughts and comments. The Pantry acquisition closed on March 16, 2015 . Synergy guidance is up to $85 million over 24 months vs . our prior estimate of $100 million over 30 months . While synergies have historically exceeded management’s initial target, we revised our forecast to be in line with guidance for now .Management also indicated additional benefits related to growing in-store sales and fuel volumes . Our model reflects The Pantry growing at levels in line with Couche-Tard’s U .S . business . ATD delivered SFR acquisition synergies of $19 million vs . NBF at $32 million; the synergy run-rate is ~$138 million . Management updated its synergy guidance as follows: close to $200 million by the end of 2015 from $150-$200 million previously; our forecast is $220 million by Q3/F16 .
Tuck-in acquisitions. On March 16, 2015, ATD indicated that it acquired 21 corporate stores, 151 dealer fuel supply agreements and five development properties from Cinco J, Inc ., Tiger Tote Food Stores, Inc . and their affiliates . We estimate annualized EPS potential of ~$0 .01 . Prior to announcing Q3/F15 results, ATD indicated an agreement to buy A/S Dansk Shell’s retail, commercial fuel and aviation business (in Denmark) . ATD will acquire 315 retail sites (140 are owned, 115 are leased and 60 are dealer-owned) . We estimate annualized EPS potential of ~$0 .04 . We estimate a purchase price for both deals to be $600-$800 million .
Maintain Outperform rating; price target is Cdn$55 from Cdn$52. We value ATD at 21 .5x our blended F16/F17 EPS (adj . for F/X) .
Merchandising and Consumer ProductsSector Analysis
—
Vishal Shreedhar Analyst 416-869-7930 —
Associate: Ryan Li 416-869-6767
Shares Stock Last FDEPS EBITDA Debt/ 12-MthStock Stock Risk O/S Price Year (A) est. est. P/E (A) est. est. EV/EBITDA Book Total PriceSym. Rating Rating (Mln) 03/17 Reported Last FY FY1 FY2 FY1 FY2 Last FY FY1 FY2 FY1 FY2 Value Capital Target
General MerchandiseCanadian Tire CTC.a OP A 78.4 129.99 Dec-14 7.96 8.13 9.08 16.0 14.3 1,376 1,448 1,541 8.8 8.3 61.89 0.35 141.00 Dollarama DOL OP BA 132.7 63.93 Feb-14 1.74 2.15 2.45 29.7 26.1 402 452 504 20.1 18.0 5.25 0.46 58.00
Specialty StoresCouche Tard ATD.b OP AA 565.9 49.24 Apr-14 1.35 1.74 1.78 22.1 21.6 1,591 1,867 2,003 12.2 11.3 6.99 0.23 55.00 Rona RON OP A 115.9 15.90 Dec-14 0.71 0.92 1.04 17.3 15.3 235 260 274 7.8 7.3 13.90 0.10 15.50
ApparelGildan GIL OP A 121.9 59.14 Dec-14 2.94 3.08 3.81 19.2 15.5 465 535 639 14.1 11.8 15.44 0.14 80.00
Drug StoresJean Coutu PJC.a SP A 186.8 26.68 Mar-14 1.09 1.19 1.30 22.4 20.5 335 338 351 14.5 13.9 5.28 (0.10) 27.00
GrocersEmpire Company EMP.a SP BA 92.4 88.90 May-14 4.90 5.68 6.64 15.7 13.4 1,053 1,329 1,419 8.0 7.5 64.08 0.30 99.00 Loblaw L OP BA 412.5 62.82 Dec-14 3.18 3.44 3.99 18.3 15.8 3,237 3,591 3,838 10.3 9.7 30.98 0.47 69.00 Metro MRU OP BA 254.4 34.59 Sep-14 1.71 1.93 2.06 17.9 16.8 788 829 855 12.0 11.6 10.59 0.30 34.00
Food ManufacturerSaputo SAP SP A 396.9 35.04 Mar-14 1.44 1.51 1.72 23.2 20.4 1,020 1,104 1,201 14.4 13.2 8.14 0.38 36.00
Rating System: OP = Outperform; SP = Sector Perform; UP = Underperform; T = Tender; UR = Under Review; R = Restricted u=US dollarsRisk Rating: BA = Below Average; A = Average; AA = Above Average; S = Speculative

VISIONApril 2015
44
—
Intertain Group - becoming largest online bingo provider with up to $1.2 billion buy of Gamesys B2C Assets : Intertain has been busy since its debut on the TSX on Feb . 18, 2014, with the acquisitions of Mandalay Media on July 14 and Vera&John on Dec . 23 . In announcing on Feb . 5, 2015 its purchase of player databases, registered trademarks, certain unregistered intellectual property, the domain names and certain commercial agreements relating to Gamesys’ key brands – Jackpotjoy UK, Starspins, Botemania, Jackpotjoy Sweden, Jackpotjoy social slots and Starspins social slots – Intertain has 1) materially accelerated its M&A strategy by several years, 2) established itself as the #1 player in online bingo which is the key vertical that management had begun targeting since last fall, and 3) significantly elevated itself into the big leagues of online gaming with a tripling of its pro forma 2014 revenues & adjusted EBITDA . The deal is expected to close during the week of April 6 . For the 12 months ended Sept . 30, 2014, the assets being bought produced £130 .9 million ($250 .0 million) in Gross Win and £67 .0 million ($128 .0 million) of EBITDA for a margin of 51 .2% – that’s before the U .K .’s point-of-consumption
tax introduced on Dec . 1 . Intertain will make an initial payment of £425 .8 million ($813 .4 million) consisting of £369 .0 million ($704 .9 million) in cash and £56 .8 million ($108 .4 million) in shares (7,361,365 million at $14 .73) . We estimate that aggregate earnouts to be paid over the next five years could reach £205 .1 million ($391 .8 million) . Besides issuing shares to Gamesys shareholders, Intertain is financing the deal with a further issuance of stock to the public (32 .2 million equity subscription receipts priced at $15 .00) and the sale of debt (US$352 .5 million senior secured credit facilities) . Following material adjustments to our forecast to reflect the purchase of the Gamesys assets whose key elements we outlined in a detailed note dated Feb . 26, we raised our target to $25 based on both the updated 2015E metric in our DCF and EV/EBITDA of just under 10 .5x 2016E . We believe there’s room for further upside to our target, as we reflect on the benefits the company derives from a weakening Canadian dollar, its newly-improved industry positioning with considerably greater liquidity in the online bingo vertical, and the context of relative peer growth profiles and related valuations . We rate Intertain as Outperform with an Above Average risk rating .
Selections
Intertain, NYX Gaming, Sirius XM Canada, Quebecor, Cineplex, Rogers, TELUS, Cogeco Cable
Communications Media and TelecomSector Analysis
—
Adam Shine, cfa Analyst 514-879-2302 —
Associates: Peter Stusio, MBA, CFA .: 514-879-2564
Kevin Krishnaratne, B .Eng, MBA, CFA .: 416-869-6585
Shares Stock Last FDEPS EBITDA ($mln) ND/ 12-MthStock Stock Risk O/S Price Year (A) est. est. P/E (A) est. est. Book Total PriceSym. Rating Rating (Mln) 3/17 Reported Last FY FY1 FY2 FY1 FY2 Last FY FY1 FY2 FY1 FY2 Value Capital Target
Broadcasting & EntertainmentCineplex Inc. CGX OP BA 63.0 49.32 Dec-14 1.24 1.78 2.22 27.7 22.2 201.0 251.0 290.6 13.9 11.9 11.61 0.30 50.00Corus Entertainment Inc. CJR.b SP AA 86.2 21.18 Aug-14 1.76 1.86 2.00 11.4 10.6 289.6 300.5 305.1 8.8 8.3 15.44 0.40 21.50DHX Media DHX.b SP AA 123.1 9.08 Jun-14 0.10 0.30 0.43 29.3 21.1 37.0 84.5 106.5 14.7 12.3 1.96 0.52 9.50NYX Gaming NYX OP AA 33.8 4.20 NA (0.02) 0.06 0.22 NM 19.1 5.7 8.2 16.4 14.8 7.3 1.04 -0.04 6.00Sirius XM Canada Holdings XSR OP AA 128.1 5.66 Aug-14 0.16 0.25 0.36 22.6 15.7 79.0 82.0 91.3 10.9 9.6 NM NM 7.00The Intertain Group Limited IT OP AA 72.3 15.20 Dec-14 (0.22) 1.29 1.98 10.2 7.7 20.1 125.9 193.6 8.8 6.7 5.60 0.19 25.00
TVA Group Inc. TVA.b SP AA 23.8 5.66 Dec-14 0.02 (0.06) 0.35 NM 16.2 34.1 37.7 59.5 9.1 5.9 10.86 0.41 6.50Printing & PublishingSupremex Inc. SXP SP AA 28.8 3.60 Dec-14 0.39 0.40 0.41 9.0 8.8 26.6 26.5 26.6 4.4 4.0 2.10 0.26 4.00
Thomson Reuters TRI SP A 803.2 51.55 Dec-14 1.95 2.10 2.35 19.2 17.2 3448.0 3544.0 3765.0 11.2 10.5 17.65 0.33 50.00Torstar Corporation TS.b SP AA 80.2 6.70 Dec-14 0.58 0.56 0.40 12.0 16.8 101.7 91.7 74.3 2.9 3.6 10.81 NM 7.00Transcontinental Inc. TCL.a SP AA 78.1 17.50 Oct-14 2.16 2.20 2.22 8.0 7.9 360.4 370.2 362.2 4.5 4.3 10.71 0.35 18.00
Advertising & MarketingAimia Inc. AIM SP AA 172.0 13.06 Dec-14 1.05 0.53 0.63 24.6 20.7 316.5 230.9 252.4 11.8 10.4 2.61 0.05 13.50
TelecommunicationsBCE Inc. BCE SP A 840.3 53.79 Dec-14 3.18 3.34 3.54 16.1 15.2 8303.0 8547.2 8809.2 8.1 7.6 13.02 0.43 52.00Cogeco Cable CCA OP A 49.1 73.14 Aug-14 4.26 5.18 5.34 14.1 13.7 893.4 923.6 952.5 6.6 6.1 31.88 0.65 80.00Manitoba Telecom Services Inc. MBT SP A 77.6 23.57 Dec-14 1.69 1.52 1.45 15.5 16.3 565.9 582.3 596.8 5.4 5.3 13.56 0.31 26.00Quebecor Inc. QBR.b OP AA 122.9 33.88 Dec-14 1.64 1.94 2.29 17.5 14.8 1398.9 1476.9 1564.9 6.3 5.8 8.17 0.73 41.00
Rogers Communications Inc. RCI.b OP A 514.7 43.50 Dec-14 2.96 3.10 3.22 14.0 13.5 5019.0 5158.0 5284.1 7.1 6.9 10.64 0.55 50.00Shaw Communications SJR.b UP A 462.5 28.89 Aug-14 1.78 1.95 1.95 14.8 14.8 2262.0 2378.6 2439.5 8.0 7.7 11.05 0.52 28.50Telus Corp. T OP A 615.0 42.59 Dec-14 2.31 2.57 2.89 16.6 14.7 4216.0 4440.2 4678.0 7.9 7.2 12.16 0.56 46.00TeraGo TGO OP AA 11.6 6.19 Dec-14 0.35 (0.34) 0.05 N/A N/A 18.4 16.2 16.4 5.5 5.2 3.54 0.33 8.00
Communications EquipmentCOM DEV CDV OP AA 76.5 4.26 Oct-14 0.13 0.19 0.29 22.4 14.7 29.4 36.8 48.2 8.5 6.9 2.52 0.09 5.25
Risk Rating: BA = Below Average; A = Average; AA = Above Average; S = Speculative TRI estimates in US$, rest is CAD$.Stock Rating: OP = Outperform; SP = Sector Perform; UP = Underperform; T=Tender; UR= Under Review; R=Restricted
EV/EBITDA

45
—
REITs Give Back Some Gains as Further Move Higher Stunted by Macro Volatility. Select REIT equities (large cap / defensive names) have rebounded from a late 2014 sell-off with more trading near their NAVs (some are now at premiums – particularly the large-cap retail REITs), although the sector on the whole is still trading well below all-time highs and intrinsic value . On the back of a fragile global economic outlook and downward pressures in Energy prices, many yield names on the TSX have enjoyed a sector rotation – with funds flow out of commodity stocks and into Telecom / Real Estate / Pipelines . The 10-year government of Canada bond yield accordingly has pulled back to ~1 .5% (versus 2 .8% in September 2013) . Currently, the REIT yield spreads on average are ~400 bps (vs . ~310 bps five-year average), which is sitting at the highest levels in recent history .
CBRE Real Estate Marketview Q4 2014: Despite macro headwinds and declining oil prices the Canadian office market showed signs of strength in 2014, on the back of relatively robust corporate sentiment and leasing fundamentals . 3 .2 million sq . ft . of new supply was delivered in Q4/14 – a notable completion was RBC WaterPark Place . Net absorption improved slightly in 2014 at 3 .0 million sq . ft . vs . -1 .8 million sq . ft . in 2013 . In the near term, Alberta remains a key focus given fears over a sustained lower oil price environment which could lead to further cuts in capital spending and reduced headcounts . However, weakness may be partially offset by
higher demand derived from financial services firms, particularly in Toronto .
On the industrial front, fundamentals remain healthy . In Q4/14, 6 .9 million sq . ft of new supply came online which satiated pent-up demand in many of Canada’s markets . While a depreciated Cdn$ has piqued investors’ interests on the hope for bolstered strength in the manufacturing and logistics segments, it is still unclear how long this will take and to what extent the currency tailwinds will persist .
When looking at the Multi-Family sector immigration / population growth have supported demand while new supply of rental product has been limited . That being said, construction starts averaged 10,239 units annually from 2009-2013; however, 2014 was a record year with construction of 15,581 units commencing . Vacancy nonetheless remains very low for this asset class and as homeownership becomes increasingly unattainable given hot residential real estate markets this is likely to persist .
Selections
AHIP (HOT .un: TSX, Outperform, $12 .50 target), Crombie REIT (CRR .un: TSX; Outperform; $15 .25 target), Milestone Apartments REIT (MST .un: TSX; Outperform, $15 .00 target) and Pure-Multi Family REIT (RUF .u: TSX .V; Outperform, US$5 .75 target) .
Real EstateSector Analysis
—
Matt Kornack Analyst 416-507-8104 —
Associate: Dawoon Chung 416-507-8102
Trevor Johnson, cfa Analyst 416-869-8511 —
Associates: Endri Leno: 416-869-8047 Kyle Stanley: 416-507-8108
Units Unit FD FFO P/FFO NetREIT Stock Risk O/S Price (A) est. est. (A) est. est. Current (A) est. est. (A) est. est. Asset Combined
Sym. Rating Rating (Mln) 3/17 2013 2014 2015 2013 2014 2015 Annualized 2013 2014 2015 2013 2014 2015 Value Target Return Return (1)
Retail
Choice Properties REIT CHP.un OP ↔ BA 395 11.29 0.32 0.65 0.65 0.0% 5.8% 5.8% 5.8% 0.43 0.91 0.95 - 12.4 11.8 12.00 12.00 6.3% 12.0%
Crombie REIT CRR.un OP ↔ BA 131 13.09 0.89 0.89 0.89 6.8% 6.8% 6.8% 6.8% 1.10 1.10 1.15 11.9 11.9 11.4 14.85 15.25 16.5% 23.3%First Capital Realty FCR OP ↔ BA 226 19.57 0.84 0.85 0.86 4.3% 4.3% 4.4% 4.4% 1.03 1.04 1.08 19.0 18.9 18.1 18.00 21.00 7.3% 11.7%Partners REIT PAR.un R R R R R R R R R R R R R R R R R R R R ROffice & DiversifiedAllied Properties REIT AP.un OP ↔ BA 78 38.12 1.36 1.41 1.46 3.6% 3.7% 3.8% 3.8% 1.94 2.09 2.27 19.7 18.3 16.8 35.60 42.00 10.2% 13.9%Artis REIT AX.un OP ↔ BA 138 14.75 1.08 1.08 1.08 7.3% 7.3% 7.3% 7.3% 1.40 1.42 1.52 10.5 10.4 9.7 16.80 16.75 13.6% 20.9%BTB REIT BTB.un SP ↔ BA 34 4.85 0.40 0.41 0.42 8.2% 8.5% 8.7% 8.7% 0.45 0.48 0.53 10.7 10.2 9.2 5.00 5.00 3.1% 11.5%Cominar REIT CUF.un OP ↔ BA 167 19.05 1.44 1.46 1.47 7.6% 7.6% 7.7% 7.7% 1.77 1.85 1.91 10.8 10.3 10.0 20.65 22.50 18.1% 25.7%DREAM Office REIT D.un SP ↔ BA 107 25.98 2.23 2.24 2.24 8.6% 8.6% 8.6% 8.6% 2.86 2.86 2.86 9.1 9.1 9.1 32.25 29.00 11.6% 20.2%H&R REIT HR.un OP ↔ BA 297 22.64 1.35 1.35 1.35 6.0% 6.0% 6.0% 6.0% 1.78 1.85 1.83 12.7 12.2 12.4 25.15 26.25 15.9% 21.9%Melcor REIT MR.un SP ↔ A 11 8.26 0.45 0.68 0.68 5.4% 8.2% 8.2% 8.2% 0.85 0.87 0.96 9.7 9.5 8.6 9.50 9.50 15.0% 23.2%
NorthWest H.P. REIT NWH.un R R R R R R R R R R R R R R R R R R R R RSlate Office REIT SOT.un SP ↔ A 20 8.10 0.75 0.75 0.75 9.3% 9.3% 9.3% 9.3% 0.96 0.79 0.94 8.4 10.3 8.6 9.45 8.50 4.9% 14.2%IndustrialDREAM Industrial REIT DIR.un OP ↔ BA 77 8.80 0.70 0.70 0.70 8.0% 8.0% 8.0% 8.0% 0.91 0.95 0.99 9.6 9.3 8.9 10.20 10.50 19.3% 27.3%Pure Industrial REIT AAR.un OP ↔ BA 193 4.99 0.31 0.31 0.31 6.3% 6.3% 6.3% 6.3% 0.39 0.36 0.41 12.7 13.8 12.2 4.75 5.25 5.2% 11.5%WPT Industrial REIT WIR'U-T OP ↔ A 19 11.42u 0.48u 0.70u 0.70u 4.2% 6.1% 6.1% 6.1% 0.66u 1.00u 1.11u 17.3 11.4 10.3 12.50u 12.50u 9.5% 15.6%Seniors HousingAmica Mature Lifestyles ACC SP ↔ BA 31 7.53 0.42 0.42 0.42 5.6% 5.6% 5.6% 5.6% 0.42 0.48 0.58 17.9 15.7 13.0 8.50 8.00 6.2% 11.8%HotelsAmerican Hotel Income Properties HOT.un OP ↔ BA 24 11.05 0.77u 0.90u 0.90u 7.0% 8.1% 8.1% 8.1% 0.70u 0.87u 1.19u 15.8 12.8 9.3 12.50 12.50 13.1% 21.3%Temple Hotels TPH SP ↔ AA 41 1.94 0.54 0.54 0.30 27.8% 27.8% 15.5% 15.5% 0.78 0.49 0.59 2.5 4.0 3.3 2.00 2.00 3.1% 30.9%
Multi-ResBoardwalk REIT BEI.un SP ↔ A 52 58.69 1.98 2.04 2.04 3.4% 3.5% 3.5% 3.5% 3.21 3.36 3.62 18.3 17.5 16.2 65.60 68.00 15.9% 19.3%CAP REIT CAR.un R R R R R R R R R R R R R R R R R R R R RInterRent REIT IIP.un OP ↔ BA 72 6.09 0.19 0.20 0.22 3.1% 3.3% 3.6% 3.6% 0.34 0.32 0.43 17.7 18.8 14.2 6.85 7.25 19.0% 22.4%Milestone Apartments REIT MST.un OP ↔ BA 62 13.76 0.53 0.65 0.65 3.9% 4.7% 4.7% 4.7% - 0.99 1.06 - 13.9 13.0 12.60 15.00 9.0% 13.7%Pure Multi-family REIT RUFu.V OP ↔ A 35 5.06u 0.37u 0.38u 0.38u 7.2% 7.4% 7.4% 7.4% 0.37u 0.46u 0.48u 13.7 10.9 10.6 5.75u 5.75u 13.6% 21.0%
True North Apartment REIT TN.un SP ↔ A 33 8.06 0.56 0.70 0.70 6.9% 8.7% 8.7% 8.7% 0.71 0.69 0.71 11.3 11.7 11.3 9.20 9.00 11.7% 20.3%InternationalDREAM Global REIT DRG.un SP ↔ BA 111 9.31 0.80 0.80 0.80 8.6% 8.6% 8.6% 8.6% 0.84 0.87 0.88 11.1 10.7 10.6 9.85 10.25 10.1% 18.7%Inovalis REIT INO.un OP ↔ A 17 9.01 - 0.83 0.83 - 9.2% 9.2% 9.2% - 0.86 0.96 - 10.5 9.4 9.50 10.25 13.8% 22.9%Asset ManagementTricon Capital Group TCN OP ↔ A 90 10.99 0.24 0.24 0.24 2.2% 2.2% 2.2% 2.2% 0.70 (2) 0.64 (2) 0.82 (2) 15.6 17.3 13.4 NA 10.50 -4.5% -2.3%
Stock Rating: OP = Outperform; SP = Sector Perform; UP = Underperform; T = Tender; UR = Under Review; R = Restricted Risk Rating System: BA = Below Average; A = Average; AA = Above Average; S = Speculative(1) Combined return = price return + 12 months rolling forward distribution return; For Amica, distribution is quarterly. u = US Dollars(2) Figures represent DCPS
Matt Kornack, Trevor Johnson Distributions per Unit 12-MthPrice
Cash Yield

VISIONApril 2015
46
—
Metals and Mining: Precious MetalsSector Analysis
—
Shane Nagle, CFA Analyst 416-869-7936 —
Associates: Raj Ray, MBA: 416-507-8105 Gregory Doyle: 416-869-6538
Adam Melnyk Analyst 604-643-2864 —
Associate: David Lee 416-869-8045
Steve Parsons, P.Eng Analyst 416-869-6766 —
Associate: Don DeMarco 416-869-7572
(All dollar amounts in Canadian dollars unless noted)
Weaker currency outlook blows in cost tailwinds for producers... it’s about time
Tailwinds of any kind have been unmistakably absent for gold miners, notably since gold prices peaked in late 2011... Adding insult to injury, the ensuing period saw producers face persistent headwinds, with labour costs for capital programs and operations pressured by industry congestion, stronger currencies in mining jurisdictions and elevated prices for key consumables such as diesel . Add to that limited flexibility in mine plans and the effect has been uninspiring production, declining cash balances, project deferrals to protect balance sheets and with that, visibility for production declines .
… However, the outlook has since changed with currency declines and weaker energy prices offering up some gusty tailwinds for many, but not all producers in our coverage universe. Currency depreciation has been playing out since Q3/13, led by the Argentinean peso and Brazilian real . Yet for these examples, we have not observed lower operating costs as most of the benefit was eroded by elevated in-country inflation .
Currency declines have since extended to other key jurisdictions, such as Canada, Australia and the Euro zone . Importantly, with in-country labour inflation benign, producers in these jurisdictions should see direct cost relief via lower labour costs . The Canadian dollar, for example, has posted record depreciation in the past 24 months, and at ~US$0 .78/Cdn$1, is the most competitive in over a decade .
In selecting our overall Top Picks, we take a longer-term view. We prefer long-term visibility for low-cost production growth, solid operating track records, proven development expertise with an ability to reduce/defer capex, as well as a robust balance sheet .
We continue to have a constructive outlook for high quality development companies. We contend that our outlook for contemporaneous production declines among certain senior and intermediate producers support a constructive thesis for development companies as M&A will be needed . With that, mines/projects that offer scale, scalability and favourable development logistics should be in focus . In other words, attributes that ease acquisition and subsequent execution risk for the acquirer . Recent proposed acquisitions of Probe, Rio Alto and Newstrike Capital provides support to this thesis .
Selections
Royalties: Royal Gold (RGLD: NDQ, Outperform, US$87 target)
Producers: Yamana (YRI: TSX, Outperform, $8 .50 target), B2Gold (BTO: TSX, Outperform, $3 .15 target), Claude Resources (CRJ: TSX, Outperform, $0 .80)
Developers: MAG Silver (MAG: TSX, Outperform, $11 target)

47
—
Metals and Mining: Precious MetalsSector Analysis
—Stock 12-Mth FDEPS FDCFPS Net
Stock Risk Shares Price Price (A) est. est. (A) est. est. Asset Company Symbol Rating Rating O/S (Mln) 3/17 Target Analyst Last FY FY1 FY2 FY1 FY2 Last FY FY1 FY2 FY1 FY2 Value P/NAVPS
Senior Producers (>1 mln oz production)Agnico-Eagle Mines Ltd. AEM-T SP AA 215.2 35.90$ 44.00$ Parsons 0.83u 0.83u 0.55u 40.1x 61.4x 2.87u 3.18u 3.36u 10.5x 10.0x 20.80 1.7xKinross Gold Corporation K-T OP AA 1144.6 2.86$ 4.80$ Parsons 0.28u 0.10u (0.06)u 26.0x - 0.94u 0.84u 0.76u 3.2x 3.5x 3.21 0.9xYamana Gold Inc YRI-T OP AA 934.0 4.48$ 8.50$ Parsons 0.37u 0.01u 0.07u 309.6x 59.7x 0.94u 0.75u 0.74u 5.6x 5.7x 6.45 0.7x
Royalty CompaniesFranco-Nevada Corp FNV-T SP AA 156.2 61.43$ 74.00$ Nagle 1.19u 0.93u 1.00u 51.7x 48.1x 2.00u 2.06u 2.15u 23.4x 22.4x 42.16 1.5xOsisko Gold Royalties Ltd. OR-T SP AA 98.7 16.79$ 18.00$ Nagle (0.04)c 0.20c 0.30c 84.2x 56.4x 0.12c 0.28c 0.42c 59.7x 40.4x 13.04 1.3xRoyal Gold Inc RGLD-O OP AA 64.7 63.19$ 87.00$ Nagle 0.99u 0.68u 1.60u 92.9x 39.5x 2.51u 2.66u 3.33u 23.8x 19.0x 55.82 1.1xSilver Wheaton Corp SLW-T R R R R R Nagle R R R R R R R R R R R RSandstorm Gold Ltd SSL-T SP S 118.2 3.76$ 5.25$ Nagle 0.22u 0.08u 0.04u 36.8x 73.6x 0.36u 0.32u 0.30u 9.2x 9.8x 3.25 1.2x
Intermediate Producers ( >250 Koz production)Alamos Gold Inc. AGI-T OP AA 127.4 7.06$ 10.00$ Melnyk (0.02)u (0.09)u 0.03u n/a n/a 0.40u 0.24u 0.38u 22.5x 14.4x 9.54 0.7xAuRico Gold Inc AUQ-T SP AA 250.0 3.55$ 5.30$ Melnyk (0.15)u (0.17)u (0.07)u n/a n/a 0.26u 0.21u 0.38u 13.2x 7.3x 4.26 0.8xB2Gold Corp. BTO-T OP AA 917.7 1.86$ 3.15$ Parsons 0.11u 0.01u 0.10u 158.3x 17.4x 0.23u 0.16u 0.21u 10.8x 8.1x 2.12 0.9xDetour Gold Corp DGC-T OP S 170.6 10.44$ 15.25$ Parsons n/a n/a n/a n/a n/a n/a n/a n/a n/a n/a 15.47 0.7xIAMGOLD Corporation IMG-T SP AA 376.8 2.37$ 3.50$ Parsons 0.35u 0.12u (0.15)u 19.0x - 0.82u 0.89u 0.44u 2.7x 5.4x 3.13 0.8xNew Gold Inc NGD-T SP AA 503.9 4.38$ 5.60$ Parsons 0.14u 0.07u 0.04u 62.4x 108.2x 0.56u 0.61u 0.54u 6.7x 7.5x 4.04 1.1xOceanaGold Corp. OGC-T OP AA 301.5 2.55$ 3.65$ Ray (0.16)u 0.33u 0.19u 7.0x - 0.85u 0.77u 0.59u 3.0x 3.4x 2.89 0.9x
Junior Producers (<250 Koz production)Alacer Gold Corp ASR-T SP AA 290.4 2.40$ 3.05$ Parsons (1.44)u 0.27u 0.07u 8.2x 30.2x 0.43u 0.41u 0.29u 5.5x 7.6x 3.03 0.8xClaude Resource Corp. CRJ-T OP S 188.2 0.59$ 0.80$ Melnyk (0.48)c 0.04c 0.04c 16.2x 16.1x 0.08c 0.16c 0.13c 3.7x 4.4x 0.78 0.8xGolden Star Resources Ltd GSC-T SP AA 259.5 0.33$ 0.60$ Ray (1.08)u (0.28)u (0.02)u - - 0.08u 0.03u 0.15u 27.9x 2.6x 0.50 0.6xKirkland Lake Gold Inc KGI-T OP S 80.0 5.81$ 6.00$ Ray (0.28)u 0.36u 0.44u 23.7x 10.6x 0.42u 1.00u 0.94u 6.2x 4.2x 5.47 1.1xLake Shore Gold Corp LSG-T OP AA 435.4 1.05$ 1.50$ Ray (0.55)c 0.08c 0.13c 14.1x 8.3x 0.15c 0.27c 0.26c 4.0x 4.1x 0.98 1.1xLuna Gold Corp. LGC-T UP S 141.5 0.27$ 0.20$ Nagle 0.08u (0.09)u (0.23)u n/a n/a 0.22u 0.06u 0.04u 3.3x 5.1x 0.25 1.1xRichmont Mines Inc. RIC-T OP S 57.9 3.75$ 5.00$ Melnyk 0.21c 0.06c 0.12c n/a n/a 0.76c 0.38c 0.51c 10.0x 7.3x 5.37 0.7xRio Alto Mining Ltd. RIO-T T AA 332.6 3.16$ 3.70$ Parsons 0.17u 0.24u 0.21u 13.0x 14.7x 0.34u 0.37u 0.29u 8.5x 10.7x 2.47 1.3xSEMAFO Inc. SMF-T OP AA 277.4 3.99$ 5.00$ Ray 0.10u 0.09u 0.21u 37.1x 14.3x 0.35u 0.39u 0.44u 8.5x 6.7x 2.89 1.4xSilverCrest Mines Inc. SVL-T OP S 118.8 1.40$ 2.20$ Nagle 0.11u 0.03u 0.02u 36.5x 54.8x 0.21u 0.06u 0.14u 18.3x 7.8x 2.59 0.5xTimmins Gold Corp. TMM-T R R R R R Nagle R R R R R R R R R R R R
DevelopersBelo Sun Mining Corp BSX-T OP S 266.1 0.20$ 0.35$ Nagle n/a n/a n/a n/a n/a n/a n/a n/a n/a n/a 0.54 0.4xDalradian Resources Inc. DNA-T OP S 152.8 0.93$ 1.30$ Melnyk n/a n/a n/a n/a n/a n/a n/a n/a n/a n/a 1.94 0.5xKaminak Gold Corp. KAM-V OP S 143.7 0.81$ 1.40$ Melnyk n/a n/a n/a n/a n/a n/a n/a n/a n/a n/a 1.50 0.5xLydian International Ltd. LYD-T OP S 186.9 0.51$ 1.30$ Nagle n/a n/a n/a n/a n/a n/a n/a n/a n/a n/a 1.65 0.3xMAG Silver Corp MAG-T OP S 68.7 7.61$ 11.00$ Nagle n/a n/a n/a n/a n/a n/a n/a n/a n/a n/a 10.10 0.8xMagellan Minerals Ltd MNM-V SP S 138.5 0.07$ 0.15$ Nagle n/a n/a n/a n/a n/a n/a n/a n/a n/a n/a 0.19 0.4xMidas Gold Inc. MAX-T OP S 141.7 0.40$ 0.90$ Melnyk n/a n/a n/a n/a n/a n/a n/a n/a n/a n/a 1.14 0.4xMountain Province Diamonds Inc. MPV-T OP S 115.1 4.13$ 6.35$ Ray n/a n/a n/a n/a n/a n/a n/a n/a n/a n/a 6.35 0.7xNewstrike Capital Inc. NES-V R R R R R Melnyk R R R R R R R R R R R ROrezone Gold Corp. ORE-T OP S 95.7 0.44$ 0.95$ Melnyk n/a n/a n/a n/a n/a n/a n/a n/a n/a n/a 1.25 0.3xRomarco Minerals Inc R-T OP S 1242.6 0.49$ 0.80$ Parsons - - - - - -- -- -- - - 0.83 0.6xRubicon Minerals Corp RMX-T OP S 370.2 1.22$ 2.00$ Parsons 0.00c (0.05)c (0.05)c - - 0.00c (0.05)c (0.04)c - - 1.77 0.7xPilot Gold Corp. PLG-T OP S 103.0 0.80$ 1.90$ Nagle n/a n/a n/a n/a n/a n/a n/a n/a n/a n/a 1.85 0.4xSeabridge Gold Inc. SEA-T R R R R R Ray R R R R R R R R R R R RTrue Gold Mining Inc. TGM-T OP S 398.8 0.19$ 0.55$ Ray n/a n/a n/a n/a n/a n/a n/a n/a n/a n/a 0.67 0.3x
OtherSprott Resource Corp. SCP-T SP AA 97.9 0.93$ 1.70$ DeMarco n/a n/a n/a n/a n/a n/a n/a n/a n/a n/a 200.30 0.5x
Rating System: OP = Outperform; SP = Sector Perform; UP = Underperform; T = Tender; UR = Under Review; R = Restricted u = US dollars; c = Canadian dollarsRisk Rating: BA = Below Average; A = Average; AA = Above Average; S = Speculative
P/CFP/E

VISIONApril 2015
48
—
(All dollar amounts in Canadian dollars unless noted)
Maintaining Our Near-Term Cautious Outlook, But Potential Supply Deficits Could Provide Longer-Term Price Support
Slowdown in the Chinese and Global economy will continue to weigh on commodity prices throughout H1/15. Our near-term outlook for base metals remains cautious as 2014 clearly marked an end to the rapid Chinese urbanization/commodity super-cycle . Indeed, Chinese Manufacturing PMI continues to border contraction territory with a print of 49 .9 in February, albeit up slightly from 49 .8 for the month prior . The country’s factory sector has shown some resilience year-to-date and is at least partially attributable to ongoing infrastructure stimulus aided by the People’s Bank of China (PBoC) maintaining low interest rates and lowering reserve ratio requirements within the country’s banking sector . As this phase of seemingly unlimited demand for commodities draws to an end, the market has demonstrated significant concern with what demand will look like in a more consumer-driven Chinese economy, exacerbated by the recent reduction in the World Bank’s global growth forecast to 3 .0% for 2015 from its previous projection of 3 .4% in June . As such, we continue to expect soft demand for base metals, particularly copper through the first half of the year .
Long-term outlook remains intact for copper, nickel and zinc as market fundamentals become more prevalent in price determination. With impartial demand for commodities out of China in recent years, metal prices have deviated from valuations implied by underlying market fundamentals . With the anticipated slowdown in Chinese GDP growth (NBF estimates 6 .5% in 2015, down from 7 .4% in 2014) and its government’s shift in emphasis toward reform over
short-term expansion, we contend that supply/demand factors will once again weigh more prominently in determining fair value . Looking forward, we expect this to translate into improved support long-term for copper, nickel and zinc given a lack of significant investment in recent years and current commodity prices are well below the incentive price for many large-scale development projects . On the other end of the spectrum, bulk commodities such as iron ore and coking coal are likely to remain oversupplied given expansion of production, particularly out of Australia, where a depreciating domestic currency and lower oil prices have moved the marginal cost of production even lower in recent months .
Lundin Mining Corp. (LUN: TSX) continues to offer the best combination of value, growth and defensiveness. Lundin maintains the strongest balance sheet in our base metals coverage universe with US$175 million of cash and US$1 .0 billion of long-term debt (due in 2020 and 2022) . The company’s shares continue to trade at an attractive EV/2015E CF multiple relative to its peers while benefitting from a stable multi-mine operating base and tangible near-term cash flow growth . Longer term, we see stepwise improvement in free cash flow, backed by comparably less exposure to capital cost increases and commissioning delays .
HudBay Minerals Inc. (HBM: TSX) offers the best growth profile; however, deferral of the Lalor mill expansion and debt refinancing will likely be necessary. With commissioning of the company’s Constancia project underway, we expect 2015 to represent a transformational year for HudBay with ~400% growth in operating cash flow . Although commissioning a new, 80,000 tpd operation is not without risk, softer ore and positive grade reconciliation at Constancia combined with flexible capital requirements at Lalor provide us comfort that, under a typical ramp-up scenario, the company will not be under undue financial stress in 2015 .
Metals and Mining: Base MetalsSector Analysis
—
Shane Nagle, CFA Analyst 416-869-7936 —
Associates: Raj Ray, MBA: 416-507-8105 Gregory Doyle: 416-869-6538
Steve Parsons, P.Eng Analyst 416-869-6766 —
Associate: Don DeMarco 416-869-7572
Stock 12-Mth FDEPS FDCFPS NetStock Risk Shares Price Price (A) est. est. (A) est. est. Asset
Company Symbol Rating Rating O/S (Mln) 3/17 Target Analyst Last FY FY1 FY2 FY1 FY2 Last FY FY1 FY2 FY1 FY2 Value P/NAVPSBase Metals Producers
Copper Mountain Mining Corp. CUM-T SP AA 118.8 1.14$ 1.70$ Parsons 0.11 0.13 0.05 8.9x 23.1x 0.37 0.47 0.31 2.4x 3.6x 3.68 0.3xCapstone Mining Corp CS-T SP AA 382.0 1.15$ 1.75$ Nagle 0.07 -0.13 -0.01 n/a n/a 0.52 0.14 0.40 6.3x 2.2x 2.43 0.5xFirst Quantum Minerals FM-T SP AA 600.5 13.86$ 14.50$ Nagle 1.41 0.27 0.81 39.7x 13.3x 1.86 1.10 2.05 9.9x 5.3x 15.44 0.9xHudBay Minerals HBM-T OP AA 233.6 9.62$ 11.50$ Nagle 0.23 0.66 1.29 14.5x 7.4x 0.07 1.80 2.76 5.3x 3.5x 13.38 0.7xSherritt Int. Corp S-T SP AA 297.0 2.10$ 3.40$ Parsons -0.02 -0.66 -0.55 - - 1.03 0.84 0.84 2.5x 2.5x 4.68 0.4xTaseko Mines Limited TKO-T SP AA 227.6 0.88$ 1.70$ Parsons -0.09 -0.13 -0.18 - - 0.24 0.23 0.20 3.9x 4.4x 3.40 0.3xLundin Mining LUN-T OP AA 718.2 5.11$ 6.75$ Nagle 0.24 0.33 0.45 12.1x 8.9x 0.38 0.96 0.96 4.2x 4.2x 6.34 0.8xTeck Resources TCK'B-T SP AA 576.3 17.27$ 17.50$ Nagle 0.63 1.10 1.34 15.6x 12.9x 3.48 4.12 4.36 4.2x 4.0x 21.92 0.8x
Base Metals Developers and ExplorersPolyMet Mining Corp. POM-T SP S 275.0 1.61$ 1.70$ Parsons -0.04 -0.02 -0.02 - - -0.04 -0.02 -0.02 - - 1.64 1.0x
Rating System: OP = Outperform; SP = Sector Perform; UP = Underperform; T=Tender; UR= Under Review; R=Restricted u = US dollars; c = Canadian dollarsRisk Rating: BA = Below Average; A = Average; AA = Above Average; S = Speculative
P/CFP/E

49
—
Highlights as of March 2015
K-Bro Linen Inc. (KBL: TSX)
Q4 Results Largely in Line. Top line as expected, but modest margin miss: On March 11th KBL reported Q4 revenue of $33 .8 million (vs . $33 .3 million est . & $32 .3 million in Q4/13), EBITDA of $6 .3 million (vs . $6 .9 million est . & $5 .4 million Q4/13) and DCPS of $0 .69 reflecting a 43% payout ratio (vs . $0 .77/39% est . & $0 .58/49% Q4/13) .
Investment Summary: At over 12x forward EV/EBITDA and 15x P/CF, KBL is trading at: 1) record levels versus its historic range; and 2) a ~2x premium versus the average TSX diversified yield equity . An already relatively expensive valuation may constrain upside, but we argue there is still enough total return to justify an Outperform rating, owing to KBL’s: 1) large healthcare opportunities as provinces look to save costs and outsource their linen function; 2) continued earnings momentum, with organic volume growth consistently tracking in the low-single digit range and getting a lift H2/15 as the Regina facility is completed; 3) a favourable backdrop for Canadian hotels, with occupancy expected to keep growing aided by a low Cdn$
and fuel prices; and 4) significant capacity to finance growth . The introduction of our 2016 estimates prompted a target price increase to $55 (was $48) which implies ~13x 2016e EV/EBITDA and ~17x P/CF (was ~12x & ~15x 2014e, respectively); we maintained an Outperform rating .
DH Corp. (DH: TSX)
U.S. Portfolio Continued to Outpace Expectations. A number of positive takeaways following Q4 results, including: 1) the U .S . portfolio again outperformed, generating revs/EBITDA ahead of expectations driven by ongoing uptake of DH’s offering by financial institutions and cross-selling efforts from the HFS acquisition, both themes expected to persist 2015+; 2) top-line contribution from the cheque business remained resilient, as DH combatted underlying volume declines by providing products and enhancements to increase average order value; 3) the domestic lending solutions segment (student loan, registration, collateral, mortgage software) grew revenues, led by favourable recovery services volumes, incentive-based payments from student lending and positive mortgage origination activity . Despite concerns over Canada’s housing market and the impact of depressed commodity price on overall activity levels, we argue DH’s portfolio of financial service businesses is well-positioned to manage headwinds; 4) management remained bullish on retaining its student loan mandate (expires March 2016 followed by two one-year options); and 5) management is targeting 8-10% y/y EBITDA and DCPS growth .
After incorporating our 2016 estimates and applying an unchanged ~12x forward EV/EBITDA and ~15x P/CF valuation, our target increased to $44 (was $39), and we reiterated our Outperform rating .
Special SituationsSector Analysis
—
Trevor Johnson, cfa Analyst 416-869-8511 —
Associates: Endri Leno: 416-869-8047 Kyle Stanley: 416-507-8108
Shares Stock Last FDDCPS EBITDA (mln) Net Y1 Net 12-MthStock Stock Risk O/S Price Quarter (A) est. est. P/DCPS (A) est. est. EV/EBITDA Debt Debt/ PriceSym. Rating Rating (Mln) 3/17 Reported Last FY FY1 FY2 FY1 FY2 Last FY FY1 FY2 FY1 FY2 (Mln) EBITDA Target
Alaris Royalty AD OP A 32.1 31.85 Sep-14 1.47 1.87 2.01 17.0 15.8 43.1 57.6 69.7 18.0 15.4 2.7 0.8 40.00Boyd Group Inc. BYD.UN OP A 16.6 45.40 Sep-14 1.97 2.77 3.63 16.4 12.5 41.4 68.2 87.7 11.8 9.7 87.1 1.0 50.00DH Corp. DH OP A 86.4 39.94 Dec-14 2.61 2.28 2.83 17.5 14.1 352.3 373.9 391.0 11.9 11.3 950.7 2.5 44.00
Exchange Income Corp. EIF OP AA 22.5 21.38 Dec-14 1.59 2.27 2.50 9.4 8.5 94.3 148.2 159.8 6.7 6.6 470.9 3.2 25.00Grenville Strategic Royalty Corp. GRC OP AA 79.2 0.68 Dec-14 0.01 0.04 0.08 15.7 8.4 1.5 7.0 17.2 13.1 6.0 (0.7) 0.0 1.15IBI Group Inc. IBG SP AA 28.9 1.86 Sep-14 (0.06) (0.10) 0.54 nmf 3.4 15.3 25.3 33.0 9.1 6.3 195.8 5.9 2.75K-Bro Linen Inc. KBL OP A 8.0 51.00 Dec-14 2.87 2.89 3.22 17.6 15.8 26.2 29.1 32.7 14.1 12.6 -7.9 0.0 55.00
Liquor Stores N.A. Ltd. LIQ OP AA 27.2 15.06 Dec-14 0.92 1.12 1.36 13.5 11.1 37.9 45.1 53.7 11.7 10.2 92.0 1.7 16.50
Just Energy Group Inc. JE SP AA 146.1 6.12 Dec-14 0.64 0.53 0.58 11.5 10.6 210.3 171.8 189.1 8.6 8.0 574.8 3.3 6.50Medical Facilities Corp. DR SP A 31.3 18.00 Sep-14 1.30u 1.28u 1.28u 12.9 13.0 99.7u 98.1u 100.9u 10.3 10.1 35.9u 0.4 17.00Morneau Shepell Inc. MSI SP BA 48.0 17.05 Dec-14 0.92 1.04 1.10 16.4 15.5 98.9 109.8 123.1 10.3 9.4 302.9 2.3 18.50
Mosaic Capital Corp. M OP AA 8.6 12.39 Sep-14 0.68 0.95 1.53 13.0 8.1 18.0 24.4 36.1 9.9 7.3 5.7 0.2 16.00New Flyer Industries Inc. NFI OP A 55.5 13.90 Sep-14 0.83u 1.03u 0.99u 13.5 14.1 79.1u 88.4u 102.6u 9.9 9.3 164.2u 1.6 14.00Parkland Fuel Corp. PKI OP A 82.1 23.65 Dec-14 1.41 1.85 1.84 12.8 12.8 183.2 260.7 275.0 9.6 8.8 283.9 1.1 25.00Performance Sports Group PSG OP A 44.4 24.38 Nov-14 1.23u 1.21u 1.34u 20.2 18.2 69.1u 112.6u 132.9u 13.7 11.4 422.8u 3.1 26.00Rogers Sugar Inc. RSI SP BA 94.3 4.78 Dec-14 0.36 0.39 0.40 12.3 12.0 61.1 66.0 67.7 10.0 9.8 210.5 3.2 4.50WesternOne Equity WEQ SP AA 38.7 1.05 Dec-14 0.58 0.12 0.22 8.6 4.9 41.6 38.4 35.9 5.7 5.4 210.0 5.5 2.00
Rating System: OP = Outperform; SP = Sector Perform; UP = Underperform; T = Tender; UR = Under Review; R = Restricted u = US DollarsRisk Rating: BA = Below Average; A = Average; AA = Above Average; S = Speculative

VISIONApril 2015
50
—
Mixed Q4 2014 results from our E&C universe
As we approach the end of Q4/14 earnings season, we take a look at the five companies (out of 6) under our Engineering & Construction (E&C) coverage universe that have reported results.
Aecon Group Inc. (ARE: TSX; Outperform, $17.00 target). Aecon finished 2014 on a mixed note with Q4/14 revenues weaker than expected but with stronger profitability . Backlog at the end of 2014 remained healthy at $2 .7 billion and includes a mix of projects supporting margin improvement going forward . While the Energy and Mining revenue declines were anticipated, we believe that Aecon’s large and diversified backlog, limited exposure to Oil & Gas and the fact most of the contract mining work performed in the oil sands is on producing assets reduce the downside risk of lower capital spending in the oil sector .
Canam Group Inc. (CAM: TSX; Outperform, $16.50 target). Our highest conviction name, Canam, reported strong Q4/14 results posting an impressive 36 .2% y/y revenue growth as well as improved margins . Fuelled by large orders, backlog grew 10 .8% q/q to
~$1 billion of which 79% are U .S . contracts . We expect increasing U .S . non-residential construction spending to support backlog and believe that profitability will trend higher in 2015 as competition abates on both sides of the border due to higher activity and a lower Canadian dollar resulting in better pricing .
SNC-Lavalin Group Inc. (SNC: TSX; Outperform, $48.00 target). SNC reported in-line Q4/14 results but announced 2015 guidance that was below expectations . In fact, Kentz and the Power segment will be the main drivers behind the 2015 outlook as Infrastructure & Construction and Environment & Water will continue to struggle . While the current share price reflects this expected performance, we believe that SNC’s assets remain undervalued . Moreover, with the integration of Kentz and most of the restructuring initiatives completed, we expect that SNC will deliver earnings improvements in the near term .
Stantec Inc. (STN: TSX; Sector Perform, $35.00 target). Stantec missed Q4/14 estimates on the back of weak Energy & Resources results due to clients being cautious on project ramp-ups in the current oil environment . However, lower oil prices are not anticipated to materially impact Oil & Gas operations in 2015 given the need to develop energy transportation infrastructure in North America . Moreover, we are encouraged by the turnaround in Buildings after several quarters of negative performance .
Stuart Olson Inc. (SOX: TSX; Sector Perform, $6.00 target). While Q4/14 results were above consensus, we view the bleak 2015 outlook as more concerning . Although Stuart Olson will benefit from a large backlog of ~$2 billion mostly consisting of Buildings and Commercial Systems projects, fewer new opportunities in Alberta’s oil sands will impact Industrial revenues in 2015 . We also anticipate lower Industrial margins in 2015 due to increasing competition .
Special SituationsSector Analysis
—
Leon Aghazarian, M.Sc. Analyst 514-879-2574 —
Associates: Frédéric Tremblay, M .Sc ., CFA: 514-412-0021 Jean-François Bourdon: 514-390-7825
Shares Stock Last 12-MthStock Stock Risk O/S Price Year (A) est. est. P/E (A) est. est. EV/EBITDA Div. Net Debt/ Price
Symbol Rating Rating (Mln) 3/17 Reported Last FY FY1 FY2 FY1 FY2 Last FY FY1 FY2 FY1 FY2 yield FY2 EBITDA Target Special SituationsAecon Group ARE OP AA 56.4 10.88 Dec 14 0.41 1.08 1.18 10.1 9.2 170.2 201.9 209.5 4.6 4.4 3.7% 1.5 17.00
Canam Group CAM OP AA 42.0 12.15 Dec 14 0.70 1.04 1.30 11.7 9.3 78.7 106.0 119.3 7.2 6.4 1.3% 2.1 16.50
Cascades CAS OP AA 94.2 7.21 Dec 14 0.21 0.70 0.78 10.4 9.2 340.0 363.8 384.5 6.3 6.0 2.2% 4.2 9.00Centric Health Corp. CHH OP AA 171.1 0.39 Dec 14 (0.18) (0.10) (0.08) nm nm 28.0 39.5 44.1 8.1 7.3 0.0% 5.0 0.55
Colabor Group GCL SP AA 27.5 0.90 Dec 14 (0.06) 0.03 0.07 31.9 12.1 30.1 30.0 31.9 7.3 6.8 0.0% 6.1 2.25
Domtar Corporation UFS OP AA 65.0 45.64 Dec 14 3.61 3.87 3.80 11.8 12.0 765.0 801.8 808.6 5.2 5.1 3.5% 1.5 50.00Dorel Industries DII.B SP A 32.3 35.19 Dec 14 2.18 2.00 2.48 13.7 11.1 186.5 198.8 214.8 7.2 6.6 4.4% 2.5 37.00
Knight Therapeutics GUD OP A 92.7 9.10 Dec 13 N/A 0.01 0.20 nmf 45.3 N/A (3.9) 10.0 nmf 52.3 0.0% (22.8) 8.00KP Tissue KPT OP A 8.9 16.20 Dec 14 0.41 0.96 1.31 39.8 16.9 121.6 138.1 158.2 8.6 7.5 4.4% 2.0 19.00
MTY Food Group MTY SP A 19.1 35.30 Nov 14 1.42 1.63 1.75 21.6 20.2 42.7 50.2 53.0 13.7 13.0 1.1% 0.3 35.00New Look Eyewear BCI OP AA 13.3 29.08 Dec 14 0.72 0.96 1.08 30.2 27.0 27.0 33.5 35.5 13.5 12.7 2.1% 1.8 30.00
Park Lawn Corporation PLC OP AA 5.8 12.45 Dec 13 0.46 0.44 0.51 28.3 24.6 2.4 3.5 5.0 21.2 14.9 3.7% 0.6 15.00Premium Brands Holdings PBH OP A 22.8 26.79 Dec 14 0.69 1.41 2.03 19.0 13.2 76.1 98.1 111.1 10.2 9.0 5.2% 3.5 30.00
Richelieu Hardware RCH OP A 19.6 61.99 Nov 14 2.63 2.94 3.26 21.1 19.0 77.4 86.4 94.8 13.7 12.5 1.0% (0.3) 65.00SNC-Lavalin Group SNC OP AA 152.5 39.43 Dec 14 8.74 1.69 2.67 15.8 14.8 654.3 630.6 658.1 8.2 7.9 2.5% (2.1) 48.00
Stantec STN SP BA 93.8 31.51 Dec 14 1.74 2.09 2.35 15.1 13.4 294.7 348.0 395.7 8.9 7.9 1.3% 0.4 35.00
Stella-Jones SJ OP A 68.9 40.41 Dec 14 1.50 1.85 2.12 21.9 19.0 176.3 210.1 234.1 15.4 13.8 0.8% 1.9 42.50
Stuart Olson SOX SP AA 26.2 6.14 Dec 14 0.28 0.59 0.92 10.4 6.7 41.7 49.2 55.6 5.7 5.1 7.8% 1.0 6.00
Uni-Sélect UNS OP BA 21.2 43.81 Dec 14 2.60 2.28 2.54 15.0 13.5 111.4 92.2 82.6 7.0 7.8 1.4% 0.0 45.00WSP Global WSP OP A 89.1 37.94 Dec 13 1.47 1.80 2.37 21.1 16.0 180.6 253.9 435.8 10.4 9.4 4.0% 0.6 43.00Rating System: OP = Outperform; SP = Sector Perform; UP = Underperform; T = Tender; UR = Under Review; R = Restricted Risk Rating: BA = Below Average; A = Average; AA = Above Average; S = SpeculativeNote: Dorel data is in USD except stock prices and target prices. KP Tissue: financial data reflects Kruger Products L.P. (in which KP Tissue has a 16.5% interest).
EBITDAFDEPS

51
—
Weak oil prices and low oil prices are two factors that are having a driving impact within a number of our companies under coverage . Interest rates have started to firm in the United States with the rebound starting to take hold, though rates in Canada continue to remain soft . As we noted before, we believe that many of the same trends that were witnessed in 2014 will repeat – and believe investors will continue to favour companies with highly predictable and growing cash flow generation, exposure to U .S . construction markets, solid organic growth opportunities and or dividend growth potential .
Notable highlights within our coverage universe from the past month include:
We increased our target on DIRTT Environmental Solutions (DRT: TSX, Outperform) to $9 .00 following reporting much stronger than anticipated Q4/14 results . After 69% y/y growth in revenues in Q4, we are looking for 30% top-line growth in 2015E; after backing out our assumed changes to CAD/USD exchange and completion of a US$30 million job in 2015E, we are looking for organic growth of only 9% . With growth in new markets and verticals, we believe this growth should continue
well into the future, supporting improved production efficiencies and increases in EBITDA margin . Our target is based on 11x EV/EBITDA on 2016E, a discount to most of DRT’s peer group of innovative builders, which trade at >11x FY1 .
We increased our target on Algonquin Power & Utilities (AQN: TSX, Sector Perform) following reporting Q4/14 results and providing some information related to the associated delay in reporting . While results were strong, there were some modest delays to a number of development projects, though budgeted costs remain stable . With close to 80% of its cash flow in the United States, our estimates move higher with refreshed FX assumptions; with this, we increased our target to $10 .50, based on a DCF at 7 .5%, sum of parts analysis and an EV/EBITDA multiple of 12 .5x our 2016E .
We initiated coverage on Pattern Energy Group (PEGI: NDQ / PEG: TSX, Outperform), a leading wind power operator with global ambitions . PEGI operates a net 1,636 MW of wind power in Canada, the United States and Chile under long-term contracts . With a >10% CAGR on cash flow available for distribution (CAFD), dividends should increase in each of the next few quarters . PEGI has a right of first offer (ROFO) on about 4,500 MW of development assets from its parent company, in North America, South America and Japan . The balance sheet is strong, with about $400 million in cash that can be used to fund growth; however, more dilution is anticipated in the next couple of years . We use a 7 .5% discount rate for our DCF analysis and an 11 .5x adj EV/EBITDA multiple . See our full report titled Wind Powered Yield Co . – A Stable Dividend Growth Story at http://nbfm .ca/en/research/ .
Sustainability and Clean TechSector Analysis
—
Rupert Merer, P. Eng, CFA Analyst 416-869-8008 —
Associates: Jeremy Mersereau, P . Eng, CFA: 416-869-6768 Mark Vernest, CFA: 416-869-7476
Shares Stock LastStock Stock Risk O/S Price Year (A) est. est. (A) est. est. P/S Book Debt/ PriceSym. Rating Rating (Mln) 03/17 Reported Last FY FY1 FY2 FY1 FY2 Last FY FY1 FY2 FY1 FY2 Value Capital Target
Energy TechnologyAlgonquin Power AQN SP A 251 9.19 Dec 14 0.36 0.49 0.50 18.9 18.4 4.35 4.51 4.91 2.0 1.9 7.06 0.47 10.50 Alterra Power AXY SP S 467 0.33 Dec 13 0.02u 0.01u (0.02)u 64.9 nmf 0.14u 0.15u 0.14u 2.5 2.7 0.60u 0.40 0.40Atlantic Power ATP SP AA 122 3.00 Dec 14 (1.89)u (0.59)u (0.54)u nmf nmf 4.70u 4.57u 4.58u 0.7 0.7 7.00u 0.77 2.75u Boralex BLX OP AA 41 12.93 Dec 14 (0.29) 0.27 0.46 47.1 27.8 4.81 4.90 4.31 2.6 3.0 8.60 0.65 17.00Capstone Infrastructure CSE SP A 97 3.46 Dec 14 0.43 0.06 (0.02) 60.2 nmf 4.81 4.58 3.48 0.8 1.0 5.46 0.61 3.75Chemtrade Logistics CHE.un OP A 68 21.02 Dec 14 (0.34) 0.29 1.20 nmf 17.6 19.83 18.51 18.68 1.1 1.1 11.69 0.27 23.00 Conifex Timber Inc. CFF OP AA 21 7.00 Dec 14 0.22 0.99 1.19 7.1 5.9 16.40 19.13 19.93 0.4 0.4 5.70 0.38 10.00DIRTT Environmental Solutions DRT OP S 78 6.69 Dec 14 0.07 0.35 0.41 19.2 16.4 2.40 3.06 3.63 2.2 1.8 1.09 -0.24 9.00 EnerCare ECI OP A 92 14.88 Dec 14 0.34 0.49 0.60 30.1 24.7 5.53 6.02 6.33 2.5 2.3 0.97 0.48 18.00Etrion Corp ETX SP AA 335 0.48 Dec 13 (0.05)u (0.05)u (0.01)u nmf nmf 0.26u 0.15u 0.25u 3.6 2.2 0.14u 0.56 0.55Innergex INE OP AA 99 11.54 Dec 14 0.16 0.23 0.41 50.6 28.4 2.45 2.48 2.93 4.6 3.9 3.02 0.65 14.00Interfor IFP OP AA 72 17.32 Dec 14 0.62 1.55 1.98 11.1 8.8 21.93 26.33 29.40 0.7 0.6 9.60 0.21 25.00 Mason Graphite LLG OP S 87 0.53 Jun 13 (0.12) (0.07) (0.04) nmf nmf 0.00 0.00 0.00 na na 0.26 0.20 1.20Newalta Inc. NAL OP AA 57 14.01 Dec 14 0.94 0.88 1.71 15.8 8.2 13.44 8.26 10.54 1.7 1.3 11.97 0.41 20.00Ovivo Inc (formerly GLV Inc) OVI'A SP S 44 1.41 Mar 14 0.17 (0.09) 0.08 nmf 18.5 14.40 10.49 6.82 0.1 0.2 3.70 0.17 2.50Pattern Energy PEGI-US OP AA 69 26.91u Dec 14 (0.58)u 0.63u 0.76u 48.8 40.2 4.88u 5.34u 5.74u 5.7 5.3 19.40u 0.66 32.00u Progressive Waste Solution BIN-US OP A 112 29.15u Dec 14 1.34u 1.31u 1.68u 25.4 19.7 17.57u 17.30u 18.40u 1.9 1.8 11.41u 0.52 32.00uShawCor SCL OP A 64 33.93 Dec 14 (0.32) 0.56 0.78 60.4 43.3 7.71 6.90 7.70 4.9 4.4 15.63 0.20 52.00TransAlta Renewables RNW SP AA 115 12.76 Dec 14 0.44 0.42 0.50 30.1 25.6 2.14 2.04 2.04 6.3 6.2 8.20 0.33 12.75 Westport WPRT-US UP AA 64 4.02u Dec 13 (1.78)u (1.13)u (0.89)u nmf nmf 8.03u 8.20u 9.60u 0.6 0.5 3.64u 0.25 5.00u5N Plus VNP OP S 84 2.07 Dec 14 0.10u 0.17u 0.29u 13.8 8.1 6.03u 6.03u 6.54u 0.4 0.4 2.38 0.14 3.25
Rating System: OP = Outperform; SP = Sector Perform; UP = Underperform; T = Tender; UR = Under Review; R = Restricted Risk Rating: BA = Below Average; A = Average; AA = Above Average; S = Speculative1 FD EPS are pro-forma numbers from continuing operations and exludes goodwill amortization, restructuring and one-time charges. u = US dollar
12-MthFDEPSP/E
Sales per share

VISIONApril 2015
52
—
Selecting tech stocks in Canada is getting harder this year after a strong two-year rally . There is no doubt that money is flowing into the technology space; funds flow is driving the valuations of well-run tech companies to new highs . We continue to favour software & services vendors and a select few special sits tech vendors with competitive advantages, and avoid stocks attached to the communications technology sector . We believe the technology market is positioned for further acceleration, driven by: GDP and employment growth, cashed-up balance sheets, low interest rates fueling M&A, a strong IPO pipeline, venture capital in Canada seeing larger deals as later stage companies raise funds, and Cdn$ weakness versus the US$ .
CGI Group remains our favourite large cap stock but is getting expensive trading at ~17x on C2015E earnings . The valuation is supported by a recurring business model that is based on a large backlog of long-term contracts . While top-line revenue slowed in the December quarter, bookings and margin expansion were strong and operating cash flow continues to support more M&A . We expect M&A to be a major catalyst for this stock; without M&A the stock is getting expensive .
Constellation Software seems to be another decent place to hide (although we’d be taking some profit) as the company is a holdco of many software vendors and as such offers great global diversification . Constellation is much more expensive than CGI at nearly 23x on C2015E earnings, which also assumes that M&A adds around $150 million of revenue (a declining risk to estimates as M&A has recently
accelerated) . Constellation is also achieving margin expansion, which was a positive surprise in Q3 and Q4 results .
Open Text disappointed on license revenue due to the macro environment in its December quarter . We remain cautious in our license revenue outlook and the recent acquisition of Actuate Corp . and higher interest expense associated with a recent debt issue is another drag on EPS growth . Open Text trades at ~15x on C2015E earnings; we’d be taking some profit .
In small-cap land Sandvine remains our top pick . Sandvine is trading at ~7x EV/EBITDA on F2015 (Nov) estimates and is executing better than its peers Allot Communications and Procera Networks . Sandvine reported a record F2014 year, but outlook was dampened by a lower-than-expected operating margin in F2015 . Sandvine is about to enter a major new carrier infrastructure upgrade cycle that could be an important growth driver for several years . Sandvine has been actively buying back stock under its new NCIB announced on Oct . 9th .
Avigilon is another very topical name and delivered in-line Q4 results on March 3rd . The stock has pulled back from the rally leading up to the report date as management expects operating expenses to increase as a percentage of revenue in 2015 due to hiring activity to support growth . Avigilon now trades at ~16x on C2016E earnings; we like the stock under $22/share .
Lumenpulse reported Q3 results on March 12th that was more or less in line . International growth in the quarter was very strong and gross margin was solid, reflecting leading quality . The company is executing very strong growth and is just starting to scratch the surface of a market soon growing to $40 billion . The stock now trades at ~9x EBITDA on C2016E . Investors appear to be waiting on the sideline for a better entry; we are likely there at this point .
Our coverage group average EV/EBITDA is ~12x and P/E is ~21x on our C2015 estimates . However, the EV/EBITDA range is ~4x-19x and the P/E range is ~15x-36x .
TechnologySector Analysis
—
Kris Thompson, MBA Analyst 416-869-8049 —
Associates: Auritro Kundu: 416-869-7495
Steven Walt: 416-869-7938
Shares Stock Last FDEPS EBITDA ($mln) Debt/ 12-MthStock Stock Risk O/S Price Year (A) est. est. P/E (A) est. est. EV/EBITDA Book Total PriceSym. Rating Rating (Mln) 03/17 Reported Last FY FY1 FY2 FY1 FY2 Last FY FY1 FY2 FY1 FY2 Value Capital Target
Avigilon Corporation AVO SP AA 46.6 20.24 2014 0.80 0.98 1.30 20.5 15.4 54.3 70.0 97.1 12.3 8.9 6.46 0% 25.00Axia NetMedia AXX OP AA 63.0 3.25 2014 NA NA NA NA NA 32.7 42.0 50.9 4.4 3.6 1.79 8% 3.30CGI Group Inc. GIB.A OP A 313.9 54.84 2014 2.93 3.23 3.41 16.6 NA 1845.8 1896.2 1972.5 9.9 NMF 16.62 32% 53.00Constellation Software Inc. CSU SP A 21.2 434.73 2014 12.94u 15.02u 17.95u 22.8 19.1 364.5u 419.7u 493.0u 17.8 15.2 12.11u 53% 450.00 Difference Capital Financial Inc. DCF SP S 38.2 0.90 2014 NA NA NA NA NA NA NA NA NA NA 1.73 44% 1.50 EXFO Inc. EXFO SP AA 53.7 3.57 2014 0.08u 0.16u NA 22.1 NA 14.4u 17.4u 3.0u 9.2 NMF 4.09 0% 3.50uGuestLogix Inc. GXI OP S 133.5 0.82 2014 (0.02u) 0.03u 0.06u 20.2 11.1 2.5u 11.1u 14.6u 8.6 6.5 0.35 32% 1.50Halogen Software Inc. HGN OP AA 21.9 8.61 2014 (0.55u) (0.51u) (0.33u) NMF NMF (8.7u) (5.5u) 0.2u NMF NMF 1.21 0% 12.00Kinaxis Inc. KXS OP AA 23.7 24.20 2014 0.46u 0.53u 0.67u 35.6 28.1 16.1u 20.2u 26.0u 19.3 15.1 1.96 0% 25.00 Lumenpulse Inc. LMP OP AA 23.4 14.26 2014 NMF 0.10 0.60 32.8 16.0 0.4 4.4 21.2 18.1 9.3 4.62 0% 28.00Macdonald, Dettwiler and Associates Ltd. MDA SP AA 36.1 94.80 2014 5.76 6.25 6.98 15.2 13.6 338.1 368.5 410.9 11.3 10.2 22.26 48% 100.00
Mediagrif Interactive Inc. MDF OP AA 15.5 17.25 2014 0.80 0.94 1.06 16.8 NMF 24.5 27.9 30.2 10.0 NMF 7.70 20% 24.00Open Text Corporation OTEX SP AA 122.1 55.03 2014 3.37u 3.74u 3.87u 15.0 NMF 537.9u 656.8u 682.4u 11.6 NMF 14.41 46% 60.00uSandvine Inc. SVC OP S 148.0 3.35 2014 0.17u 0.17u 0.24u 15.1 11.0 31.5u 32.9u 43.6u 7.2 5.4 1.11u 0% 4.50TIO Networks Corp. TNC OP S 57.1 0.81 2014 0.01 0.05 0.09 15.4 NMF 1.49 3.41 5.94 12.6 NMF 0.13 23% 1.50
Rating System: OP = Outperform; SP = Sector Perform; UP = Underperform; T = Tender; UR = Under Review; R = RestrictedRisk Rating: BA = Below Average; A = Average; AA = Above Average; S = Speculative

53
—
While risk remains regarding Bombardier Inc .’s (BBD .B: TSX; Sector Perform; $3 .00 price target) execution on its major aircraft development programs, several recent developments give us more confidence in the company and the shares:
Liquidity position improved – We believe that the issuance of Cdn$1 .1 billion in equity and additional debt capital of US$2 .25 billion will be sufficient for Bombardier to complete the development of the CSeries as well as Global 7000/8000 programs . While we see free cash flow usage of just under $1 .0 billion in 2015, we expect the company to be close to free cash flow breakeven in 2016 and FCF positive in 2017 .
New CEO with a solid track record – We view the appointment of Alain Bellemare as the new CEO as a clear positive for the company . His extensive senior leadership experience at UTC Aerospace will be very helpful as Bombardier completes its major aerospace development programs . Further, under his leadership, we expect a clearer focus on improving the profitability of Bombardier’s underperforming Aerospace operations .
CSeries testing making good progress – The CSeries has now completed 1,164 hours of a targeted 2,400 hours of flight testing while the larger CS300 version recently performed its first flight .
Assuming the current pace of flying continues, we believe that Bombardier is on track to achieve certification by the late fall . Achieving flight test milestones will be important catalysts for Bombardier as we believe they will result in increased interest from prospective customers . Of note, the CSeries performance (fuel burn, etc .) is exceeding the company’s marketing promises to airlines .
Weak Cdn$ a nice tailwind – Based on the current exchange rate, the potential tailwind for Bombardier Aerospace is $350 million by 2016 (versus 2014), which is meaningful . A $350 million tailwind would theoretically equate to 3%+ positive impact to Aerospace EBIT margins .
Bombardier Transportation (BT) positioning for better results – Although we were disappointed that the Transportation EBIT margin is expected to be similar (~5%) in 2015, we do believe that the proper actions are being taken to position the division for better profitability and cash flow in the coming years .
Hitachi deal to acquire Ansaldo STS argues for a higher BT valuation – Hitachi rail recently agreed to acquire rail signalling and systems company Ansaldo STS . The implied valuation of Ansaldo STS is just under 13x current year EBITDA based on consensus forecasts . Ansaldo STS generates revenue of ~1 .4 billion euros, which is roughly equivalent to Bombardier Transportation’s System and Signalling operations . BT does not break out profitability of this operation, but we believe that using lower than typical industry margins that this business alone could be worth about $1 .5 billion . We therefore believe that the Hitachi-Ansaldo STS deal argues for a higher valuation of BT as a whole .
Transportation and Industrial ProductsSector Analysis
—
Cameron Doerksen, CFA Analyst 514-879-2579 —
Associate: Umayr Allem, CFA, MBA 416-869-8577
Shares Stock Last Cash EPS FDFCFPS 12-MthStock Stock Risk O/S Price Year (A) est. est. P/E (A) est. est. P/CFPS PriceSym. Rating Rating (Mln) 3/17 Reported Last FY FY1 FY2 FY1 FY2 Last FY FY1 FY2 FY1 FY2 Target
Air Canada* AC OP AA 286 12.50 Dec-14 1.81 2.44 1.65 5.1x 7.6x 3.08 4.68 4.00 2.7x 3.1x nmf 17.00Bombardier Inc. BBD.b SP AA 2,230 2.48 Dec-14 u0.35 u0.18 u0.18 10.6x 12.8x u0.48 u0.42 u0.47 5.9x 5.3x 85% 3.00BRP Inc. DOO OP A 119 21.86 Jan-14 1.48 1.64 1.78 13.3x 12.3x 0.21 0.48 1.03 45.1x 21.3x 90% 28.00CAE Inc. CAE SP A 266 14.92 Mar-14 0.71 0.76 0.91 19.5x 16.4x 1.16 1.25 1.45 11.9x 10.3x 38% 16.00HNZ Group Inc. HNZ.a SP A 13 21.71 Dec-13 1.37 1.46 1.24 14.9x 17.5x 4.80 2.94 2.77 7.4x 7.8x -4% 20.00Canadian National Rail CNR SP BA 817 87.78 Dec-14 3.76 4.28 4.70 20.5x 18.7x 2.53 2.53 3.58 34.7x 24.6x 38% 85.00Canadian Pacific Rail CP OP A 171 241.36 Dec-14 8.50 10.73 12.71 22.5x 19.0x 3.87 5.23 6.65 46.2x 36.3x 50% 242.00Cargojet Inc. CJT SP AA 9 26.25 Dec-14 (1.07) 0.42 2.00 nmf 13.1x 0.02 2.52 4.05 10.4x 6.5x 71% 25.00Chorus Aviation Inc.* CHR.b SP AA 120 5.98 Dec-13 0.78 0.74 0.78 8.1x 7.7x 1.13 -0.02 -0.66 NM NM 53% 6.25 Héroux-Devtek Inc. HRX OP A 36 10.00 Mar-14 0.48 0.52 0.61 19.2x 16.4x 0.12 -0.40 -0.77 NM NM 18% 14.00Manac Inc. MA OP AA 17 8.51 Dec-13 0.60 1.04 1.13 8.2x 7.5x 1.17 0.38 1.23 22.1x 6.9x 8% 11.00Transat A.T. Inc. TRZ.b SP AA 39 6.00 Oct-14 1.16 0.33 0.83 17.9x 7.2x 1.14 -0.48 0.76 nmf 7.9x - 7.50 TransForce Inc. TFI OP A 102 30.97 Dec-14 1.74 2.01 2.41 15.4x 12.8x 3.35 3.01 3.10 10.3x 10.0x 61% 34.00Trimac Transportation Ltd. TMA OP A 28 7.07 Dec-14 0.58 0.68 0.79 10.5x 9.0x 1.23 0.68 0.90 10.4x 7.8x 67% 8.00WestJet Airlines* WJA OP A 128 29.94 Dec-14 2.46 3.03 2.67 9.9x 11.2x -0.72 -0.03 1.82 NM 16.4x 39% 38.00
Rating System: OP = Outperform; SP = Sector Perform; UP = Underperform; T = Tender; UR = Under Review; R = Restricted
*based on EBITDAR (includes leases)
Net Debt / Cap
Risk Rating: BA = Below Average; A = Average; AA = Above Average; S = Speculativeu = US dollars

VISIONApril 2015
54
—
Notes —

55
—
Notes —

VISIONApril 2015
56
—
Alphabetical Listing —5N Plus VNP 51Advantage Oil & Gas AAV 39Aecon Group ARE 50Ag Growth International Inc . AFN-T 36AGF Management Ltd . AGF'B 41Agnico-Eagle Mines Ltd . AEM-T 47AGT Food and Ingredients Inc . AGT 36Aimia Inc . AIM 44Air Canada AC 53Alacer Gold Corp ASR-T 47Alamos Gold Inc . AGI-T 47Alaris Royalty AD 49Algonquin Power AQN 51Allied Properties REIT AP .un 45AltaGas ALA 40Alterra Power AXY 51American Hotel Income Properties HOT .un 45Amica Mature Lifestyles ACC 45ARC Resources Ltd . ARX 39Arianne Phosphate Inc . DAN-V 36Arsenal Energy AEI 39Artek Exploration RTK 39Artis REIT AX .un 45ATCO Ltd . ACO'X 40Atlantic Power ATP 51AuRico Gold Inc AUQ-T 47Avigilon Corporation AVO 52Axia NetMedia AXX 52B2Gold Corp . BTO-T 47Bank of Montreal BMO 42Bank of Nova Scotia BNS 42Baytex Energy Corp . BTE 39BCE Inc . BCE 44Bellatrix Exploration BXE 39Belo Sun Mining Corp BSX-T 47Birchcliff Energy BIR 39Black Diamond Group Ltd . BDI 37Blackbird Energy BBI 39Boardwalk REIT BEI .un 45Bombardier Inc . BBD .b 53Bonavista Energy Corporation BNP 39Bonterra Energy BNE 39Boralex BLX 51Boyd Group Inc . BYD .UN 49Brookfield Renewable BEP 40BRP Inc . DOO 53BTB REIT BTB .un 45CAE Inc . CAE 53Calfrac Well Services Ltd . CFW 37Callidus Capital Corp . CBL 41Canadian Energy Services & Tech CEU 37Canadian National Rail CNR 53Canadian Natural Resources CNQ 39Canadian Oil Sands COS 39Canadian Pacific Rail CP 53Canadian Tire CTC .a 43Canadian Utilities Ltd . CU 40Canadian Western Bank CWB 41Canam Group CAM 50CanElson Drilling Inc . CDI 37Canexus CUS 40Canyon Services Group Inc . FRC 37CAP REIT CAR .un 45Capital Power CPX 40Capstone Infrastructure CSE 51Capstone Mining Corp CS-T 48Cardinal Energy CJ 39Cargojet Inc . CJT 53Cascades CAS 50Cathedral Energy Services Ltd . CET 37Cenovus Energy CVE 39Centric Health Corp . CHH 50Cequence Energy CQE 39Cervus Equipment Corporation CVL-T 36CGI Group Inc . GIB .A 52Chemtrade Logistics CHE .un 51Chinook Energy Inc . CKE 39Choice Properties REIT CHP .un 45Chorus Aviation Inc . CHR .b 53CI Financial Corp CIX 41CIBC CM 42Cineplex Inc . CGX 44Claude Resource Corp . CRJ-T 47
Cogeco Cable CCA 44Colabor Group GCL 50COM DEV CDV 44Cominar REIT CUF .un 45Conifex Timber Inc . CFF 51Constellation Software Inc . CSU 52Copper Mountain Mining Corp . CUM-T 48Corus Entertainment Inc . CJR .b 44Couche Tard ATD .b 43Crescent Point Energy Corp . CPG 39Crew Energy CR 39Crombie REIT CRR .un 45Dalradian Resources Inc . DNA-T 47DeeThree Exploration DTX 39Delphi Energy DEE 39Detour Gold Corp DGC-T 47DH Corp . DH 49DHX Media DHX 44Difference Capital Financial Inc . DCF 52DIRTT Environmental Solutions DRT 51Dollarama DOL 43Domtar Corporation UFS 50Dorel Industries DII .B 50DREAM Global REIT DRG .un 45DREAM Industrial REIT DIR .un 45DREAM Office REIT D .un 45Element Financial EFN 41Emera Inc . EMA 40Empire Company EMP .a 43Enbridge Inc . ENB 40Enbridge Income Fund ENF 40Encana Corp . ECA 39EnerCare ECI 51Enerplus Corporation ERF 39ENTREC Corp . ENT 37Equitable Group EQB 41Essential Energy Services Ltd . ESN 37Etrion Corp ETX 51Exchange Income Corp . EIF 49EXFO Inc . EXFO 52Fiera Capital Corp . FSZ 41First Capital Realty FCR 45First National Financial FN 41First Quantum Minerals FM-T 48Fortis Inc . FTS 40Franco-Nevada Corp FNV-T 47Freehold Royalties FRU 39Genworth MI Canada MIC 41Gibson Energy GEI 40Gildan GIL 43Gluskin Sheff + Assoc . GS 41Golden Star Resources Ltd GSC-T 47Great-West Lifeco GWO 42Grenville Strategic Royalty Corp . GRC 49GuestLogix Inc . GXI 52H&R REIT HR .un 45Halogen Software Inc . HGN 52Hawk Exploration HWK'A 39Héroux-Devtek Inc . HRX 53High Arctic Energy Services Inc . HWO 37HNZ Group Inc . HNZ .a 53Home Capital Group HCG 41Horizon North Logistics Inc . HNL 37HudBay Minerals HBM-T 48IAMGOLD Corporation IMG-T 47IBI Group Inc . IBG 49IGM Financial Inc . IGM 41Industrial Alliance IAG 42Innergex INE 51Inovalis REIT INO .un 45Input Capital Corp INP-V 36Intact Financial Corp . IFC 41Inter Pipeline IPL 40Interfor IFP 51InterRent REIT IIP .un 45Jean Coutu PJC .a 43Just Energy Group Inc . JE 49Kaminak Gold Corp . KAM-V 47K-Bro Linen Inc . KBL 49Kelt Exploration KEL 39Keyera KEY 40Kinaxis Inc . KXS 52Kinross Gold Corporation K-T 47
Kirkland Lake Gold Inc KGI-T 47Knight Therapeutics GUD 50KP Tissue KPT 50Lake Shore Gold Corp LSG-T 47Laurentian Bank LB 41Legacy Oil + Gas LEG 39Leucrotta Energy LXE 39LGX Oil + Gas OIL 39Lightstream Resources Ltd . LTS 39Liquor Stores N .A . Ltd . LIQ 49Loblaw L 43Lonestar West LSI 37Long Run Exploration LRE 39Lumenpulse Inc . LMP 52Luna Gold Corp . LGC-T 47Lundin Mining LUN-T 48Lydian International Ltd . LYD-T 47Macdonald, Dettwiler and Associates Ltd . MDA 52MAG Silver Corp MAG-T 47Magellan Minerals Ltd MNM-V 47Manac Inc . MA 53Manitoba Telecom Services Inc . MBT 44Manitok Energy MEI 39Manulife Financial MFC 42Marquee Energy MQL 39Mason Graphite LLG 51MCAN Mortgage Corp . MKP 41Mediagrif Interactive Inc . MDF 52Medical Facilities Corp . DR 49MEG Energy MEG 39Melcor REIT MR .un 45Metro MRU 43Midas Gold Inc . MAX-T 47Milestone Apartments REIT MST .un 45Morneau Shepell Inc . MSI 49Mosaic Capital Corp . M 49Mountain Province Diamonds Inc . MPV-T 47MTY Food Group MTY 50Mullen Group Ltd . MTL 37National Bank NA 42New Flyer Industries Inc . NFI 49New Gold Inc NGD-T 47New Look Eyewear BCI 50Newalta Inc . NAL 51Newstrike Capital Inc . NES-V 47Northern Blizzard Resources Inc . NBZ 39Northland Power NPI 40NorthWest H .P . REIT NWH .un 45NuVista Energy NVA 39NYX Gaming NYX 44OceanaGold Corp . OGC-T 47Open Text Corporation OTEX 52Orezone Gold Corp . ORE-T 47Osisko Gold Royalties Ltd . OR-T 47Ovivo Inc (formerly GLV Inc) OVI'A 51Painted Pony Petroleum PPY 39Park Lawn Corporation PLC 50Parkland Fuel Corp . PKI 49Partners REIT PAR .un 45Pason Systems Corp . PSI 37Pattern Energy PEGI-US 51Pembina Pipelines PPL 40Pengrowth Energy Corporation PGF 39Penn West Exploration PWT 39Performance Sports Group PSG 49Perpetual Energy PMT 39Peyto Exploration & Development Corp . PEY 39PHX Energy Services Corp . PHX 37Pilot Gold Corp . PLG-T 47Pinecliff Energy PNE 39PolyMet Mining Corp . POM-T 48PrairieSky Royalty PSK 39Premium Brands Holdings PBH 50Progressive Waste Solution BIN-US 51Pure Industrial REIT AAR .un 45Pure Multi-family REIT RUFu .V 45Quebecor Inc . QBR .b 44Raging River Exploration RRX 39Richelieu Hardware RCH 50Richmont Mines Inc . RIC-T 47Rio Alto Mining Ltd . RIO-T 47RMP Energy RMP 39Rock Energy RE 39
Rogers Communications Inc . RCI .b 44Rogers Sugar Inc . RSI 49Romarco Minerals Inc R-T 47Rona RON 43Royal Bank of Canada RY 42Royal Gold Inc RGLD-O 47Rubicon Minerals Corp RMX-T 47Sandstorm Gold Ltd SSL-T 47Sandvine Inc . SVC 52Saputo SAP 43Savanna Energy Services Corp . SVY 37Seabridge Gold Inc . SEA-T 47Secure Energy Services Inc . SES 37SEMAFO Inc . SMF-T 47Shaw Communications SJR .b 44ShawCor SCL 51Sherritt Int . Corp S-T 48Silver Wheaton Corp SLW-T 47SilverCrest Mines Inc . SVL-T 47Sirius XM Canada Holdings XSR 44Slate Office REIT SOT .un 45SNC-Lavalin Group SNC 50Spartan Energy SPE 39Sprott Resource Corp . SCP-T 47Spyglass Resources SGL 39Stantec STN 50Stella-Jones SJ 50Storm Resources SRX 39Strategic Oil & Gas Ltd . SOG 39Stuart Olson SOX 50Student Transportation Inc . STB 37Sun Life Financial SLF 42Suncor Energy SU 39Superior Plus SPB 40Supremex Inc . SXP 44Surge Energy SGY 39Tamarack Valley Energy TVE 39Taseko Mines Limited TKO-T 48Teck Resources TCK'B-T 48Telus Corp . T 44Temple Hotels TPH 45TeraGo TGO 44The Intertain Group Limited IT 44Thomson Reuters TRI 44Timmins Gold Corp . TMM-T 47TIO Networks Corp . TNC 52TMX Group X 41Torc Oil & Gas TOG 39Toro Oil & Gas TOO 39Toronto-Dominion Bank TD 42Torstar Corporation TS .b 44Tourmaline Oil TOU 39TransAlta TA 40TransAlta Renewables RNW 51Transat A .T . Inc . TRZ .b 53TransCanada Corp . TRP 40Transcontinental Inc . TCL .a 44TransForce Inc . TFI 53Trican Well Services TCW 37Tricon Capital Group TCN 45Trilogy Energy TET 39Trimac Transportation Ltd . TMA 53Trinidad Drilling Ltd . TDG 37True Gold Mining Inc . TGM-T 47True North Apartment REIT TN .un 45TVA Group Inc . TVA .b 44Twin Butte Energy TBE 39Uni-Sélect UNS 50Valener Inc . VNR 40Veresen Inc . VSN 40Vermilion Energy Inc . VET 39Vicwest Inc . VIC-T 36WesternOne Equity WEQ 49WestJet Airlines WJA 53Westport WPRT-US 51Whiltecap Resources WCP 39WPT Industrial REIT WIR'U-T 45WSP Global WSP 50Xtreme Drilling and Coil Services Corp . XDC 37Yamana Gold Inc YRI-T 47Zargon Energy ZAR 39

Branches—
InternationalNBF Securities UK(Regulated by The Financial Services Authority) 71 Fenchurch Street, 11th floor London, England EC3M 4HD Tel.: 44-207-680-9370 Tel.: 44-207-488-9379
New York65 East 55th Street, 31st Floor New York, NY 10022 Tel.: 212-632-8610
National Bank of Canada Financial inc.New York65 East 55th Street, 34th Floor New York, NY 10022 Tel.: 212-546-7500
Member of Montreal Exchange Toronto Stock Exchange Winnipeg Commodities Exchange Securities Industry Association CNQ Investment Dealers Association of Canada Canadian Investor Protection Fund Securities Investor Protection Corporation
Baie-Comeau • 337, boulevard Lasalle, Baie-Comeau, QC, G4Z 2Z1 • 418-296-8838 Barrie • 126 Collier Street, Barrie, ON, L4M 1H4 • 705-719-1190Beauce • 11505, 1re Avenue est, Bureau 100, St-Georges, QC, G5Y 7X3 • 418-227-0121Berthierville • 779, rue Notre-Dame, Berthierville, QC, J0K 1A0 • 450-836-2727Bin-Scarth • 24 Binscarth Rd, Toronto, ON, M4W 1Y1 • 416-929-6432Brampton • 10520 Torbram Road (at Sandalwood Parkway), Brampton, ON, L6R 2S3 • 905-456-1515Brandon • 633-C, 18th Street, Brandon, MB, R7A 5B3 • 204-571-3200Burnaby • 4211 Kingsway Street, Suite 218, Burnaby, BC, V5H 1Z6 • 604-541-8500Calgary • TCP Building, 450 - 1 Street SW, Suite 2800, Calgary, AB, T2P 5H1 • 403-531-8400Calgary - Southport • 10655 Southport Road SW, Suite 1100, Southland Tower, Calgary,AB, T2W 4Y1 • 403-301-4859Charlottetown • BDC Tower, 310-119 Kent Street, Charlottetown, PEI, C1A 1N3 • 902-569-8813Chatham • 380 St. Clair, Street, Chatham, ON, N7L 3K2 • 519-351-7645Chicoutimi • 1180, boulevard Talbot, Suite 201, Chicoutimi, QC, G7H 4B6 • 418-549-8888DIX30 • 9160, boulevard Leduc, Bureau 710, Brossard, QC, J4Y 0E3 • 450-462-2552Drumheller • 356 Centre Street, PO Box 2176, Drumheller, AB, T0J 0Y0 • 403-823-6857Drummondville • 150, rue Marchand, Bureau 401, Drummondville, QC, J2C 4N1 • 819-477-5024Duncan • 2763 Beverly Street, Suite 206 Duncan,BC, V9L 6X2 • 250-715-3050Edmonton • 10180 – 101 Street, Suite 3500, Edmonton, AB, T5J 3S4 • 780-412-6600Edmonton-North • 10088-102 Avenue, Suite 903, TD Tower, Edmonton, AB, T5J 2Z1 • 780-421-4455Eglinton • 295 Eglinton Avenue East, Delaware Square, Mississauga, ON, L4Z 3K6 • 905-507-4883 Fredericton • 551 King Street, P.O. Box 252, Suite B, Fredericton, NB, E3B 1E7 • 506-453-9040Gatineau • 920, St-Joseph, Bureau 100, Hull-Gatineau, QC, J8Z 1S9 • 819-770-5337Granby • 150, rue St-Jacques, Bureau 202, Granby, QC, J2G 8V6 • 450-378-0442Grand-Mère • 602, 6e avenue, Grand-Mère, QC, G9T 2H5 • 819-538-8628Halifax • Purdy's Wharf Tower II, 1969 Upper Water Street, Suite 1601, Halifax, NS, B3J 3R7 • 902-496-7700Halifax-Spring Garden • 5670 Spring Garden Road, Suite 901, Halifax, NS, B3J 1H6 • 902-425-1283Joliette • 40, rue Gauthier Sud, Bureau 3500, Joliette, QC, J6E 4J4 • 450-760-9595Kelowna • Suite 500 - 1632 Dickson Avenue, Kelowna, BC, V1Y 7T2 • 250-717-5510Kentville • 402 Main Street, Kentville, NS, B4N 3X7 • 902-679-0077La Pocatière • 608 C, 4e avenue, La Pocatière, QC, G0R 1Z0 • 418-856-4566Lac-Mégantic • 3956, rue Laval, suite 100, QC, G6B 2W9 • 819-583-6035Laval • 2500, boulevard Daniel Johnson, Bureau 610, Laval, QC, H7T 2P6 • 450-686-5700Lethbridge • 404, 6th Street South, Lethbridge, AB, T1J 2C9 • 403-388-1900 London • 333 Dufferin Avenue, London, ON, N6B 1Z3 • 519-439-6228London-City Centre • 802-380 Wellington Street, London, ON, N6A 5B5 • 519-646-5711Metcalfe • 1155, rue Metcalfe, Suite 1450, Montréal, QC, H3B 2V6 • 514-879-4825Mississauga • 350, Burnhamthorpe road West, Suite 603, Mississauga, ON, L5B 3J1 • 905-272-2799Moncton • 735 Main Street, Suite 300, Moncton, NB, E1C 1E5 • 506-857-9926Montréal Centre-Ville • 1, Place Ville-Marie, Bureau 2201, Montréal, QC, H3B 3M4 • 514-879-2509Mont Saint-Hilaire • 436, boulevard Sir-Wilfrid-Laurier, Suite 100, Mont Saint-Hilaire, QC, J3H 3N9 • 450-467-4770Mont-Laurier • 906, Albiny-Paquette, Mont-Laurier, QC, J9L 1L4 • 819-623-6002Montréal 5 • 1155, rue Metcalfe, Bureau 1438, Montréal, QC, H3B 4S9 • 514-843-3088Montréal International • 1155, rue Metcalfe, Suite 1438, Montréal, QC, H3B 4S9 • 514-879-5287Montréal L'Acadie • 9001, boulevard de l’Acadie, Bureau 801, Montréal, QC, H4N 3H5 • 514-389-5506Montréal Siège Social • 1155, rue Metcalfe, 23e étage Montréal, QC, H3B 4S9 • 514-879-2512Nanaïmo • 75 Commercial Street, Nanaïmo, BC, V9R 5G3 • 250-751-1111North Bay • 680 Cassells Street, Suite 101, North Bay, ON, P1B 4A2 • 705-476-6360Oak Bay • #220 - 2186 Oak Bay Avenue, Victoria, BC, V8R 1G3 • 250-953-8400Oakville - Robinson St. • 105 Robinson Street, Oakville, ON, L6J 1G1 • 905-842-1925Ottawa • 50 O'Connor Street, Suite 1602, Ottawa, ON, K1P 6L2 • 613-236-0103Outremont • 1160, boulevard Laurier Ouest, App. 1, Outremont, QC, H2V 2L5 • 514-276-3532Penticton • City Center Building, 399 Main Street, Suite 305, Penticton, BC, V2A 5B7 • 250-487-2600Plessisville • 1719, rue St-Calixte, Plessisville, QC, G6L 1R2 • 819-362-6000
Pointe-Claire • 1, rue Holiday, Tour est, Suite 145, Pointe-Claire, QC, H9R 5N3 • 514-426-2522PVM Montréal • 1, Place Ville-Marie, Bureau 1805, Montréal, QC, H3B 4A9 • 514-879-5200Québec • 900, boulevard René-Lévesque Est, Bureau 640, Québec, QC, G1R 2B5 • 418-649-2525Québec - Sainte-Foy • Place de la Cité, 2600, boulevard Laurier, Bureau 700, Québec, QC, G1V 4W2 • 418-654-2323Québec 3 • Édifice Delta 3 - 2875, boulevard Laurier, Suite 700, Québec, QC, G1V 2M2 • 418-651-0680Red Deer • 4719 48th Avenue, Suite 200, Red Deer, AB, T4N 3T1 • 403-348-2600Regina • 1770-1881 Scarth Street, 17th Floor, McCallum Hill Centre - Tower II, Regina, SK, S4P 4K9 • 306-781-0500Repentigny • 534, rue Notre-Dame, Bureau 201, Repentigny, QC, J6A 2T8 • 450-582-7001Richmond • 135-8010 Saba Road, Richmond, BC, V6Y 4B2 • 604-658-8050Richmond Hill • 500 Highway 7 East, Gr. Floor, Richmond Hill, ON, L4B 1J1 • 905-477-2002Rimouski • 127, boulevard René-Lepage Est, Bureau 100, Rimouski, QC, G5L 1P1 • 418-721-6767Rivière-du-Loup • 10, rue Beaubien, Rivière-du-Loup, QC, G5R 1H7 • 418-867-7900 Rosemère • 218, boulevard Curé-Labelle, Rosemère, QC, J7A 2H4 • 450-437-8292Rouyn-Noranda • 74, avenue Principale, Rouyn-Noranda, QC, J9X 4P2 • 819-762-4347Saint John • 72 Prince William Street, Saint John, NB, E2L 2B1 • 506-642-1740Sainte-Marie-de-Beauce • 249, Du Collège, Bureau 100, Ste-Marie, QC, G6E 3Y1 • 418-387-8155Saint-Félicien • 1120, boulevard Sacré-Cœur, Saint-Félicien, QC, G8K 1P7 • 418-679-2684Saint-Hyacinthe • 1355, rue Johnson, Suite 4100, Saint-Hyacinthe, QC, J2S 8W7 • 450-774-5354Saint-Jean-sur-Richelieu • 383, boul. du Séminaire Nord, Suite 224, Saint-Jean-sur-Richelieu, QC, J3B 8C5 • 450-349-7777Saint-Jérôme • 265, rue St-George, Suite 100, Saint-Jérôme, QC, J7Z 5A1 • 450-569-8383Saint-Nicolas • 425, rue des Chutes, Bureau 100, Saint-Nicolas, QC, G7A 1E7 • 450-261-5268Saskatoon - 8th St. • 1220 8th Street East, Saskatoon, SK, S7H 0S6 • 306-657-3465Saskatoon - Downtown • 410-22nd Street East, Suite 1360, Saskatoon Square, Saskatoon, SK, S7K 5T6 • 306-657-4400Sept-Îles • 805, boulevard Laure, Suite 200, Sept-Îles, QC, G4R 1Y6 • 418-962-9154Sherbrooke • 1802, rue King Ouest, Suite 200, Sherbrooke, QC, J1J 0A2 • 819-566-7212Sidney • 2537, Beacon Avenue, Suite 205, Sidney, BC, V8L 1Y3 • 250-657-2200Sorel • 26, Pl. Charles-de-Montmagny, Suite 100, Sorel , QC, J3P 7E3 • 450-743-8474 St. Catharines • 40 King Street, St. Catharines, ON, L2R 3H4 • 905-641-1221Sudbury • 10 Elm Street, Suite 501, Sudbury, ON, P3C 1S8 • 705-671-1160Swift Current • 406 Cheadle Street West, Suite 202, Swift Current, SK, S9H 0B6 • 306-778-4770Thedford Mines • 222, boulevard Frontenac Ouest, bureau 107, Thedford Mines, QC, G6G 6N7 • 418-338-6183Thunder Bay • Hydro BLG 34 Cumberland Street North, 7th Fl., Thunder Bay, ON, P7A 4L3 • 807-683-1777Toronto 1 • Exchange Tower, 130 King Street West, Suite 3200, Toronto, ON, M5X 1J9 • 416-869-3707 Toronto Downtown • 121 King Street West, Toronto, ON, M5H 3T9 • 416-864-7791Trois-Rivières • 7200, rue Marion, Trois-Rivières, QC, G9A 0A5 • 819-379-0000Val d'Or • 840, 3e avenue, Val d'Or, QC, J9P 1T1 • 819-824-3687Valleyfield • 1356, boulevard Monseigneur-Langlois, Valleyfield, QC, J6S 1E3 • 450-370-4656Vancouver - Bentall V • 550 Burrard Street, Suite 1028, Vancouver, BC, V6C 2B5 • 604-685-6371Vancouver - Broadway • 1333 West Broadway Avenue, Suite 1488, Vancouver, BC, V6H 4C1 • 604-738-5655Vancouver 1 • Park Place, 666 Burrard Street, Suite 3300, Vancouver, BC, V6C 2X8 • 604-623-6777 Vancouver 2 • Park Place, 666 Burrard Street, Suite 3300, Vancouver, BC, V6C 2X8 • 604-643-2774 Vernon • 3100-30th Avenue, Suite 101, Vernon, BC, V1T 2C2 • 250-260-4580Victoria • 700-737 Yates Street, Victoria, BC, V8W 1L6 • 250-953-8400Victoria - Fort • 1480 Fort Street, Victoria, BC, V8S 1Z5 • 250-475-3698Victoriaville • 650, boulevard Jutras Est, Bureau 150, Victoriaville, QC, G6S 1E1 • 819-758-3191Waterloo • 180 King Street South, Suite 340 Allen Square, Waterloo, ON, N2J 1P8 • 519-742-9991West Vancouver • Suite 202, 545 Clyde Avenue, West Vancouver, BC V7T 1C5 • 604-925-5640White Rock • 2121 160th Street, Surrey, BC, V3Z 9N6 • 604-541-4925Willowdale • 9130 Leslie Street, suite 200, Richmond Hill, ON, L4B 0B9 • 416-756-4016Windsor • 1 Riverside Drive West,Suite 600, Windsor, ON, N9A 5K3 • 519-258-5810Winnipeg • 200 Waterfront Drive, Suite 400, Winnipeg, MB, R3B 3P1 • 204-925-2250Yorkton • 89 Broadway Street West, Yorkton, SK, S3N 0L9 • 306-782-6450

MontrealNational Bank Financial—Sun Life Building1155 Metcalfe StreetMontreal, QC H3B 4S9514-879-2222
TorontoNational Bank Financial—The Exchange Tower130 King Street West4th Floor PodiumSuite 3200Toronto, ON M5X 1J9416-869-3707
Canada (Toll-Free)—1-800-361-88381-800-361-9522
United States (Toll-Free)—1-800-678-7155
National Bank Financial (NBF) is an indirect wholly owned subsidiary of National Bank of Canada. National Bank of Canada is a public company listed on Canadian stock exchanges.The particulars contained herein were obtained from sources which we believe reliable but are not guaranteed by us and may be incomplete. The opinions expressed are based upon our analysis and interpretation of these particulars and are not to be construed as a solicitation or offer to buy or sell the securities mentioned herein. The Firm may act as financial advisor, fiscal agent or underwriter for certain of the companies mentioned herein and may receive a remuneration for its services. The Firm and/or its officers, directors, representatives, associates, may have a position in the securities mentioned herein and may make purchases and/or sales of these securities from time to time in the open market or otherwise. To U.S. residents: With respect to the distribution of this report in the United States, National Bank of Canada Financial Inc. (NBCFI) is regulated by the Financial Industry Regulatory Authority (FINRA) and a member of the Securities Investor Protection Corporation (SIPC). This report has been prepared in whole or in part by, research analysts employed by non-US affiliates of NBCFI that are not registered as broker/dealers in the US. These non-US research analysts are not registered as associated persons of NBCFI and are not licensed or qualified as research analysts with FINRA or any other US regulatory authority and, accordingly, may not be subject (among other things) to FINRA restrictions regarding communications by a research analyst with the subject company, public appearances by research analysts and trading securities held a research analyst account. All of the views expressed in this research report accurately reflect the research analysts’ personal views regarding any and all of the subject securities or issuers. No part of the analysts’ compensation was, is, or will be, directly or indirectly, related to the specific recommendations or views expressed in this research report. The analyst responsible for the production of this report certifies that the views expressed herein reflect his or her accurate personal and technical judgment at the moment of publication. Because the views of analysts may differ, members of the National Bank Financial Group may have or may in the future issue reports that are inconsistent with this report, or that reach conclusions different from those in this report. To make further inquiry related to this report, United States residents should contact their NBCFI registered representative.© 2014 National Bank Financial. All rights reserved. This report may not be reproduced in whole or in part, or further distributed or published or referred to in any manner whatsoever nor may the information, opinions or conclusions contained in it be referred to without in each case the prior express consent of National Bank Financial.
2971
3-20
2 (2
015/
04)
Corporate Offices—