Embed Size (px)
Citation preview
Information & Management 46 (2009) 9–15
Virtual organizational learning in open source software development projects
Yoris A. Au *, Darrell Carpenter, Xiaogang Chen, Jan G. Clark
Department of Information Systems and Technology Management, College of Business, University of Texas at San Antonio, One UTSA Circle, San Antonio, TX 78249, USA
A R T I C L E I N F O
Article history:
Received 3 May 2007
Received in revised form 23 May 2008
Accepted 26 September 2008
Available online 28 November 2008
Keywords:
Virtual organizational learning
Organizational learning curve
Virtual organization
Open source software
Software development
Project performance
A B S T R A C T
We studied virtual organizational learning in open source software (OSS) development projects.
Specifically, our research focused on learning effects of OSS projects and the factors that affect the
learning process. The number and percentage of resolved bugs and bug resolution time of 118
SourceForge.net OSS projects were used to measure the learning effects. Projects were characterized by
project type, number and experience of developers, number of bugs, and bug resolution time. Our results
provided evidence of virtual organizational learning in OSS development projects and support for several
factors as determinants of performance. Team size was a significant predictor, with mid-sized project
teams functioning best. Teams of three to seven developers exhibited the highest efficiency over time and
teams of eight to 15 produced the lowest mean time for bug resolution. Increasing the percentage of bugs
assigned to specific developers or boosting developer participation in other OSS projects also improved
performance. Furthermore, project type introduced variability in project team performance.
� 2008 Elsevier B.V. All rights reserved.
Contents lists available at ScienceDirect
Information & Management
journa l homepage: www.e lsev ier .com/ locate / im
1. Introduction
Many people can work together on a task regardless of time,geographic location, or organizational affiliation by adopting avirtual approach [14]. Open source software (OSS) developmentprojects exhibit many of the characteristics that make virtualorganizations successful, including self-governance, a powerfulset of mutually reinforcing motivations, effective work struc-tures and processes, and technology for communication andcoordination. Examples of thriving OSS projects include Linux,Apache, and Mozilla. Although seemingly disorganized, andlacking monetary incentives, the development approach ischaracterized by design simplicity, team work, a visible product,and communication.
But what makes OSS development projects successful? Mockuset al. [13] conducted a case study on the Apache Web server andMozilla Web browser projects to learn their development processcharacteristics; they found that projects based on a relatively smallcore of developers (10–15 people) could be geographicallydispersed, yet communicate and function without conflict via aset of implicit coordination mechanisms (i.e. informal emailexchange). However, when the number of core developersexceeded this size, other explicit coordination mechanisms (e.g.,
* Corresponding author. Tel.: +1 210 4586337; fax: +1 210 4586305.
E-mail address: [email protected] (Y.A. Au).
0378-7206/$ – see front matter � 2008 Elsevier B.V. All rights reserved.
doi:10.1016/j.im.2008.09.004
a code ownership policy) had to be adopted. In a similar study,Huntley [9] used organizational learning to explain the success ofOSS projects; he maintained that it decreased time in fixing bugs.However, there were significant debugging differences in Apacheand Mozilla, with project maturity as the apparent reason, asopposed to other factors such as project size and number ofprogrammers. Debugging data were modeled to fit a learningcurve. Mozilla, an emerging project, was characterized as havingimprovements due to learning effects present in their team. Boththese authors pointed out significant differences between theprojects.
Our intent was to extend and refine their work by including amuch larger number of OSS development projects of varying size(in terms of the number of developers involved) and type (fromsimple file management software to complex enterprise softwaresuite). Specifically, we included 118 OSS projects in our sample. Byfocusing on multiple projects of varying size and type, we werebetter able to characterize OSS projects. Our study was initiated toanswer the following research questions:
(1) A
re learning effects universally present in OSS projects? (2) W hat are the factors that affect the learning process?We used the number and percentage of resolved bugs and bugresolution time to measure learning effects. However, we alsolooked at how different project types, number of developers(project team size) and their experience, and the intensity of
Y.A. Au et al. / Information & Management 46 (2009) 9–1510
assigned bugs affected the learning rates. Data for this study wereobtained from the SourceForge.net1 database.
2. Theoretical framework and hypotheses
We developed several hypotheses based on theories that relateto virtual organizational learning. Our first hypothesis seeks toshow that organizational learning exists in OSS developmentprojects. The subsequent hypotheses seek to explain the variationof learning rates observed across projects.
2.1. Organizational learning curves
Group learning curves were first observed in the 1940s duringconstruction of ships and aircraft [22]. The time required to build acomplex product decreased at a diminishing rate as more productswere produced.
Fiol and Lyles [6] postulated that there are two levels oforganizational learning: higher- and lower-level. The first focuses onre-defining the overall organizational strategy under ill-definedcontext; examples include developing a new organizational cultureand re-establishing organizational priorities [3]. Conversely, thatlower-level learning focused on specific organizational behaviorsand constraints within existing organizational rules, suggesting thatminor managerial adjustments, improved problem-solving skillsand that the development of formal rules were examples of it. Thistype of learning is primarily a process of repetition [5].
We consider debugging as a way that organizational experienceis accumulated in OSS development teams, thus establishing thesoftware development learning curve. This is lower-level learningwhere developers repeatedly scan, review, and/or modify programcode. As the team gains experience, it exhibits its learning curve bydecreasing its average time to resolve a bug. Therefore, wehypothesized that:
H1. As the number of bugs resolved to date increases, the averagebug resolution time decreases.
2.2. Cognitive capital and developer’s OSS experience
Cognitive capital consists of expertise and the knowledge abouthow to apply expertise in solving a problem. Over time, peopledevelop it as they learn the skills, knowledge, specialized dialogue,and norms of their work and interact with others who share thesame practice [18].
OSS developers can be concurrently involved in more than oneproject, allowing them a greater opportunity to work with others,learn about the norms of OSS development, and accumulate moreexperience. Overall, developer’s OSS expertise increases with thenumber of projects in which they are involved. This translates intolarger cognitive capital that can be shared with other teammembers to improve team performance.
Social capital is defined as the number of the ties or interactionsthat an actor (e.g., a developer) has with another in a social eventwithin a social network or community. For example, Okoli and Oh[15] found a significant relationship between developer perfor-mance on Wikipedia and their social ties within the Wikipediacommunity. Grewal et al. [7] measured social capital as ‘‘networkembeddedness’’ using parameters derived from the number ofprojects in which an OSS developer had been involved. Wetherefore used number of OSS projects as a measure for OSSdeveloper experience.
1 Details were avalaible at http://zerlot.cse.nd.edu/mywiki/ Christley and Madey
[4] provided further descriptions of the SourceForge.net data set.
This lead to the hypothesis:
H2. Teams with more experienced OSS developers resolve bugsfaster.
2.3. Task ownership
Task ownership occurs when a task performer takes personalinterest and responsibility for it. Its degree can affect how the taskis accomplished. It improves team effectiveness and facilitatesindividual learning; for example, students exhibit a sense ofindividual accountability when their grade is based on individualefforts in a group project. This also helps to eliminate non-participants.
The relationship between task ownership and individual/teamperformance can be explained by Goal-Setting Theory, whichmaintains that task ownership helps task performers clarify theirtask goals [12]. In turn, these help performers focus attention ongoal-related activities, thus improving performance. Rasch andTosi [16] validated Goal-Setting Theory in software developmentteams.
We hypothesized that:
H3. There is an inverse relationship between increasing the per-centage of bugs assigned to specific developers and average bugresolution time.
2.4. Project category
At the time of our research, Sourceforge.net classified its projectsinto thirteen categories. These included Clustering, Database,Desktop, Development, Enterprise, Financial, Games, Hardware,Multimedia, Networking, Security, SysAdmin, and VoIP. Projects indifferent categories typically have different complexity and time-liness, affecting their bug resolution times. We hypothesized:
H4. Different project categories have different average bug reso-lution times.
2.5. Project team size
Prior work on traditional co-located teams has suggested thatthe appropriate team depends on the nature of the task; forexample, Hwang and Guynes [10] reported that large computer-supported groups generated more decision alternatives but tooklonger to reach a decision. If a team is too small, it does noteffectively share the workload but if it is too large, coordination theoverhead is large and social loafing becomes a concern.
The relationship between team size and team performance inOSS communities might exhibit a different pattern than that in atraditional setting, because the communication structure isdifferent; the OSS project team generally consists of two sub-groups of developers: core developers and code contributors. Coredevelopers make the critical decisions (e.g., when to release thenext version and whether or not to implement a new feature).However, to reach consensus on these decisions, intensivecommunication among core developers is critical and a smallnumber of core developers per project is therefore recommended.
Code contributors produce the code. They receive well-definedsubtasks (i.e. bugs), work on them independently, and, whenfinished, report back to core developers. As a result, thecommunication structure follows a star topology. The coredevelopers are the central ‘‘hub,’’ and all the contributors connectto and through this hub.
Y.A. Au et al. / Information & Management 46 (2009) 9–15 11
We felt that different team sizes have different challenges: alarge team may have coordination problems, whereas a small teammay encounter resource problems. This lead to the hypothesis:
H5. Average bug resolution time varies among project team size.
3. Research methodology
3.1. Empirical model
Based on the production function and motivated by Argote et al.[2] and Huntley, we developed a log–log regression model withboth qualitative and quantitative variables:
lnðMeanBugResolutionTimeitÞ ¼ a0 þ a1 lnðCumBugsResolveditÞ
þ a2 lnðDeveloperExperienceiÞ
þ a3 lnðCumPctBugsAssigneditÞ
þX12
i¼1
biProjectCategoryi
þX3
j¼1
g jDeveloperCategoryi j þ eit
where MeanBugResolutionTimeit = mean time to resolve the bugs ofProject i reported in Week t, measured in days, CumBugsResolve-
dit = cumulative resolved bugs of Project i, including Week t,
DeveloperExperienceit = average number of other projects eachdeveloper in Project i has worked on up to Week t, CumPctBug-
sAssignedit = cumulative percentage of assigned bugs in Week t ofProject i, ProjectCategoryi = category of Project i, DeveloperCategor-
yit = size of Project i in Week t, measured in terms of the number ofdevelopers in the project (1–2 developers; 3–7 developers; 8–15developers; >15 developers), As the model indicates, our analysiswas based on cross-sectional time series data or panel data,consisting of two-dimensional sets in which a group of people orobjects are observed longitudinally. Thus Project i is the panelvariable and Week t is the time variable. Each observation is acollection of information on a specific project in a given week. Thedescriptive statistics for the model variables are shown in Table 1.
Table 1Descriptive statistics for the model variables.
Variable Min Max Mean Std. dev.
MeanBugResolutionTime (DV) 0.00 1546.1 33.8 97.6
CumBugsResolved 0.00 6148 484.0 881.8
DeveloperExperience 1.00 7.67 2.81 4.23
CumPctBugsAssigned 0.00 1.00 0.56 0.29
ProjectCategory
Enterprise 0 1 0.06 0.24
Desktop 0 1 0.06 0.24
SysAdmin 0 1 0.10 0.31
Financial 0 1 0.01 0.11
Development 0 1 0.31 0.46
Games 0 1 0.08 0.27
Security 0 1 0.04 0.20
Multimedia 0 1 0.01 0.11
Database 0 1 0.07 0.26
Hardware 0 1 0.05 0.22
Networking 0 1 0.09 0.29
VoIP 0 1 0.01 0.11
DeveloperCategory
1–2 Developers 0 1 0.08 0.28
3–7 Developers 0 1 0.30 0.46
8–15 Developers 0 1 0.28 0.45
>15 Developers 0 1 0.33 0.47
3.2. Data collection
We collected data from SourceForge.net on a wide variety ofproject-related measures, including development status, rank,bugs reported, patches, feature requests, support requests,developer registrations, and project category. To avoid thepitfalls of spidering and parsing the Sourceforge.net website [8],we collected data directly from its database. SourceForge.nethosts over 100,000 OSS development projects with a centralizedresource for managing projects, issues, communications, andcode. It provides many tools to support collaborative develop-ment and allows developers to register their projects at nocharge. These properties make it equally attractive to both largeand small development efforts. Furthermore, the number ofprojects, the wide variety in terms of size and expertise, and theavailability of event data made it an ideal data source for ourresearch.
3.2.1. Project identification
Of course, there is a fair amount of ‘‘noise’’ in SourceForge data;some OSS teams use SourceForge as the ‘‘repository of record’’instead of the ‘‘repository of use,’’ and thus are not responding tobugs. This can lead to inaccurate bug resolution data in thedatabase. To address this issue, we collected data from the top 50projects in each of SouceForge.net’s 13 primary software cate-gories, ensuring that only projects actively in use were included inour sample.
Identification of top projects was based on two factors:development status and site rank. The first limited projects tothose that had produced a production/stable version of theapplication; the developers of some were unresponsive toexternally reported events (such as bug reports) and thus theyhad to be excluded. The second was to use SourceForge.net’sinternal ranking system. It used three sub-factors (traffic,communication, and development) to determine an overallranking of projects. This multi-factor system had severaldesirable qualities that enhanced the sample validity. Onebenefit of using this ranking system was that older projectstended to drop in activity and thus in ranking. Using the rankcriterion also ensured that the selected projects reflected thecurrent state of development.
Based on these factors, a ‘‘snapshot’’ of the top 50 projects ineach of 13 categories was collected on March 9, 2006. However,one category, VoIP, had only 47 projects that had developed aproduction/stable version, resulting in an initial sample of 647projects.
The final data set was reduced by applying three additionalcriteria for the sample we used in testing our research hypotheses.The criteria are summarized in Table 2.
As shown, when we applied these criteria, the sample wasreduced to 118.
3.2.2. Bug tracking
SourceForge.net provided developers with tools for trackingfour primary types of events: (1) bugs, (2) support requests, (3)patches, and (4) feature requests. We included data on all of thesein our data set, referring to them collectively as bugs throughoutthe paper. An important measure of organizational learning wasthe comparison of the ratio between reported and resolved bugs.After applying all project selection criteria our final pool of bugsacross the 118 projects in the sample consisted of 91,745 reportedand 73,253 resolved. The data was then aggregated to produceweekly averages for each project. The result was a data setcapturing 14,293 observations (project-weeks) across the 118projects.
Table 2Project selection criteria for data sampling.
Criterion Comment Number of projects
after applying criterion
Select top 50 projects from
the 13 project categories
Rankings were based on SourceForge.net’s internal ranking system. With only 47 for one category 647
Resolve data duplication issues 61 projects were multi-listed (in two or more categories). These projects were only included in the
category where they received the highest rank
586
Limit projects to those that
were 2 years or older
The minimum project duration was established to allow a long enough adaptive learning observation
period. 446 projects were less than 2 years old
140
Limit projects to those with a
minimum of 100 reported bugs
This ensured that each project had sufficient bug data for analysis 118
Y.A. Au et al. / Information & Management 46 (2009) 9–1512
3.2.3. Developers
We also collected information about the developers of a givenproject. For each week of the project, we counted the number ofregistered developers (DeveloperCategory), as well as the numberof projects (DeveloperExperience) in which each developer wasregistered. Of course, the number of registered developers on agiven project changed over time. For time periods where data wasmissing, we calculated a trend value using a linear regression ‘‘leastsum of squares’’ formula. A linear trend was preferable to acurvilinear trend line based on characteristics of the data. We usedthis data to test our hypotheses that the percentage of bugsassigned to specific developers was negatively related to bugresolution time and that the average number of projects in which adeveloper participated was negatively related to bug resolutiontime.
4. Data analysis and discussion
The distribution of projects and project-weeks across projectcategories is shown in Table 3. In addition, Table 4 shows thedistribution of project-size and project-weeks.
We used Stata/SE 9.2 [17] for our data analysis. We started ouranalysis by checking for problems with pairwise correlationsbetween all independent variables. This required calculating thephi coefficient when both of the variables compared weredichotomous, the point-biserial correlation coefficient when onevariable was dichotomous and the other one was continuous, andthe Pearson correlation coefficient when both variables werecontinuous. The highest pairwise correlation coefficient was46.4%, which is below the commonly used threshold of 60–80%suggested by Kennedy [11].
We next checked for the presence of multicollinearity bycalculating the variance inflation factor (VIF). Our calculations
Table 3Distribution of projects and project-weeks.
Project category Number of projects Number of project-weeks
Clustering 6 599
Networking 8 1342
Multimedia 3 187
Hardware 7 709
VoIP 3 174
SysAdmin 12 1492
Games 9 1163
Security 9 1221
Development 32 4405
Database 9 1062
Enterprise 8 883
Desktop 9 868
Financial 3 188
Total 118 14,293
showed VIF values that ranged between 1.16 and 4.90, well belowthe threshold value of 10, suggesting no multicollinearityproblems. To test for autocorrelation (serial correlation), we usedWooldridge’s test [20] for autocorrelation in panel data models.Our calculation resulted in an insignificant test statistic, indicatingthe absence of serial correlation.
A likelihood ratio (LR) test indicated the presence of hetero-skedastic data in our panel data. To correct for this, we used theStata/SE 9.2 xtgls command, which fit panel-data linear models byusing feasible generalized least squares analysis (FGLS) andallowed estimation in the presence of heteroskedasticity acrosspanels. The model summary results and coefficient estimates areshown in Table 5.
4.1. Learning curve effect as reflected on bug resolution time
H1 stated that as the number of bugs resolved increased, theaverage bug resolution time decreased. The variable CumBugsRe-
solved was defined as the total number of bugs resolved, per week,for weeks 1 thru 108. The regression model was applied to eachProjectCategory over the first 108 weeks of the life of the project.
As shown in Table 5, the negative coefficient for ln(CumBugs-
Resolved) (p < 0.00) indicated that average bug resolution timedecreased as the cumulative number of bugs resolved increased,providing support for the hypothesis. This indicated the presenceof a learning curve effect.
In addition to learning curve effect, we also investigated thepresence of adaptive learning in our sample by examining the ratioof cumulative resolved bugs to cumulative reported bugs. Weplotted a graph of project efficiency to show the effect of adaptivelearning. For comparison, our study was based on the same 108-week period as Huntley’s study. Our study compared the first 108weeks of 118 projects. The projects were categorized according tothe number of developers (i.e., 1–2, 3–7, 8–15, and>15). The graph(Fig. 1) indicates that there was an adaptive learning process, butthey depended on the number of developers. It was interesting tonote that the fluctuation of efficiency over time was the smallest inprojects with >15 developers and largest in projects with 1 to 2developers.
One potential pitfall in measuring project efficiency andlearning was the open source phenomenon of project branching.It was possible for several projects within the same project
Table 4Distribution of project size and project-weeks.
Project size Number of project-weeks
1–2 Developers 1199
3–7 Developers 4349
8–15 Developers 4024
>15 Developers 4721
Total 14,293
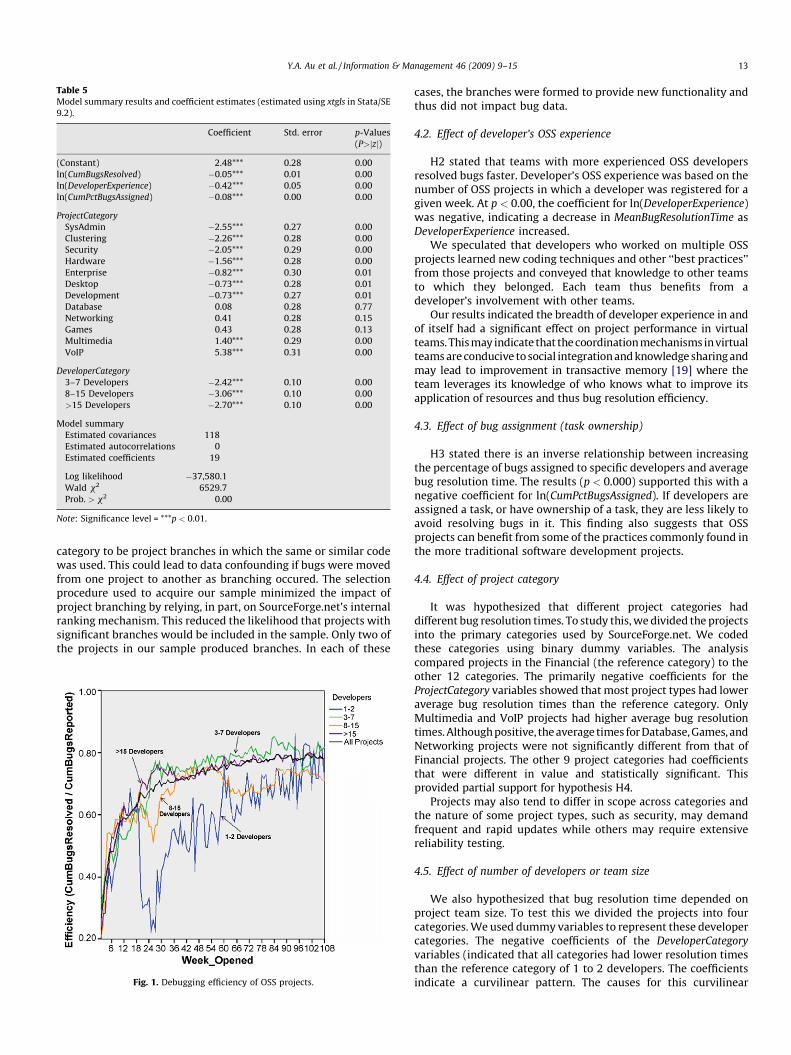
Table 5Model summary results and coefficient estimates (estimated using xtgls in Stata/SE
9.2).
Coefficient Std. error p-Values
(P>jzj)
(Constant) 2.48*** 0.28 0.00
ln(CumBugsResolved) �0.05*** 0.01 0.00
ln(DeveloperExperience) �0.42*** 0.05 0.00
ln(CumPctBugsAssigned) �0.08*** 0.00 0.00
ProjectCategory
SysAdmin �2.55*** 0.27 0.00
Clustering �2.26*** 0.28 0.00
Security �2.05*** 0.29 0.00
Hardware �1.56*** 0.28 0.00
Enterprise �0.82*** 0.30 0.01
Desktop �0.73*** 0.28 0.01
Development �0.73*** 0.27 0.01
Database 0.08 0.28 0.77
Networking 0.41 0.28 0.15
Games 0.43 0.28 0.13
Multimedia 1.40*** 0.29 0.00
VoIP 5.38*** 0.31 0.00
DeveloperCategory
3–7 Developers �2.42*** 0.10 0.00
8–15 Developers �3.06*** 0.10 0.00
>15 Developers �2.70*** 0.10 0.00
Model summary
Estimated covariances 118
Estimated autocorrelations 0
Estimated coefficients 19
Log likelihood �37,580.1
Wald x2 6529.7
Prob. > x2 0.00
Note: Significance level = ***p < 0.01.
Y.A. Au et al. / Information & Management 46 (2009) 9–15 13
category to be project branches in which the same or similar codewas used. This could lead to data confounding if bugs were movedfrom one project to another as branching occured. The selectionprocedure used to acquire our sample minimized the impact ofproject branching by relying, in part, on SourceForge.net’s internalranking mechanism. This reduced the likelihood that projects withsignificant branches would be included in the sample. Only two ofthe projects in our sample produced branches. In each of these
Fig. 1. Debugging efficiency of OSS projects.
cases, the branches were formed to provide new functionality andthus did not impact bug data.
4.2. Effect of developer’s OSS experience
H2 stated that teams with more experienced OSS developersresolved bugs faster. Developer’s OSS experience was based on thenumber of OSS projects in which a developer was registered for agiven week. At p < 0.00, the coefficient for ln(DeveloperExperience)was negative, indicating a decrease in MeanBugResolutionTime asDeveloperExperience increased.
We speculated that developers who worked on multiple OSSprojects learned new coding techniques and other ‘‘best practices’’from those projects and conveyed that knowledge to other teamsto which they belonged. Each team thus benefits from adeveloper’s involvement with other teams.
Our results indicated the breadth of developer experience in andof itself had a significant effect on project performance in virtualteams. This may indicate that the coordination mechanisms in virtualteams are conducive to social integration and knowledge sharing andmay lead to improvement in transactive memory [19] where theteam leverages its knowledge of who knows what to improve itsapplication of resources and thus bug resolution efficiency.
4.3. Effect of bug assignment (task ownership)
H3 stated there is an inverse relationship between increasingthe percentage of bugs assigned to specific developers and averagebug resolution time. The results (p < 0.000) supported this with anegative coefficient for ln(CumPctBugsAssigned). If developers areassigned a task, or have ownership of a task, they are less likely toavoid resolving bugs in it. This finding also suggests that OSSprojects can benefit from some of the practices commonly found inthe more traditional software development projects.
4.4. Effect of project category
It was hypothesized that different project categories haddifferent bug resolution times. To study this, we divided the projectsinto the primary categories used by SourceForge.net. We codedthese categories using binary dummy variables. The analysiscompared projects in the Financial (the reference category) to theother 12 categories. The primarily negative coefficients for theProjectCategory variables showed that most project types had loweraverage bug resolution times than the reference category. OnlyMultimedia and VoIP projects had higher average bug resolutiontimes. Although positive, the average times for Database, Games, andNetworking projects were not significantly different from that ofFinancial projects. The other 9 project categories had coefficientsthat were different in value and statistically significant. Thisprovided partial support for hypothesis H4.
Projects may also tend to differ in scope across categories andthe nature of some project types, such as security, may demandfrequent and rapid updates while others may require extensivereliability testing.
4.5. Effect of number of developers or team size
We also hypothesized that bug resolution time depended onproject team size. To test this we divided the projects into fourcategories. We used dummy variables to represent these developercategories. The negative coefficients of the DeveloperCategory
variables (indicated that all categories had lower resolution timesthan the reference category of 1 to 2 developers. The coefficientsindicate a curvilinear pattern. The causes for this curvilinear

Table 6Summary of results.
Hypothesis Variable Supported?
H1 CumBugsResolved Yes
H2 DeveloperExperience Yes
H3 CumPctBugsAssigned Yes
H4 ProjectCategory Partial—Database, Financial, Games, and
Networking did not show a significant
difference in average bug resolution times
H5 DeveloperCategory Yes
Y.A. Au et al. / Information & Management 46 (2009) 9–1514
pattern in the average bug resolution time include communicationcomplexity, organizational complexity, management effectivenessand project complexity as the size of the project changes.
4.6. Summary of results
As shown is Table 6, all of our hypotheses were supported.Based on these results, we provide the following suggestions:
� P
erformance is best in moderately sized teams. OSS projectmanagers formulate a strategy for breaking projects into sub-groups when the number of active developers exceeds 15. Theideal size of each sub-group may be dependent on the projectmanager’s perception of the relative importance of efficiencyversus bug resolution time. Each sub-group should have a leaderthat coordinates with the central development team, which takeson an oversight role to ensure the direction remains consistentwith the goals of the overall project. � P roject performance improves when a greater percentage of bugsare assigned to specific developers. Therefore, OSS projectmanagers should assign bugs to specific developers wheneverpossible. Preferably, bug assignment should be based onexpertise and experience with a given task or module.
� P rojects with developers who participate in a large number ofother projects are more efficient in resolving bugs. Thusmanagers should encourage developers who work on multipleprojects to participate in similar development projects.
� K nowledge sharing apparently increases when developers workon more projects. Developers learn when participating inprojects and bring their knowledge back to teams in whichthey participate. Thus, managers should foster an environmentthat facilitates knowledge sharing.
5. Conclusions
Our study contributes to the body of literature by providingempirical evidence of virtual organizational learning in a largenumber of OSS development projects.
Our results suggest that both adaptive and organizationallearning were observed in the projects. We also found that OSSdevelopment project performance was influenced by the number ofdevelopers on the team, the amount of experience that theypossessed, project category, and percentage of bugs assigned to aperson. In addition, our results indicated that though smaller teamslearned faster, they suffered from greater variability in efficiency.
Open source developers work on projects voluntarily. As such,they tend to work on projects or tasks that they consider fun,interesting, challenging, and/or that can bring them notoriety. It israre for traditional developers to be able to pick and choose projectsor tasks. Also in OSS projects, end-users play a more interactive role.They review the actual code during development, run and testmodules, suggesting modifications and even how to fix bugs.
Reliability and decreased cost are often cited as benefits of OSS[1]. There appears to be a camaraderie among the OSS community
in which the lesser skilled developers can learn from the moreexperienced ones [21].
Development costs are lower because many, if not all,developers are volunteers. However, the cost of using the actualsoftware may not be less. End-users and support staff still needtraining and more resources may be required to take full advantageof the software.
Acknowledgments
The authors wish to thank the anonymous reviewers from the18th Information Resources Management Association Interna-tional Conference (IRMA2007) for useful suggestions on an earlyversion of this paper, Greg Madey for providing access toSourceForge.net database, the participants in a seminar at theUniversity of Texas at San Antonio in 2007 for their helpfulcomments, and the College of Business of the University of Texas atSan Antonio for providing financial and technical support for thisresearch.
References
[1] M. AlMarzouq, L. Zheng, G. Rong, V. Grover, Open source: concepts, benefits, andchallenges, Communication of the Association for Information Systems 2005 (16),2005, pp. 756–784.
[2] L. Argote, S.L. Beckman, D. Epple, The persistence and transfer of learning inindustrial settings, Management Science 36 (2), 1990, pp. 140–154.
[3] C. Argyris, D.A. Sch?n, Organizational Learning, Addison-Wesley, Readings, MA,1978.
[4] S. Christley, G. Madey, Analysis of activity in the open source software develop-ment community, in: R.H. Sprague, Jr. (Ed.), in: Proceedings of the 40th HawaiiInternational Conference on System Sciences, IEEE Computer Society Press, LosAlamitos, CA, 2007.
[5] R.M. Cyert, J.G. March, A Behavioral Theory of the Firm, Prentice-Hall, EnglewoodCliffs, NJ, 1963.
[6] C.M. Fiol, M.A. Lyles, Organizational learning, Academy of Management Review 10(4), 1985, pp. 803–813.
[7] R. Grewal, G.L. Lilien, G. Mallapragada, Location, location, location: how networkembeddedness affects project success in open source systems, ManagementScience 52 (7), 2006, pp. 1043–1056.
[8] J. Howison, K. Crowston, The perils and pitfalls of mining SourceForge, in:Proceedings of Mining Software Repositories Workshop, International Conferenceon Software Engineering, Edinburgh, Scotland, 2004.
[9] C.L. Huntley, Organizational learning in open-source software projects: an ana-lysis of debugging data, IEEE Transactions on Engineering Management 50 (4),2003, pp. 485–493.
[10] H.G. Hwang, J. Guynes, The effect of group size on group performance in com-puter-supported decision making, Information & Management 26 (4), 1994, pp.189–198.
[11] P. Kennedy, A Guide to Econometrics, fifth ed., The MIT Press, Cambridge, MA,2003.
[12] E.A. Locke, G.P. Latham, Building a practically useful theory of goal setting andtask motivation, American Psychologist 57 (2), 2002, pp. 705–717.
[13] A. Mockus, R.T. Fielding, J.D. Herbsleb, Two case studies of open source softwaredevelopment: Apache and Mozilla, ACM Transactions on Software Engineeringand Methodology 11 (3), 2002, pp. 309–346.
[14] B.E. Munkvold, I. Zigurs, Process and technology challenges in swift-startingvirtual teams, Information & Management 44 (3), 2007, pp. 287–299.
[15] C. Okoli, W. Oh, Investigating recognition-based performance in an open contentcommunity: a social capital perspective, Information & Management 44 (3), 2007,pp. 240–252.
[16] R.H. Rasch, H.L. Tosi, Factors affecting software developers’ performance: anintegrated approach, MIS Quarterly 16 (3), 1992, pp. 395–413.
[17] StataCorp, Stata Statistical Software: Release 9, StataCorp LP, College Station, TX,2005.
[18] M.M. Wasko, S. Faraj, Why should I share? Examining social capital and knowl-edge contribution in electronic networks of practice MIS Quarterly 29 (1), 2005,pp. 35–57.
[19] D.M. Wegner, Transactive memory: a contemporary analysis of the group mind,in: B. Mullen, G.R. Goethals (Eds.), Theories of Group Behavior, Springer-Verlag,New York, NY, 1986, pp. 185–205.
[20] J.M. Wooldridge, Econometric Analysis of Cross Section and Panel Data, The MITPress, Cambridge, MA, 2002.
[21] C.-G. Wu, J.H. Gerlach, C. Young, An empirical analysis of open source softwaredevelopers’ motivations and continuance intentions, Information & Management44 (3), 2007, pp. 253–262.
[22] L.E. Yelle, The learning curve: historical review and comprehensive survey,Decision Sciences 10, 1979, pp. 302–328.

Y.A. Au et al. / Information & Management 46 (2009) 9–15 15
Yoris A. Au is an assistant professor in the Department of
Information Systems and Technology Management of the
College of Business at the University of Texas at San
Antonio. He received a Ph.D. in Information and Decision
Sciences from the University of Minnesota. His research
interestsincludeeconomicsoftechnologyadoption,open
source software, and electronic billing and payment. He
has published in such journals as Communications of the
AIS, Electronic Commerce Research and Applications,
Information & Management, Information Systems and E-
Business Management, and Journal of Management Infor-
mation Systems. He currently serves as an associate editor
for Electronic Commerce Research and Applications.
Darrell R. Carpenter is Ph.D. candidate in information
technology at The University of Texas at San Antonio.
He received his masters degree in Information Tech-
nology from The University of Texas at San Antonio. His
research interests include biometrics, information
systems privacy, the influence of ethnicity on informa-
tion system adoption, measurement of information
system success in non-profit organizations, and open
source software development.
Xiaogang Chen is Ph.D. candidate of information
technology at The University of Texas at San Antonio.
He received his masters degree in Management
Information Systems from Claremont Graduate Uni-
versity. His research interests include open source
software, knowledge management, and virtual team
cognition.
Jan Guynes Clark is professor of information systems
at The University of Texas at San Antonio. She received
her Ph.D. from the University of North Texas. Her
research interests include the impact of information
technologies on productivity and performance, infor-
mation security, and IS strategies. Her publications
have appeared in leading journals such as Commu-
nications of the AIS, Communications of the ACM, IEEE
Transactions on Engineering Management, and Informa-
tion & Management.