Embed Size (px)
Citation preview

Virginia’s Audiology Workforce: 2013
Healthcare Workforce Data Center
July 2014
Virginia Department of Health Professions Healthcare Workforce Data Center
Perimeter Center 9960 Mayland Drive, Suite 300
Richmond, VA 23233 804-367-2115, 804-527-4466(fax) E-mail: [email protected]
Follow us on Tumblr: www.vahwdc.tumblr.com

Virginia Department of Health Professions
David E. Brown, D.C. Director
Jaime H. Hoyle, J.D. Chief Deputy Director
Healthcare Workforce Data Center Staff:
Dr. Elizabeth Carter, Ph.D. Executive Director
Justin Crow, MPA Research Analyst
Laura Jackson Operations Manager
Christopher Coyle Research Assistant
More than 300 Audiologists voluntarily participated in this survey. Without their efforts the work of the center would not be possible. The Department of Health Professions, the Healthcare Workforce Data Center, and the Board of Audiology & Speech-Language Pathology express our sincerest appreciation for your ongoing cooperation.
Thank You!

The Board of Audiology & Speech-Language Pathology
Chair
A. Tucker Gleason, Ph.D., CCC-A Jeffersonton
Vice-Chair
Laura Purcell Verdun, MA, CCC-SLP
Oak Hill
Members
Lillian Beasley Beahm, Au.D., CCC-A Roanoke
George T. Hashisaki, MD
Charlottesville
Wanda L. Pritekel, MA, CCC-SLP Warrenton
Ronald Spencer, RN
Midlothian
Harold Sayles, Ph.D. Henrico

Contents
Results in Brief ............................................................................................................................................................................ 2
Survey Response Rates ............................................................................................................................................................... 3
The Workforce ............................................................................................................................................................................ 4
Demographics ............................................................................................................................................................................. 5
Background ................................................................................................................................................................................ 6
Education ................................................................................................................................................................................... 8
Specializations & Credentials ...................................................................................................................................................... 9
Current Employment Situation ................................................................................................................................................. 10
Employment Quality ................................................................................................................................................................. 11
2013 Labor Market ................................................................................................................................................................... 12
Work Site Distribution .............................................................................................................................................................. 13
Establishment Type .................................................................................................................................................................. 14
Time Allocation ........................................................................................................................................................................ 16
Patient Workload ..................................................................................................................................................................... 17
Retirement & Future Plans ....................................................................................................................................................... 18
Full-Time Equivalency Units ...................................................................................................................................................... 20
Maps ........................................................................................................................................................................................ 21 Council on Virginia’s Future Regions ............................................................................................................................................ 21 Area Health Education Center Regions ........................................................................................................................................ 22 Workforce Investment Areas ....................................................................................................................................................... 23 Health Services Areas ................................................................................................................................................................... 24 Planning Districts .......................................................................................................................................................................... 25
Appendix .................................................................................................................................................................................. 26 Weights ........................................................................................................................................................................................ 26

1
The Audiology Workforce: At a Glance:
The Workforce Background Current Employment t Licensees: 501 Rural Childhood: 7% Employed in Prof.: 95% Virginia’s Workforce: 406 HS Degree in VA: 27% Hold 1 Full-time Job: 74% FTEs: 375 Prof. Degree in VA: 31% Satisfied?: 96%
Survey Response Rate Education Job Turnover t All Licensees: 67% Au.D.: 59% Switched Jobs in 2013: 5% Renewing Practitioners: 74% Any Doctorate: 69% Employed over 2 yrs: 73%
Demographics Finances Primary Roles t Female: 85% Median Inc.: $60k-$70k Patient Care: 82% Diversity Index: 19% Health Benefits: 53% Administration: 2% Median Age: 45 Under 40 w/ Ed debt: 55% Non-Clinical Educ.: 1%
Source: Va. Healthcare Workforce Data Center

2
Results in Brief
335 audiologists voluntarily took part in the 2013 Audiology Workforce Survey. The Virginia Department of Health
Professions’ Healthcare Workforce Data Center (HWDC) administers the survey during the license renewal process, which takes place every December for audiologists. These survey respondents represent 67% of the 501 audiologists who are licensed in the state and 74% of renewing practitioners.
The HWDC estimates that 406 audiologists participated in Virginia’s workforce during the survey period, which is
defined as those who worked at least a portion of the year in the state or who live in the state and intend to return to work as an audiologist some point in the future. Virginia’s audiology workforce provided 375 “full-time equivalency units” during the survey time period, which the HWDC defines simply as working 2,000 hours a year (or 40 hours per week for 50 weeks with 2 weeks off).
85% of audiologists are female, and the median age of all audiologists is 45. In a random encounter between two
audiologists, there is just a 19% chance that they would be of different races or ethnicities, a measure known as the diversity index. For the Virginia population as a whole, this same probability is 54%. Meanwhile, the diversity index for those audiologists who are under the age of 40 is 18%.
More than one-quarter of all audiologists grew up in a rural area, and 19% of these professionals currently work in
non-Metro areas of the state. Meanwhile, approximately one-third of Virginia’s audiologists graduated from high school in Virginia, while 31% received their initial professional degree in the state. In total, 43% of Virginia’s audiology workforce has some educational background in the state.
Nearly 60% of audiologists hold a Doctor of Audiology (Au.D.) as their highest professional degree, while another
31% have a master’s degree. More than half of audiologists who are under the age of 40 currently carry educational debt. The median debt burden for those with educational debt is between $40,000 and $50,000.
95% of audiologists are currently employed in the profession. Nearly three-quarters hold one full-time position, while another 6% hold two or more position. Less than 1% of audiologists are involuntarily unemployed, while another 2% are voluntarily unemployed. Nearly three-quarters of all audiologists have been at their primary work location for at least two years.
The median annual income for audiologists is between $60,000 and $70,000, while one-quarter earn more than
$90,000 per year. In addition, more than three-quarters of Virginia’s audiology workforce receive at least one employer-sponsored benefit, including more than half who receive employer-sponsored health insurance. 96% of audiologists indicate they are satisfied with their current employment situation, including two-thirds who indicate they are “very satisfied”.
Nearly three-quarters of audiologists work in Northern Virginia, Central Virginia or Hampton Roads. One-quarter of
audiologists worked at two or more locations in the past year. 80% of audiologists work in the private sector, including 69% who work at a for-profit company. Nearly one-quarter of audiologists work at a private group practice, while another 20% work at a physician’s office.
A typical audiologist spends between 80% and 90% of their time in client care activities, with most of the remaining time spent on administrative duties. 82% of audiologists serve a client care role, meaning that at least 60% of their time is spent in client care activities.
43% of audiologists expect to retire by the age of 65. Nearly 20% of the workforce expects to retire in the next
decade, while half the current workforce expects to retire by 2038. Over the next two years, only 4% of audiologists plan on leaving either the state or the profession. Meanwhile, 13% of audiologists expect to pursue additional educational opportunities in the next two years, and 13% plan on increasing client care activities.

3
Survey Response Rates
A Closer Look:
Response Rates
Statistic Non
Respondents Respondent
Response Rate
By Age
Under 30 24 15 39%
30 to 34 22 41 65%
35 to 39 21 53 72%
40 to 44 18 48 73%
45 to 49 16 31 66%
50 to 54 22 46 68%
55 to 59 16 43 73%
60 and Over 27 58 68%
Total 166 335 67%
New Licenses
Issued in 2013 27 6 18%
Metro Status
Non-Metro 15 18 55%
Metro 116 248 68%
Not in Virginia 35 69 66%
Licensee Counts License Status # %
Renewing Practitioners
435 87%
New Licensees 33 7%
Non-Renewals 33 7%
All Licensees 501 100%
Response Rates Completed Surveys 335
Response Rate, all licensees 67%
Response Rate, Renewals 74%
At a Glance:
Licensed Audiologists Number: 501 New: 7% Not Renewed: 7%
Survey Response Rates All Licensees: 67% Renewing Practitioners: 74%
Definitions
1. The Survey Period: The survey was conducted in December 2013.
2. Target Population: All audiologists who held a Virginia license at some point in 2013.
3. Survey Population: The survey was available to those who renewed their licenses online. It was not available to those who did not renew, including some audiologists newly licensed in 2013.
Our surveys tend to achieve very high response rates. 74% of renewing audiologists submitted a
survey. These represent 67% of audiologists who held a license at some point in 2013.
Source: Va. Healthcare Workforce Data Center
Source: Va. Healthcare Workforce Data Center
Source: Va. Healthcare Workforce Data Center
Source: Va. Healthcare Workforce Data Center

4
The Workforce
Virginia's Audiology Workforce
Status # %
Worked in Virginia in Past Year
402 99%
Looking for Work in Virginia
4 1%
Virginia's Workforce
406 100%
Total FTEs 375
Licensees 501
At a Glance:
Workforce 2013 Audiology Workforce: 406 FTEs: 375
Utilization Ratios Licensees in VA Workforce: 81% Licensees per FTE: 1.34 Workers per FTE: 1.08
Definitions
1. Virginia’s Workforce: A licensee with a primary or secondary work site in Virginia at any time in 2013 or who indicated intent to return to Virginia’s workforce at any point in the future.
2. Full Time Equivalency Unit (FTE): The HWDC uses 2,000 (40 hours for 50 weeks) as its baseline measure for FTEs.
3. Licensees in VA Workforce: The proportion of licensees in Virginia’s Workforce.
4. Licensees per FTE: An indication of the number of licensees needed to create 1 FTE. Higher numbers indicate lower licensee participation.
5. Workers per FTE: An indication of the number of workers in Virginia’s workforce needed to create 1 FTE. Higher numbers indicate lower utilization of available workers.
This report uses weighting to
estimate the figures in this
report. Unless otherwise noted,
figures refer to the Virginia
Workforce only. For more
information on HWDC’s
methodology visit:
www.dhp.virginia.gov/hwdc
Source: Va. Healthcare Workforce Data Center
Source: Va. Healthcare Workforce Data Center
Source: Va. Healthcare Workforce Data Center

5
Demographics
A Closer Look:
Age & Gender
Age Male Female Total
# %
Male # % Female #
% in Age Group
Under 30 0 0% 34 100% 34 9%
30 to 34 3 7% 44 94% 47 12%
35 to 39 5 9% 57 91% 62 16%
40 to 44 3 5% 47 95% 50 13%
45 to 49 7 18% 33 82% 40 10%
50 to 54 15 26% 42 74% 57 15%
55 to 59 7 16% 36 84% 43 11%
60 + 17 29% 43 71% 60 15%
Total 58 15% 335 85% 393 100%
Race & Ethnicity
Race/ Ethnicity
Virginia* Audiologists Audiologists
Under 40
% # % # %
White 64% 357 90% 131 90%
Black 19% 12 3% 6 4%
Asian 6% 13 3% 4 3%
Other Race 0% 3 1% 1 1% Two or more races
2% 5 1% 0 0%
Hispanic 8% 7 2% 3 2%
Total 100% 397 100% 145 100% *Population data in this chart is from the US Census, ACS 1-yr estimates, 2011 vintage.
At a Glance:
Gender % Female: 85% % Under 40 Female: 94%
Age Median Age: 45 % Under 40: 36% % 55+: 26%
Diversity Diversity Index: 19% Under 40 Div. Index: 18%
In a chance encounter between two audiologists, there is a 19% chance that they would be of a different race/ethnicity (a measure known as the Diversity Index), For Virginia’s population as a whole, the comparable number is 54%.
85% of all audiologists are women, including 94% of audiologists under the age of
40. The median age of audiologists is 45.
Source: Va. Healthcare Workforce Data Center
Source: Va. Healthcare Workforce Data Center
Source: Va. Healthcare Workforce Data Center
Source: Va. Healthcare Workforce Data Center

6
Background
A Closer Look:
Primary Location: USDA Rural Urban Continuum
Rural Status of Childhood Location
Code Description Rural Suburban Urban
Metro Counties
1 Metro, 1 million+ 19% 72% 9%
2 Metro, 250,000 to 1 million 28% 72% -
3 Metro, 250,000 or less 40% 53% 7%
Non-Metro Counties
4 Urban pop 20,000+, Metro adj
56% 44% -
6 Urban pop, 2,500-19,999, Metro adj
83% 17% -
7 Urban pop, 2,500-19,999, nonadj
73% 27% -
8 Rural, Metro adj - - -
9 Rural, nonadj 25% 75% -
Overall 27% 66% 7%
At a Glance:
Childhood Urban Childhood: 7% Rural Childhood: 27%
Virginia Background HS in Virginia: 34% Prof. Education in VA: 31% HS/Prof. Educ. in VA: 43%
Location Choice % Rural to Non-Metro: 19% % Urban/Suburban
to Non-Metro: 4%
27% of audiologists grew up in self-described rural areas, but
just 8% of all audiologists currently work in non-Metro
counties.
43% off Virginia’s audiologists have a background (i.e., a high
school or professional degree) in the state.
Source: Va. Healthcare Workforce Data Center Source: Va. Healthcare Workforce Data Center
Source: Va. Healthcare Workforce Data Center
Source: Va. Healthcare Workforce Data Center

7
Top Ten States for Audiologist Recruitment
Rank
All Professionals
High School # Professional
School #
1 Virginia 136 Virginia 124
2 Pennsylvania 28 Tennessee 36
3 Maryland 24 Washington, D.C. 33
4 New York 24 West Virginia 21
5 West Virginia 21 Maryland 17
6 Outside of U.S. 16 Ohio 17
7 Ohio 15 North Carolina 16
8 Michigan 13 New York 16
9 Indiana 11 Michigan 10
10 New Jersey 10 Pennsylvania 10
Rank
Licensed in the Past 5 Years
High School # Professional
School #
1 Virginia 23 Tennessee 19
2 Pennsylvania 10 Washington, D.C. 10
3 New York 7 Virginia 10
4 Georgia 5 Maryland 8
5 Outside of U.S. 4 Texas 5
6 Tennessee 4 Pennsylvania 4
7 Texas 4 North Carolina 4
8 Ohio 4 Alabama 4
9 Florida 4 Missouri 3
10 Maryland 4 Connecticut 3
34% of Virginia’s audiologists received their high school degree
in Virginia, and 31% received their initial professional degree in
the state.
At a Glance:
Not in VA Workforce Total: 95 % of Licensees: 19% Federal/Military: 16% Va Border State/DC: 33%
Nearly 20% of licensed audiologists did not participate in Virginia’s workforce in 2013. 85%
of these audiologists worked at some point in the past year, and 82% currently work as
audiologists.
Source: Va. Healthcare Workforce Data Center Source: Va. Healthcare Workforce Data Center
Source: Va. Healthcare Workforce Data Center
Among audiologists who have been licensed in the past five years, 24% received their
high school degree in Virginia, but just 10% received their initial professional degree in the state.
In fact, more of these audiologists received their initial
professional degree in Tennessee.

8
Education
A Closer Look:
Highest Professional Degree Degree # %
Masters Degree 120 31%
Au.D. 227 59%
Ph.D. 35 9%
Other Doctorate 3 1%
Total 386 100%
Educational Debt
Amount Carried
All Audiologists
Audiologists Under 40
# % # %
None 229 69% 57 46%
Less than $10,000 11 3% 2 2%
$10,001-$20,000 14 4% 10 8%
$20,001-$30,000 11 3% 7 6%
$30,001-$40,000 14 4% 8 6%
$40,001-$50,000 12 4% 12 10%
$50,001-$60,000 7 2% 3 2%
$60,001-$70,000 4 1% 4 3%
$70,001-$80,000 9 3% 4 3%
$80,001-$90,000 2 1% 2 2%
$90,001-$100,000 4 1% 3 2%
Over $100,000 13 4% 13 10%
Total 330 100% 124 100%
At a Glance:
Education Doctor of Audiology: 59% Masters Degree: 31%
Educational Debt Carry debt: 31% Under age 40 w/ debt: 55% Median debt: $40k-$50k
31% of audiologists currently have educational debt, including
55% of those under the age of 40. For those with educational debt, the median amount is between
$40,000 and $50,000.
Source: Va. Healthcare Workforce Data Center
Source: Va. Healthcare Workforce Data Center
Source: Va. Healthcare Workforce Data Center
59% of audiologists have a Doctor of Audiology (Au.D.) as their highest professional degree, while an additional 10% have another Doctoral Degree.

9
Specializations & Credentials
A Closer Look:
Self-Designated Specialties Specialty # %
Hearing Aids/Devices 249 61%
Pediatrics 131 32%
Geriatrics 113 28%
Vestibular 92 23%
Educational 62 15%
Occupational Hearing Conservation
53 13%
Cochlear Implants 43 11%
Intraoperative Monitoring 10 2%
Other 39 10%
Have at least 1 Specialty 317 78%
Credentials Credential # %
CCC-A: Audiology 340 84%
Hearing Aid Dispenser License
254 63%
F-AAA Fellow 206 51%
ABA Certification 22 5%
CCC-SLP: Speech-Language Pathology
13 3%
CI: Cochlear Implants 2 0%
PASC: Pediatric Audiology 2 0%
BCS-ION: Intraoperative Monitoring
0 0%
Other 13 3%
Have at least 1 Credential 388 96%
At a Glance:
Top Specialties Hearing Aids/Devices: 61% Pediatrics: 32% Geriatrics: 28%
Top Credentials CCC-A Audiology: 84% Hearing Aid Disp. Lic.: 63% F-AAA Fellow: 51%
Source: Va. Healthcare Workforce Data Center
Source: Va. Healthcare Workforce Data Center
More than three-quarters of all audiologists have at least one
self-designated specialty, and 96% have at least one credential.
Hearing Aids & Devices is the most common self-designated
specialization, while CCC-A Audiology is the most common
credential.
Source: Va. Healthcare Workforce Data Center

10
Current Employment Situation
A Closer Look:
Current Work Status Status # %
Employed, capacity unknown 0 0%
Employed in an audiology-related capacity
375 95%
Employed, NOT in an audiology-related capacity
8 2%
Not working, reason unknown 0 0%
Involuntarily unemployed 1 0%
Voluntarily unemployed 8 2%
Retired 1 0%
Total 394 100%
Current Positions Positions # %
No Positions 10 3%
One Part-Time Position 67 17%
Two Part-Time Positions 6 2%
One Full-Time Position 288 74%
One Full-Time Position & One Part-Time Position
18 5%
Two Full-Time Positions 0 0%
More than Two Positions 0 0%
Total 389 100%
Current Weekly Hours Hours # %
0 hours 10 3%
1 to 9 hours 4 1%
10 to 19 hours 17 4%
20 to 29 hours 31 8%
30 to 39 hours 79 20%
40 to 49 hours 203 52%
50 to 59 hours 29 7%
60 to 69 hours 14 4%
70 to 79 hours 0 0%
80 or more hours 3 1%
Total 390 100%
At a Glance:
Employment Employed in Profession: 95% Involuntarily Unemployed: 0%
Positions Held 1 Full-time: 74% 2 or More Positions: 6%
Weekly Hours: 40 to 49: 52% 60 or more: 4% Less than 30: 13%
95% of licensed audiologists are employed in the profession, and less than 1% are involuntary unemployed. Nearly three-quarters of audiologists have full-time work, while 6% have two or more
positions. More than half of audiologists work between 40 and 49 hours per week, while 4% of audiologists work at least 60 hours per week.
Source: Va. Healthcare Workforce Data Center
Source: Va. Healthcare Workforce Data Center
Source: Va. Healthcare Workforce Data Center
Source: Va. Healthcare Workforce Data Center
Source: Va. Healthcare Workforce Data Center

11
Employment Quality
A Closer Look:
Income Hourly Wage # %
Volunteer Work Only 2 1%
$20,000 or less 17 6%
$20,001-$30,000 10 3%
$30,001-$40,000 18 6%
$40,001-$50,000 19 7%
$50,001-$60,000 42 15%
$60,001-$70,000 50 17%
$70,001-$80,000 40 14%
$80,001-$90,000 35 12%
$90,001-$100,000 17 6%
$100,001-$110,000 10 4%
$110,001-$120,000 7 2%
$120,000 and over 22 8%
Total 289 100%
Employer-Sponsored Benefits Benefit # %
Paid Vacation 248 66%
Paid Sick Leave 236 63%
Health Insurance 199 53%
Retirement 164 44%
Dental Insurance 149 40%
Group Life Insurance 115 31%
Signing/Retention Bonus 19 5%
Receive at least one benefit* 290 77% *From any employer at time of survey.
Job Satisfaction Level # %
Very Satisfied 251 66%
Somewhat Satisfied 112 30%
Somewhat Dissatisfied 12 3%
Very Dissatisfied 3 1%
Total 378 100%
At a Glance:
Hourly Earnings Median Income: $60k-70k Middle 50%: $50k-$90k
Benefits Employer Health Insrnce: 53% Employer Retirement: 44%
Satisfaction Satisfied: 96% Very Satisfied: 66%
The median annual income for audiologists is between $60,000 and $70,000, while one-quarter earn more than
$90,000 per year. 77% of audiologists receive at least one
employer-sponsored benefit, including 53% who receive
health insurance.
96% of audiologists were satisfied with their jobs, including
two-thirds who were very satisfied.
Source: Va. Healthcare Workforce Data Center
Source: Va. Healthcare Workforce Data Center

12
2013 Labor Market
A Closer Look:
1
1 As reported by the US Bureau of Labor Statistics for 2013. The not seasonally adjusted monthly unemployment rate ranged from
6.3% in January to 4.8% in December.
Underemployment in Past Year In the past year did you . . .? # %
Experience Involuntary Unemployment? 7 2%
Experience Voluntary Unemployment? 19 5%
Work Part-time or temporary positions, but would have preferred a full-time/permanent position?
7 2%
Work two or more positions at the same time? 35 9%
Switch employers or practices? 19 5%
Experienced at least 1 81 20%
Location Tenure
Tenure Primary Secondary
# % # %
Not Currently Working at this Location
8 2% 8 8%
Less than 6 Months 19 5% 6 6%
6 Months to 1 Year 18 5% 4 4%
1 to 2 Years 56 15% 17 18%
3 to 5 Years 85 22% 25 26%
6 to 10 Years 66 17% 12 13%
More than 10 Years 126 33% 25 26%
Subtotal 378 100% 96 100%
Did not have location 4
304
Item Missing 24
6
Total 406
406
Employment Type
Primary Work Site # %
Salary/ Commission 205 64%
Hourly Wage 61 19%
By Contract 10 3%
Business/ Practice Income
45 14%
Unpaid 0 0%
Subtotal 321 100%
At a Glance:
Unemployment Experience 2013 Involuntarily Unemployed: 2% Underemployed: 2%
Stability Switched: 5% New Location: 12% Over 2 years: 73% Over 2 yrs, 2nd location: 65%
Employment Type Salary/Commission: 64% Hourly Wage: 19% Hourly Wage: 72%
Only 2% of Virginia’s audiologists were involuntary unemployed at some point in 2013. For comparison,
Virginia’s average monthly unemployment rate was 5.5%.2
Nearly three-quarters of audiologists have worked at their primary location for more than 2
years.
64% of audiologists receive a salary or commission at their primary work location, while 19% receive an hourly
wage.
Source: Va. Healthcare Workforce Data Center
Source: Va. Healthcare Workforce Data Center
Source: Va. Healthcare Workforce Data Center
Source: Va. Healthcare Workforce Data Center

13
Work Site Distribution
A Closer Look:
Regional Distribution of Work Locations
COVF Region
Primary Location
Secondary Location
# % # %
Central 74 20% 13 13%
Eastern 3 1% 0 0%
Hampton Roads 67 18% 14 14%
Northern 135 36% 35 35%
Southside 10 3% 12 12%
Southwest 21 6% 4 4%
Valley 29 8% 7 7%
West Central 36 9% 4 4%
Virginia Border State/DC
4 1% 7 7%
Other US State 0 0% 3 3%
Outside of the US 0 0% 0 0%
Total 379 100% 99 100%
Item Missing 21
3
Number of Work Locations
Locations
Work Locations in
2013
Work Locations
Now*
# % # %
0 4 1% 11 3%
1 299 74% 280 73%
2 50 12% 49 13%
3 43 11% 35 9%
4 6 1% 4 1%
5 0 0% 0 0%
6 or More
3 1% 3 1%
Total 406 100% 382 100% *At the time of survey completion, December 2013.
Source: Va. Healthcare Workforce Data Center
At a Glance:
Concentration Top Region: 36% Top 3 Regions: 73% Lowest Region: 1%
Locations 2 or more (2013): 25% 2 or more (Now*): 24%
Nearly three-quarters of audiologists had just one work
location in 2013, while another 12% had two work locations during the
year.
More than one-third of audiologists work in Northern
Virginia, while another 20% work in Central Virginia. Meanwhile, Eastern Virginia has the lowest
concentration of audiologists in the state.
Source: Va. Healthcare Workforce Data Center
Source: Va. Healthcare Workforce Data Center

14
Establishment Type
A Closer Look:
Location Sector
Sector
Primary Location
Secondary Location
# % # %
For-Profit 245 69% 75 82%
Non-Profit 39 11% 4 4%
State/Local Government 48 14% 7 8%
Veterans Administration 13 4% 5 5%
U.S. Military 7 2% 1 1%
Other Federal Gov’t 3 1% 0 0%
Total 355 100% 92 100%
Did not have location 4
304
Item Missing 46
10
At a Glance: (Primary Locations)
Sector For Profit: 69% Federal: 7%
Top Establishments Private Practice (Group): 24% Physician Office: 20% Private Practice (Solo): 15%
69% of audiologists work in a for-profit company, while
another 14% work in state or local government. Meanwhile,
11% of audiologists work in the non-profit sector, and 7% work
for the federal government.
Source: Va. Healthcare Workforce Data Center
Source: Va. Healthcare Workforce Data Center
Source: Va. Healthcare Workforce Data Center

15
Top 10 Location Type
Establishment Type
Primary Location
Secondary Location
# % # %
Private Practice (Group) 82 24% 28 31%
Physician Office 71 20% 22 24%
Private Practice (Solo) 52 15% 15 16%
Hospital (Outpatient) 50 14% 13 14%
School (Providing Care to Clients) 28 8% 4 4%
Academic Institution (Teaching Health Professions Students)
14 4% 4 4%
Community-Based Clinic/Health Center
12 3% 1 1%
Administrative/Business Organization
4 1% 0 0%
Hospital (Inpatient) 4 1% 0 0%
Residential Facility/Group Home 2 1% 0 0%
Rehabilitation Facility 1 0% 0 0%
Other 27 8% 4 4%
Total 347 100% 91 100%
Does not have location 4 304
For secondary work locations, nearly half of
audiologists work in a private practice, while nearly one-
quarter work in a physician’s office.
Nearly one-quarter of audiologists work in a private group practice, while another
20% work in a physician’s office. Meanwhile, 15% work in a private solo practice, and
14% work in the outpatient department of a hospital.
Source: Va. Healthcare Workforce Data Center
Source: Va. Healthcare Workforce Data Center

16
Time Allocation
A Closer Look:
Time Allocation
Time Spent
Client Care Admin. Non-Clinical Education
Professional Education
Research Other
Prim Site
Sec. Site
Prim Site
Sec. Site
Prim Site
Sec. Site
Prim Site
Sec. Site
Prim Site
Sec. Site
Prim Site
Sec. Site
All or Almost All (80-100%)
51% 59% 2% 6% 0% 0% 0% 3% 0% 0% 0% 2%
Most (60-79%)
31% 16% 0% 2% 1% 0% 0% 0% 0% 1% 0% 0%
About Half (40-59%)
8% 6% 6% 2% 0% 0% 0% 0% 0% 0% 0% 0%
Some (20-39%)
5% 0% 28% 22% 2% 3% 2% 0% 1% 0% 1% 0%
A Little (1-20%)
1% 7% 54% 41% 24% 9% 26% 16% 6% 6% 13% 7%
None (0%)
3% 13% 9% 29% 72% 88% 71% 79% 93% 94% 86% 91%
At a Glance: (Primary Locations)
Typical Time Allocation Client Care: 80%-89% Administration: 10%-19%
Roles Patient Care: 82% Administration: 2% Non-Clinical Educ.: 1%
Administration Time Median Admin Time: 10%-19% Ave. Admin Time: 10%-19%
A typical audiologist spends most of their time in client care activities, with most of the remaining time handling administrative tasks. 82% of audiologists fill a client care role, defined as spending 60% or more of their time in that activity.
Source: Va. Healthcare Workforce Data Center
Source: Va. Healthcare Workforce Data Center
Source: Va. Healthcare Workforce Data Center
Source: Va. Healthcare Workforce Data Center
Source: Va. Healthcare Workforce Data Center

17
Patient Workload
A Closer Look:
# of Weekly Sessions
Primary Work Location Secondary Work Location
Individual Sessions Group Sessions Individual Sessions Group Sessions
# % # % # % # %
None 19 5% 319 92% 11 12% 84 89%
1-9 27 8% 24 7% 27 28% 6 6%
10-19 56 16% 1 0% 31 33% 4 4%
20-29 85 24% 0 0% 15 16% 0 0%
30-39 59 17% 1 0% 9 9% 0 0%
40-49 47 14% 0 0% 0 0% 0 0%
50-59 25 7% 0 0% 1 1% 0 0%
60-69 11 3% 0 0% 0 0% 0 0%
70-79 7 2% 0 0% 0 0% 0 0%
80 or more 10 3% 0 0% 2 2% 0 0%
Total 347 100% 346 100% 95 100% 94 100%
Patients / Week
Primary Work Location
Secondary Work Location
Total
# % # % # %
None 18 5% 11 12% 16 5%
1-9 21 6% 22 23% 20 6%
10-19 55 16% 30 32% 39 11%
20-29 85 24% 18 19% 76 22%
30-39 60 17% 11 12% 49 14%
40-49 48 14% 0 0% 51 15%
50-59 24 7% 1 1% 44 13%
60-69 12 3% 0 0% 22 6%
70-79 9 3% 0 0% 10 3%
80 or more
16 5% 2 2% 23 6%
Total 348 100% 95 100% 350 100%
At a Glance:
Weekly Patient Totals (Median) Primary Location: 20-29 Secondary Location: 10-19 Total 30-39
% with Group Sessions Primary Location: 8% Secondary Location: 11%
Source: Va. Healthcare Workforce Data Center
Source: Va. Healthcare Workforce Data Center
Source: Va. Healthcare Workforce Data Center
A typical audiologist has between 20 and 29 individual patient sessions at their primary work location. In addition, 8% of audiologists participate in group patient sessions at their primary work location. Overall, the typical audiologist sees between 30 and 39 patients per week across both primary and secondary work locations.

18
Retirement & Future Plans
A Closer Look:
Retirement Expectations
Expected Retirement Age
All Over 50
# % # %
Under age 50 6 2% - -
50 to 54 5 2% 1 1%
55 to 59 27 9% 10 8%
60 to 64 94 30% 36 29%
65 to 69 112 36% 46 37%
70 to 74 39 13% 19 15%
75 to 79 4 1% 3 2%
80 or over 6 2% 4 3%
I do not intend to retire 15 5% 7 6%
Total 309 100% 126 100%
Future Plans
2 Year Plans: # %
Decrease Participation
Leave Profession 5 1%
Leave Virginia 11 3%
Decrease Client Care Hours 18 4%
Decrease Teaching Hours 1 0%
Increase Participation
Increase Client Care Hours 51 13%
Increase Teaching Hours 17 4%
Pursue Additional Education 53 13%
Return to Virginia’s Workforce 1 0%
At a Glance:
Retirement Expectations All Audiologists Under 65: 43% Under 60: 12% Audiologists 50 and over Under 65: 37% Under 60: 9%
Time until Retirement Within 2 years: 5% Within 10 years: 19% Half the workforce: by 2038
Approximately two-thirds of all audiologists expect to retire at some point in their 60s, while more than 20% expect to work until at least age 70. Among audiologists who are over the age of 50, two-
thirds still expect to retire in their 60s. Meanwhile, one-quarter of audiologists over the age of 50 expect to work through at least age 70, including 6% who do not expect to retire at all.
Within the next two years approximately 4% of audiologists
expect to leave either the profession or Virginia. Meanwhile,
13% of audiologists plan on pursuing additional educational
opportunities, and 13% also plan to increase client care hours.
Source: Va. Healthcare Workforce Data Center
Source: Va. Healthcare Workforce Data Center
Source: Va. Healthcare Workforce Data Center

19
Time to Retirement
Expect to retire within. . . # % Cumulative %
2 years 14 5% 5%
5 years 16 5% 10%
10 years 29 9% 19%
15 years 48 16% 35%
20 years 34 11% 46%
25 years 40 13% 59%
30 years 35 11% 70%
35 years 37 12% 82%
40 years 29 9% 91%
45 years 7 2% 94%
50 years 2 1% 94%
55 years 2 1% 95%
In more than 55 years 0 0% 95%
Do not intend to retire 15 5% 100%
Total 309 100%
By comparing retirement expectation to age, we can
estimate the maximum years to retirement for audiologists. Only
5% of audiologists plan on retiring in the next two years, while 19% plan on retiring in the next ten
years. Half of the current audiology workforce expects to be retired by
2038.
Source: Va. Healthcare Workforce Data Center
Source: Va. Healthcare Workforce Data Center
Using these estimates, retirements will begin to reach 10% of the current workforce starting in
2028. Peak retirement years will take place around the same time,
when 16% of the current workforce expects to retire every five years. After 2028, retirements will not
permanently fall below 10% of the current workforce during a five-
year time interval until 2053.

20
Full-Time Equivalency Units
A Closer Look: 2
2 There were also assumption violations in Mixed between-within ANOVA (Levene’s Test was significant).
Full-Time Equivalency Units
Average Median
Age
Under 30 0.79 0.84
30 to 34 0.89 0.88
35 to 39 0.88 0.95
40 to 44 0.90 0.96
45 to 49 1.03 1.17
50 to 54 1.03 1.04
55 to 59 0.95 0.91
60 and Over
0.97 1.06
Gender
Male 1.06 1.08
Female 0.91 0.91
At a Glance:
FTEs Total: 375 Average: 0.93
Age & Gender Effect Age, Partial Eta2: 0.03 Gender, Partial Eta2: 0.011
Partial Eta2 Explained: Partial Eta2 is a statistical
measure of effect size.
.01=Small Effect .06=Medium Effect .138=Large Effect
The average audiologist provided 0.93 FTEs in 2013, or about 36 hours per week for 52 weeks. Statistical tests did not verify any difference in the variability of FTEs by either age or gender.2
Source: Va. Healthcare Workforce Data Center
Source: Va. Healthcare Workforce Data Center Source: Va. Healthcare Workforce Data Center
Source: Va. Healthcare Workforce Data Center

21
Maps
Council on Virginia’s Future Regions

22
Area Health Education Center Regions

23
Workforce Investment Areas

24
Health Services Areas

25
Planning Districts
26
Appendix
Weights
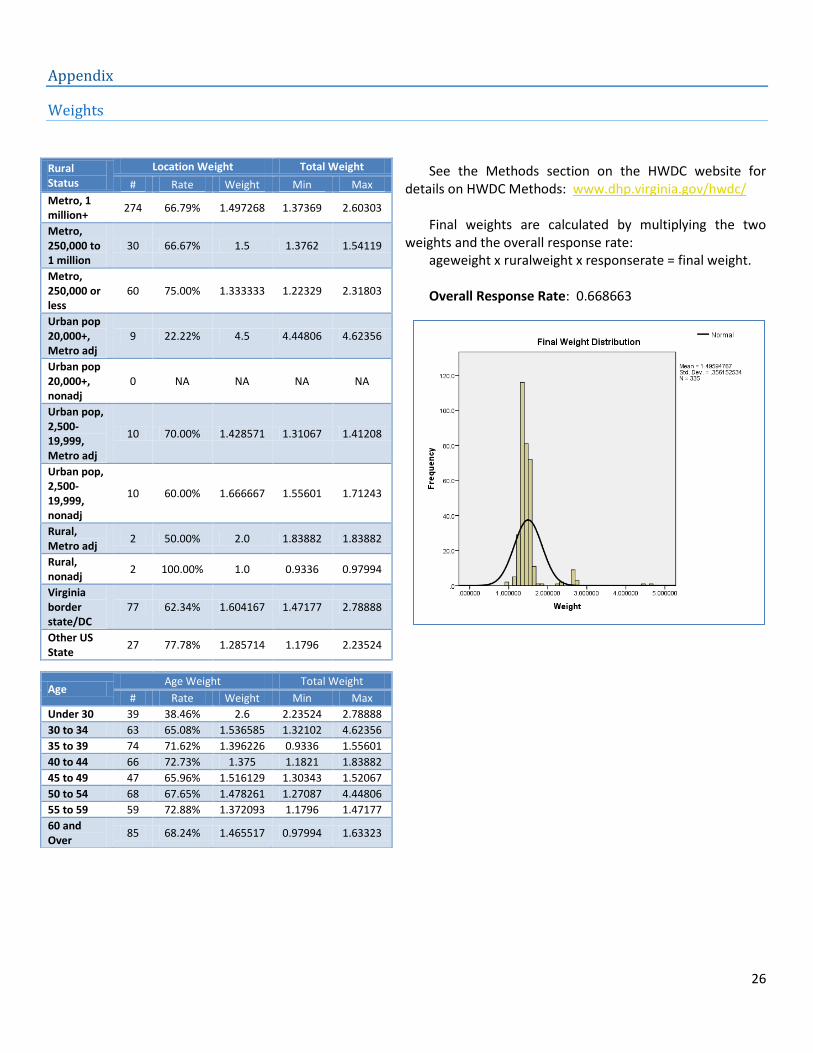
See the Methods section on the HWDC website for
details on HWDC Methods: www.dhp.virginia.gov/hwdc/ Final weights are calculated by multiplying the two
weights and the overall response rate: ageweight x ruralweight x responserate = final weight. Overall Response Rate: 0.668663
Rural Status
Location Weight Total Weight
# Rate Weight Min Max
Metro, 1 million+
274 66.79% 1.497268 1.37369 2.60303
Metro, 250,000 to 1 million
30 66.67% 1.5 1.3762 1.54119
Metro, 250,000 or less
60 75.00% 1.333333 1.22329 2.31803
Urban pop 20,000+, Metro adj
9 22.22% 4.5 4.44806 4.62356
Urban pop 20,000+, nonadj
0 NA NA NA NA
Urban pop, 2,500-19,999, Metro adj
10 70.00% 1.428571 1.31067 1.41208
Urban pop, 2,500-19,999, nonadj
10 60.00% 1.666667 1.55601 1.71243
Rural, Metro adj
2 50.00% 2.0 1.83882 1.83882
Rural, nonadj
2 100.00% 1.0 0.9336 0.97994
Virginia border state/DC
77 62.34% 1.604167 1.47177 2.78888
Other US State
27 77.78% 1.285714 1.1796 2.23524
Age Age Weight Total Weight
# Rate Weight Min Max
Under 30 39 38.46% 2.6 2.23524 2.78888
30 to 34 63 65.08% 1.536585 1.32102 4.62356
35 to 39 74 71.62% 1.396226 0.9336 1.55601
40 to 44 66 72.73% 1.375 1.1821 1.83882
45 to 49 47 65.96% 1.516129 1.30343 1.52067
50 to 54 68 67.65% 1.478261 1.27087 4.44806
55 to 59 59 72.88% 1.372093 1.1796 1.47177
60 and Over
85 68.24% 1.465517 0.97994 1.63323