Embed Size (px)
Citation preview

July 20, 2011Alan Meyers, Principal
Cambridge Systematics, Inc.
Virginia Statewide Multimodal Freight Study

Why a Multimodal Freight Study?•
Freight is a major contributor to Virginia’s economy–
Around 50% of economic output (sales, receipts, operating income), 28% of gross state product (value added), and 34% of jobs are from industries
that depend heavily on freight movement: agriculture and food, energy and natural resources, construction, chemicals, transportation and logistics, wholesale
and retail sales
•
Freight is a major consumer of transportation resources–
Nation’s seventh largest container port; major international air cargo hub; two Class I railroads; two major through-truck corridors (I-95 and I-81)
•
Cooperative multi-year effort of all modal agencies•
First-ever freight study to examine needs and opportunities and develop statewide recommendations to support VTRANS and multimodal planning
•
Respond to legislative mandate for I-81 diversion study
•
Report completed and accepted by the Secretary of Transportation
in 2011
1

Freight Stakeholder Input Results of 200 Interviews
•
63% of respondents said Virginia’s system is adequate (86% in Harrisonburg, 25% in Northern Virginia)
•
Highway congestion is the number one freight concern, especially
in Northern Virginia, Hampton Roads, I-81 Corridor, I-95 Corridor; most recommend adding highway capacity, improving rail options
2
High Fuel Costs
Driver Shortage
CongestionTruck Permits/ Regs
Truck Size/Weight
High Shipping CostsConstruction Delays
Secondary Road Capacity
Port OperationsBridge Capacity
Driver Rest Req’s
Rail Capacity
Internal Problems
High Fuel Costs
Driver Shortage
CongestionTruck Permits/ Regs
Truck Size/Weight
High Shipping CostsConstruction Delays
Secondary Road Capacity
Port OperationsBridge Capacity
Driver Rest Req’s
Rail Capacity
Internal Problems
Heartland Corridor
Add Lanes to I-95
Add Lanes to I-64
Relax Driver Rest Requirements
Improve Highway Maintenance
Add Lanes to I-81
Local Roadway Improvements
Add Highway Capacity
Simplify Rules and Regulations
Better Land Use Planning
Expand Truck Parking
Increase Transit Use
Relax Truck Size/Weight Limits
Shift More Freight to Rail
Reported Problems Recommendations
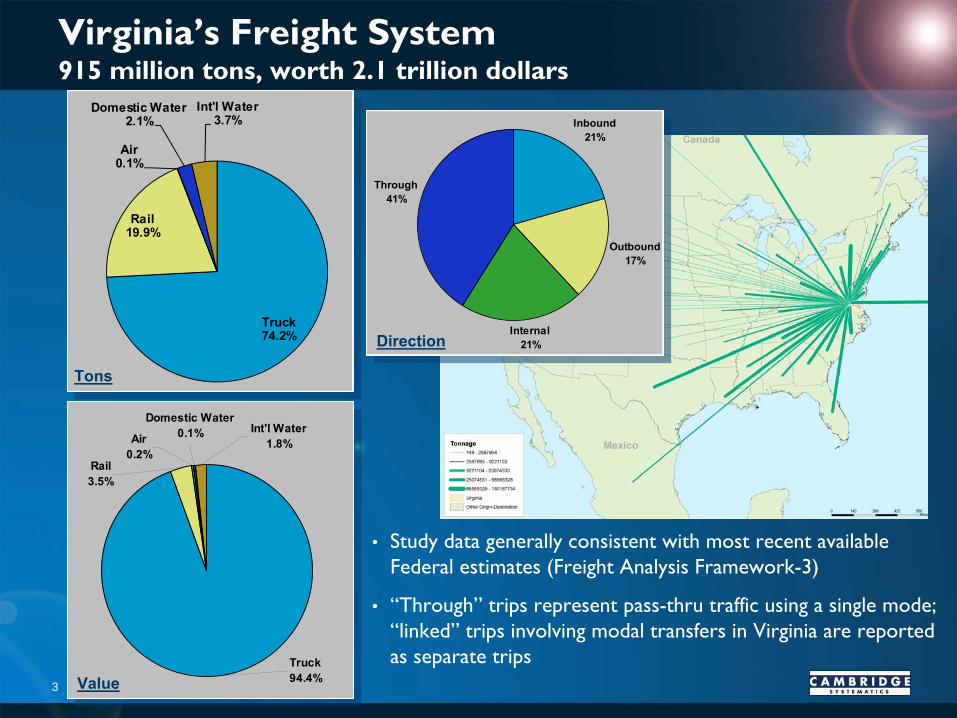
Virginia’s Freight System 915 million tons, worth 2.1 trillion dollars
3
Truck74.2%
Rail19.9%
Air0.1%
Domestic Water2.1%
Int'l Water3.7%
Air0.2%
Rail3.5%
Domestic Water0.1% Int'l Water
1.8%
Truck94.4%
Tons
Value
Inbound21%
Outbound17%
Internal21%
Through41%
Direction
•
Study data generally consistent with most recent available Federal estimates (Freight Analysis Framework-3)
•
“Through”
trips represent pass-thru traffic using a single mode; “linked”
trips involving modal transfers in Virginia are reported as separate trips
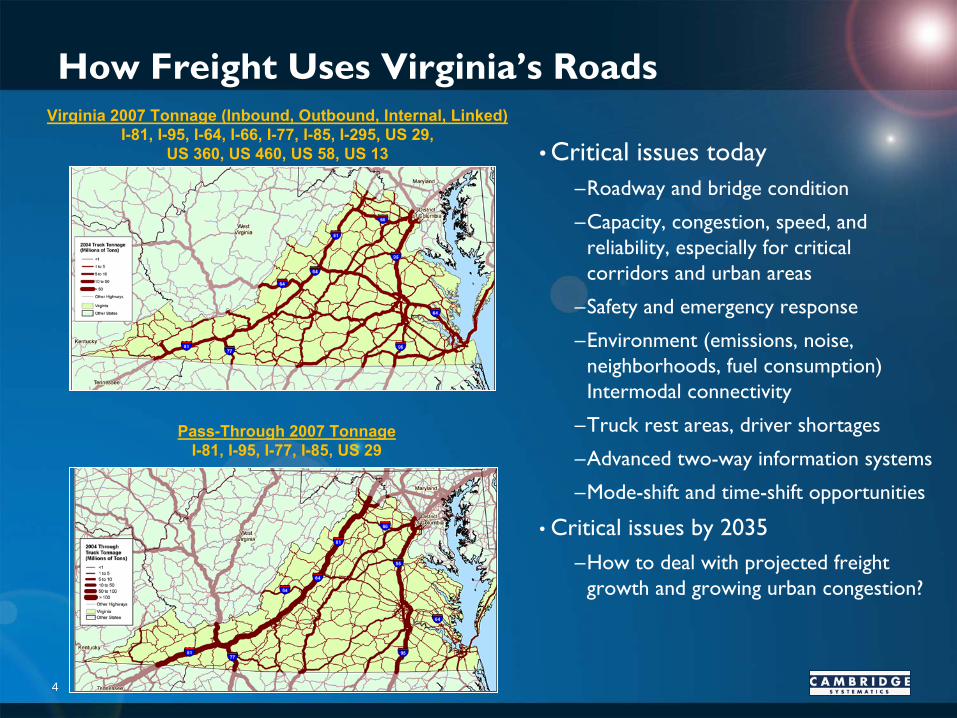
How Freight Uses Virginia’s Roads
•
Critical issues today–Roadway and bridge condition
–Capacity, congestion, speed, and reliability, especially for critical corridors and urban areas
–Safety and emergency response
–Environment (emissions, noise, neighborhoods, fuel consumption) Intermodal connectivity
–Truck rest areas, driver shortages
–Advanced two-way information systems
–Mode-shift and time-shift opportunities
•
Critical issues by 2035–How to deal with projected freight
growth and growing urban congestion?
4
Pass-Through 2007 TonnageI-81, I-95, I-77, I-85, US 29
Virginia 2007 Tonnage (Inbound, Outbound, Internal, Linked)I-81, I-95, I-64, I-66, I-77, I-85, I-295, US 29,
US 360, US 460, US 58, US 13
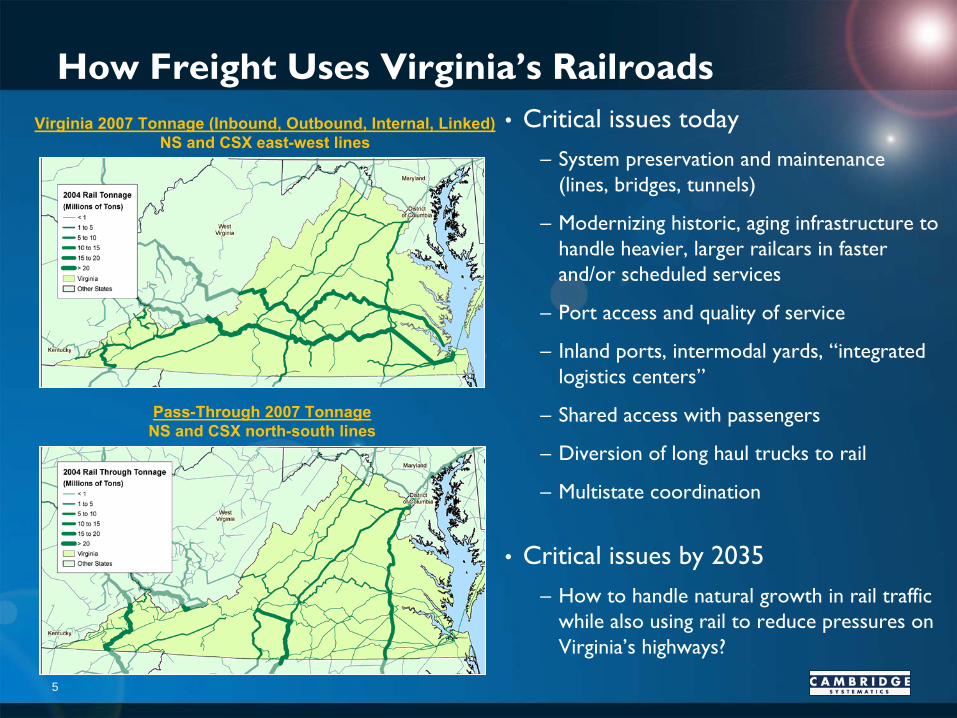
How Freight Uses Virginia’s Railroads•
Critical issues today–
System preservation and maintenance (lines, bridges, tunnels)
–
Modernizing historic, aging infrastructure to handle heavier, larger railcars in faster and/or scheduled services
–
Port access and quality of service
–
Inland ports, intermodal yards, “integrated logistics centers”
–
Shared access with passengers
–
Diversion of long haul trucks to rail
–
Multistate coordination
•
Critical issues by 2035–
How to handle natural growth in rail traffic while also using rail to reduce pressures on Virginia’s highways?
5
Pass-Through 2007 TonnageNS and CSX north-south lines
Virginia 2007 Tonnage (Inbound, Outbound, Internal, Linked) NS and CSX east-west lines

How Freight Uses Virginia’s Ports and Warehouse/Distribution Facilities
•
Critical issues today–
Panama Canal expansion, next-
generation mega-containerships, and global ocean carrier routings
–
Port capacity and terminal expansion
–
Truck access and rail service
–
Warehouse sites (large parcels, truck/rail access, limited impact)
–
“Marine Highway”
initiatives
–
Advanced operations and information
•
Critical issues through 2035–
How to handle significant growth in container traffic and tonnage, while managing transportation and environmental impacts?
6
2.0
4.0
6.0
8.0
10.0
12.0
2005
2008
2011
2014
2017
2020
2023
2026
2029
2032
2035
2038
TEU
s(in
Mill
ions
)
Containerized Cargo Forecast
(4.2% Average Growth Per Year)Planned Capacity
Maersk Terminal Maersk Terminal Craney Island
Marine TerminalCraney Island
Marine Terminal2.0
4.0
6.0
8.0
10.0
12.0
2005
2008
2011
2014
2017
2020
2023
2026
2029
2032
2035
2038
TEU
s(in
Mill
ions
)
Containerized Cargo Forecast
(4.2% Average Growth Per Year)Planned Capacity
Maersk Terminal Maersk Terminal Craney Island
Marine TerminalCraney Island
Marine Terminal
Pre-Recession ForecastStill Valid, But Delayed 5 to 8 Years
2007
2007
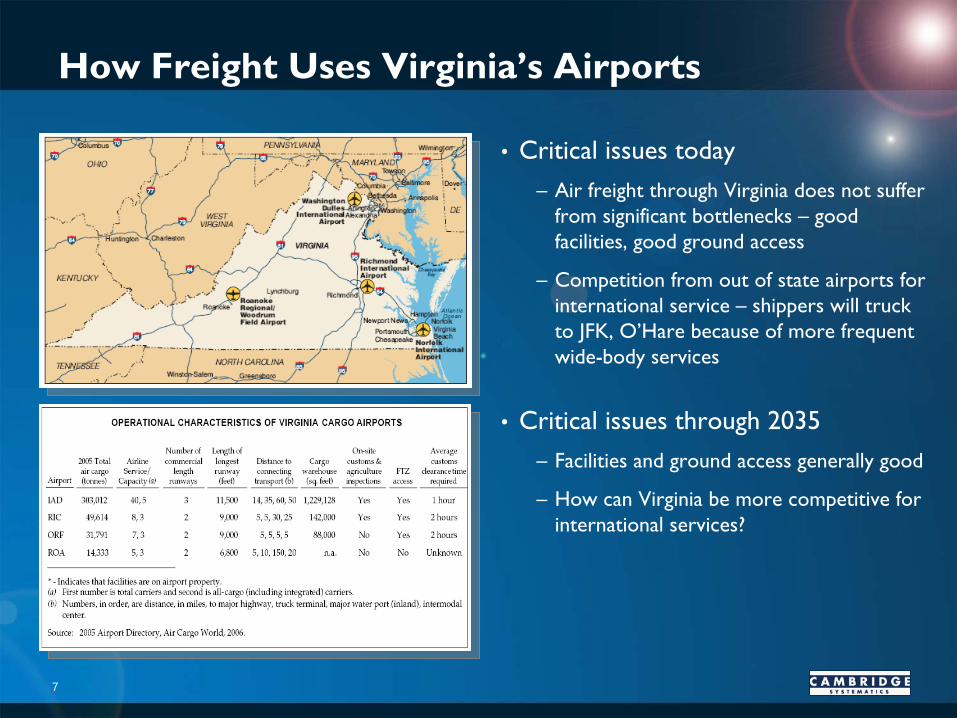
How Freight Uses Virginia’s Airports
•
Critical issues today–
Air freight through Virginia does not suffer from significant bottlenecks –
good facilities, good ground access
–
Competition from out of state airports for international service –
shippers will truck to JFK, O’Hare because of more frequent wide-body services
•
Critical issues through 2035–
Facilities and ground access generally good
–
How can Virginia be more competitive for international services?
7
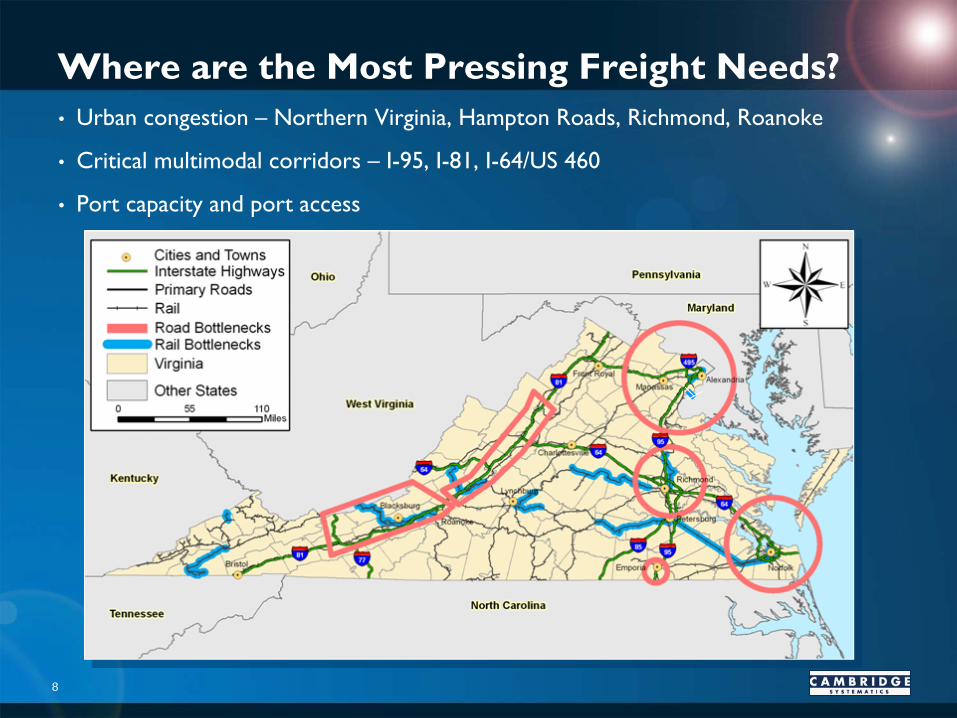
Where are the Most Pressing Freight Needs?•
Urban congestion –
Northern Virginia, Hampton Roads, Richmond, Roanoke
•
Critical multimodal corridors –
I-95, I-81, I-64/US 460
•
Port capacity and port access
8

Status of Freight Plan Initiatives
9
Mode Key Project StatusRail Heartland Corridor Phase
I/Phase IICrescent Corridor Phase
INational Gateway Phase
IRail Access to NIT
Complete/UnderwayUnderwayUnderwayUnderway
Port Channel DeepeningTerminal Projects (NIT, PMT, NNMT)Craney
Island Dike Construction and Engineering/Environmental Studies
Terminal Equipment
CompleteCompleteComplete
UnderwayHighway I-81 Selected Widenings
and Climbing LanesI-64 Selected WideningsUS-460 Corridor PPTA ProcurementI-564 Extension to NITVA-164 Design/Build for APM Terminal AccessI-95 Selected WideningsI-95 HOT Lanes PPTA ProcurementI-495 HOT Lanes PPTA
UnderwayUnderwayUnderwayUnderwayUnderwayCompleteUnderwayUnderway

Potential Benefits from Freight Plan Initiatives
•
Virginia Statewide Model
–
Freight Plan initiatives emphasize mode shifting, peak shifting,
bottleneck elimination
–
30% less truck VMT under congested conditions and 20% less truck
VMT each day
•
Cumulative “net direct”
benefits through 2035 based, on recent
USDOT-recommended methods and factors
–
Avoidance of potential future transportation and environmental impacts: pavement damage, safety, emissions ($4.7 billion)
–
Travel time savings due to reduced highway congestion ($6.6 billion)
–
Direct shipper cost savings from reduced highway congestion and increased use of lower-cost transportation modes ($6.4 billion in direct savings, $5.4 billion in indirect and induced savings, accruing inside and outside VA)
•
Significant “economic stimulus”
benefits (business retention/attraction, job creation, etc. ), best estimated case-by-case
10
Key Take-Aways•
Freight Study recommendations would improve Virginia freight mobility and generate significant benefits.
•
Projects are recently completed or underway
•
Freight Study findings should inform other ongoing local, regional, and statewide planning and programming efforts.
11