Embed Size (px)
Citation preview
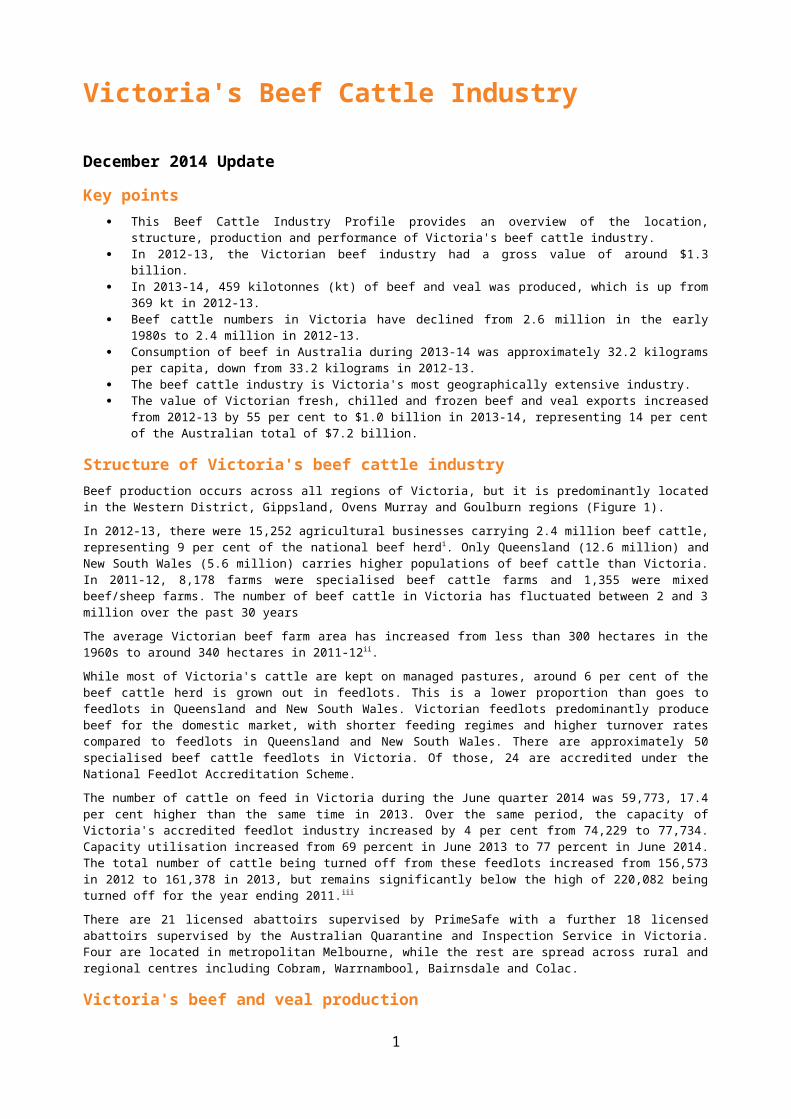
Victoria's Beef Cattle Industry
December 2014 Update
Key points This Beef Cattle Industry Profile provides an overview of the location, structure, production and performance
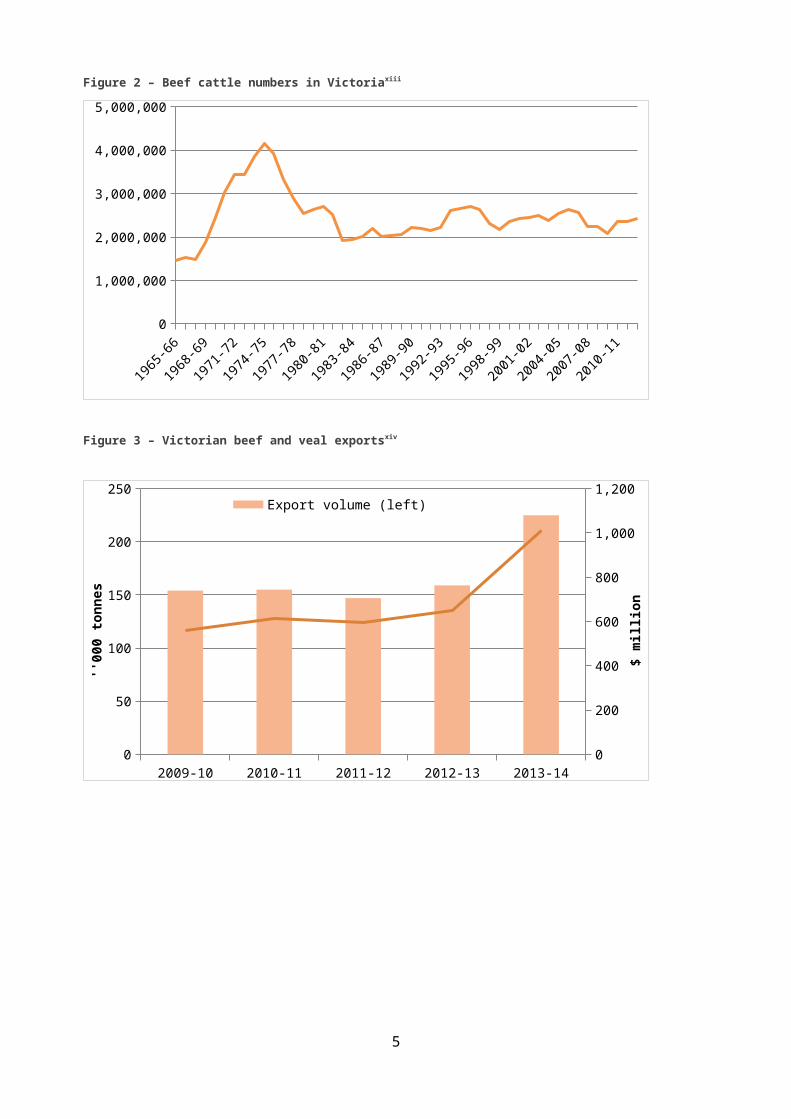
of Victoria's beef cattle industry. In 2012-13, the Victorian beef industry had a gross value of around $1.3 billion. In 2013-14, 459 kilotonnes (kt) of beef and veal was produced, which is up from 369 kt in 2012-13. Beef cattle numbers in Victoria have declined from 2.6 million in the early 1980s to 2.4 million in 2012-13. Consumption of beef in Australia during 2013-14 was approximately 32.2 kilograms per capita, down from
33.2 kilograms in 2012-13. The beef cattle industry is Victoria's most geographically extensive industry. The value of Victorian fresh, chilled and frozen beef and veal exports increased from 2012-13 by 55 per cent
to $1.0 billion in 2013-14, representing 14 per cent of the Australian total of $7.2 billion.
Structure of Victoria's beef cattle industryBeef production occurs across all regions of Victoria, but it is predominantly located in the Western District, Gippsland, Ovens Murray and Goulburn regions (Figure 1).
In 2012-13, there were 15,252 agricultural businesses carrying 2.4 million beef cattle, representing 9 per cent of the national beef herdi. Only Queensland (12.6 million) and New South Wales (5.6 million) carries higher populations of beef cattle than Victoria. In 2011-12, 8,178 farms were specialised beef cattle farms and 1,355 were mixed beef/sheep farms. The number of beef cattle in Victoria has fluctuated between 2 and 3 million over the past 30 years
The average Victorian beef farm area has increased from less than 300 hectares in the 1960s to around 340 hectares in 2011-12ii.
While most of Victoria's cattle are kept on managed pastures, around 6 per cent of the beef cattle herd is grown out in feedlots. This is a lower proportion than goes to feedlots in Queensland and New South Wales. Victorian feedlots predominantly produce beef for the domestic market, with shorter feeding regimes and higher turnover rates compared to feedlots in Queensland and New South Wales. There are approximately 50 specialised beef cattle feedlots in Victoria. Of those, 24 are accredited under the National Feedlot Accreditation Scheme.
The number of cattle on feed in Victoria during the June quarter 2014 was 59,773, 17.4 per cent higher than the same time in 2013. Over the same period, the capacity of Victoria's accredited feedlot industry increased by 4 per cent from 74,229 to 77,734. Capacity utilisation increased from 69 percent in June 2013 to 77 percent in June 2014. The total number of cattle being turned off from these feedlots increased from 156,573 in 2012 to 161,378 in 2013, but remains significantly below the high of 220,082 being turned off for the year ending 2011.iii
There are 21 licensed abattoirs supervised by PrimeSafe with a further 18 licensed abattoirs supervised by the Australian Quarantine and Inspection Service in Victoria. Four are located in metropolitan Melbourne, while the rest are spread across rural and regional centres including Cobram, Warrnambool, Bairnsdale and Colac.
Victoria's beef and veal productionVictoria's beef cattle industry generally supplies smaller, younger animals for the domestic market and higher quality stock for the Japanese and Korean market. The volume and value of beef and veal produced in Victoria is determined primarily by seasonal conditions, domestic and foreign demand and input prices. These factors influence farmers' decisions on beef cattle stocking rates relative to sheep and lamb stocking rates and saleyard throughput – thus influencing the numbers of adult cattle and calves slaughtered and the amount of beef and veal produced.
For the year 2013-14, the number of cattle and calves slaughtered was 2.1 million head which was a rise of approximately 382,200 (22 per cent) from 2012-13 when the figure was 1.71 million iv. Between 2009-10 and 2013-14, beef and veal meat production in Victoria increased by almost 96,000 tonnes to 459,100 tonnes, a 26 per cent increasev. This is an increase of around 90,500 tonnes (25 per cent) from the 368,600 tonnes produced in the previous year 2012-13. Average animal slaughter weight for cattle increased from 225 kg to 257.4 kg, or by14.4 per cent, since 2000vi.
1
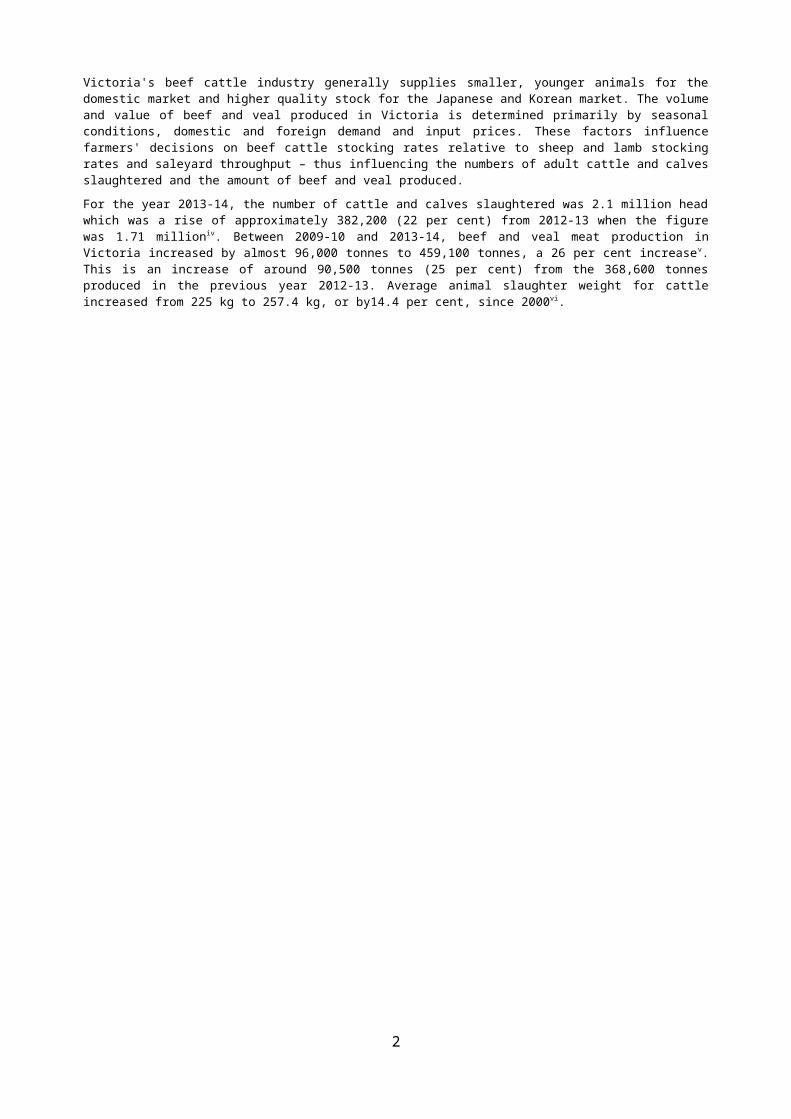
Figure 1 Victoria's beef production regionsvii
Victorian exports and domestic consumption of Victoria's beef productsThe domestic market for beef in Australia is driven by consumer preferences, competition with other protein sources (e.g. poultry meat) and price. In 2010-11, it was the single largest market for Australian beef, accounting for 38per cent of beef and veal production.viii
In 2012-13, beef and veal consumption comprised approximately 29 per cent of meat consumed in Australia with approximately 32.2 kg per capita consumed out of a total of 112.3 kilograms of meat consumedix.
In 2013-14, 71 per cent of Victorian beef and veal production was exportedx. From 2012-13 to 2013-14 the value of fresh, chilled or frozen beef exports from Victoria increased sharply by almost 55 per cent or $357 million from $652 million to $1,009 millionxi. Victorian beef exports increased from 159 kilotonnes (kt) in 2013 to 225 kt in 2014xii.
Victoria's major export markets for beef are Japan, the Republic of Korea and the United States of America. With the conclusion of negotiations on the Australia-Korea Free Trade Agreement (FTA) in 2013, it is expected that Victoria’s beef and veal exports will increase substantially over the next few decades. The landmark China-Australia Free Trade Agreement (ChAFTA), which was agreed upon on the 17th November 2014 to be officially signed in early 2015, will make Australia’s beef and sheep farmers to gain from the abolition of tariffs ranging from 12 to 25 per cent.
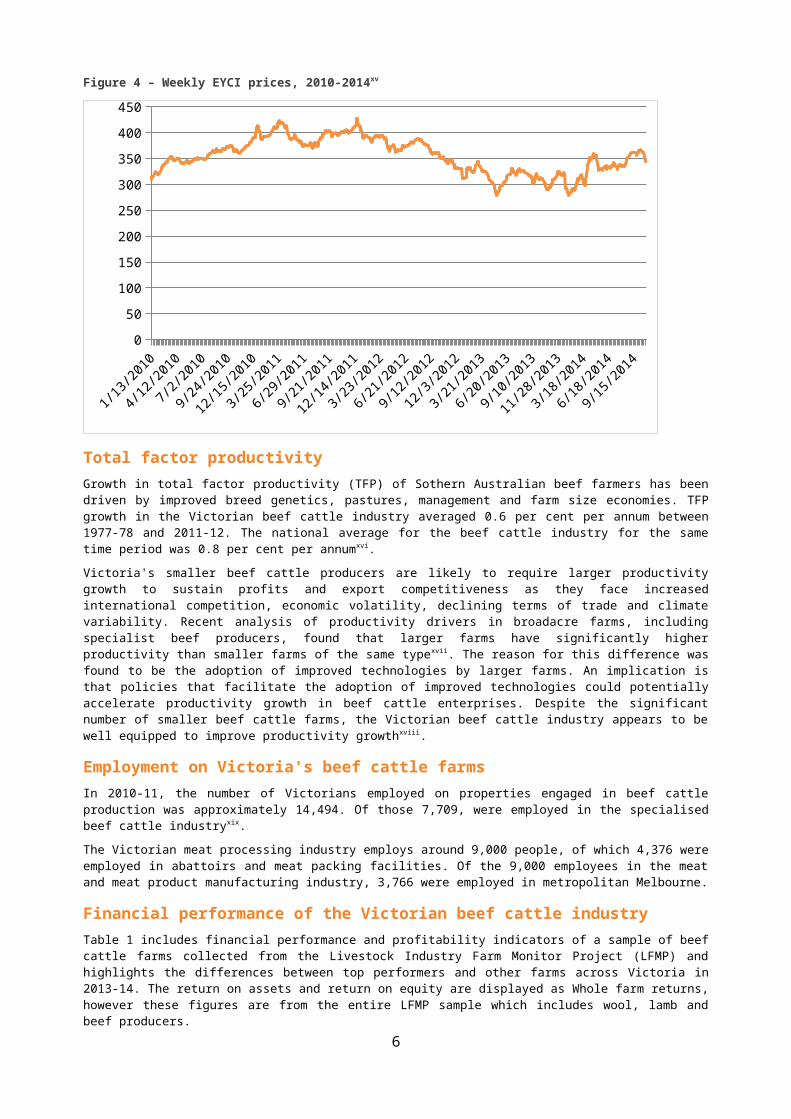
PricesThe Eastern Young Cattle Indicator (EYCI) is the main indicator of beef prices in Victoria and other eastern states. Historically, movements in the EYCI closely reflected movements in young cattle prices, which in turn are influenced by seasonal conditions, fluctuations in slaughter rates, export demand and exchange rates.
The EYCI declined from its record high of 428 c/kg in December 2011 to its lowest level of 278.75 c/kg in mid May 2013, and has subsequently increased to its current level of 342.5 c/kg in late October 2014.
2
Figure 2 – Beef cattle numbers in Victoriaxiii
1965-66
1967-68
1969-70
1971-72
1973-74
1975-76
1977-78
1979-80
1981-82
1983-84
1985-86
1987-88
1989-90
1991-92
1993-94
1995-96
1997-98
1999-00
2001-02
2003-04
2005-06
2007-08
2009-10
2011-120
1,000,000
2,000,000
3,000,000
4,000,000
5,000,000
Figure 3 – Victorian beef and veal exportsxiv
2009-10 2010-11 2011-12 2012-13 2013-140
50
100
150
200
250
0
200
400
600
800
1,000
1,200Export volume (left) Export value (right)
''000
tonn
es
$ m
illio
n
3
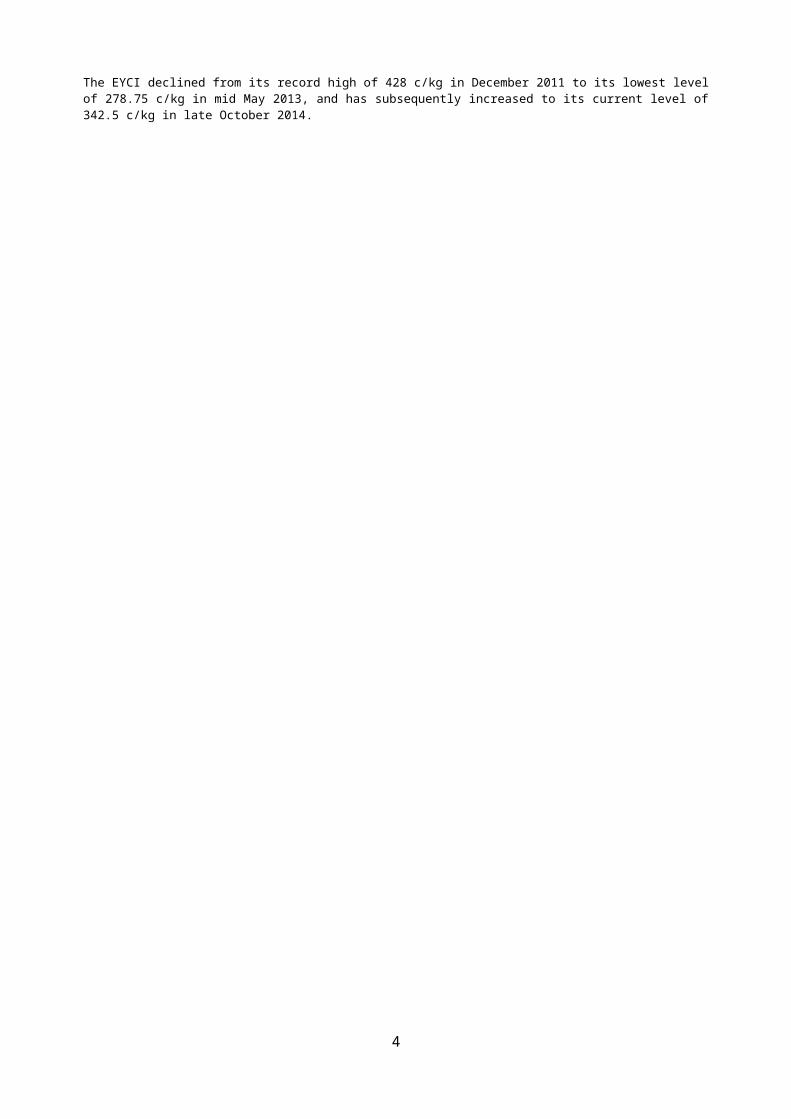
Figure 4 – Weekly EYCI prices, 2010-2014xv
1/11/2
010
3/22/2
010
5/31/2
010
8/9/2010
10/18/2010
12/27/2010
3/7/2011
5/16/2
011
7/25/2
011
10/3/2011
12/12/2011
2/20/2
012
4/30/2
012
7/9/2012
9/17/2
012
11/26/2012
2/4/2013
4/15/2
013
6/24/2
013
9/2/2013
11/11/2013
1/20/2
014
3/31/2
014
6/9/2014
8/18/2
014
10/27/20140
50
100
150
200
250
300
350
400
450
Total factor productivityGrowth in total factor productivity (TFP) of Sothern Australian beef farmers has been driven by improved breed genetics, pastures, management and farm size economies. TFP growth in the Victorian beef cattle industry averaged 0.6 per cent per annum between 1977-78 and 2011-12. The national average for the beef cattle industry for the same time period was 0.8 per cent per annumxvi.
Victoria's smaller beef cattle producers are likely to require larger productivity growth to sustain profits and export competitiveness as they face increased international competition, economic volatility, declining terms of trade and climate variability. Recent analysis of productivity drivers in broadacre farms, including specialist beef producers, found that larger farms have significantly higher productivity than smaller farms of the same typexvii. The reason for this difference was found to be the adoption of improved technologies by larger farms. An implication is that policies that facilitate the adoption of improved technologies could potentially accelerate productivity growth in beef cattle enterprises. Despite the significant number of smaller beef cattle farms, the Victorian beef cattle industry appears to be well equipped to improve productivity growthxviii.
Employment on Victoria's beef cattle farmsIn 2010-11, the number of Victorians employed on properties engaged in beef cattle production was approximately 14,494. Of those 7,709, were employed in the specialised beef cattle industryxix.
The Victorian meat processing industry employs around 9,000 people, of which 4,376 were employed in abattoirs and meat packing facilities. Of the 9,000 employees in the meat and meat product manufacturing industry, 3,766 were employed in metropolitan Melbourne.
Financial performance of the Victorian beef cattle industryTable 1 includes financial performance and profitability indicators of a sample of beef cattle farms collected from the Livestock Industry Farm Monitor Project (LFMP) and highlights the differences between top performers and other farms across Victoria in 2013-14. The return on assets and return on equity are displayed as Whole farm returns, however these figures are from the entire LFMP sample which includes wool, lamb and beef producers.
In 2013-14, farm profitability and productivity was higher for the top 20 per cent of beef cattle enterprises across the surveyed regions. The top 20 per cent of farms surveyed mostly tended to receive higher rainfall, manage with higher stocking rates, receive higher prices for cattle sold, and enjoy lower costs of production on a kilogram of product produced basis.
As an indicator of general financial performance, beef cattle gross margins are a useful measure. In 2013-14, the top 20 per cent of beef cattle properties surveyed enjoyed gross margins per hectare of around 40 to 80 per cent higher
4
than the average gross margin. In two of the three regions, the top 20 per cent of beef cattle operators had stocking rates well above the average.
Table 1: Beef cattle farm financial performance and profitability indicators 2013-14xx
Gippsland North East South West
Average Top 20% Average Top 20% Average Top 20%
Stocking rate DSE/Grazed ha 18.1 19.7 11.9 12.7 15.3 14.2
Average sale price received $/kg/LWT 1.62 1.62 1.63 1.85 1.79 1.82
Cost of production $/kg/LWT 1.33 0.82 1.20 0.74 1.27 0.66
Gross income $/ha 695 895 433 607 608 907
Variable costs $/ha 253 284 151 146 252 261
EBIT $/ha -17 299 120 598 64 336
Return on assets % 1.2 3.1 2.0 6.0 2.2 4.8
Return on equity % -0.1 1.3 0.9 6.8 0.8 3.6
Government policy/regulation influencesBeef cattle farms and beef cattle feedlots have legal responsibilities and are required to comply with a range of policies relating to food safety, animal welfare, biosecurity and the environment – for example, the various codes governing the accepted farming practices for the welfare of cattle, the welfare of animals during transportation and the Prevention of Cruelty to Animals Act 1986.
New beef cattle feedlots or substantial modifications to existing feedlots should comply with the Victorian Code for Cattle Feedlots.
5
i Australian Bureau of Statistics (ABS), Agricultural Commodities, Australia, 7121.0, 2012-13
ii Australian Bureau of Agricultural and Resource Economics and Sciences (ABARES), Australian agricultural and grazing industries survey (AAGIS), 2011-12iii Australian Lot Feeders Association, ALFA/MLA Feedlot Survey & ALFA Media Release 25th November 2013iv ABS, Livestock Products, Australia, 7215.0, September 2014 v ABS, Livestock and Meat, Australia, 7218.0.55.001, October 2014 vi MLA, Statistical Review July 2013 – June 2014.vii ABS: Based on 2006 Mesh Block Boundaries. Number of beef cattle sourced from the 2006 Agricultural Census. This map was produced using coordinate system: Lat/Long GDA94, @Commonwealth of Australia, 2010.viii MLA, Statistical Review July 2013 – June 2014ix MLA, Statistical Review July 2013 – June 2014x MLA, Statistical Review July 2013 – June 2014. xi DEPI, Victorian Food and Fibre Export Performance Report, 2013-14xii DEPI, Victorian Food and Fibre Export Performance Report, 2013-14xiii ABS, Historical Agriculture Commodities 1861-2011, 7124.0; ABS, Agricultural Commodities, Australia, 2012-13, 7121.0; and ABS, Principal Agricultural Commodities, 2012-13, 7111.0xiv DEPI, Victorian Food and Fibre Export Performance Report, 2013-14xv Source: MLA website http://www.mla.com.au/Prices-and-markets/Market-reports-and-prices/Eastern-young-cattle-indicator, accessed on 6 November 2014xvi ABARES, 2014, unpublished dataxvii Sheng, Y., Zhao, S., Nossal, K. and Zhang, D., 2014, Productivity and farm size in Australian agriculture: reinvestigating the returns to scale, Australian Journal of Agricultural and Resource Economics xviii Nossal, k, Sheng, Y. and Zhao, S., 2008, Productivity in the beef cattle and slaughter lamb industries, ABARES Research Report 08.13, Canberraxix ABS, Population and Housing Census 2010-11xx DEPI, Livestock Farm Monitor Project (LFMP) Results 2013-14