Embed Size (px)
Citation preview
INTERIM REPORT ON OPERATIONS OF THE DIASORIN GROUP AT SEPTEMBER 30, 2013
Third quarter 2013
DiaSorin S.p.A.Via Crescentino (no building No.) - 13040 Saluggia (VC)Tax I. D. and Vercelli Company Register n. 13144290155
1

CONTENTS
BOARD OF DIRECTORS, BOARD OF STATUTORY AUDITORS AND INDEPENDENT AUDITORS.................................3
THE DIASORIN GROUP.......................................................................................................................................................................4
STRUCTURE OF THE DIASORIN GROUP AT SEPTEMBER 30, 2013.......................................................................................6
CONSOLIDATED FINANCIAL HIGHLIGHTS................................................................................................................................7
INTERIM REPORT ON OPERATIONS.............................................................................................................................................8
REVIEW OF THE GROUP’S OPERATING PERFORMANCE AND FINANCIAL POSITION..............................................10OPERATING PERFORMANCE IN THE THIRD QUARTER OF 2013..........................................................................................10OPERATING PERFORMANCE IN THE FIRST NINE MONTHS OF 2013....................................................................................18STATEMENT OF FINANCIAL POSITION OF THE GROUP AT SEPTEMBER 30, 2013............................................................27ANALYSIS OF CONSOLIDATED CASH FLOWS..........................................................................................................................29OTHER INFORMATION....................................................................................................................................................................30
TRANSACTIONS WITH RELATED PARTIES...............................................................................................................................31
SIGNIFICANT EVENTS OCCURRING AFTER NOVEMBER 30, 2013 AND BUSINESS OUTLOOK..................................32
CONSOLIDATED FINANCIAL STATEMENTS OF THE DIASORIN GROUP AT SEPTEMBER 30, 2013 AND ACCOMPANYING NOTES.................................................................................................................................................................33
CONSOLIDATED INCOME STATEMENT..................................................................................................................................33CONSOLIDATED STATEMENT OF COMPREHENSIVE INCOME.......................................................................................34CONSOLIDATED STATEMENT OF FINANCIAL POSITION.................................................................................................35CONSOLIDATED STATEMENT OF CASH FLOWS..................................................................................................................37STATEMENT OF CHANGES IN CONSOLIDATED SHAREHOLDERS’ EQUITY...............................................................38
NOTES TO THE CONSOLIDATED QUARTERLY REPORT AT SEPTEMBER 30, 2013 AND SEPTEMBER 30, 2012... .39
DECLARATION IN ACCORDANCE WITH THE SECOND SUBSECTION OF ART. 154-BIS, PART IV, TITLE III, SECOND PARAGRAPH, SECTION V-BIS, OF LEGISLATIVE DECREE NO. 58 OF FEBRUARY 24, 1998: “UNIFORM LAW ON FINANCIAL INTERMEDIATION ENACTED PURSUANT TO ARTICLES 8 AND 21 OF LAW NO. 52 OF FEBRUARY 6, 1996”............................................................................................................................................................................64
2
BOARD OF DIRECTORS, BOARD OF STATUTORY AUDITORS AND INDEPENDENT AUDITORS
B o a r d o f D i r e c t o r s (elected on April 22, 2013)
Chairman Gustavo Denegri
Deputy Chairman Michele Denegri
Chief Executive Officer Carlo Rosa (1) Directors Antonio Boniolo
Chen Menachem EvenEnrico Mario AmoGian Alberto SaporitiGiuseppe Alessandria (2) (3)Franco Moscetti (2)Maria Paola Landini (2)Roberta Somati (2)Eva Desana Ezio Garibaldi
B o a r d o f S t a t u t o r y A u d i t o r s
Chairman Roberto BracchettiStatutory Auditors Andrea Caretti
Ottavia AlfanoAlternates Bruno Marchina
Maria Carla Bottini
I n d e p e n d e n t A u d i t o r s Deloitte & Touche S.p.A.
COMMITTEES
Internal Control and Risks Committee Franco Moscetti (Chairman)Enrico Mario Amo Roberta Somati
Compensation Committee Giuseppe Alessandria (Chairman)Roberta Somati Michele Denegri
Nominating Committee Franco Moscetti (Chairman)Giuseppe AlessandriaMichele Denegri
Related-party Committee Franco Moscetti (Coordinator) Giuseppe Alessandria
Roberta Somati
(1) General Manager(2) Independent Director(3) Lead Independent Director
3

THE DIASORIN GROUP
Diasorin is an Italian company listed on the stock market in the FTSE MIB Index. It is a global leader in the field of biotechnologies: for over 40 years the company has been developing, producing and commercializing reagent kits for the in vitro diagnostics worldwide.
Diasorin’s products are specifically designed for hospital and private testing laboratories, in the market of:
immunodiagnostics molecular diagnostics
where the Group provides diagnostic tests in different clinical areas. Diasorin can offer to the market an assay menu that is unique for its width and presence of specialty tests, which identify Diasorin as the In Vitro Diagnostic “Specialist”.
Over the last 10 years the Group strengthened its commercial presence on a global scale. Starting from the historical reference markets, Europe and USA, the company opened new commercial branches in all the emerging markets, such as Brazil, Mexico, China and Australia, confirming its presence, as Global Player, in over 60 countries.
Research and Development is pivotal in Diasorin business model. Through its research activity and the following expansion of its immunodiagnostic and, more recently, molecular diagnostic products, the Group constantly supports clinical laboratory needs and activities, providing solutions that are:
innovative;
fully automated and standardized; reliable; easy to use; affordable.
The fruits of its current success and its future growth lie in the Group’s dedication to constantly improve the quality of its products and develop menus addressed to laboratories.
Diasorin internally manages the primary processes involved in the research, production, distribution and commercial aspects, that is, the process that, starting with the development of new products, leads to the marketing of those products. The Group’s manufacturing organization consists of several facilities located in Europe, USA and South Africa.
Saluggia Italy At the Group’s Parent Company’s headquartersStillwater USA At the headquarters of Diasorin Inc.Dietzenbach Germany At the headquarters of Diasorin Deutschland GmbHDublin Ireland At the headquarters of Diasorin Ireland LtdDartford UK At the headquarters of Diasorin S.p.A-UK BranchKyalami South Africa At the headquarters of Diasorin South Africa (Pty) Ltd
4
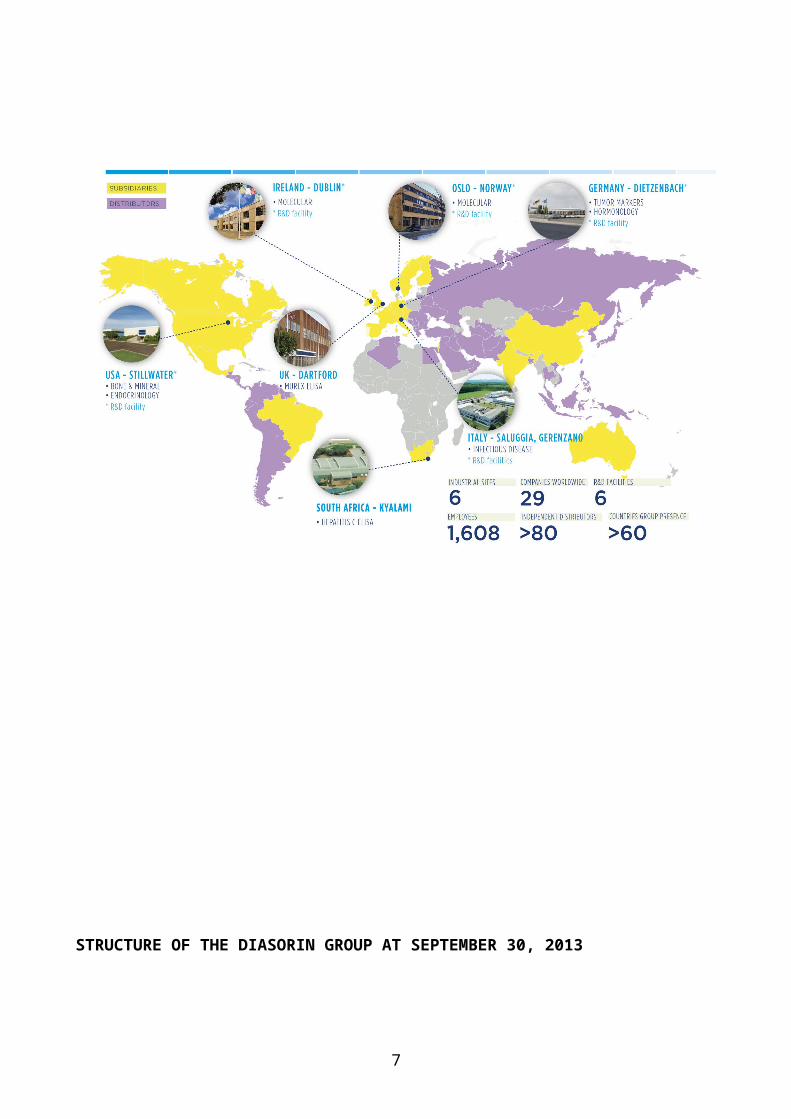
The Group headed by Diasorin S.p.A. is comprised of 24 companies and 5 branches in 5 continents.
In Europe, United States, Mexico, Brazil, China, Australia and Israel, the Diasorin Group sells its products mainly through its marketing companies that are part of the Diasorin Group.In countries where the Group does not have a direct presence, it operates through an international network of more than 80 independent distributors.
5
STRUCTURE OF THE DIASORIN GROUP AT SEPTEMBER 30, 2013
6
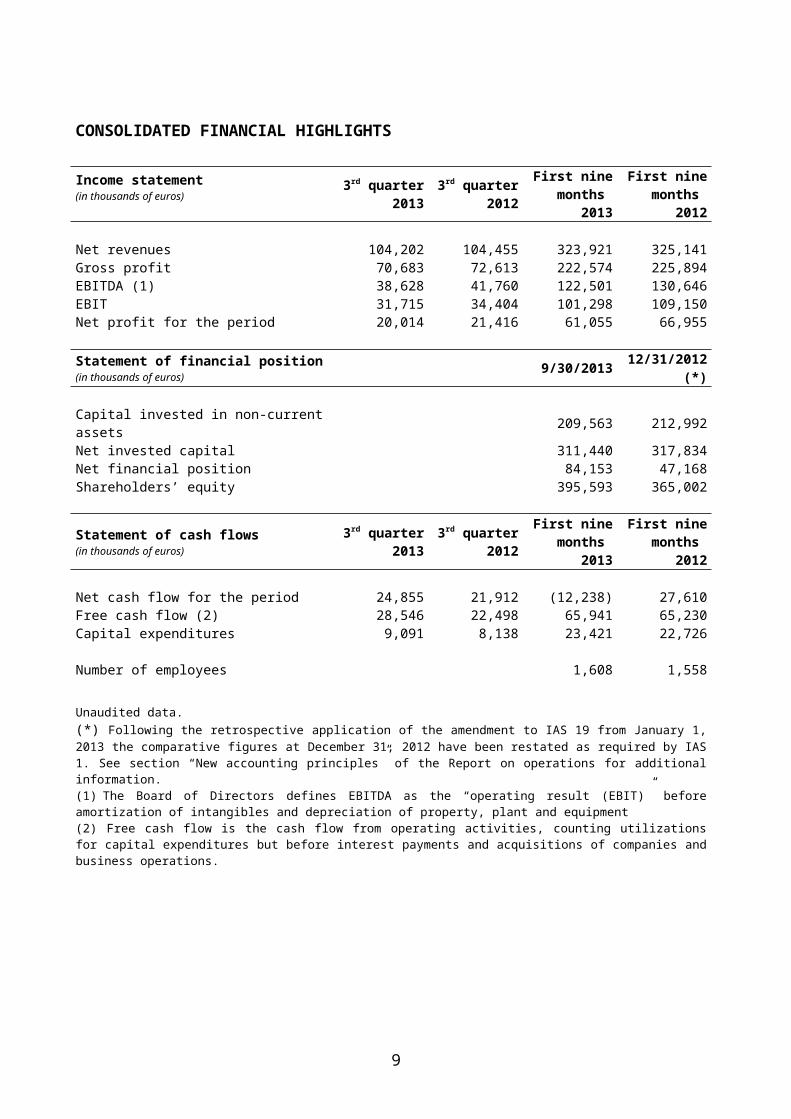
CONSOLIDATED FINANCIAL HIGHLIGHTS
Income statement (in thousands of euros)
3rd quarter 2013
3rd quarter 2012
First nine months
2013
First nine months
2012 Net revenues 104,202 104,455 323,921 325,141Gross profit 70,683 72,613 222,574 225,894EBITDA (1) 38,628 41,760 122,501 130,646EBIT 31,715 34,404 101,298 109,150Net profit for the period 20,014 21,416 61,055 66,955 Statement of financial position (in thousands of euros) 9/30/2013 12/31/2012(*)
Capital invested in non-current assets 209,563 212,992Net invested capital 311,440 317,834Net financial position 84,153 47,168Shareholders’ equity 395,593 365,002
Statement of cash flows (in thousands of euros)
3rd quarter 2013
3rd quarter 2012
First nine months
2013
First nine months
2012 Net cash flow for the period 24,855 21,912 (12,238) 27,610Free cash flow (2) 28,546 22,498 65,941 65,230Capital expenditures 9,091 8,138 23,421 22,726 Number of employees 1,608 1,558
Unaudited data.(*) Following the retrospective application of the amendment to IAS 19 from January 1, 2013 the comparative figures at December 31, 2012 have been restated as required by IAS 1. See section “New accounting principles” of the Report on operations for additional information.(1) The Board of Directors defines EBITDA as the “operating result (EBIT)” before amortization of intangibles and depreciation of property, plant and equipment(2) Free cash flow is the cash flow from operating activities, counting utilizations for capital expenditures but before interest payments and acquisitions of companies and business operations.
7

INTERIM REPORT ON OPERATIONS
Foreword
This interim report on operations at September 30, 2013 (hereinafter referred to as the “Quarterly Report”) was prepared in accordance with international accounting principles (International Accounting Standards – IAS and International Financial Reporting Standards – IFRS) and the corresponding interpretations (Standing Interpretations Committee – SIC and International Financial Reporting Interpretations Committee – IFRIC) published by the International Accounting Standards Boards (IASB). More specifically, it is being presented in condensed form, in accordance with the international accounting principle that governs interim financial reporting (IAS 34), as adopted by the European Union, and complies with the requirements of Article 154-ter, Sections 2 and 3, of Legislative Decree No. 58 of February 24, 1998.
The accounting principles applied to prepare this consolidated quarterly report are consistent with those used for the annual consolidated financial statements at December 31, 2012, except as otherwise stated under “ New Accounting principles”, in the Notes to the Interim Consolidated Financial Statements.
Following application of the amendment to IAS 19 (retrospectively) from January 1, 2013 figures previously reported in the statement of financial position at December 31, 2012 and the statement of comprehensive income for the first nine months of 2012, have been restated in accordance with the requirements of IAS 1. For further details, refer to “ New accounting principles” in the Notes to the Interim Consolidated Financial Statements.
Key events in the third quarter of 2013
In July 2013, Diasorin received the marketing authorization for 5 LIAISON XL assays (HBsAg Quant, Anti-HBs II, HCV Ab, HIV Ab/Ag, recHTLV-I/II) related to Hepatitis and Retroviruses. With the launch of the full panel of CLIA Hepatitis and Retroviruses assays, now available on the LIAISON XL, Diasorin completed the already available markers for Hepatitis B and Hepatitis A in CLIA technology.
In the same month, Diasorin launched a new molecular diagnostic test for the detection of Toxoplasmosis in the context of infectious diseases on its LIAISON IAM analyzer, available on the market outside of the United States and Canada. The IAM Toxo is the fourth test launched by the Group to implement the panel of infectious diseases in molecular diagnostics already composed by the assays for the detection of infections from BK Virus, Varicella Zoster and Parvovirus (IAM BKV, IAM VZV, IAM PARVO) all marketed during the past months.
In September, Diasorin received the clearance for the LIAISON XL hCG test from the Food and Drug Administration for the US market. The hCG is an In Vitro Immunoassay for the quantitative determination of the total human chorionic gonadotropin (hCG and βhCG) in human serum for early detection of pregnancy, which can be performed on the LIAISON XL analyzer, in addition to the other Diasorin’s Fertility tests already approved.
8
The foreign exchange market
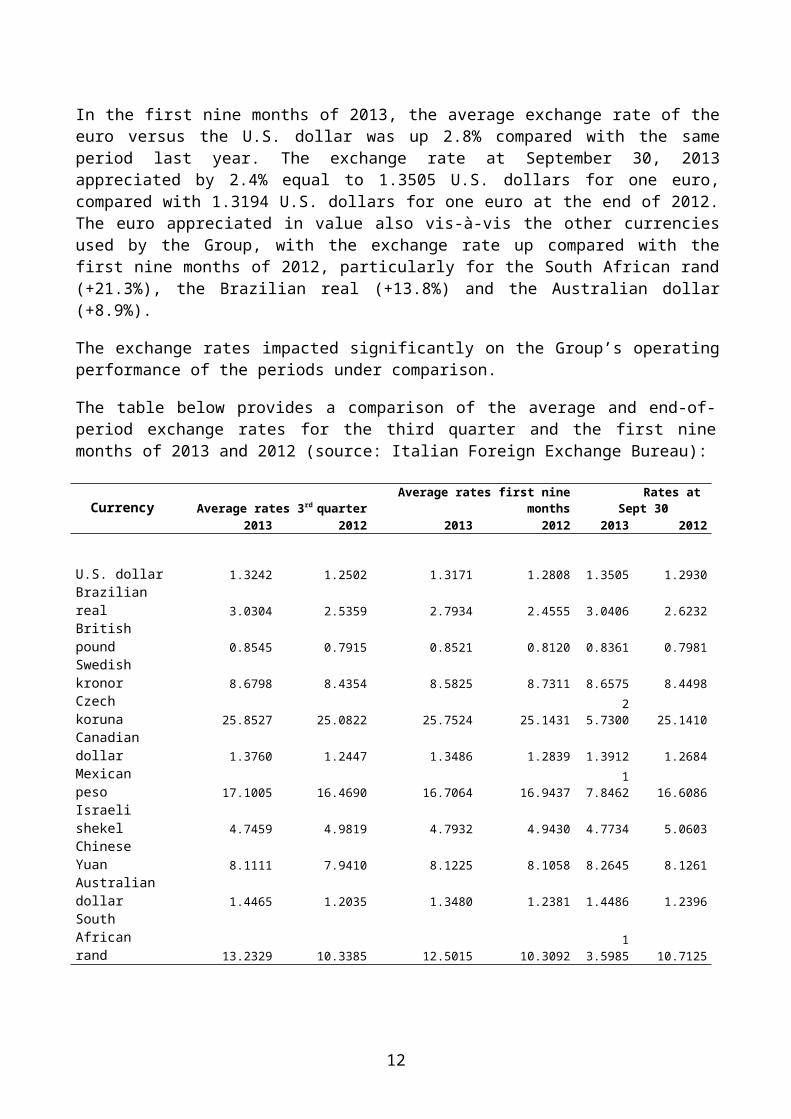
In the foreign exchange market, the average exchange rate of the euro gained value against almost all currencies used by the Group in the third quarter of 2013, particularly for the U.S. dollar (almost +6%) compared with the third quarter of 2012. The euro appreciated in value also vis-à-vis the other currencies used by the Group, with the exchange rate up versus the South African rand (+28%), the Brazilian real (about +20%) and the Australian dollar (about +20%).
In the first nine months of 2013, the average exchange rate of the euro versus the U.S. dollar was up 2.8% compared with the same period last year. The exchange rate at September 30, 2013 appreciated by 2.4% equal to 1.3505 U.S. dollars for one euro, compared with 1.3194 U.S. dollars for one euro at the end of 2012. The euro appreciated in value also vis-à-vis the other currencies used by the Group, with the exchange rate up compared with the first nine months of 2012, particularly for the South African rand (+21.3%), the Brazilian real (+13.8%) and the Australian dollar (+8.9%).
The exchange rates impacted significantly on the Group’s operating performance of the periods under comparison.
The table below provides a comparison of the average and end-of-period exchange rates for the third quarter and the first nine months of 2013 and 2012 (source: Italian Foreign Exchange Bureau):
Currency Average rates 3rd quarter Average rates first nine months Rates at Sept 30 2013 2012 2013 2012 2013 2012
U.S. dollar 1.32
42 1.25
02 1.31
71 1.28
08 1.350
5 1.293
0
Brazilian real 3.03
04 2.53
59 2.79
34 2.45
55 3.040
6 2.623
2
British pound 0.85
45 0.79
15 0.85
21 0.81
20 0.836
1 0.798
1
Swedish kronor 8.67
98 8.43
54 8.58
25 8.73
11 8.657
5 8.449
8
Czech koruna 25.85
27 25.08
22 25.75
24 25.14
31 25.730
0 25.141
0
Canadian dollar 1.37
60 1.24
47 1.34
86 1.28
39 1.391
2 1.268
4
Mexican peso 17.10
05 16.46
90 16.70
64 16.94
37 17.846
2 16.608
6
Israeli shekel 4.74
59 4.98
19 4.79
32 4.94
30 4.773
4 5.060
3
Chinese Yuan 8.11
11 7.94
10 8.12
25 8.10
58 8.264
5 8.126
1
Australian dollar 1.44
65 1.20
35 1.34
80 1.23
81 1.448
6 1.239
6 South African rand
13.2329
10.3385
12.5015
10.3092
13.5985
10.7125
9
REVIEW OF THE GROUP’S OPERATING PERFORMANCE AND FINANCIAL POSITION
OPERATING PERFORMANCE IN THE THIRD QUARTER OF 2013
In the third quarter of 2013, the Diasorin Group’s revenues totaled 104,202 up by 3.6% at constant exchange rates, compared with the third quarter of 2012 (-0.2% at current exchange rates). The Group achieved this result despite the difficult macroeconomic environment, especially in Europe, where the contraction in the IVD market continues in Italy (-2.5%1), France (-2.0%2) and Spain (-6.4%2).
As stated previously, the currency market showed an appreciation of the Euro appreciated against almost all currencies used by the Group, with a negative impact on the third quarter sales of approximately 4.0 million euros compared to the third quarter of 2012.
In detail:
i) 21.1% growth at constant exchange rates (+18.4% at current exchange rates), compared with the same period last year, of CLIA technology product line, net of Vitamin D, driven by the expansion of LIAISON XL installed base and products launched on the market in the past quarters.
ii) 6.3% decline at constant exchange rates in Vitamin D sales (-11.1% at current exchange rates), with different trends depending on the geographical areas: steady growth in Italy, Germany, Brazil and Australia, contraction in France and North America. The United States market confirms the slowdown in sales decrease due to steady volumes when compared with 2012 and the attenuation of the negative impact deriving from the price renegotiation which occurred in the previous quarters;
iii) higher instruments and consumables sales, (+10.3% at constant exchange rates, +5.2% at current exchange rates), with a positive impact on the future revenues deriving from the sales of tests performed on these systems;
iv) The expansion of installed base: 146 new instruments have been placed, totaling 5,206 units installed at September 30, 2013. LIAISON XL new placements in the third quarter of 2013 amounted to 124, including 63 units in the validation phase at customers facilities.
As a result of the above, net of Vitamin D, the Group’s total revenues increased by 8.3% at constant exchange rates (+4.9% at current exchange rates) compared with the same period in 2012.
In the third quarter of 2013, the gross profit amounted to 70,683 thousand euros, with a loss of 1,930 thousand euros when compared with 72,613 thousand euros in the same period in 2012. The ratio of gross profit to revenues decreased from 69.5% to 67.8%, as a result of the different mix of sales, even though in line with the previous quarters.
1 Source Assobiomedica. Latest 2013 data available 2 Source EDMA. Latest 2013 data available
10
In the third quarter of 2013, operating expenses totaled 37,232 thousand euros, up by 0.7 percentage points or 248 thousand euros compared with the same period in 2012, due to the expenses for the start-up of the molecular business and the technical support for the growing installed base at customers facilities.
Other operating expenses equal to 1,736 thousand euros, increased by 511 thousand euros compared with the third quarter of 2012. This item reflects the exchange rate fluctuation: the amount includes a negative translation difference of 798 thousand euros related to commercial items (189 thousand euros in the same period of 2012).
EBITDA amounted to 38,628 thousand euros (41,760 thousand euros in 2012). The ratio of EBITDA to revenues decreased from 40% in the third quarter of 2012 to 37.1% in the third quarter of 2013. The difference of 3,131 thousand euros between these two quarters is mainly the result of the negative effect related to the exchange rates fluctuation above described equal to over 2.0 million euros. Excluding the molecular business contribution in the periods under comparison, and the exchange rates impact, EBITDA would be equal to 39.5% of revenues (about 42% in 2012), confirming the marginality of the two previous quarters.
EBIT decreased from 34,404 thousand euros in 2012 to 31,715 thousand euros in the third quarter of 2013, equal to 30.4% of revenues, down by 2.5% compared with the same period in 2012.
Net financial expenses totaled 937 thousand euros, compared with net financial expenses of 578 thousand euros in the third quarter of 2012. The increase of 359 thousand euros, is mainly related to the negative translation effect of the period, equal to 416 thousand euros (92 thousand euros in the third quarter of 2012) and to the financial balances of subsidiaries that use currencies different from the Group’s reporting currency.
Income taxes totaled 10,764 thousand euros in the third quarter of 2013 (12,410 thousand euros in the same period of 2012). The tax rate decreased from 36.7% in the third quarter of 2012 to 35% in the third quarter of 2013, due mainly to the difference in the scheduling of non-deductible tax withholdings calculated on the payment of dividends to the Group’s Parent company.
Finally, in the third quarter of 2013 the net profit totaled 20,014 thousand euros, equal to 19.2% of revenues compared with the net profit of 21,416 thousand euros in the same period in 2012. It should be noted that the decline is mainly attributable to the negative impact of unfavorable exchange rates on the income statement line items.
The table that follows shows the consolidated income statement for the quarters ended September 30, 2013 and September 30, 2012:
11
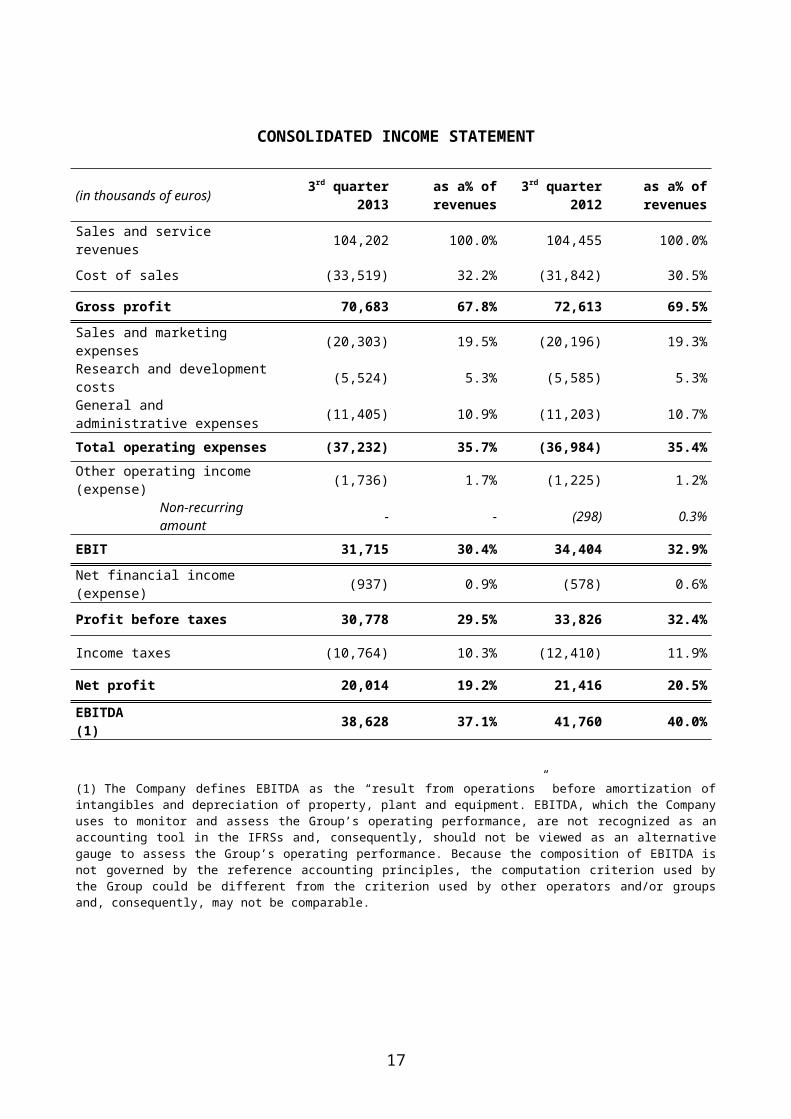
CONSOLIDATED INCOME STATEMENT
(in thousands of euros) 3rd quarter2013
as a% of revenues
3rd quarter2012
as a% of revenues
Sales and service revenues 104,202 100.0% 104,455 100.0%
Cost of sales (33,519) 32.2% (31,842) 30.5%
Gross profit 70,683 67.8% 72,613 69.5%
Sales and marketing expenses (20,303) 19.5% (20,196) 19.3%
Research and development costs (5,524) 5.3% (5,585) 5.3%
General and administrative expenses (11,405) 10.9% (11,203) 10.7%
Total operating expenses (37,232) 35.7% (36,984) 35.4%
Other operating income (expense) (1,736) 1.7% (1,225) 1.2%
Non-recurring amount - - (298) 0.3%
EBIT 31,715 30.4% 34,404 32.9%
Net financial income (expense) (937) 0.9% (578) 0.6%
Profit before taxes 30,778 29.5% 33,826 32.4%
Income taxes (10,764) 10.3% (12,410) 11.9%
Net profit 20,014 19.2% 21,416 20.5%
EBITDA (1) 38,628 37.1% 41,760 40.0%
(1) The Company defines EBITDA as the “result from operations” before amortization of intangibles and depreciation of property, plant and equipment. EBITDA, which the Company uses to monitor and assess the Group’s operating performance, are not recognized as an accounting tool in the IFRSs and, consequently, should not be viewed as an alternative gauge to assess the Group’s operating performance. Because the composition of EBITDA is not governed by the reference accounting principles, the computation criterion used by the Group could be different from the criterion used by other operators and/or groups and, consequently, may not be comparable.
12

Net Revenues
As mentioned earlier in this report, in the third quarter of 2013, revenues totaled 104,202 thousand euros, up by 3.6% at constant exchange rates and almost in line (-0.2%) at current exchange rates compared with the same period last year.
Breakdown of revenues by geographic region
The table below provides a breakdown of the consolidated revenues of the Diasorin Group by geographic region of destination.
(in thousands of euros) 3rd quarter2013
3rd quarter2012
% Change at current exchange
rates
% Change at constant
exchange ratesEuropa and Africa 49,580 47,333 +4.7% +5.1%North America 26,050 30,481 -14.5% -9.4%Asia Pacific 16,495 14,635 +12.7% +18.4%Central and South America 12,077 12,006 +0.6% +13.2%Total 104,202 104,455 -0.2% +3.6%
Europe and Africa47.6%
North America25.0%
Asia Pacific15.8%
Central and South America
11.6%
3rd quarter, 2013
Europe and Africa45.3%
North America29.2%
Asia Pacific14.0%
Central and South America
11.5%
3rd quarter, 2012
Europa and Africa
In the third quarter of 2013, revenues booked in Europe and Africa totaled 49,580 thousand euros, up by 4.7% compared with the same period last year (47,333 thousand euros). Net of revenues generated from Vitamin D sales, all countries, except Israel, reported higher revenues compared with the third quarter of 2012. CLIA reagent sales, net of Vitamin D, increased by 15.3% compared with the same period last year.
Higher contribution to revenue was provided by Germany (+7.2%) and Italy (+6.9%), despite a 2.5% contraction in the Italian IVD market. Moreover, a decrease in sales on the French market (-4.4%), mainly due to the decline in Vitamin D sales, was partly offset by CLIA products, up by 14.8% compared with the third quarter of 2012.
13
North America
In the third quarter of 2013, revenues generated in the North American market totaled 26,050 thousand euros, down by 9.4% at constant exchange rates (-14.5% at current exchange rates) compared with the same period last year.
As reported in the previous quarters, North America performance was mainly impacted by lower Vitamin D sales (-14.2% at constant exchange rates, -19.2% at current exchange rates). It should be noted that volumes did not change compared with the same period in 2012. Therefore the revenues decrease is the result of the different mix of customers and lower average selling price (even though this trend slowed down compared with the previous quarters). On the contrary, revenues of CLIA specialties, increased 24.1% at constant exchange rates (+17.6% at current exchange rates).
Asia Pacific
In third quarter of 2013, the Asia Pacific sales region reported revenues of 16,495 thousand euros, up 18.4% compared with the same period last year (+12.7% at current exchange rates). In China sales increased by 16.1% (+13.6% at current exchange rates), and CLIA sales increased about 58% at constant exchange rates. In Australia, sales increased by 13.7% at constant exchange rates, due to the strong performance of Vitamin D and CLIA products (sales more than doubled compared with 2012). The Australian dollar lost value versus the euro, at current exchange rates (sales decreased by 5.5% compared with 2012). Sales grew by 10% compared with the same period last year in markets where the Group does not have a direct presence.
Central and South America
In third quarter of 2013, the Latin American sales region reported revenues of 12,077 thousand euros, up 13.2% at constant exchange rates compared with the third quarter of 2012 and substantially in line at current exchange rates due to the Brazilian real depreciation. This change is the result of the higher sales in countries where the Group operates through local distributors (+45.5% compared with 2012) together with the Brazilian subsidiary performance, up 4.5% at constant exchange rates (-14% at current exchange rates). The change is due to the Brazilian subsidiary’s stronger sales of CLIA reagents (+24% compared with the same period in 2012). In the third quarter of 2013, net of the currency effect, the sales of the Mexican subsidiary increased by 8.6 percentage points (+5% at current exchange rates) compared with the third quarter of 2012.
14
Breakdown of revenues by technology
The tables that follow show the percentage of the Group’s consolidated revenues contributed by each technology in the third quarter of 2013 and 2012.
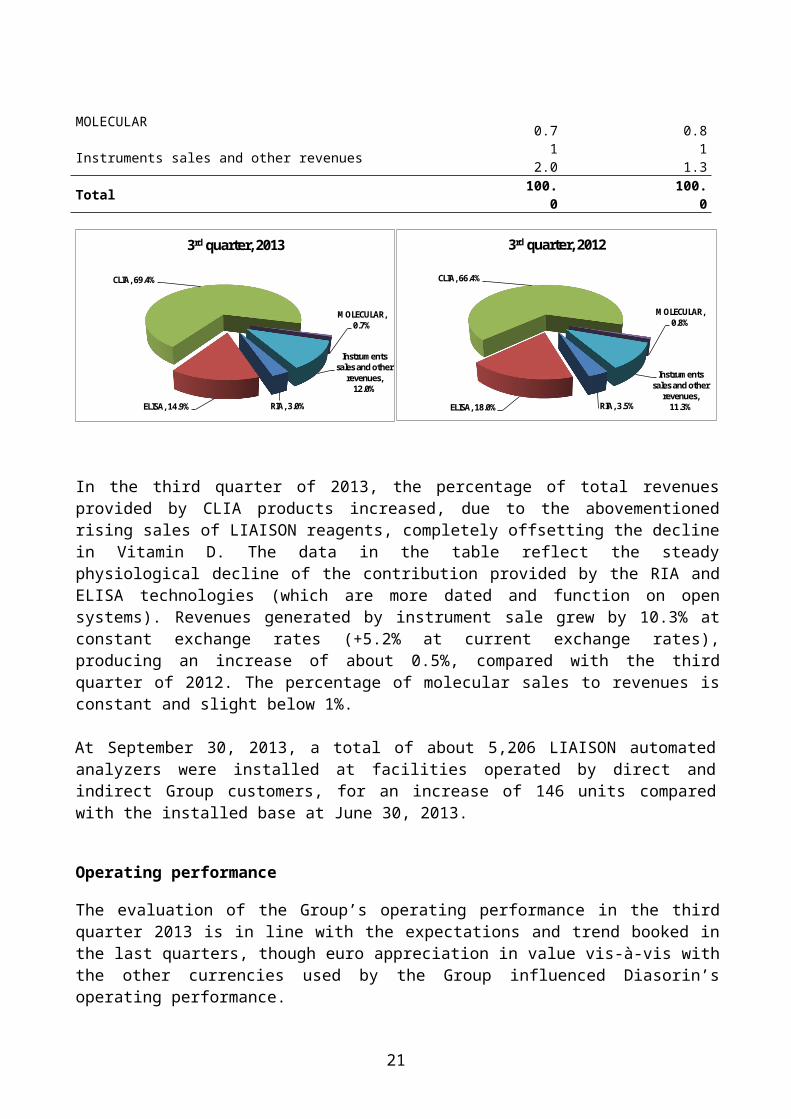
% of revenues contributed 3rd quarter 2013 3rd quarter 2012
RIA 3.0 3.5 ELISA 14.9 18.0 CLIA 69.4 66.4 MOLECULAR 0.7 0.8 Instruments sales and other revenues 12.0 11.3 Total 100.0 100.0
RIA, 3.0%ELISA, 14.9%
CLIA, 69.4%
MOLECULAR, 0.7%
Instruments sales and other
revenues, 12.0%
3rd quarter, 2013
RIA, 3.5%ELISA, 18.0%
CLIA, 66.4%
MOLECULAR, 0.8%
Instruments sales and other
revenues, 11.3%
3rd quarter, 2012
In the third quarter of 2013, the percentage of total revenues provided by CLIA products increased, due to the abovementioned rising sales of LIAISON reagents, completely offsetting the decline in Vitamin D. The data in the table reflect the steady physiological decline of the contribution provided by the RIA and ELISA technologies (which are more dated and function on open systems). Revenues generated by instrument sale grew by 10.3% at constant exchange rates (+5.2% at current exchange rates), producing an increase of about 0.5%, compared with the third quarter of 2012. The percentage of molecular sales to revenues is constant and slight below 1%.
At September 30, 2013, a total of about 5,206 LIAISON automated analyzers were installed at facilities operated by direct and indirect Group customers, for an increase of 146 units compared with the installed base at June 30, 2013.
Operating performance
The evaluation of the Group’s operating performance in the third quarter 2013 is in line with the expectations and trend booked in the last quarters, though euro appreciation in value vis-à-vis with the other currencies used by the Group influenced Diasorin’s operating performance.
In the third quarter of 2013, the gross profit amounted to 70,683 thousand euros, compared with 72,613 thousand euros in the same period in 2012. The ratio of gross profit to revenues decreased from 69.5% to 67.8%. This trend resulted from the different geographic sales mix of the periods under comparison.
15
In the third quarter of 2013, operating expenses totaled 37,232 thousand euros, up by 0.7 percentage points compared with the same period in 2012. The ratio of operating expenses to total revenues increased from 35.4% to 35.7%, as a result of the Molecular diagnostics business in start-up phase and expenses related to the technical support for the growing installed base. The foreign exchange market positively impacted the operating expenses for about 1.2 million euros.
Research and development costs totaled 5,524 thousand euros, in line with 2012 results (5,585 thousand euros in the third quarter of 2012) and refer mainly to activities concerning the development of molecular diagnostics new products. In the third quarter of 2013, the ratio of research and development costs to revenues amounted to 5.3 percentage points, in line with the third quarter of 2012.
Sales and marketing expenses totaled 20,303 thousand euros, up by 0.5% compared with the third quarter of 2012, due to the costs incurred to support the launch of new products and expenses of technical support for the instruments at customers facilities.
General and administrative expenses totaled 11,405 thousand euros, up 1.8% compared with the third quarter of 2012, their ratio to total revenues equal to 10.9 percentage points, up 0.2% compared with the third quarter of 2012.
Other operating expenses equal to 1,736 thousand euros (1,225 thousand euros in the third quarter of 2012) include a negative translation adjustment of 798 thousand euros related to commercial items (negative translation adjustment of 189 thousand euros in the same period of 2012), deriving from a sharp depreciation of the Brazilian Real and the Australian dollar (including 131 thousand euros recognized purely for valuation purposes) and 476 thousand euros (180 thousand euros in the third quarter of 2012) in tax expenses, including 243 thousand euros for the Medical Device Tax introduced in the United States in 2013.
EBITDA amounted to 38,628 thousand euros compared with 41,760 thousand euros in 2012, decreased to 37.1% of revenues (40% of revenues in 2012). The reduction of 3,132 thousand euros is the result of the abovementioned translation effects equal to over 2 million euros. Excluding the molecular business contribution and the exchange rates impact in the periods under comparison, EBITDA would be equal to 39.5 percentage points of revenues (about 42% in 2012) confirming the performance of the previous quarters.
In the third quarter of 2013, EBIT totaled 31,715 thousand euros, equal to 30.4% of revenues (32.9% the same period in 2012).
Financial income and expense
In the third quarter of 2013, net financial expenses totaled 937 thousand euros, compared with net financial expenses of 578 thousand euros in the same period in 2012.
The fair value of the Group’s financial instruments was positive by 255 thousand euros (471 thousand euros in the third quarter of 2012), recognized purely for valuation purposes.
The currency translation effect on other financial balances, which was negative by 416 thousand euros (negative by 92 thousand euros in the third quarter of 2012), related mainly to the Euro exchange rate in the dividends received by the Group’s Parent Company for 163 thousand euros, together with the financial balances of subsidiaries that use currencies different from the Group’s
16
Parent Company currency (131 thousand euros) and the intercompany financing disbursed by the Group’s Parent company to the Australian subsidiary in the local currency (98 thousand euros). Interests and other financial expenses for the period included 463 thousand euros in factoring transaction fees (666 thousand euros in the third quarter of 2012).
Profit before taxes and net profit
The third quarter of 2013 ended with a result before taxes of 30,778 thousand euros, which generated a tax liability of 10,764 thousand euros, down from the same period last year, when the result before taxes and the corresponding tax liability amounted to 33,826 thousand euros and 12,410 thousand euros, respectively.
The tax rate decreased from 36.7% in the third quarter of 2012 to 35% in 2013, due mainly to a lower amount of taxable dividends the Group’s Parent company received in the periods under comparison.
The net profit for the third quarter of 2013 totaled 20,014 thousand euros equal to 19.2% of revenues (21,416 thousand euros equal to 20.5% of revenues in the same period last year). The reduction is due to the negative impact of unfavorable exchange rate on the income statement line items.
17

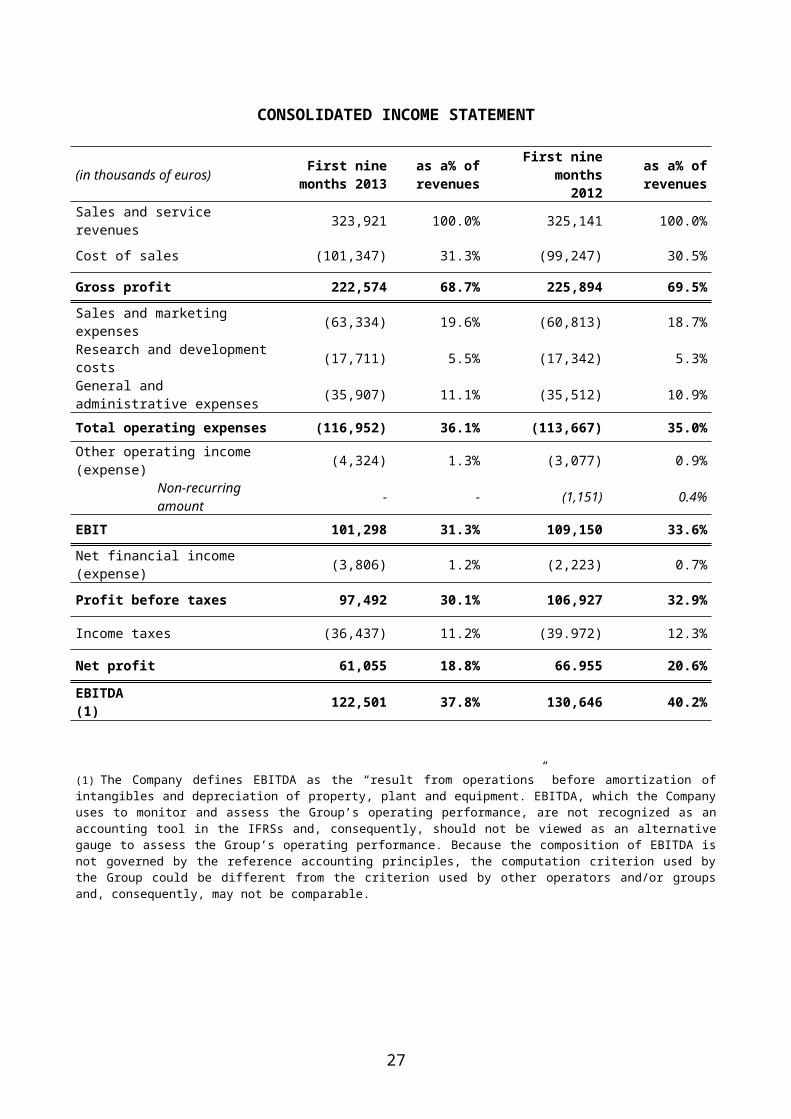
OPERATING PERFORMANCE IN THE FIRST NINE MONTHS OF 2013
In the first nine months of 2013, the Diasorin Group reported revenues of 323,921 thousand euros (+1.6% at constant exchange rates and substantially in line at current exchange rates) compared with 325,141 thousand euros in the first nine months of 2012. The depreciation of some of the currencies used by the Group had a negative impact of about 6.5 million euros.
The positive performance of CLIA products continued, net of Vitamin D, up 16 percentage points at constant exchange rates (around +15% at current exchange rates), offsetting the decline in Vitamin D sales. Noteworthy is the growth in the clinical areas of Tumor markers, Infectious Disease, Prenatal Screening, Parvovirus and the new HIV and Viral Hepatitis assays line. This result was achieved through the introduction of LIAISON XL automated analyzer, that enabled the Group to provide its customers with a solution to compete with the major players in this market segment.
In the first nine months of 2013, the Molecular business generated revenues of 2,385 thousand euros compared with 1,155 thousand euros in 2012. These sales were mainly obtained from customers acquired together with NorDiag business operations and consolidated since May 2012.
Diasorin placed 405 LIAISON XL, bringing the installed base to 1,010 instruments (including 63 in the validation phase at customers facilities). An additional 61 LIAISON analyzers have been placed, bringing to 466 the total number of LIAISON and LIAISON XL analyzers installed in the first nine months of 2013.
The gross profit totaled 222,574 thousand euros, compared with 225,894 thousand euros in the same period in 2012, for a decrease of 1.5% or 3,320 thousand euros. At September 30, 2013, the ratio of gross profit to revenues was equal to 68.7%, for a loss of 0.8% over the ratio at September 30, 2012 as a result of the different mix of sales in the periods under comparison.
At September 30, 2013, operating expenses totaled 116,952 thousand euros, for a gain of 2.9 percentage points or 3,285 thousand euros compared with the same period in 2012, mainly due to the expenses for the start-up of the Molecular business and expenses related to the technical support for the growing installed base number. The foreign exchange market impacted the operating expenses for about 2 million euros.
EBITDA amounted to 122,501 thousand euros, compared with 130,646 thousand euros in 2012. The ratio of EBITDA to revenues decreased from 40.2 percentage points at September 30, 2012 to 37.8 percentage points this year. The decrease, equal to 8,145 thousand euros, is the result of the exchange rates effect for over 3.3 million euros. Excluding the Molecular business and the exchange rates impact, EBITDA would be equal to 40 percentage points of revenues (41.9% at September 30, 2012).
In the first nine months of 2013, EBIT totaled 101,298 thousand euros, compared with 109,150 in the same period in 2012, equal to 31.3% of revenues, compared with 33.6% of revenues in 2012.
Net financial expenses totaled 3,806 thousand euros in the first nine months of 2013, compared with net financial expenses of 2,223 thousand euros in the same period last year. The difference between these two periods is mainly the result of the exchange rates fluctuation: the first nine months of 2013 reported an expense of 1,321 thousand euros related to the translation effect, compared with a gain of 122 thousand euros in the first nine months of 2012.
18
In the first nine months of 2013, the net profit totaled 61,055 thousand euros, equal to 18.8% of revenues, compared with 66,955 thousand euros, equal to 20.6% of revenues in the first nine months of 2012. In the first nine months of 2013, the net profit was significantly impacted by the fluctuation of the exchange rates market, as mentioned above.
The table that follows shows the consolidated income statement for the quarters ended September 30, 2013 and September 30, 2012:
19
CONSOLIDATED INCOME STATEMENT
(in thousands of euros) First nine months 2013
as a% of revenues
First nine months2012
as a% of revenues
Sales and service revenues 323,921 100.0% 325,141 100.0%
Cost of sales (101,347) 31.3% (99,247) 30.5%
Gross profit 222,574 68.7% 225,894 69.5%
Sales and marketing expenses (63,334) 19.6% (60,813) 18.7%
Research and development costs (17,711) 5.5% (17,342) 5.3%
General and administrative expenses (35,907) 11.1% (35,512) 10.9%
Total operating expenses (116,952) 36.1% (113,667) 35.0%
Other operating income (expense) (4,324) 1.3% (3,077) 0.9%
Non-recurring amount - - (1,151) 0.4%
EBIT 101,298 31.3% 109,150 33.6%
Net financial income (expense) (3,806) 1.2% (2,223) 0.7%
Profit before taxes 97,492 30.1% 106,927 32.9%
Income taxes (36,437) 11.2% (39.972) 12.3%
Net profit 61,055 18.8% 66.955 20.6%
EBITDA (1) 122,501 37.8% 130,646 40.2%
(1) The Company defines EBITDA as the “result from operations” before amortization of intangibles and depreciation of property, plant and equipment. EBITDA, which the Company uses to monitor and assess the Group’s operating performance, are not recognized as an accounting tool in the IFRSs and, consequently, should not be viewed as an alternative gauge to assess the Group’s operating performance. Because the composition of EBITDA is not governed by the reference accounting principles, the computation criterion used by the Group could be different from the criterion used by other operators and/or groups and, consequently, may not be comparable.
20
Net Revenues
In the first nine months of 2013, revenues totaled 323,921 thousand euros (325,141 thousand euros in the same period last year), up 1.6% at constant exchange rates and substantially in line at current exchange rates (-0.4%).Molecular business sales of the period totaled 2,385 thousand euros and were obtained mainly from customers acquired with NorDiag business in 2012.
The evolution of sales was due to the following elements:
i) 16% increase at constant exchange rates (+14.7% at current exchange rates) in CLIA technology product line, net of Vitamin D, thanks to the LIAISON XL success and new products launched on the market in 2013 (today exceeding the target of 100 assays available);
ii) 16.7% increase at constant exchange rates (+13.4% at current exchange rates) in instruments and consumables sales, with a positive impact on the future generation of revenues derived from reagent sales;
iii) 10.5 % decrease at constant exchange rates (-12.7% at current exchange rates) in Vitamin D sales, compared with 2012, mainly due to the pricing erosion caused by competing products introduced on the market. Worth mentioning is the slowdown of the decrease of the Vitamin D sales, above all at the end of the period, mainly due to lower price reduction in North America and higher revenues in such important markets as Italy, Germany, Australia and Brazil;
iv) Growing sales of instruments and consumables (+16.7% at constant exchange rates, +13.4% at current exchange rates), expected for higher revenues derived from tests performed on these systems.
21
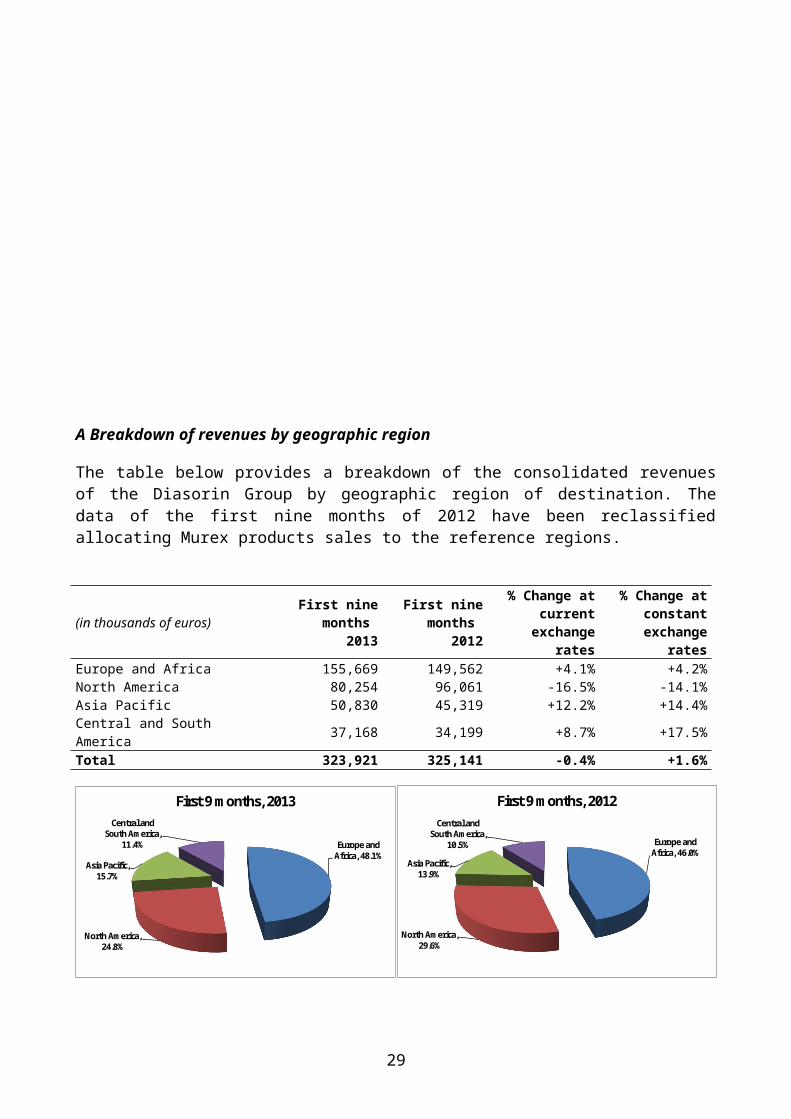
A Breakdown of revenues by geographic region
The table below provides a breakdown of the consolidated revenues of the Diasorin Group by geographic region of destination. The data of the first nine months of 2012 have been reclassified allocating Murex products sales to the reference regions.
(in thousands of euros)First nine
months 2013
First nine months
2012
% Change at current exchange
rates
% Change at constant
exchange ratesEurope and Africa 155,669 149,562 +4.1% +4.2%North America 80,254 96,061 -16.5% -14.1%Asia Pacific 50,830 45,319 +12.2% +14.4%Central and South America 37,168 34,199 +8.7% +17.5%Total 323,921 325,141 -0.4% +1.6%
Europe and Africa, 48.1%
North America, 24.8%
Asia Pacific, 15.7%
Central and South America,
11.4%
First 9 months, 2013
Europe and Africa, 46.0%
North America, 29.6%
Asia Pacific, 13.9%
Central and South America,
10.5%
First 9 months, 2012
Europe and Africa
Despite the difficult macroeconomic environment that characterized most of the European markets, revenues booked in the Europe and Africa sales region totaled 155,669 thousand euros, for a gain of 4.1% compared with 2012. Specifically:
i) revenues growth in the Italian market (+6.1%), despite a -2.5% contraction in the reference market, driven by the introduction of new products (mainly in the Hepatitis and Endocrinology clinical areas), the strong performance of Vitamin D sales and the enrichment of the Infectious Diseases panel;
ii) growth in the German market (+11.2%), due to long-terms contract signed in 2012 with big chains of private laboratories which adopted LIAISON XL, the introduction of new products (Endocrinology) and the upward trend in Vitamin D sales (+19.7%);
iii) sales slowdown in the French market (-5.3%) due exclusively to the Vitamin D performance. Net of sales, the French market reported a growth of about 6 percentage points, despite a 2% contraction in the reference market. Sales of CLIA reagents, excluding Vitamin D, were up over 15 percentage points, compared with the first nine months of 2012;
iv) strong sales in the main countries of the area, excluding UK, Belgium and Israel whose sales resulted in line with the first nine months of 2012, net of the decrease in Vitamin D sales.
22
North America
In the first nine months of 2013, the North America sales region reported revenues of 80,254 thousand euros, down 14.1% at constant exchange rates compared with the first nine months of 2012 (-16.5% at current exchange rates). This change reflects two opposing phenomena:
i) the good performance of CLIA specialties with a gain of 21.2 percentage points at constant exchange rates (+17.9% at current exchange rates) through mainly Infectiology and Prenatal Screening product families;
ii) the downward trend in Vitamin D sales (-18.1% at constant exchange rates, -20.4% at current exchange rates) driven by a reduction in selling price. It should be noted that this phenomenon slowed down at the end of the first nine months of 2013, as previously stated.
Asia Pacific
In the first nine months of 2013, revenues of the Asia Pacific sales region amounted to 50,830 thousand euros, up by 14.4% at constant exchange rates (+12.2% or 5,511 thousand euros at current exchange rates), compared with the same period in 2012.
This situation is the net result of:
i) the good performance of the Chinese subsidiary, with revenues increased by 14.7% at constant exchange rates (+14.5% at current exchange rates) on all CLIA products with a gain of 42.7%. Noteworthy is the success of LIAISON XL automated analyzer, launched in December 2012.
ii) sales growth in the Australian market (+33% at constant exchange rates, +22.2% at current exchange rates), due to Vitamin D revenues recovery and diversification of catalog, that led to higher revenues related to CLIA products (which almost tripled).
iii) Steady growth of revenues generated through distributors in markets where the Group does not have a direct presence.
Central and South America
In the first nine months of 2013, the Latin American sales region booked revenues of 37,168 thousand euros, up by 17.5 percentage points at constant exchange rates (+8.7% at current exchange rates) compared with 34,199 thousand euros in the same period of 2012. This change is mainly attributable to:
i) the performance of the Brazilian subsidiary (+14.5% at constant exchange rates and substantially in line at current exchange rates), as a result of the upward trend in CLIA sales (+16.2%) and instruments and consumables sale;
ii) the performance of the network of the Group’s distributors, (+31.7% compared with the first nine months of 2012) in countries where the Group does not have a direct presence. In this area, strong instruments sales reported in December 2012, are now enjoying routine activity levels, generating a steady and growing revenue stream from the sale of reagents (+24.9%);
iii) the performance of the Mexican subsidiary (+2.5% at constant exchange rates, +4% at current exchange rates).
23
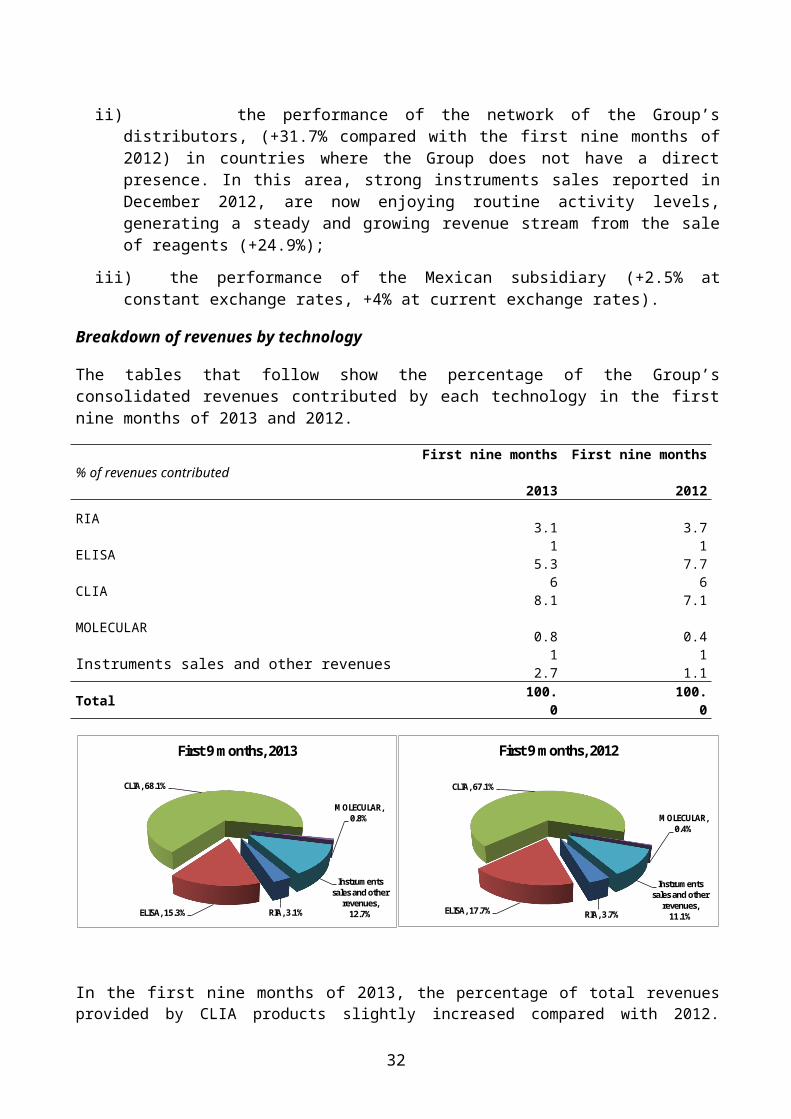
Breakdown of revenues by technology
The tables that follow show the percentage of the Group’s consolidated revenues contributed by each technology in the first nine months of 2013 and 2012.
% of revenues contributed First nine months 2013
First nine months 2012
RIA 3.1 3.7 ELISA 15.3 17.7 CLIA 68.1 67.1 MOLECULAR 0.8 0.4 Instruments sales and other revenues 12.7 11.1 Total 100.0 100.0
RIA, 3.1%ELISA, 15.3%
CLIA, 68.1%
MOLECULAR, 0.8%
Instruments sales and other
revenues, 12.7%
First 9 months, 2013
RIA, 3.7%ELISA, 17.7%
CLIA, 67.1%
MOLECULAR, 0.4%
Instruments sales and other
revenues, 11.1%
First 9 months, 2012
In the first nine months of 2013, the percentage of total revenues provided by CLIA products slightly increased compared with 2012. Revenues generated by instruments sales equal to +16.7% at constant exchange rates (+13.4% at current exchange rates), producing an increase of 1.5 percentage points on total revenues, contrasted the decrease in Vitamin D sale (almost completely offset by the growth in CLIA ex Vitamin D revenues); instruments sales will have a positive impact on revenues generated by reagents in the next months. The data in the table reflect the steady physiological decline of the contribution provided by the RIA and ELISA technologies.
24
Operating performance
The evaluation of the Group’s operating performance in the first nine months of 2013 is in line with the expectations and trend booked in the previous quarters.
In the first nine months of 2013, the gross profit amounted to 222,574 thousand euros, compared with 225,894 thousand euros in the same period in 2012. The ratio of gross profit to revenues equal to 68.7% decreased by 0.8% compared with 2012. This trend resulted from the different geographic sales mix of the periods under comparison.
In the first nine months of 2013, operating expenses totaled 116,952 thousand euros, up by 2.9 percentage points compared with the same period in 2012. The ratio of operating expenses to total revenues increased from 35% to 36.1%, as a result of the Molecular diagnostics business in start-up phase and higher expenses related to the technical support for the growing installed base at customers facilities.
Research and development costs rose by 2.1% compared with the same period in 2012 and refer mainly to activities concerning the development of molecular diagnostics new products. In the first nine months of 2013, the ratio of research and development costs to revenues rose from 5.3 percentage points in first nine months of 2012 to 5.5 percentage points in the first nine months of 2013.
General and administrative expenses totaled 35,907 thousand euros, their ratio to total revenues equal to 11.1 percentage points ( +1.1% compared with the first nine months of 2012).
Other operating expenses equal to 4,324 thousand euros (3,077 thousand euros in the first nine months of 2012) include a negative translation effect of 1,399 thousand euros related to commercial items (negative translation effect of 990 thousand euros in the same period of 2012), 508 thousand euros of additions for provisions to risks and allowances for doubtful accounts (release of provisions for 912 thousand euros in the first nine months of 2012) and 1,583 thousand euros in tax expenses (566 thousand euros in first nine month of 2012), including 729 thousand euros for the Medical Device Tax introduced in the United States in 2013.
EBITDA amounted to 122,501 thousand euros down by 6.2 percentage points compared with the same period last year. EBITDA incidence to revenues decreased from 40.2% in 2012 to 37.8% in the first nine months of 2013. Excluding the molecular business contribution and the exchange rates impact in the periods under comparison, EBITDA would be equal to about 40 percentage points of revenues (41.9% in 2012).
In the first nine months of 2013, EBIT totaled 101,298 thousand euros, equal to 31.3% of revenues and down 7.2 percentage points compared with the same period in 2012.
Financial income and expense
In the first nine months of 2013, net financial expenses totaled 3,806 thousand euros, compared with net financial expenses of 2,223 thousand euros in the same period in 2012.
The fair value of the Group’s financial instruments was negative by 113 thousand euros against a positive fair value of 98 thousand euros in the first nine months of 2012. Forward contracts closed out
25
in the first nine months of 2013 reported a loss of 205 thousand euros (forward contracts closed out in 2012 reported a loss of 40 thousand euros)The translation effect on other financial balances, which was negative by 1,321 thousand euros (positive by 122 thousand euros in the first nine months of 2012), related mainly to Euro exchange rate in medium and long-term intercompany financing disbursed by the Group’s Parent company to the Australian subsidiary in the local currency (636 thousand euros) and to translation effect on the GE Capital borrowing in USD refunded in the period (302 thousand euro).
Interests and other financial expense for the period included 1,561 thousand euros in factoring transaction fees (1,799 thousand euros in the first nine months of 2012).
Profit before taxes and net profit
The first nine months of 2013 ended with a result before taxes of 97,492 thousand euros, which generated a tax liability of 36,437 thousand euros, down from the same period last year, when the result before taxes and the corresponding tax liability amounted to 106,927 thousand euros and 39,972 thousand euros, respectively. The tax rate amounting to 37.4% was in line with data at September 30, 2012.
The net profit totaled 61,055 thousand euros compared with the net profit of 66,955 thousand euros in the first nine month of 2012, as a result of the negative effect related to exchange rates fluctuation above described.
26
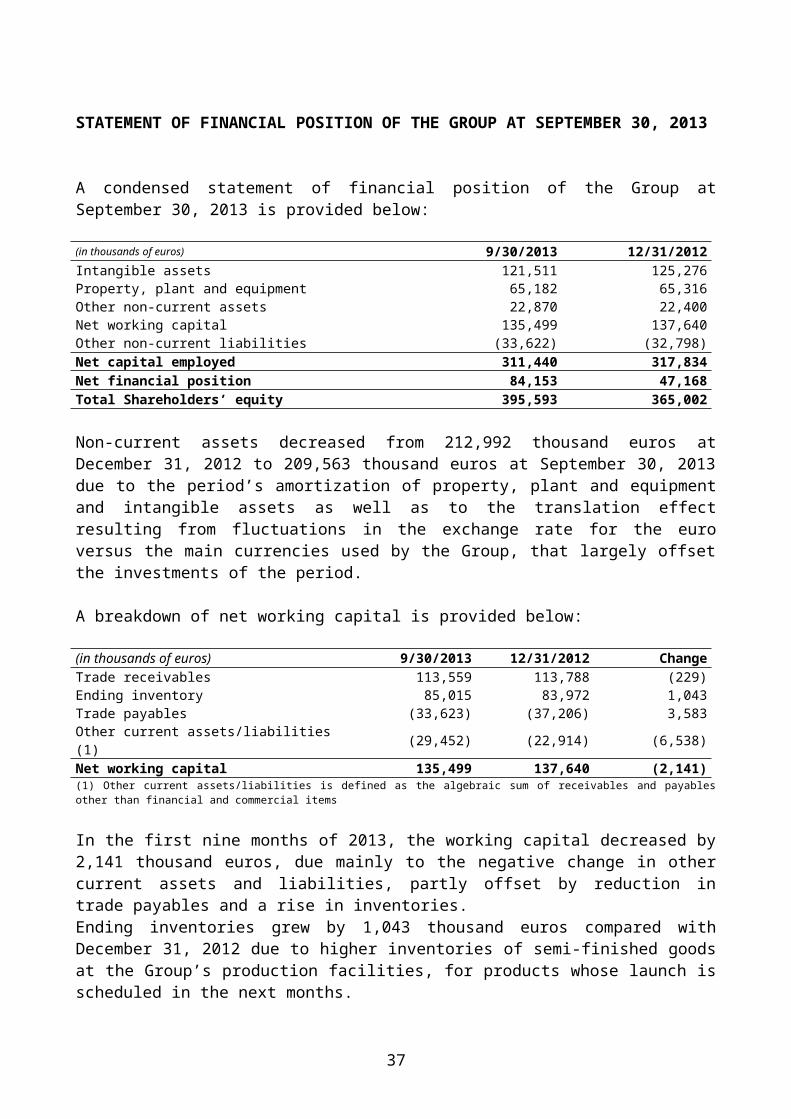
STATEMENT OF FINANCIAL POSITION OF THE GROUP AT SEPTEMBER 30, 2013
A condensed statement of financial position of the Group at September 30, 2013 is provided below:
(in thousands of euros) 9/30/2013 12/31/2012Intangible assets 121,511 125,276Property, plant and equipment 65,182 65,316Other non-current assets 22,870 22,400Net working capital 135,499 137,640Other non-current liabilities (33,622) (32,798)Net capital employed 311,440 317,834Net financial position 84,153 47,168Total Shareholders’ equity 395,593 365,002
Non-current assets decreased from 212,992 thousand euros at December 31, 2012 to 209,563 thousand euros at September 30, 2013 due to the period’s amortization of property, plant and equipment and intangible assets as well as to the translation effect resulting from fluctuations in the exchange rate for the euro versus the main currencies used by the Group, that largely offset the investments of the period.
A breakdown of net working capital is provided below:
(in thousands of euros) 9/30/2013 12/31/2012 ChangeTrade receivables 113,559 113,788 (229)Ending inventory 85,015 83,972 1,043Trade payables (33,623) (37,206) 3,583Other current assets/liabilities (1) (29,452) (22,914) (6,538)Net working capital 135,499 137,640 (2,141)(1) Other current assets/liabilities is defined as the algebraic sum of receivables and payables other than financial and commercial items
In the first nine months of 2013, the working capital decreased by 2,141 thousand euros, due mainly to the negative change in other current assets and liabilities, partly offset by reduction in trade payables and a rise in inventories. Ending inventories grew by 1,043 thousand euros compared with December 31, 2012 due to higher inventories of semi-finished goods at the Group’s production facilities, for products whose launch is scheduled in the next months.Other current assets/liabilities increased by 6,538 thousand euros, due to income tax liabilities and tax credits registered at December 31, 2012 during 2013. Trade receivables were substantially in line with December 2012.
At September 30, 2013 the net consolidated financial position was positive by 84,153 thousand euros for an increase of 36,985 thousand euros compared with December 31, 2012, due to the cash flow generated from operating activities in the first nine months of 2013, equal to 65,941 thousand euros.
27

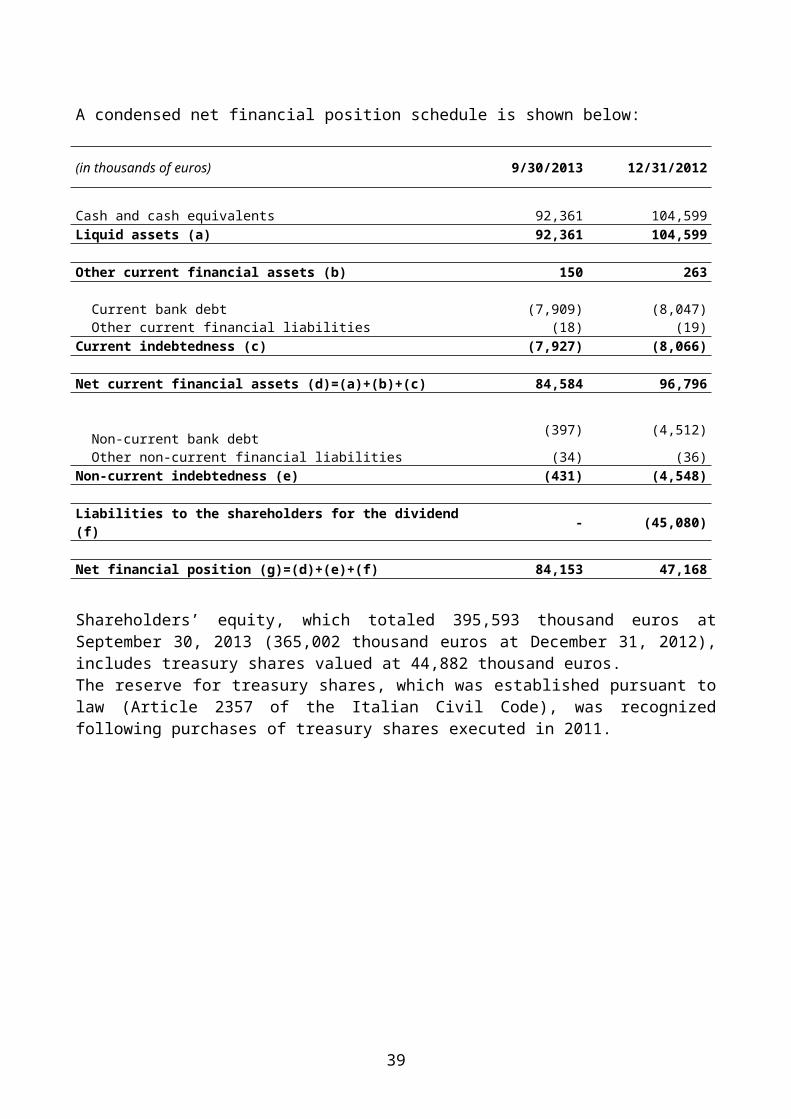
A condensed net financial position schedule is shown below:
(in thousands of euros) 9/30/2013 12/31/2012
Cash and cash equivalents 92,361 104,599Liquid assets (a) 92,361 104,599
Other current financial assets (b) 150 263
Current bank debt (7,909) (8,047) Other current financial liabilities (18) (19)Current indebtedness (c) (7,927) (8,066)
Net current financial assets (d)=(a)+(b)+(c) 84,584 96,796
Non-current bank debt (397) (4,512)
Other non-current financial liabilities (34) (36)Non-current indebtedness (e) (431) (4,548)
Liabilities to the shareholders for the dividend (f) - (45,080)
Net financial position (g)=(d)+(e)+(f) 84,153 47,168
Shareholders’ equity, which totaled 395,593 thousand euros at September 30, 2013 (365,002 thousand euros at December 31, 2012), includes treasury shares valued at 44,882 thousand euros. The reserve for treasury shares, which was established pursuant to law (Article 2357 of the Italian Civil Code), was recognized following purchases of treasury shares executed in 2011.
28
ANALYSIS OF CONSOLIDATED CASH FLOWS
A schedule showing a condensed consolidated statement of cash flows, followed by a review of the main statement items and of the changes that occurred compared with the corresponding period in 2012, is provided below:
(in thousands of euros)First nine
months2013
First nine months
2012
3rd quarter 2013
3rd quarter 2012
Cash and cash equivalents at the beginning of period 104,599 64,145 67,506 69,843
Net cash from operating activities 85,450 84,990 36,706 30,072Cash used for investing activities (21,055) (21,464) (8,654) (8,166)Cash used for financing activities (76,903) (28,316) (3,197) 6
Acquisitions of subsidiaries and business operations 270 (7,600) - -
Net change in cash and cash equivalents (12,238) 27,610 24,855 21,912
Cash and cash equivalents at end of period 92,361 91,755 92,361 91,755
The net cash flow from operating activities increased from 84,990 thousand euros in the first nine months of 2012 (30,072 thousand euros in the third quarter of 2012) to 85,450 thousand euros in the first nine months of 2013 (36,706 thousand euros in the third quarter of 2013). The cash generated by operations (net profit plus depreciation and amortization, additions to provisions and other non-cash items) was lower and equal to 123,309 thousand euros compared with 128,264 thousand euros in the same period in 2012. The first nine months of 2013 enjoyed the collection of past-due positions owed by public entities in the countries where the Group operates. Moreover, tax payments totaled 28,624 thousand euros (42,109 thousand euros in the first nine months of 2012).
Net cash used in investing activities totaled 21,055 thousand euros, compared with 21,464 thousand euros in the first nine months of 2012. Capital expenditures for medical equipment amounted to 14,428 thousand euros (5,401 thousand euros in the third quarter of 2013), substantially in line with 2012 (14,901 thousand euros in the first nine months of 2012 and 5,460 thousand euros in the third quarter of 2012). In addition, development costs of 2,344 thousand euros (830 thousand euros in the third quarter of 2013) were capitalized in the first nine months of 2013, compared with 2,723 thousand euros in 2012 (1,073 thousand euros in the third quarter of 2012), mainly in connection with investments in molecular diagnostics.
The cash used for financing activities totaled 76,903 thousand euros (28,316 in the same period last year). It was used mainly for a dividend distribution of 72,257 thousand euros (including 45,080 thousand euros for an extraordinary dividend distribution occurred at the beginning of 2013) and repayments of financing facilities amounting to 4,190 thousand euros.
Moreover, in May the Group cashed 270 thousand euros to adjust Nordiag business cost, acquired last year.
Cash and cash equivalents at September 30, 2013 totaled 92,361 thousand euros down from 104,599 thousand euros at the end of 2012.
29

OTHER INFORMATION
The Group totaled 1,608 employees at September 30, 2013 (1,553 at December 31, 2012).
30
TRANSACTIONS WITH RELATED PARTIES
In the normal course of business, Diasorin S.p.A. engages on a regular basis in commercial and financial transactions with its subsidiaries, which are also Group companies. These transactions, which are part of the Group’s regular operations and are executed on standard market terms, consist of the supply of goods and services, including administrative, information technology, personnel management, technical support and consulting services, which produce receivables and payables at the end of the year, and financing and cash management transactions, which produce income and expenses.
These transactions are eliminated in the consolidation process and, consequently, are not discussed in this section of this Report.
The Group awards additional benefits to several eligible employees of Diasorin S.p.A. and other Group companies through a stock option plan. The costs incurred in connection with this plan totaled 1,107 thousand euros in the first nine months of 2013 (1,312 thousand euros in 2012) and 370 thousand euros in the third quarter of 2013 (448 thousand euros in the third quarter of 2012).
The compensation payable to the key management and strategic management is consistent with standard market terms for compensation offered to employees with a similar status.
31
SIGNIFICANT EVENTS OCCURRING AFTER NOVEMBER 30, 2013 AND BUSINESS OUTLOOK
In October, Diasorin announced the launch of the new LIAISON XL Chagas test for the qualitative detection of the antibodies to Trypanosoma cruzi (T.cruzi) in human serum and plasma for the market outside the US and Canada only.The Chagas disease is endemic in Central and Latin American countries, growing also in non-endemic countries through migration of people and, becoming nowadays, an emerging health problem worldwide.As for the market, according to last estimates there are around 18 million people worldwide affected by this chronic, systemic, parasitic infection, of which about 8 million people are resident in Latin America. In terms of value, the current market is estimated around 9 million Euros, excluding the United States, Canada and Japan.
In October, Diasorin launched the EHEC Toxins test on its LIAISON platform for the market outside the US, Canada and UK only. Enterohaemorrhagic E. coli is a bacterium that can cause severe foodborne disease. The launch of the new LIAISON EHEC toxins assay provides a complete, automatic and consolidated solution to a new potential clients base where manual labor is still the most common and problematic solution. This test is an addition to the DiaSorin’s stool menu already available on the market (C. difficile Toxin A&B, C. difficile GDH, H. Pylori) and shows our commitment to rapidly increase the stool panel that establishes Diasorin as a key player in this microbiology field.
Diasorin signed a 5-year agreement with Roche to allow the connectivity of the LIAISON XL System to the cobas 8100® automated workflow series in the High Volume Laboratories requesting to fully automate their diagnostic processes. The agreement also allows Roche to exclusively represent part of the DiaSorin’s specialty assays in this market segment, in association with the Cobas 8100 platform. The connectivity of the two systems is meant to address the rising demand of a broader and complete solution by high volume laboratories, requiring analytical set-up flexibility and a broader online menu of both routine and specialty assays.
In view of the Group’s operating performance after September, 2013 and taking into account possible evolutions of the global macroeconomic scenario and the diagnostic sector in particular, management confirms the guidance already provided for the 2013 reporting year:
Revenues : growth rate between 2% and 4% at constant exchange rate compared with 2012. Molecular business would be equal to about € 5 mln;
EBITDA : in line with the absolute value of 2012 at constant exchange rate, with an absorption from Molecular business equal to about € 6 mln, as a result of investments required in the development of the new business;
LIAISON/LIAISON XL installed base : about 500.
32

CONSOLIDATED FINANCIAL STATEMENTS OF THE DIASORIN GROUP AT SEPTEMBER 30, 2013 AND ACCOMPANYING NOTES
CONSOLIDATED INCOME STATEMENT
(in thousand of euros) notes3rd quarter First nine months
2013 2012 2013 2012Net revenues (1) 104,202 104,455 323,921 325,141
Cost of sales (2) (33,519) (31,842) (101,347) (99,247)
Gross profit 70,683 72,613 222,574 225,894
Sales and marketing expenses (3) (20,303) (20,196) (63,334) (60,813)
Research and development costs (4) (5,524) (5,585) (17,711) (17,342)
General and administrative expenses (5) (11,405) (11,203) (35,907) (35,512)
Other operating income (expenses) (6) (1,736) (1,225) (4,324) (3,077)
Non-recurring amount - (298) - (1,151)
EBIT 31,715 34,404 101,298 109,150
Net financial income/ (expense) (7) (937) (578) (3,806) (2,223)
Profit before taxes 30,778 33,826 97,492 106,927
Taxes (8) (10,764) (12,410) (36,437) (39,972)
Net profit for the period 20,014 21,416 61,055 66,955
Broken down as follows
Minority interest in net result 65 110 288 295
Group’s Parent Company interest in net result 19,949 21,306 60,767 66,660
Earnings per share (basic) (9) 0.37 0.39 1.12 1.23
Earnings per share (diluted) (9) 0.37 0.39 1.12 1.23
33
CONSOLIDATED STATEMENT OF COMPREHENSIVE INCOME
(in thousands of euros)3rd quarter First nine months
2013 2012(*) 2013 2012(*)Net profit for the period (A) 20,014 21,416 61,055 66,955Other comprehensive income that will not be reclassified subsequently to profit/(loss) of the period:
Gains/(losses) on retirement benefit obligations (9) (351) (4) (1,054)Total other comprehensive income that will not be reclassified subsequently to profit/(loss) of the period (B1) (9) (351) (4) (1,054)
Other comprehensive income that will be reclassified subsequently to profit/(loss) of the period:
Gains/(losses) on exchange differences on translating foreign operations (4,529) (3,724) (5,783) (2,247)
Gains/(losses) on net investment hedge 150 274 308 252
Total other comprehensive income that will not be reclassified subsequently to profit/(loss) of the period (B2) (4,379) (3,450) (5,475) (1,995)
TOTAL OTHER COMPREHENSIVE INCOME, NET OF TAX (B1)+(B2)=(B) (4,388) (3,801) (5,479) (3,049)
TOTAL COMPREHENSIVE INCOME (A)+(B) 15,626 17,615 55,576 63,906Including: - amount attributable to minority interests 43 101 280 295- amount attributable to Parent Company shareholders 15,583 17,514 55,296 63,611
(*)Following the retrospective application of the amendment to IAS 19 from January 1, 2013 the comparative figures of the first half 2012 have been restated as required by IAS 1. The relative effect compared with the previously reported figures reflects a decrease in the comprehensive income of the first nine months of 2012 equal to 1,054 thousand euros (351 thousand euros in the third quarter 2012). See section “New accounting principles” of the Report on operations for additional information.
34
CONSOLIDATED STATEMENT OF FINANCIAL POSITION
(in thousands of euros) notes 9/30/2013 12/31/2012 (*)
ASSETS
Non-current assets
Property, plant and equipment (10) 65,182 65,316Goodwill (11) 66,203 67,689Other intangibles (11) 55,308 57,587Equity investments (12) 491 177Deferred-tax assets (13) 20,603 21,342Other non-current assets (14) 1,776 881Total non-current assets 209,563 212,992
Current assets
Inventories (15) 85,015 83,972Trade receivables (16) 113,559 113,788Other current financial assets (20) 150 263Other current assets (17) 8,077 10,540Cash and cash equivalent (18) 92,361 104,599Total current assets 299,162 313,162
TOTAL ASSETS 508,725 526,154
(*)Following the retrospective application of the amendment to IAS 19 from January 1, 2013 the comparative figures at January 1 and December 31, 2012 have been restated as required by IAS 1. More specifically, the figure for deferred tax assets reported in the Consolidated Financial Statements at 31 December 2012 has increased by 1,134 thousand euros. See section “New accounting principles” of the Report on operations for additional information
35

CONSOLIDATED STATEMENT OF FINANCIAL POSITION (continued)
(in thousands of euros) notes 9/30/2013 12/31/2012 (*)
LIABILITIES AND SHAREHOLDERS’ EQUITY
Shareholders’ equity
Share capital (19) 55,908 55,863Additional paid-in capital (19) 17,007 15,967Statutory reserve (19) 11,181 11,168Other reserves and retained earnings (19) 294,838 238,996Treasury stock (44,882) (44,882)Net profit for the period attributable to shareholders of the Parent Company 60,767 87,396Shareholders’ equity attributable to shareholders of the Parent Company 394,819 364,508
Other reserves and retained earnings attributable to minority interests 486 206Net profit for the year attributable to minority interests 288 288Shareholders’ equity attributable to minority interests 774 494
Total shareholders’ equity 395,593 365,002
Non-current liabilities
Long-term borrowings (20) 431 4,548Provisions for employee severance indemnities and other employee benefits (21) 26,350 25,802Deferred-tax liabilities (13) 3,394 3,579Other non-current liabilities (22) 3,878 3,417Total non-current liabilities 34,053 37,346
Current liabilities
Trade payables (23) 33,623 37,206Other current liabilities (24) 24,897 24,572Liabilities to the shareholders for the dividend (24) - 45,080Taxes payable (25) 12,632 8,882Current portion of medium and long-term debt (20) 7,927 8,066Total current liabilities 79,079 123,806
Total liabilities 113,132 161,152
TOTAL LIABILITIES AND SHAREHOLDERS’ EQUITY 508,725 526,154
(*)Following the retrospective application of the amendment to IAS 19 from January 1, 2013 the comparative figures at January 1 and December 31, 2012 have been restated as required by IAS 1. More specifically, the figure for employee benefit plans reported in the Consolidated Financial Statements at December 31, 2012 has increased by 4,213 thousand euros and the figure for closing Shareholders’ equity has decreased by 3,079 thousand euros, relating to closing Shareholders’ equity attributable to owners of the Group Parents company. See section “New accounting principles” of the Report on operations for additional information.
36
CONSOLIDATED STATEMENT OF CASH FLOWS
(in thousands of euros)3rd quarter First nine months
2013 2012 2013 2012
Cash flow from operating activities Net profit for the period 20,014 21,416 61,055 66,955Adjustment for: - Income taxes 10,764 12,410 36,437 39,972 - Depreciation and amortization 6,913 7,356 21,203 21,496 - Financial expense/ (income) 937 578 3,806 2,223 - Additions to/ (Utilizations of) provisions for risk 339 387 377 (896) - (Gains)/Losses on sales of non-current assets 2 40 52 103 - Additions to/(Reversals of) provisions for employee severance indemnities 585 217 675 505 - Changes in shareholders’ equity reserves: - Stock option reserve 370 448 1,107 1,312 - Cumulative translation adjustment from operating activities (1,069) (1,331) (1,347) (390) - Change in other non current-assets/liabilities 555 (18) (56) (3,016)
Cash flow from operating activities before changes in working capital 39,410 41,503 123,309 128,264 (Increase)/Decrease in receivables included in working capital 6,399 4,367 (1,504) 5,412(Increase)/Decrease in inventories 400 (743) (2,492) (3,566)Increase/(Decrease) in trade payables (1,843) (3,352) (3,325) (5,064)(Increase)/Decrease in other current items (690) 5,233 (368) 3,757
Cash from operating activities 43,676 47,008 115,620 128,803Income taxes paid (6,476) (16,344) (28,624) (42,109)Interest paid (494) (592) (1,546) (1,704)
Net cash from operating activities 36,706 30,072 85,450 84,990 Investments in intangibles (1,212) (1,207) (3,371) (3,376)Investments in property, plant and equipment (7,879) (6,931) (20,050) (19,350)Retirements of property, plant and equipment 437 (28) 2,366 1,262
Cash used in regular investing activities (8,654) (8,166) (21,055) (21,464)
Acquisitions of subsidiaries and business operations - - 270 (7,600)
Cash used in investing activities (8,654) (8,166) (20,785) (29,064)
(Repayment of)/Proceeds from loan and other financial obligations (2,106) (155) (4,192) (4,703)Increase in share capital and additional paid-in capital/Dividend distribution - - (71,172) (22,755)Equity investments (66) - (561) -Foreign exchange translation effect (1,025) 161 (978) (858)
Cash used in financing activities (3,197) 6 (76,903) (28,316)
Net change in cash and cash equivalents 24,855 21,912 (12,238) 27,610
CASH AND CASH EQUIVALENTS AT BEGINNING OF PERIOD 67,506 69,843 104,599 64,145
CASH AND CASH EQUIVALENTS AT END OF PERIOD 92,361 91,755 92,361 91,755
37
STATEMENT OF CHANGES IN CONSOLIDATED SHAREHOLDERS’ EQUITY
(in thousands of euros) Share capital
Additional
paid-in capital
Statu-tory
reserve
Cumula-tive
transla-tion
reserve
StockOption Reser-
ve
Reser-ve for
treasu-ry
stock
OCI Reserv
e
Retained
earnings
(Accu-mulateddeficit)
Treasurystock
Netprofit
for theperiod
Groupinterest
in share-holders’
equity
Minority interest in
equity
Total interest
in shareholders’equ
ity
Shareholders’ equity at 12/31/2011(*) 55,698 13,744 8,016 8,137 2,337 44,882 (1,673
) 163,570 (44,882) 99,465 349,294 211 349,505
Appropriation of previous year’s profit - - 3,152 - - - - 96,313 - (99,465) - -
Dividends distribution - - - - - - - (24,971) - - (24,971) (24,971)
Capital increase 157 2,059 - - - - - - - - 2,216 2,216Stock options and other changes - - - - 772 - - 540 - - 1,312 1,312
Translation adjustment - - - (2,247) - - - - - - (2,247) - (2,247)Actuarial gains/losses on employee benefits recognized directly in other comprehensive income
- - - - - - (1,054) - - - (1,054) (1,054)
Net investment hedge gains/(losses), net of tax effect
- - - 252 - - - - - - 252 252
Net profit for the period - - - - - - - - - 66,660 66,660 295 66,955Shareholders’ equity at 9/30/2012(*) 55,855 15,803 11,168 6,142 3,109 44,882 (2,727
) 235,452 (44,882) 66,660 391,462 506 391,968
Shareholders’ equity at 12/31/2012 55,863 15,967 11,168 3,463 3,336 44,882 (3,079
) 190,394 (44,882) 87,396 364,508 494 365,002
Appropriation of previous year’s profit - - 13 - - - - 87,383 - (87,396) - -
Dividends distribution - - - - - - - (27,177) - - (27,177) (27,177)
Capital increase 45 1,040 - - - - - - - - 1,085 1,085Stock options and other changes - - - - 839 - - 268 - - 1,107 1,107
Translation adjustment - - - (5,775) - - - - - - (5,775) (8) (5,783)Actuarial gains/losses on employee benefits recognized directly in other comprehensive income
- - - - - - (4) - - - (4) (4)
Net investment hedge gains/(losses), net of tax effect
- - - 308 - - - - - - 308 308
Net profit for the period - - - - - - - - - 60,767 60,767 288 61,055Shareholders’ equity at 9/30/2013 55,908 17,007 11,181 (2,004) 4,175 44,882 (3,083
) 250,868 (44,882) 60,767 394,819 774 395,593
(*)Following the retrospective application of the amendment to IAS 19 from January 1, 2013 the comparative figures at January 1 and December 31, 2012 have been restated as required by IAS 1. More specifically, the figure for closing Shareholders’ equity has decreased by 3,079 thousand euros, relating to closing Shareholders’ equity attributable to owners of the Group Parents company. See section “New accounting principles” of the Report on operations for additional information.
38
NOTES TO THE CONSOLIDATED QUARTERLY REPORT AT SEPTEMBER 30, 2013 AND SEPTEMBER 30, 2012
GENERAL INFORMATION AND SCOPE OF CONSOLIDATION
General information
The Diasorin Group specializes in the development, manufacture and distribution of products in the immunochemistry and infectious immunology product groups. These product classes can also be grouped into a single family called immunodiagnostics. Diasorin S.p.A., the Group’s Parent Company, has its headquarters on Via Crescentino (no building number), in Saluggia (VC).
Principles for the preparation of the interim report on operations
This quarterly report was prepared in compliance with the International Financial Reporting Standards (“IFRSs”), as issued by the International Accounting Standards Board (“IASB”) and adopted by the European Union. The designation IFRSs also includes the International Accounting Standards (“IASs”) that are still in effect and all of the interpretations of the International Financial Reporting Interpretations Committee (“IFRIC”).
This quarterly report was prepared in accordance with the requirements of the relevant international accounting standard (IAS 34 – Interim Financial Reporting). These notes provide information in summary form, in order to avoid duplicating information published previously, as required by IAS 34. Specifically, these notes discuss only those components of the income statement and balance sheet the composition or change in amount of which require comment (due to the amount involved or the type of transaction or because an unusual transaction is involved) in order to understand the Group’s operating performance, financial performance and financial position.
When preparing interim financial reports, management is required to develop estimates and assumptions that affect the amounts shown for revenues, expenses, assets and liabilities in the financial statements and the disclosures provided with regard to contingent assets and liabilities on the date of the interim financial statements. If such estimates and assumptions, which were based on management’s best projections, should differ from actual events, they will be modified appropriately when the relevant events produce the abovementioned differences.
As a rule, certain valuation processes, particularly the more complex processes such as determining whether the value of non-current assets has been impaired, are carried out fully only in connection with the preparation of the annual financial statements, when all the necessary information is available, except when there are impairment indicators that require an immediate evaluation of any impairment losses that may have occurred.
The income tax liability is recognized using the best estimate of the weighted average tax rate projected for the entire year.
In this consolidated quarterly report, all amounts are in thousands of euros unless otherwise stated.
This quarterly report was not audited.New accounting principles
39

On June 16, 2011, the IASB issued an amendment to IAS 1 – Presentation of Financial Statements requiring companies to group items presented in comprehensive income on the basis of whether they are potentially reclassified to profit or loss subsequently. The amendment is applicable for periods beginning on or after July 1, 2012; the Group has applied this amendment since January 1, 2013. The application of this amendment had no effect on the measurement of items and had a limited effect on the disclosures provided in this Report.
On December 16, 2011, the IASB issued certain amendments to IFRS 7 – Financial Instruments: Disclosures. The amendments require information about the effect or potential effect of netting arrangements for financial assets and liabilities on an entity’s financial position. The amendments are applicable for periods beginning on or after January 1, 2013 and subsequent interim reporting periods. Applying these amendments has not had effects on the disclosures presented in this Report.
On May 12, 2011, the IASB issued IFRS 13 – Fair Value Measurement, which clarifies the determination of fair value for the purpose of the financial statements and is applicable to all IFRSs permitting or requiring a fair value measurement or the presentation of disclosures based on fair value. The Group has prospectively applied this standard from January 1, 2013. The application of this standard did not have any effect on the measurement of items in this Report.
On June 16, 2011, the IASB issued an amendment to IAS 19 – Employee Benefits, which eliminates the option of deferring the recognition of actuarial gains or losses by the corridor method, requiring instead the presentation in the statement of financial position of the full amount of any deficit or surplus in the provision, the separate recognition in the income statement of cost components related to employee service and net financial expense, and the recognition of actuarial gains or losses resulting from the annual remeasurement of assets and liabilities as other comprehensive income/ (loss). In addition, the return on assets included in net financial expense must be computed based on the discount rate applied to liabilities and no longer on the assets’ expected rate of return. Lastly, the amendment introduces new additional disclosures to be provided in the notes to the financial statements. In accordance with the transition rules in IAS 19, paragraph 173, the Parent Company applied this amendment retrospectively as of the reporting period beginning on January 1, 2013, by adjusting the values of openness of financial position at January 1, 2012 and at December 31, 2012 and the comprehensive income statement of 2012 as if the amendments to IAS 19 had always been applied. In detail, the Group determined the final effects due to the adoption of the amendment, as follows:
40
At January 1, 2012
(in thousands of euros)
Amounts as
previously reported
IAS 19 revised
adoption effect
Amounts as restated
Effects on the statement of financial position: Deferred-tax assets 20,119 544 20,663Provisions for employee severance indemnities and other employee benefits 20,948 2.217 23,165
Total shareholders’ equity 351,178 (1,673) 349,505Shareholders’ equity attributable to shareholders of the Parent Company 350,967 (1,673) 349,294
Shareholders’ equity attributable to minority interests 211 - 211
At December 31, 2012
(in thousands of euros)
Amounts as
previously reported
IAS 19 revised
adoption effect
Amounts as restated
Effects on the statement of financial position: Deferred-tax assets 20,208 1,134 21,342Provisions for employee severance indemnities and other employee benefits 21,589 4,213 25,802
Total shareholders’ equity 368,081 (3,079) 365,002Shareholders’ equity attributable to shareholders of the Parent Company 367,587 (3,079) 364,508
Shareholders’ equity attributable to minority interests 494 - 494
First nine months
2012
(in thousands of euros)Amounts as
previously reported
IAS 19 revised adoption effect
Amounts as restated
Effects on the comprehensive income statement:Profit/(loss) for the period 66,955 - 66,955Profit/(loss) on employee benefits - (1,054) (1,054)Total comprehensive profit/(loss) that will not be reclassifiedin profit/(loss) of the period
- (1,054) (1,054)
Total comprehensive profit/(loss) that will be reclassifiedin profit/(loss) of the period
(1,995) - (1,995)
TOTAL COMPREHENSIVE PROFIT/(LOSS) 64,960 (1,054) 63,906
41

3rd quarter 2012
(in thousands of euros)Amounts as
previously reported
IAS 19 revised adoption effect
Amounts as restated
Effects on the comprehensive income statement:Profit/(loss) for the period 21,416 - 21,416Profit/(loss) on employee benefits - (351) (351)Total comprehensive profit/(loss) that will not be reclassifiedin profit/(loss) of the period
- (351) (351)
Total comprehensive profit/(loss) that will be reclassifiedin profit/(loss) of the period
(3,450) - (3,450)
TOTAL COMPREHENSIVE PROFIT/(LOSS) 17,966 (351) 17,615
On May 17, 2012, the IASB issued a set of amendments to IFRSs (“Annual Improvements to IFRSs 2009-2011 Cycle”), to be applied retrospectively from January 1, 2013; set out below are those applicable to the Group, excluding those that only regard changes in terminology having a limited accounting effect:
IAS 1 – Presentation of Financial Statements: the amendment clarifies the way in which comparative information should be presented when an entity changes accounting policies and when an entity provides comparative information in addition to the minimum comparative financial statements. This amendment was applied for assets and liabilities in accordance with the application of IAS 19, as the table above show.
IAS 16 – Property, plant and equipment: the amendment clarifies that the spare parts and replacement equipment must be capitalized only if they comply with the definition of property, plant and equipment, or should be classified as inventories. The application of this amendment had no effect on the measurement of items provided in this Report.
IAS 32 – Financial Instruments: Presentation: the amendment eliminates an inconsistency between IAS 12 – income tax and IAS 32 on tax collection arising from distributions to shareholders that should be recognized in the income statement to the extent that the distribution refers to revenue generated from transactions originally entered in the income statement. The application of this amendment had no effect on the measurement of items provided in this Report.
42
Financial statement presentation formats
The financial statements are presented in accordance with the following formats:
- In the income statement, costs are broken down by function. This income statement format, also known as a “cost of sales” income statement, is more representative of the Group’s business than a presentation with expenses broken down by nature because it is consistent with internal reporting and business management methods and with international practice in the diagnostic industry;
- In the statement of financial position, current and non-current assets and current and non-current liabilities are shown separately;
- The statement of cash flows is presented in accordance with the indirect method.
Scope of consolidation
These condensed quarterly consolidated financial statements include the financial statements of Diasorin S.p.A., the Group’s Parent Company, and those of its subsidiaries. Subsidiaries are companies over which the Group is able to exercise control, i.e., it has the power to determine their operating and financial policies, so as to obtain benefits from the results of their operations.
Subsidiaries are consolidated line by line from the date the Group obtains control until the moment when control ceases to exist. Dormant subsidiaries and subsidiaries that generate an insignificant volume of business are not consolidated. Their impact on the Group’s total assets and liabilities, cash flow and bottom-line result is not material.
Starting from July 1, 2013 Diasorin Switzerland has been integrally consolidated and, though it has been established during the first six months of 2013, it started to be effective in the third quarter 2013.
A list of the subsidiaries included in the scope of consolidation, complete with information about head office locations and the percentage interest held by the Group, is provided in Annex I.
Other information
Information about significant events occurring after September 30, 2013, the Group’s business outlook and its transactions with related parties is provided in separate sections of this quarterly report.
43

The table below shows the exchange rates used to translate amounts reported by companies that operate outside the euro zone:
Currency Average rates third quarter Average rates first nine months Rates at 9.30 2013 2012 2013 2012 2013 2012
U.S. dollar 1.32
42 1.2502 1.31
71 1.28
08 1.350
5 1.29
30
Brazilian real 3.03
04 2.5359 2.79
34 2.45
55 3.040
6 2.62
32
British pound 0.85
45 0.7915 0.85
21 0.81
20 0.836
1 0.79
81
Swedish kronor 8.67
98 8.4354 8.58
25 8.73
11 8.657
5 8.44
98
Czech koruna 25.85
27 25.0822 25.75
24 25.14
31 25.730
0 25.14
10
Canadian dollar 1.37
60 1.2447 1.34
86 1.28
39 1.391
2 1.26
84
Mexican peso 17.10
05 16.4690 16.70
64 16.94
37 17.846
2 16.60
86
Israeli shekel 4.74
59 4.9819 4.79
32 4.94
30 4.773
4 5.06
03
Chinese Yuan 8.11
11 7.9410 8.12
25 8.10
58 8.264
5 8.12
61
Australian dollar 1.44
65 1.2035 1.34
80 1.23
81 1.448
6 1.23
96 South African rand
13.2329 10.3385
12.5015
10.3092
13.5985
10.7125
44

OPERATING SEGMENTS
As required by IFRS 8, the Company designated the geographic regions where it operates as its operating segments.
The Group’s organization and internal management structure and its reporting system identify the following segments: Italy and UK Branch, Europe (Germany, France, Belgium and the Netherlands, Spain and Portugal, Ireland, Austria, Switzerland, Great Britain, Scandinavia, Czech Republic), North America (United States and Canada) and Rest of the World (Brazil, Mexico, Israel, China, Australia and South Africa).
The Group is characterized by a structure of its commercial organization based geographic regions, which was developed to address the requirements created by geographic expansion and strategic initiatives. This new organization, which was conceived to reflect the destinations of the Group’s sales, is based on the following four regions: Europe and Africa, North America, Latin America, and Asia Pacific and China.
As a result, the financial data of the Diasorin Group that are being disclosed to the financial markets and the investing public now include revenue information that reflects the regional organization mentioned above.
The schedules that follow show the Group’s operating and financial data broken down by geographic region. Information about revenues based on customer locations is provided in the Notes to the consolidated quarterly report, in the comments to the schedule showing a breakdown of net revenues by geographic region.
No unallocated common costs are shown in the abovementioned schedules because the operations in each country (hence, each segment) are equipped with comprehensive independent organizations (sales, technical support and accounting) fully capable of exercising their functions. Moreover, the Italy segment invoices each quarter to the other segments the costs that are incurred centrally (mainly insurance costs and costs related to the Group’s IT systems and management personnel).
Eliminations refer mainly to inter-segment margins that are eliminated upon consolidation. Specifically, the elimination of the margin earned by the Italy segment on the sale of equipment to other segments is shown both at the result level and with regard to capital expenditures. The margins earned on products sold by manufacturing facilities to sales branches that have not yet been sold to customers are eliminated only at the result level.
Segment assets include all items related to operations (non-current assets, receivables and inventories), but do not include tax related items (deferred-tax assets) and financial assets, which are shown at the Group level. The same approach was used for segment liabilities, which include items related to operations (mainly trade payables and amounts owed to employees), but do not include financial and tax liabilities and shareholders’ equity items, which are shown at the Group level.
45

(in thousands of euros) 2013 2012 2013 2012 2013 2012 2013 2012 2013 2012 2013 2012
INCOME STATEMENT
Revenues from customers 86,169 79,131 89,550 85,987 84,675 99,664 63,527 60,359 - - 323,921 325,141Inter-segment revenues 83,091 81,976 21,821 21,280 20,635 19,866 2,547 4,908 (128,094) (128,030) - - Total revenues 169,260 161,107 111,371 107,267 105,310 119,530 66,074 65,267 (128,094) (128,030) 323,921 325,141Segment result 34,110 26,720 8,755 10,292 54,282 66,266 3,988 7,783 163 (1,911) 101,298 109,150Unallocated common costs - - - - - - - - - - - - EBIT - - - - - - - - - - 101,298 109,150Other income (expense), net - - - - - - - - - - - - Financial income (expense) - - - - - - - - - - (3,806) (2,223)Result before taxes - - - - - - - - - - 97,492 106,927Income taxes - - - - - - - - - - (36,437) (39,972)Net result - - - - - - - - - - 61,055 66,955
OTHER INFORMATION
Investments in intangibles 1,131 621 1,091 1,723 942 827 207 205 - - 3,371 3,376Invest. in prop., plant and equip. 7,822 6,084 6,695 6,563 3,134 5,421 4,786 4,783 (2,387) (3,501) 20,050 19,350Total investments 8,953 6,705 7,786 8,286 4,076 6,248 4,993 4,988 (2,387) (3,501) 23,421 22,726
Amortization of intangibles (2,669) (2,665) (2,002) (1,563) (321) (273) (540) (985) - - (5,532) (5,486)Amortization of prop., plant and equip. (5,482) (6,080) (5,276) (4,869) (3,778) (3,656) (3,297) (3,379) 2,162 1,974 (15,671) (16,010)Total amortization (8,151) (8,745) (7,278) (6,432) (4,099) (3,929) (3,837) (4,364) 2,162 1,974 (21,203) (21,496)
9/30/2013 12/31/2012 9/30/2013 12/31/2012 9/30/2013 12/31/2012 9/30/2013 12/31/2012 9/30/2013 12/31/2012 9/30/2013 12/31/2012
STATEMENT OF FINANCIAL POSITIONSegment assets 228,552 222,558 115,867 110,130 68,137 73,625 56,356 57,877 (73,792) (64,417) 395,120 399,773Unallocated assets - - - - - - - - - - 113,605 126,381Total assets 228,552 222,558 115,867 110,130 68,137 73,625 56,356 57,877 (73,792) (64,417) 508,725 526,154
Segment liabilities 51,846 99,165 75,028 72,102 8,684 10,511 30,472 28,950 (77,282) (74,651) 88,748 136,077Unallocated liabilities - - - - - - - - - - 24,384 25,075Shareholders' equity - - - - - - - - - - 395,593 365,002Total liabilities and shareholders' equity 51,846 99,165 75,028 72,102 8,684 10,511 30,472 28,950 (77,282) (74,651) 508,725 526,154
CONSOLIDATED
ITALY EUROPE NORTH AMERICA REST OF THE WORLD ELIMINATIONS CONSOLIDATED
ITALY EUROPE NORTH AMERICA REST OF THE WORLD ELIMINATIONS
46
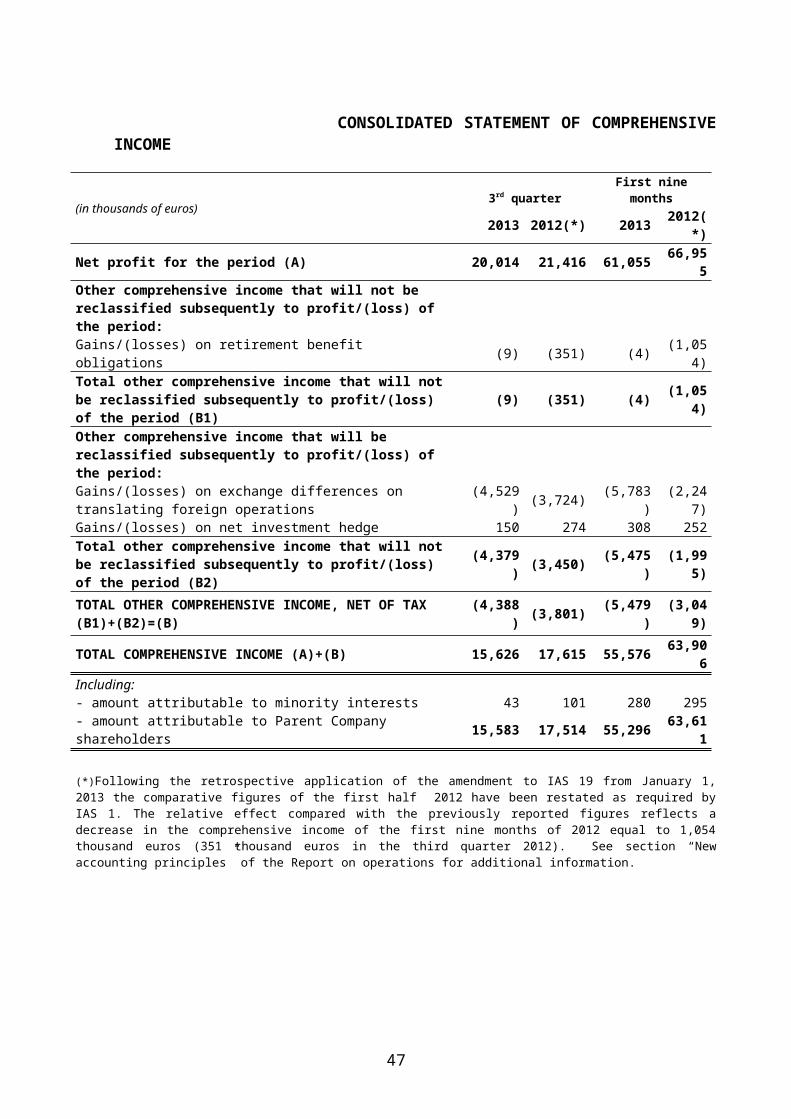
2013 2012 2013 2012 2013 2012 2013 2012 2013 2012INCOME STATEMENTRevenues from customers 155,669 149,562 80,254 96,061 37,168 34,199 50,830 45,319 323,921 325,141
CONSOLIDATED
(in thousands of euros)
EUROPE AND AFRICA NORTH AMERICA CENTRAL AND SOUTH AMERICA
ASIA/PACIFIC
47
DESCRIPTION AND MAIN CHANGES
CONSOLIDATED INCOME STATEMENT
The notes to the consolidated income statement are provided below. More detailed information about the components of the income statement is provided in the Report on Operations.
(1)Net revenues
In the first nine months of 2013, net revenues, which are generated mainly through the sale of diagnostic kits, totaled 323,921 thousand euros, in line with data stated at September 30, 2012.
Net revenues in the third quarter of 2013 totaled 104,202 thousand euros (104,455 thousand euros in the third quarter of 2012) and include 2,174 thousand euros for equipment rentals and technical support (1,870 thousand euros in the same period of 2012).
(2) Cost of sales
In the third quarter of 2013, the cost of sales amounted to 33,519 thousand euros compared with 31,842 thousand euros in the third quarter of 2012. At the end of the first nine months of 2013, the cost of sales totaled 101,347 thousand euros (99,247 thousand euros in the first nine months of 2012). The cost of sales includes 1,698 thousand euros in royalty expense (2,130 thousand euros in the same period last year) and 2,022 thousand euros in costs incurred to distribute products to end customers (1,975 in the same period of 2012). The cost of sales also includes the depreciation of medical equipment held by customers, which amounted to 3,563 thousand euros (3,652 thousand euros in the same period last year).
(3) Sales and marketing expenses
Sales and marketing expenses totaled 20,303 thousand euros in the third quarter of 2013, compared with 20,196 thousand euros in the third quarter of 2012. In the first nine months of 2013, sales and marketing expenses totaled 63,334 thousand euros (60,813 thousand euros in 2012).This item consists mainly of marketing costs incurred to promote and distribute Diasorin products, costs attributable to the direct and indirect sales force and the cost of the technical support offered together with the Group-owned equipment provided to customers under gratuitous loan contracts.
(4) Research and development costs
The research and development costs incurred during the third quarter of 2013, which totaled 5,524 thousand euros (5,585 thousand euros in the same period of 2012), include all of the research and development outlays that were not capitalized equal to 3,294 thousand euros (3,410 thousand euros the third quarter of 2012), the costs incurred to register the products offered for sale and meet quality requirements amounting to 1,788 thousand euros, (1,758 thousand euros in the third quarter of 2012) and the amortization of capitalized development costs equal to 442 thousand euros (417 thousand euros in the third quarter of 2012).
48
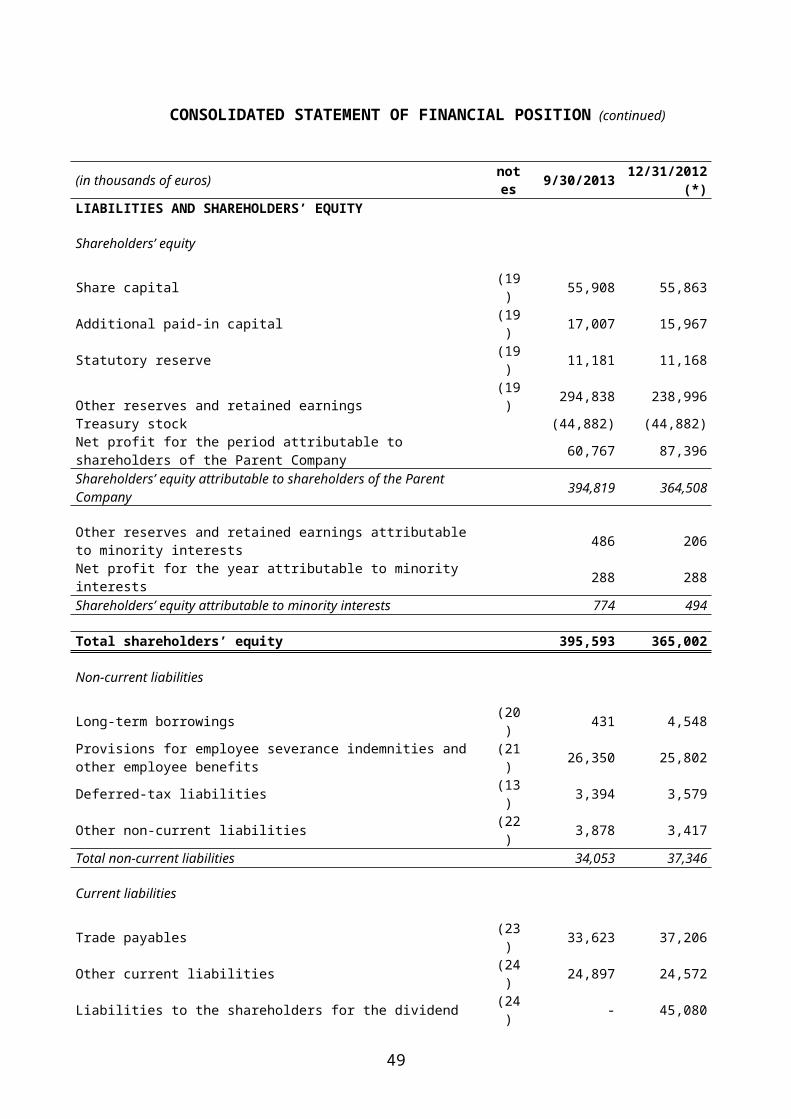
In the first nine months of 2013, the research and development costs amounted to 17,711 thousand euros (17,342 thousand euros in the first nine months of 2012).
In the third quarter of 2013, the Group capitalized development costs amounting to 830 thousand euros (1,073 compared thousand euros in 2012). At September 30, 2013 development costs totaled 2,344 thousand euros (2,723 thousand euros at September 30, 2012)
(5) General and administrative expenses
General and administrative expenses, which include expenses incurred for corporate management activities, Group administration, finance and control, information technology, corporate organization and insurance, totaled 11,405 thousand euros in the third quarter of 2013 (11,203 thousand euros in the third quarter of 2012). In the first nine months of 2013, general and administrative expenses amounted to 35,907 thousand euros (35,512 thousand euros in 2012).
(6) Other operating income (expense)
Net other operating expense totaled 1,736 thousand euros in the third quarter of 2013 (1,225 thousand euros in the third quarter of 2012) and 4,324 thousand euros in the first nine months of 2013 (3,077 thousand euros in the first nine months of 2012), respectively. This item reflects other income from operations that does not derive from the Group’s regular sales activities (such as gains on asset sales, government grants and insurance settlements), net of other operating charges that cannot be allocated to specific functional areas (losses on asset sales, out-of-period charges, indirect taxes and fees, and additions to provisions for risks).
Specific charges include 798 thousand euros in trade related foreign exchange translation losses in the third quarter of 2013 (1,399 thousand euros in the first nine months of 2013) compared with 189 thousand euros in third quarter of 2012 (990 thousand euros in the first nine months of 2012). In the third quarter of 2013, this item includes 243 thousand euros for the Medical Device Tax introduced in the United States in 2013 (729 thousand euros in the first nine months of 2013).
(7) Net financial income (expense)
The table below provides a breakdown of financial income and expense:
(in thousands of euros) 3rd quarter 2013
3rd quarter 2012
First nine months
2013
First nine months
2012Interest and other financial expense (693) (878) (2,195) (2,414)Valuation of financial instruments as per IAS 39 255 471 (113) 98Cumulative share of OCI of entities consolidated under the equity method (JV Diasorin Trivitron Healthcare Private Limited)
(84) - (243) -
Interest on pension funds (147) (234) (565) (651)Interest and other financial income 148 155 631 622Net translation adjustment (416) (92) (1,321) 122Net financial income (expense) (937) (578) (3,806) (2,223)
49
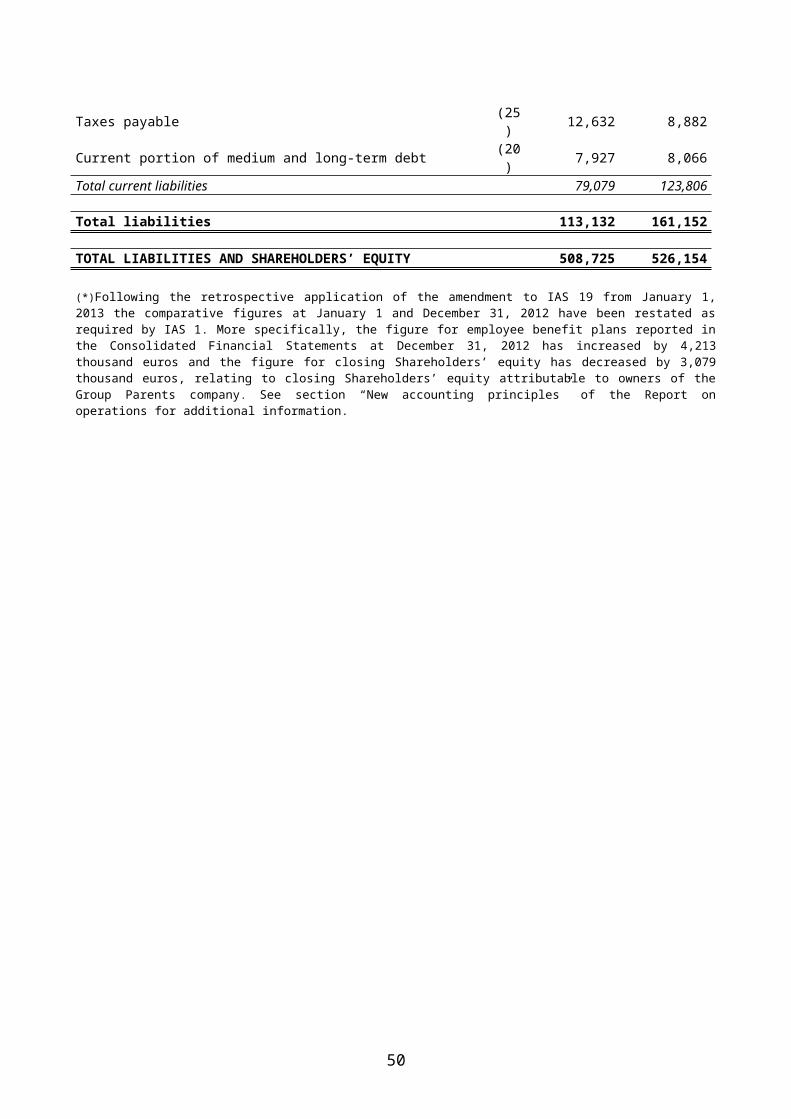
In the third quarter of 2013, net financial expense totaled 937 thousand euros, as against net financial expense of 578 thousand euros in the same period last year. At September 30, 2013 net financial expense totaled 3,806 thousand euros (2,223 thousand euros at September 30, 2012).
The negative change between 2013 and 2012 quarters is mainly attributable to the translation adjustment, negative by 416 thousand euros (negative by 92 thousand euros in the third quarter of 2012), related mainly to the Euro exchange rate in the dividends distributed to subsidiaries for 163 thousand euros, together with the financial balances of subsidiaries that use currencies different from the Group’s Parent Company currency (131 thousand euros) and the intercompany financing disbursed by the Group’s Parent company to the Australian subsidiary in the local currency (98 thousand euros).In the first nine months of 2013, the translation adjustment, negative by 1,321 thousand euros (positive by 122 thousand euros in the first nine months of 2012), related mainly to Euro exchange rate in the intercompany financing disbursed by the Group’s Parent company to the Australian subsidiary in the local currency (636 thousand euros) and to translation effect on the GE Capital borrowing in USD reimbursed in the period (302 thousand euro).
In the third quarter of 2013, the fair value of the Group’s financial instruments was positive by 255 thousand euros (positive fair value of 471 thousand euros in the third quarter of 2012). This item was recognized for valuation purposes. In the first nine months of 2013, the fair value was negative by 113 thousand euros, compared with a positive fair value of 98 thousand euros in the third quarter of 2012.
Interests and other financial expense for the period included 463 thousand euros in factoring transaction fees (1,561 thousand euros in the first nine months of 2013) compared with 666 thousand euros in the third quarter of 2012 (1,799 thousand euros in the first nine months of 2012).
(8) Income taxes
The income tax expense recognized in the income statement for the third quarter of 2013 amounted to 10,764 thousand euros (12,410 thousand euros in the same period in 2012).
In the third quarter of 2013 the tax burden was equal to 35% of the profit before taxes (36.7% in the third quarter of 2012).
At September 30, 2013 the income tax expense amounted to 36,437 thousand euros (39,972 thousand euros at September 30, 2012) with a 37.4% tax rate, substantially in line with 2012.
(9) Earnings per share
Basic earnings per share, which amounted to 1.12 euros in the first nine months of 2013, compared with 1.23 euros in the same period in 2012, were computed by dividing the net result attributable to shareholders by the weighted average number of shares outstanding for the period (54,349 million at September 30, 2013).
Diluted earnings per share also amounted to 1.12 euros in the first nine months of 2013, compared with 1.23 euros in the same period in 2012: the average number of “potentially dilutive” shares resulting from
50

the hypothetical exercise of stock options, based on plan regulations, that were taken into account to determine dilute earning did not have a material diluting effect.
Basic earnings per share and diluted earnings per share amounted to 0.37 euros in the third quarter of 2013 and 0.39 euros in the third quarter of 2012, respectively.
51
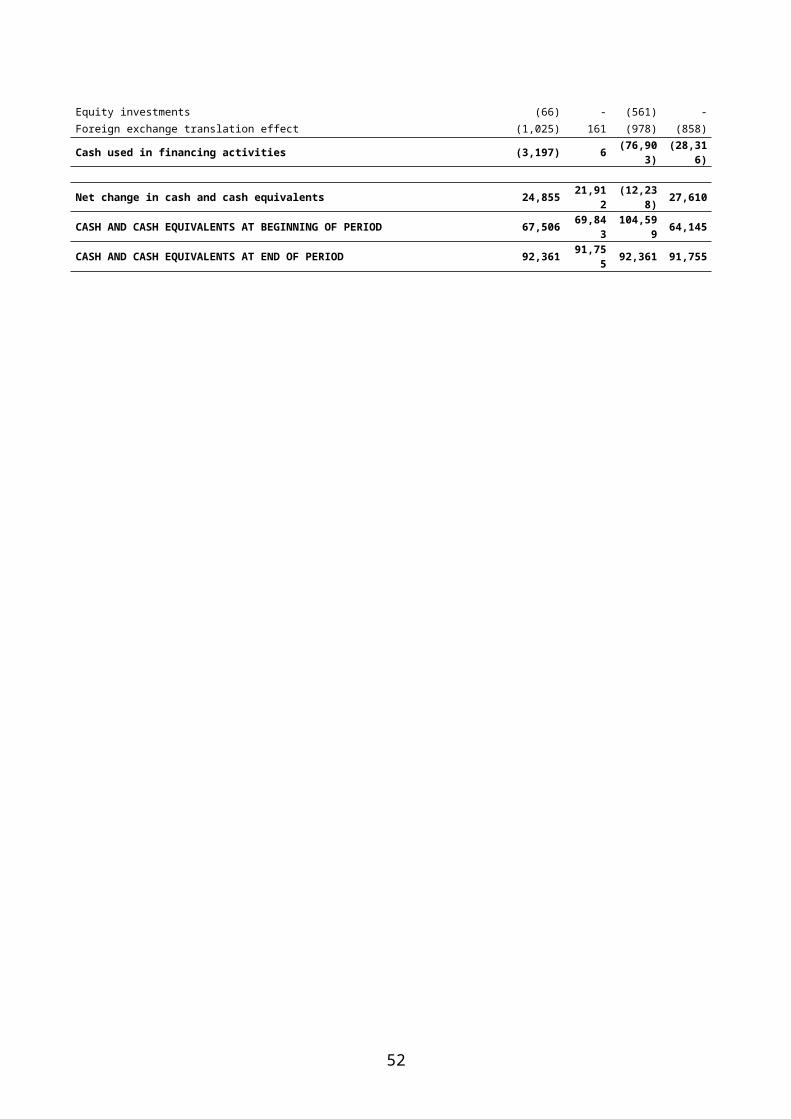
CONSOLIDATED STATEMENT OF FINANCIAL POSITION
(10) Property, plant and equipment
The table below shows the changes that occurred in this account as of September 30, 2013:
(in thousands of euros)
At Decembe
r 31, 2012Addition
sDepreciatio
n Retirements
Translation
adjustment
Reclassifications and other
changes
At September 30, 2013
Land 2,323 - - - (5) - 2,318Buildings 5,588 44 594 - (49) 87 5,076Plant and machinery 5,977 1,422 845 2 (150) 656 7,058Manufacturing and distribution equipment 40,002 15,857 13,238 2,048 (1,098) 205 39,680Other assets 6,466 1,042 994 31 (146) - 6,337Construction in progress and advances 4,960 1,685 - 337 (64) (1,531) 4,713Total property, plant and equipment 65,316 20,050 15,671 2,418 (1,512) (583) 65,182
Additions to manufacturing and distribution equipment include purchases of medical equipment amounting to 14,428 thousand euros, down from 14,901 thousand euros at September 30, 2012. In the first nine months of 2013, depreciation for the period totaled 10,954 thousand euros, compared with 10,450 in the same period in 2012.
(11) Goodwill and other intangibles
A breakdown of intangible assets at September 30, 2013 is as follows:
(in thousands of euros)At
December 31, 2012
Additions DepreciationTranslatio
n adjustment
Retirements and other
changes
At September
30, 2013Goodwill 67,689 - - (1,216) (270) 66,203Development costs 13,832 2,344 1,371 (70) - 14,735Concessions, licenses and trademarks 30,432 729 2,103 (594) 253 28,717Industrial patents and intellectual property rights 13,100 237 2,003 (36) 331 11,629Advances and other intangibles 223 61 55 (1) (1) 227Total intangible assets 125,276 3,371 5,532 (1,917) 313 121,511
Goodwill amounted to 66,203 thousand euros at September 30, 2013. The decrease compared with December 31, 2012 also reflects the translation effect on the goodwill allocated to the Diasorin Brazil, Diasorin U.S.A. and Diasorin South Africa CGUs, for a negative amount equal to 1,216 thousand euros.At June 30, 2013, the process of valuing the assets of Nordiag has been completed, with a reduction of 270 thousand euros in the purchase price accounted to reduce goodwill.
Please note that intangible assets with an indefinite useful life were not tested for impairment at September 30, 2013, since there were no indications of impairment. A full impairment test will be carried out in connection with the preparations of the annual financial statements.
52

(12) Equity investments
Equity investments, which totaled 491 thousand euros include 464 thousand euros for the investment held by the U.S subsidiary in the JV Diasorin Trivitron Healthcare Private Limited, 26 thousand euros for the investment held by the German subsidiary in the U-Kasse pension fund and 1 thousand euros for the interest held in the Sobedia affiliated company.
The change occurred in the third quarter of 2013, equal to 314 thousand euros, is due to the capital transfer in favor of Diasorin Trivitron Healthcare Private Limited subsidiary (557 thousand euros) and the evaluation of investments in associates, negative for 243 thousand euros, on the basis of the equity method.
(13) Deferred-tax assets and deferred-tax liabilities
Deferred-tax assets amounted to 20,603 thousand euros. They relate to consolidated companies that have deferred-tax assets in excess of deferred-tax liabilities and to consolidation adjustments. Deferred-tax liabilities, which totaled 3,394 thousand euros, relate to consolidated companies that have deferred-tax liabilities in excess of deferred-tax assets. They are shown on the liabilities side of the statement of financial position.
The balance reflects the net deferred-tax assets computed on the consolidation s (mainly from the elimination of unrealized gains on intra-Group transactions) and on temporary differences between the asset and liability amounts used to prepare the consolidated financial statements and the corresponding amounts used by the consolidated companies for tax purposes.
Deferred-tax assets were recognized in the financial statements when their future utilization was deemed probable. The same approach was used to recognize the benefit provided by the use of tax loss carry forwards, most of which, under current laws, can be brought forward indefinitely.
Based on the multi-year plans prepared by management, the Group is expected to generate sufficient taxable income in future years to allow for the full recovery of the abovementioned amounts.
An analysis of deferred-tax assets, net of offsettable deferred-tax liabilities, is provided below:
(in thousands of euros) 9/30/2013 12/31/2012Deferred-tax assets 20,603 21,342Deferred-tax liabilities (3,394) (3,579)Total net deferred-tax assets 17,209 17,763
The Group offsets deferred-tax assets and liabilities when they refer to the same company. Depending on whether they are positive or negative, the resulting balances are recognized as deferred-tax assets or deferred-tax liabilities, respectively.
53
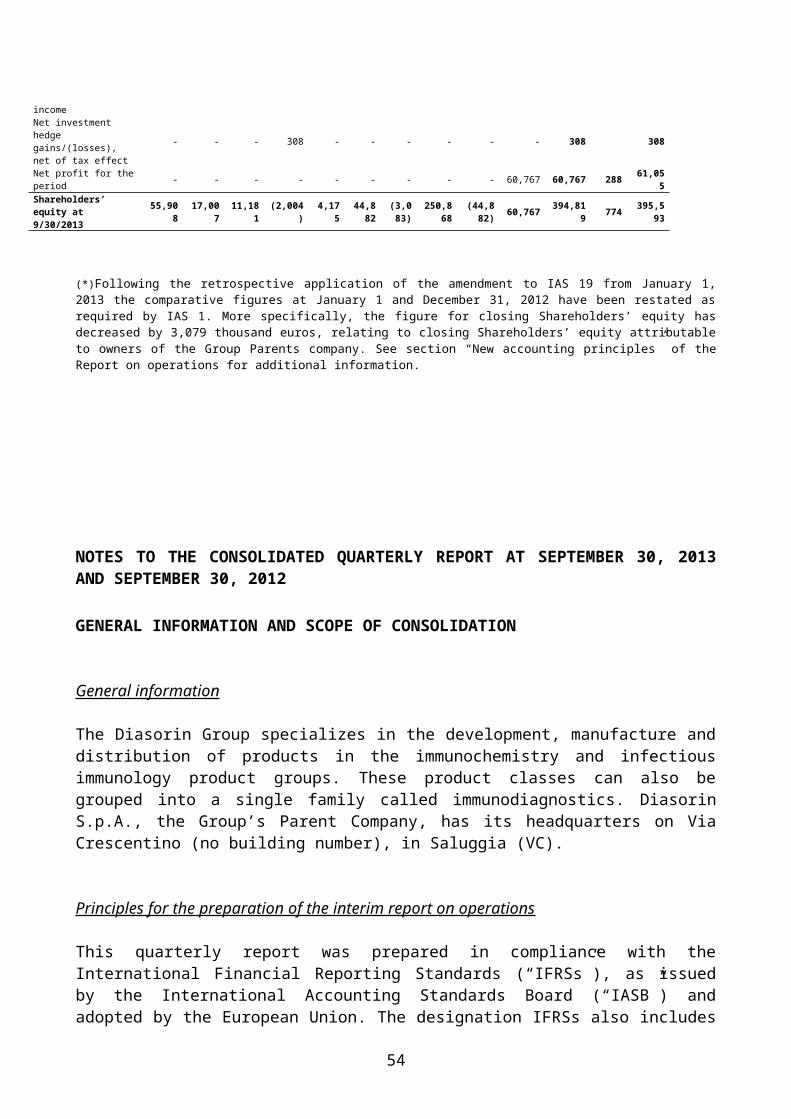
(14) Other non-current assets
The amount of 1,776 thousand euros, at September 30, 2013, refers mainly to receivables due over 12 months held by the Brazilian subsidiary.
(15) Inventories
A breakdown of inventories, which totaled 85,015 thousand euros at September 30, 2013, is provided below:
(in thousands of euros) 9/30/2013 12/31/2012
Gross amount
Provisions for write-downs
Net amount
Gross amount
Provisions for write-
downs
Net amount
Raw materials and supplies 25,208 (1,965) 23,243 24,970 (2,006) 22,964Semi-finished goods 36,722 (2,412) 34,310 35,418 (2,770) 32,648Finished goods 29,171 (1,709) 27,462 29,950 (1,590) 28,360Total 91,101 (6,086) 85,015 90,338 (6,366) 83,972
The table below shows the changes that occurred in the provisions for inventory write-downs:
(in thousands of euros) 9/30/2013 12/31/2012Opening balance 6,366 6,521Additions for the period 600 755Utilizations/ reversals for the period (734) (826)Currency translation differences and other changes (146) (84)Closing balance 6,086 6,366
The increase of 1,043 thousand euros in ending inventory, compared with December 31, 2012, is due to higher inventories of strategic materials at the Group’s production facilities. These products are scheduled for launch in the coming months.
(16) Trade receivables
Trade receivables totaled 113,559 thousand euros at September 30, 2013. The table that follows shows the changes that occurred in the allowance for doubtful accounts, which amounted to 7,989 thousand euros at September 30, 2013:
(in thousands of euros) 9/30/2013 12/31/2012Opening balance 8,330 8,338Additions for the period 558 992Utilizations/ reversals for the period (623) (725)Currency translation differences and other changes (276) (275)Closing balance 7,989 8,330
In order to bridge the gap between contractual payment terms and actual collection dates, the Group assigns its receivables to factors without recourse. The receivables assigned by the Group’s Parent Company in the first nine months of 2013 totaled 33,807 thousand euros.
(17) Other current assets
54
Other current assets of 8,077 thousand euros (10,540 thousand euros at December 31, 2012) consist mainly of accrued income and prepaid expenses for insurance, interest, rentals and government grants, tax credits for foreign taxes withheld and advances paid to suppliers.
(18) Cash and cash equivalents
The components of cash and cash equivalents, which totaled 92,361 thousand euros (104,599 thousand euros at December 31, 2012), include regular bank and postal accounts and short-term bank deposits.
(19) Shareholders’ equity
Share capital
At September 30, 2013, the fully paid-in share capital consisted of 55,908 million common shares, par value of 1 euro each. In the first nine months of 2013, it increased by 45 thousand euros, due to a capital increase carried out in connection with the 2007-2012 Stock Option Plan.
Additional paid-in capital
This account, which had a balance of 17,007 thousand euros, increased by 1,040 thousand euros, compared with December 31, 2012, due to a capital increase carried out in connection with the 2007-2012 Stock Option Plan.
Statutory reserve
This reserve amounted to 11,181 thousand euros at September 30, 2013. The appropriation of the 2012 net profit accounts for the change compared with December 31, 2012.
Other reserves
A breakdown of other reserves is as follows:
(in thousands of euros) 9/30/2013 12/31/2012 ChangeCurrency translation reserve (1,999) 3,476 (5,475)Reserve for treasury stock 44,882 44,882 -Stock option reserve 4,175 3,336 839OCI Reserve (3,083) (3,079) (4)Retained earnings 253,418 192,656 60,762IFRS transition reserve (2,973) (2,973) -Consolidation reserve 904 904 -Total other reserves and retained earnings 295,324 239,202 56,122Including minority interest 486 206 280
Currency translation reserve
55

The decrease of 5,475 thousand euros shown in the currency translation reserve at September 30, 2013 is due to the fluctuation of the exchange rate of the US dollar, Brazilian real and the South African rand. It also reflects the foreign exchange differences resulting from the translation at year-end exchange rates of the shareholders’ equities of consolidated companies with financial statements denominated in foreign currencies, for a negative value equal to 5,783 thousand euros. This amount includes 1,216 thousand euros for adjustments to the goodwill allocated to CGUs that operate with currencies different from the euro.
This reserve also includes a gain of 308 thousand euros, net of tax effect equal to 117 thousand euros, for translation differences on indebtedness denominated in foreign currencies held by the Group’s Parent Company to hedge its investment in the shareholders’ equity of the Diasorin USA subsidiary.
Reserve for treasury shares
With regard to treasury shares, the Company complied with all statutory requirements, purchasing treasury shares for amount covered by the distributable earnings and available reserves shown in its latest duly approved financial statements. Purchases were authorized by the Shareholders’ Meeting and under no circumstance did the par value of the purchased shares exceed one-fifth of the share capital. On January 17, 2011, the Company began to implement a program to buy treasury shares reserved for implementation of its new stock option plan, in accordance with the provisions and timing authorized by the Shareholders’ Meeting on April 27, 2010. The program ended on February 15, 2011, with the purchase of 750,000 common shares, equal to 1.35% of the share capital, at an average price of 33.48 euros per share. A second program to buy treasury shares got under way on October 17, 2011, in accordance with the provisions and timing authorized by the Shareholders’ Meeting of October 4, 2011. Following these purchases, Diasorin S.p.A. holds a total of 1,550,000 treasury shares, equal to 2.77% of the share capital. The average purchase price of the 800,000 treasury shares purchased in the last quarter of the year was 24.71 euros per share.
At September 30, 2013 the reserve for treasury shares amounted to 44,882 thousand euros. This reserve was established pursuant to law (Article 2357 ter of the Italian Civil Code) due to purchases of treasury shares made in 2011.
Stock option reserve
The balance in the stock option reserve refers to the 2007-2012 Stock Option Plan and the 2010 Stock Option Plan. In the first nine months of 2013, this reserve increased due to the recognition of stock option costs amounting to 1,107 thousand euros. The exercise of some tranches of the 2007-2012 Plan in the first nine months of 2013 caused a reduction of 268 thousand euros in the stock option reserve.
OCI reserve
OCI reserve is negative for 3,083 thousand euros and includes actuarial gains or losses resulting from the computation of the Group’s defined-benefit pension plans, net of the applicable tax effect equal to 1,131 thousand euros
Retained earnings
56

The increase of 60,762 thousand euros in retained earnings, compared with December 31, 2012, is due mainly to the:
appropriation of the consolidated net profit earned in 2012 (87,671 thousand euros);
dividend distribution to the shareholders (27,177 thousand euros) approved on April 22, 2013 during the ordinary shareholders meeting (EUR 0.50 per share);
The exercise of some tranches of the 2007-2012 Plan resulted in a positive change of 268 thousand euros in the stock option reserve.
IFRS transition reserve
The IFRS transition reserve was established on January 1, 2005, upon first-time adoption of the IFRSs as an offset to the adjustments recognized to make the financial statements prepared in accordance with Italian accounting principles consistent with IFRS requirements, net of the applicable tax effect (as required by and in accordance with IFRS 1). This reserve has not changed since it was first established.
Consolidation reserve
The consolidation reserve, amounting to 904 thousand euros, reflects the negative difference generated by the elimination of the carrying amounts of equity investments against the corresponding shareholders’ equities.
(20) Borrowings
Borrowings include 431 thousand euros in long-term debt and 7,927 thousand euros for the current portion due within one year.
The table below lists the borrowings at September 30, 2013 (amounts in thousands of euros):
Lender Currency Current portion Non-current portion
Amount due after 5
yearsTotal
GE Capital USD $ 8,554 - - 8,554Amt. in EUR 6,334 - - 6,334
GE Capital Euro € 1,379 - - 1,379IMI MIUR € 196 397 - 593Finance leases € 18 34 - 52TOTAL 7,927 431 - 8,358
The table below lists the changes that occurred in the facilities outstanding as of the date of this quarterly report compared with December 31, 2012 (amounts in thousands of euros):
57

Balance at 12/31/2012
Borrowings
Repayments
Currency translation differences
Amortized cost effect
Balance at 9/30/2013
GE Capital USD 9,707 - (3,287) (122) 36 6,334GE Capital EUR 2,069 - (690) - - 1,379IMI MIUR 783 - (213) - 23 593Finance leases 55 - (2) (1) - 52Total borrowings owed to financial institutions 12,614 - (4,192) (123) 59 8,358
The following amount was repaid in the first nine months of 2013: 4,300 thousand US dollars to GE Capital (equal to 3,287 thousand euros), 690 thousand euros to GE Capital (amount in euros), 213 thousand euros to IMI-Ministry of Education.
There were no changes in contract terms compared with December 31, 2012 and Diasorin was in compliance with all of the operating and financial covenants of the existing loan agreements.
Net financial position
The table below shows a breakdown of the net financial position of the Diasorin Group at September 30, 2013 and provides a comparison with the data at December 31, 2012:
(in thousands of euros) 9/30/2013 12/31/2012
Cash and cash equivalents 92,361 104,599Liquid assets (a) 92,361 104,599
Other current financial assets (b) 150 263
Current bank debt (7,909) (8,047) Other current financial liabilities (18) (19)Current indebtedness (c) (7,927) (8,066)
Net current financial assets (d)=(a)+(b)+(c) 84,584 96,796
Non-current bank debt (397) (4,512)
Other non-current financial liabilities (34) (36)Non-current indebtedness (e) (431) (4,548)
Liabilities to the shareholders for the dividend (f) - (45,080)
Net financial position (g)=(d)+(e)+(f) 84,153 47,168
The entire amount of the net financial position reflects transactions with parties outside the Group.
A breakdown of the changes in the Group’s liquid assets is provided in the statement of cash flows.
(21) Provision for employee severance indemnities and other employee benefits
58
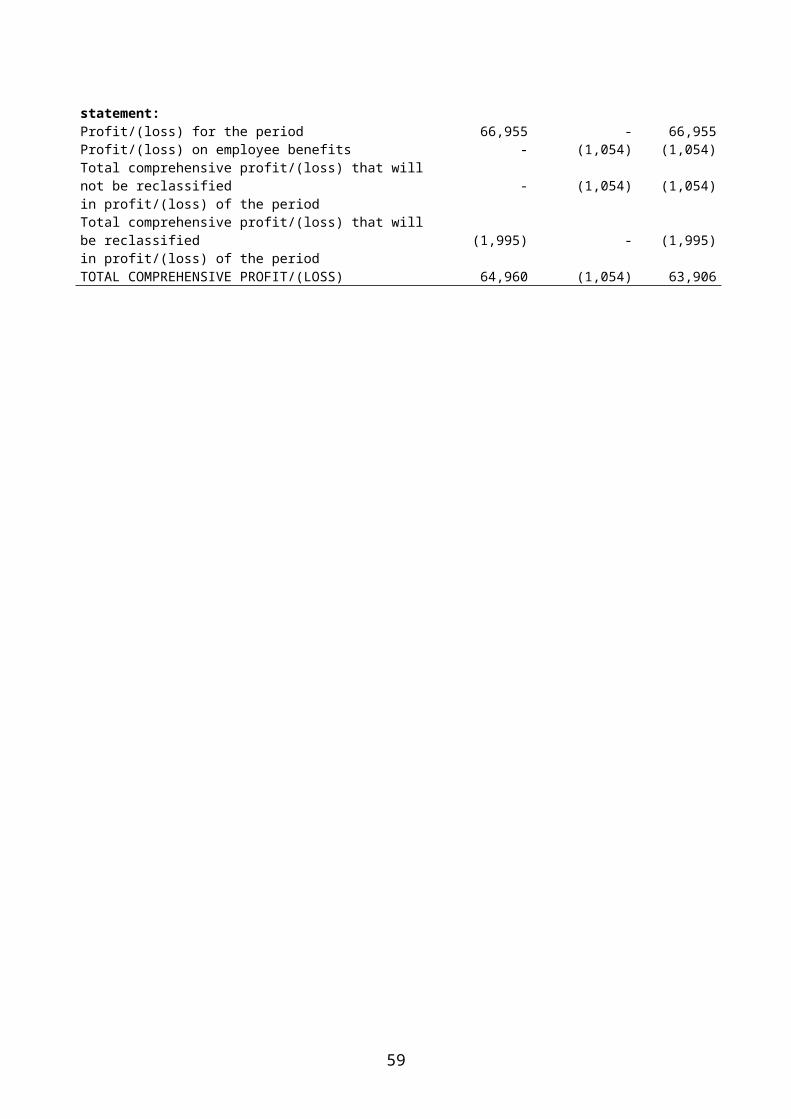
The balance in this account reflects all of the Group’s pension plans obligations, other post-employment benefits and benefits payable to employees when certain requirements are met. Group companies provide post-employment benefits to their employees by contributing to external funds and by funding defined-contribution and/or defined-benefit plans.
The manner in which these benefits are provided varies depending on the applicable statutory, tax-related and economic conditions in the countries where Group companies operate. As a rule, benefits are based on each employee’s level of compensation and years of service. The Group’s obligations refer to the employees currently on its payroll.
Defined-contribution plans
Certain Group companies pay contributions to private funds or insurance companies pursuant to a statutory or contractual obligation or on a voluntary basis. With the payment of these contributions, the companies in question absolve all of their obligations. The liability for contributions payable is included under other current liabilities. The cost attributable to each year, which accrues based on the services provided by employees, is recognized as a labor cost of the relevant organizational unit.
Defined-benefit plans
The Group’s pension plans that qualify as defined-benefit plans include the provisions for employee severance indemnities in Italy, the Alecta system in Sweden and the U-Kasse pension plan and Direct Covenant system in Germany.
The liability owed under these plans is recognized at its actuarial value using the projected unit credit method. Any resulting actuarial gains or losses are recognized in accordance with the Corridor Method.
Other employee benefits
The Group also provides its employees with additional long-term benefits, which are paid when employees reach a predetermined length of service. In these cases, the value of the liability recognized in the financial statements reflects the probability that these benefits will be paid and the length of time for which they will be paid. The liability owed under this plan is recognized at its actuarial value using the projected unit credit method. In this case, the Corridor Method is not applied to any resulting actuarial gains or losses.
The table that follows summarizes the Group’s main employee benefit plans that are currently in effect:
(in thousands of euros) 9/30/2013 12/31/2012 Change
59
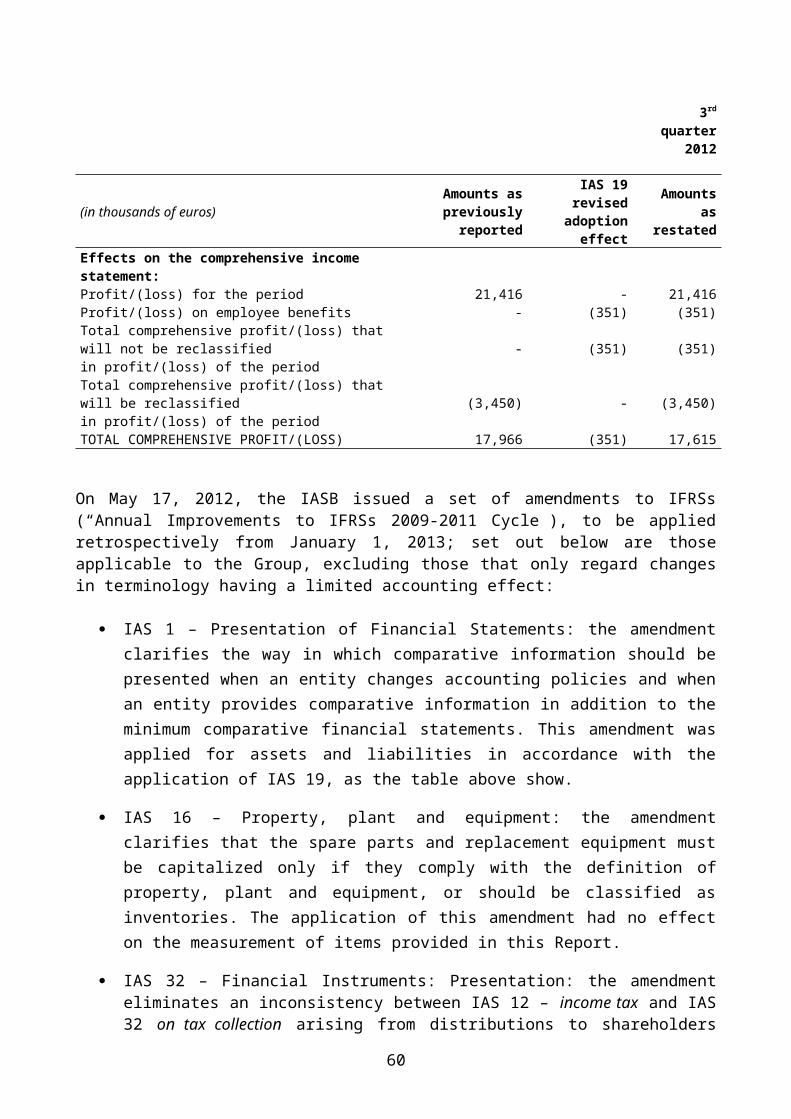
Employee benefitsprovided in:
- Italy 6,588
6,352
236
- Germany 15,828
15,613
215
- Sweden 3,415
3,380
35
- Other 519
457
62
26,350 25,802 548 Broken down as follows- Defined-benefits plans
Provision for employee severance indemnities 5,318 5,167 151 Other defined-benefit plans 19,243 18,993 250
24,561
24,160
401
- Other long-term benefits 1,789
1,642
147
Total employee benefits 26,350 25,802 548
The table below shows the main changes that occurred in the Group’s employee benefit plans in the first nine months of 2013 (amounts in thousands of euros):
(in thousands of euros) Defined-benefit plans Other benefits Total employee
benefitsBalance at December 31, 2012 24,160 1,642 25,802
Financial expense/(income) 559 6
565
Actuarial losses/(gains) - 80 80
Actuarial losses/(gains) recognized directly in equity 2
- 2
Service costs for employee benefits 463 132 595
Contribution/benefits paid (581)
(70)
(651)
Currency translation differences and other charges (42)
(1)
(43)
Balance at September 30, 2013 24,561 1,789 26,350
60

(22) Other non-current liabilities
Other non-current liabilities, which totaled 3,878 thousand euros at September 30, 2013, consist mainly of provisions for risks and charges. The table that follows shows the changes that occurred in these provisions:
(in thousands of euros) 9/30/2013 12/31/2012Opening balance 3,417 4,165Addition for the period 576 190Utilizations for the period - (27)Reversals for the period - (793)Currency translation differences and other charges (115) (118)Ending balance 3,878 3,417
(23) Trade payables
Trade payables, which totaled 33,623 thousand euros at September 30, 2013 represent amounts owed to suppliers for purchases of goods and services. All amounts are due within the year.
(24) Other current liabilities
Other current liabilities of 24,897 thousand euros consist mainly of amounts owed to employees for statutory bonuses (17,435 thousand euros), contributions payable to social security and health benefit institutions (1,372 thousand euros).
(25) Taxes payable
The balance of 12,632 thousand euros represents the income tax liability for the profit earned in the first nine months of 2013, less estimated payments made, and amounts owed for other indirect taxes and fees.
(26) Commitments and contingent liabilities
Significant commitments and contractual obligations
Significant contractual obligations include the agreements executed by Diasorin S.p.A., the Group’s Parent Company, and Stratec in connection with the development and production of the new chemiluminescent diagnostic system (LIAISON XL). The supply contract signed by Diasorin and Stratec calls for the latter to manufacture and supply exclusively to Diasorin the LIAISON XL analyzer. The Group has agreed to purchase a minimum number of systems. However, the projected commitment is deemed to be significantly lower than the normal level of capital investment that would be required for current or future equipment production. As a result, net invested capital is not expected to undergo significant structural changes in the future as a result of this commitment.
61
Contingent liabilities
The Diasorin Group operates globally. As a result, it is exposed to the risks that arise from the complex laws and regulations that apply to its commercial and manufacturing activities. The Group believes that, overall, the amounts set aside for pending legal disputes in the corresponding provision for risks are adequate.
(27) Entries resulting from atypical and/or unusual transactions
As required by Consob Communication No. DEM/6064296 of July 28, 2006, the Company declares that, in the first half of 2013, the Group did not execute atypical and/or unusual transactions, as defined in the abovementioned Communication, according to which atypical and/or unusual transactions are transactions that, because of their significance/material amount, type of counterpart, subject of the transaction, method of determining the transfer price and timing of the event (proximity to the end of a reporting period), could create doubts with regard to: the fairness/completeness of the financial statement disclosures, the existence of a conflict of interest, the safety of the corporate assets and the protection of minority shareholders.
62
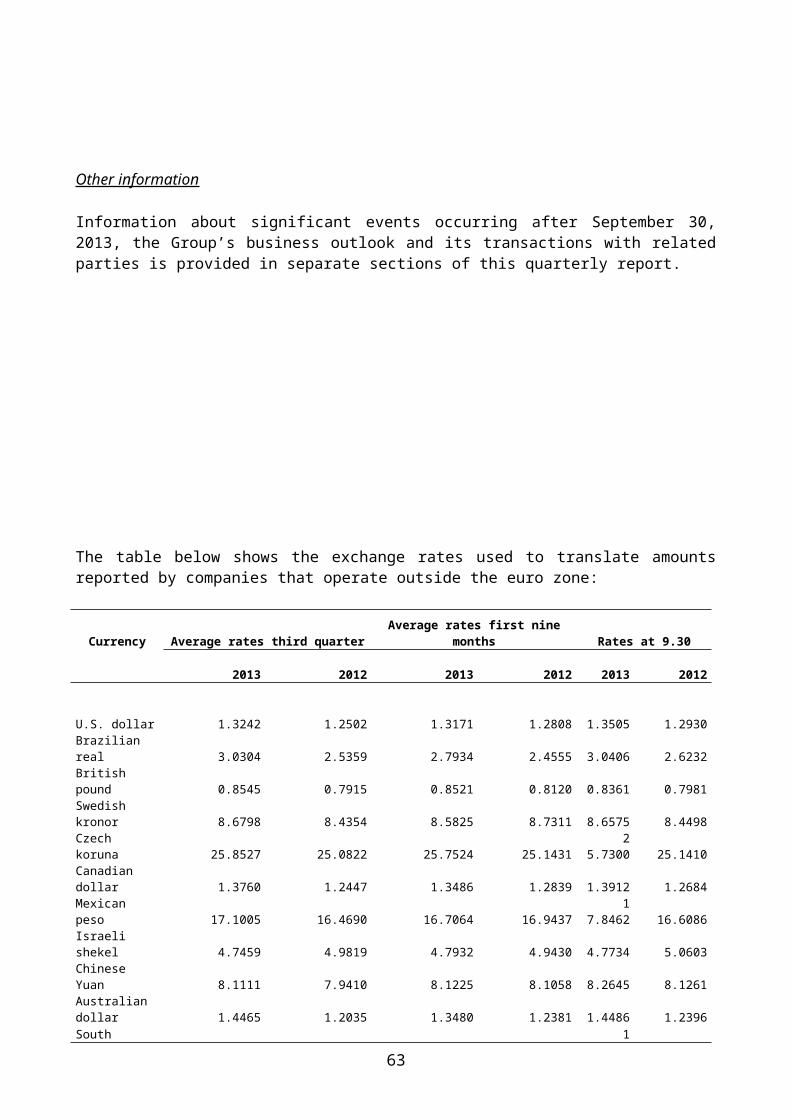
ANNEX I: LIST OF EQUITY INVESTMENTS
CompanyHead office location
Currency
Share capital (*)
Par value per share or
partnership interest
% interest held directly
Companies consolidated line by line
Diasorin S.A/N.V. Bruxelles (Belgium) EUR 1,674,000 6,69
6 99.99%
Diasorin Ltda San Paolo (Brazil) BRL 18,056,977
1 99.99%
Diasorin S.A. Antony (France) EUR 960,000 1
5 99.99%
Diasorin Iberia S.A. Madrid (Spain) EUR 1,453,687 6
99.99%
Diasorin Ltd Oldbury (Great Britain) GBP 500
1 100.00%
Diasorin Inc. Stillwater (USA) USD 1 0.0
1 100.00%
Diasorin Canada Inc Mississauga (Canada) CAD 200,000 N/A -
Diasorin Mexico S.A de C.V. Mexico City (Mexico) MXP 63,768,473
1 99.99%
Diasorin Deutschland GmbH Dietzenbach (Germany) EUR 275,000 275,00
0 100.00%
Diasorin AB Sundbyberg (Sweden) SEK 5,000,000 10
0 100.00%
Diasorin Ltd Rosh Haayin (Israel) ILS 100
1 100.00%
Diasorin Austria GmbH Vienna (Austria) EUR 35,000 35,00
0 100.00%
Diasorin Czech s.r.o. Prague (Czech Republic) CZK 200,000 200,00
0 100.00%
Diasorin Diagnostics Ireland Limited Dublin (Ireland) EUR 3,923 0.0
1 100.00%
Diasorin Ireland Limited Dublin (Ireland) EUR 163,202 1.
2 -
Biotrin Intellectual Properties Limited Dublin (Ireland) EUR 144 0.
6 -
Diasorin I.N.UK Limited Dublin (Ireland) EUR 7,826,072 0.0
1 -
Diasorin South Africa (PTY) Ltd Johannesburg (South Africa) ZAR 101
1 100.00%
Diasorin Australia (Pty) Ltd Sydney (Australia) AUD 100
1 100.00%
Diasorin Ltd Shanghai (China) RMB 1,211,417
1 80.00%
Diasorin Switzerland AG Zurich (Switzerland) CHF 100,000 10
0 100.00%
Investments accounted for using the equity method
Diasorin Trivitron Healthcare Private Limited Chennai (India) INR 77,809,000 10 -
Equity investments valued at cost
Diasorin Deutschland Unterstuetzungskasse GmbH Dietzenbach (Germany) EUR 25,565
1 -
Consorzio Sobedia Saluggia (Italy) EUR 5,000 N/A 20.00%
63
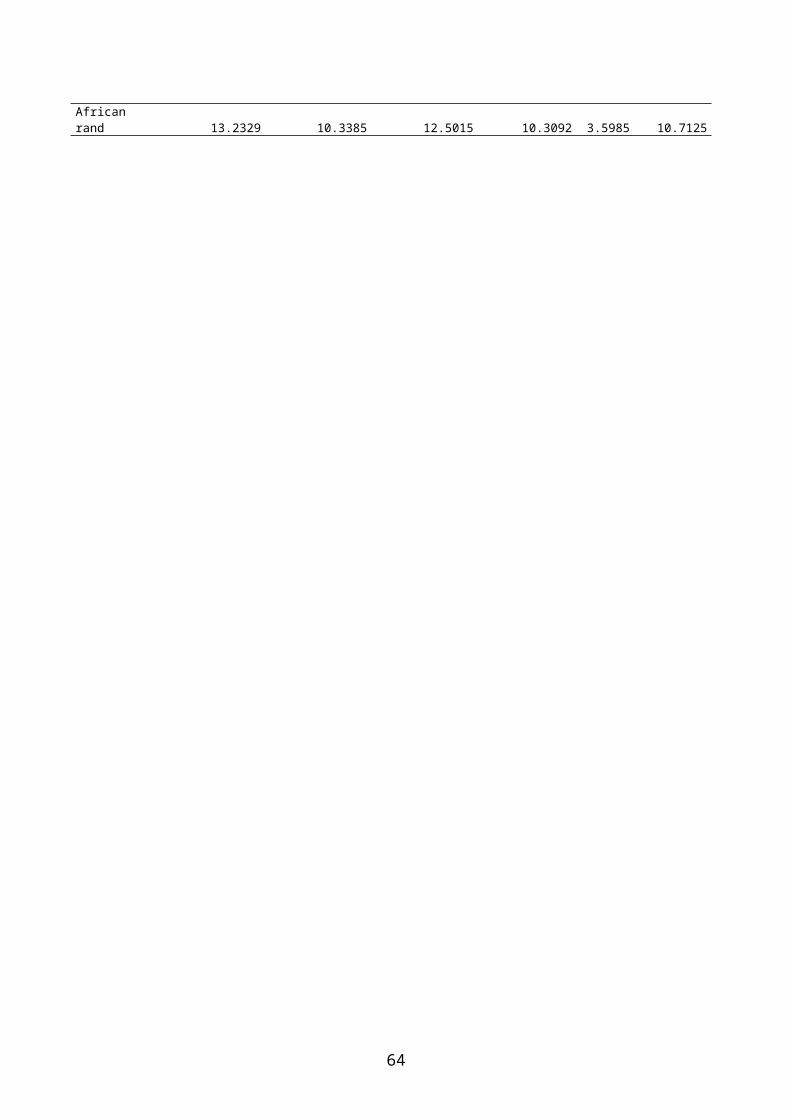
DECLARATION IN ACCORDANCE WITH THE SECOND SUBSECTION OF ART. 154-BIS, PART IV, TITLE III, SECOND PARAGRAPH, SECTION V-BIS, OF LEGISLATIVE DECREE NO. 58 OF FEBRUARY 24, 1998: “UNIFORM LAW ON FINANCIAL INTERMEDIATION ENACTED PURSUANT TO ARTICLES 8 AND 21 OF LAW NO. 52 OF FEBRUARY 6, 1996”
I, the undersigned, Luigi De Angelis, in my capacity as Corporate Accounting Documents Officer of Diasorin S.p.A.
ATTEST
as required by the second subsection of Art. 154-bis, Part IV, Title III, Second Paragraph, Section V-bis, of Legislative Decree No. 58 of February 24, 1998, that, to the best of my knowledge, the financial information included in the present document corresponds to book of accounts and bookkeeping entries of the Company.
Saluggia, November 8, 2013.
Luigi De Angelis
Corporate Accounting Documents Officer DIASORIN S.p.A.
64