Embed Size (px)
Citation preview
VIETNAM PETROCHEMICAL INDUSTRY REPORT Q2/2018
2
Content
Abbreviations 4 2.8 Situations in some typical countries 65
Executive Summary 5 3. Vietnam petrochemical industry 74
1. Business environment 7 3.1 History of the Vietnam petrochemical industry 74
1.1 Macroeconomic situation 7 3.2 Position of Vietnam petrochemical industry 76
1.2 Legal Framework 12 3.3 Input materials 79
1.3 Impacts of Free Trade Agreement 16 3.4 Production 86
2. Global petrochemical industry 19 3.5 Consumption 92
2.1 Introduction of petrochemicals 19 3.6 Import - Export 99
2.2 Process and production technology 21 Export 99
2.3 Input materials 25 Import 103
2.4 Production 32 3.7 Price Movement 110
2.5 Consumption 42 4. Risk analysis 112
2.6 Import - Export 53 4.1 Industry risk 112
2.7 Price Movement 57 4.2 SWOT analysis 116
3
Nội dung
5. Industry planning 118 6.2 Forecast 134
5.1 Oil & gas industry planning 118 7. Enterprise analysis 140
5.2 Petrochemical industry planning 120 7.1 Enterprises introduction 140
5.3 Chemical industry planning 123 7.2 Financial analysis 146
6. Outlooks and forecasts 129 Appendix of financial statements 154
6.1 Outlooks 129
4
Table of abbreviation
CIS Commonwealth of Independent States
EU European Union
FDI Foreign Direct Investment
GSO General Statistics Office
GDVC General Department of Vietnam Customs
IEA International Energy Agency
LNG Liquefied natural gas
LPG Liquefied petroleum gas
MOIT Ministry of Industry and Trade
NAFTA North American Free Trade Agreement
OPEC Organization of the Petroleum Exporting Countries
PVN Petro Vietnam
Vinachem Vietnam Chemical Group
Vinacomin Vietnam Coal and Mineral Industries Group
VIRAC Vietnam Industry Research and Consultant JSC
VPAS Vietnam Plastics Association
5
Executive Summary
Petrochemicals and refineries are two areas in the oil industry.
Petrochemical inputs are products of the oil industry, in particular refinery products and natural gas processing plants.
In the 2012-2022 period, production of primary petrochemical products is estimated to grow at a CAGR of 4.29%. In 2018, the output of primary
petrochemical products reached about 520.4 million tons
Demand for petrochemical products tends to increase over the years
Generally, according to PGPI of Platts, in 2018 prices of petrochemical products increased from January to March, then decreased from April to July,
and increased from August to the end of year.
Content is intentionally removed for demo purpose
6
Executive Summary
At present, almost all petrochemical refineries in the country are supplied by Dung Quat oil refinery of PVN, with the rest from Ba Ria - Vung Tau oil
refinery with a capacity of 2,000 barrels per day.
Demand for petrochemical products is high, but domestic production capacity can not be met.
Content is intentionally removed for demo purpose
1. Business environment
1.1 Macroeconomic situation
1.2 Legal Framework
1.3 Impacts of Free Trade Agreement
Content
7
8
Source: VIRAC, GSO
VND Trillion
GDP growth rate by quarter, 2015 - 2017
GDP by current price and GDP per capita, 2013 - 2018
1. Business Environment
1.1 Macroeconomic Situation
Source: VIRAC, GSO
Content is intentionally removed for demo purpose
Gross domestic product in 2018 is estimated to increase by 6.81% over 2016,
9
VND/USD exchange rates, 2015 – 2018
VND/CNY exchange rates, 2/2016 - 12/2017
Source: VIRAC, GSO
Source: VIRAC, SBV
1. Business Environment
1.1 Macroeconomic Situation
Content is intentionally removed for demo purpose
In 2018, the VND / USD exchange rate was quite stable around VND 22,400.
10
FDI attraction by sector, 2018
Source: VIRAC, FIA
1. Business Environment
1.1 Macroeconomic Situation
Content is intentionally removed for demo purpose
FDI in 2018 had a strong growth
11
Crude oil and natural gas are indirect materials of the petrochemical industry. Therefore, the price of crude oil and natural gas is closely related to the
prices of petrochemical products.
World natural gas prices, 2012 – 2018
USD/million BTU
Sources: VIRAC, Indexmundi
1. Business Environment
1.1 Macroeconomic Situation
Content is intentionally removed for demo purpose
1. Business environment
1.1 Macroeconomic situation
1.2 Legal Framework
1.3 Impacts of Free Trade Agreement
Content
12
13
1. Business Environment
1.2 Legal Framework
Content is intentionally removed for demo purpose
14
•
Thus, the increase of preferential import tax of Vietnam has
brought benefits for PP plastic producers for countries in ASEAN, South Korea and China, while Vietnamese enterprises import plastic resin which suffers
from increased input costs due to import prices increase corresponding with the import tax.
1. Business Environment
1.2 Legal Framework
Content is intentionally removed for demo purpose
15
• The Government issued Decree No. 122/2016 / ND-CP on Export Tariff, Preferential Import Tariff, List of Goods and Absolute Tariff, Mixed Tax, Import
Tax for Quotas Outside Tariff, taking effect from 1 September 2016.
1. Business Environment
1.2 Legal Framework
Content is intentionally removed for demo purpose
1. Business environment
1.1 Macroeconomic situation
1.2 Legal Framework
1.3 Impacts of Free Trade Agreement
Content
16
• Impact of the ASEAN Economic Community (AEC)
• Impact of Comprehensive and Progressive Agreement for Trans-Pacific Partnership (CPTPP)
17
1. Business Environment
1.3 Impacts of Free Trade Agreement
Content is intentionally removed for demo purpose
• Impact of the Free Trade Agreement Vietnam - Eurasian Economic Union (EAEU)
• Impact of the Regional Comprehensive Economic Partnership Agreement (RCEP)
18
1. Business Environment
1.3 Impacts of Free Trade Agreement
Content is intentionally removed for demo purpose
2. Global petrochemical industry
2.1 Introduction of petrochemicals
2.2 Process and production technology
2.3 Input materials
2.4 Production
2.5 Consumption
2.6 Import – Export
2.7 Price Movement
2.8 Situation in some typical countries
Content
19
20
Content is intentionally removed for demo purpose
2. Global petrochemical industry
2.1 Introduction of petrochemicals
2. Global petrochemical industry
2.1 Introduction of petrochemicals
2.2 Process and production technology
2.3 Input materials
2.4 Production
2.5 Consumption
2.6 Import – Export
2.7 Price Movement
2.8 Situation in some typical countries
Content
21
22
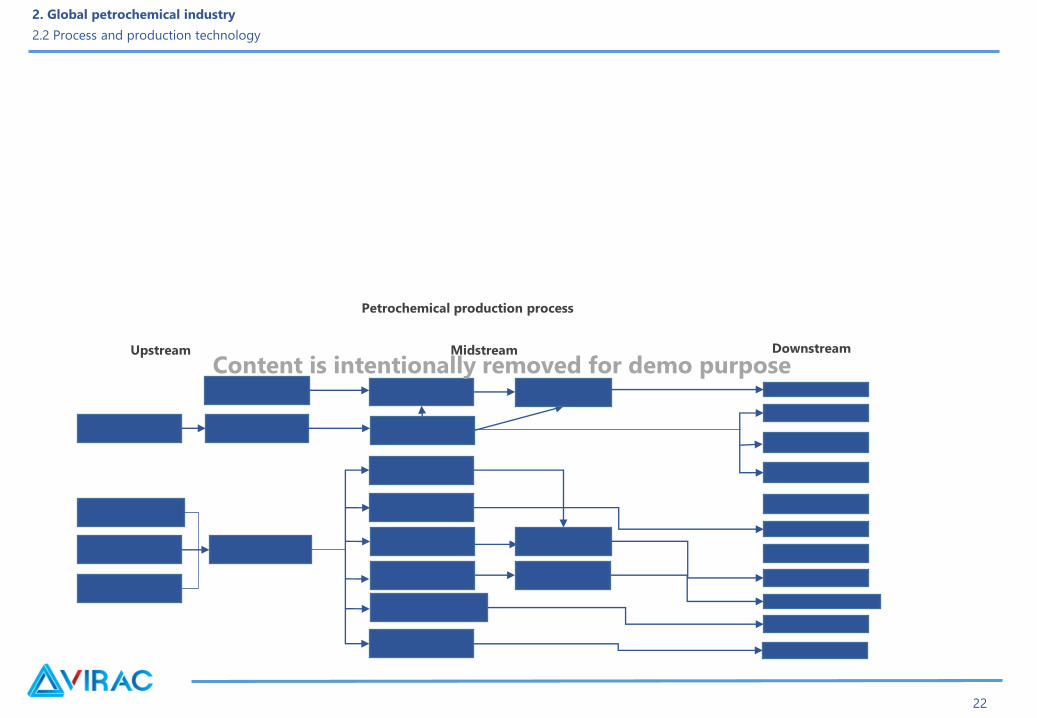
2. Global petrochemical industry
2.2 Process and production technology
Upstream Midstream Downstream
Petrochemical production process
Content is intentionally removed for demo purpose
23
Petrochemical refinery:
2. Global petrochemical industry
2.2 Process and production technology
Content is intentionally removed for demo purpose
24
2. Global petrochemical industry
2.2 Process and production technology
Content is intentionally removed for demo purpose
2. Global petrochemical industry
2.1 Introduction of petrochemicals
2.2 Process and production technology
2.3 Input materials
2.4 Production
2.5 Consumption
2.6 Import – Export
2.7 Price Movement
2.8 Situation in some typical countries
Nội dung
25
26
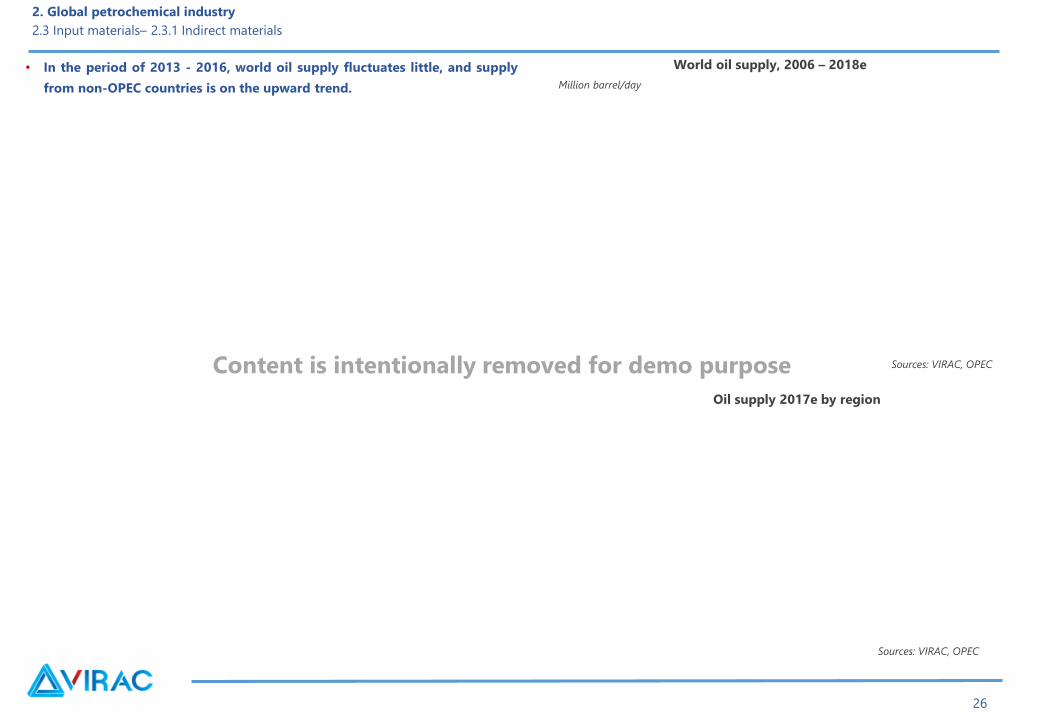
World oil supply, 2006 – 2018e
Million barrel/day
• In the period of 2013 - 2016, world oil supply fluctuates little, and supply
from non-OPEC countries is on the upward trend.
Sources: VIRAC, OPEC
Oil supply 2017e by region
Sources: VIRAC, OPEC
2. Global petrochemical industry
2.3 Input materials– 2.3.1 Indirect materials
Content is intentionally removed for demo purpose
27
• The United States remains a leader in non-OPEC countries,
2. Global petrochemical industry
2.3 Input materials– 2.3.1 Indirect materials
Content is intentionally removed for demo purpose
28
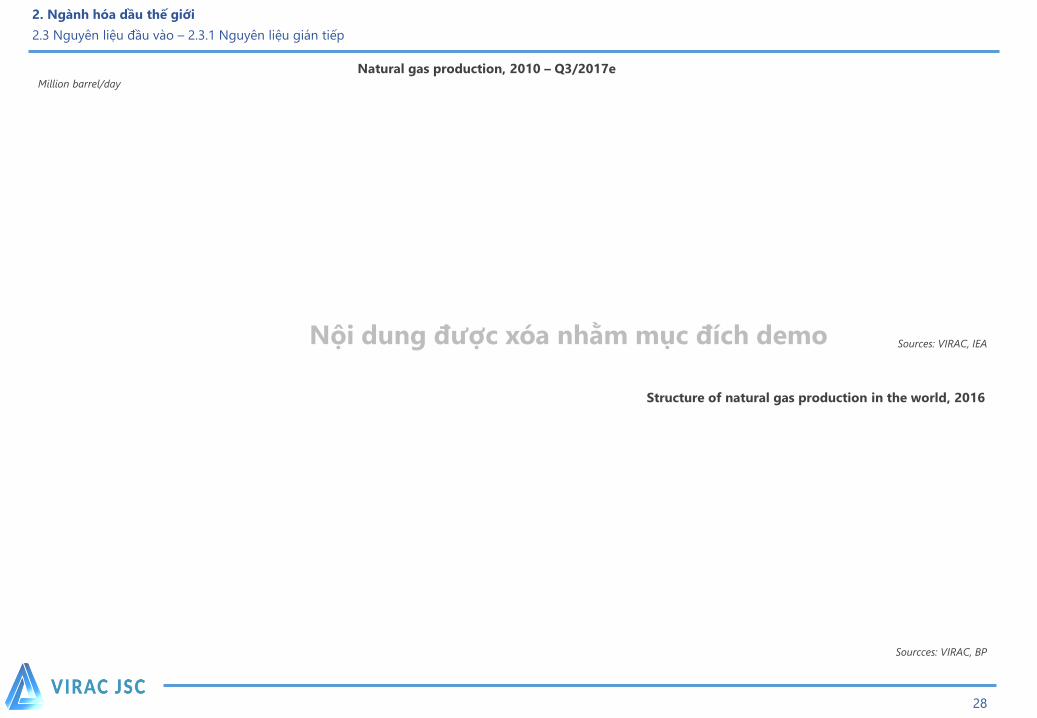
Structure of natural gas production in the world, 2016
Sources: VIRAC, IEA
Natural gas production, 2010 – Q3/2017e
2. Ngành hóa dầu thế giới
2.3 Nguyên liệu đầu vào – 2.3.1 Nguyên liệu gián tiếp
Sourcces: VIRAC, BP
Nội dung được xóa nhằm mục đích demo
Million barrel/day
29
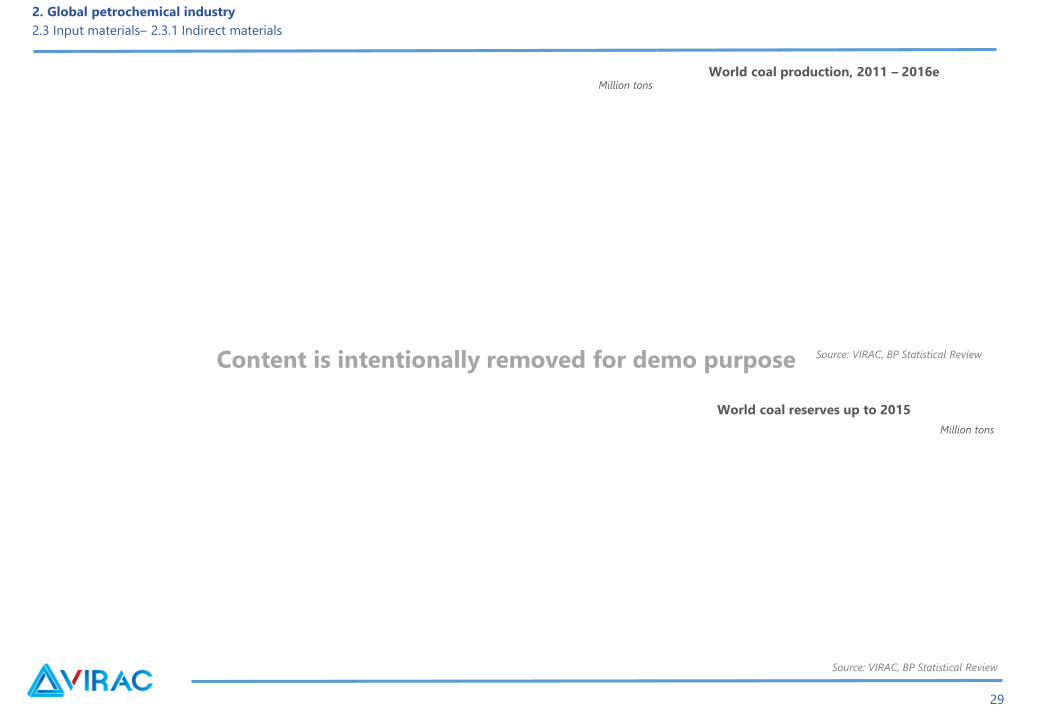
Million tons
Source: VIRAC, BP Statistical Review
World coal production, 2011 – 2016e
World coal reserves up to 2015
2. Global petrochemical industry
2.3 Input materials– 2.3.1 Indirect materials
Million tons
Source: VIRAC, BP Statistical Review
Content is intentionally removed for demo purpose
30
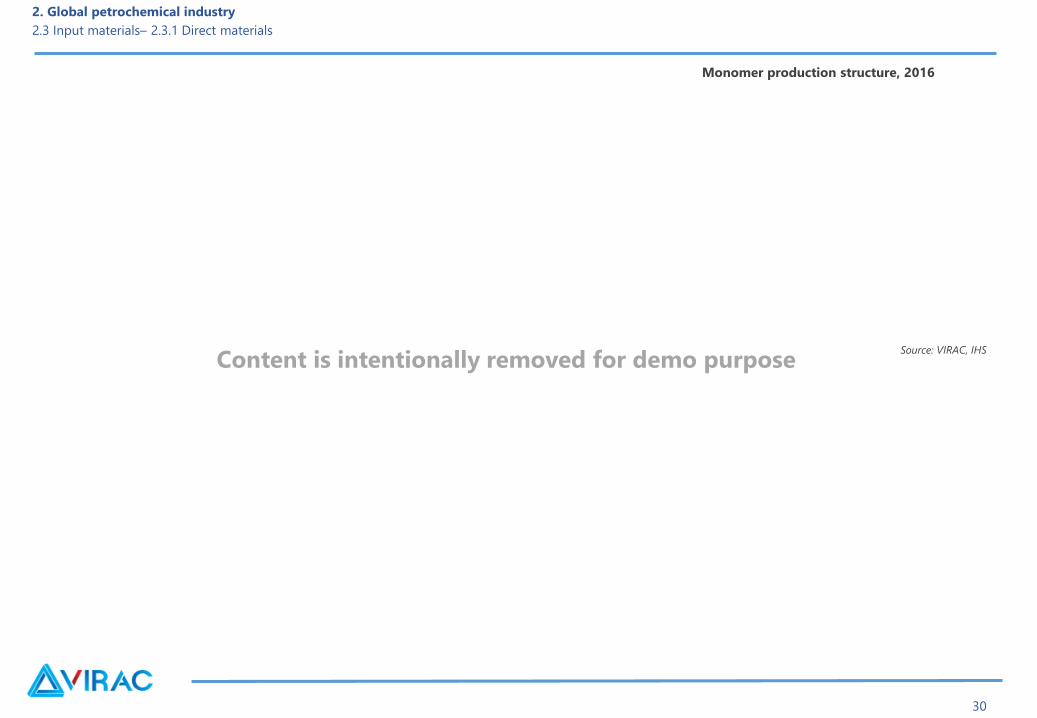
Source: VIRAC, IHS
Monomer production structure, 2016
2. Global petrochemical industry
2.3 Input materials– 2.3.1 Direct materials
Content is intentionally removed for demo purpose
31
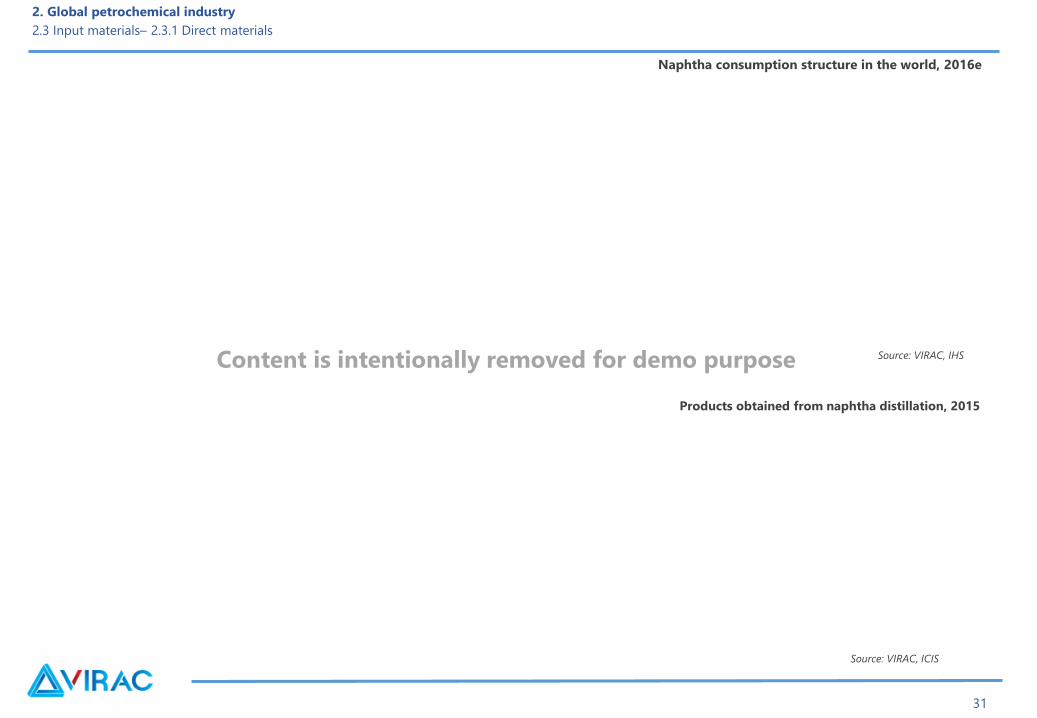
Source: VIRAC, IHS
Products obtained from naphtha distillation, 2015
Source: VIRAC, ICIS
Naphtha consumption structure in the world, 2016e
2. Global petrochemical industry
2.3 Input materials– 2.3.1 Direct materials
Content is intentionally removed for demo purpose

32
Product obtained from Ethane distillation, 2015
Ethane consumption structure by region, 2016e
2. Global petrochemical industry
2.3 Input materials– 2.3.1 Direct materials
Source: VIRAC, IHS
Source: VIRAC, ICIS
Content is intentionally removed for demo purpose
2. Global petrochemical industry
2.1 Introduction of petrochemicals
2.2 Process and production technology
2.3 Input materials
2.4 Production
2.5 Consumption
2.6 Import – Export
2.7 Price Movement
2.8 Situation in some typical countries
Content
33
34
Source: VIRAC, Grand View Research
2. Global petrochemical industry
2.4 Production– 2.4.1 Primary product
Million tons World production of petrochemicals, 2012 - 2022e
Content is intentionally removed for demo purpose
35
*Ethylene, Propylene, Methanol, Benzene, Paraxylene, Chlorine
Production capacity of some basic* petrochemical products by region, 2015 – 2020e
2. Global petrochemical industry
2.4 Production– 2.4.1 Primary product
Source: VIRAC, IHS
Million tons
Content is intentionally removed for demo purpose
36
Global ethylene production capacity by region, 2016e
2. Global petrochemical industry
2.4 Production– 2.4.1 Primary product
Source: VIRAC, ICIS
Source: VIRAC
Content is intentionally removed for demo purpose
Global ethylene production capacity, 2010 - 2016
Global Propylene production, 2010 - 2016
37
Million tons
• Propylene is the second largest organic molecule after ethylene produced
in the world,
Sources: VIRAC, ICIS
Structure of Propylene by region, 2016
Nội dung được xóa nhằm mục đích demo
2. Global petrochemical industry
2.4 Production– 2.4.1 Primary product

38
Global Butadiene capacity and production, 2011
- 2015
Source: VIRAC, ICIS
Butadiene production structure by country, 2015
2. Global petrochemical industry
2.4 Production– 2.4.1 Primary product
Million tons
Source: VIRAC, ICIS
Content is intentionally removed for demo purpose
39
Source: VIRAC, HIS, ICIS
Butadiene production capacity of some companies in the world
No Company Country Capacity (ton/year) Time of operation
1
2
3
4
5
6
7
8
9
10
11
12
13
14
15
16
17
18
19
20
21
22
23
24
25
2. Global petrochemical industry
2.4 Production– 2.4.1 Primary product
Content is intentionally removed for demo purpose
40
Source: VIRAC, IHS
Global benzene supply- demand, 2012 – 2017f
2. Global petrochemical industry
2.4 Production– 2.4.1 Primary product
Million tons
Content is intentionally removed for demo purpose Source: VIRAC, ICIS
Million tons
Global benzene production capacity, 2016 - 2019e
41
Source: VIRAC, Europe Plastic
Structure of polymer production by country 2016Global polymer production, 2009 – 2016e
2. Global petrochemical industry
2.4 Production– 2.4.2 Secondary product
Source: VIRAC, Europe Plastic
Million tons
Content is intentionally removed for demo purpose
42
• In 2015, China had more factories producing polypropylene (PP) from coal into operation.
2. Global petrochemical industry
2.4 Production– 2.4.2 Secondary product
Content is intentionally removed for demo purpose
2. Global petrochemical industry
2.1 Introduction of petrochemicals
2.2 Process and production technology
2.3 Input materials
2.4 Production
2.5 Consumption
2.6 Import – Export
2.7 Price Movement
2.8 Situation in some typical countries
Content
43
44
Source: VIRAC, ICIS
Source: VIRAC, ICISSource: VIRAC, Stratas Advisor
Application structure of ethylene in the production of plastic materials, 2016
Production capacity and demand of ethylene by regions
2015
Global Ethylene demand, 2010 – 2016
2. Global petrochemical industry
2.5 Consumption– 2.5.1 Primary product
Million tons
Million tons
Content is intentionally removed for demo purpose
45
Sources: VIRAC, IHS
Structure of ethylene dichloride consumption market, 2016Ethylene dichloride accounts for about 9% of global ethylene application in
2016.
2. Global petrochemical industry
2.5 Consumption– 2.5.1 Primary product
Content is intentionally removed for demo purpose
46
Source: VIRAC, ICIS
Global propylene demand, 2010 – 2016
Structure of propylene uses, 2015
2. Global petrochemical industry
2.5 Consumption– 2.5.1 Primary product
Million tons
Content is intentionally removed for demo purpose
47
Source: VIRAC, IHS
Structure of global propylene consumption, 2013 Structure of propylene consumption, 2023e
Source: VIRAC, IHS
2. Global petrochemical industry
2.5 Consumption– 2.5.1 Primary product
Content is intentionally removed for demo purpose
Global consumption of propylene is on the upward trend
48
Sources: VIRAC, IHSSources: VIRAC, American Chemical Society
Structure of butadiene consumption by product, 2018 Structure of global consumption of SBR by region, 2016
Content is intentionally removed for demo purpose
2. Global petrochemical industry
2.3 Consumption– 2.3.1 Primary product
49
Source: VIRAC, IHS
Structure of benzene usage in the world, 2015
2. Global petrochemical industry
2.5 Consumption– 2.5.1 Primary product
Content is intentionally removed for demo purpose
• Over the past decade, global demand for benzene has grown at a slow pace
and most of the growth comes from the Asia Pacific region.
50
Source: VIRAC, IHS
Structure of VCM consumption by region, 2016e
2. Global petrochemical industry
2.5 Consumption– 2.5.2 Secondary product
Content is intentionally removed for demo purpose
51
Source: VIRAC, ICIS
Demand of Polymer consumption by region 2016
Demand of Polymer consumption in the world, 2010 – 2016e
2. Global petrochemical industry
2.5 Consumption– 2.5.2 Secondary product
Source: VIRAC, ICIS
Million tons
Content is intentionally removed for demo purpose
52
Source: VIRAC, ICIS
PP global consumption structure by country 2015
Structure of Polymer consumption by type, 2016
2. Global petrochemical industry
2.5 Consumption– 2.5.2 Secondary product
Source: VIRAC, ICISSource: VIRAC, IHS
PE demand structure by region 2016
Content is intentionally removed for demo purpose
Demand for PP and PE accounts for two thirds of the total worldwide demand
for polymer in the segments of packaging and spare parts of the automobile.
53
Source: VIRAC, VPA
Source: VIRAC, Statista
Kg/person
Structure Polymer consumption by field, 2015
Consumption of plastic per capita, 2015
2. Global petrochemical industry
2.5 Consumption– 2.5.2 Secondary product
Content is intentionally removed for demo purpose
2. Global petrochemical industry
2.1 Introduction of petrochemicals
2.2 Process and production technology
2.3 Input materials
2.4 Production
2.5 Consumption
2.6 Import – Export
2.7 Price Movement
2.8 Situation in some typical countries
Content
54
55
Source: VIRAC, Uncomtrade
USD billion
The global ethylene export structure, 2016eThe global ethylene import structure, 2016e
Global ethylene trade, 2011 - 2016e
2. Global petrochemical industry
2.6 Import & Export– 2.6.1 Primary product
Million tons
Source: VIRAC, Uncomtrade Source: VIRAC, Uncomtrade
Content is intentionally removed for demo purpose
56
Global propylene exports, 2011 – 2016e
2. Global petrochemical industry
2.6 Import & Export– 2.6.1 Primary product
Million tons USD billion
Source: VIRAC, ICIS
Content is intentionally removed for demo purpose
Source: VIRAC, Wood Mackenzie
Million tons
Global benzene exports, 2010 - 2020e
57
Source: VIRAC, UN Comtrade
Source: VIRAC, ICIS
USD billion
Source: VIRAC, UN Comtrade
Global polymer export, 2012 - 2016e
Structure of polymer import markets, 2016eStructure of polymer export markets, 2016e
2. Global petrochemical industry
2.6 Import & Export– 2.6.2 Secondary product
Content is intentionally removed for demo purpose
2. Global petrochemical industry
2.1 Introduction of petrochemicals
2.2 Process and production technology
2.3 Input materials
2.4 Production
2.5 Consumption
2.6 Import – Export
2.7 Price Movement
2.8 Situation in some typical countries
Content
58
59
Sources: VIRAC, Platts
PGPI World Index, 11/2016 - 11/2017USD/ton
Average monthly PGPI, 7/2017 – 11/2017
Sources: VIRAC, Platts
Đơn vị: USD/tấn
Nội dung được xóa nhằm mục đích demo
2. Global petrochemical industry
2.7 Price movement
60
Source: VIRAC, ICIS
IPEX index of the world and the regions, 5/2007- 31/3/2017
2. Global petrochemical industry
2.7 Price movement
Content is intentionally removed for demo purpose
61
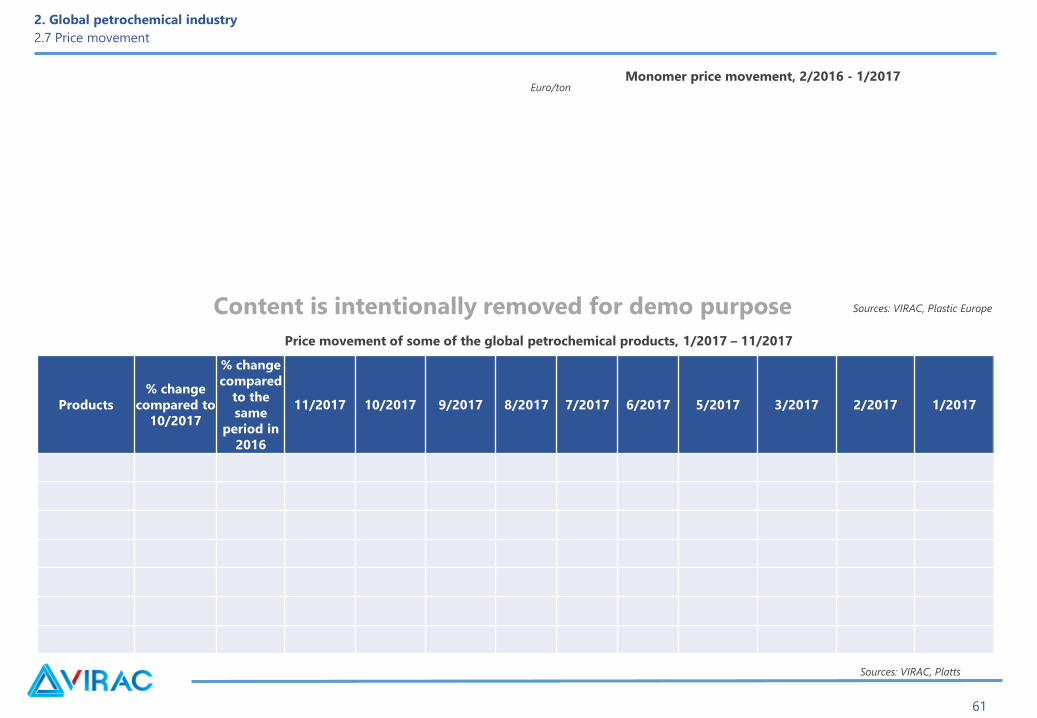
Sources: VIRAC, Plastic Europe
Euro/tonMonomer price movement, 2/2016 - 1/2017
Price movement of some of the global petrochemical products, 1/2017 – 11/2017
Sources: VIRAC, Platts
Đơn vị: USD/tấnProducts
% change
compared to
10/2017
% change
compared
to the
same
period in
2016
11/2017 10/2017 9/2017 8/2017 7/2017 6/2017 5/2017 3/2017 2/2017 1/2017
2. Global petrochemical industry
2.7 Price movement
Content is intentionally removed for demo purpose
62
USD/ton
Global ethylene price, 11/2016 – 12/2017
Global propylene price, 11/2016 –
11/2017
Toluene price movement, 11/2016 –
11/2017USD/ton
USD/ton
2. Global petrochemical industry
2.7 Price movement
Source: VIRAC, PlattsSource: VIRAC, Platts
Source: VIRAC, PlattsContent is intentionally removed for demo purpose
63
Benzene price movement, 11/2016 – 11/2017
USD/ton
LDPE price movement, 11/2016 – 11/2017 Paraxylene price movement, 11/2016 – 11/2017
Source: VIRAC, Platts
Source: VIRAC, Platts
USD/ton
Source: VIRAC, Platts
2. Global petrochemical industry
2.7 Price movement
Content is intentionally removed for demo purpose
64
Source: VIRAC, Bloomerg
USD/ton
Butadiene price movement, 1/2011 – 1/2017
2. Global petrochemical industry
2.7 Price movement
Content is intentionally removed for demo purpose
65
Source: VIRAC, Plastics New Europe
USD/tonPolymer price movement, 5/2015 – 9/2017
2. Global petrochemical industry
2.7 Price movement
Content is intentionally removed for demo purpose
2. Global petrochemical industry
2.1 Introduction of petrochemicals
2.2 Process and production technology
2.3 Input materials
2.4 Production
2.5 Consumption
2.6 Import – Export
2.7 Price Movement
2.8 Situation in some typical countries
Content
66
67
Source: VIRAC, Europe Plastic
Million tons
2. Global petrochemical industry
2.8 Situations in some typical regions in the world – Europe
Polymer production output of Europe, 2011 – 2017f
Content is intentionally removed for demo purpose European Polymer industry is facing great difficulties in the costs of petrochemical materials and energy
68
Structure of polymer usage in Europe by sector, 2016 Structure of polymer usage in Europe by type, 2016e
Polymer demand in Europe by country, 2016
2. Global petrochemical industry
2.8 Situations in some typical regions in the world – Europe
Source: VIRAC, Europe Plastic
Source: VIRAC, Europe Plastic Source: VIRAC, Europe Plastic
Content is intentionally removed for demo purpose
69
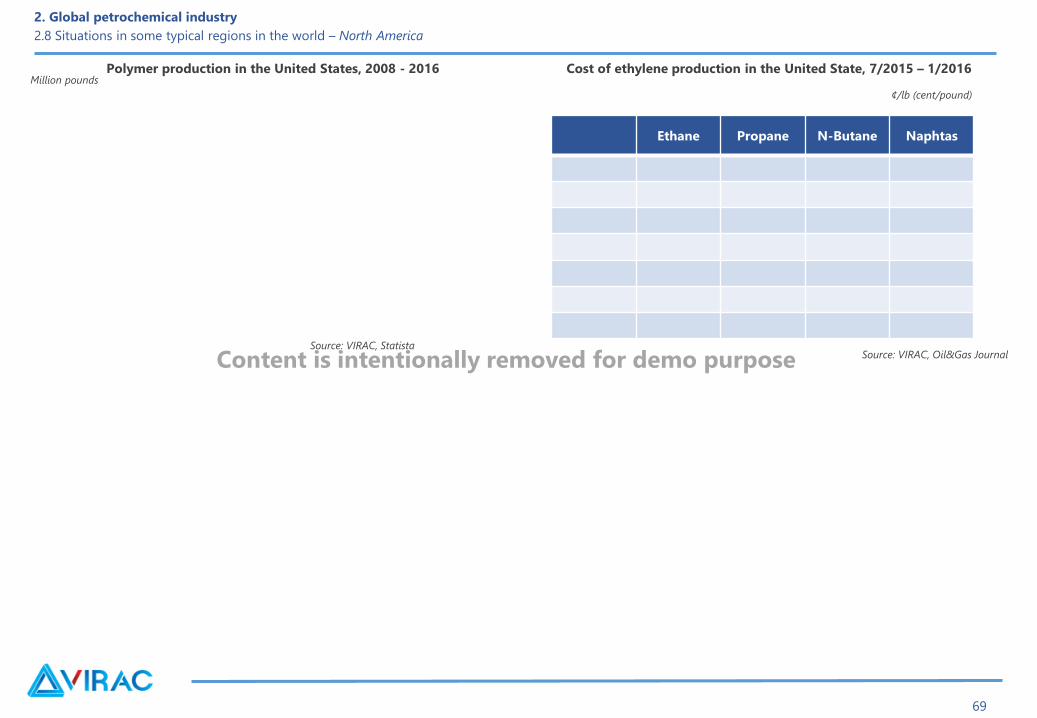
Source: VIRAC, Statista
Million pounds
Source: VIRAC, Oil&Gas Journal
Cost of ethylene production in the United State, 7/2015 – 1/2016
¢/lb (cent/pound)
Polymer production in the United States, 2008 - 2016
2. Global petrochemical industry
2.8 Situations in some typical regions in the world – North America
Content is intentionally removed for demo purpose
Ethane Propane N-Butane Naphtas
70
China
2. Global petrochemical industry
2.8 Situations in some typical regions in the world – Asia
Content is intentionally removed for demo purpose
71
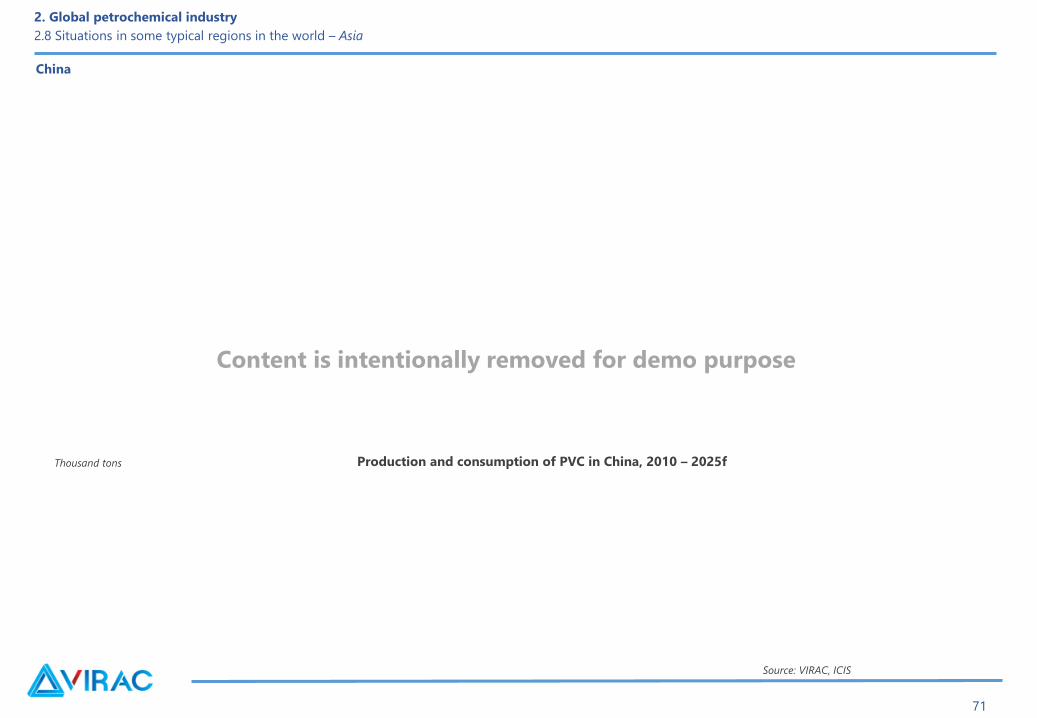
China
Source: VIRAC, ICIS
Thousand tons Production and consumption of PVC in China, 2010 – 2025f
2. Global petrochemical industry
2.8 Situations in some typical regions in the world – Asia
Content is intentionally removed for demo purpose
72
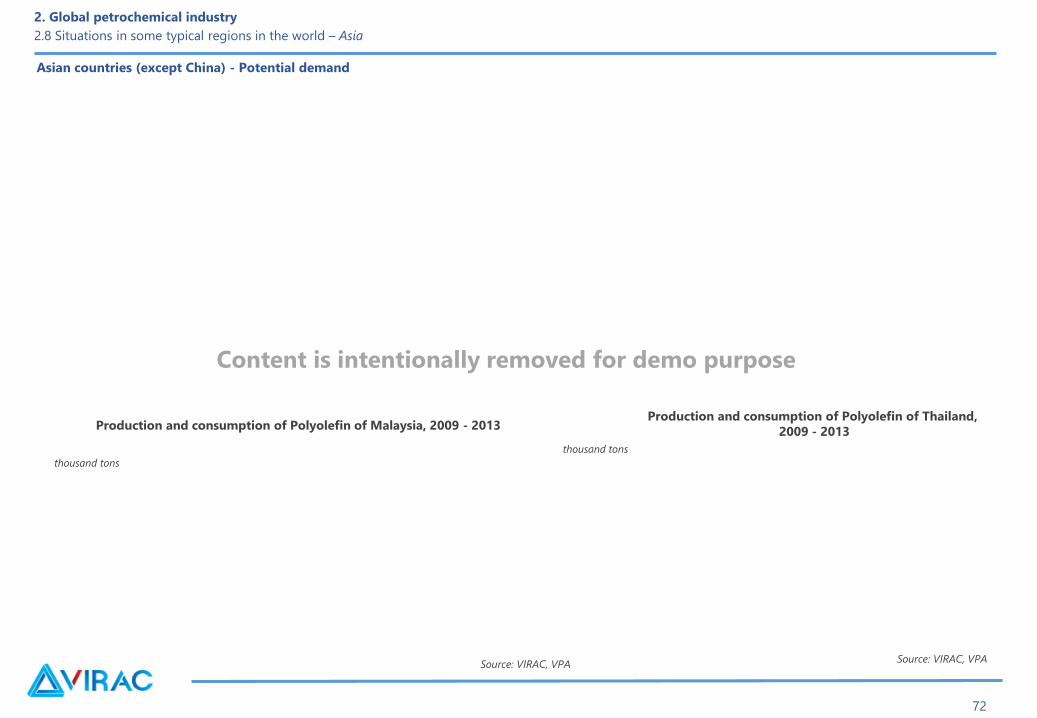
Asian countries (except China) - Potential demand
Production and consumption of Polyolefin of Malaysia, 2009 - 2013Production and consumption of Polyolefin of Thailand,
2009 - 2013
Source: VIRAC, VPA
2. Global petrochemical industry
2.8 Situations in some typical regions in the world – Asia
thousand tons
thousand tons
Source: VIRAC, VPA
Content is intentionally removed for demo purpose
73
• Southeast Asian countries have a great potential for development
• India is the market behind China in terms of volume demand.
2. Global petrochemical industry
2.8 Situations in some typical regions in the world – Asia
Content is intentionally removed for demo purpose
74
2. Global petrochemical industry
2.8 Situations in some typical regions in the world – Asia
Content is intentionally removed for demo purpose
75
Nội dung
3. Vietnam petrochemical industry
3.1 History of Vietnam petrochemical industry
3.2 Position of Vietnam petrochemical industry
3.3 Input materials
3.4 Production
3.5 Consumption
3.6 Import- Export
3.7 Price movement
76
In Vietnam, the petrochemical refining sector began in 1982 with simple, small-scale factories
Petrochemical technology and products in Vietnam in the future is also not out of the world trend.
3. Vietnam petrochemical industry
3.1 History of Vietnam petrochemical industry
Content is intentionally removed for demo purpose
77
Content
3. Vietnam petrochemical industry
3.1 History of Vietnam petrochemical industry
3.2 Position of Vietnam petrochemical industry
3.3 Input materials
3.4 Production
3.5 Consumption
3.6 Import- Export
3.7 Price movement
78
• Facilitate the development of many other industries
Content is intentionally removed for demo purpose
3. Vietnam petrochemical industry
3.2 Position of Vietnam petrochemical industry
79
• Save foreign currency
• Increase the content of the local value of the product
• Save and improve the efficiency of natural resource use
3. Vietnam petrochemical industry
3.2 Position of Vietnam petrochemical industry
Content is intentionally removed for demo purpose
80
Content
3. Vietnam petrochemical industry
3.1 History of Vietnam petrochemical industry
3.2 Position of Vietnam petrochemical industry
3.3 Input materials
3.4 Production
3.5 Consumption
3.6 Import- Export
3.7 Price movement
81
3. Vietnam petrochemical industry
3.3 Input materials
Million tons
Forecast of coal supply and demand, 2015 - 2030
Source: VIRAC, VinacominContent is intentionally removed for demo purpose
82
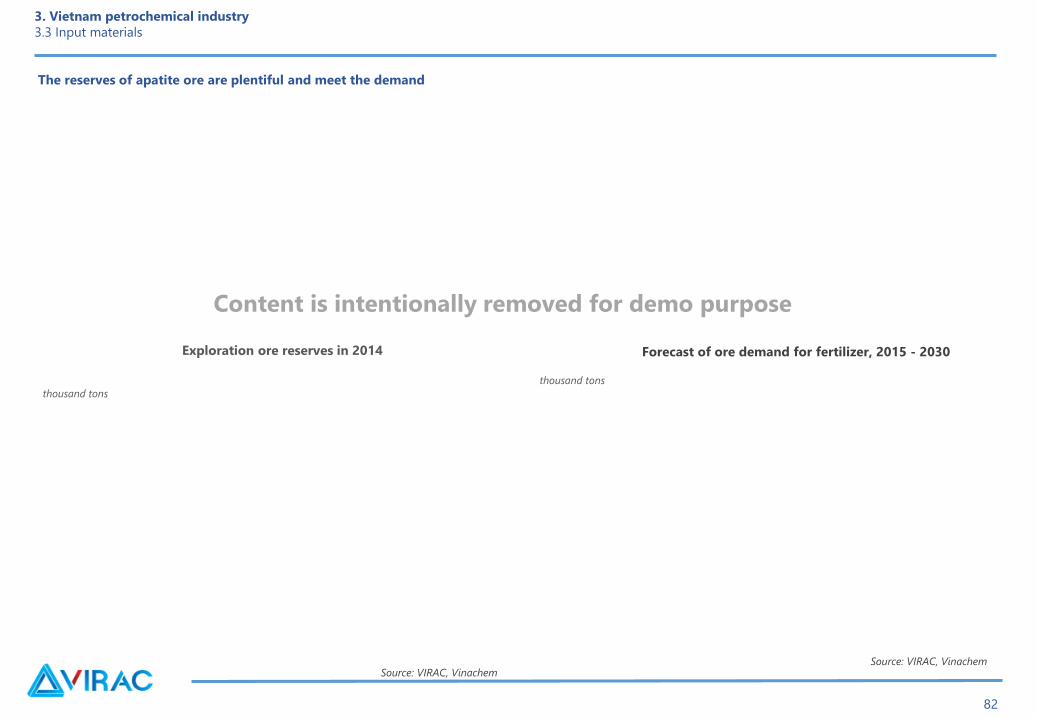
The reserves of apatite ore are plentiful and meet the demand
Source: VIRAC, Vinachem
thousand tons
thousand tons
Forecast of ore demand for fertilizer, 2015 - 2030Exploration ore reserves in 2014
3. Vietnam petrochemical industry
3.3 Input materials
Source: VIRAC, Vinachem
Content is intentionally removed for demo purpose
83
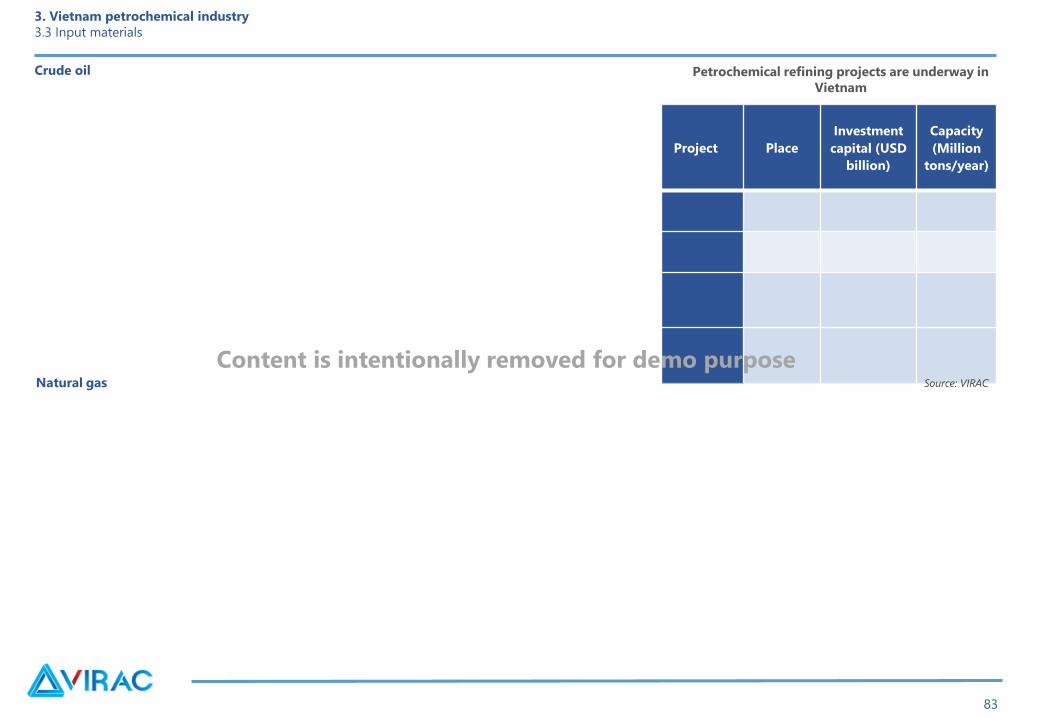
Crude oil
Project Place
Investment
capital (USD
billion)
Capacity
(Million
tons/year)
Natural gas
Petrochemical refining projects are underway in
Vietnam
Source: VIRAC
3. Vietnam petrochemical industry
3.3 Input materials
Content is intentionally removed for demo purpose
84
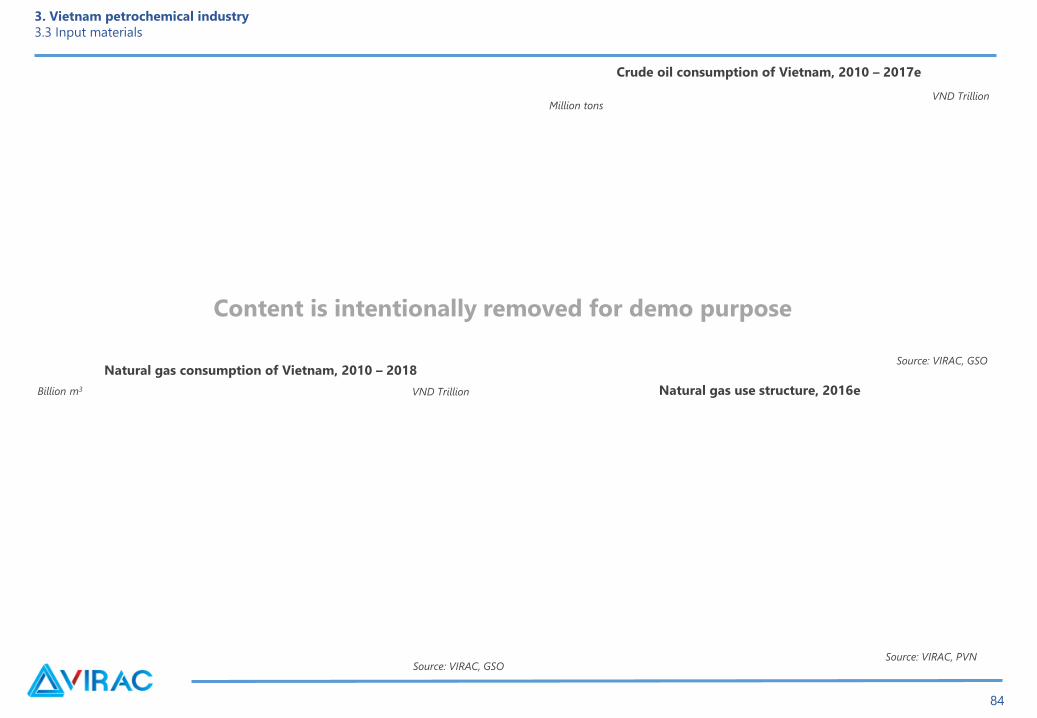
Crude oil consumption of Vietnam, 2010 – 2017e
Source: VIRAC, GSO
Million tons
Source: VIRAC, GSO
Billion m3
Natural gas consumption of Vietnam, 2010 – 2018
VND Trillion
Source: VIRAC, PVN
Natural gas use structure, 2016e
3. Vietnam petrochemical industry
3.3 Input materials
VND Trillion
Content is intentionally removed for demo purpose
85
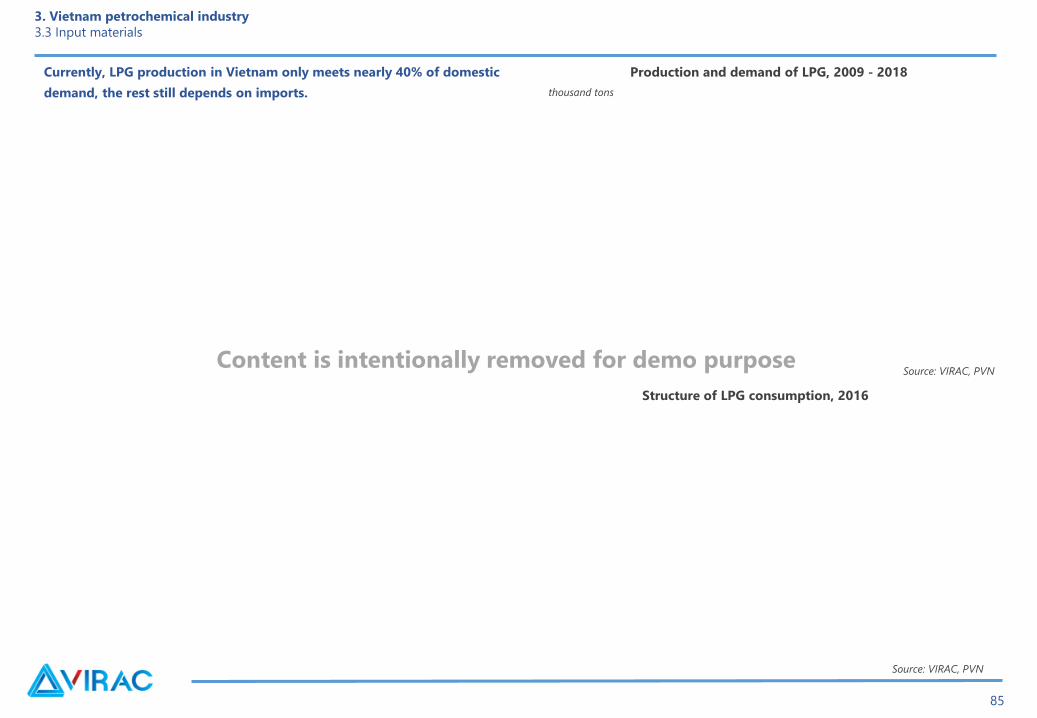
Production and demand of LPG, 2009 - 2018
Source: VIRAC, PVN
thousand tons
Source: VIRAC, PVN
Structure of LPG consumption, 2016
3. Vietnam petrochemical industry
3.3 Input materials
Content is intentionally removed for demo purpose
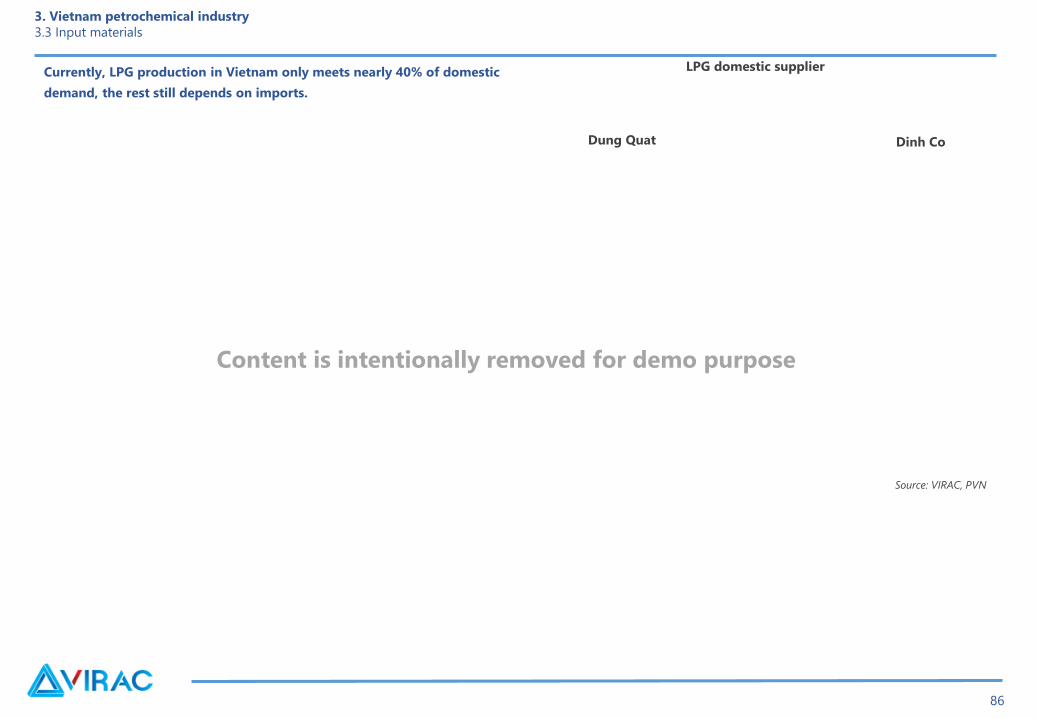
Currently, LPG production in Vietnam only meets nearly 40% of domestic
demand, the rest still depends on imports.
86
LPG domestic supplier
3. Vietnam petrochemical industry
3.3 Input materials
Source: VIRAC, PVN
Content is intentionally removed for demo purpose
Dung Quat Dinh Co
Currently, LPG production in Vietnam only meets nearly 40% of domestic
demand, the rest still depends on imports.
87
Content
3. Vietnam petrochemical industry
3.1 History of Vietnam petrochemical industry
3.2 Position of Vietnam petrochemical industry
3.3 Input materials
3.4 Production
3.5 Consumption
3.6 Import- Export
3.7 Price movement
88
3. Vietnam petrochemical industry
3.4 Production
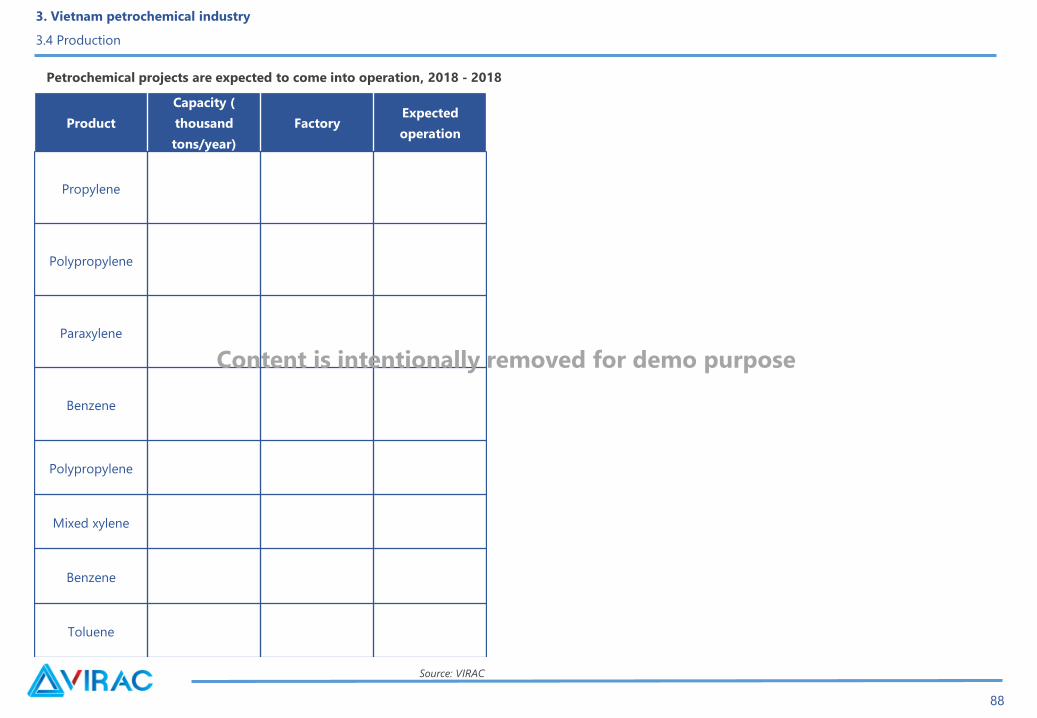
Petrochemical projects are expected to come into operation, 2018 - 2018
Source: VIRAC
Product
Capacity (
thousand
tons/year)
FactoryExpected
operation
Propylene
Polypropylene
Paraxylene
Benzene
Polypropylene
Mixed xylene
Benzene
Toluene
Content is intentionally removed for demo purpose
89
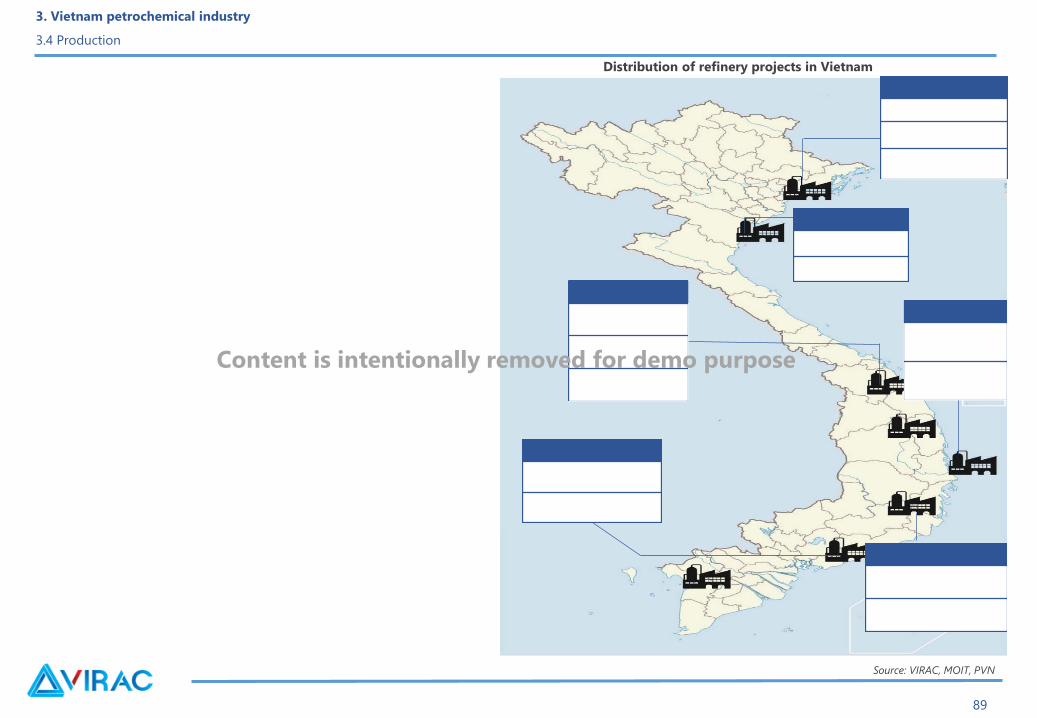
Distribution of refinery projects in Vietnam
Source: VIRAC, MOIT, PVN
3. Vietnam petrochemical industry
3.4 Production
Content is intentionally removed for demo purpose
Despite receiving many foreign investment projects in the fields of oil petrochemical refining, up to now, only Dung Quat Oil Refinery Plant managed by
Binh Son Refining and Petrochemical Company has been put into operation since 2009.
90
3. Vietnam petrochemical industry
3.4 Production
Content is intentionally removed for demo purpose
91
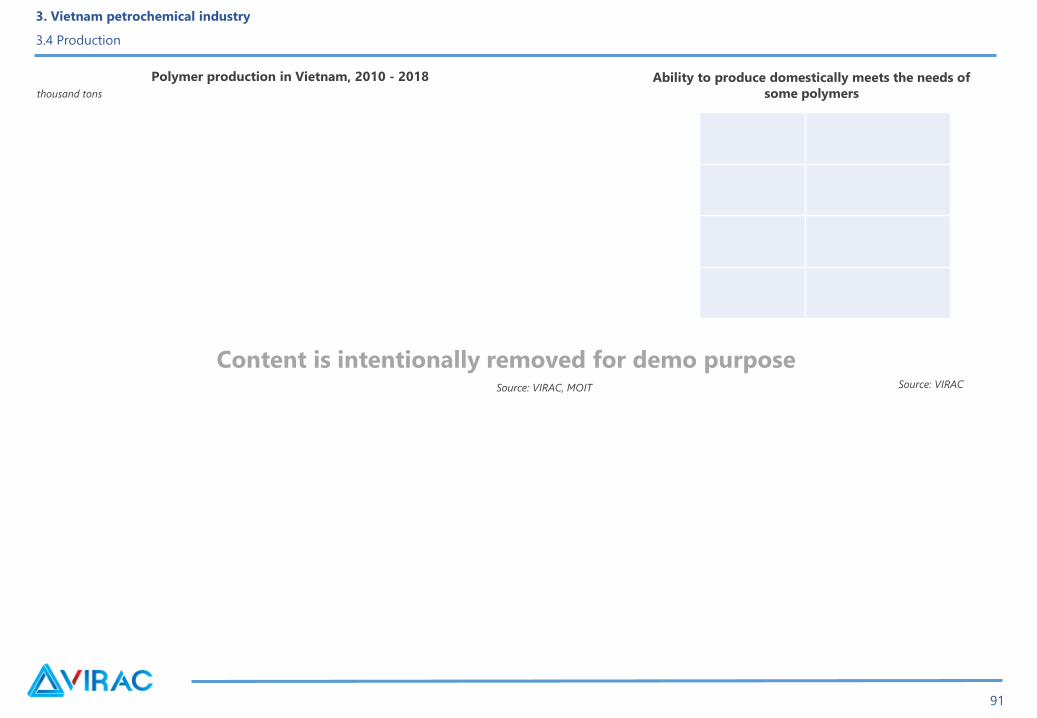
Source: VIRAC, MOIT
thousand tons
Polymer production in Vietnam, 2010 - 2018 Ability to produce domestically meets the needs of
some polymers
Source: VIRAC
3. Vietnam petrochemical industry
3.4 Production
Content is intentionally removed for demo purpose
92
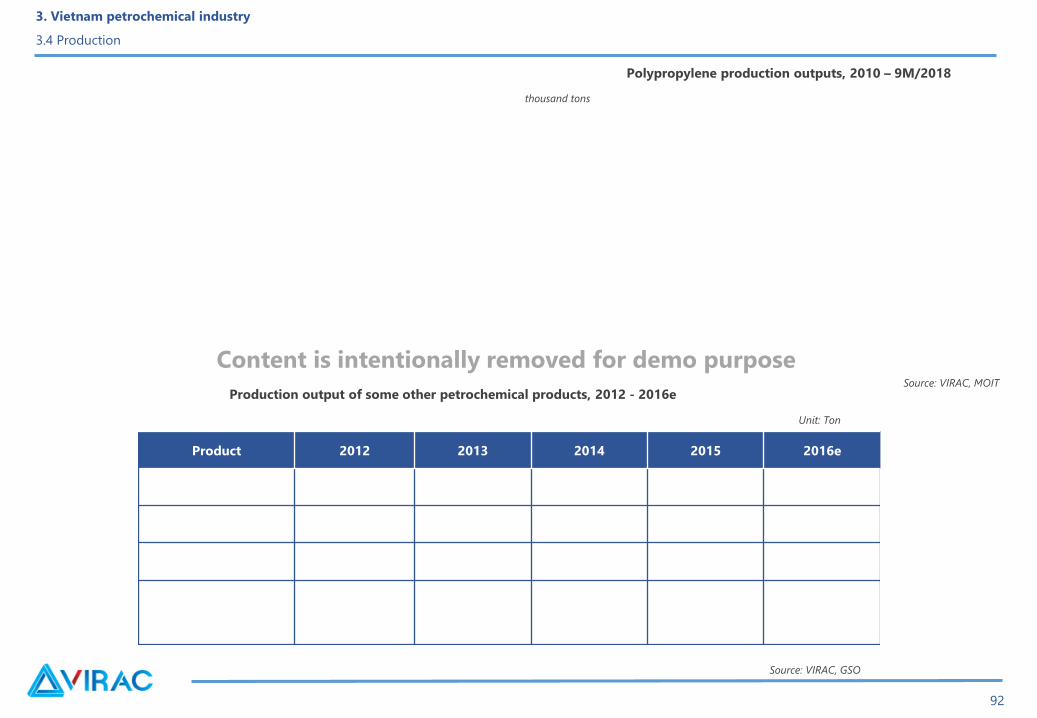
Polypropylene production outputs, 2010 – 9M/2018
Source: VIRAC, MOIT
thousand tons
Production output of some other petrochemical products, 2012 - 2016e
Source: VIRAC, GSO
Unit: Ton
Product 2012 2013 2014 2015 2016e
3. Vietnam petrochemical industry
3.4 Production
Content is intentionally removed for demo purpose
93
Content
3. Vietnam petrochemical industry
3.1 History of Vietnam petrochemical industry
3.2 Position of Vietnam petrochemical industry
3.3 Input materials
3.4 Production
3.5 Consumption
3.6 Import- Export
3.7 Price movement
94
3. Vietnam petrochemical industry
3.5 Consumption
Content is intentionally removed for demo purpose
Petrochemical products are divided into two main categories.
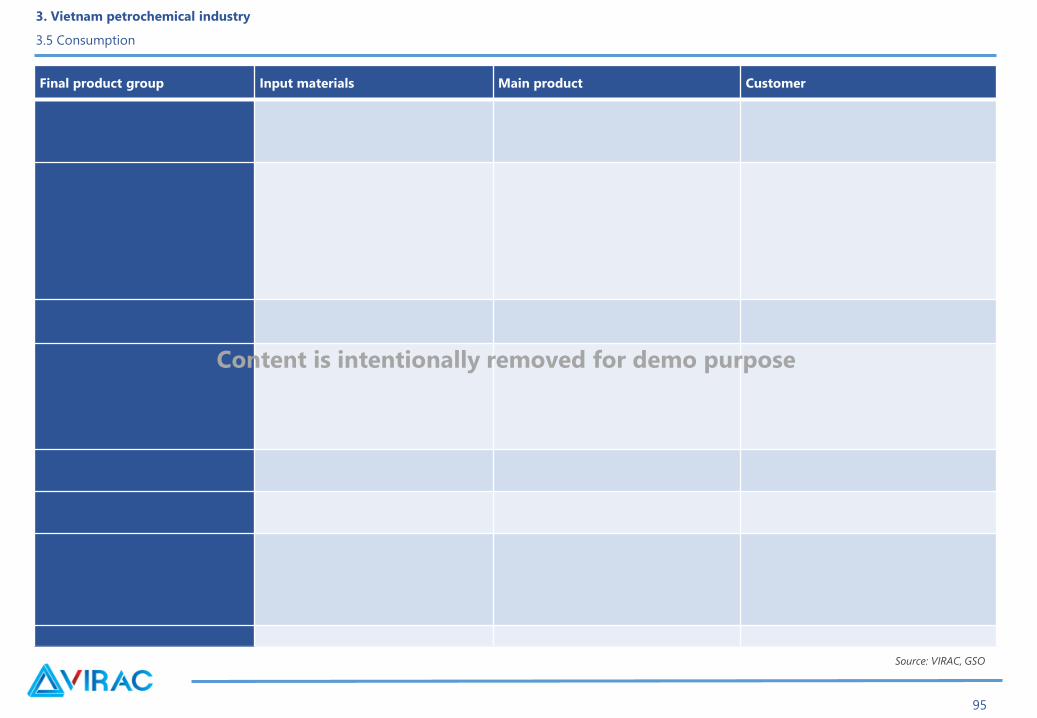
Source: VIRAC, GSO
Final product group Input materials Main product Customer
95
3. Vietnam petrochemical industry
3.5 Consumption
Content is intentionally removed for demo purpose
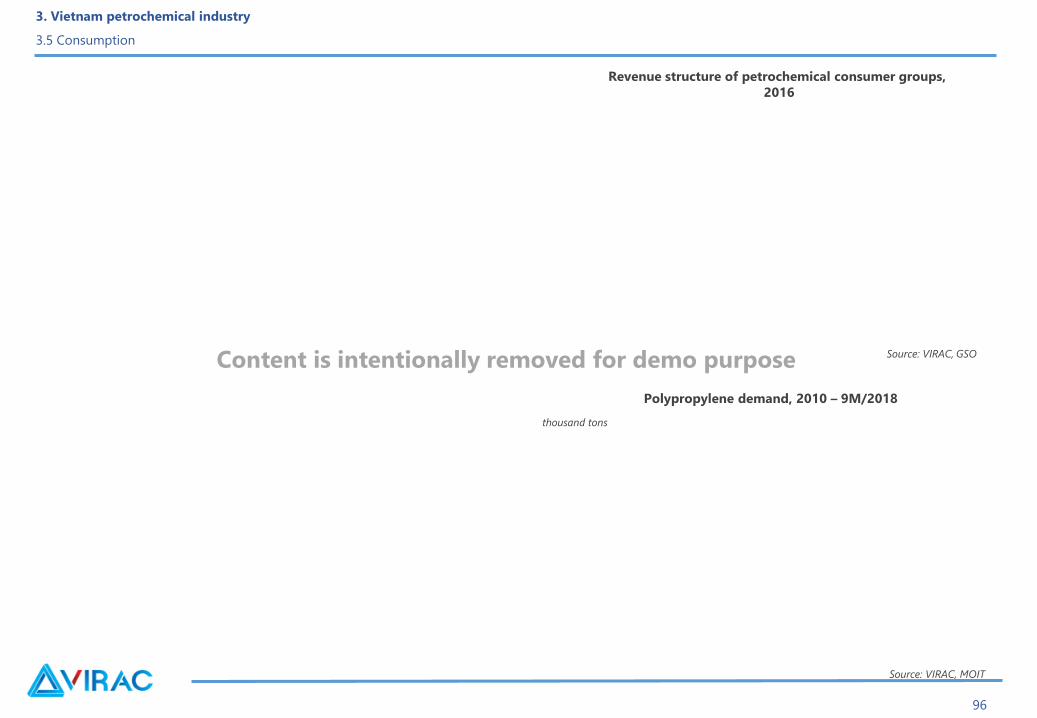
Source: VIRAC, GSO
Revenue structure of petrochemical consumer groups,
2016
96
Polypropylene demand, 2010 – 9M/2018
Source: VIRAC, MOIT
thousand tons
3. Vietnam petrochemical industry
3.5 Consumption
Content is intentionally removed for demo purpose
97
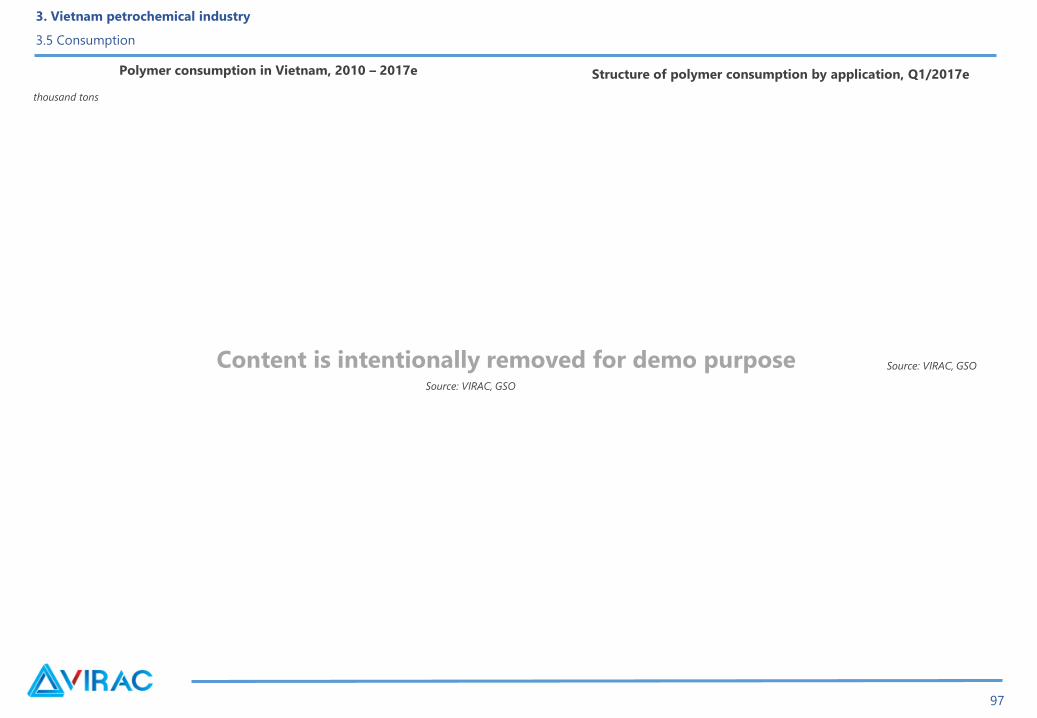
thousand tons
Polymer consumption in Vietnam, 2010 – 2017e Structure of polymer consumption by application, Q1/2017e
3. Vietnam petrochemical industry
3.5 Consumption
Source: VIRAC, GSO
Source: VIRAC, GSOContent is intentionally removed for demo purpose
98
Consumption of other petrochemical products, 2012 - 2016e
Year
Toluene Styrene Polyethylene (PE) Polyvinyl clorua (PVC)
Output (tons)Value (VND
million)Output (tons)
Value (VND
million)Output (tons)
Value (VND
million)Output (tons)
Value (VND
million)
2012
2013
2014
2015
2016e
3. Vietnam petrochemical industry
3.5 Consumption
Source: VIRAC, GSO
Content is intentionally removed for demo purpose
99
Application of some petrochemical products
Product Application
3. Vietnam petrochemical industry
3.5 Consumption
Content is intentionally removed for demo purpose
100
Nội dung
3. Vietnam petrochemical industry
3.1 History of Vietnam petrochemical industry
3.2 Position of Vietnam petrochemical industry
3.3 Input materials
3.4 Production
3.5 Consumption
3.6 Import- Export
3.7 Price movement
101
Sources: VIRAC, GDVC
Polymer export value, 2012 – 2017e
Million USD
Sources: VIRAC, GDVC
Export structure of polymer by value, 2018
Sources: VIRAC, GDVC
According to preliminary statistics, in December 2018, exports of polymers in Vietnam reached
the highest turnover since early 2018,
Export structure of polymer by
weight, 2018
3. Vietnam petrochemical industry
3.6 Import & Export– Export
Content is intentionally removed for demo purpose
102
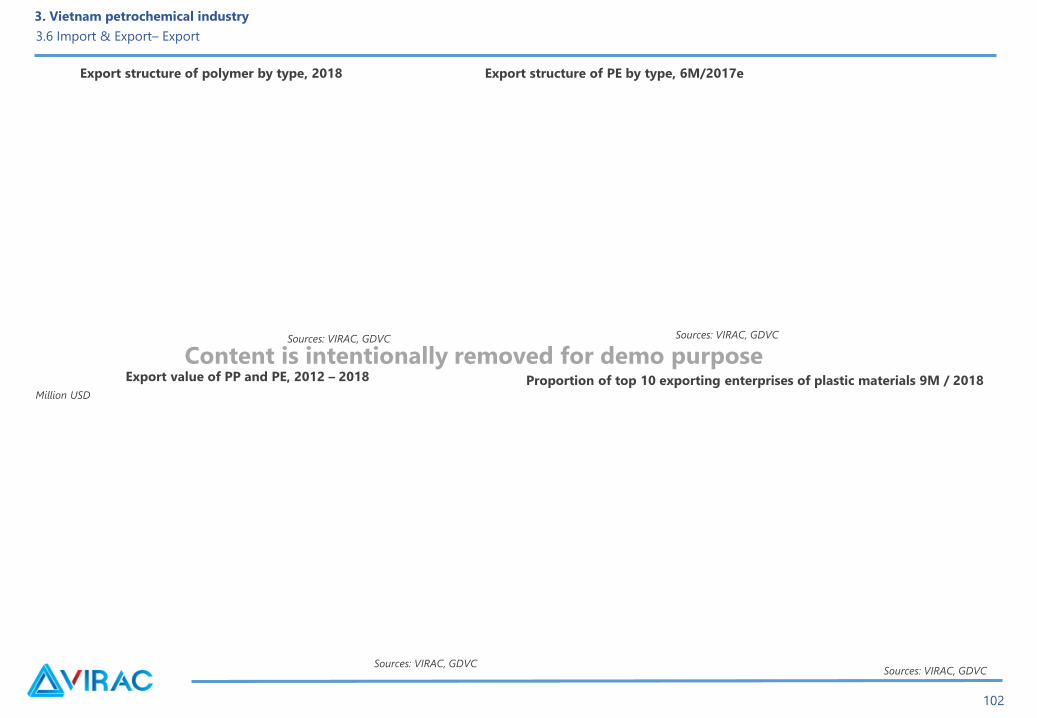
Sources: VIRAC, GDVC
Million USD
Export value of PP and PE, 2012 – 2018
Sources: VIRAC, GDVC
Export structure of PE by type, 6M/2017e
Sources: VIRAC, GDVC
Sources: VIRAC, GDVC
Export structure of polymer by type, 2018
Proportion of top 10 exporting enterprises of plastic materials 9M / 2018
Content is intentionally removed for demo purpose
3. Vietnam petrochemical industry
3.6 Import & Export– Export
103
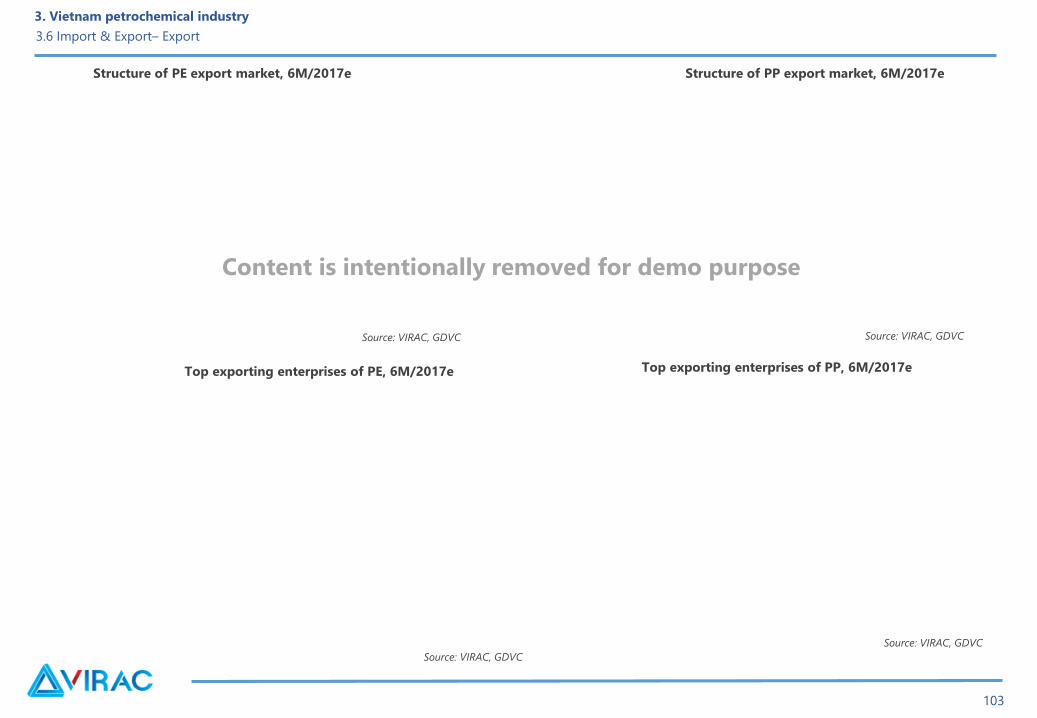
Structure of PE export market, 6M/2017e Structure of PP export market, 6M/2017e
Top exporting enterprises of PE, 6M/2017e Top exporting enterprises of PP, 6M/2017e
Source: VIRAC, GDVC Source: VIRAC, GDVC
Source: VIRAC, GDVC
Source: VIRAC, GDVC
3. Vietnam petrochemical industry
3.6 Import & Export– Export
Content is intentionally removed for demo purpose
104
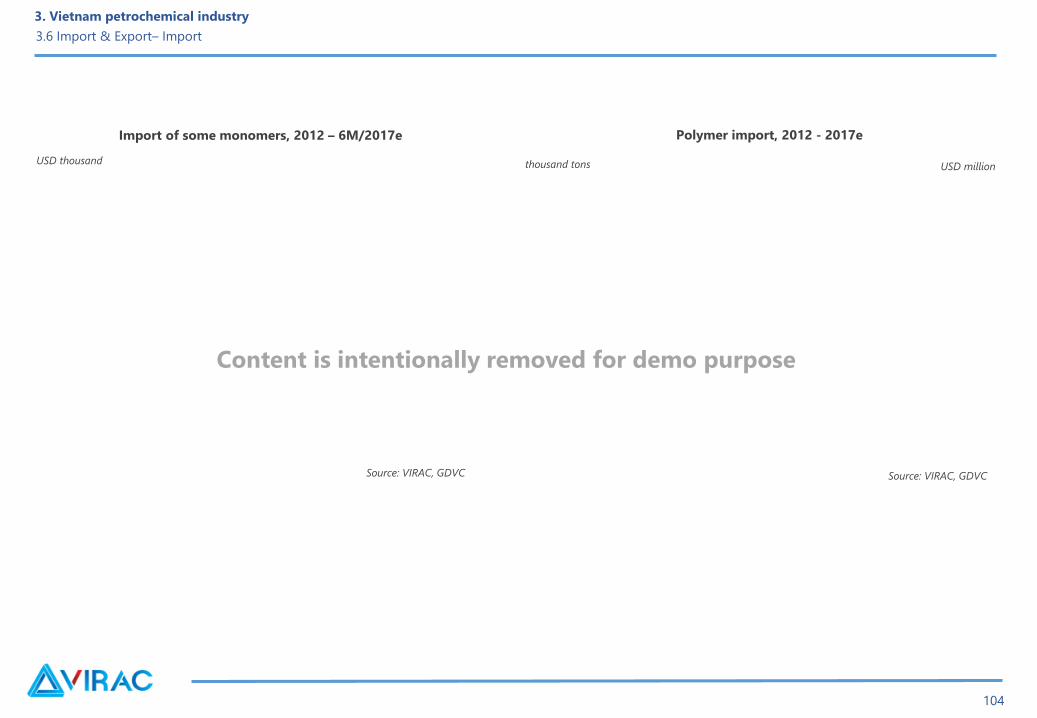
thousand tons
Polymer import, 2012 - 2017e
USD million
Import of some monomers, 2012 – 6M/2017e
Source: VIRAC, GDVC
USD thousand
3. Vietnam petrochemical industry
3.6 Import & Export– Import
Source: VIRAC, GDVC
Content is intentionally removed for demo purpose
105
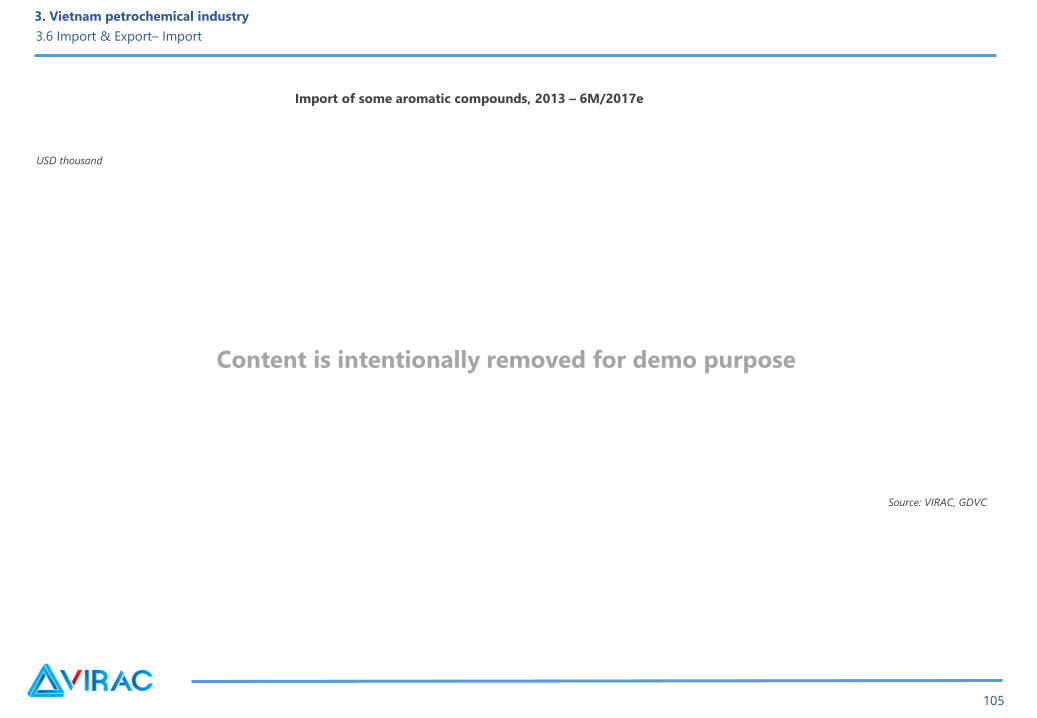
Import of some aromatic compounds, 2013 – 6M/2017e
USD thousand
Source: VIRAC, GDVC
3. Vietnam petrochemical industry
3.6 Import & Export– Import
Content is intentionally removed for demo purpose
106
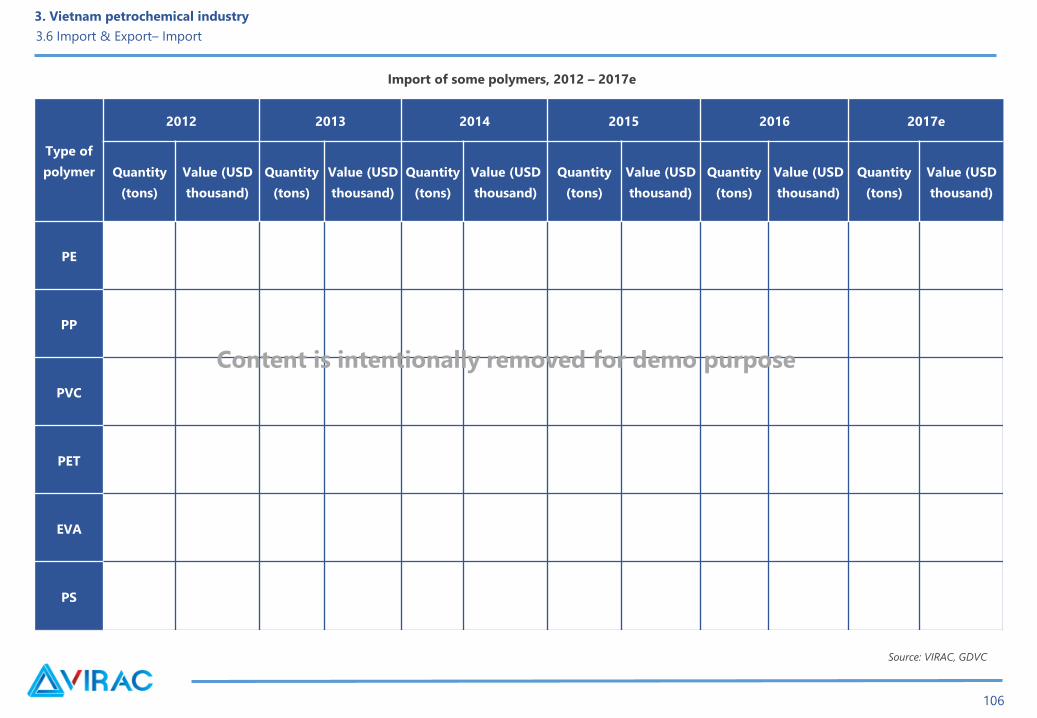
Import of some polymers, 2012 – 2017e
Type of
polymer
2012 2013 2014 2015 2016 2017e
Quantity
(tons)
Value (USD
thousand)
Quantity
(tons)
Value (USD
thousand)
Quantity
(tons)
Value (USD
thousand)
Quantity
(tons)
Value (USD
thousand)
Quantity
(tons)
Value (USD
thousand)
Quantity
(tons)
Value (USD
thousand)
PE
PP
PVC
PET
EVA
PS
3. Vietnam petrochemical industry
3.6 Import & Export– Import
Source: VIRAC, GDVC
Content is intentionally removed for demo purpose

107
Sources: VIRAC, GDVCSources: VIRAC, GDVC
• PE and PP continue to be the most imported types in 2018.
Proportion of top importing enterprises of plastic raw materials, 9M/2018 Import structure of polymer by type, 2018
3. Vietnam petrochemical industry
3.6 Import & Export– Import
Content is intentionally removed for demo purpose
108
Source: VIRAC, GDVC
PE import market, 6M/2017e
PP import market, 6M/2017e
Import structure of PE by type, 6M/2017e
3. Vietnam petrochemical industry
3.6 Import & Export– Import
Source: VIRAC, GDVC
Source: VIRAC, GDVC
Content is intentionally removed for demo purpose
109
Source: VIRAC, EuroMonitor
Growth in beverage and food packaging, 2013 - 2020f
3. Vietnam petrochemical industry
3.6 Import & Export– Import
Content is intentionally removed for demo purpose
110
Top of PE importing enterprises, 6M/2017e
Top of PP importing enterprises, 6M/2017e
3. Vietnam petrochemical industry
3.6 Import & Export– Import
Source: VIRAC, GDVC
Source: VIRAC, GDVC
Content is intentionally removed for demo purpose
111
Content
3. Vietnam petrochemical industry
3.1 History of Vietnam petrochemical industry
3.2 Position of Vietnam petrochemical industry
3.3 Input materials
3.4 Production
3.5 Consumption
3.6 Import- Export
3.7 Price movement
112
3. Vietnam petrochemical industry
3.7 Price movement
Source: VIRAC, ChemOrbis Price Wizard
Polymer domestic price movement, 7/2016 – 6/2017USD/ton
Content is intentionally removed for demo purpose
113
Content
4. Risk analysis
4.1 Industry risk
4.2 SWOT analysis
114
Risk of policy and law
Risk of exchange rate and interest rate
4. Risk analysis
4.1 Industry risk
Content is intentionally removed for demo purpose
115
Risk of environmental pollution
Risk of imput material price
Risk of economic integration
Economical risk
4. Risk analysis
4.1 Industry risk
Content is intentionally removed for demo purpose
116
Risk of competition
Risk of product supply and demand
4. Risk analysis
4.1 Industry risk
Content is intentionally removed for demo purpose
117
Content
4. Risk analysis
4.1 Industry risk
4.2 SWOT analysis
S W
O T118
4. SWOT analysis
Content is intentionally removed for demo purpose
119
Content
5. Industry planning
5.1 Oil & gas industry planning
5.2 Petrochemical industry planning
5.3 Chemical industry planning
120
in terms of sector development, including the development of petrochemicals to develop oil consumption
market.
5. Industry planning
5.1 Oil & gas industry planning
Content is intentionally removed for demo purpose
121
Content
5. Industry planning
5.1 Oil & gas industry planning
5.2 Petrochemical industry planning
5.3 Chemical industry planning
122
According to Decision No. 1621 / QD-TTg of the Prime Minister promulgated on September 18, 2013 approving the development plan of chemical industry
of Vietnam to 2020, by 2030,
5. Industry planning
5.1 Petrochemical industry planning
Content is intentionally removed for demo purpose
123
Source: VIRAC, MOIT
No Project Place
Investment information
Capacity (1.000
ton/year)
Investment capital
(USD million)Time of investment
Oil refinery projects, 2011 - 2020
5. Industry planning
5.1 Petrochemical industry planning
Content is intentionally removed for demo purpose
124
Content
5. Industry planning
5.1 Oil & gas industry planning
5.2 Petrochemical industry planning
5.3 Chemical industry planning
125
According to Decision No. 1621 / QD-TTg of the Prime Minister promulgated on September 18, 2013 approving the development plan of chemical industry
of Vietnam to 2020, by 2030.
5. Industry planning
5.3 Chemical industry planning
Content is intentionally removed for demo purpose
126
5. Industry planning
5.3 Chemical industry planning
Content is intentionally removed for demo purpose

127
5. Industry planning
5.3 Chemical industry planning
Content is intentionally removed for demo purpose
128
Ministry of Industry and Trade promulgated Decision No. 8989 / QD-BCT dated 25/08/2015 approving the project of restructuring Vietnam's chemical
industry,
5. Industry planning
5.3 Chemical industry planning
Content is intentionally removed for demo purpose
129
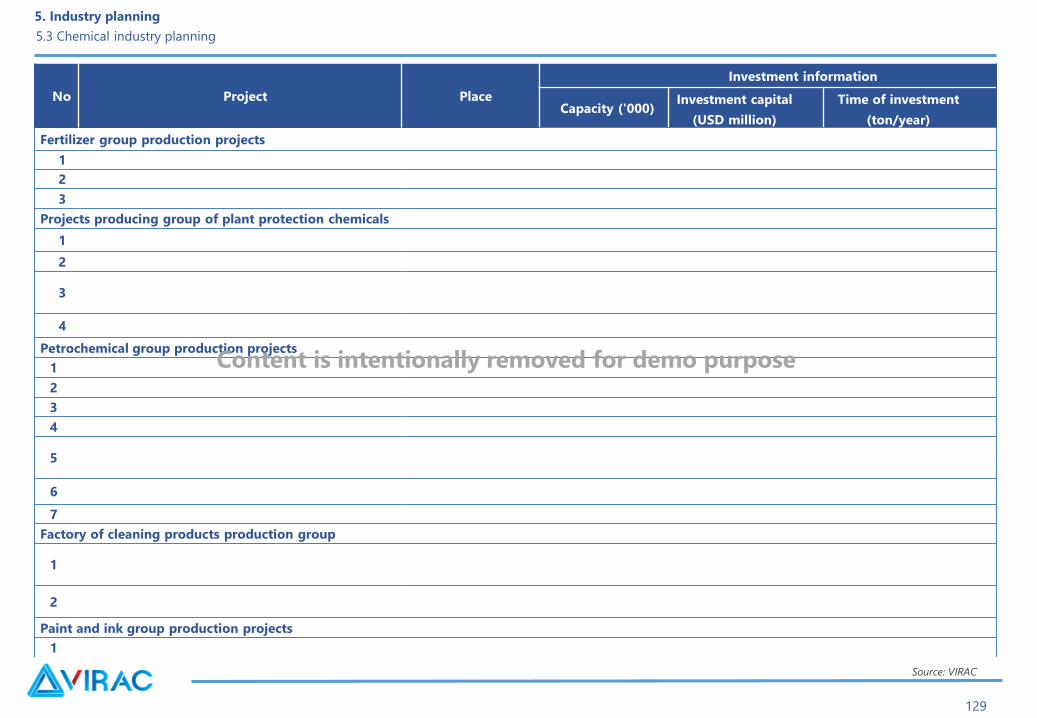
No Project Place
Investment information
Capacity ('000)Investment capital
(USD million)
Time of investment
(ton/year)
Fertilizer group production projects
1
2
3
Projects producing group of plant protection chemicals
1
2
3
4
Petrochemical group production projects
1
2
3
4
5
6
7
Factory of cleaning products production group
1
2
Paint and ink group production projects
1
Source: VIRAC
5. Industry planning
5.3 Chemical industry planning
Content is intentionally removed for demo purpose
130
Content
6. Outlooks and forecasts
6.1 Outlooks
6.2 Forecasts
131
• Petrochemical products are useful materials but also dangerous and toxic chemicals for humans and ecosystems.
Content is intentionally removed for demo purpose
Outlooks and forecasts
6.1 Outlooks – Global petrochemical industry
132
Over the next 20 to 30 years, the world's petrochemical refining industry will develop with particular trends.
Outlooks and forecasts
6.1 Outlooks – Global petrochemical industry
Content is intentionally removed for demo purpose
133
Forecasts for GDP growth and some industries, 2014 - 2018f
%
Source: VIRAC, World Bank GSO
6. Outlooks and forecasts
6.1 Outlooks – Vietnam petrochemical industry
Content is intentionally removed for demo purpose
134
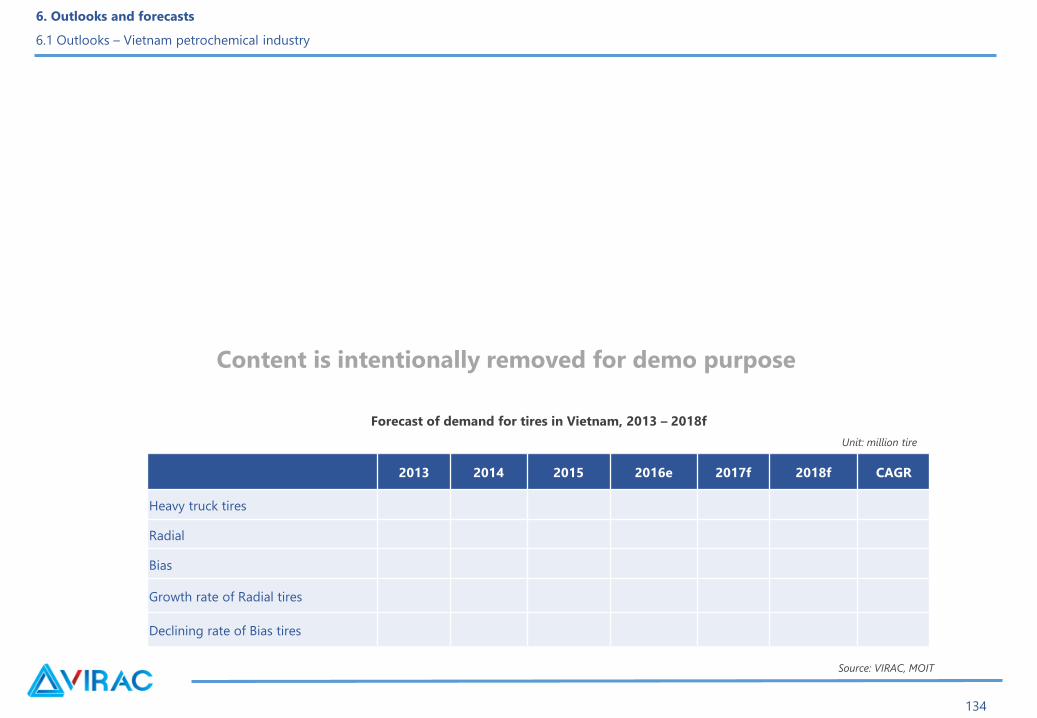
Source: VIRAC, MOIT
2013 2014 2015 2016e 2017f 2018f CAGR
Heavy truck tires
Radial
Bias
Growth rate of Radial tires
Declining rate of Bias tires
Forecast of demand for tires in Vietnam, 2013 – 2018f
Unit: million tire
6. Outlooks and forecasts
6.1 Outlooks – Vietnam petrochemical industry
Content is intentionally removed for demo purpose
135
Content
6. Outlooks and forecasts
6.1 Outlooks
6.2 Forecasts
136
6. Outlooks and forecasts
6.2 Forecasts – Global chemical industry
Source: VIRAC, IHS
Growth of global PP and PE consumption demand, 2014 - 2019
Content is intentionally removed for demo purpose
137
• Petrochemical projects beginning in the period 2015-2017 in the United States, China, Russia and the Middle East will significantly increase the
capacity of polymer production.
6. Outlooks and forecasts
6.2 Forecasts – Global chemical industry
Content is intentionally removed for demo purpose
138
Capacity to produce some basic chemicals (Ethylene, Propylene, Methanol, Benzene, Paraxylene, Chlorine)
Region 2015 2025f Change
Source: VIRAC, IHS
Content is intentionally removed for demo purpose
6. Outlooks and forecasts
6.2 Forecasts – Global chemical industry
139
Source: VIRAC tổng hợp
Project Place Investment capitalCapacity of petrochemical refining
(Million tons/year)
Some petrochemical refining projects are being implemented in Vietnam, 2010 - 2020
Content is intentionally removed for demo purpose
6. Outlooks and forecasts
6.2 Forecasts – Global chemical industry
140
Forecast of production capacity of PP and PVC, 2016 – 2021f
thousand tons/year
Source: VIRAC
Content is intentionally removed for demo purpose
6. Outlooks and forecasts
6.2 Forecasts – Global chemical industry

141
Content
7. Enterprises analysis
7.1 Enterprises introduction
7.2 Financial analysis
142
7. Enterprises analysis
7.1 Enterprises introduction
No Company Main productCapacity
(ton/year)
Net revenue in 2016
(VND billion)
Total asset in 2016
(VND billion)
1
2
3
4
5
Top of large company in Vietnam petrochemical industry
Source: VIRAC, VPAS
Content is intentionally removed for demo purpose
143
Binh Son Refining and Petrochemical Company Limited
7. Enterprises analysis
7.1 Enterprises introduction
Content is intentionally removed for demo purpose
144
Formosa Hung Nghiep Company Limited
7. Enterprises analysis
7.1 Enterprises introduction
Content is intentionally removed for demo purpose
145
TPC VINA Plastics and Chemicals Company Limited
7. Enterprises analysis
7.1 Enterprises introduction
Content is intentionally removed for demo purpose
146
AGC Vietnam Chemicals Limited Company
Vietnam Polystyrene Limited Company
7. Enterprises analysis
7.1 Enterprises introduction
Content is intentionally removed for demo purpose
147
Content
7. Enterprises analysis
7.1 Enterprises introduction
7.2 Financial analysis
148
7. Enterprises analysis
7.2 Financial analysis
Net revenue, 2015 - 2016
Gross profit, 2015 - 2016VND billion
Source: VIRAC
Source: VIRAC
VND billion
Content is intentionally removed for demo purpose
149
Gross profit margin, 2015 - 2016
7. Enterprises analysis
7.2 Financial analysis
Source: VIRAC
Content is intentionally removed for demo purpose
150
Solvency, 2015 - 2016
7. Enterprises analysis
7.2 Financial analysis
Source: VIRACContent is intentionally removed for demo purpose

151
Time
Ability to repay, 2016
7. Enterprises analysis
7.2 Financial analysis
Source: VIRAC
Content is intentionally removed for demo purpose
152
Source: VIRAC
Fixed asset turnover, 2015 - 2016
Total asset turnover, 2015 - 2016
7. Enterprises analysis
7.2 Financial analysis
Source: VIRAC
Content is intentionally removed for demo purpose
153
7. Enterprises analysis
7.2 Financial analysis
Source: VIRAC
VND billion
Source: VIRAC
VND billion Costs of sales, 2015 - 2016
Enterprise cost management, 2015 - 2016
Nội dung được xóa nhằm mục đích demo
154
Profitability ratio, 2015 - 2016
7. Enterprises analysis
7.2 Financial analysis
Source: VIRACContent is intentionally removed for demo purpose
155
Content
Appendix of financial statements

156
Appendix- Financial Statement
Binh Son Refining and Oil Company Limited
BALANCE SHEET
Unit: VND 2015 2016
A. CURRENT ASSETS
I. Cash and cash equivalents
II. Short-term investments
III. Short-term receivables
1. Inventories
2. Other current assets
B. NON – CURRENT ASSETS
I. Fixed assets
II. Long-term investment
TOTAL ASSETS
A. LIABILITIES
I. Current liabilities
II. Non – current liabilities
B. OWNER’S EQUITY
I. Owner’s equity
II. Share premium
III. Undistributed earnings
TOTAL LIABILITIES AND OWNER’S EQUITY
INCOME STATEMENT
Unit: VND 2015 2016
Net revenue
Costs of goods sold
Gross profit
Financial income
Financial expenses
Selling expenses
General and administrative expenses
Net profit from operating activities
Accounting profit before tax
Net profit after corporate income tax
Profit after tax for shareholders of the parent
company
Basic earning per share (VND)
CASH FLOWS STATEMENT
Unit: VND 2015 2016
I. Cash flows from operating activities
Net cash flows from operating activities
II. Cash flows from investing activities
Net cash flows from investing activities
III. Cash flows from financing activities
Net cash flows from financing activities
Net cash flows in the period
Cash and cash equivalents at beginning of the year
Cash and cash equivalents at the end of the year
Content is intentionally removed for demo purpose
157
Appendix- Financial Statement
Formosa Hung Nghiep Company Limited
BALANCE SHEET
Unit: VND 2015 2016
A. CURRENT ASSETS
I. Cash and cash equivalents
II. Short-term investments
III. Short-term receivables
1. Inventories
2. Other current assets
B. NON – CURRENT ASSETS
I. Fixed assets
II. Long-term investment
TOTAL ASSETS
A. LIABILITIES
I. Current liabilities
II. Non – current liabilities
B. OWNER’S EQUITY
I. Owner’s equity
II. Share premium
III. Undistributed earnings
TOTAL LIABILITIES AND OWNER’S EQUITY
INCOME STATEMENT
Unit: VND 2015 2016
Net revenue
Costs of goods sold
Gross profit
Financial income
Financial expenses
Selling expenses
General and administrative expenses
Net profit from operating activities
Accounting profit before tax
Net profit after corporate income tax
Profit after tax for shareholders of the parent
company
Basic earning per share (VND)
CASH FLOWS STATEMENT
Unit: VND 2015 2016
I. Cash flows from operating activities
Net cash flows from operating activities
II. Cash flows from investing activities
Net cash flows from investing activities
III. Cash flows from financing activities
Net cash flows from financing activities
Net cash flows in the period
Cash and cash equivalents at beginning of the year
Cash and cash equivalents at the end of the year
Content is intentionally removed for demo purpose

158
Appendix- Financial Statement
TPC VINA Plastics and Chemicals Company Limited
BALANCE SHEET
Unit: VND 2015 2016
A. CURRENT ASSETS
I. Cash and cash equivalents
II. Short-term investments
III. Short-term receivables
1. Inventories
2. Other current assets
B. NON – CURRENT ASSETS
I. Fixed assets
II. Long-term investment
TOTAL ASSETS
A. LIABILITIES
I. Current liabilities
II. Non – current liabilities
B. OWNER’S EQUITY
I. Owner’s equity
II. Share premium
III. Undistributed earnings
TOTAL LIABILITIES AND OWNER’S EQUITY
INCOME STATEMENT
Unit: VND 2015 2016
Net revenue
Costs of goods sold
Gross profit
Financial income
Financial expenses
Selling expenses
General and administrative expenses
Net profit from operating activities
Accounting profit before tax
Net profit after corporate income tax
Profit after tax for shareholders of the parent
company
Basic earning per share (VND)
CASH FLOWS STATEMENT
Unit: VND 2015 2016
I. Cash flows from operating activities
Net cash flows from operating activities
II. Cash flows from investing activities
Net cash flows from investing activities
III. Cash flows from financing activities
Net cash flows from financing activities
Net cash flows in the period
Cash and cash equivalents at beginning of the year
Cash and cash equivalents at the end of the year
Content is intentionally removed for demo purpose

159
Appendix- Financial Statement
AGC Vietnam Chemicals Limited Company
BALANCE SHEET
Unit: VND 2015 2016
A. CURRENT ASSETS
I. Cash and cash equivalents
II. Short-term investments
III. Short-term receivables
1. Inventories
2. Other current assets
B. NON – CURRENT ASSETS
I. Fixed assets
II. Long-term investment
TOTAL ASSETS
A. LIABILITIES
I. Current liabilities
II. Non – current liabilities
B. OWNER’S EQUITY
I. Owner’s equity
II. Share premium
III. Undistributed earnings
TOTAL LIABILITIES AND OWNER’S EQUITY
INCOME STATEMENT
Unit: VND 2015 2016
Net revenue
Costs of goods sold
Gross profit
Financial income
Financial expenses
Selling expenses
General and administrative expenses
Net profit from operating activities
Accounting profit before tax
Net profit after corporate income tax
Profit after tax for shareholders of the parent
company
Basic earning per share (VND)
CASH FLOWS STATEMENT
Unit: VND 2015 2016
I. Cash flows from operating activities
Net cash flows from operating activities
II. Cash flows from investing activities
Net cash flows from investing activities
III. Cash flows from financing activities
Net cash flows from financing activities
Net cash flows in the period
Cash and cash equivalents at beginning of the year
Cash and cash equivalents at the end of the year
Content is intentionally removed for demo purpose
160
Appendix- Financial Statement
Vietnam Polystyrene Limited Company
BALANCE SHEET
Unit: VND 2015 2016
A. CURRENT ASSETS
I. Cash and cash equivalents
II. Short-term investments
III. Short-term receivables
1. Inventories
2. Other current assets
B. NON – CURRENT ASSETS
I. Fixed assets
II. Long-term investment
TOTAL ASSETS
A. LIABILITIES
I. Current liabilities
II. Non – current liabilities
B. OWNER’S EQUITY
I. Owner’s equity
II. Share premium
III. Undistributed earnings
TOTAL LIABILITIES AND OWNER’S EQUITY
INCOME STATEMENT
Unit: VND 2015 2016
Net revenue
Costs of goods sold
Gross profit
Financial income
Financial expenses
Selling expenses
General and administrative expenses
Net profit from operating activities
Accounting profit before tax
Net profit after corporate income tax
Profit after tax for shareholders of the parent
company
Basic earning per share (VND)
CASH FLOWS STATEMENT
Unit: VND 2015 2016
I. Cash flows from operating activities
Net cash flows from operating activities
II. Cash flows from investing activities
Net cash flows from investing activities
III. Cash flows from financing activities
Net cash flows from financing activities
Net cash flows in the period
Cash and cash equivalents at beginning of the year
Cash and cash equivalents at the end of the year
Content is intentionally removed for demo purpose
REPORT DISCLAIMER
161
REPORT DISCLAIMER
This document has been prepared in good faith on the basis of information available at the date of publication without any independent verification. VIRAC has
produced this report for private circulation to professional clients only. All information and statistical data herein have been obtained from sources we believe to
be reliable and made to ensure the accuracy of the contents of the pages of the report at the time of preparation. Such information has not been independently
verified and VIRAC makes no representation or warranty, whether express or implied, of any kind with respect to the document and its contents, information and
materials. The content found in this report is proprietary to VIRAC and is provided solely for your personal and non-commercial use. You agree that you will not
use this report for any purpose that is unlawful and that you will not reproduce the report or redistribute it outside your organisation, or place it on a website for
public access without the express written permission of VIRAC.
SHOULD YOU NEED ANY ASSISTANCE, PLEASE CONTACT US:
VIETNAM INDUSTRY RESEARCH AND CONSUTANT (VIRAC JSC.,)
6th Floor, Anh Minh Building, 36 Hoang Cau, O Cho Dua, Dong Da, Hanoi, Vietnam
Website: http://virac.com.vn/
Email: [email protected] | Tel: +84 463289520

Thank you !
162