Embed Size (px)
Citation preview

1
5 December 2017
Victrex plc – Preliminary Results 2017
‘Strong core growth & record cash generation’
Victrex plc, an innovative world leader in high performance polymer solutions, today announces its
preliminary results for the 12 months ended 30 September 2017.
FY 2017 FY 2016 % change
Group sales volumes 3,992 tonnes 3,952 tonnes +1%
Group revenue £290.2m £252.3m +15%
Gross profit £183.8m £158.7m +16%
Gross margin 63.3% 62.9% +40 bps
Profit before tax
(PBT)
£111.0m £100.3m +11%
EPS 116.4p 96.8p +20%
Dividend per share
(regular & special
dividend)
121.80p 46.82p +160%
Highlights:
• Strong core business* growth, fully offsetting lower Consumer Electronics
– Core business volumes up >15% reflecting broad based growth & new applications
– Total sales volumes up 1%
– Group revenue up 15%, constant currency revenue* up 3%
– Strong performances in Automotive, Electronics (ex-Consumer), Value Added Resellers, Energy
• Further progress in new product pipeline
– PEEK Gears supply agreement to major European car manufacturer starting in 2018
– Meaningful revenue of £1m+ for PEEK-OPTIMATM
HA-Enhanced Spine product
– Medium term aspiration for 10-20% of sales from new products* (2017: 4%)
• Investment to underpin Polymer & Parts strategy
– £10m acquisition of Zyex PEEK fibres business to expand semi-finished products offering
– TxV Aero Composites joint-venture to develop differentiated Aerospace products
– £10m Polymer Innovation Centre now operational; support prototyping & new polymer grades
• Record cash generation supports strong shareholder returns
– Cash up 88% to £120.1m and operating cash conversion* of 124%
– Regular dividend up 15% to 53.80p (dividend cover 2.2x*), special dividend of 68.00p/share
Jakob Sigurdsson, Chief Executive of Victrex, said: “This has been a good year for Victrex, with the strength
and broad based growth in our core business fully offsetting the expected and significant reduction in
Consumer Electronics volumes.
“Our pipeline of new products – both our core application pipeline and our mega-programmes – remains
strong and our aspiration to deliver 10-20% of sales from new products in the medium term is unchanged.
Our Polymer & Parts strategy is already differentiating Victrex in a competitive market and whilst several of
our mega-programmes will take time to be adopted, we made good progress this year in Gears, in
Aerospace Brackets and in our next generation Spine product. We are also closing in on a major OEM
agreement in Dental.
“Whilst growth investment remains the priority for Victrex and we will continue to focus on partnerships,
alliances and acquisition opportunities to help accelerate our growth programmes, our ability to deliver
strong returns provides an additional attraction. With strong earnings growth and cash generation, the Board
Victrex plc Preliminary Results 2017 2
is proposing a 15% increase to our regular dividend and a special dividend of 68p, with a combined dividend
per share of 121.8p.
“Looking forward, we have started our new financial year with positive growth momentum. Whilst Sterling
has strengthened over recent months, currency is still supportive for the year ahead, although not at the
levels seen in 2017. We remain focused on driving growth, on cost efficiency and making progress in
delivering our Polymer & Parts strategy.”
* Alternative performance measures are marked with an asterisk and defined on page 19.
About Victrex:
Victrex is an innovative world leader in high performance polymer solutions, focused on the strategic markets
of automotive, aerospace, energy (including manufacturing & engineering), electronics and medical. Every
day, millions of people use products and applications, which contain our materials – from smart phones,
aeroplanes and cars to oil and gas operations and medical devices. With over 35 years’ experience, we
develop world leading solutions in PEEK and PAEK based polymers, semi-finished and finished parts which
shape future performance for our customers and our markets, and drive value for our shareholders. Find out
more at www.victrexplc.com
A presentation for investors and analysts will be held at 9.30am (BST) this morning at JP Morgan, 1 John
Carpenter Street, London EC4Y 0JP. A conference call facility will be available for analysts and investors who are
unable to attend the presentation. To register, dial +44 (0) 203 139 4830 and participant pin 51747115. The
presentation can be viewed on Victrex's website at www.victrexplc.com.
Enquiries:
Victrex plc:
Andrew Hanson, Director of Investor Relations & Corporate Communications
+44 (0) 7809 595831
Louisa Burdett, Group Finance Director
+44 (0) 1253 897700
Jakob Sigurdsson, Chief Executive
+44 (0) 1253 897700
Teneo Blue Rubicon:
Charles Armitstead
+44 (0) 207 260 2700

Victrex plc Preliminary Results 2017 3
Preliminary results statement for the 12 months ended 30 September 2017
‘Strong core growth & record cash generation’
Group financial results
Strong core business (ex-Consumer Electronics) volumes up >15%
The strong growth in our core business offset the expected year on year impact of significantly lower
Consumer Electronics volumes. Total Group sales volume of 3,992 tonnes was 1% ahead of the prior year
(2016: 3,952 tonnes). Excluding volumes from the large Consumer Electronics order, core business growth
was over 15% ahead.
Our second half year saw a tougher comparative, reflecting that volumes from the large Consumer
Electronics order were heavily H2 weighted during 2016. Despite this challenge, H2 2017 Group volumes of
2,133 tonnes were only 2% lower than the second half of 2016 (H2 2016: 2,182 tonnes), underlining the
strength and diversity in our core business.
Our Industrial division (VPS) reported revenues of £236.3m, 17% ahead of the prior year (2016: £201.5m),
supported by currency. Market growth was broad based, with Automotive, Electronics (ex-Consumer), Value
Added Resellers – driven partly by indirect business into the Automotive and Industrial markets – and Energy
being particularly strong, offsetting a weaker performance in Aerospace in the second half of this year,
principally driven by phasing of new models.
Medical (Invibio) revenues were £53.9m, 6% ahead of the prior year (2016: £50.8m), reflecting currency.
Whilst the US Spine market remains mature, progress outside of the US in Europe, as we diversify our
Medical business away from just being US focused, continues to be positive. Spine revenue overall was down
1% although we enjoyed good progress with our next generation Spine product, PEEK-OPTIMATM
HA
Enhanced, which delivered over £1m of revenue this year. We anticipate further growth and progress towards
our next milestone in 2018.
Revenue 15% ahead; 3% ahead in constant currency
Group revenue for 2017 was £290.2m, 15% ahead of the prior year (2016: £252.3m). Group revenue in
constant currency was 3% ahead of the prior year (2016: £282.8m in constant currency). Sales from new
products (one of our strategic KPIs), were £10.7m, or 4% of Group revenues. Our aspiration is to drive sales
from new products up to 10-20% of Group revenues over the medium term. This includes sales from our
mega-programmes and new differentiated polymer grades (sales from new products includes new grades or
semi-finished products which commenced commercialisation from FY 2014 onwards).
Currency benefiting pricing
Our Average Selling Price (ASP) of £72.70kg was ahead of the prior year (2016: £63.80/kg), principally
reflecting currency benefits. Mix, with much lower Consumer Electronics volumes, offset by a muted
performance in Medical and a higher proportion of Value Added Resellers business, remained similar to
2016.
Underlying pricing in the core business remains broadly stable, with product mix being an important driver.
Competitive pressure remains however and our focus on differentiation and value added semi-finished
products will be a key driver of maintaining price over the coming years. Excluding Consumer Electronics
volumes and the impact of foreign currency, our average selling price in 2017 was £65/kg (2016: £68/kg),
which reflects a higher proportion of Value Added Resellers and a muted performance in Medical.
Looking into 2018, with a further, but reduced, benefit from currency, our expectations are for full year ASP
to be slightly ahead of 2017.
Gross margin
Group gross margin of 63.3% (2016: 62.9%) was marginally ahead of the prior year, but slightly lower than
our full year expectations particularly given favourable currency movements. Two factors contributed to this.
Firstly, during 2017, there was a strong ramp in higher than anticipated demand during our second half and,
Victrex plc Preliminary Results 2017 4
after a degree of downsizing in the earlier part of the year, the business needed to deploy additional
resource quickly back into our operations team to meet this growth. This inevitably led to some inefficiencies
in ramp up and the need for air freighting of material. The impact of this on the margin should not reoccur.
Secondly, and as previously communicated, our strategy involves a transition to a higher cost of manufacture
– as we develop differentiated polymers and new grades and products to support our mega-programmes
and semi-finished products. This will continue to be a feature of our business model.
However, our strategy also offers the opportunity to capture a higher value share of each application (rather
than just the material share). Remaining focused on growing absolute profits, rather than solely focusing on
the gross margin percentage, remains a priority for Victrex.
Profit before tax up 11% and EPS 20% ahead
Group profit before tax (PBT) of £111.0m was 11% up on the prior year (2016: £100.3m). PBT in constant
currency – removing the effect of the Group’s profit linked bonus scheme, which did not pay out in 2016 –
was down approximately 2%, driven by the higher cost of manufacture and higher investment in the business
during the year.
Basic earnings per share of 116.4p was 20% ahead (2016: 96.8p per share), principally reflecting the
associated benefit to the Group’s tax rate following Victrex filing patents to reflect its unique chemistry and
intellectual property (IP) which qualified for the UK Government’s Patent Box scheme.
Volatile currency but still supportive for FY 2018
Currency provided a benefit of approximately £18m to our 2017 profits, weighted approximately 30:70 in H1
and H2. As a UK based exporter, and with a significant global revenue exposure, Victrex hedges currency up
to 12 months in advance. We are mindful that Sterling has been re-rating over recent months against some
of our selling currencies, meaning the benefit for 2018 will be lower than that seen in 2017. All hedging
placed for 2018 is based on post-Brexit deals. With over 80% hedging now in place for 2018, the anticipated
currency benefit is expected to be more than £10m.
Brexit
Management continues to consider the potential impact of Brexit on its business. Based on our assessment
of the available information, the largest risk is a sustained period when the Group may not be able to import
certain raw materials or export finished goods through Customs, which could curtail sales if regional
inventory levels were depleted. To mitigate such a risk, the Group is assessing additional global warehousing
and the potential opportunities from measures to improve import and export processes, such as Authorised
Economic Operator status. In the short term, Brexit has provided, and continues to provide, a currency
benefit. If sterling remains weak, this upside could compensate for any additional tariffs. However, at this
stage, there remains considerable uncertainty as to the overall net impact on the business from Brexit after
March 2019. The Directors’ focus on Brexit is to ensure that the Group remains in the best position to ensure
continuity of supply on raw materials and access for our products to key markets.
Cost focus; support “front end” investment
Victrex remains fully focused on being cost competitive in our manufacturing. As communicated earlier in the
year, we are evaluating some potential cost opportunities in our supply chain, whilst ensuring that we retain
the differentiators in our polymer chemistry and manufacturing process.
As we move further downstream to add semi-finished and finished products to our portfolio, we will continue
to invest to drive the “burden of proof” for these products.
Overheads were up 24% to £72.7m (2016: £58.4m) which reflects higher front-end investment, as well as the
Group’s profit growth linked bonus scheme and LTIPs (which did not pay out during 2016). The Group also
incurred £2.0m of restructuring costs from business reorganisation during the first half of 2017. Research &
Development investment was £14.5m (2016: £14.1m), representing approximately 5% of Group revenue.

Victrex plc Preliminary Results 2017 5
Investment to support long term growth
During the year we announced an investment in a new joint venture, TxV Aero Composites, where Victrex
and Tri-Mack Plastics will team up to manufacture, at scale, differentiated Loaded Brackets for the Aerospace
market. We anticipate the capital investment, for a new US manufacturing facility, will be in the region of
£10m, with approximately half committed during 2017, alongside some incremental overhead investment.
Construction of our new facility and recruitment to support it is progressing well. Commissioning is on track
for the second half of 2018, with the first ‘parts’ available for supply.
Victrex also announced the acquisition of Zyex, a UK based PEEK fibres business, for approximately £10m.
Zyex is recognised as a global leader in the manufacture of PEEK fibres for the Aerospace, Industrial and
Automotive markets. Examples of product applications include fuel filters for Automotive and food
processing belts for Industrial. We have made good progress integrating Zyex and are focused on improving
efficiency within the business, as well as the significant opportunity to build this new product form as a
platform to translate globally.
Our other recent investments were in Magma (our Oil & Gas mega-programme) where we acquired a
minority equity stake; and in our world class Polymer Innovation Centre at our UK headquarters, which
supports the ability to scale up or test new polymer grades or applications – a key role for our downstream
Polymer & Parts strategy – and supports process improvement for existing products. M&A, joint-ventures,
acquisitions or organic investments remain very much in focus and with our cash resources, we will continue
to consider appropriate investments which can help accelerate progress in our pipeline.
For organic investment, our expectations of medium term capital expenditure in the £25m-£35m per annum
range are unchanged but in the short term, we anticipate this will now be closer to a £20m per annum level.
Total capital expenditure for the year was £16.7m (2016: £25.9m).
Progress in our development pipeline
Victrex has a strong core application development pipeline. In our core business, we benefited from some
new and incremental applications during the year. These include home appliance applications in Electronics,
business machines and fluid handling systems in Manufacturing & Engineering (which reports under Energy
& Other Industrial). New and incremental applications in the wider Electronics market offer us good medium
term opportunities.
In our medium to longer term pipeline, Victrex has six mega-programmes of Dental, Victrex Pipe/Magma,
Trauma, Knee, Gears and Aerospace Loaded Brackets, as well as some smaller opportunities such as PEEK-
OPTIMATM
HA Enhanced for the Spine market.
Good progress was made this year in Gears, where we have a first supply agreement to a major European
automotive manufacturer starting in early 2018. Thanks to the capabilities we acquired through the Kleiss
Gears acquisition, we are able to design, develop and manufacture gears. With a number of other Gear
development programmes also underway with major car manufacturers and in the industrial space, we
anticipate further progress, working in partnership, which will limit the need for significant capital outlay and
could reduce development time, whilst ensuring that Victrex retains the IP for development.
Aerospace Loaded Brackets also saw progress thanks to our TxV Aero Composites joint venture. Our AE
250TM
composites are pre-qualified with the major aerospace manufacturers and development of our US
parts manufacturing facility is well underway. Whilst our PEEK-OPTIMATM
HA-Enhanced programme in Spine
is now a major programme – reflecting the long term cannibalisation of existing PEEK-OPTIMATM
products –
progress has been good this year, with 28 global approvals and first meaningful revenues of over £1m
delivered slightly ahead of schedule.
Our other mega-programmes of Magma, Trauma, Dental and Knee continue to progress. Magma’s long term
proposition remains strong although the immediate focus continues on revenue from test orders or pipe for
intervention or jumper lines. The focus in our Trauma and Dental programmes is on partnerships and
collaborations to deliver market access, and we are closing in on a major OEM agreement in Dental.

Victrex plc Preliminary Results 2017 6
Strong balance sheet
Our strong balance sheet supports growth investment and provides security of supply to our customers. Net
assets at 30 September 2017 totalled £478.4m (2016: £389.1m). Stock levels were at £61.5m (2016: £61.8m),
reflecting strong demand alongside some of the early efficiency benefits from our ERP system being
implemented.
For the medium term, we continue to see some opportunities to reduce our inventory levels, but remain
mindful of the requirements, in the near term, to support the early development of more differentiated
products. Many of these differentiated polymers and downstream products, including parts, require either
minimum volume production campaigns or some initial stock build.
Victrex’s Revolving Credit Facility (RCF), which expired in September 2017, was replaced with a 5 year bank
facility of £40m, £20m committed and £20m accordion. The facility was undrawn at the year end.
Continued strong cash generation
Cash generated from operations was £137.4m (2016: £96.0m) representing an operating cash conversion
(cash generated from operations / operating profit) of 124% (2016: 96%). Net cash (with no debt) at 30
September 2017 was up 88% to £120.1m (2016: £64.0m).
This record cash performance was driven by a combination of strong trading, lower capital expenditure and
favourable working capital movements. Working capital improved due to receivables moving to a more
normalised level, following the weighting of Consumer Electronics volumes in Q4 2016.
In June 2017 we paid the interim dividend of 12.20p per share. Combined with the final 2016 dividend, paid
in February 2017, these totalled £40.4m (2016 dividends paid: £39.9m).
Taxation
The effective tax rate for the year was 10.4% (2016: 17.7%). This reflects the associated benefit of a materially
lower UK tax rate, following Victrex filing patents as part of its unique chemistry and IP which qualified under
the UK Government’s Patent Box scheme, which incentivises Research & Development investment in the UK.
As previously communicated, the patents, based on our unique chemistry, are expected to provide an
associated benefit to our tax rate, resulting in a normalised tax rate of approximately 12% from 2018. The
lower rate during 2017 reflects the additional patent box deduction relating back to the date the patent
application was made during 2016.
Dividends
Growth investment remains our top priority, whether that is capital expenditure or M&A, joint ventures or
partnerships. Our capital allocation policy is to grow the regular dividend broadly in line with earnings, whilst
maintaining cover around 2x. After this, and subject to no additional growth investment, Victrex will return
around 50% of the net cash balance to shareholders, via a special dividend, subject to a 50p/share minimum
level. The threshold for payment of a special dividend is approximately £85m of net cash. With capital
expenditure reducing from historic levels, and reflecting the post-tax benefit to earnings and cash from
Patent Box, the opportunities for incremental returns are attractive.
For the full year, with Group profit before tax increasing by 11% and earnings per share increasing by 20%,
the final regular dividend will increase by 15% to 53.80p (2016: 46.82p) and will be supplemented by a special
dividend of 68.00p, following our cash balance reaching a record £120.1m. The special dividend of 68p/share
equates to a payout of approximately £58m, with the calculation excluding cash earmarked for investment in
our TxV Aero Composites joint-venture. Total dividends for the year were 121.80p (2016: 46.82p).
Audit tender process
The process to appoint a new external auditor took place during the year and we are pleased to have
announced PricewaterhouseCoopers LLP (“PwC”) as our Auditors starting from our FY 2018 financial year
(subject to approval at the 2018 AGM). The Board is grateful to KPMG for their lengthy service to Victrex.

Victrex plc Preliminary Results 2017 7
Our people
This has been a good year for Victrex, despite competitive markets, and on behalf of the Board, I would
like to thank each and every one of Victrex’s employees for their continued contribution.
Outlook
Looking forward, we have started our new financial year with positive growth momentum. Whilst Sterling has
strengthened over recent months, currency is still supportive for the year ahead, although not at the levels
seen in 2017. We remain focused on driving growth, on cost efficiency and making progress in delivering our
Polymer & Parts strategy.
Jakob Sigurdsson
Chief Executive
5 December 2017
Victrex plc Preliminary Results 2017 8
DIVISIONAL REVIEW
Industrial
12
months
12
months
Ended ended
30 Sept 30 Sept
2017 2016
£m £m Change
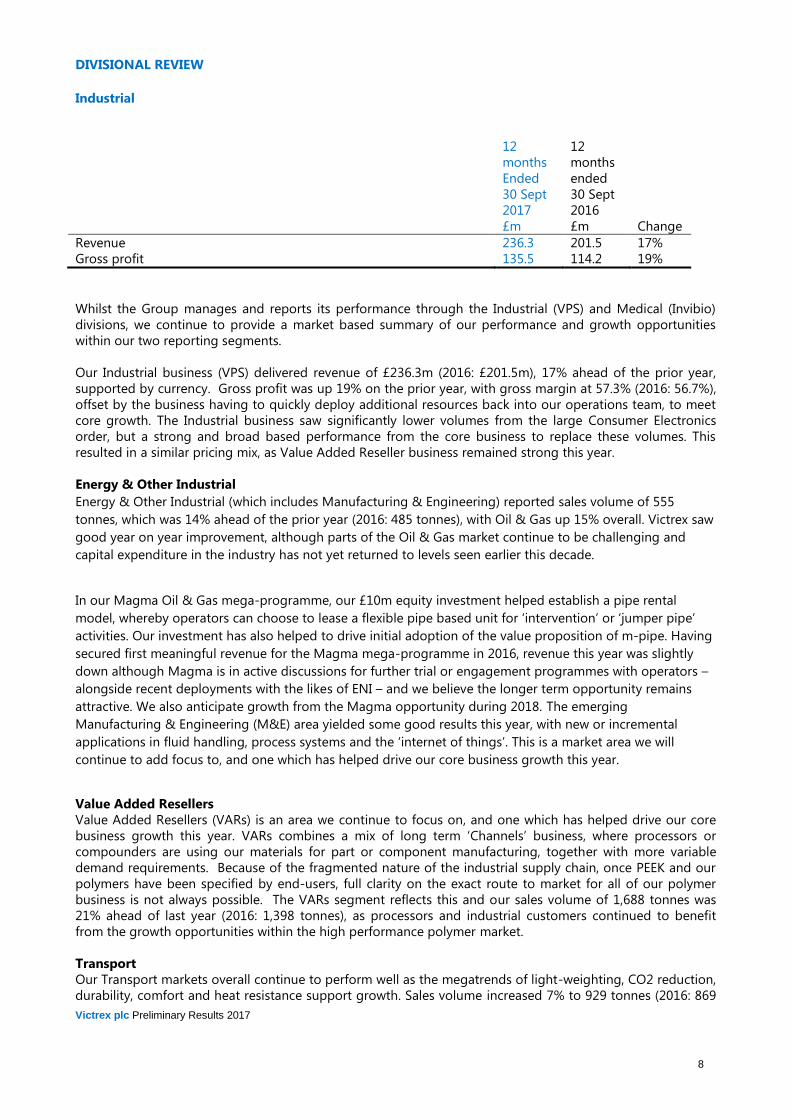
Revenue 236.3 201.5 17%
Gross profit 135.5 114.2 19%
Whilst the Group manages and reports its performance through the Industrial (VPS) and Medical (Invibio)
divisions, we continue to provide a market based summary of our performance and growth opportunities
within our two reporting segments.
Our Industrial business (VPS) delivered revenue of £236.3m (2016: £201.5m), 17% ahead of the prior year,
supported by currency. Gross profit was up 19% on the prior year, with gross margin at 57.3% (2016: 56.7%),
offset by the business having to quickly deploy additional resources back into our operations team, to meet
core growth. The Industrial business saw significantly lower volumes from the large Consumer Electronics
order, but a strong and broad based performance from the core business to replace these volumes. This
resulted in a similar pricing mix, as Value Added Reseller business remained strong this year.
Energy & Other Industrial
Energy & Other Industrial (which includes Manufacturing & Engineering) reported sales volume of 555
tonnes, which was 14% ahead of the prior year (2016: 485 tonnes), with Oil & Gas up 15% overall. Victrex saw
good year on year improvement, although parts of the Oil & Gas market continue to be challenging and
capital expenditure in the industry has not yet returned to levels seen earlier this decade.
In our Magma Oil & Gas mega-programme, our £10m equity investment helped establish a pipe rental
model, whereby operators can choose to lease a flexible pipe based unit for ‘intervention’ or ‘jumper pipe’
activities. Our investment has also helped to drive initial adoption of the value proposition of m-pipe. Having
secured first meaningful revenue for the Magma mega-programme in 2016, revenue this year was slightly
down although Magma is in active discussions for further trial or engagement programmes with operators –
alongside recent deployments with the likes of ENI – and we believe the longer term opportunity remains
attractive. We also anticipate growth from the Magma opportunity during 2018. The emerging
Manufacturing & Engineering (M&E) area yielded some good results this year, with new or incremental
applications in fluid handling, process systems and the ‘internet of things’. This is a market area we will
continue to add focus to, and one which has helped drive our core business growth this year.
Value Added Resellers
Value Added Resellers (VARs) is an area we continue to focus on, and one which has helped drive our core
business growth this year. VARs combines a mix of long term ‘Channels’ business, where processors or
compounders are using our materials for part or component manufacturing, together with more variable
demand requirements. Because of the fragmented nature of the industrial supply chain, once PEEK and our
polymers have been specified by end-users, full clarity on the exact route to market for all of our polymer
business is not always possible. The VARs segment reflects this and our sales volume of 1,688 tonnes was
21% ahead of last year (2016: 1,398 tonnes), as processors and industrial customers continued to benefit
from the growth opportunities within the high performance polymer market.
Transport
Our Transport markets overall continue to perform well as the megatrends of light-weighting, CO2 reduction,
durability, comfort and heat resistance support growth. Sales volume increased 7% to 929 tonnes (2016: 869
Victrex plc Preliminary Results 2017 9
tonnes), primarily driven by the strong performance in Automotive, with a slightly weaker performance in
Aerospace this year, primarily in the second half.
Automotive
In Automotive, growth was particularly strong, with volumes up 11%. Our core applications continue to offer
good global translation opportunities, and across manufacturers, in braking systems, transmission and
chassis applications. VictrexTM
PEEK is predominantly located within the vehicle powertrain and with a long
track record here, our focus is to increase the average volume to approximately 12 grams of PEEK per vehicle
over the medium term, compared to approximately 8 grams today.
Victrex’s value proposition is not just focused in the internal combustion engine (ICE) platform. The potential
from electric vehicles (EVs), whilst still emerging, with slot-liners and other applications, remains significant.
PEEK’s properties of durability, chemical, electrical and heat resistance play well here. Whilst EV opportunities
remain at a very early stage, early indications suggest a potential for over 100g per EV application and with
more “value” rather than simply “volume” business, we continue to work on several differentiated products in
this area.
Our Gears mega-programme has made good progress this year and reflects the demand for lower noise,
vibration and harshness (NVH), where PEEK gears based on VictrexTM
HPG PEEK can offer a 50% performance
benefit compared to metal gears, as well as the trend for CO2 reduction through weight & inertia reduction,
and quicker manufacturing compared to metal. A supply agreement for PEEK gears with a major European
car manufacturer commences in early 2018 and we have also added new development programmes with
several major car manufacturers. We are focused on driving this mega-programme towards a meaningful
(£1m+) revenue stage during the 2018 / 2019 period. Partnering with others to support a wider
manufacturing roll-out and reduce development time, whilst retaining the IP and development know-how,
will be a key part of this programme.
Aerospace
In Aerospace, translation opportunities for our existing products in brackets, fasteners and other applications
remain strong although phasing of new platform build rates meant a second half slowdown this year in
certain models, leading to volumes declining by 5%. We remain positive for medium term growth prospects
as build rates and the use of composites increase. Light-weighting and the ability to reduce manufacturing
cycle time by up to 40% is a key selling point for our PEEK and PAEK polymers. Beyond this, our differentiated
polymer grades, such as our AE250TM
(low-melt) version continue to progress, alongside our focus on
product forms such as film and parts such as our Aerospace Loaded Brackets opportunity.
We formed our TxV Aero Composites joint venture this year, with Tri-Mack Plastics, to build a new
manufacturing facility in the US, supporting a differentiated and protectable Loaded Brackets product,
following pre-qualification for our PEEK/composites last year.
Electronics
Electronics was a very strong performer this year, despite the significant decline in Consumer Electronics resin
volumes. Total volumes were down 36% to 626 tonnes (2016: 977 tonnes), but excluding the lower year on
year volumes from the large Consumer Electronics order, Electronics volumes were over 40% ahead. This
principally reflects an improved performance in Semiconductor, in AptivTM
film and in some emerging
applications for Home Appliances and other consumer related areas.
For the large Consumer Electronics order, our current planning assumption, and based on some initial
volumes supplied, is that our PEEK will be used on smartphone models during 2018. At this early stage,
volumes are anticipated to be in a similar range to those delivered in 2017. We continue to work hard to
secure differentiated product opportunities across the major device manufacturers.
Regional trends
In our regions, Europe was up 8%, with 2,155 tonnes (2016: 1,987 tonnes), reflecting the strength in
Transport, Value Added Resellers and Industrial markets. Asia-Pacific was down 19% to 1,049 tonnes (2016:
1,303 tonnes) principally from lower Consumer Electronics, whilst US volumes were 19% ahead at 788 tonnes
(2016: 662 tonnes) principally reflecting the improvement in the Energy market and Value Added Resellers.

Victrex plc Preliminary Results 2017 10
Medical (Invibio)
12
months
12
months
Ended ended
30 Sept 30 Sept
2017 2016
£m £m Change
Revenue 53.9 50.8 6%
Gross profit 48.3 44.5 9%
Our Medical business performed steadily during the year, principally reflecting the maturity of the US Spine
market, with the US accounting for nearly two-thirds of our Medical revenues. Europe performed well, with
revenues increasing by 13%. Overall, Invibio revenue, including the benefit of currency, was up 6% at £53.9m
(2016: £50.8m), although it was down in constant currency. Gross profit was £48.3m (2016: £44.5m) and gross
margin nudged up to 89.6% (2016: 87.6%).
Medical market overview
Spine accounts for around two-thirds of our Medical revenues. With a lack of material growth in the number
of US spinal procedures, market growth in recent years has remained muted. This is now a mature market
where PEEK has a good position and remains the material of choice in spinal fusion surgery, but incremental
innovation is required to drive growth, offsetting the mature phase of the product lifecycle and some
competition from Titanium in one very specific application - expandable cages.
Our premium and differentiated PEEK-OPTIMATM
HA Enhanced product made good progress this year,
delivering over £1m of revenue by the third quarter, slightly ahead of schedule. This product, which offers
improved bone-on growth and enhanced clinical benefit, now has 28 global approvals and whilst it will
cannibalise some of our existing Spine product, the opportunity for global translations is attractive. We are
focused on moving revenue beyond £1m and delivering further growth in 2018, including a focus on product
launches in Asia.
Medical remains well placed in both the US and other geographic markets on a medium to longer term basis,
although adoption of new applications can be slow. During the year we communicated our vision to treat a
patient every 15-20 seconds with Invibio solutions in 8-10 years (compared to approximately every 35
seconds today). As well as being a materials supplier, our in-house regulatory expertise and positioning with
supportive clinical evidence will help us to drive our existing programmes and new business, including in
Dental, Trauma and Knee programmes.
For our emerging business opportunities, our focus is on market adoption, whether through support data
and clinical evidence to vindicate these programmes or engagement with key opinion leaders and market
influencers.
Mega-programmes
Whilst Dental sales remain below the £1m meaningful revenue threshold, we are closing in on a major OEM
agreement, and have other opportunities to gain enhanced market access and distribution, and to help drive
adoption. Our focus is on establishing the clinical value of our solutions in order to be attractive to partners,
and to gain wider market access through partnerships and distribution. We now have 5 year clinical data in
implant borne prosthetics, and support from our collaboration with the Malo Clinic in Portugal, which
reported successful performance data for JUVORA last year. With a 99% satisfaction rate (based on comfort
and fit) for patients using our JuvoraTM
dental disc, our focus is on using strong clinical evidence and building
enhanced market access.
Last year we commissioned our Trauma manufacturing facility, enabling us to have the ability to meet initial
demand. These products offer the potential for 50 times better fatigue resistance compared to a metal plate
in the body. Collaboration or development agreements remain in focus, particularly with innovators or
smaller players. Recent clinical trial data demonstrated that PEEK composites proved 100% successful in
healing high risk trauma patients with distal femur fractures, whereas metal plates suffered breakage and
only 75% of patients successfully healed. The awareness of composites as a viable metal alternative is

Victrex plc Preliminary Results 2017 11
growing and during the year we entered into a number of ongoing development agreements with small
innovative players.
In Knee, we successfully completed all preparations for the Maxx Orthopedics clinical trial, with patient
recruitment set to commence. With 1 in 5 patients dissatisfied with their knee surgery, typically using metal
based solutions, patient demand for non-metal based solutions offer significant potential in this $8 billion
global market. Our partnership with Maxx Orthopedics provides a good platform to support our long term
aspirations.

Victrex plc Preliminary Results 2017 12
CONSOLIDATED INCOME STATEMENT
for the year ended 30 September
A final dividend in respect of 2017 of 41.60p and a special dividend of 68.00p per ordinary share has been recommended by the
Directors for approval at the Annual General Meeting in February 2018.
2017 2016
Note £m £m
Revenue 2 290.2 252.3
Cost of sales (106.4) (93.6)
Gross profit 2 183.8 158.7
Sales, marketing and administrative expenses (72.7) (58.4)
Operating profit 111.1 100.3
Financial income 0.3 0.3
Financial expenses (0.4) (0.3)
Profit before tax 111.0 100.3
Income tax expense 3 (11.5) (17.8)
Profit for the period attributable to owners of the parent 99.5 82.5
Earnings per share
Basic 116.4p 96.8p
Diluted 116.2p 96.7p
Dividends
Interim 12.20p 11.73p
Final 41.60p 35.09p
Special 68.00p -
121.80p 46.82p

Victrex plc Preliminary Results 2017 13
CONSOLIDATED STATEMENT OF COMPREHENSIVE INCOME
for the year ended 30 September
2017 2016
£m £m
Profit for the period 99.5 82.5
Items that will not be reclassified to profit or loss
Defined benefit pension schemes’ actuarial gains/(losses) 13.6 (11.6)
Income tax on items that will not be reclassified to profit or
loss (2.3) 2.0
11.3 (9.6)
Items that may be subsequently reclassified to profit or
loss
Currency translation differences for foreign operations (1.5) 2.5
Effective portion of changes in fair value of cash flow hedges 2.9 (23.8)
Net change in fair value of cash flow hedges
transferred to profit or loss 13.3 14.3
Income tax on items that may be reclassified to profit or loss (3.3) 1.7
11.4 (5.3)
Total other comprehensive income/(expense) for the
period
22.7 (14.9)
Total comprehensive income for the period
attributable to owners of the parent
122.2 67.6

Victrex plc Preliminary Results 2017 14
CONSOLIDATED BALANCE SHEET
for the year ended 30 September
2017 2016
£m £m
Assets
Non-current assets
Property, plant and equipment 258.6 255.5
Intangible assets 30.6 23.5
Investments 10.0 10.0
Deferred tax assets 5.6 8.9
Retirement benefit asset 3.8 -
308.6 297.9
Current assets
Inventories 61.5 61.8
Current income tax assets 2.4 -
Trade and other receivables 37.9 46.9
Derivative financial instruments 7.6 2.1
Cash and cash equivalents 120.1 64.0
229.5 174.8
Total assets 538.1 472.7
Liabilities
Non-current liabilities
Deferred tax liabilities (18.4) (19.2)
Retirement benefit obligations - (10.6)
(18.4) (29.8)
Current liabilities
Derivative financial instruments (4.2) (19.5)
Current income tax liabilities (3.0) (5.4)
Trade and other payables (34.1) (28.9)
(41.3) (53.8)
Total liabilities (59.7) (83.6)
Net assets 478.4 389.1
Equity
Share capital 0.9 0.9
Share premium 43.0 37.8
Translation reserve 2.7 4.2
Hedging reserve 3.8 (9.2)
Retained earnings 428.0 355.4
Total equity attributable to owners of the parent 478.4 389.1

Victrex plc Preliminary Results 2017 15
CONSOLIDATED CASH FLOW STATEMENT
For the year ended 30 September 2017
2017 2016
£m £m
Profit after tax for the year 99.5 82.5
Income tax expense 11.5 17.8
Net financing expense 0.1 -
Operating profit 111.1 100.3
Adjustments for:
Depreciation 15.3 14.8
Amortisation 2.3 0.8
Loss on disposal of non-current assets - -
Decrease/(increase) in inventories 0.2 (3.4)
Decrease/(increase) in receivables 8.9 (13.4)
Increase/(decrease) in payables 5.6 (3.3)
Equity-settled share-based payment transactions 2.3 1.8
(Gains)/losses on derivatives in income statement that have not
yet settled (7.5) 5.4
Retirement benefit obligations charge less contributions (0.8) (7.0)
Cash generated from operations 137.4 96.0
Net financing interest received - 0.1
Tax paid (19.8) (12.7)
Net cash flow from operating activities 117.6 83.4
Cash flow from investing activities
Acquisition of investments - (10.0)
Acquisition of property, plant and equipment and intangible
assets (16.7) (25.9)
Cash consideration of acquisitions (9.9) -
Cash acquired with acquisitions 0.9 -
Net cash flow from investing activities (25.7) (35.9)
Cash flow from financing activities
Proceeds from issue of ordinary shares exercised under option 5.2 1.0
Dividends paid (40.4) (39.9)
Net cash flow from financing activities (35.2) (38.9)
Net increase in cash and cash equivalents 56.7 8.6
Effect of exchange rate fluctuations on cash held (0.6) 1.6
Cash and cash equivalents at beginning of year 64.0 53.8
Cash and cash equivalents at end of year 120.1 64.0

Victrex plc Preliminary Results 2017 16
CONSOLIDATED STATEMENT OF CHANGES IN EQUITY
Share
capital
Share
premium
Translation
reserve
Hedging
reserve
Retained
earnings
Total
£m £m £m £m £m £m
Equity at 1 October 2015 0.9 36.8 1.7 (1.6) 320.8 358.6
Total comprehensive income for the year
Profit - - - - 82.5 82.5
Other comprehensive income/(expense)
Currency translation differences for foreign
operations - - 2.5 - - 2.5
Effective portion of changes in fair value of cash flow
Hedges - - - (23.8) - (23.8)
Net change in fair value of cash flow hedges
transferred to profit or loss - - - 14.3 - 14.3
Defined benefit pension schemes’ actuarial losses - - - - (11.6) (11.6)
Tax on other comprehensive income - - - 1.9 1.8 3.7
Total other comprehensive income/(expense) for
the year - - 2.5 (7.6) (9.8) (14.9)
Total comprehensive income/(expense) for the - - 2.5 (7.6) 72.7 67.6
year
Contributions by and distributions to owners of
the Company
Share options exercised - 1.0 - - - 1.0
Equity-settled share-based payment transactions - - - - 1.8 1.8
Dividends to shareholders - - - - (39.9) (39.9)
Equity at 30 September 2016 0.9 37.8 4.2 (9.2) 355.4 389.1
Total comprehensive income for the year
Profit - - - - 99.5 99.5
Other comprehensive (expense)/income
Currency translation differences for foreign
operations - - (1.5) - - (1.5)
Effective portion of changes in fair value of cash flow
Hedges - - - 2.9 - 2.9
Net change in fair value of cash flow hedges
transferred to profit or loss - - - 13.3 - 13.3
Defined benefit pension schemes’ actuarial gains - - - - 13.6 13.6
Tax on other comprehensive income - - - (3.2) (2.4) (5.6)
Total other comprehensive (expense)/income for
the year - - (1.5) 13.0 11.2 22.7
Total comprehensive (expense)/income for the - - (1.5) 13.0 110.7 122.2
year
Contributions by and distributions to owners of
the Company
Share options exercised - 5.2 - - - 5.2
Equity-settled share-based payment transactions - - - - 2.3 2.3
Dividends to shareholders - - - - (40.4) (40.4)
Equity at 30 September 2017 0.9 43.0 2.7 3.8 428.0 478.4

Victrex plc Preliminary Results 2017 17
Notes to the Financial Report
1. Basis of preparation
General information
Victrex plc (the ‘Company’) is a limited liability company incorporated and domiciled in the United Kingdom. The address of its
registered office is Victrex Technology Centre, Hillhouse International, Thornton Cleveleys, Lancashire FY5 4QD, United Kingdom.
The consolidated financial statements of the Company for the year ended 30 September 2017 comprise the Company and its
subsidiaries (together referred to as the ‘Group’).
The Company is listed on the London Stock Exchange.
The consolidated financial statements were approved for issue by the Board of Directors on 5 December 2017.
Basis of preparation
Both the consolidated and Company financial statements have been prepared on the basis of the accounting policies set out in the
Group’s last Annual Report and Accounts except for the application of relevant new standards. A number of new standards and
amendments to existing standards were effective for the financial year ended 30 September 2017. None of these have had a material
impact to the Group’s consolidated result or financial position.
A number of standards, amendments and interpretations have been issued and endorsed by the EU but are not yet effective and,
accordingly, the Group has not yet adopted them.
The financial information presented here does not constitute the Company’s statutory accounts for the years ended 30 September 2017
or 2016 but is derived from those accounts. Statutory accounts for 2016 have been delivered to the registrar of companies, and those for
2017 will be delivered in due course. The auditor has reported on those accounts; their reports were (i) unqualified, (ii) did not include
reference to any matters to which the auditor drew attention by way of emphasis without qualifying their report and (iii) did not contain
a statement under section 498 (2) or (3) of the Companies Act 2006.
Sections of this results statement contain forward-looking statements, including statements relating to; future demand and markets for
the Group’s products and services, research and development relating to new products and services and liquidity and capital resources.
These forward-looking statements involve risks and uncertainties because they relate to events that may or may not occur in the future.
Accordingly, actual results may differ materially from anticipated results because of a variety of risk factors which are summarised in
Note 6.
The accounts for the year ended 30 September 2017 will be posted to shareholders on 3 January 2018 and will be available from the
Company’s Registered Office at Victrex Technology Centre, Hillhouse International, Thornton Cleveleys, Lancashire, FY4 4QD, United
Kingdom.
2. Segment reporting
The Group complies with IFRS 8 – Operating Segments which requires operating segments to be identified and reported upon that are
consistent with the level at which results are regularly reviewed by the entity’s chief operating decision maker. The chief operating
decision maker for the Group is the Victrex plc Board. Information on the business units is the primary basis of information reported to
the Victrex plc Board. The performance of the business units is assessed based on segmental gross profit. Management of sales,
marketing and administration functions servicing both business units is consolidated and reported at a Group level.
The Group’s business is strategically organised as two business units (operating segments): Industrial (Victrex Polymer Solutions), which
focuses on our Automotive, Aerospace, Electronics and Energy markets, and Medical (Invibio Biomaterial Solutions), which focuses on
providing specialist solutions for medical device manufacturers.

Victrex plc Preliminary Results 2017 18
2. Segment reporting continued
Industrial Medical Group Industrial Medical Group
2017 2017 2017 2016 2016 2016
£m £m £m £m £m £m
Revenue from external sales 236.3 53.9 290.2 201.5 50.8 252.3
Segment gross profit 135.5 48.3 183.8 114.2 44.5 158.7
Sales, marketing and administrative expenses (72.7) (58.4)
Operating profit 111.1 100.3
Net financing expense (0.1) —
Profit before tax 111.0 100.3
Income tax (11.5) (17.8)
Profit for the year attributable to owners of the Parent 99.5 82.5
3. Taxation
2017 2016
£m £m
Current tax
UK corporation tax on profits for the year 7.7 16.8
Overseas tax on profits for the year 2.2 1.7
9.9 18.5
Deferred tax
Origination and reversal of temporary differences 0.7 2.2
Reduction in tax rate — (1.9)
0.7 0.3
Tax adjustments relating to prior years 0.9 (1.0)
Total tax expense in income statement 11.5 17.8
2017 2016
% £m % £m
Profit before tax 111.0 100.3
Tax expense at UK corporation tax rate 19.5 21.6 20.0 20.1
Effects of:
– Expenses not deductible for tax purposes 0.5 0.5
– Higher rates of tax on overseas earnings 0.9 0.6
– UK research and development tax credits and other allowances (0.4) (0.2)
– Tax adjustments relating to prior years 0.9 (1.0)
– Difference in rates between deferred tax and corporation tax (0.1) (0.3)
– Restatement of opening deferred tax balances from 20% to 17% — (1.9)
– Patent box deduction (11.9) —
Effective tax rate 10.4 11.5 17.7 17.8
4. Exchange Rates
The most significant Sterling exchange rates used in the financial statements under the Group’s accounting policies are:
2017 2016
Average Closing Average Closing
US Dollar 1.37 1.34 1.54 1.31
Euro 1.23 1.14 1.35 1.18
Yen 150 151 179 135
The average exchange rates in the above table take into account the impact of gains and losses on foreign currency contracts. These
rates are referred to elsewhere in the Preliminary Results as the effective rates for the period.

Victrex plc Preliminary Results 2017 19
5. Dividend and Annual General Meeting
The proposed final regular and special dividends will be paid on 16 February 2018 to all shareholders on the register on 2 February 2018.
The Annual General Meeting of the Company will be held at 10am on 9 February 2018, at J.P. Morgan, 1 John Carpenter Street, London,
EC4Y 0JP.
6. Risks, trends, factors and uncertainties
Victrex’s business and share price may be affected by a number of risks, trends, factors and uncertainties, not all of which are in our
control.
Accordingly, actual results may differ materially from anticipated results because of a variety of risk factors, including: changes in
exchange rates; changes in global, political, economic, business, competitive and market forces; changes in raw material pricing and
availability; changes to legislation and tax rates; future business combinations or disposals; relations with customers and customer credit
risk; events affecting international security, including global health issues and terrorism; changes in regulatory environment and the
outcome of litigation.
FINANCIAL CALENDAR (also available at www.victrexplc.com)
Ex-dividend date 1 February 2018
Record date# 2 February 2018
Annual General Meeting 9 February 2018
Payment of final dividend 16 February 2018
Announcement of 2018 half–yearly results May 2018
Payment of interim dividend July 2018
# The date by which shareholders must be recorded on the share register to receive the dividend
*Additional performance measures:
- Group revenue in constant currency which is reached by applying current year (FY 2017) effective currency rates to prior year
(FY 2016) transactions (see note 4);
- Group metrics excluding Consumer Electronics are referred to as core i.e. core volumes, core revenue and core business;
- Operating cash conversion (cash generated from operations/operating profit);
- Sales from new products (sales from new grades sold from FY 2014 onwards); and
- Dividend cover (earnings per share/total dividend per share). This excludes the special dividend.