Embed Size (px)
Citation preview
Vibrational imaging and microspectroscopies based on coherent anti-Stokes Raman scattering (CARS)
by
Andreas Volkmer
3rd Institute of Physics, University of Stuttgart,
Pfaffenwaldring 5770550 Stuttgart,
Germany
Universität Stuttgart
AG Volkmer(Coherent microscopy &
single-molecule spectroscopy)
FRISNO-8, Ein Bokek, 20-25 February 2005

Noninvasive three-dimensional characterization of mesoscopic objects within complex heterogeneous systems
• with high spatial resolution,• with high spectral resolution,• with high temporal resolution,• and with high sensitivity.
Ultimate goal in Optical Microscopy

Fluorescence-based microscopy Confocal fluorescence laser scanning microscopy Two-photon induced fluorescence laser scanning microscopy
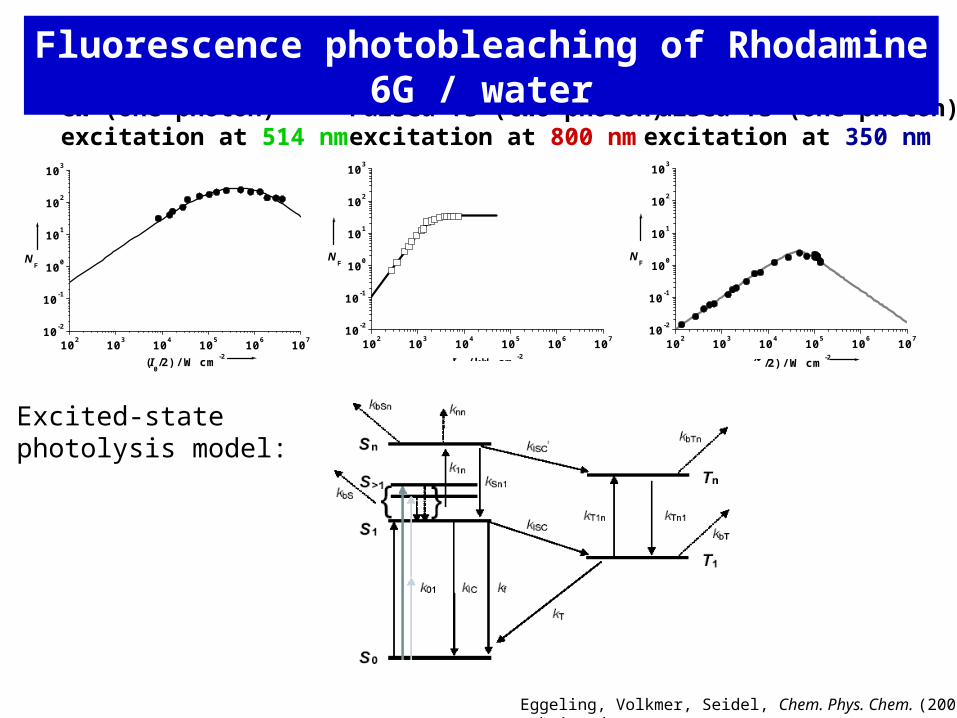
Limitations of fluorescence-based spectroscopic studies:
• dye labeling required (photo-toxicity)
• perturbation of structure and dynamics by fluorophore
• photo-stability (# emitted photons)
!
knr
abs kfl
102 103 104 105 106 10710-2
10-1
100
101
102
103
NF
(I0/2) / W cm-2
CW (one-photon)excitation at 514 nm
102 103 104 105 106 10710-2
10-1
100
101
102
103
NF
Iav
/ kW cm-2102 103 104 105 106 107
10-2
10-1
100
101
102
103
NF
(I0/2) / W cm-2
Pulsed fs (one-photon)excitation at 350 nm
Pulsed fs (two-photon)excitation at 800 nm
Fluorescence photobleaching of Rhodamine 6G / water
Excited-statephotolysis model:
Eggeling, Volkmer, Seidel, Chem. Phys. Chem. (2005) submitted.
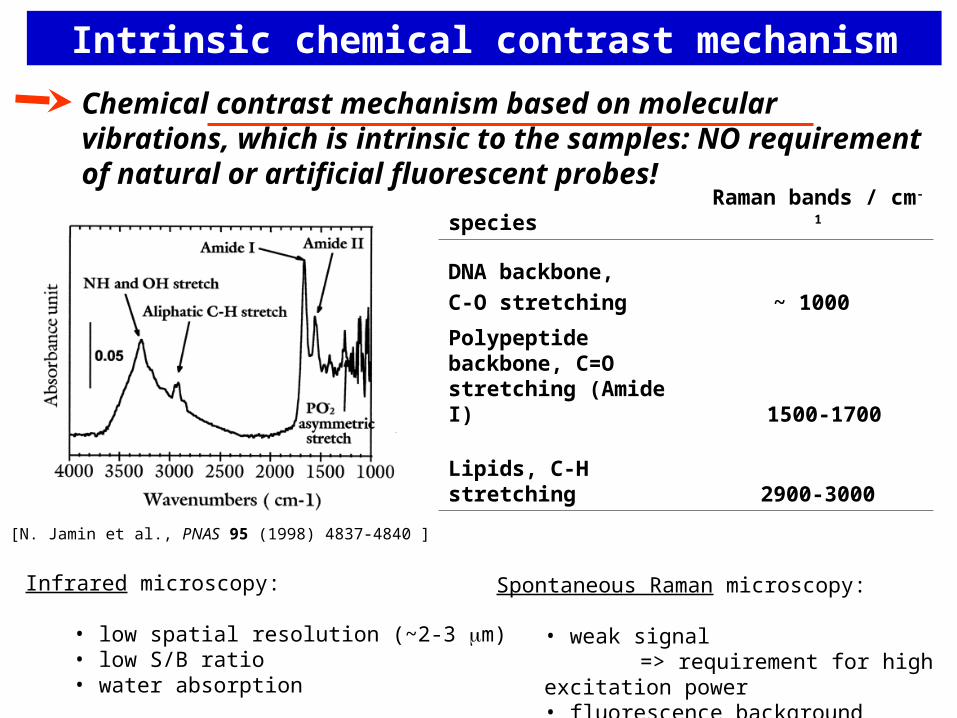
Chemical contrast mechanism based on molecular vibrations, which is intrinsic to the samples: NO requirement of natural or artificial fluorescent probes!
species Raman bands / cm-1
DNA backbone,
C-O stretching ~ 1000
Polypeptide backbone, C=O stretching (Amide I) 1500-1700
Lipids, C-H stretching 2900-3000
Intrinsic chemical contrast mechanism
[N. Jamin et al., PNAS 95 (1998) 4837-4840 ]
Spontaneous Raman microscopy:
• weak signal=> requirement for high excitation
power• fluorescence background
Infrared microscopy:
• low spatial resolution (~2-3 m)• low S/B ratio• water absorption
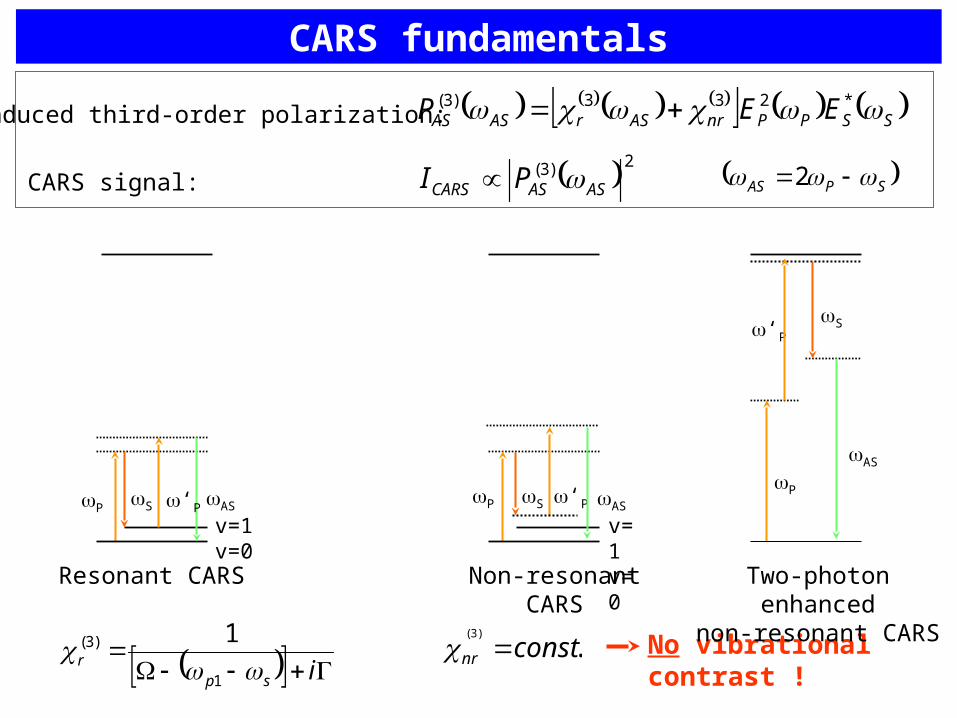
CARS fundamentals
2)3(ASASCARS PI
ispr
1
)3( 1
SSPPnrASrASAS EEP *233)3(
Resonant CARS
ASPS
v=1v=0
‘P
CARS signal:
induced third-order polarization:
.)3(
constnr No vibrational contrast !
Two-photon enhancednon-resonant CARS
Non-resonant CARS
AS
‘P
P
S
ASP S
v=1v=0
‘P
SPAS 2
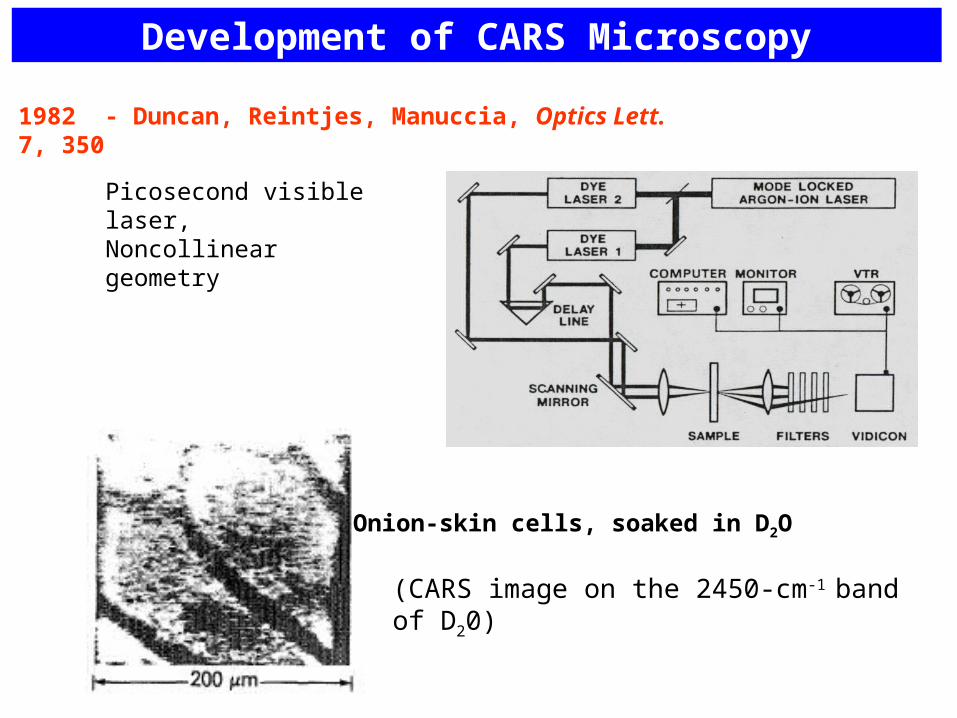
1982 - Duncan, Reintjes, Manuccia, Optics Lett. 7, 350
Picosecond visible laser,Noncollinear geometry
Development of CARS Microscopy
(CARS image on the 2450-cm-1 band of D20)
Onion-skin cells, soaked in D2O

853 nm (100 W)
1135 nm (100 W)
CARS signal at 675 nm
(Raman-shift of 2913 cm-1, on resonance with C-H vibrations)
HeLa cellsE-coli
1999 - Zumbusch, Holtom, Xie, Phys. Rev. Lett. 82, 4142
Femtosecond near-IR laser,Collinear geometry,Forward detection
High NA objectives
FilterSample
D
P
S
AS
• Intrinsic sensitivity to specific chemical bonds
=> No dye labeling
• Coherent signal enhanced by orders of magnitudes
=> Less laser power required compared to conventional Raman
compared to spontaneous Raman signal microscopy
• No population of higher electronic states
=> No photobleaching
• Confinement of nonlinear excitation to confocal volume
=> Inherent 3D spatial sectioning capability
Advantages of CARS-microscopy
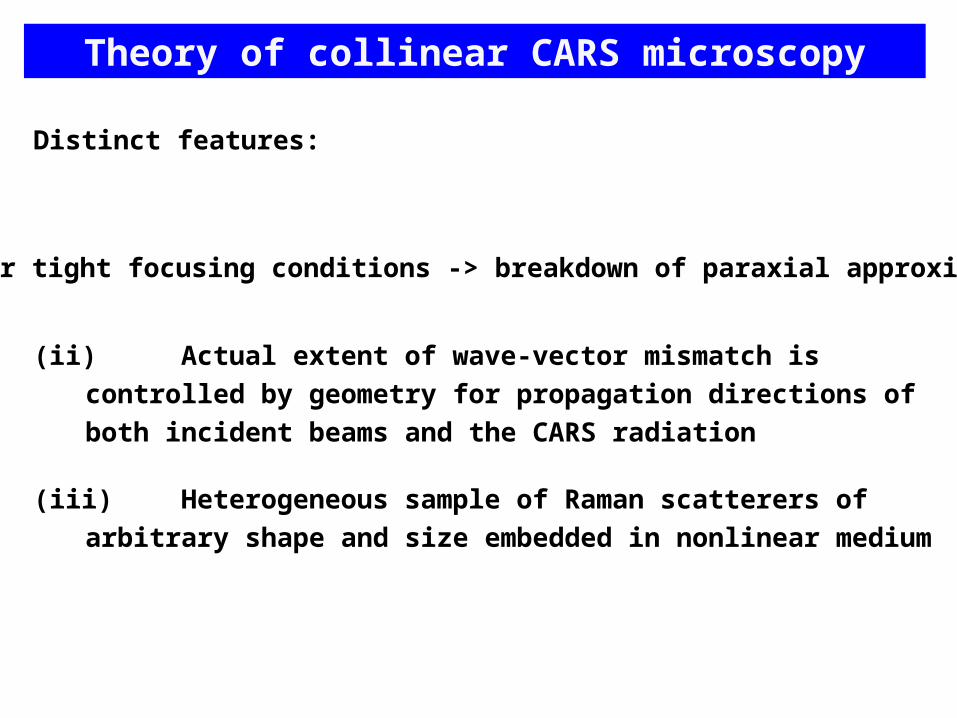
Theory of collinear CARS microscopy
Distinct features:
(ii) Actual extent of wave-vector mismatch is controlled by geometry for
propagation directions of both incident beams and the CARS radiation
(iii) Heterogeneous sample of Raman scatterers of arbitrary shape and size
embedded in nonlinear medium
(i) Under tight focusing conditions -> breakdown of paraxial approximation
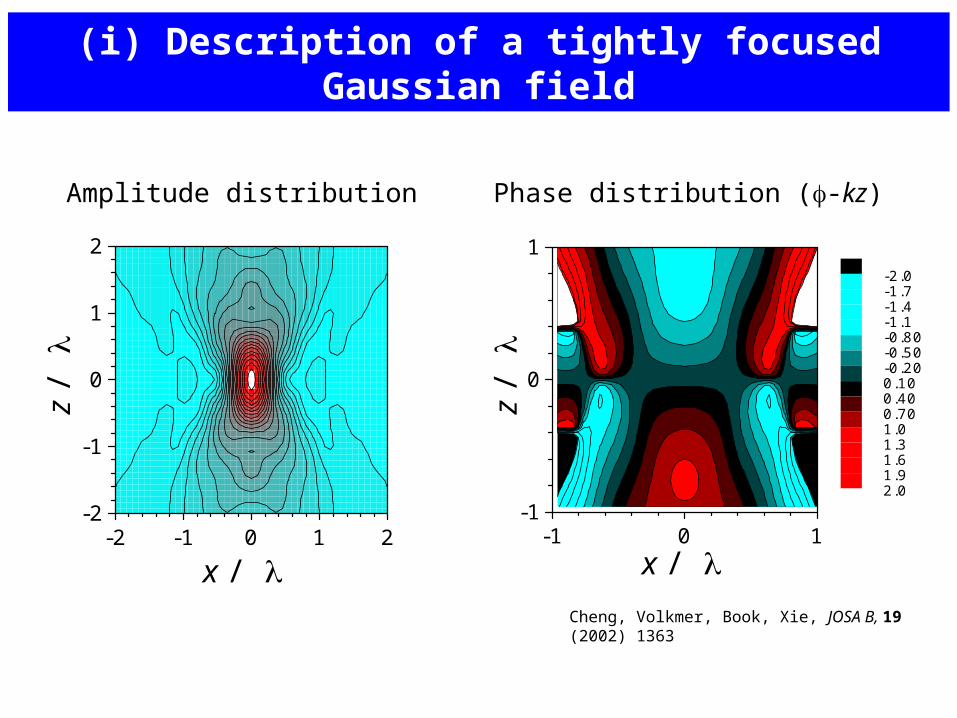
Amplitude distribution
-2 -1 0 1 2-2
-1
0
1
2
x /
z /
(i) Description of a tightly focused Gaussian field
-1 0 1-1
0
1
-2.0-1.7-1.4-1.1-0.80-0.50-0.200.100.400.701.01.31.61.92.0
x /
z /
Phase distribution (-kz)
Cheng, Volkmer, Book, Xie, JOSA B, 19 (2002) 1363
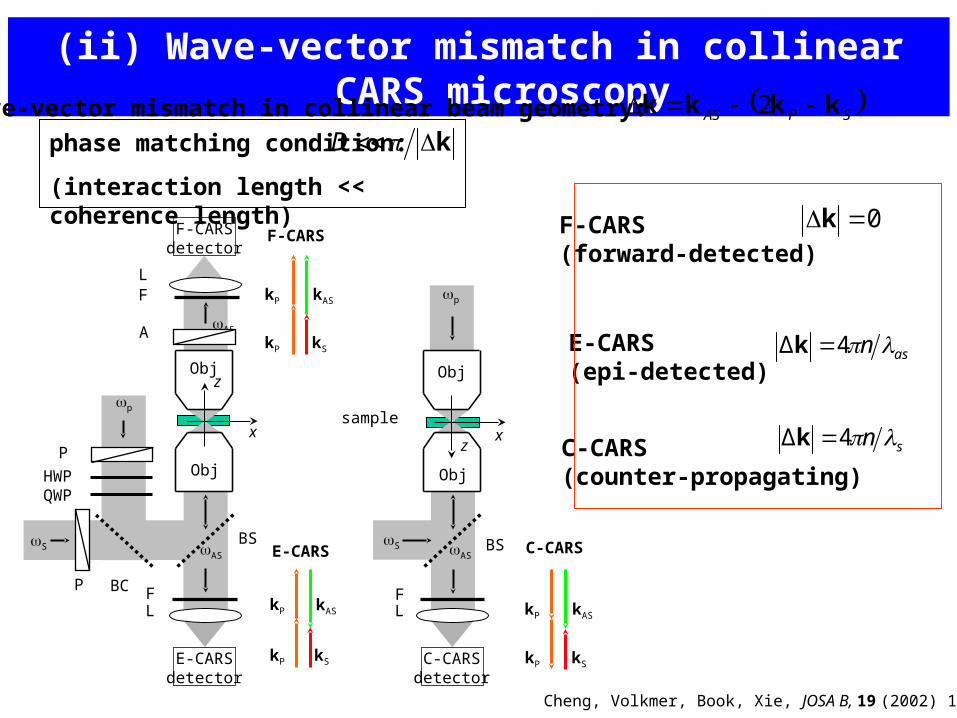
(ii) Wave-vector mismatch in collinear CARS microscopy
Wave-vector mismatch in collinear beam geometry:
phase matching condition:
(interaction length << coherence length)
kD
SPAS kkkk 2
kP kAS
kP kS
BS
p
L
Obj
Obj
S AS
F
C-CARSdetector
samplex
z
C-CARS
kP kAS
kP kS
kP kAS
kP kS
BS
L
Obj
S AS
F
E-CARSdetector
AS
Obj
LF
F-CARSdetector
x
z
F-CARS
E-CARS
BCP
P
HWPQWP
p
A
F-CARS(forward-detected)
0k
E-CARS(epi-detected)
asn 4Δ k
C-CARS(counter-propagating)
sn 4Δ k
Cheng, Volkmer, Book, Xie, JOSA B, 19 (2002) 1363
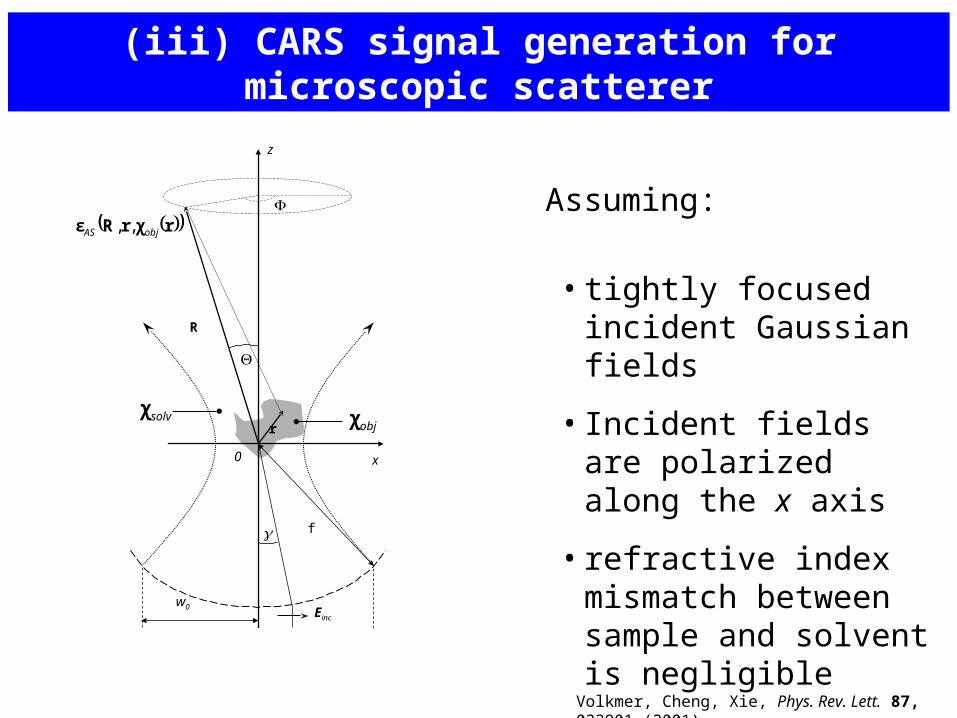
(iii) CARS signal generation for microscopic scatterer
Assuming:
• tightly focused incident Gaussian fields
• Incident fields are polarized along the x axis
• refractive index mismatch between sample and solvent is negligible
Volkmer, Cheng, Xie, Phys. Rev. Lett. 87, 023901 (2001).
w0
R
r
x
z
f
Einc
0
objχ
rχrRε objAS ,,
solvχ
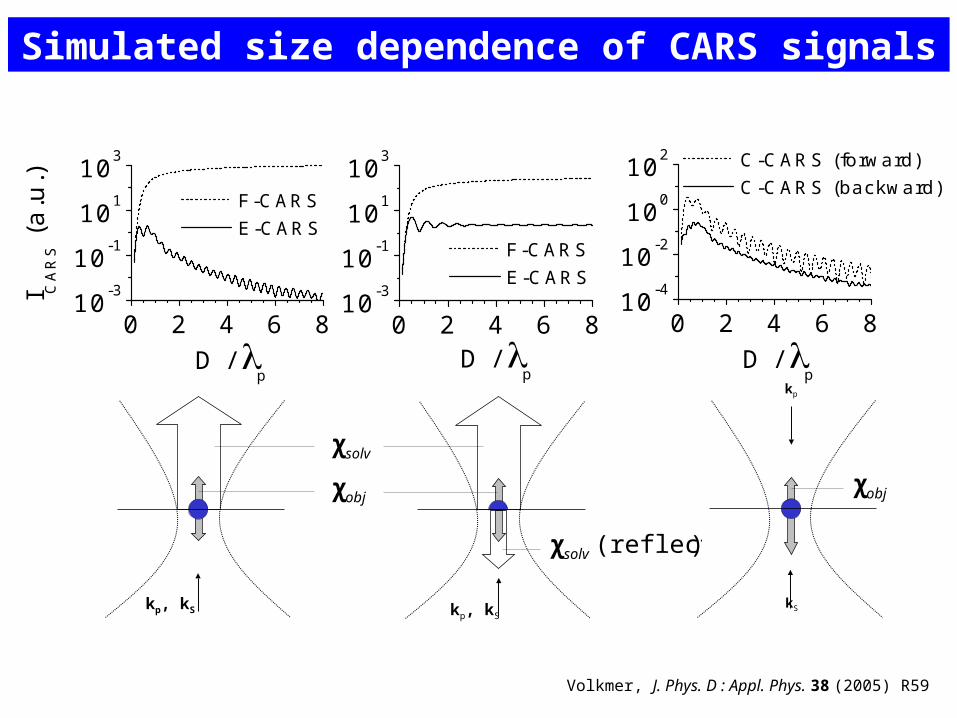
Simulated size dependence of CARS signals
0 2 4 6 810-3
10-1
101
103
I CA
RS (
a.u.
)
D / p
F-CARS E-CARS
kp, kS
objχ
solvχ
0 2 4 6 810-3
10-1
101
103
D / p
F-CARS E-CARS
kp, kS
)(reflected solvχ
0 2 4 6 810-4
10-2
100
102 C-CARS (forward) C-CARS (backward)
D / p
kS
kp
objχ
Volkmer, J. Phys. D : Appl. Phys. 38 (2005) R59
0.0 0.5 1.0 1.5 2.0 2.5 3.00
50
100
150
200
x (m)
sig
na
l (ct
s)
0.0 0.5 1.0 1.5 2.0 2.5 3.00
5
10
15
20
sig
na
l (ct
s)
x (m)
0.0 0.5 1.0 1.5 2.0 2.5 3.00
10
20
30
40
sig
na
l (ct
s)
x (m)
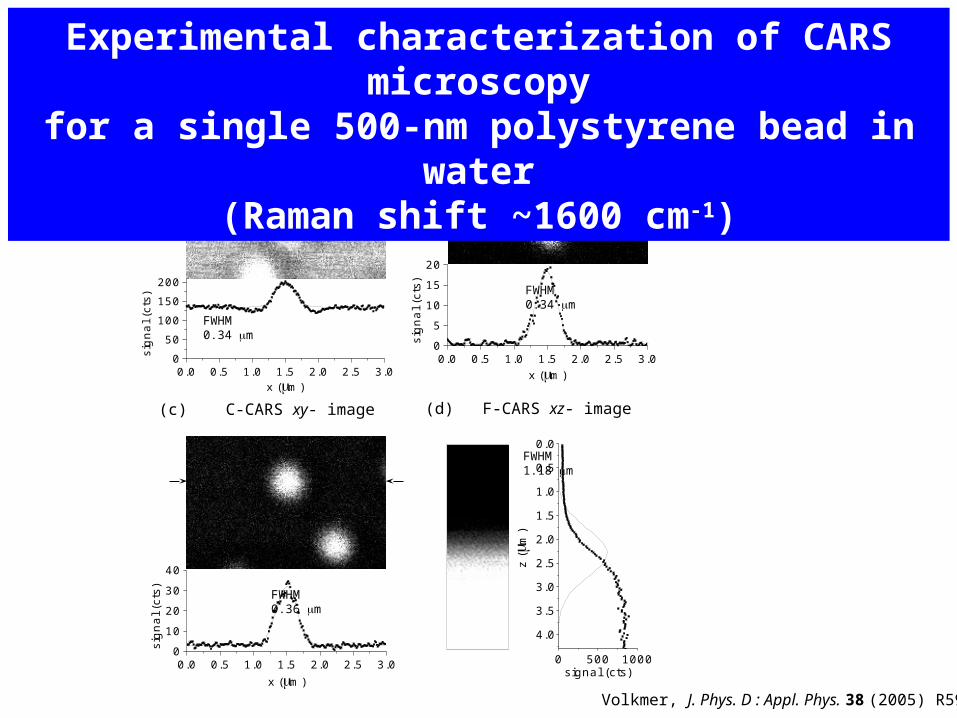
(c) C-CARS xy- image
(a) F-CARS xy-image
FWHM0.34 m
FWHM0.34 m
FWHM0.36 m
(b) E-CARS xy- image
(d) F-CARS xz- image
0 500 1000
4.0
3.5
3.0
2.5
2.0
1.5
1.0
0.5
0.0
z (
m)
signal (cts)
FWHM1.18 m
Experimental characterization of CARS microscopyfor a single 500-nm polystyrene bead in water
(Raman shift ~1600 cm-1)
Volkmer, J. Phys. D : Appl. Phys. 38 (2005) R59
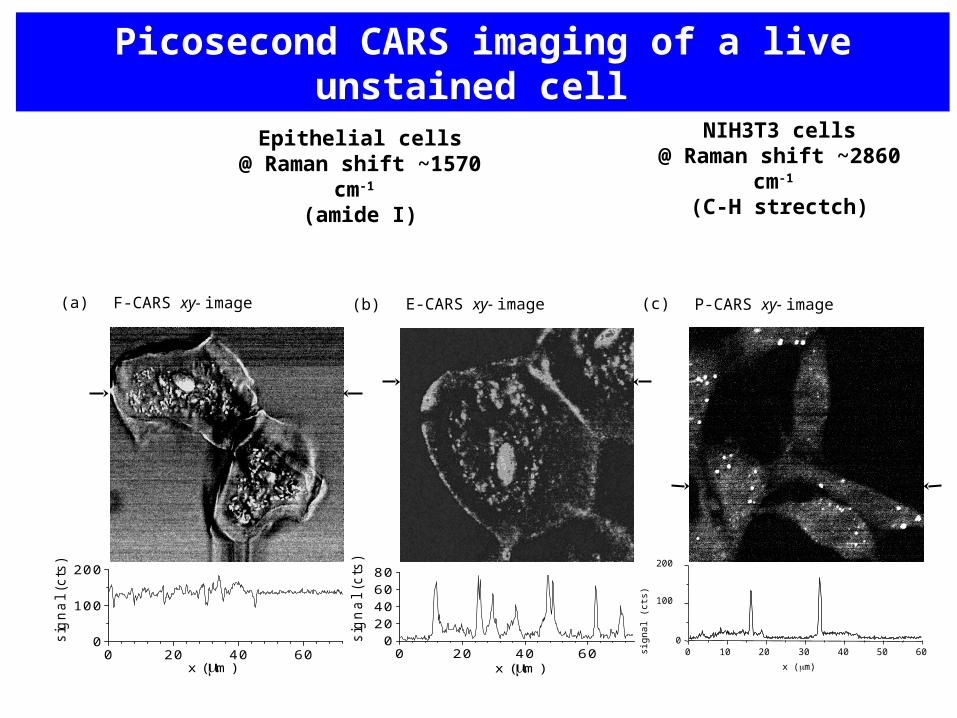
P-CARS xy- image
0 20 40 600
20406080
x (m)
sig
na
l (c
ts)
0 20 40 600
100
200
x (m)
sig
na
l (c
ts)
(a) (b)F-CARS xy- image E-CARS xy- image
sign
al (
cts)
(c)
0 10 20 30 40 50 600
100
200
x (m)
Picosecond CARS imaging of a live unstained cell
Epithelial cells@ Raman shift ~1570 cm-1
(amide I)
NIH3T3 cells@ Raman shift ~2860 cm-1
(C-H strectch)
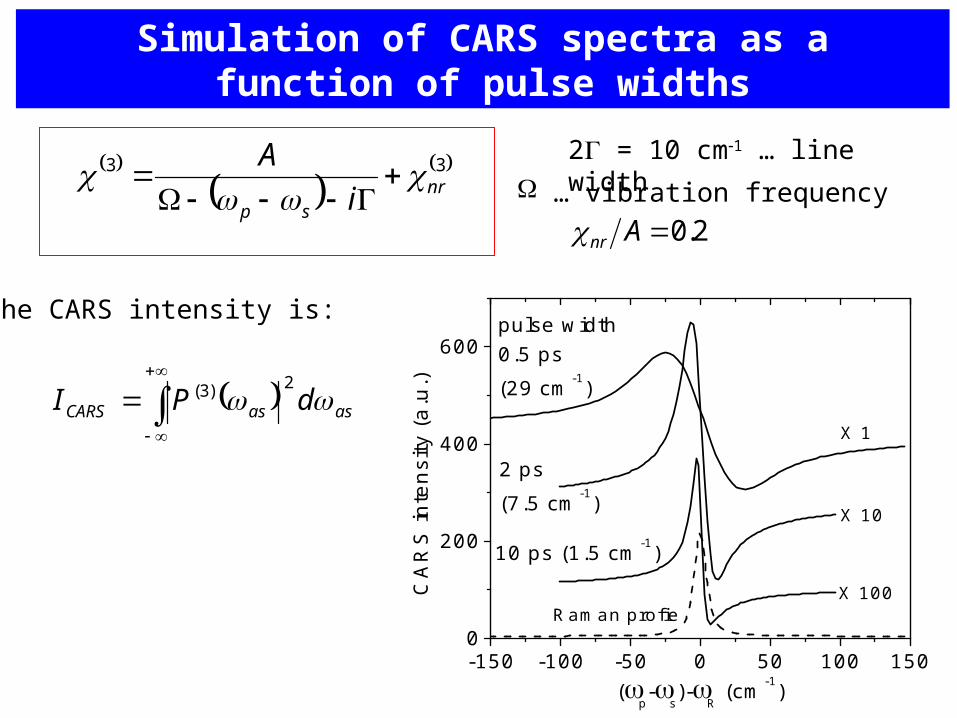
-150 -100 -50 0 50 100 1500
200
400
600
2 ps
(7.5 cm-1) X 10
Raman profie
X 1
X 100
pulse width0.5 ps
(29 cm-1)
10 ps (1.5 cm-1)
CA
RS
inte
nsity
(a.
u.)
(p-
s)-
R (cm-1)
Simulation of CARS spectra as afunction of pulse widths
33nr
sp i
A
2 = 10 cm1 … line width
2.0Anr … vibration frequency
asasCARS dPI 2)3(
The CARS intensity is:
= 25 cm-1
| |2
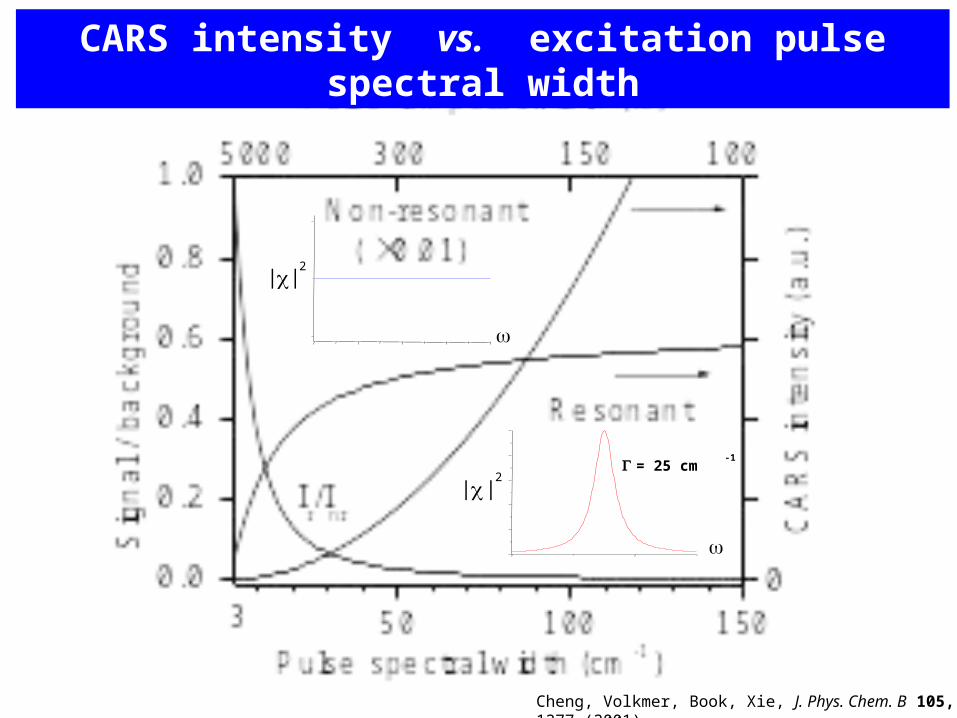
| |2
CARS intensity vs. excitation pulse spectral width
Cheng, Volkmer, Book, Xie, J. Phys. Chem. B 105, 1277 (2001).
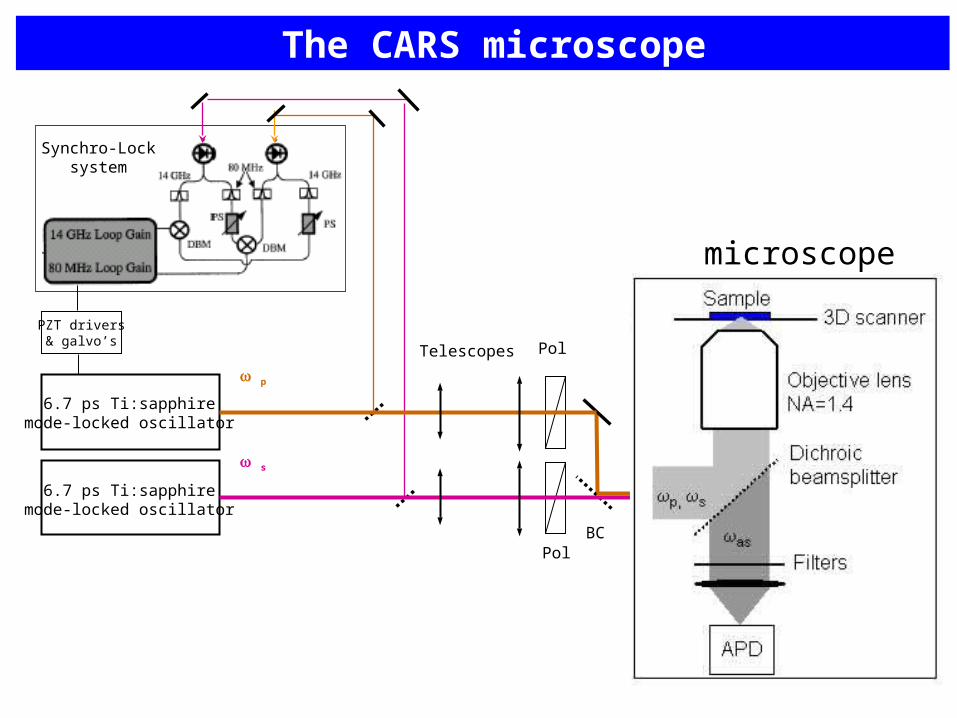
Synchro-Locksystem
PZT drivers& galvo’s
The CARS microscope
Telescopes Pol
Pol
s
p
BC
6.7 ps Ti:sapphiremode-locked oscillator
6.7 ps Ti:sapphiremode-locked oscillator
microscope
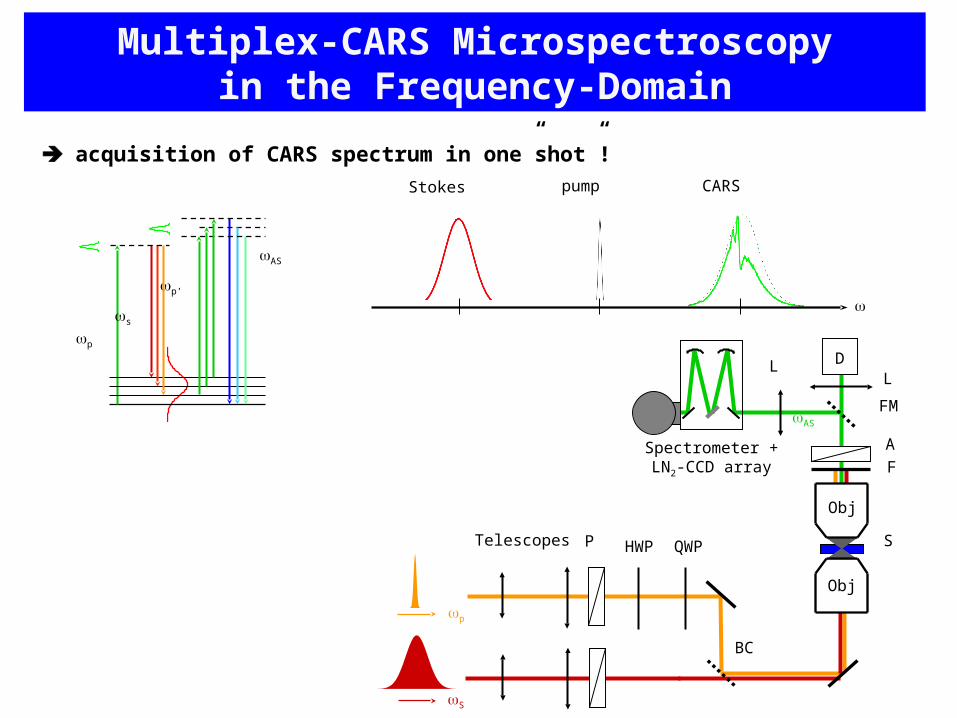
acquisition of CARS spectrum in one”shot”!
AS
p
s
p’
Obj
DL
FA
BC
Spectrometer +LN2-CCD array
Telescopes P SHWP
FM
L
Obj
AS
p
QWP
S
CARSpumpStokes
Multiplex-CARS Microspectroscopyin the Frequency-Domain
Inte
nsi
ty (
a.u
.)
Raman shift / cm-12800 2900 3000
0.0
0.2
0.4
0.6
0.8
1.0
Raman
2800 2900 30000.0
0.2
0.4
0.6
0.8
1.0
Inte
nsi
ty (
a.u
.)
Raman shift (cm-1)
Raman
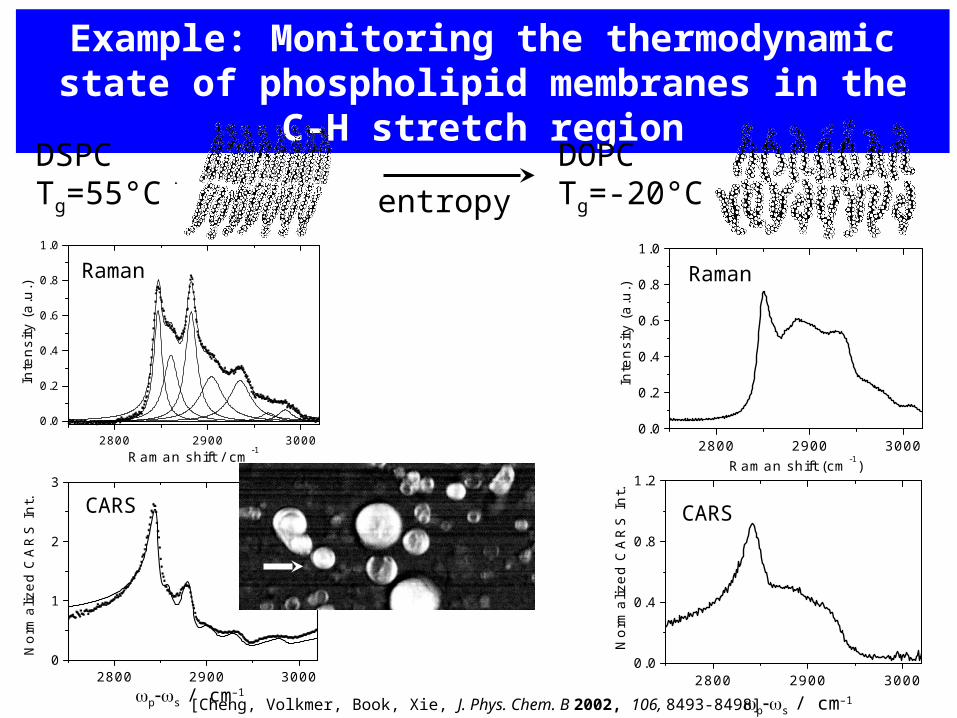
Example: Monitoring the thermodynamic state of phospholipid membranes in the C-H stretch region
DSPCTg=55°C
DOPCTg=-20°C
2800 2900 30000
1
2
3
No
rma
lize
d C
AR
S I
nt.
CARS
ps / cm–12800 2900 3000
0.0
0.4
0.8
1.2
Nor
mal
ized
CA
RS
Int.
CARS
ps / cm–1[Cheng, Volkmer, Book, Xie, J. Phys. Chem. B 2002, 106, 8493-8498]
entropy
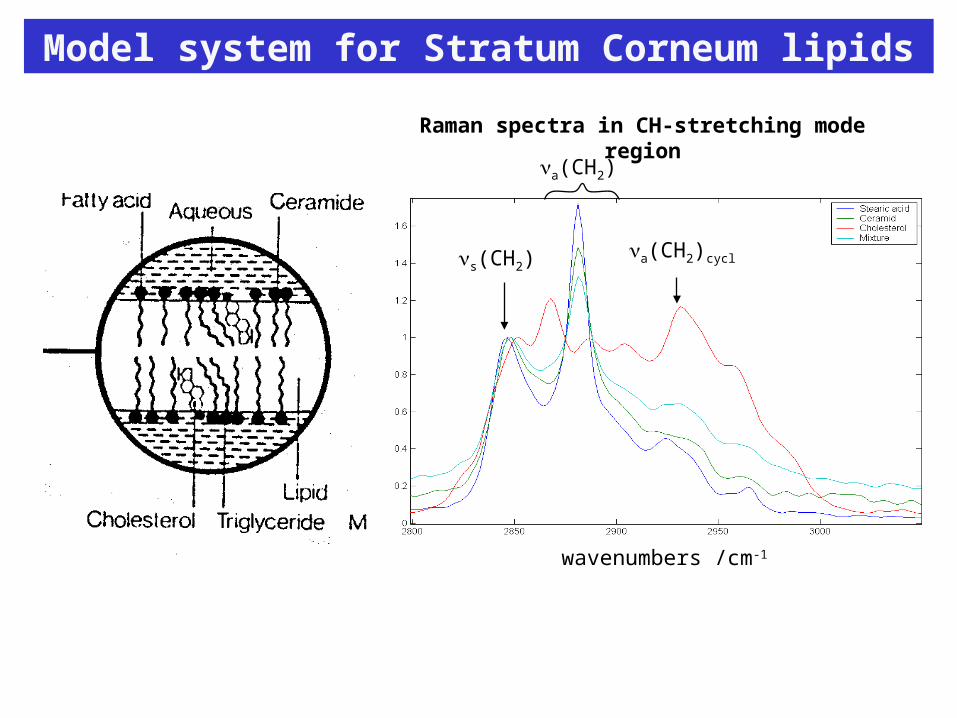
Model system for Stratum Corneum lipids
a(CH2)
a(CH2)cycl
Raman spectra in CH-stretching mode region
s(CH2)
wavenumbers /cm-1

Spectrally integrated CARS image section
10 m
2700 2900 3100
0.85
0.9
0.95
1
1.05
1.1
1.15
1.2
Extracted CARS ratio spectra for each image pixel
~
~ref
CARS
CARSI
I
1/~ cm
Hyper-spectral CARS imaging of a Stratum Corneum
Existence of cholesterol-enriched micro-domains
(see Poster by Nandakumar et al : Mo-4)
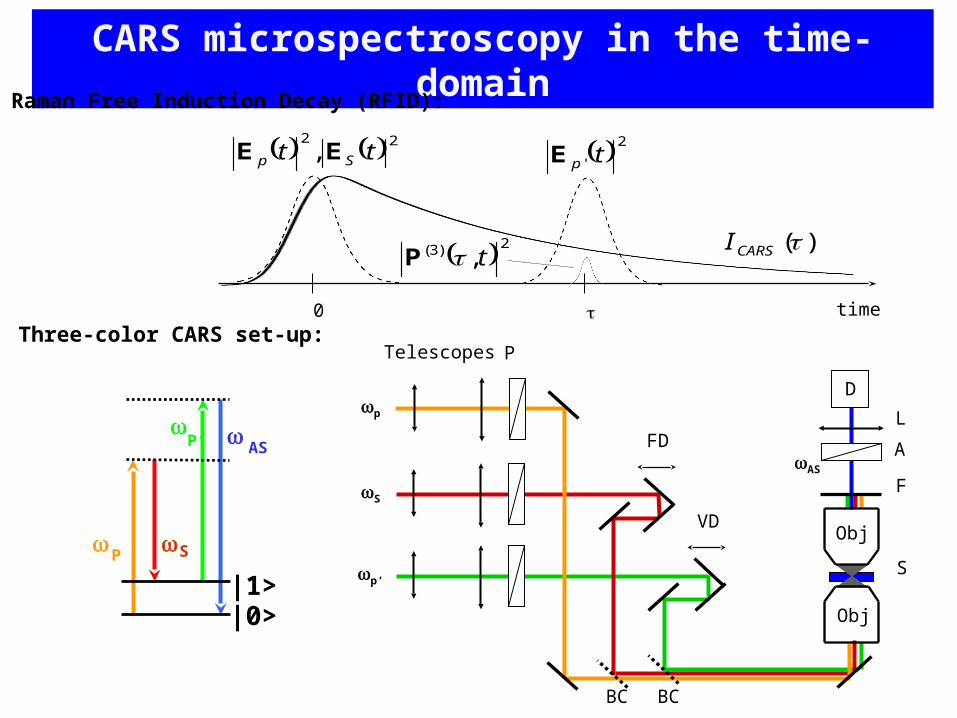
CARS microspectroscopy in the time-domain
0 time
)(CARSI
22, tt Sp EE 2
' tpE
2)3( , tP
Raman Free Induction Decay (RFID):
Obj
D
L
F
A
BC
S
Obj
AS
Telescopes P
BC
VD
FD
p’
p
S
P
S
P’
AS
|0>|1>
Three-color CARS set-up:
)~(~ ||
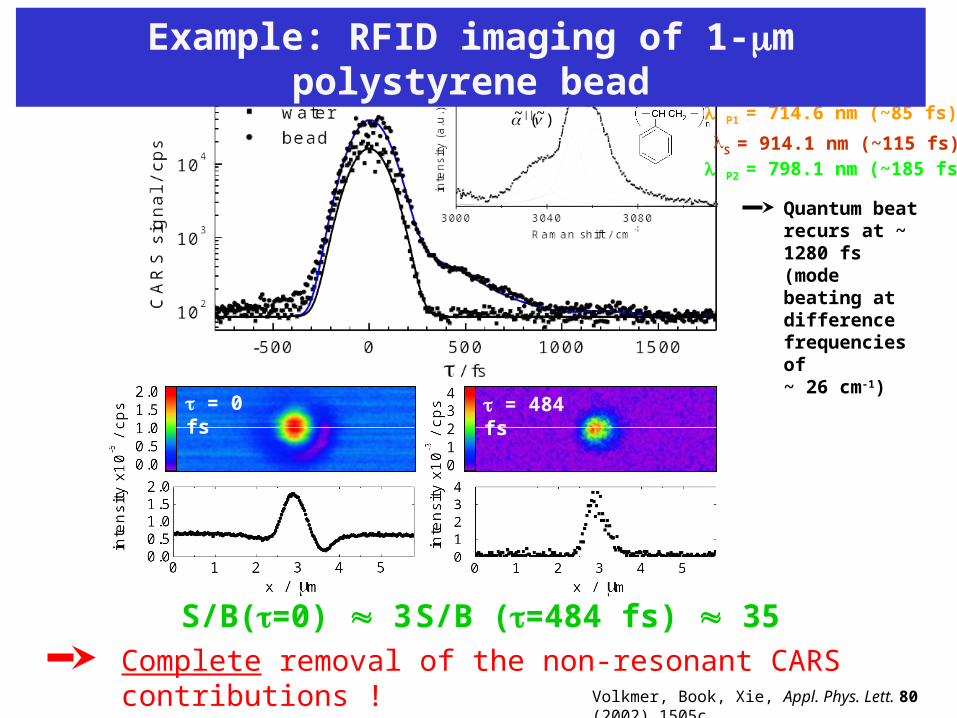
= 0 fs
S/B(=0) 3
= 484 fs
S/B (=484 fs) 35Complete removal of the non-resonant CARS contributions !
P1 = 714.6 nm (~85 fs)
S = 914.1 nm (~115 fs)
P2 = 798.1 nm (~185 fs)
Quantum beat recurs at ~ 1280 fs (mode beating at difference frequencies of~ 26 cm-1)
Volkmer, Book, Xie, Appl. Phys. Lett. 80 (2002) 1505c
Example: RFID imaging of 1-m polystyrene bead

Coherent Vibrational Imaging beyond CARS
Simplifying coherent Raman microscopy by use of a nonlinear optical imaging technique which
maps only the imaginary part of (3)
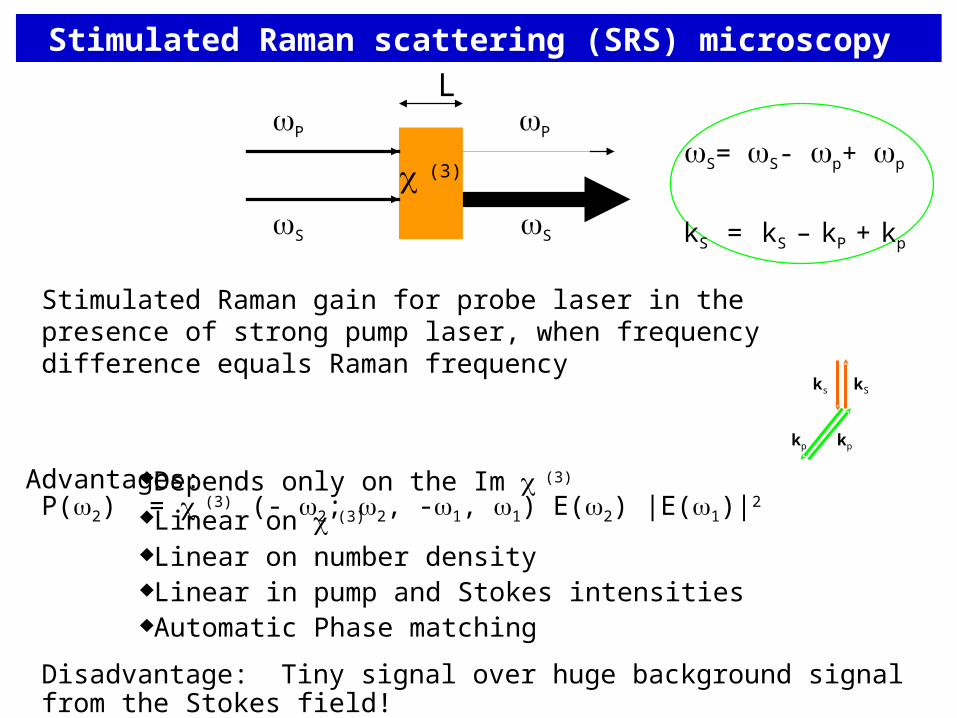
Stimulated Raman gain for probe laser in the presence of strong pump laser, when frequency difference equals Raman frequency
P(2) = (3)
(- 2; 2, -1, 1) E(2) |E(1)|2
S= S- p+ p
kS = kS – kP + kp
Stimulated Raman scattering (SRS) microscopy
Depends only on the Im (3)
Linear on (3)
Linear on number densityLinear in pump and Stokes intensitiesAutomatic Phase matching
Advantages:
ks kS
kp kp
(3)
LP P
S S
Disadvantage: Tiny signal over huge background signal from the Stokes field!
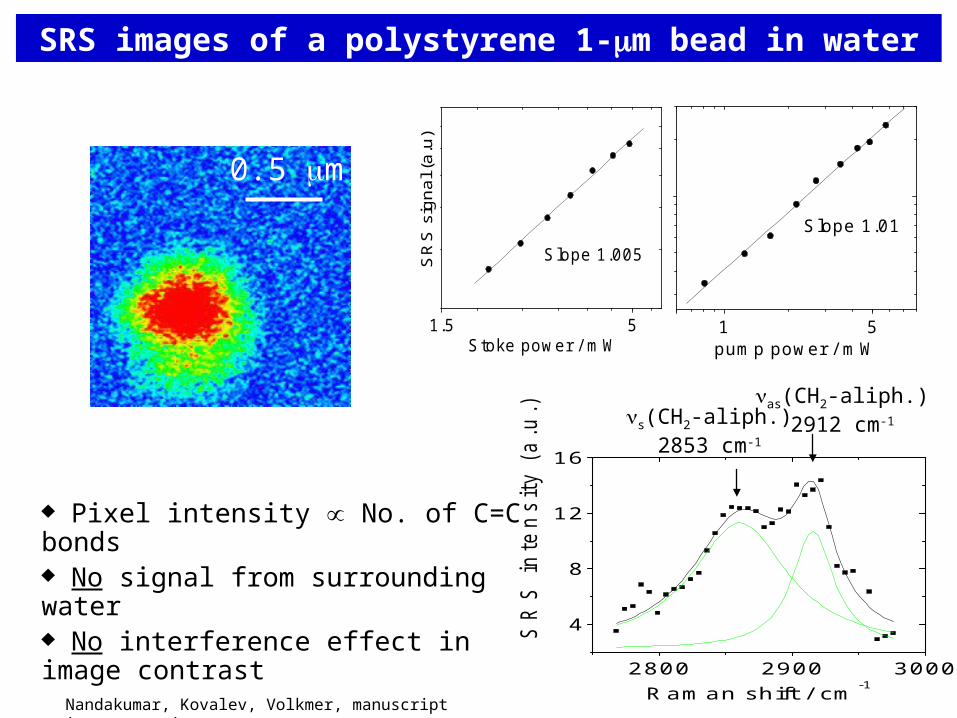
1 5
Slope 1.01
pump power / mW1.5 5
Slope 1.005SR
S s
igna
l (a.
u)
Stoke power / mW
0.5 m
Pixel intensity No. of C=C bonds No signal from surrounding water No interference effect in image contrast
SRS images of a polystyrene 1-m bead in water
2800 2900 3000
4
8
12
16
SR
S in
ten
sity (
a.u
.)
Raman shift / cm-1
s(CH2-aliph.)2853 cm-1
as(CH2-aliph.)2912 cm-1
Nandakumar, Kovalev, Volkmer, manuscript in preparation
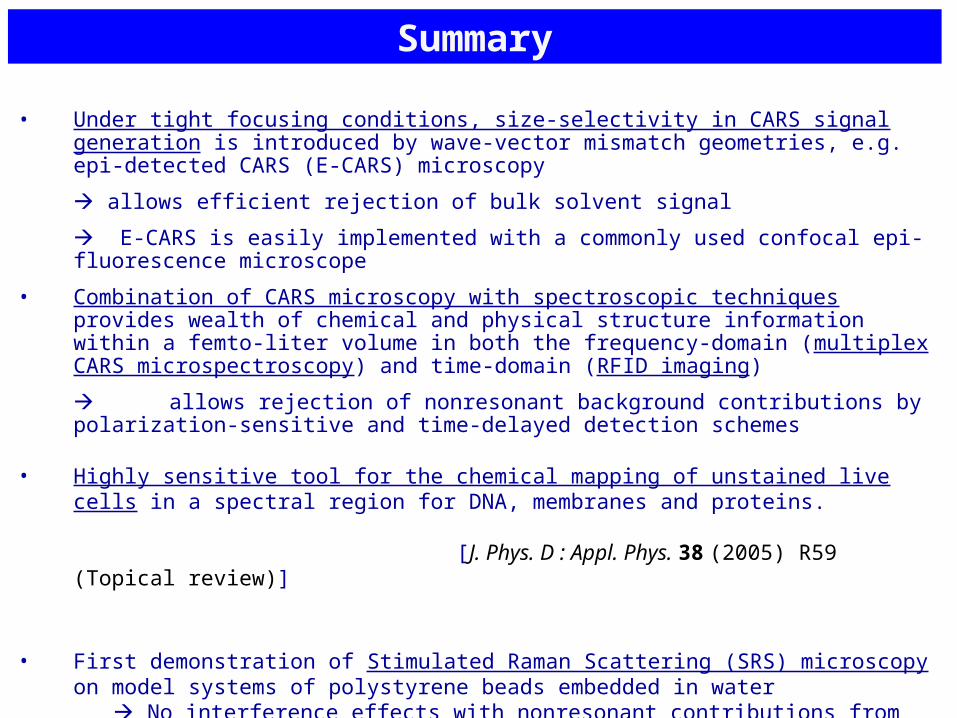
Summary
• Under tight focusing conditions, size-selectivity in CARS signal generation is introduced by wave-vector mismatch geometries, e.g. epi-detected CARS (E-CARS) microscopy
allows efficient rejection of bulk solvent signal
E-CARS is easily implemented with a commonly used confocal epi-fluorescence microscope
• Combination of CARS microscopy with spectroscopic techniques provides wealth of chemical and physical structure information within a femto-liter volume in both the frequency-domain (multiplex CARS microspectroscopy) and time-domain (RFID imaging)
allows rejection of nonresonant background contributions by polarization-sensitive and time-delayed detection schemes
• Highly sensitive tool for the chemical mapping of unstained live cells in a spectral region for DNA, membranes and proteins.
[J. Phys. D : Appl. Phys. 38 (2005) R59 (Topical review)]
• First demonstration of Stimulated Raman Scattering (SRS) microscopy on model systems of polystyrene beads embedded in water
No interference effects with nonresonant contributions from both object and matrix SRS spectra qualitatively reproduce the Raman spectra
Harvard University
X.S. Xie J.-X. Cheng
L.D. Book
3. Physikalische Institut, Universität Stuttgart:
P. NandakumarA. Kovalev
Roswell Park Cancer Institute, Buffalo, NY:
A. SenM. Koehler
Acknowledgements
Emmy Noether Program Faculty of Arts and Sciences of Harvard University
€€ $$