Embed Size (px)
Citation preview
VIA ELECTRONIC SUBMISSION
August 11, 2011
Environmental Protection Agency
Air and Radiation Docket and Information Center
Environmental Protection Agency
Mailcode: 2822T
1200 Pennsylvania Avenue, NW
Washington, D.C. 20460
RE: Regulation of Fuels and Fuel Additives: 2012 Renewable Fuel Standards:
Docket ID No. EPA–HQ–OAR–2010–0133
The American Cleaning Institute® (ACI, formerly The Soap and Detergent Association, SDA)
represents the $30 billion U.S. cleaning products market and includes the formulators of soaps,
detergents, and general cleaning products used in household, commercial, industrial and
institutional settings; companies that supply ingredients and finished packaging for these
products; and oleochemical producers.
We appreciate the opportunity to provide comments on the proposed 2012 Renewable Fuel
Standards and the volume requirements for biomass-based diesel in 2013 and beyond. As
outlined below, ACI has serious concerns regarding the 2012 Renewable Fuel Standards and
2013 biomass-based diesel volume mandate. The proposal will have a serious and significant
impact on ACI member companies’ ability to source animal fats for use as an oleochemical
feedstock. We respectfully request that EPA use its discretionary authority to lower, rather than
raise the volume requirements for biomass-based diesel and advanced biofuel, or, alternatively,
to exclude animal fats as a feedstock option. The proposed volumes would divert even larger
quantities of a finite inelastic supply of animal fats to the biofuels market, thereby critically
disadvantaging the domestic oleochemical industry.
Combined government policies have driven the price of tallow above that of palm oil for the first
time in history. More importantly, the proposed rule, with its higher volumes, now threatens the
availability of animal fats for use in oleochemicals. Unless these government policies are
reversed, the domestic oleochemical industry stands to be driven offshore to Southeast Asia to be
near its new raw material source, i.e. palm oil. While it is somewhat difficult to tease out
industry specific numbers from the Standard Industry Codes (SIC) or Dunn and Bradstreet, our
American Cleaning Institute 2012 Renewable Fuel Standards August 11, 2011
2
best estimate is that the oleochemical industry currently directly supports 20,000 breadwinner
jobs in the United States.
Executive Summary
The price of animal fats has dramatically increased under the combined policies of the
RFS2 and tax incentives for biofuels
Biofuel production consumes a significant amount of the total supply of animal fats and
current policies threaten not only the price but the availability of animal fats for
oleochemical production
For the first time in history, the price of animal fats now exceeds that of Malaysian palm
oil
Switching to palm oil by the oleochemical industry threatens 20,000 U.S. jobs
EPA must use all its available discretion to exempt or minimize the use of animal fats
under the RFS2 mandates and include the Proposed Rule’s impact on the oleochemical
industry in its analysis of impacts on other sectors and industries. The EPA must address
the potential job loss in collateral industries (Section IV. A of Proposed Rule)
The use of animal fats to make biodiesel could consume a given year’s total supply of
animal fat
Agency mandates should not choose winners and losers. EPA has a responsibility, if not
duty, to equally protect all industries that rely on animal fats to produce goods
Market Conditions under 1.0 billion gallon mandate
Since the adoption of federal policies encouraging the use of animal fats as a biofuels feedstock,
the price of animal fats has increased significantly. The average yearly price of animal fats (BFT
Delivered Chicago) has, as the table below shows, increased from $0.19 in 2006 to $0.44 in
2011.1
1 The Jacobsen; 2011 data is 6 month average (January through June 2011).
American Cleaning Institute 2012 Renewable Fuel Standards August 11, 2011
3
Table 1.
Average Yearly Price BFT - Delivered Chicago Price Change
(year to year)
Percent Change
(year to year)
2006 $0.19 N/A N/A
2007 $0.28 $0.09 50.5%
2008 $0.34 $0.06 23.2%
2009 $0.25 -$0.09 -26.6%
2010 $0.33 $0.08 32.6%
2011 (Jan-June) $0.44 $0.11 32.4%
Source: The Jacobsen
During this same period (2006-2010) domestic production of rendered products has generally
trended downward from a 2006 level of 4,534.9 metric tons to 4,264.5 metric tons in 2010, a
reduction of 270.4 metric tons.2 Unlike other commodity markets, where higher prices lead to
greater supply, animal fats operate in an inelastic market.
Table 2.
U.S. Production of Rendered Products (000 Metric Tons) 2006 2007 2008 2009 2010
Inedible tallow and greases (total): 2963.8 3006.5 2880.8 2821.5 2668.1
Inedible tallow 1737.8 1727.5 1610.7 1531.1 1511.2
Greases 1226.0 1279.0 1270.1 1290.3 1156.9
Yellow grease 671.4 700.0 769.1 740.3 569.2
Other grease 554.6 579.0 501.1 550.0 588.3
Edible tallow 844.3 811.4 813.7 833.4 827.6
Lard 143.8 211.2 222.6 157.0 130.4
Poultry fat 583.0 624.8 659.3 625.4 638.3
Subtotal 4534.9 4653.9 4576.4 4437.3 4264.5
Year to Year Difference N/A 119.00 -77.50 -139.10 -172.80
Percent of Supply Change N/A 2.56 -1.69 -3.13 -4.05
Source: Render Magazine, April 2009 and April 2011
The supply of animal fats is inelastic.
At the same time that the RFS2 mandates have been implemented for biomass-based diesel, the
supply of animal fats has fallen 8.3% from 2007-2010. The decline stems from many factors,
including an economic downturn that caused consumers to decrease their consumption of beef
products. Livestock owners also decreased their herds as the cost of production increased due to
higher feed prices, driven in part by corn ethanol. This has led to fewer animals being brought to
2 Render Magazine, April 2009 and April 2011
American Cleaning Institute 2012 Renewable Fuel Standards August 11, 2011
4
market. Livestock production is geared to food supply, not fuel. Animal fats are a co-product of
livestock slaughter, not a demand driver. Consequently, there is no reasonable prospect that
production will increase significantly, farmers and ranchers do not raise or slaughter animals for
their fats.
Historically, animal fats have provided domestic oleochemical producers a competitive raw
material cost advantage over foreign-sourced palm. As a result of the RFS2 mandates as well as
tax credits that support diversion of animal fats to biofuel production, that raw material price
advantage has now been lost for the first time (see Graph 1). Oleochemicals are the original
“green” chemistry. They are used in a wide range of value-added household and industrial
products (see Appendix A). In view of this history, any characterization of animal fats as
“waste” is false. Waste implies something that does not otherwise have a value. This is not the
case with animal fats. Papers of record, such as the Wall Street Journal and New York Times, list
the commodity prices of the various animal fats used for production in hundreds of products.
These prices are also the collected and published by private firms such as ICIS-LOR and The
Jacobsen Letter.
Supply shortages lead to raw material price increases.
As noted above, in 2011 the price of tallow has increased $0.11 to $0.44 from an already high
price of $0.33 in 2010.3
Table 3.
Average Yearly Price
BFT -
Delivered
Chicago
Soyoil Crude
Degummed -
Illinois
BFT - Soyoil
Crude
Degummed
Technical
Tallow
(Cents/Lb)
Palm
Stearin FOB
Malaysia
(Cents/Lb)
Technical
Tallow -
Palm
Stearin
2006 $0.19 $0.27 -$0.09 $0.19 $0.20 -$0.01
2007 $0.28 $0.35 -$0.08 $0.29 $0.33 -$0.03
2008 $0.34 $0.50 -$0.16 $0.37 $0.37 $0.00
2009 $0.25 $0.33 -$0.08 $0.28 $0.28 $0.00
2010 $0.33 $0.39 -$0.06 $0.36 $0.39 -$0.03
2011 (Jan-June) $0.44 $0.50 -$0.06 $0.53 $0.49 $0.04
Source: The Jacobsen
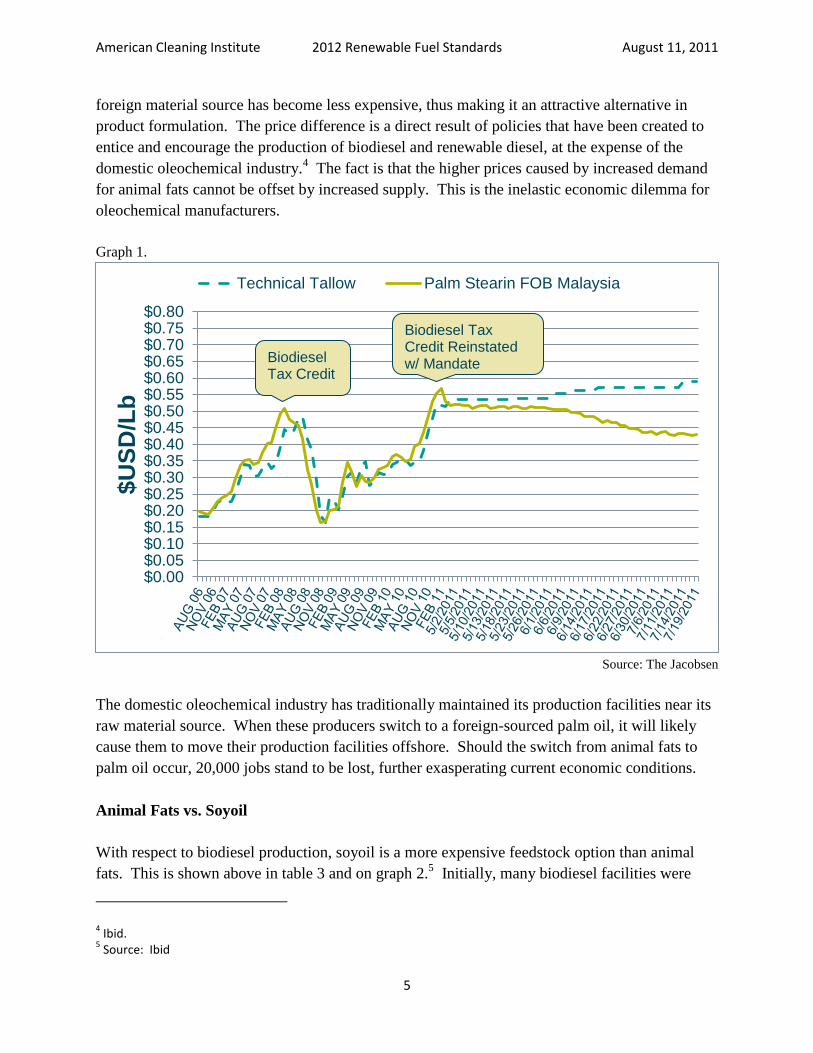
The effect the RFS2 mandate and the $1.00 per gallon biodiesel and renewable diesel tax credits
have had on the prices for animal fats and palm oil is shown in the table above and more
dramatically on the graph below. A guaranteed market combined with a tax credit, has made the
price of Malaysian palm oil cheaper than animal fats i.e. technical tallow, for the first time. This
3 Source: The Jacobsen
American Cleaning Institute 2012 Renewable Fuel Standards August 11, 2011
5
foreign material source has become less expensive, thus making it an attractive alternative in
product formulation. The price difference is a direct result of policies that have been created to
entice and encourage the production of biodiesel and renewable diesel, at the expense of the
domestic oleochemical industry.4 The fact is that the higher prices caused by increased demand
for animal fats cannot be offset by increased supply. This is the inelastic economic dilemma for
oleochemical manufacturers.
Graph 1.
Source: The Jacobsen
The domestic oleochemical industry has traditionally maintained its production facilities near its
raw material source. When these producers switch to a foreign-sourced palm oil, it will likely
cause them to move their production facilities offshore. Should the switch from animal fats to
palm oil occur, 20,000 jobs stand to be lost, further exasperating current economic conditions.
Animal Fats vs. Soyoil
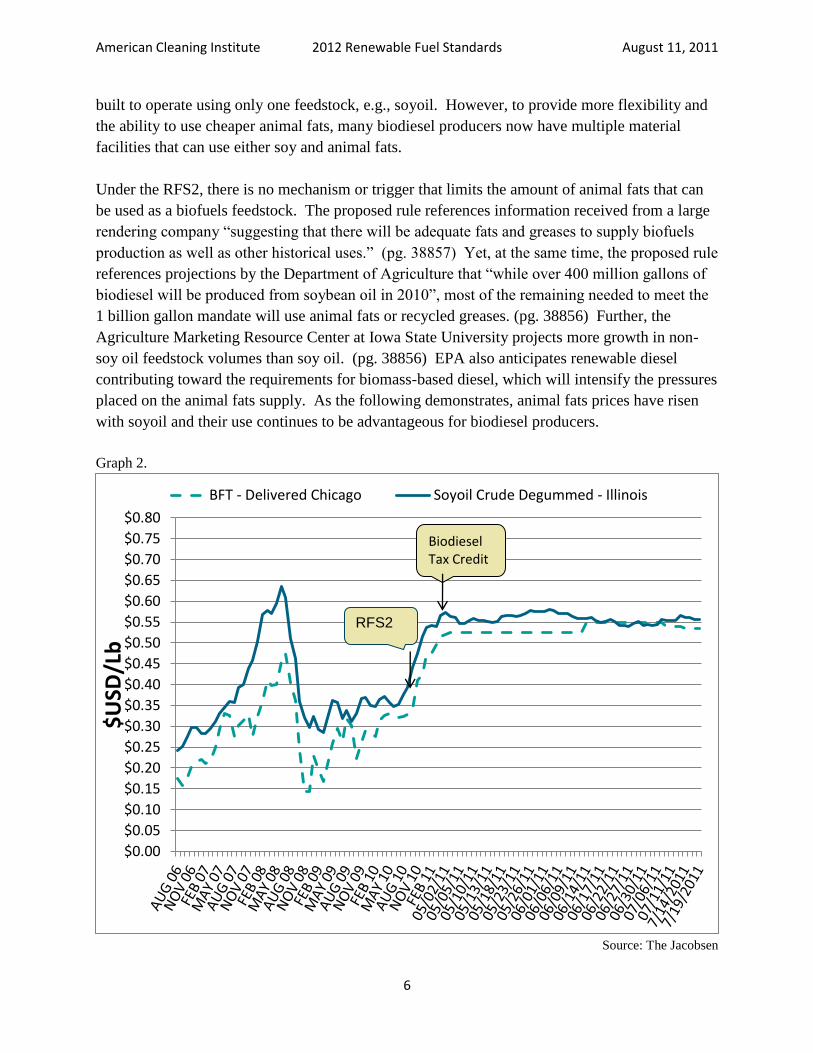
With respect to biodiesel production, soyoil is a more expensive feedstock option than animal
fats. This is shown above in table 3 and on graph 2.5 Initially, many biodiesel facilities were
4 Ibid.
5 Source: Ibid
$0.00$0.05$0.10$0.15$0.20$0.25$0.30$0.35$0.40$0.45$0.50$0.55$0.60$0.65$0.70$0.75$0.80
$U
SD
/Lb
Technical Tallow Palm Stearin FOB Malaysia
Biodiesel Tax Credit Reinstated w/ Mandate Biodiesel
Tax Credit
American Cleaning Institute 2012 Renewable Fuel Standards August 11, 2011
6
built to operate using only one feedstock, e.g., soyoil. However, to provide more flexibility and
the ability to use cheaper animal fats, many biodiesel producers now have multiple material
facilities that can use either soy and animal fats.
Under the RFS2, there is no mechanism or trigger that limits the amount of animal fats that can
be used as a biofuels feedstock. The proposed rule references information received from a large
rendering company “suggesting that there will be adequate fats and greases to supply biofuels
production as well as other historical uses.” (pg. 38857) Yet, at the same time, the proposed rule
references projections by the Department of Agriculture that “while over 400 million gallons of
biodiesel will be produced from soybean oil in 2010”, most of the remaining needed to meet the
1 billion gallon mandate will use animal fats or recycled greases. (pg. 38856) Further, the
Agriculture Marketing Resource Center at Iowa State University projects more growth in non-
soy oil feedstock volumes than soy oil. (pg. 38856) EPA also anticipates renewable diesel
contributing toward the requirements for biomass-based diesel, which will intensify the pressures
placed on the animal fats supply. As the following demonstrates, animal fats prices have risen
with soyoil and their use continues to be advantageous for biodiesel producers.
Graph 2.
Source: The Jacobsen
$0.00
$0.05
$0.10
$0.15
$0.20
$0.25
$0.30
$0.35
$0.40
$0.45
$0.50
$0.55
$0.60
$0.65
$0.70
$0.75
$0.80
$U
SD/L
b
BFT - Delivered Chicago Soyoil Crude Degummed - Illinois
Biodiesel Tax Credit
RFS2
American Cleaning Institute 2012 Renewable Fuel Standards August 11, 2011
7
Expansion of RFS2 Mandate Compounds Animal Fats Crisis: 7.5 pounds = 1 gal Biodiesel6
The market conditions outlined earlier do not take into account the effect the proposed 2012
requirement of 1.0 billion gallons or the 2013 proposed requirement of 1.28 billion gallons will
have on the cost and availability of animal fats. Of further concern is EPA’s proposed decision
not to lower the advanced fuel mandate, based on the premise that biomass-based diesel,
renewable diesel and other biofuels could fill the gap.
In 2009, when the Statute called for 0.5 billion gallons of biomass-based diesel, the Energy
Information Administration (EIA) reported that 1.04 billion pounds of animal fats were used as
inputs to biodiesel production.7 Those 1.04 billion pounds of animal fats created approximately
186,666,667 gallons of biodiesel.8 Total production of rendered products for that year was
4,437.3 (000 Metric Tons) or 9,782,571,951.73 pounds.9
10.6% of the supply of rendered products was used to produce 2009’s biodiesel fuel.10
There is
nothing in EISA or the proposed rule that limits the amount of animal fats that can be used to
meet the mandate. The usage of animal fats could range up to 100%. With no mechanism to
limit the usage amount of any feedstock, had 100% of the 0.5 billion gallons been met through
animal fats, 3.75 billion pounds of animal fats would have been used, taking 38% of all animal
fats out of the market place.
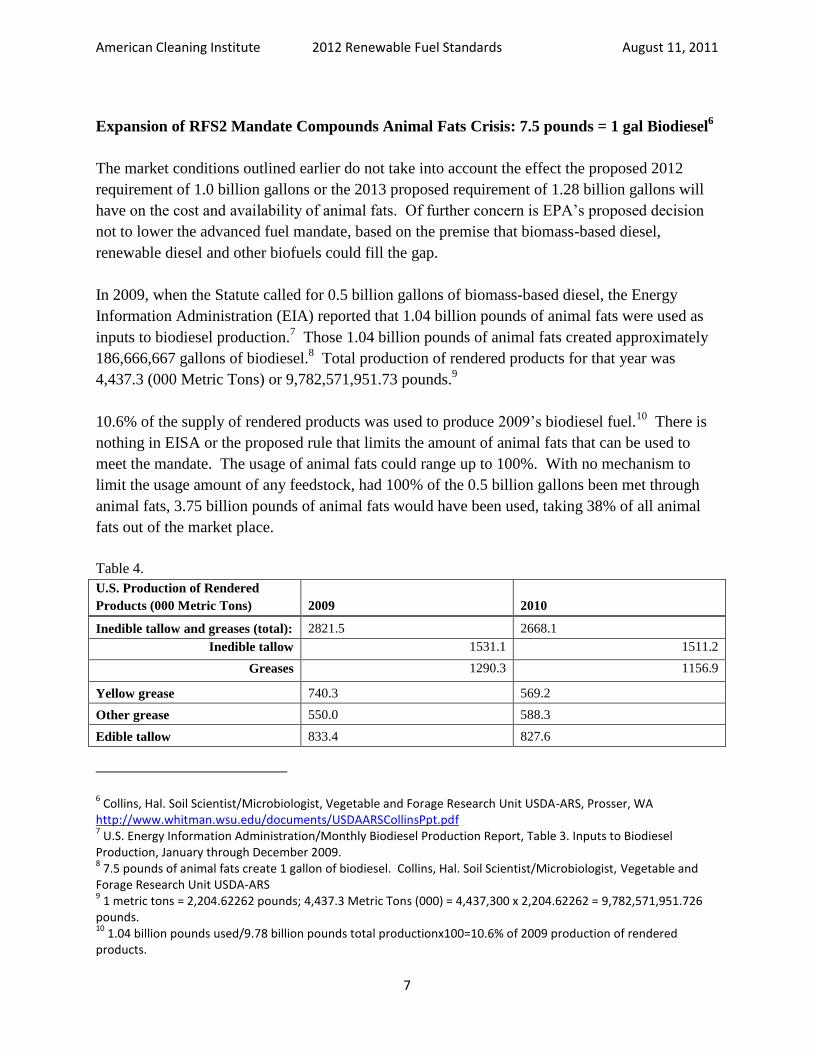
Table 4.
U.S. Production of Rendered
Products (000 Metric Tons) 2009 2010
Inedible tallow and greases (total): 2821.5 2668.1
Inedible tallow 1531.1 1511.2
Greases 1290.3 1156.9
Yellow grease 740.3 569.2
Other grease 550.0 588.3
Edible tallow 833.4 827.6
6 Collins, Hal. Soil Scientist/Microbiologist, Vegetable and Forage Research Unit USDA-ARS, Prosser, WA
http://www.whitman.wsu.edu/documents/USDAARSCollinsPpt.pdf 7 U.S. Energy Information Administration/Monthly Biodiesel Production Report, Table 3. Inputs to Biodiesel
Production, January through December 2009. 8 7.5 pounds of animal fats create 1 gallon of biodiesel. Collins, Hal. Soil Scientist/Microbiologist, Vegetable and
Forage Research Unit USDA-ARS 9 1 metric tons = 2,204.62262 pounds; 4,437.3 Metric Tons (000) = 4,437,300 x 2,204.62262 = 9,782,571,951.726
pounds. 10
1.04 billion pounds used/9.78 billion pounds total productionx100=10.6% of 2009 production of rendered products.
American Cleaning Institute 2012 Renewable Fuel Standards August 11, 2011
8
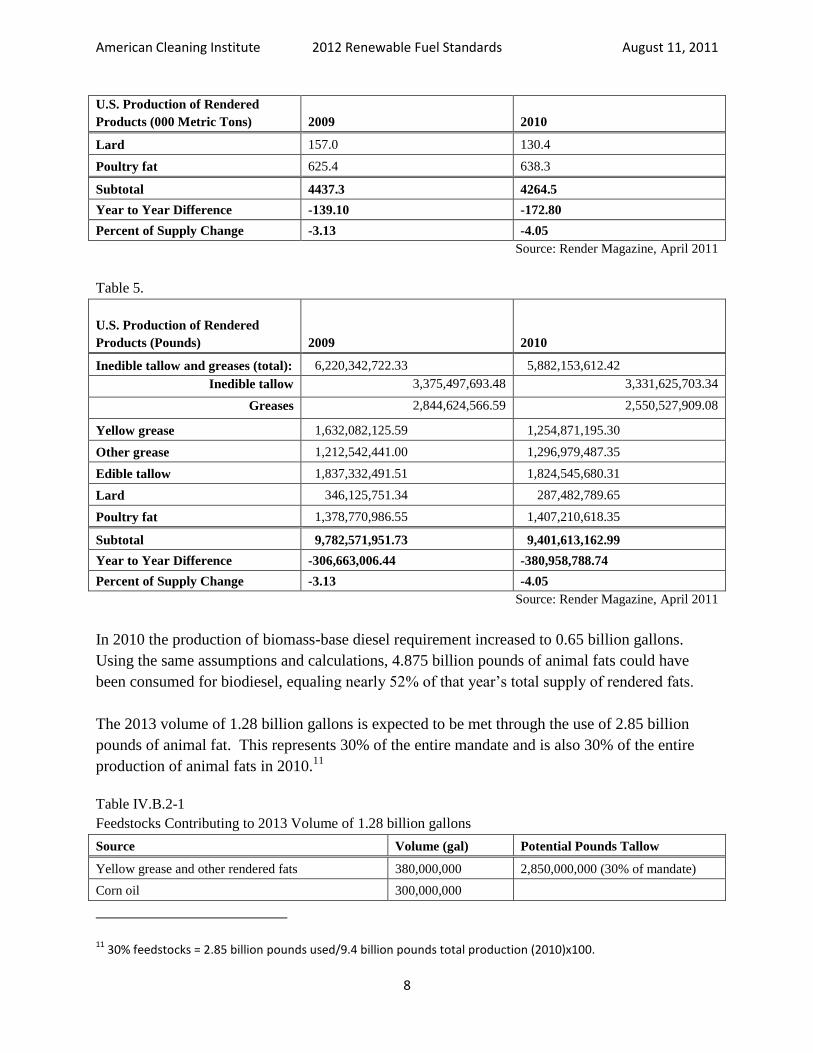
U.S. Production of Rendered
Products (000 Metric Tons) 2009 2010
Lard 157.0 130.4
Poultry fat 625.4 638.3
Subtotal 4437.3 4264.5
Year to Year Difference -139.10 -172.80
Percent of Supply Change -3.13 -4.05
Source: Render Magazine, April 2011
Table 5.
U.S. Production of Rendered
Products (Pounds) 2009 2010
Inedible tallow and greases (total): 6,220,342,722.33 5,882,153,612.42
Inedible tallow 3,375,497,693.48 3,331,625,703.34
Greases 2,844,624,566.59 2,550,527,909.08
Yellow grease 1,632,082,125.59 1,254,871,195.30
Other grease 1,212,542,441.00 1,296,979,487.35
Edible tallow 1,837,332,491.51 1,824,545,680.31
Lard 346,125,751.34 287,482,789.65
Poultry fat 1,378,770,986.55 1,407,210,618.35
Subtotal 9,782,571,951.73 9,401,613,162.99
Year to Year Difference -306,663,006.44 -380,958,788.74
Percent of Supply Change -3.13 -4.05
Source: Render Magazine, April 2011
In 2010 the production of biomass-base diesel requirement increased to 0.65 billion gallons.
Using the same assumptions and calculations, 4.875 billion pounds of animal fats could have
been consumed for biodiesel, equaling nearly 52% of that year’s total supply of rendered fats.
The 2013 volume of 1.28 billion gallons is expected to be met through the use of 2.85 billion
pounds of animal fat. This represents 30% of the entire mandate and is also 30% of the entire
production of animal fats in 2010.11
Table IV.B.2-1
Feedstocks Contributing to 2013 Volume of 1.28 billion gallons
Source Volume (gal) Potential Pounds Tallow
Yellow grease and other rendered fats 380,000,000 2,850,000,000 (30% of mandate)
Corn oil 300,000,000
11 30% feedstocks = 2.85 billion pounds used/9.4 billion pounds total production (2010)x100.
American Cleaning Institute 2012 Renewable Fuel Standards August 11, 2011
9
Source Volume (gal) Potential Pounds Tallow
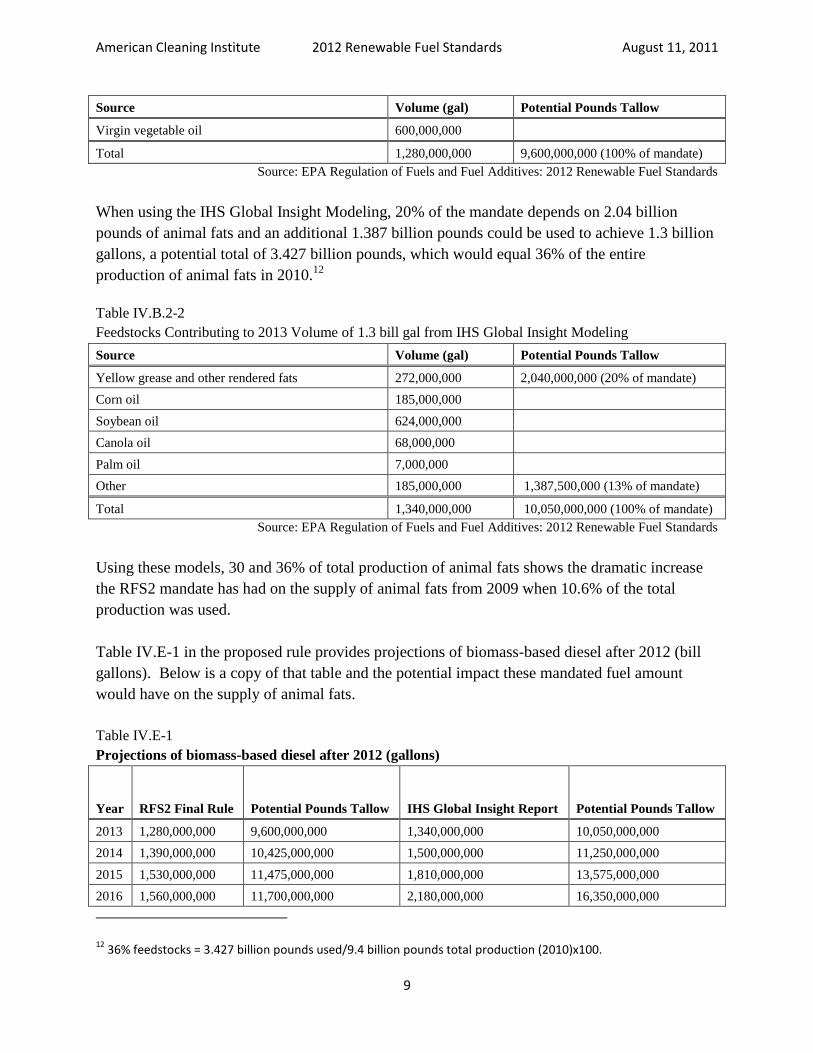
Virgin vegetable oil 600,000,000
Total 1,280,000,000 9,600,000,000 (100% of mandate)
Source: EPA Regulation of Fuels and Fuel Additives: 2012 Renewable Fuel Standards
When using the IHS Global Insight Modeling, 20% of the mandate depends on 2.04 billion
pounds of animal fats and an additional 1.387 billion pounds could be used to achieve 1.3 billion
gallons, a potential total of 3.427 billion pounds, which would equal 36% of the entire
production of animal fats in 2010.12
Table IV.B.2-2
Feedstocks Contributing to 2013 Volume of 1.3 bill gal from IHS Global Insight Modeling
Source Volume (gal) Potential Pounds Tallow
Yellow grease and other rendered fats 272,000,000 2,040,000,000 (20% of mandate)
Corn oil 185,000,000
Soybean oil 624,000,000
Canola oil 68,000,000
Palm oil 7,000,000
Other 185,000,000 1,387,500,000 (13% of mandate)
Total 1,340,000,000 10,050,000,000 (100% of mandate)
Source: EPA Regulation of Fuels and Fuel Additives: 2012 Renewable Fuel Standards
Using these models, 30 and 36% of total production of animal fats shows the dramatic increase
the RFS2 mandate has had on the supply of animal fats from 2009 when 10.6% of the total
production was used.
Table IV.E-1 in the proposed rule provides projections of biomass-based diesel after 2012 (bill
gallons). Below is a copy of that table and the potential impact these mandated fuel amount
would have on the supply of animal fats.
Table IV.E-1
Projections of biomass-based diesel after 2012 (gallons)
Year RFS2 Final Rule Potential Pounds Tallow IHS Global Insight Report Potential Pounds Tallow
2013 1,280,000,000 9,600,000,000 1,340,000,000 10,050,000,000
2014 1,390,000,000 10,425,000,000 1,500,000,000 11,250,000,000
2015 1,530,000,000 11,475,000,000 1,810,000,000 13,575,000,000
2016 1,560,000,000 11,700,000,000 2,180,000,000 16,350,000,000
12 36% feedstocks = 3.427 billion pounds used/9.4 billion pounds total production (2010)x100.
American Cleaning Institute 2012 Renewable Fuel Standards August 11, 2011
10
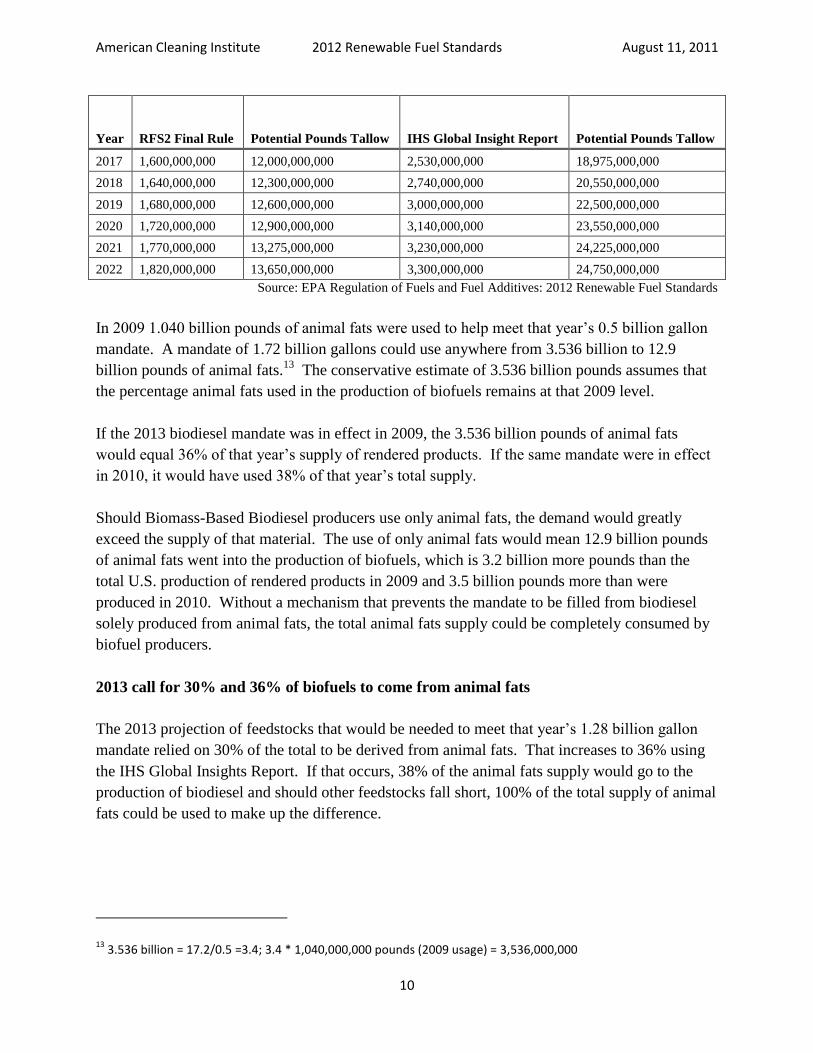
Year RFS2 Final Rule Potential Pounds Tallow IHS Global Insight Report Potential Pounds Tallow
2017 1,600,000,000 12,000,000,000 2,530,000,000 18,975,000,000
2018 1,640,000,000 12,300,000,000 2,740,000,000 20,550,000,000
2019 1,680,000,000 12,600,000,000 3,000,000,000 22,500,000,000
2020 1,720,000,000 12,900,000,000 3,140,000,000 23,550,000,000
2021 1,770,000,000 13,275,000,000 3,230,000,000 24,225,000,000
2022 1,820,000,000 13,650,000,000 3,300,000,000 24,750,000,000
Source: EPA Regulation of Fuels and Fuel Additives: 2012 Renewable Fuel Standards
In 2009 1.040 billion pounds of animal fats were used to help meet that year’s 0.5 billion gallon
mandate. A mandate of 1.72 billion gallons could use anywhere from 3.536 billion to 12.9
billion pounds of animal fats.13
The conservative estimate of 3.536 billion pounds assumes that
the percentage animal fats used in the production of biofuels remains at that 2009 level.
If the 2013 biodiesel mandate was in effect in 2009, the 3.536 billion pounds of animal fats
would equal 36% of that year’s supply of rendered products. If the same mandate were in effect
in 2010, it would have used 38% of that year’s total supply.
Should Biomass-Based Biodiesel producers use only animal fats, the demand would greatly
exceed the supply of that material. The use of only animal fats would mean 12.9 billion pounds
of animal fats went into the production of biofuels, which is 3.2 billion more pounds than the
total U.S. production of rendered products in 2009 and 3.5 billion pounds more than were
produced in 2010. Without a mechanism that prevents the mandate to be filled from biodiesel
solely produced from animal fats, the total animal fats supply could be completely consumed by
biofuel producers.
2013 call for 30% and 36% of biofuels to come from animal fats
The 2013 projection of feedstocks that would be needed to meet that year’s 1.28 billion gallon
mandate relied on 30% of the total to be derived from animal fats. That increases to 36% using
the IHS Global Insights Report. If that occurs, 38% of the animal fats supply would go to the
production of biodiesel and should other feedstocks fall short, 100% of the total supply of animal
fats could be used to make up the difference.
13 3.536 billion = 17.2/0.5 =3.4; 3.4 * 1,040,000,000 pounds (2009 usage) = 3,536,000,000
American Cleaning Institute 2012 Renewable Fuel Standards August 11, 2011
11
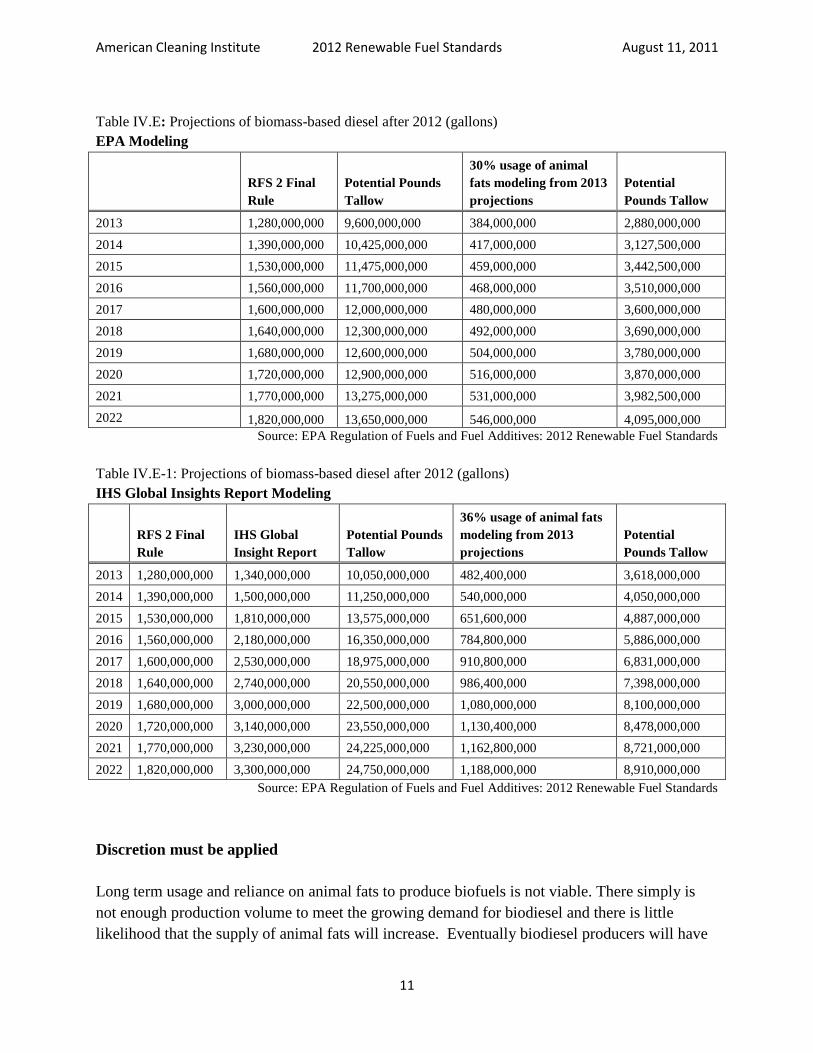
Table IV.E: Projections of biomass-based diesel after 2012 (gallons)
EPA Modeling
RFS 2 Final
Rule
Potential Pounds
Tallow
30% usage of animal
fats modeling from 2013
projections
Potential
Pounds Tallow
2013 1,280,000,000 9,600,000,000 384,000,000 2,880,000,000
2014 1,390,000,000 10,425,000,000 417,000,000 3,127,500,000
2015 1,530,000,000 11,475,000,000 459,000,000 3,442,500,000
2016 1,560,000,000 11,700,000,000 468,000,000 3,510,000,000
2017 1,600,000,000 12,000,000,000 480,000,000 3,600,000,000
2018 1,640,000,000 12,300,000,000 492,000,000 3,690,000,000
2019 1,680,000,000 12,600,000,000 504,000,000 3,780,000,000
2020 1,720,000,000 12,900,000,000 516,000,000 3,870,000,000
2021 1,770,000,000 13,275,000,000 531,000,000 3,982,500,000
2022 1,820,000,000 13,650,000,000 546,000,000 4,095,000,000
Source: EPA Regulation of Fuels and Fuel Additives: 2012 Renewable Fuel Standards
Table IV.E-1: Projections of biomass-based diesel after 2012 (gallons)
IHS Global Insights Report Modeling
RFS 2 Final
Rule
IHS Global
Insight Report
Potential Pounds
Tallow
36% usage of animal fats
modeling from 2013
projections
Potential
Pounds Tallow
2013 1,280,000,000 1,340,000,000 10,050,000,000 482,400,000 3,618,000,000
2014 1,390,000,000 1,500,000,000 11,250,000,000 540,000,000 4,050,000,000
2015 1,530,000,000 1,810,000,000 13,575,000,000 651,600,000 4,887,000,000
2016 1,560,000,000 2,180,000,000 16,350,000,000 784,800,000 5,886,000,000
2017 1,600,000,000 2,530,000,000 18,975,000,000 910,800,000 6,831,000,000
2018 1,640,000,000 2,740,000,000 20,550,000,000 986,400,000 7,398,000,000
2019 1,680,000,000 3,000,000,000 22,500,000,000 1,080,000,000 8,100,000,000
2020 1,720,000,000 3,140,000,000 23,550,000,000 1,130,400,000 8,478,000,000
2021 1,770,000,000 3,230,000,000 24,225,000,000 1,162,800,000 8,721,000,000
2022 1,820,000,000 3,300,000,000 24,750,000,000 1,188,000,000 8,910,000,000
Source: EPA Regulation of Fuels and Fuel Additives: 2012 Renewable Fuel Standards
Discretion must be applied
Long term usage and reliance on animal fats to produce biofuels is not viable. There simply is
not enough production volume to meet the growing demand for biodiesel and there is little
likelihood that the supply of animal fats will increase. Eventually biodiesel producers will have
American Cleaning Institute 2012 Renewable Fuel Standards August 11, 2011
12
to use feedstocks other than animal fats. This inevitability should cause EPA to exclude their
usage in 2012 and beyond to drive the use of more sustainable feedstock supplies. This would
go a long way toward protecting the continued viability of the U.S.-based oleochemical industry.
Without a consistent and adequate supply of animal fats as a feedstock for the production of
oleochemicals, the industry will need to turn to other non-US sourced feedstocks, which over
time could result in the US losing this industry.
EPA must use its discretionary authority to ensure adequate supply of these feedstocks for all
industries, not just biofuels. EPA should limit the percentage of animal fat supply that can be
used in the production of biofuels or eliminate animal fats as a feedstock option. It is unfair to
place such a heavy burden on a source that is as inelastic as animal fats. By doing so, EPA is
deciding which industry wins and which one loses. The domestic oleochemical industry has
provided decades of economic strength and security. Consequently, we urge the EPA to
maximize the use its discretion to limit, rather than expand the use of animal fats under the
RFS2. The future of a longstanding domestic industry is at stake.
Respectfully submitted,
Dennis Griesing
Vice President, Government Affairs
The American Cleaning Institute
Suite 650
1331 L Street, NW
Washington, D.C. 20005
202-662-2518
American Cleaning Institute 2012 Renewable Fuel Standards August 11, 2011
13
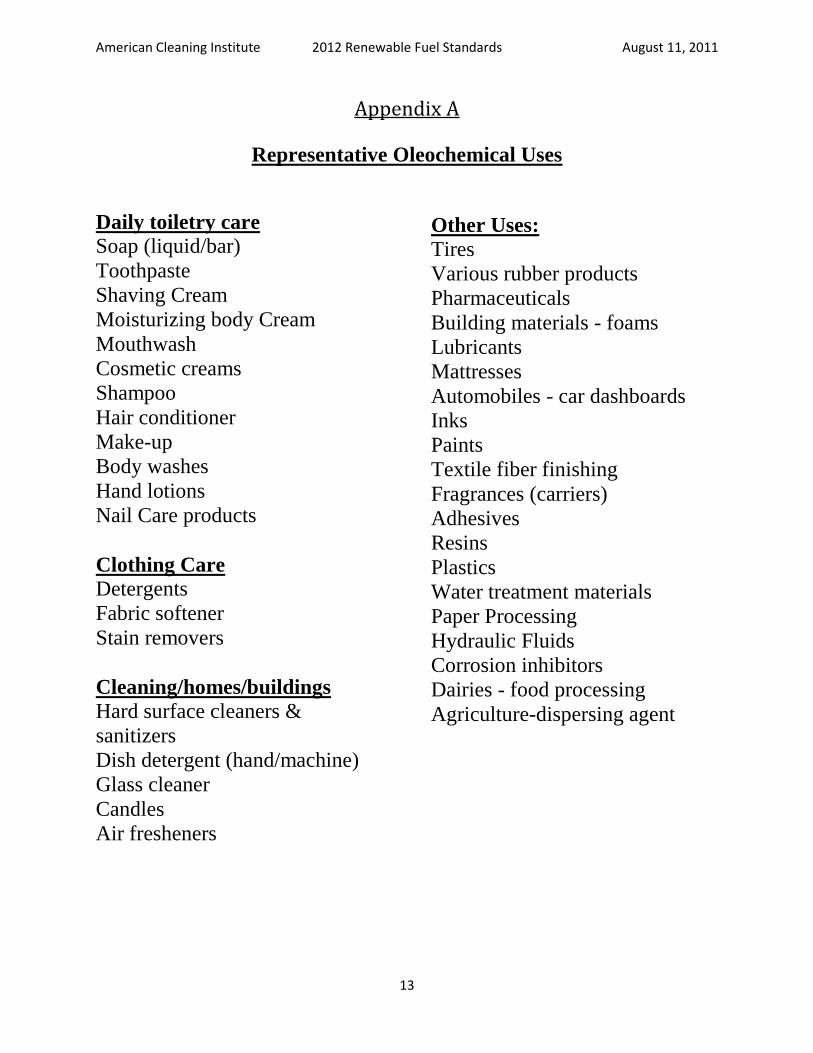
Appendix A
Representative Oleochemical Uses
Daily toiletry care
Soap (liquid/bar)
Toothpaste
Shaving Cream
Moisturizing body Cream
Mouthwash
Cosmetic creams
Shampoo
Hair conditioner
Make-up
Body washes
Hand lotions
Nail Care products
Clothing Care
Detergents
Fabric softener
Stain removers
Cleaning/homes/buildings
Hard surface cleaners &
sanitizers
Dish detergent (hand/machine)
Glass cleaner
Candles
Air fresheners
Other Uses:
Tires
Various rubber products
Pharmaceuticals
Building materials - foams
Lubricants
Mattresses
Automobiles - car dashboards
Inks
Paints
Textile fiber finishing
Fragrances (carriers)
Adhesives
Resins
Plastics
Water treatment materials
Paper Processing
Hydraulic Fluids
Corrosion inhibitors
Dairies - food processing
Agriculture-dispersing agent