Embed Size (px)
Citation preview

CODA-CERVA
Veterinary and Agrochemical Research Centre
Belgian National Reference Laboratory for Trace Elements in Food and Feed
PT-2012-NRL-TE-FASFC Determination of As, Cd, Pb and Hg in vegetables
Final report
on the 2012 Interlaboratory Comparison organised by the
National Reference Laboratory for Trace Elements in Food
and Feed
25 October 2012
Dr ir Karlien Cheyns and Dr ir Nadia Waegeneers
PT-2012-NRL-TE-FASFC: Determination of As, Cd, Pb and Hg in vegetables 1/23
Contents Summary ................................................................................................................................................. 2
Introduction ............................................................................................................................................ 3
Time frame, test material and instructions to participants .................................................................... 3
Assigned values ....................................................................................................................................... 4
Scores and evaluation criteria ................................................................................................................. 5
Results ..................................................................................................................................................... 7
Arsenic (As) .......................................................................................................................................... 7
Cadmium (Cd) ...................................................................................................................................... 9
Lead (Pb) ............................................................................................................................................ 11
Mercury (Hg) ..................................................................................................................................... 13
Discussion .............................................................................................................................................. 15
Conclusion ............................................................................................................................................. 16
Bibliography .......................................................................................................................................... 16
Annexes ................................................................................................................................................. 17
Annex 1: Invitation letter to laboratories ......................................................................................... 17
Annex 2: Results of the homogeneity studies ................................................................................... 18
Annex 3: Letter accompanying the sample ....................................................................................... 19
Annex 4: Instructions to participants ................................................................................................ 20
Annex 5: Materials receipt form ....................................................................................................... 21
Annex 6: Reporting form and questionnaire .................................................................................... 22

PT-2012-NRL-TE-FASFC: Determination of As, Cd, Pb and Hg in vegetables 2/23
Summary From the 1st of January 2008, the laboratory for Trace Elements in the Veterinary and Agrochemical
Research Centre (CODA-CERVA), Tervuren, operates as National Reference Laboratory for Trace
Elements in Feed and Food (NRL-TE). One of its core tasks is to organise interlaboratory comparisons
(ILCs) among laboratories appointed by the Federal Agency for the Safety of the Food Chain. This
report presents the results of the interlaboratory comparison organised by the NRL-TE which focused
on the determination of trace elements in vegetables. The results from the ILC were treated in
CODA-CERVA, Tervuren.
The 2012 ILC was obligatory for all laboratories approved for the analysis of heavy metals in food,
fruits and/or vegetables by the Federal Agency for the Safety of the Food Chain (FASFC). Ten
laboratories, which were approved for these foodstuffs, registered for and participated in the
exercise. Four other laboratories participated voluntarily.
The test material used in this test was dried spinach. The spinach was freshly obtained from a local
supermarket. The leaves were dried in the oven, milled and homogenized. The material was shaken
for 24 hours prior to be bottled. Each participant received approximately 5 g of test material.
Participants were invited to report the mean value and measurement uncertainty on their results for
arsenic (As), cadmium (Cd), lead (Pb) and mercury (Hg). The assigned values (xa) and their uncertainty
(u(xa)) were determined as the consensus of participant’s results. Standard deviations for proficiency
assessment were calculated using the modified Horwitz equation.
Of the 14 laboratories that registered for participation, 11 submitted results for Pb and 12 submitted
results for As, Cd and Hg Of the 37 z-scores that were calculated, 89% was satisfactory, 3% was
questionable and 8% was unsatisfactory. Of the 37 ζ-scores, 84% was satisfactory, 3 % was
questionable and 14% was unsatisfactory.

PT-2012-NRL-TE-FASFC: Determination of As, Cd, Pb and Hg in vegetables 3/23
Introduction Trace elements occur in varying amounts as natural elements in soils, plants and animals, and
consequentially in food and feed. Concerning food and feed of plant origin, the characteristics of the
soil on which the plants are grown have a considerable influence on the content of trace elements in
the plant. The concentration of trace elements in plants is often correlated to the corresponding
concentrations in the soil on which they were grown, but also soil texture, soil pH and soil organic
matter content influence the trace element content in the plants. To ensure public health, maximum
levels for trace elements in foodstuff have been laid down in the Commission Regulation (EC) No
1881/2006. Regarding leaf vegetables these maximum levels are 0.3 mg/kg fresh weight for lead and
0.2 mg/ kg fresh weight for cadmium. There is currently no European legislation regarding mercury
or arsenic levels in vegetables. Maximum mercury levels are only regulated for fish, fish products and
food supplements.
The scope of this ILC was to test the competence of the participating laboratories to determine the
total mass fraction of As, Cd, Pb and Hg in a leaf vegetable.
Time frame, test material and instructions to participants Invitation letters to this ILC were sent to participants in April (Annex 1). The 2012 ILC was obligatory
for all laboratories approved for the analysis of heavy metals in food, fruits and/or vegetables by the
Federal Agency for the Safety of the Food Chain (FASFC). Ten laboratories, which were approved for
these foodstuffs, registered for and participated in the exercise. Four other laboratories participated
voluntarily. The samples were dispatched to the participants by the beginning of June 2012.
Reporting deadline was 22nd of June. Two voluntary participants did not report their analysis results.
This year the test sample was a dried spinach sample. The material was bought in a local
supermarket (product imported from Spain) and dried at 70°C for 24 hours. The dry material was
milled (Fritsch, Pulverisette 14) and homogenized by rotating for 48 hours. The homogeneity of the
test material was tested following the recommended procedure according to IUPAC [1]. All the trace
elements appeared to be homogeneously distributed in the spinach samples (Annex 2).
Approximately 5 g of material was placed in a plastic bottle prior to dispatch to each participant.
Each participant received one bottle of test material, an accompanying letter (Annex 3) with
instructions on sample handling and reporting (Annex 4), a form that had to be sent after receipt of
the sample to confirm its arrival (Annex 5) and a reporting form (Annex 6).
Participants were instructed to store the material in a dark place at room temperature until analysis.
Before starting the analyses, the sample had to be re-homogenized by shaking for about 30 seconds.
The procedure followed for the exercise, had to be as close as possible to the method used by the
participant in routine sample analysis. Nevertheless participants were instructed to perform three
independent measurements per parameter and to report measurement uncertainty.
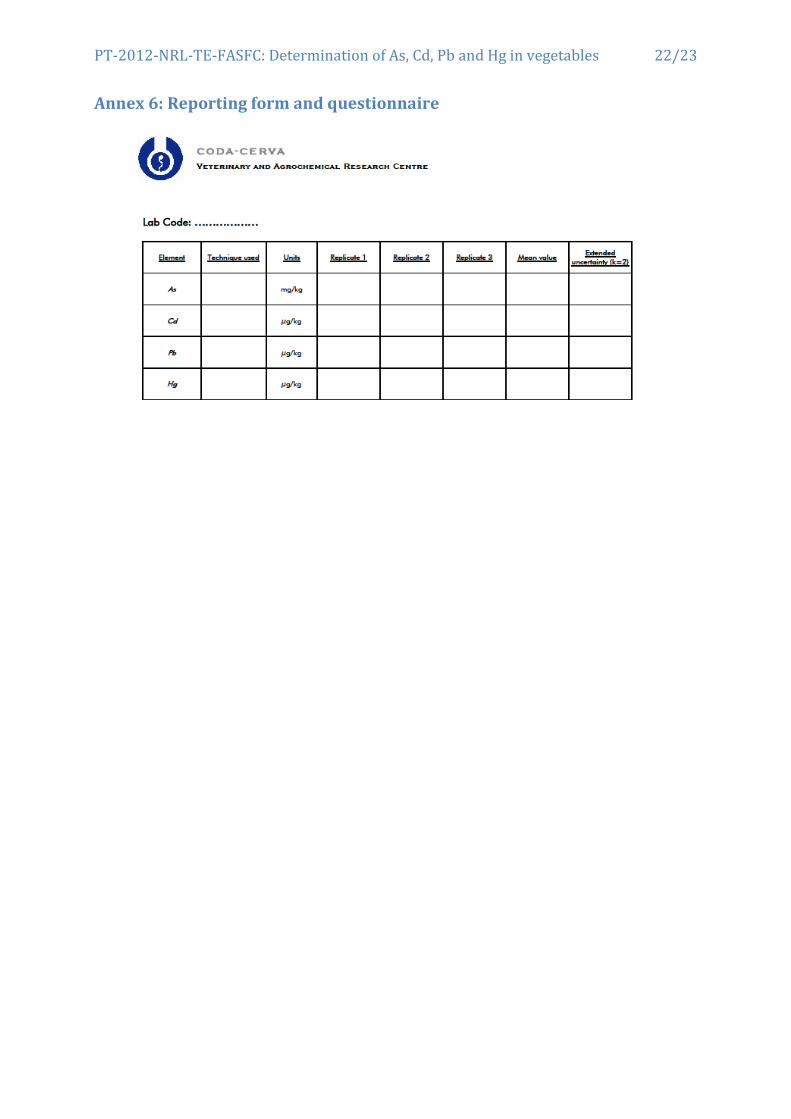
A questionnaire was attached to the reporting form. The questionnaire was intended to provide
further information on the measurements and the laboratories. A copy of the questionnaire is
presented in Annex 6.
Laboratory codes were given randomly and communicated confidentially to the corresponding
participant.

PT-2012-NRL-TE-FASFC: Determination of As, Cd, Pb and Hg in vegetables 4/23
Assigned values The assigned values for the different trace elements in the spinach sample were determined as the
consensus of participant’s results [1]. The major advantages of consensus values are the
straightforward calculation and the fact that none of the participants is accorded higher status. The
disadvantages are that the consensus values are not independent of the participant’s results and,
especially in the current case with 12 participants, that the uncertainty on the consensus (identified
as the standard error) may be high and the information content of the z-scores will be
correspondingly reduced.
The robust statistic approach is a convenient modern method of handling results when they are
expected to follow a near-normal distribution and it is suspected that they include a small proportion
of outliers. There are many different robust estimators of mean and standard deviation [2]. The
median and MAD (median absolute difference) were chosen here as robust estimators.
The modified Horwitz equation was used to establish the standard deviation for proficiency testing
(σp) [1][3]. It is an exponential relationship between the variability of chemical measurements and
concentration. The Horwitz value is widely recognized as a fitness-for-purpose criterion in proficiency
testing.
The Kernel density estimate gives a good estimate of the population density function without making
any assumptions that it is a normal distribution. The Kernel distribution plots were obtained using a
software tool developed by AMC [4].
The scheme that was followed to estimate the consensus and its uncertainty is outlined below [1]:
a) Results that were identifiable invalid or extreme outliers (data outside the range of ±60% of
the median) were excluded (As –L08, L12; Pb – L09).
b) A visual presentation of the remaining results was examined. It was checked whether the
distribution was apparently unimodal and roughly symmetric, possible outliers aside. If so
c) (As, Cd, Pb); else d) (Hg).
c) The robust mean rob̂ and standard deviation rob̂ of the n results were calculated as rob̂ =
median and rob̂ = 1.4826*MAD [2]. If rob̂ was less than about 1.2σp, then rob̂ was used as
the assigned value xa and rob̂ /√n as its standard uncertainty u(xa) (As, Cd, Pb).
d) A Kernel density estimate of the distribution was made using normal kernels with a bandwith
h of 0.75σp. If this resulted in a unimodal and roughly symmetric kernel density, and the
mode and median were nearly coincident, then rob̂ was used as the assigned value and
rob̂ /√n as its standard uncertainty; else e) (Hg).
e) If the minor mode could be safely attributed to an outlying result, then rob̂ was still used as
the assigned value and rob̂ /√n as its standard uncertainty (Hg); else no consensus value
could be derived.
The consensus values, their standard uncertainty and some other statistical parameters are
summarised in Table 1.

PT-2012-NRL-TE-FASFC: Determination of As, Cd, Pb and Hg in vegetables 5/23
Table 1 : Summary of statistical parameters for the test material.
As
µg/kg
Cd
µg/kg
Pb
µg/kg
Hg
µg/kg
n 7* 11 8** 8
Mean 60 368 125 13.5
SD 6.2 36.3 20.1 2.72
Robust mean (median) 60 365 129 12.7
Robust SD 7.6 19.3 23.0 1.04
Assigned value xa 60 365 129 12.7
Standard uncertainty of the
assigned value u(xa) 3 6 9 0.4
σp 13 68 28 2.8
Assigned value xa: median of the reported results; σp: standard deviation for proficiency assessment; *Excluding
the result of L08 and L12; ** Excluding the result of L09
Scores and evaluation criteria Individual laboratory performances are expressed in terms of z-scores and ζ-scores in accordance
with ISO 135283 and the International Harmonised Protocol [1].
p
alab xxz
)()( 22
laba
alab
xuxu
xx
where:
xlab is the mean of the individual measurement results as reported by the participant
xa is the assigned value
σp is the standard deviation for proficiency assessment
u(xa) is the standard uncertainty for the assigned value
u(xlab) is the reported standard uncertainty in the reported value xlab. When no uncertainty was
reported by the laboratory, it was set to zero.
The z-score compares the participant's deviation from the reference value with the standard
deviation accepted for the proficiency test, σp. Should participants feel that these σ values are not fit
PT-2012-NRL-TE-FASFC: Determination of As, Cd, Pb and Hg in vegetables 6/23
for their purpose they can recalculate their scorings with a standard deviation matching their
requirements.
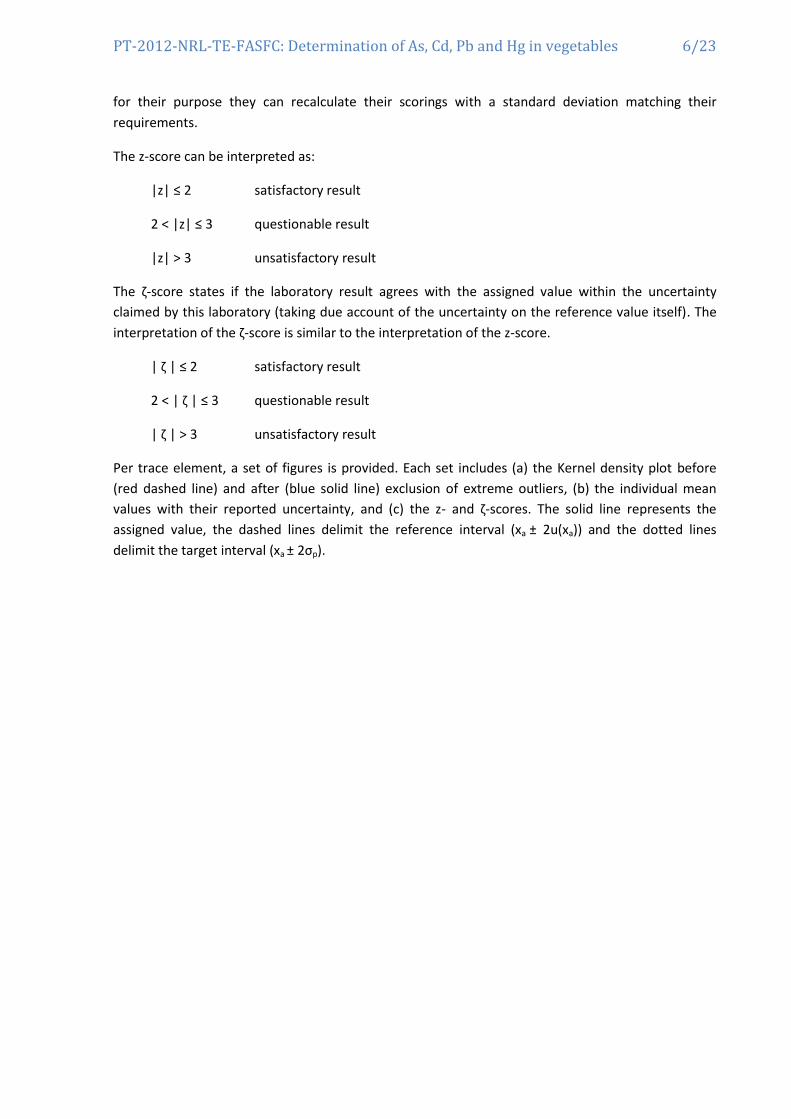
The z-score can be interpreted as:
|z| ≤ 2 satisfactory result
2 < |z| ≤ 3 questionable result
|z| > 3 unsatisfactory result
The ζ-score states if the laboratory result agrees with the assigned value within the uncertainty
claimed by this laboratory (taking due account of the uncertainty on the reference value itself). The
interpretation of the ζ-score is similar to the interpretation of the z-score.
| ζ | ≤ 2 satisfactory result
2 < | ζ | ≤ 3 questionable result
| ζ | > 3 unsatisfactory result
Per trace element, a set of figures is provided. Each set includes (a) the Kernel density plot before
(red dashed line) and after (blue solid line) exclusion of extreme outliers, (b) the individual mean
values with their reported uncertainty, and (c) the z- and ζ-scores. The solid line represents the
assigned value, the dashed lines delimit the reference interval (xa ± 2u(xa)) and the dotted lines
delimit the target interval (xa ± 2σp).

PT-2012-NRL-TE-FASFC: Determination of As, Cd, Pb and Hg in vegetables 7/23
Results
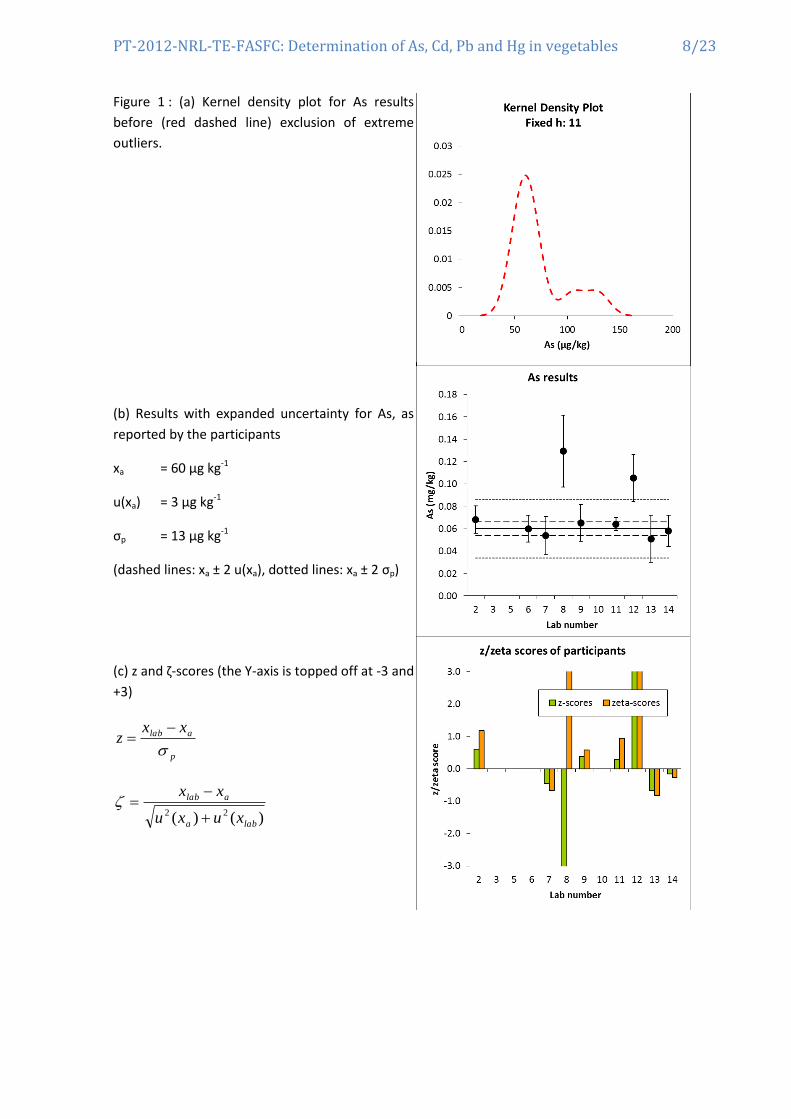
Arsenic (As) xa = 60 ± 6 µg/kg (k = 2)
Twelve laboratories submitted results for As concentrations. The mean values of two laboratories
varied more than 60% of the median value. Therefore, these results (L08 and L12) were considered
as outlying results and were not taken into account in the calculation of the consensus value. Three
laboratories could not produce results above their limit of quantification. The other seven
laboratories obtained satisfactory z-scores for As against the standard deviation accepted for the
proficiency test (Table 2; Figure 1). These seven laboratories did also obtain good ζ-scores against
their stated measurement uncertainty. The laboratories with outlying results did obtain
unsatisfactory z- and ζ- scores. No Kernel distribution could be made with only seven results, but no
extreme outlying results (except from L08 and L12) are noticed in Figure 1b.
Table 2 : values reported for As (µg/kg) by the participants and scores calculated by the organizer
Lab
co
de
Re
sult
1 (
µg
kg-1
)
Re
sult
2 (
µg
kg-1
)
Re
sult
3 (
µg
kg-1
)
Me
an (
µg
kg-1
)
Exte
nd
ed
un
cert
ain
ty (
k =
2)
(u
lab; µ
g kg
-1)
z-sc
ore
s
ζ-sc
ore
s
2 66 68 69 68 12 0.6 1.2
3 <100 <100 <100
5 <400 <400 <400
6 55 59 65 60 12 0.0 0.0
7 58 54 51 54 17 -0.5 -0.7
8 127 123 138 129 32 4.5 4.3
9 63.3 65.1 66.9 65.1 16.3 0.4 0.6
10 <250 <250 <250
11 69 60 63 64 6 0.3 1.0
12 92.2 94.6 128.9 105 21 3.4 4.1
13 49 52 52 51 21 -0.7 -0.8
14 56 58 60 58 14 -0.2 -0.3
PT-2012-NRL-TE-FASFC: Determination of As, Cd, Pb and Hg in vegetables 8/23
Figure 1 : (a) Kernel density plot for As results
before (red dashed line) exclusion of extreme
outliers.
(b) Results with expanded uncertainty for As, as
reported by the participants
xa = 60 µg kg-1
u(xa) = 3 µg kg-1
σp = 13 µg kg-1
(dashed lines: xa ± 2 u(xa), dotted lines: xa ± 2 σp)
(c) z and ζ-scores (the Y-axis is topped off at -3 and
+3)
p
alab xxz
)()( 22
laba
alab
xuxu
xx

PT-2012-NRL-TE-FASFC: Determination of As, Cd, Pb and Hg in vegetables 9/23
Cadmium (Cd) xa = 365 ± 12 µg/kg (k = 2)
Twelve laboratories submitted results for Cd concentrations. One laboratory could not produce
results above their limit of quantification. All other laboratories that submitted results obtained
satisfactory z-scores for Cd against the standard deviation accepted for the proficiency test (Table 3;
Figure 2). All but two laboratories obtained satisfactory ζ-scores against their stated measurement
uncertainty. Two laboratories (L05 and L10) obtained an unsatisfactory ζ-score.
Table 3 : values reported for Cd (µg/kg) by the participants and scores calculated by the organizer
Lab
co
de
Re
sult
1 (
µg
kg-1
)
Re
sult
2 (
µg
kg-1
)
Re
sult
3 (
µg
kg-1
)
Me
an (
µg
kg-1
)
Exte
nd
ed
un
cert
ain
ty (
k =
2)
(u
lab; µ
g kg
-1)
z-sc
ore
s
ζ-sc
ore
s
2 368 365 362 365 88 0.0 0.0
3 379 393 362 378 50 0.2 0.5
5 296 290 294 293 39 -1.1 -3.5
6 426 423 441 430 90 1.0 1.4
7 <600 <600 <600
8 342 353 367 354 106 -0.2 -0.2
9 390.0 402.4 389.3 394.0 118.2 0.4 0.5
10 343 336 336 338 0 -0.4 -4.6
11 370 369 386 375 28 0.1 0.7
12 353.9 362.9 345.8 354 44 -0.2 -0.7
13 398 415 406 406 97 0.6 0.8
14 354 356 357 356 53 -0.1 -0.3

PT-2012-NRL-TE-FASFC: Determination of As, Cd, Pb and Hg in vegetables 10/23
Figure 2 : (a) Kernel density plot for Cd results, no
outliers were excluded.
(b) Results with expanded uncertainty for Cd, as
reported by the participants
xa = 365 µg kg-1
u(xa) = 6 µg kg-1
σp = 68 µg kg-1
(dashed lines: xa ± 2 u(xa), dotted lines: xa ± 2 σp)
(c) z and ζ-scores (the Y-axis is topped off at -3 and
+3)
p
alab xxz
)()( 22
laba
alab
xuxu
xx

PT-2012-NRL-TE-FASFC: Determination of As, Cd, Pb and Hg in vegetables 11/23
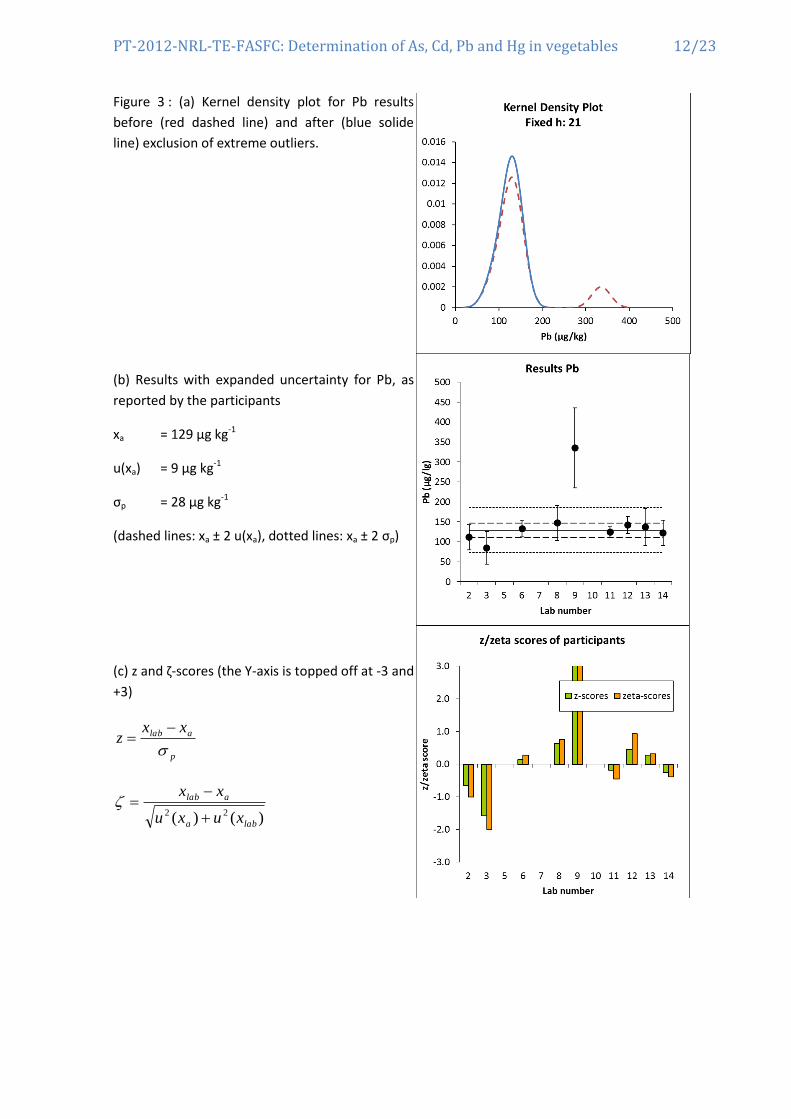
Lead (Pb) xa = 129 ± 18 µg/kg (k = 2)
Eleven laboratories submitted results for Pb concentrations. One laboratory did not provide results
for Pb. The mean value of one laboratory varied more than 60% of the median value. Therefore, this
result (L09) was considered as an outlying result and was not taken into account in the calculation of
the consensus value. Two laboratories could not produce results above their limit of quantification.
The other eight laboratories obtained satisfactory z-scores for Pb against the standard deviation
accepted for the proficiency test (Table 4; Figure 3). These eight laboratories did also obtain good ζ-
scores against their stated measurement uncertainty. The laboratory with an outlying value did
obtain an unsatisfactory z- and ζ-score.
Table 4 : values reported for Pb (µg/kg) by the participants and scores calculated by the organizer
Lab
co
de
Re
sult
1 (
µg
kg-1
)
Re
sult
2 (
µg
kg-1
)
Re
sult
3 (
µg
kg-1
)
Me
an (
µg
kg-1
)
Exte
nd
ed
un
cert
ain
ty (
k =
2)
(u
lab; µ
g kg
-1)
z-sc
ore
s
ζ-sc
ore
s
2 114 111 108 111 31 -0.6 -1.0
3 90.6 93.3 69.8 84.6 41 -1.6 -2.0
5 <200 <200 <200
6 136 138 124 133 21 0.2 0.3
7
8 142 146 154 147 44 0.7 0.8
9 337.4 324.4 343.2 335.0 100.5 7.4 4.1
10 <250 <250 <250
11 120 120 131 124 13 -0.2 -0.4
12 140.1 147.9 137.2 142 32 0.5 1.0
13 139 134 137 137 46 0.3 0.3
14 120 122 124 122 32 -0.2 -0.4
PT-2012-NRL-TE-FASFC: Determination of As, Cd, Pb and Hg in vegetables 12/23
Figure 3 : (a) Kernel density plot for Pb results
before (red dashed line) and after (blue solide
line) exclusion of extreme outliers.
(b) Results with expanded uncertainty for Pb, as
reported by the participants
xa = 129 µg kg-1
u(xa) = 9 µg kg-1
σp = 28 µg kg-1
(dashed lines: xa ± 2 u(xa), dotted lines: xa ± 2 σp)
(c) z and ζ-scores (the Y-axis is topped off at -3 and
+3)
p
alab xxz
)()( 22
laba
alab
xuxu
xx

PT-2012-NRL-TE-FASFC: Determination of As, Cd, Pb and Hg in vegetables 13/23
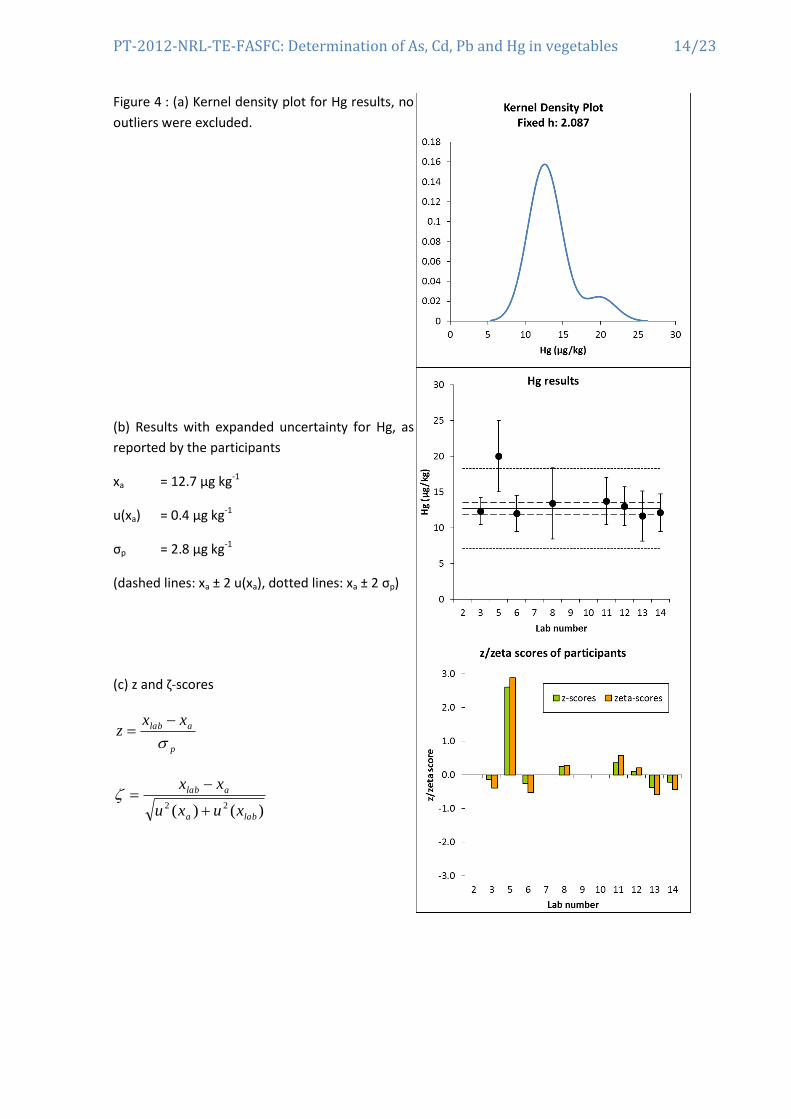
Mercury (Hg) xa = 12.7 ± 0.8 µg/kg (k = 2)
Twelve laboratories submitted results for Hg concentrations. Four laboratories could not produce
results above their limit of quantification. One laboratory (L05) did obtain questionable z and ζ-
scores. The other seven laboratories obtained satisfactory z-scores for Hg against the standard
deviation accepted for the proficiency test (Table 5; Figure 4). These seven laboratories did also
obtain good ζ-scores against their stated measurement uncertainty.
Table 5 : values reported for Hg (µg/kg) by the participants and scores calculated by the organizer
Lab
co
de
Re
sult
1 (
µg
kg-1
)
Re
sult
2 (
µg
kg-1
)
Re
sult
3 (
µg
kg-1
)
Me
an (
µg
kg-1
)
Exte
nd
ed
un
cert
ain
ty (
k =
2)
(u
lab; µ
g kg
-1)
z-sc
ore
s
ζ-sc
ore
s
02 <20 <20 <20
03 12.6 12.6 11.6 12.3 1.9 -0.1 -0.3
05 18 22 19 20 5 2.6 2.9
06 13 13 11 12 3 -0.2 -0.5
07 <60 <60 <60
08 19.8 9.6 10.7 13.4 5 0.3 0.3
09 <100 <100 <100
10 <20 <20 <20
11 12 14 15.4 13.7 3.3 0.4 0.6
12 14 12.3 13.6 13 2.7 0.1 0.2
13 11.14 11.23 12.53 11.63 3.49 -0.4 -0.6
14 12.14 12.22 11.92 12.09 2.61 -0.2 -0.4
PT-2012-NRL-TE-FASFC: Determination of As, Cd, Pb and Hg in vegetables 14/23
Figure 4 : (a) Kernel density plot for Hg results, no
outliers were excluded.
(b) Results with expanded uncertainty for Hg, as
reported by the participants
xa = 12.7 µg kg-1
u(xa) = 0.4 µg kg-1
σp = 2.8 µg kg-1
(dashed lines: xa ± 2 u(xa), dotted lines: xa ± 2 σp)
(c) z and ζ-scores
p
alab xxz
)()( 22
laba
alab
xuxu
xx

PT-2012-NRL-TE-FASFC: Determination of As, Cd, Pb and Hg in vegetables 15/23
Discussion Of the 14 laboratories that registered for participation, two laboratories did not submit any results.
Eleven submitted results for Pb and 12 submitted results for As, Cd and Hg. Outliers (data outside the
range of ±60% of the median) were excluded for further evaluation. From the remaining results,
values as “less than” were not included in the evaluation. This was the case for three, one, two and
four laboratories for As, Cd, Pb and Hg respectively. No detection limits were reported that were
lower than the corresponding xa-3 u(xa) value or xa-2 u(xa) value, so those statements are
satisfactory.
Of the 37 z-scores that were calculated, 89% was satisfactory, 3% was questionable and 8% was
unsatisfactory. Of the 37 ζ-scores, 84% was satisfactory, 3 % was questionable and 14% was
unsatisfactory.
Different techniques are used for analysing trace element concentrations in the test samples,
whereby ICP-MS was the most commonly used technique (Figure 5). The number of participants per
technique was too small to make inferences on the performance of the different techniques.
Figure 5 : z-scores obtained by the participants, ordered per element and per technique. The z-scores are topped-off at -3 and +3.
Additional information was gathered from the questionnaire that participants were asked to fill in.
One laboratory did not provide this information. All other 11 the laboratories have a quality system
in place (ISO 17025). Four out of 11 participating laboratories did not carry out this type of analysis
on a routine basis.
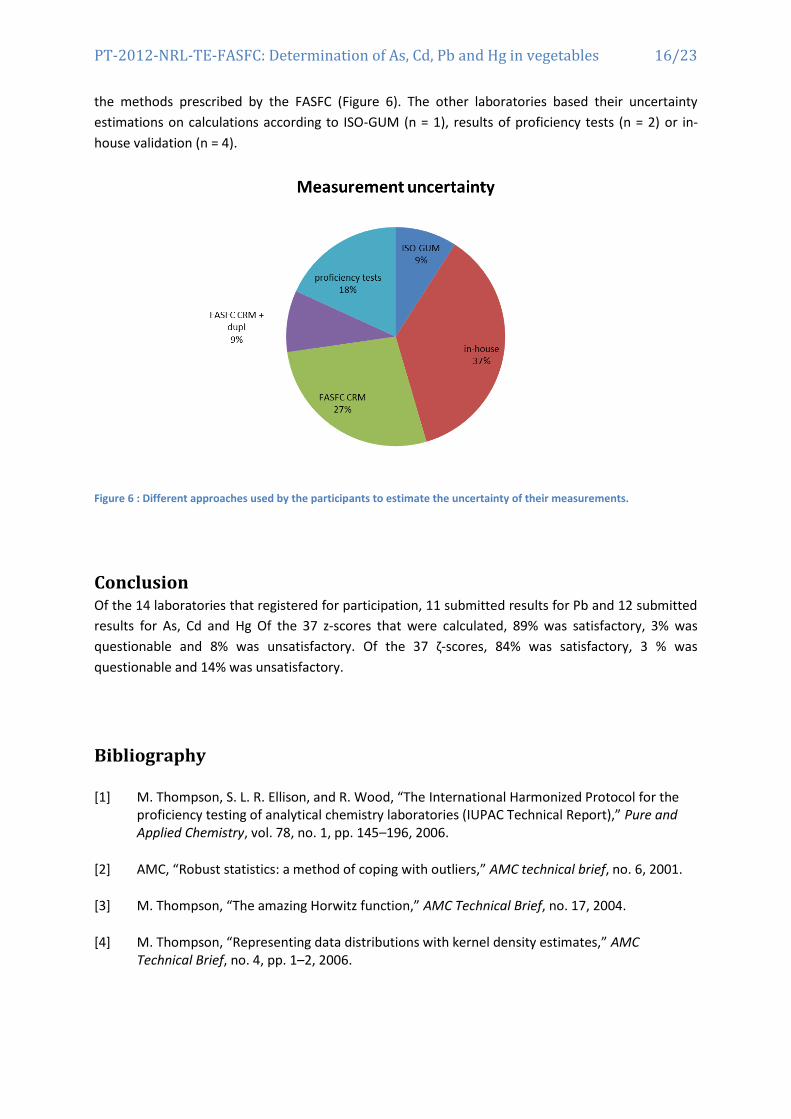
Seven laboratories usually provide an uncertainty statement to their customers for this type of
analysis, four laboratories usually do not. For uncertainty estimation, four laboratories used one of
PT-2012-NRL-TE-FASFC: Determination of As, Cd, Pb and Hg in vegetables 16/23
the methods prescribed by the FASFC (Figure 6). The other laboratories based their uncertainty
estimations on calculations according to ISO-GUM (n = 1), results of proficiency tests (n = 2) or in-
house validation (n = 4).
Figure 6 : Different approaches used by the participants to estimate the uncertainty of their measurements.
Conclusion Of the 14 laboratories that registered for participation, 11 submitted results for Pb and 12 submitted
results for As, Cd and Hg Of the 37 z-scores that were calculated, 89% was satisfactory, 3% was
questionable and 8% was unsatisfactory. Of the 37 ζ-scores, 84% was satisfactory, 3 % was
questionable and 14% was unsatisfactory.
Bibliography
[1] M. Thompson, S. L. R. Ellison, and R. Wood, “The International Harmonized Protocol for the proficiency testing of analytical chemistry laboratories (IUPAC Technical Report),” Pure and Applied Chemistry, vol. 78, no. 1, pp. 145–196, 2006.
[2] AMC, “Robust statistics: a method of coping with outliers,” AMC technical brief, no. 6, 2001.
[3] M. Thompson, “The amazing Horwitz function,” AMC Technical Brief, no. 17, 2004.
[4] M. Thompson, “Representing data distributions with kernel density estimates,” AMC Technical Brief, no. 4, pp. 1–2, 2006.

PT-2012-NRL-TE-FASFC: Determination of As, Cd, Pb and Hg in vegetables 17/23
Annexes
Annex 1: Invitation letter to laboratories
PT-2012-NRL-TE-FASFC: Determination of As, Cd, Pb and Hg in vegetables 18/23
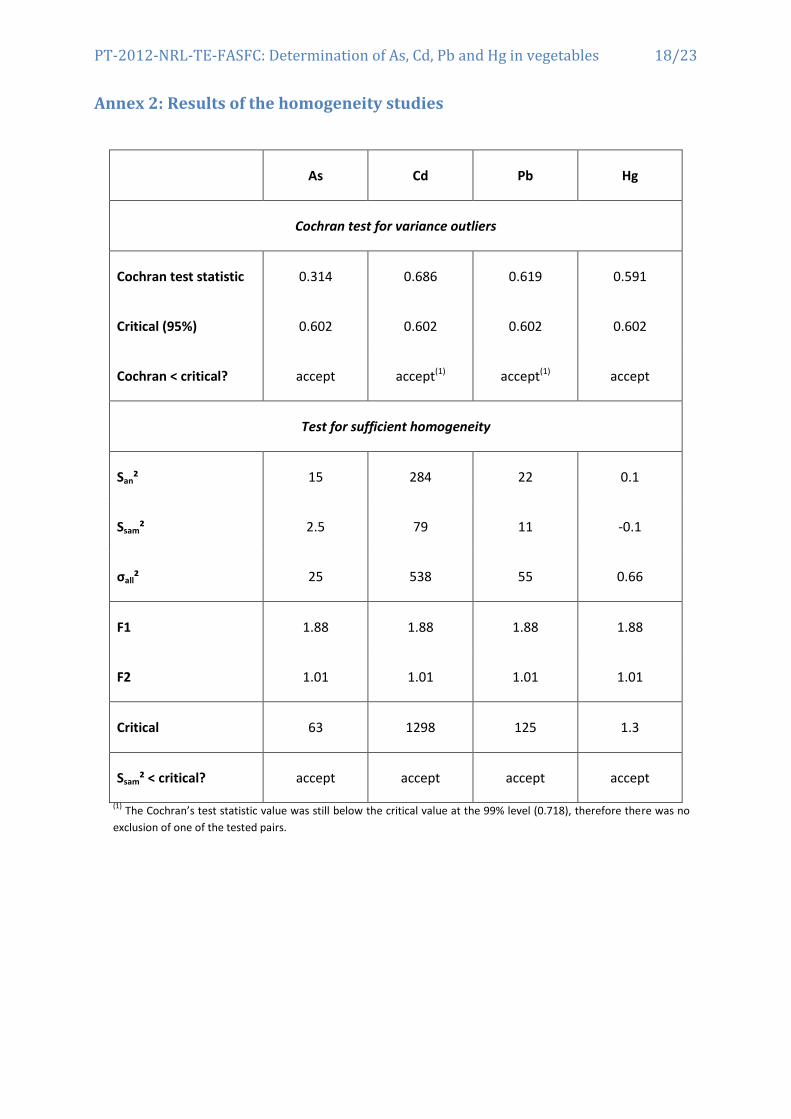
Annex 2: Results of the homogeneity studies
As Cd Pb Hg
Cochran test for variance outliers
Cochran test statistic 0.314 0.686 0.619 0.591
Critical (95%) 0.602 0.602 0.602 0.602
Cochran < critical? accept accept(1) accept(1) accept
Test for sufficient homogeneity
San² 15 284 22 0.1
Ssam² 2.5 79 11 -0.1
σall² 25 538 55 0.66
F1 1.88 1.88 1.88 1.88
F2 1.01 1.01 1.01 1.01
Critical 63 1298 125 1.3
Ssam² < critical? accept accept accept accept
(1) The Cochran’s test statistic value was still below the critical value at the 99% level (0.718), therefore there was no
exclusion of one of the tested pairs.

PT-2012-NRL-TE-FASFC: Determination of As, Cd, Pb and Hg in vegetables 19/23
Annex 3: Letter accompanying the sample

PT-2012-NRL-TE-FASFC: Determination of As, Cd, Pb and Hg in vegetables 20/23
Annex 4: Instructions to participants

PT-2012-NRL-TE-FASFC: Determination of As, Cd, Pb and Hg in vegetables 21/23
Annex 5: Materials receipt form
PT-2012-NRL-TE-FASFC: Determination of As, Cd, Pb and Hg in vegetables 22/23
Annex 6: Reporting form and questionnaire

PT-2012-NRL-TE-FASFC: Determination of As, Cd, Pb and Hg in vegetables 23/23