Embed Size (px)
Citation preview
Ventilation and Odor Control
for
Sewers and Tunnels
Lawrence H. Hentz Jr, P.E., BCEE
Shahriar Eftekharzadeh, P.E., Ph.D,, PMP
Rich Atoulikian, P.E., BCEE, PMP

Do You Know My Friend?

She Changed My Life
Seneca, MD
Patuxent, MD
Mill Creek, MD
Broadwater, MD
Mont. Co. RCF
Howard Co, MD
Arlington.VA
Alexandria, VA
DC WASA
Philly (x2), PA
HRSD, VA (x4)
Chez Liz, VA
Dick Creek, GA
Long Trail, VT
NBC, RI
New England Fert
MPW, SC (x4)
IRC, FL
Sarasota, FL
Ypsilanti, MI
NGWRP, AZ
91st Avenue, AZ
Ocotillo, AZ
Avondale, AZ
Palm City/Tuscany
Hills, FL
Seattle, WA
Iron Bridge, FL
Dade County, FL
Sacramento, CA
Hartford, CT
East Bay MUD, CA
Rock Hill, SC
Yellowstone, WY
PG County, MD
Harford County, MD
Athens, Greece
WERF
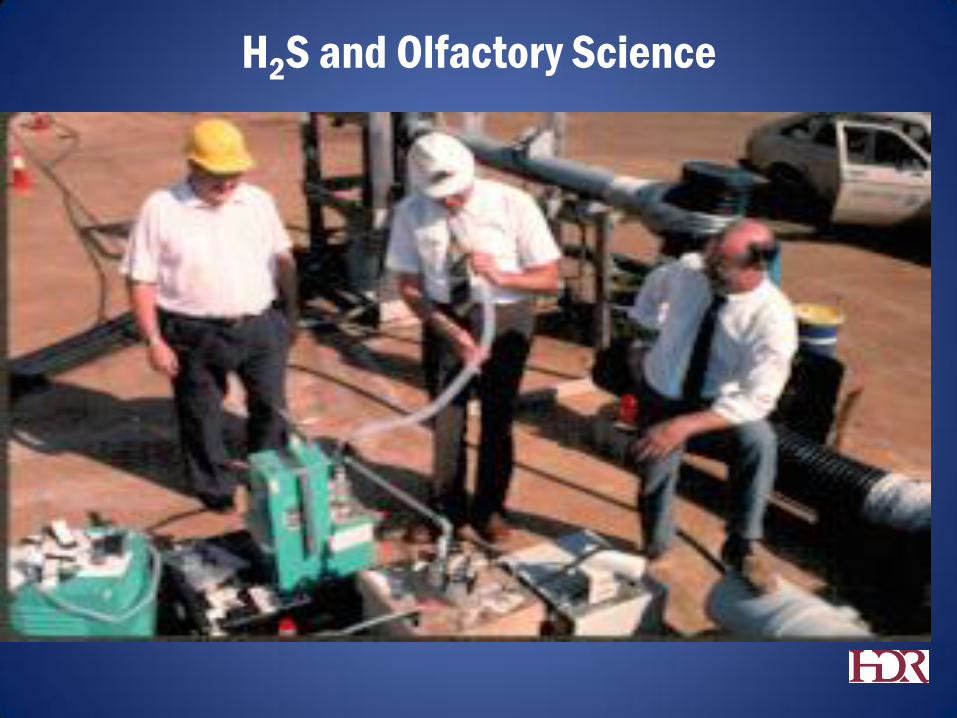
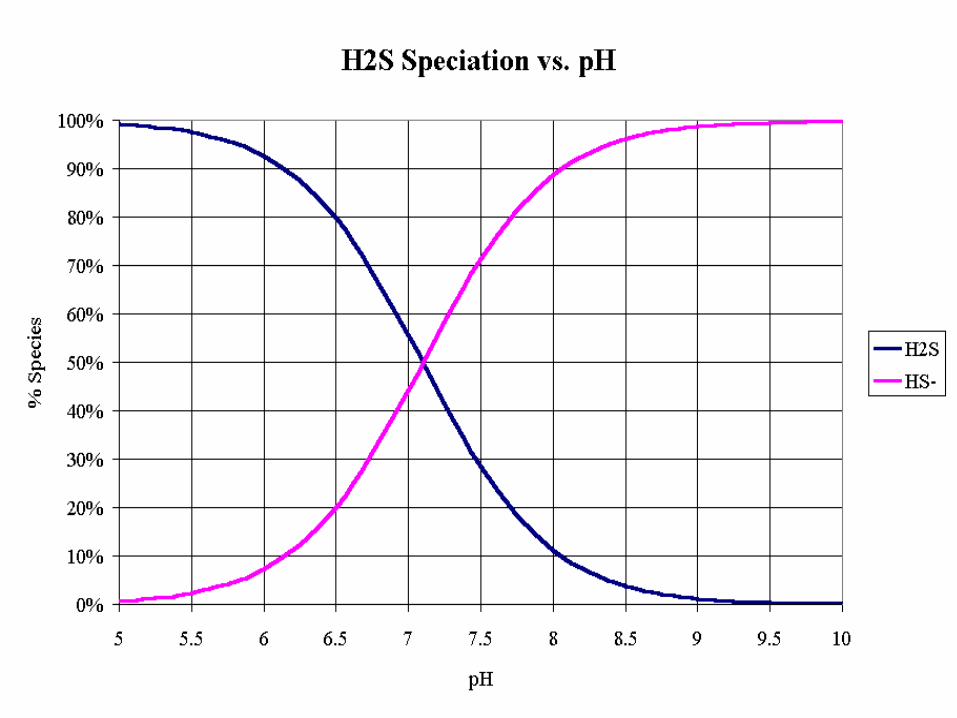
H2S and Olfactory Science
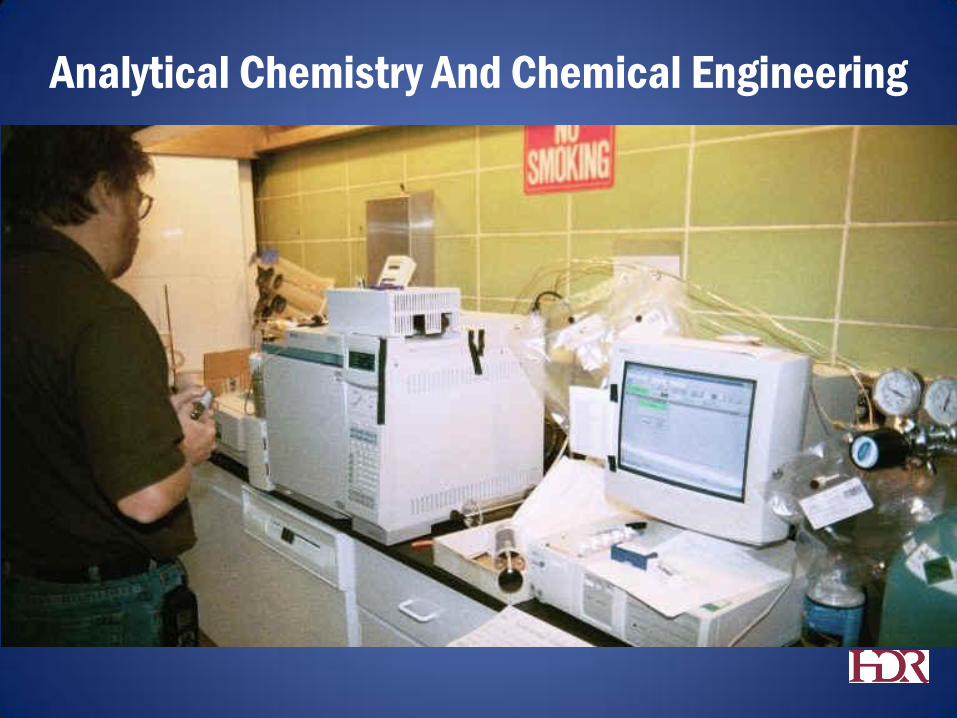
Analytical Chemistry And Chemical Engineering
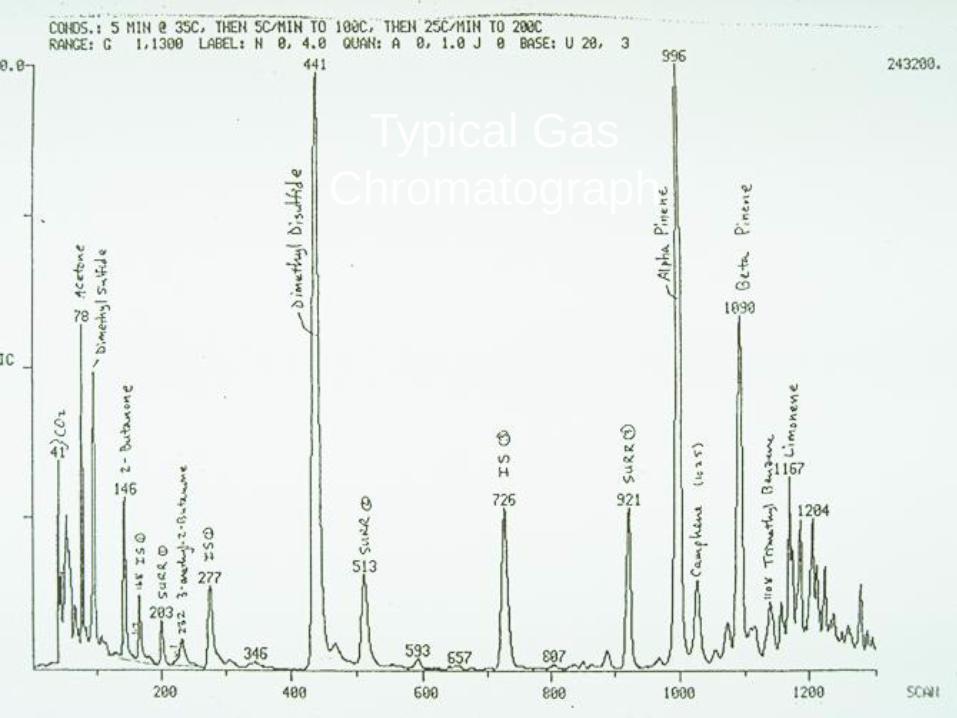
Typical Gas
Chromatograph

…Contributing Author to the WEF / ASCE
Manuals of Practice
ODOR CONTROL IN WASTEWATER
TREATMENT PLANTS
…More Than 30 Articles on Odor Control
…U.S. Patent Holder For Scrubber Technology
Publications and Patents

I Am Forever Grateful
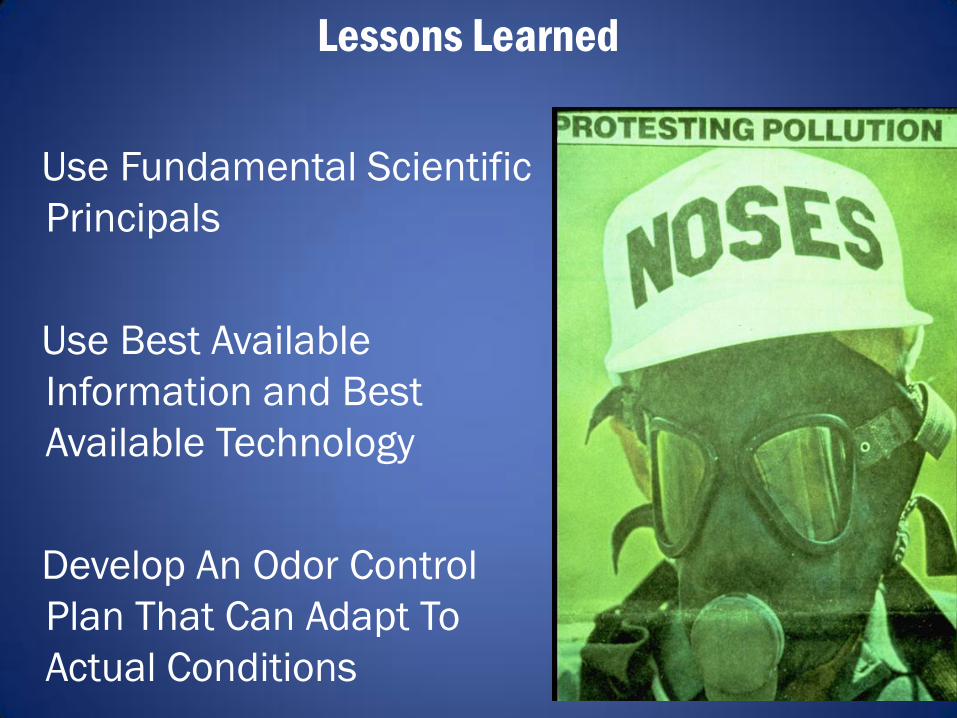
Use Fundamental Scientific
Principals
Use Best Available
Information and Best
Available Technology
Develop An Odor Control
Plan That Can Adapt To
Actual Conditions
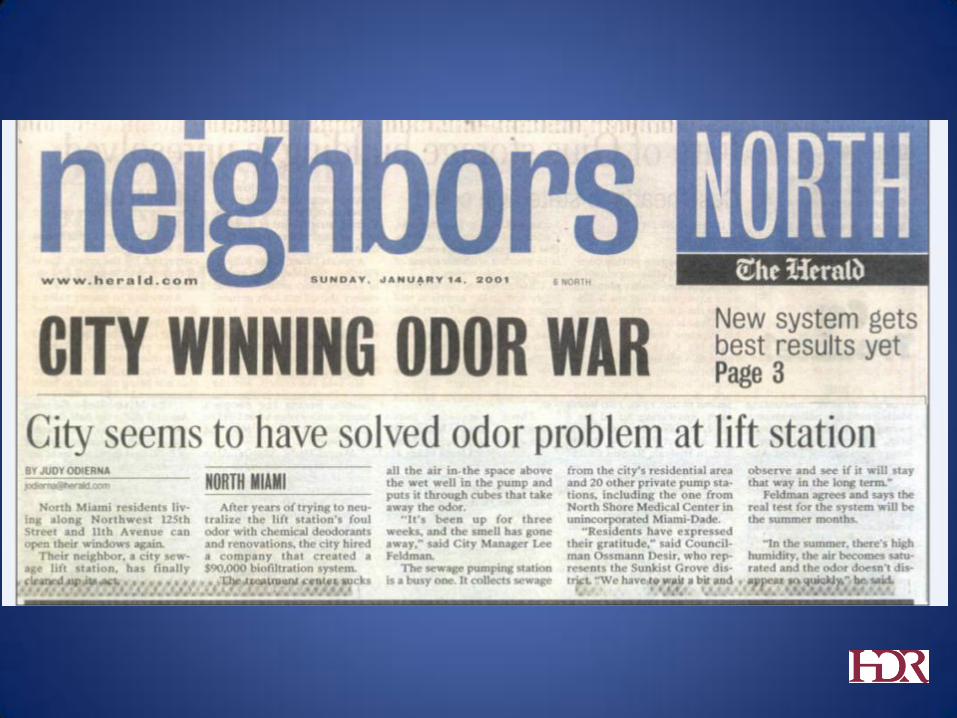
Lessons Learned
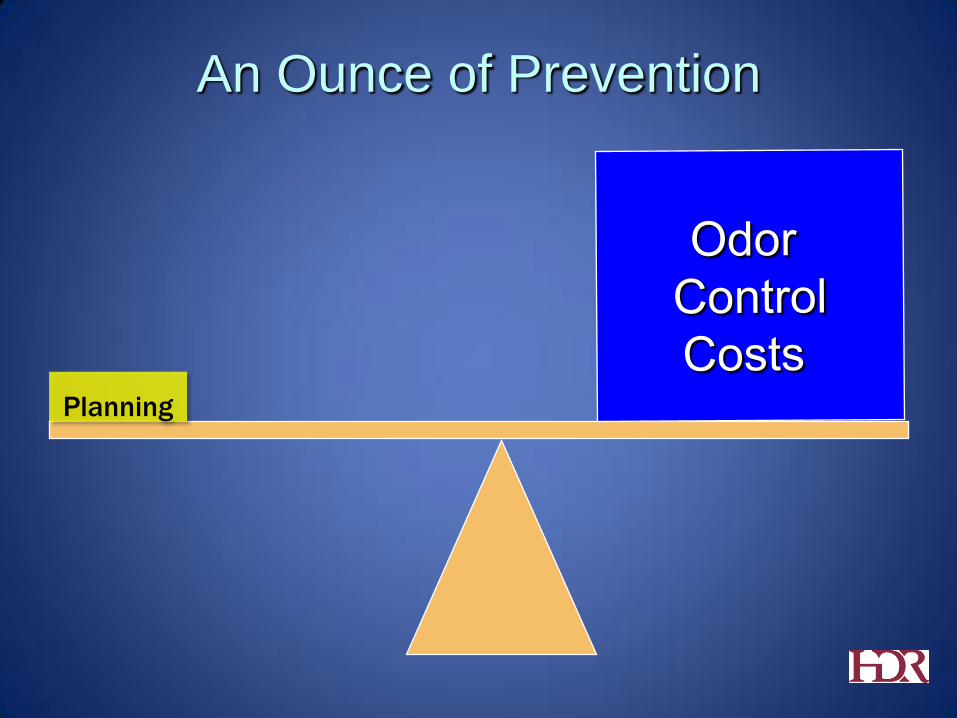
An Ounce of Prevention
Planning
Ventilation and Odor Control in Sewers and Tunnels
Forces Causing Airflow and Ventilation
Tools for Estimating Airflow and
Pressurization
Technologies for Controlling Emissions of Odorous Compounds
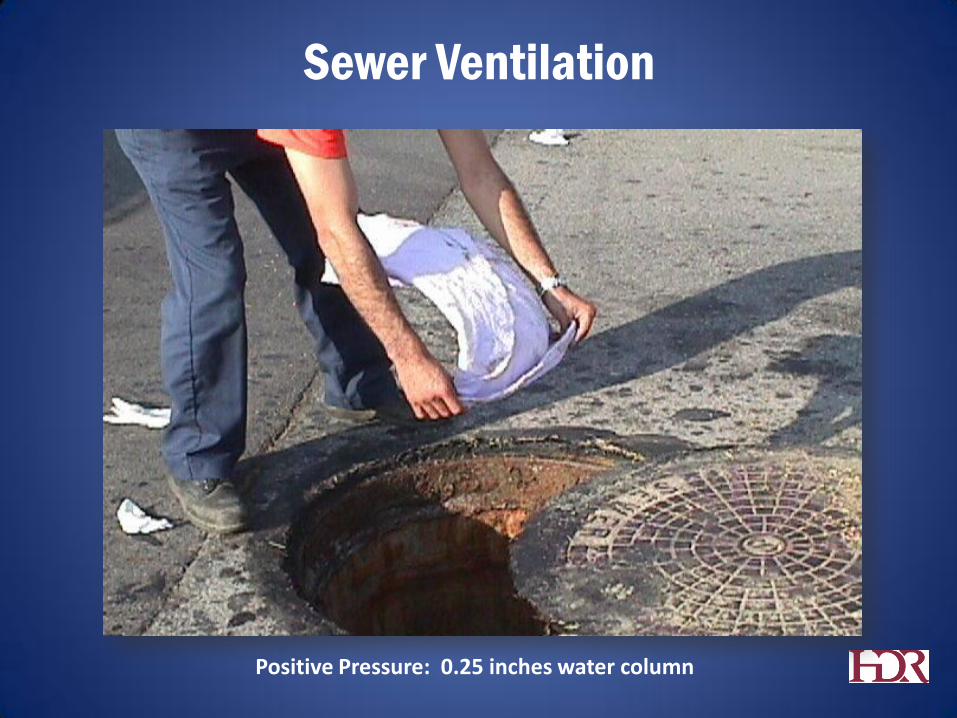
Sewer Ventilation
Positive Pressure: 0.25 inches water column
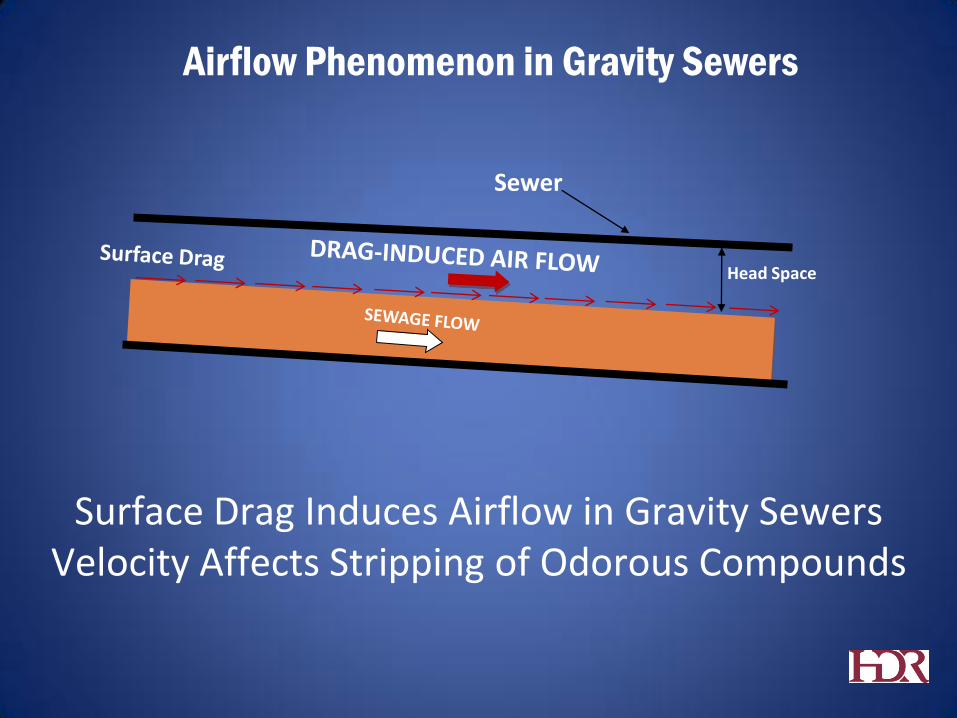
Airflow Phenomenon in Gravity Sewers
Sewer
Head Space
Surface Drag Induces Airflow in Gravity Sewers Velocity Affects Stripping of Odorous Compounds
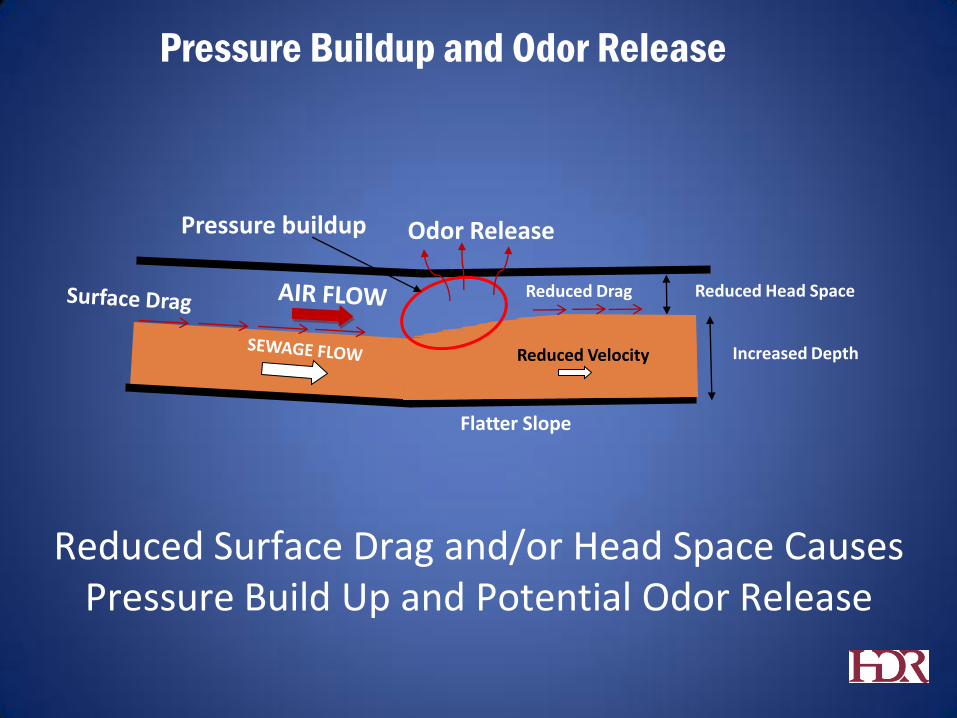
Pressure Buildup and Odor Release
Pressure buildup
Reduced Head Space Reduced Drag
Increased Depth Reduced Velocity
Flatter Slope
Odor Release
Reduced Surface Drag and/or Head Space Causes Pressure Build Up and Potential Odor Release
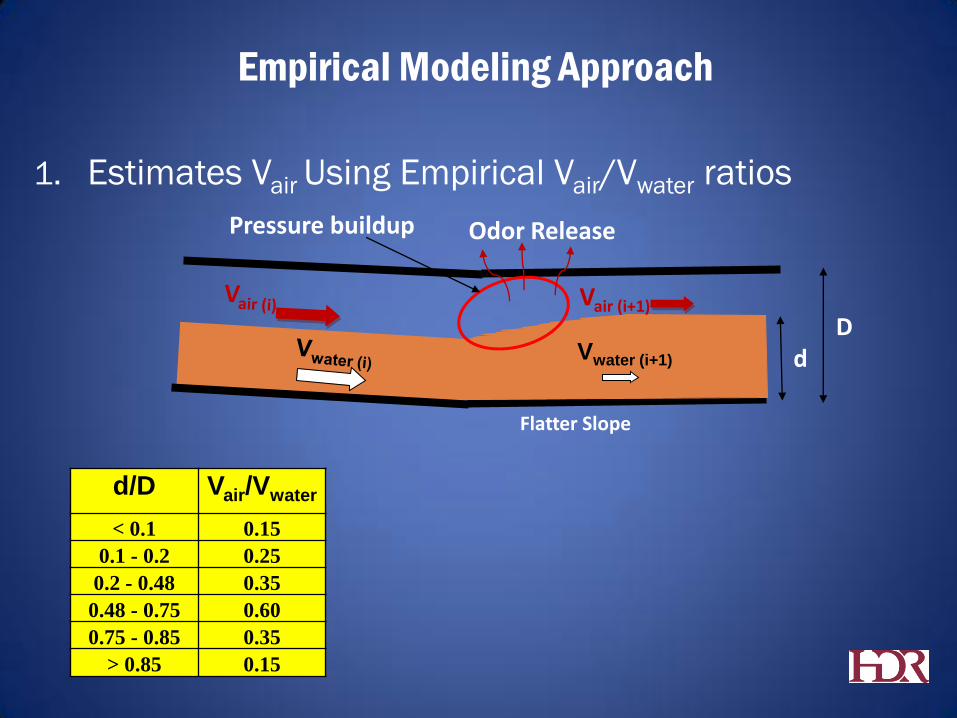
1. Estimates Vair Using Empirical Vair/Vwater ratios
Empirical Modeling Approach
Pressure buildup
D
d
Flatter Slope
Odor Release
Vwater (i+1)
Vair (i+1)
d/D Vair/Vwater
< 0.1 0.15
0.1 - 0.2 0.25
0.2 - 0.48 0.35
0.48 - 0.75 0.60
0.75 - 0.85 0.35
> 0.85 0.15
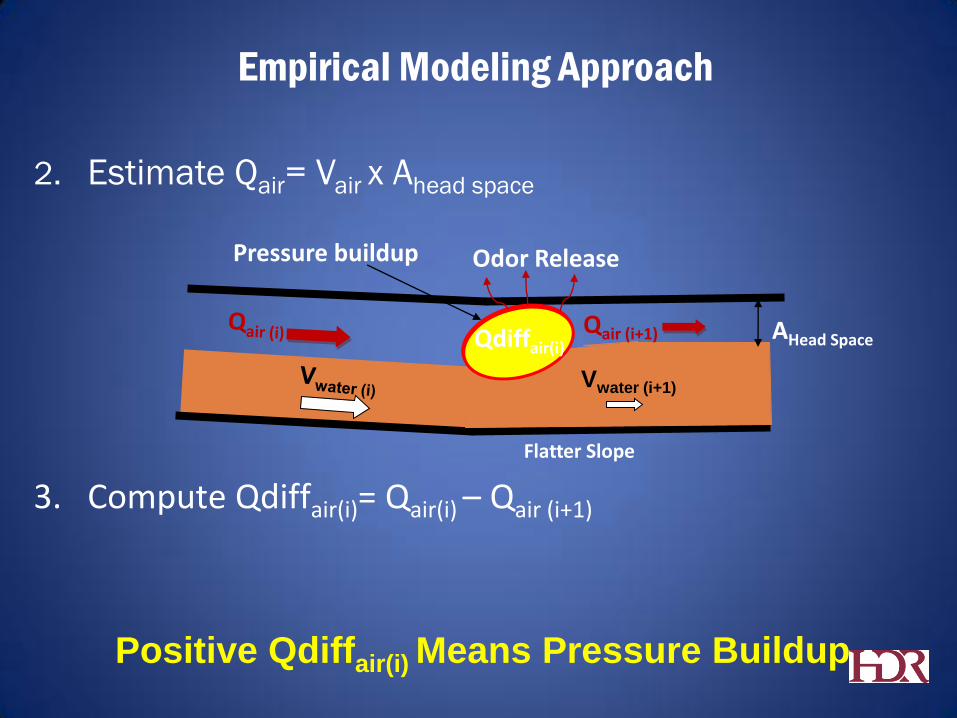
2. Estimate Qair= Vair x Ahead space
Empirical Modeling Approach
Pressure buildup
Flatter Slope
Odor Release
Vwater (i+1)
Qair (i+1) AHead Space
3. Compute Qdiffair(i)= Qair(i) – Qair (i+1)
Positive Qdiffair(i) Means Pressure Buildup
Qdiffair(i)
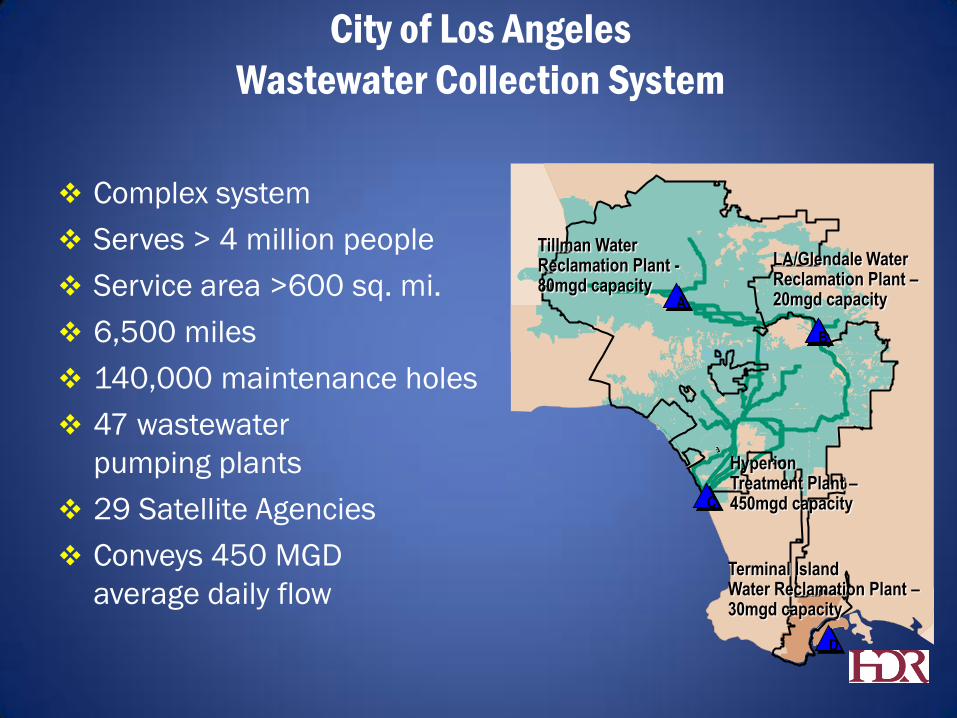
City of Los Angeles
Wastewater Collection System
Complex system
Serves > 4 million people
Service area >600 sq. mi.
6,500 miles
140,000 maintenance holes
47 wastewater
pumping plants
29 Satellite Agencies
Conveys 450 MGD
average daily flow
A
B
C
D
Tillman Water Reclamation Plant - 80mgd capacity
LA/Glendale Water Reclamation Plant – 20mgd capacity
Hyperion Treatment Plant – 450mgd capacity
Terminal Island Water Reclamation Plant – 30mgd capacity
Overall Study Goal
Minimize Odor Issues in the
City of Los Angeles Sewer System
Study Objectives
Identify sources and causes of odor
Establish effective means of reducing odor
Determine best location(s) and most effective
technologies for Air Treatment Facilities (ATF)
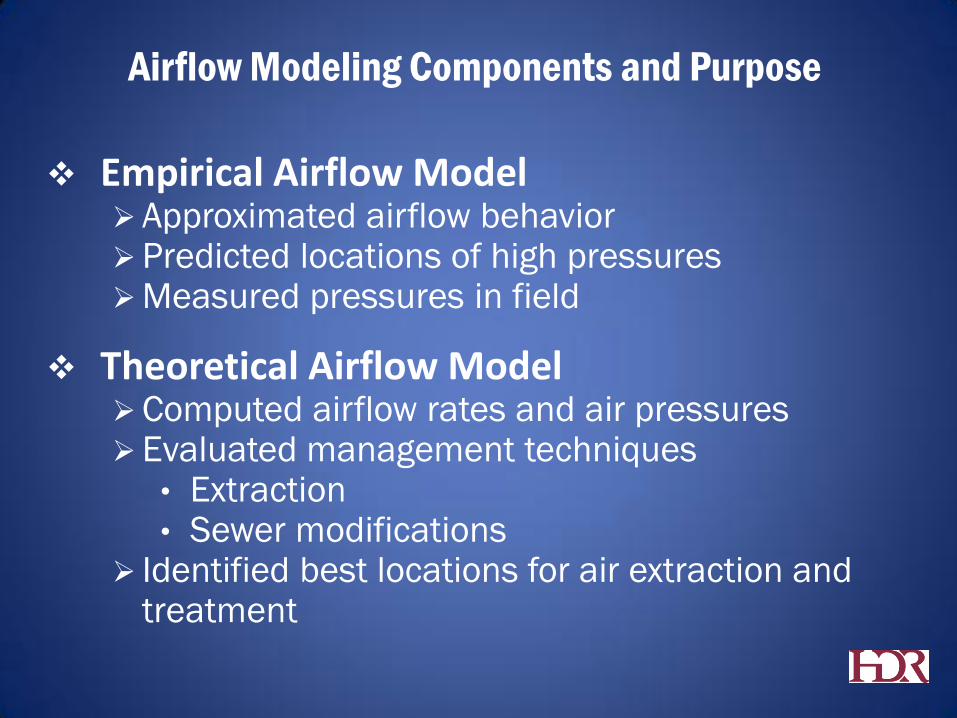
Airflow Modeling Components and Purpose
Empirical Airflow Model Approximated airflow behavior Predicted locations of high pressures Measured pressures in field
Theoretical Airflow Model Computed airflow rates and air pressures Evaluated management techniques
• Extraction • Sewer modifications
Identified best locations for air extraction and treatment
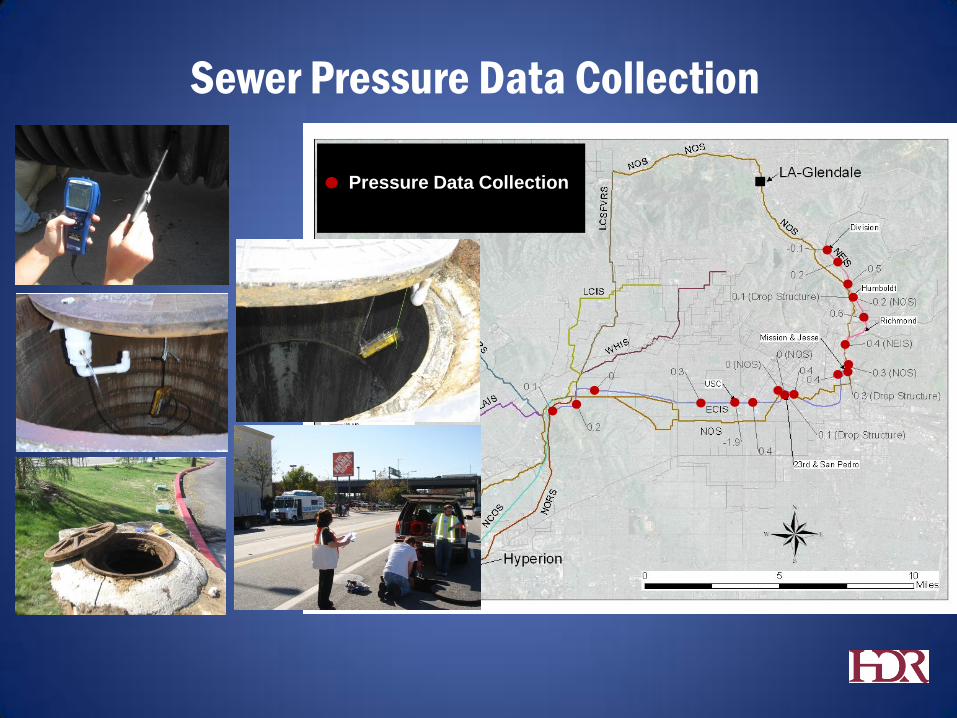
Sewer Pressure Data Collection
Pressure Data Collection
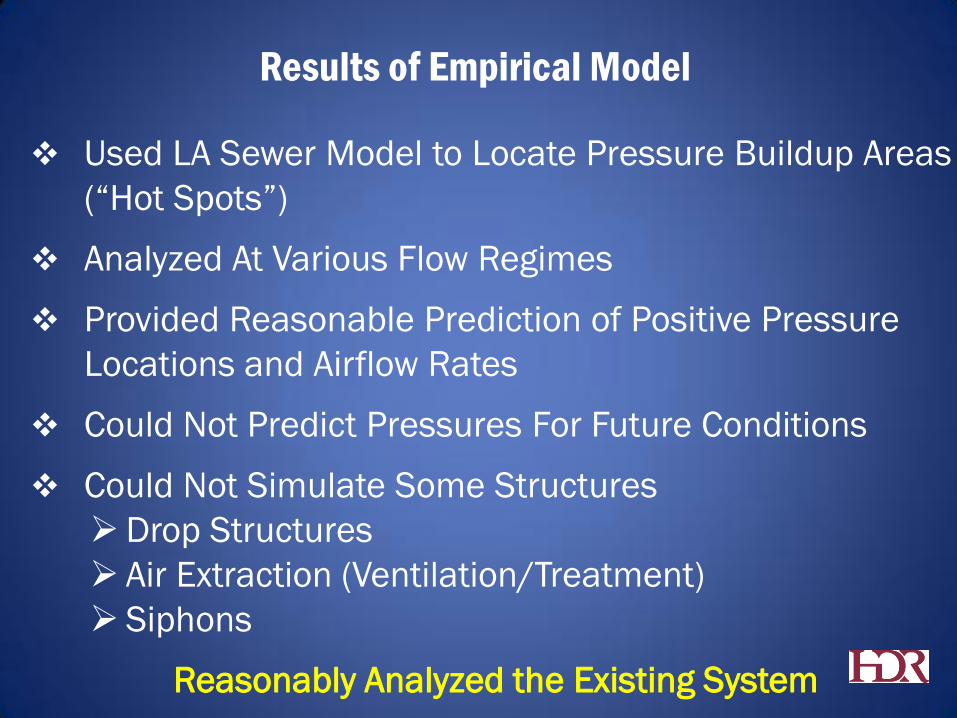
Used LA Sewer Model to Locate Pressure Buildup Areas
(“Hot Spots”)
Analyzed At Various Flow Regimes
Provided Reasonable Prediction of Positive Pressure
Locations and Airflow Rates
Could Not Predict Pressures For Future Conditions
Could Not Simulate Some Structures
Drop Structures
Air Extraction (Ventilation/Treatment)
Siphons
Reasonably Analyzed the Existing System
Results of Empirical Model
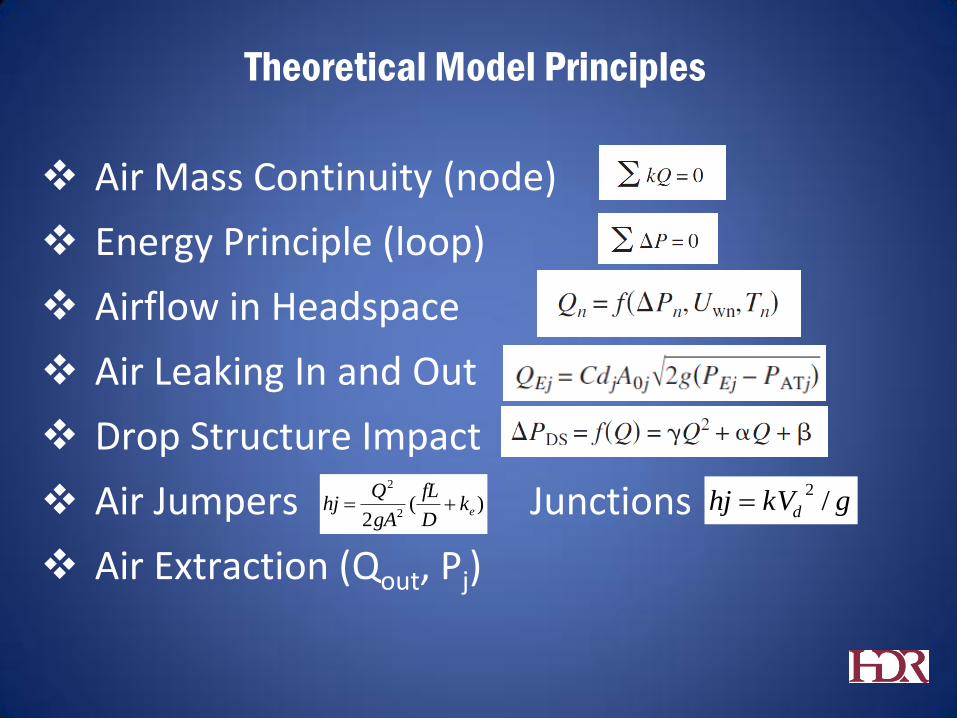
Theoretical Model Principles
Air Mass Continuity (node)
Energy Principle (loop)
Airflow in Headspace
Air Leaking In and Out
Drop Structure Impact
Air Jumpers Junctions
Air Extraction (Qout, Pj)
)(2 2
2
ekD
fL
gA
Qhj gkVhj d /
2
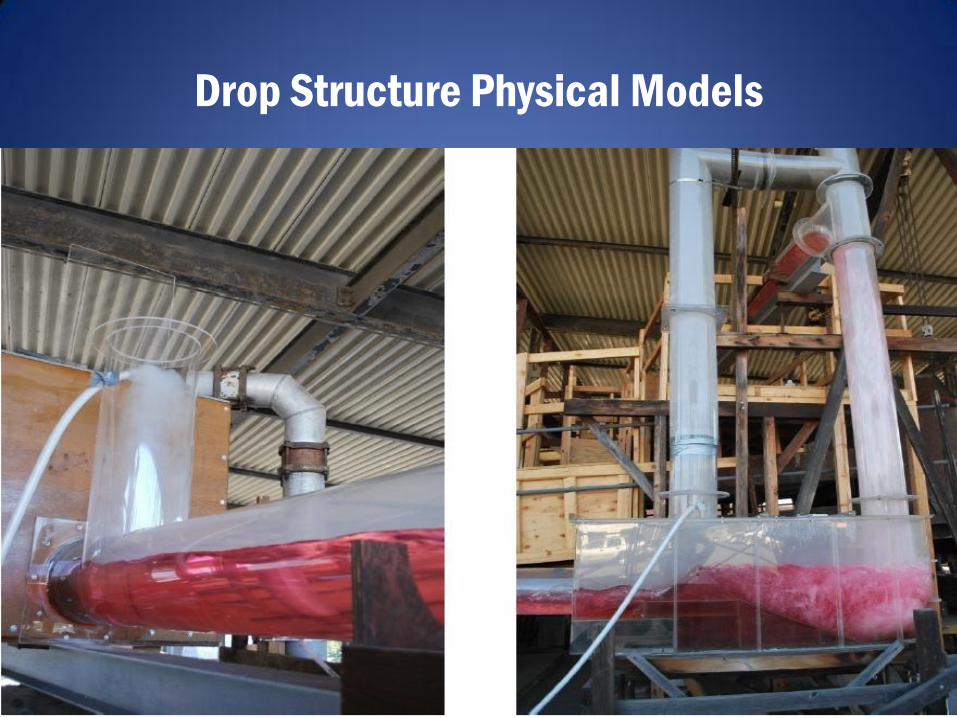
Drop Structure Physical Models
Air Model Input Data
Depth and Velocity (Hydraulic Model)
Drop Structure Characteristic Curve (Physical Model)
Field Pressure Data Pav and Pmax
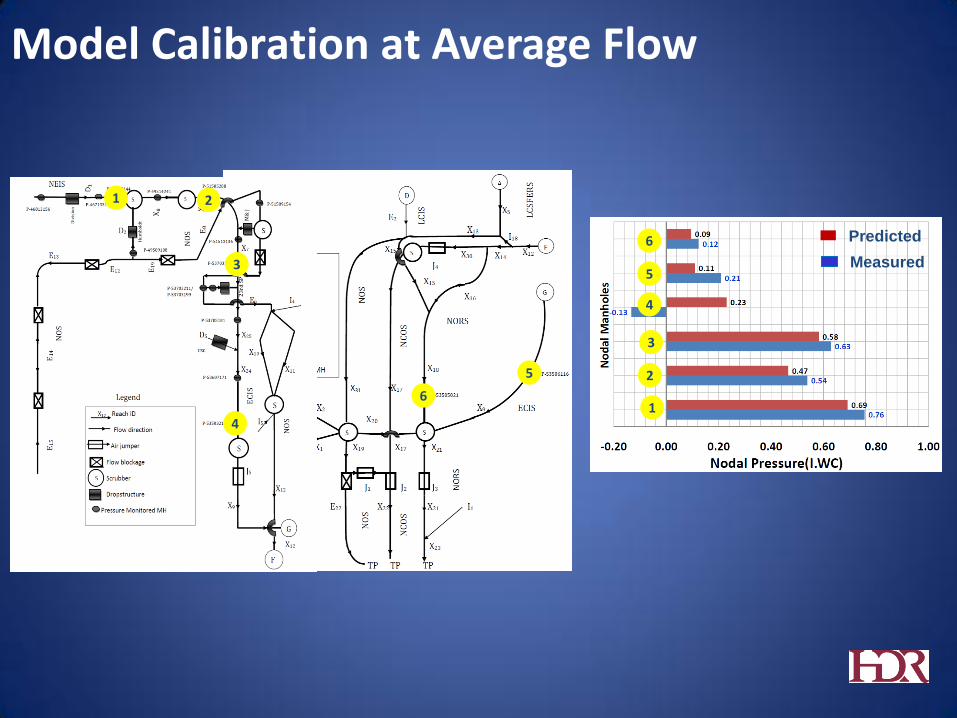
Model Calibration at Average Flow
1 2
3
4
5
6
Predicted
Measured
1
2
3
4
5
6
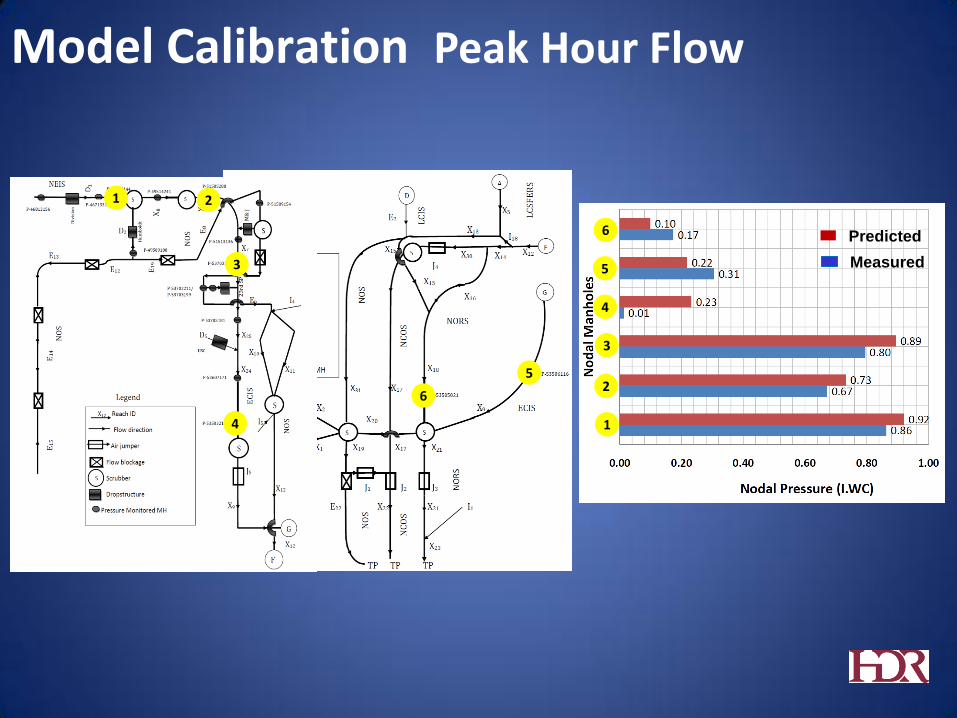
Model Calibration Peak Hour Flow
1 2
3
4
5
6
Predicted
Measured
1
2
3
4
5
6
Theoretical Model Summary
Computed Airflow and Air Pressures
Analyzed Various Flow Scenarios
Simulated Drop Structures, ATF(s), Siphons (air jumpers), and Air Curtains, etc.
Model Can Be Used as a Good Planning and Decision- Making Too
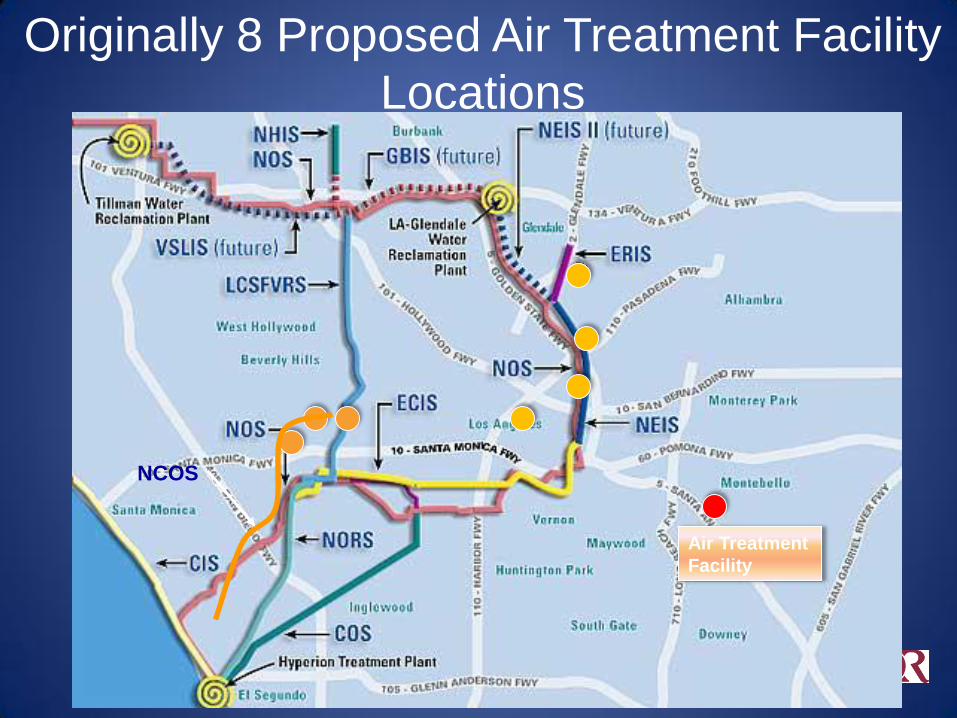
Originally 8 Proposed Air Treatment Facility
Locations
Air Treatment
Facility
NCOS
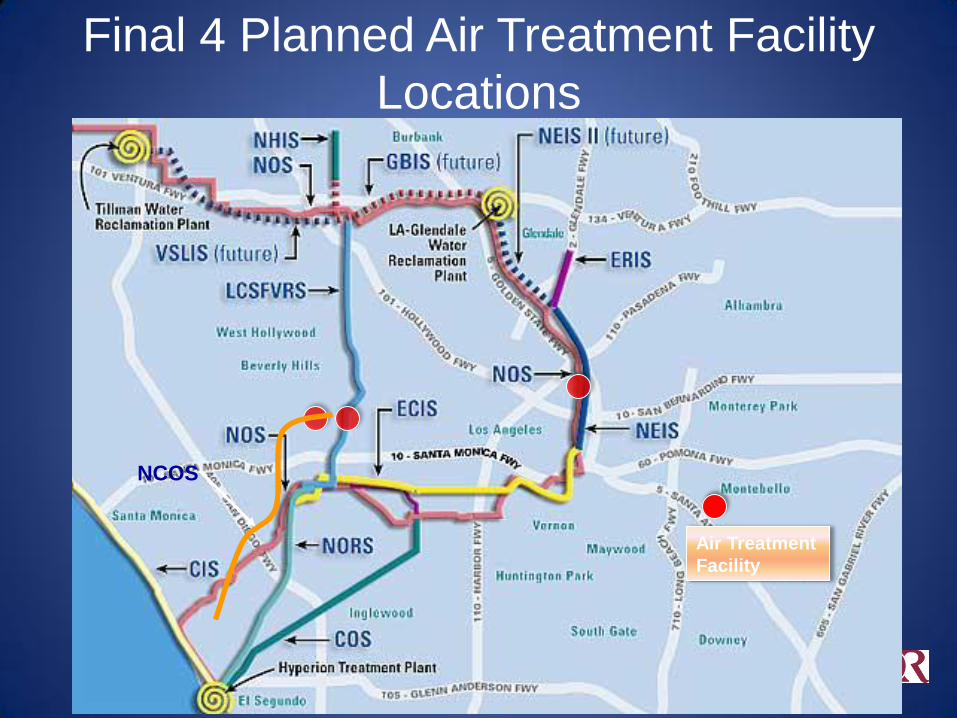
Final 4 Planned Air Treatment Facility
Locations
Air Treatment
Facility
NCOS
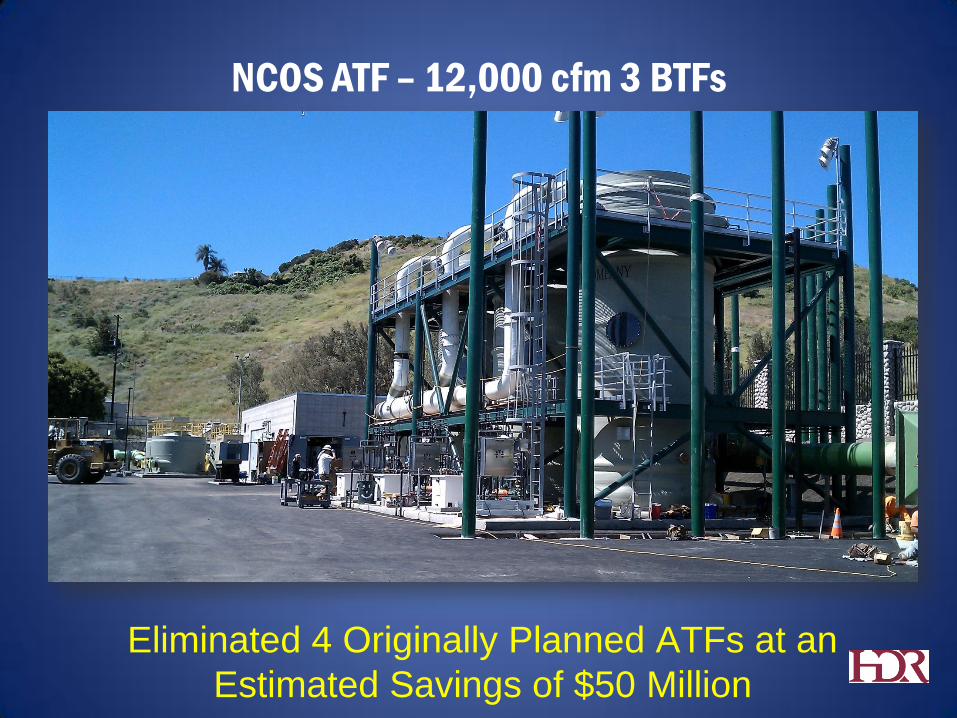
NCOS ATF – 12,000 cfm 3 BTFs
Eliminated 4 Originally Planned ATFs at an
Estimated Savings of $50 Million
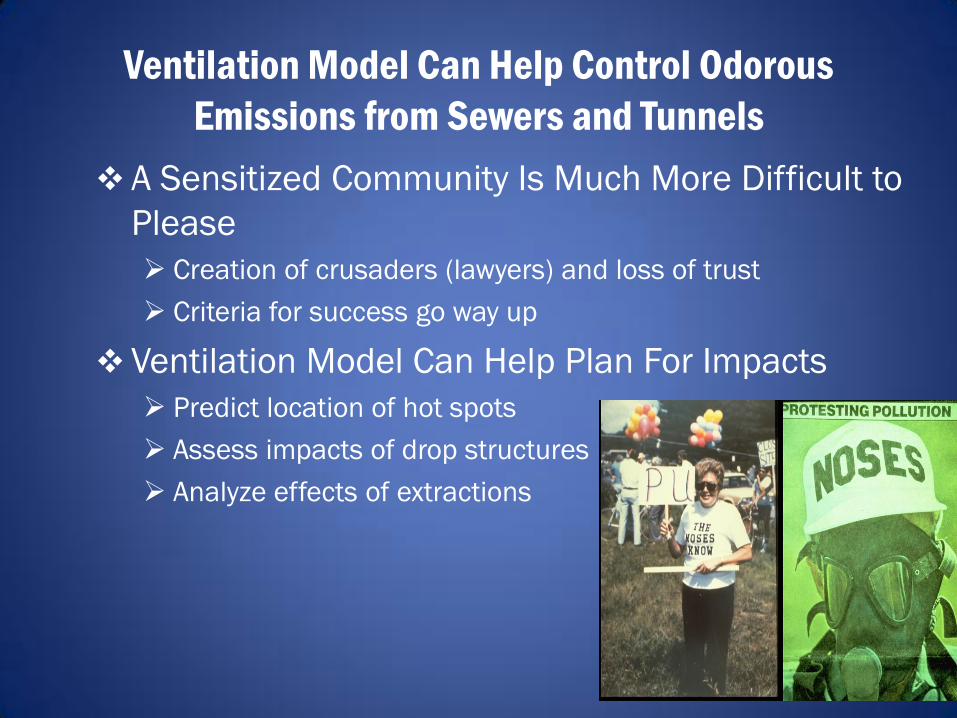
Ventilation Model Can Help Control Odorous
Emissions from Sewers and Tunnels
A Sensitized Community Is Much More Difficult to
Please
Creation of crusaders (lawyers) and loss of trust
Criteria for success go way up
Ventilation Model Can Help Plan For Impacts
Predict location of hot spots
Assess impacts of drop structures
Analyze effects of extractions
Ventilation Model Approach
Plan
Use HDR Ventilation Model and Utility Sewer Model
Validate the model in the summer
Collect H2S data
Assess impacts of tunnel or sewer connections
Assess emissions mitigation techniques (extraction, drop structures, etc)
Output
Air flow rates at hot spots under various flow regimes
Locations of most influence for air extraction
Options for control
Estimates of H2S concentrations
Most Important Odor Control Principles
Location, Location, Location Distance to nearest detector The number of detectors Direction of prevailing winds
Control Technology Parameters Airflow rates H2S concentration Emitted H2S mass emission rate
Most Often Need BACT PPM to PPB = 99.9% efficiency
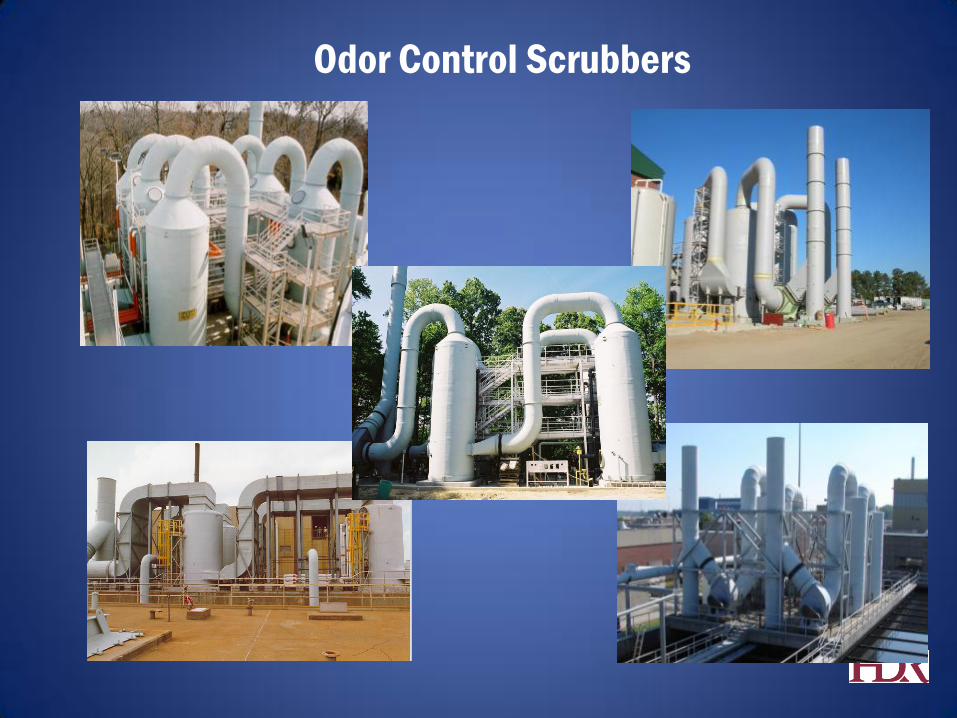
Odor Control Scrubbers
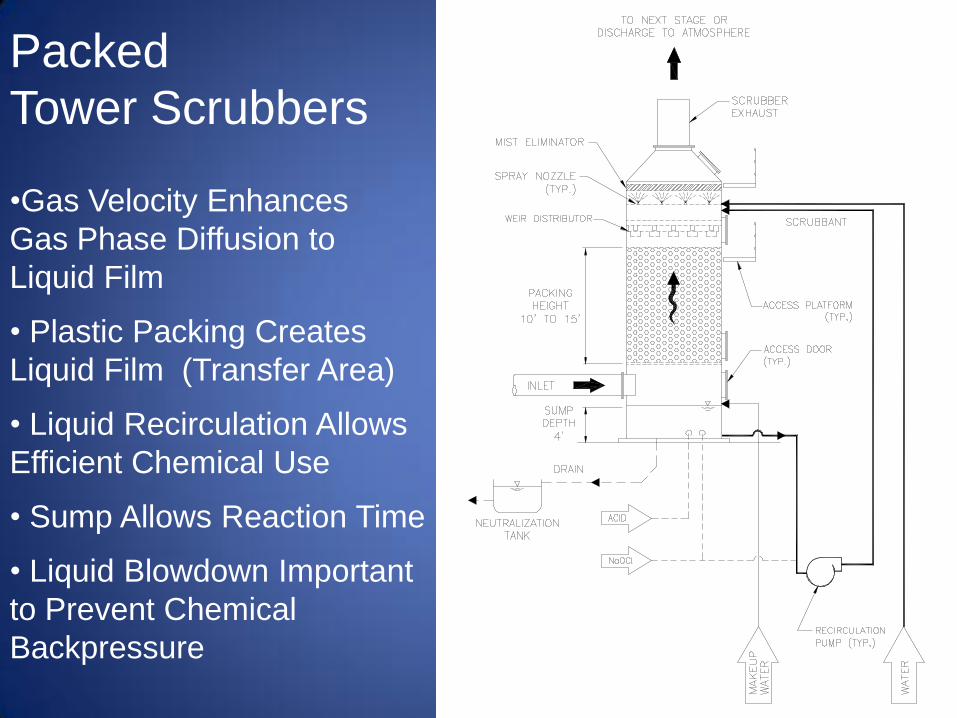
Packed
Tower Scrubbers
•Gas Velocity Enhances
Gas Phase Diffusion to
Liquid Film
• Plastic Packing Creates
Liquid Film (Transfer Area)
• Liquid Recirculation Allows
Efficient Chemical Use
• Sump Allows Reaction Time
• Liquid Blowdown Important
to Prevent Chemical
Backpressure
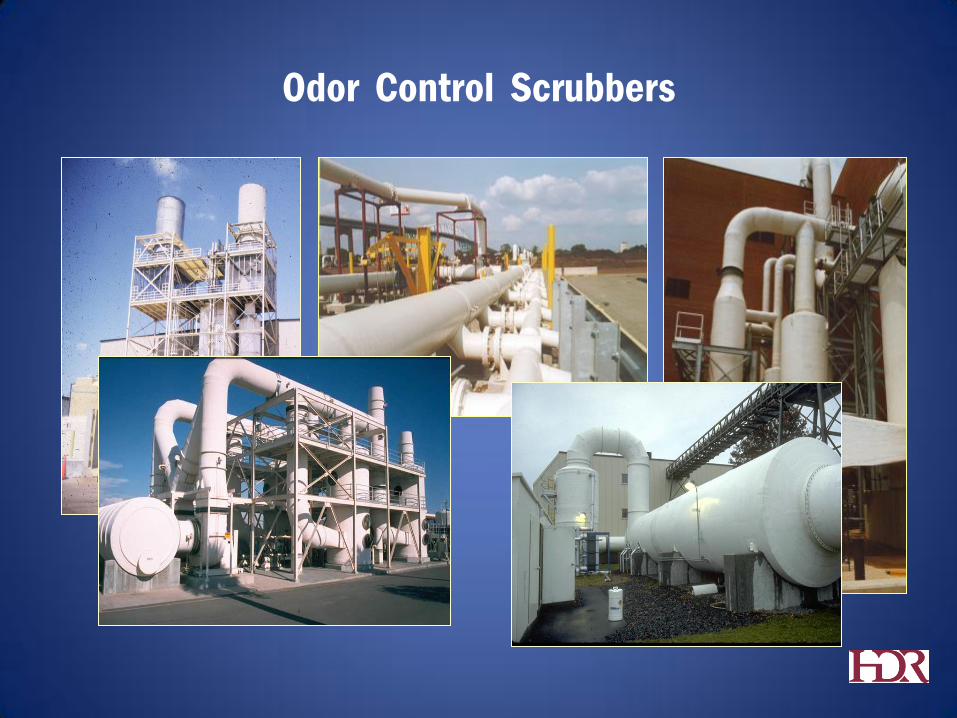
Odor Control Scrubbers
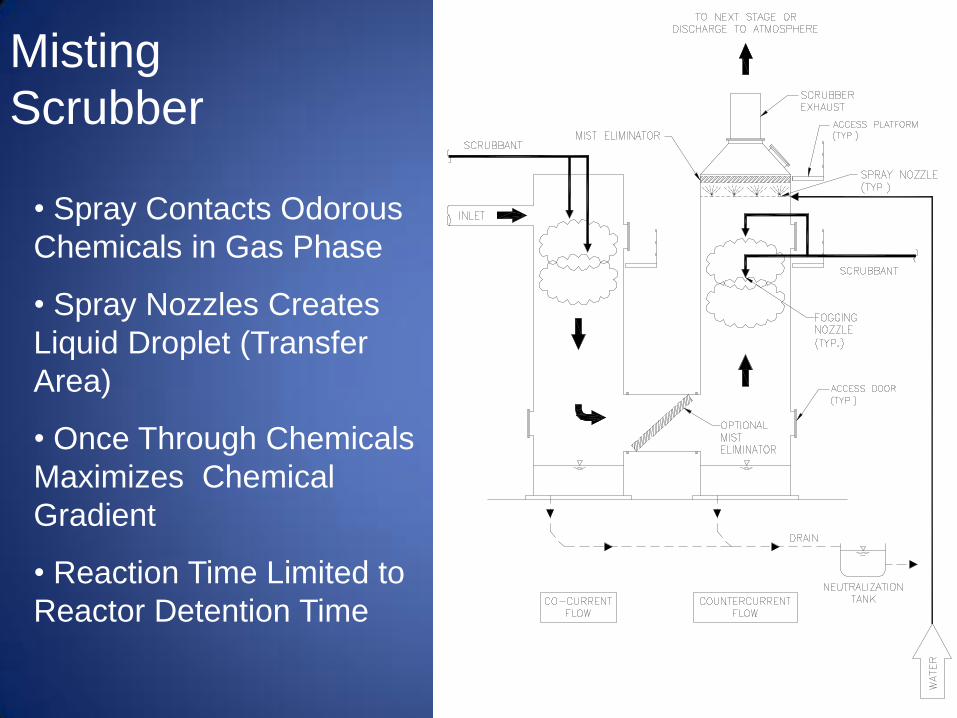
Misting
Scrubber
• Spray Contacts Odorous
Chemicals in Gas Phase
• Spray Nozzles Creates
Liquid Droplet (Transfer
Area)
• Once Through Chemicals
Maximizes Chemical
Gradient
• Reaction Time Limited to
Reactor Detention Time
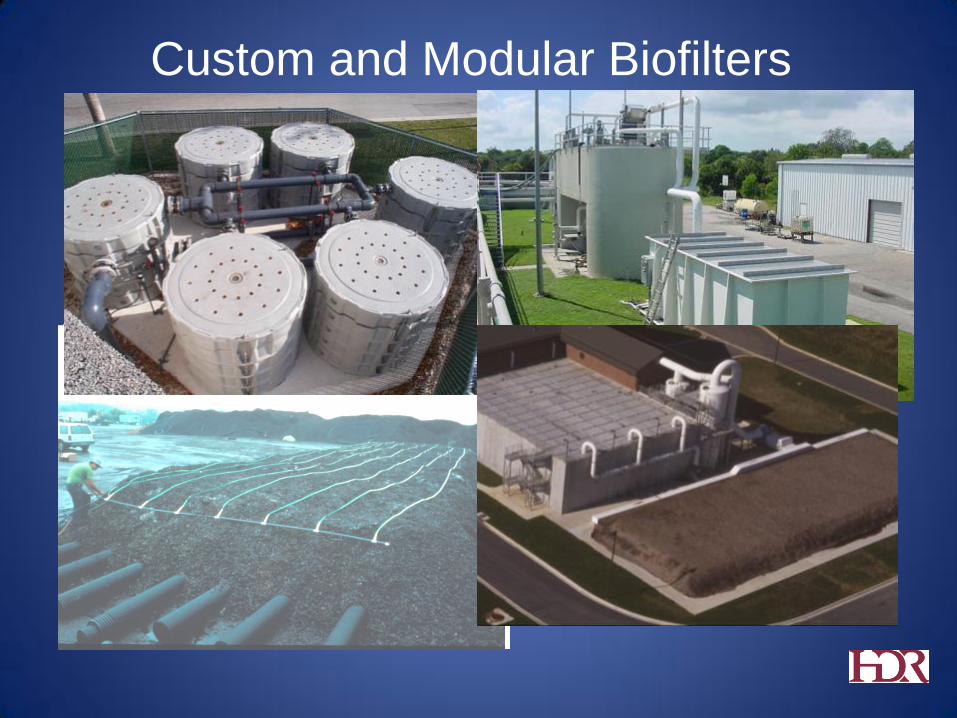
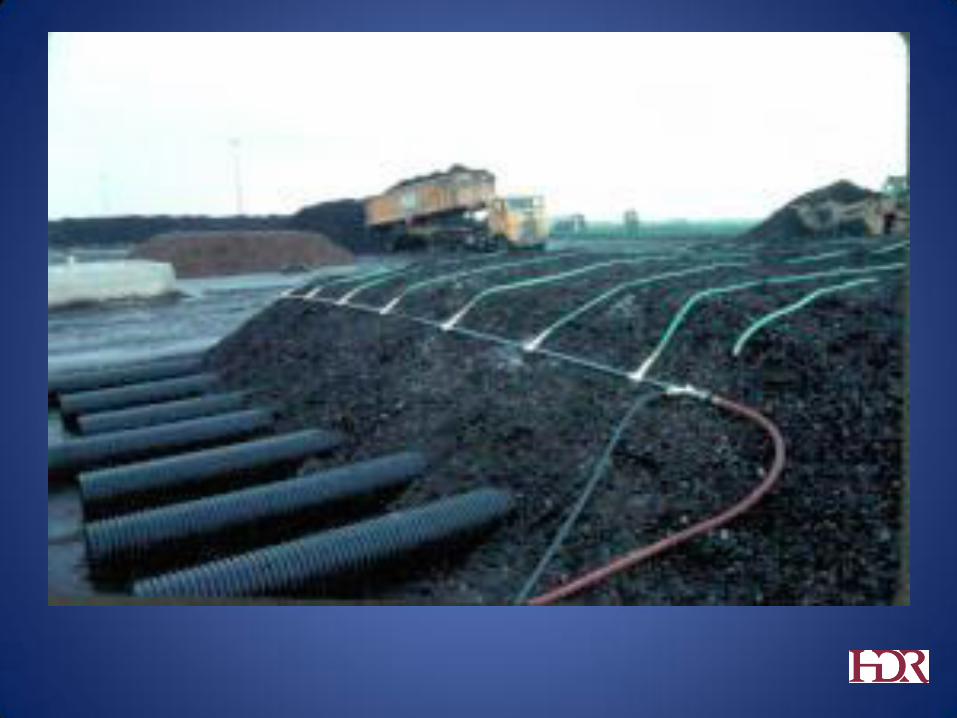
Custom and Modular Biofilters
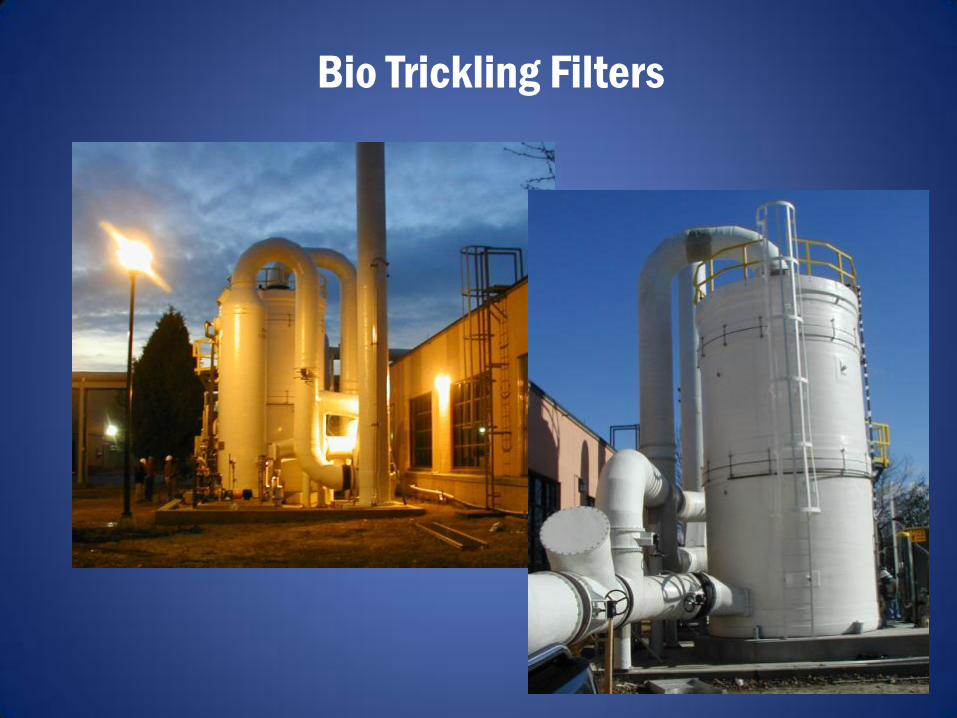
Bio Trickling Filters
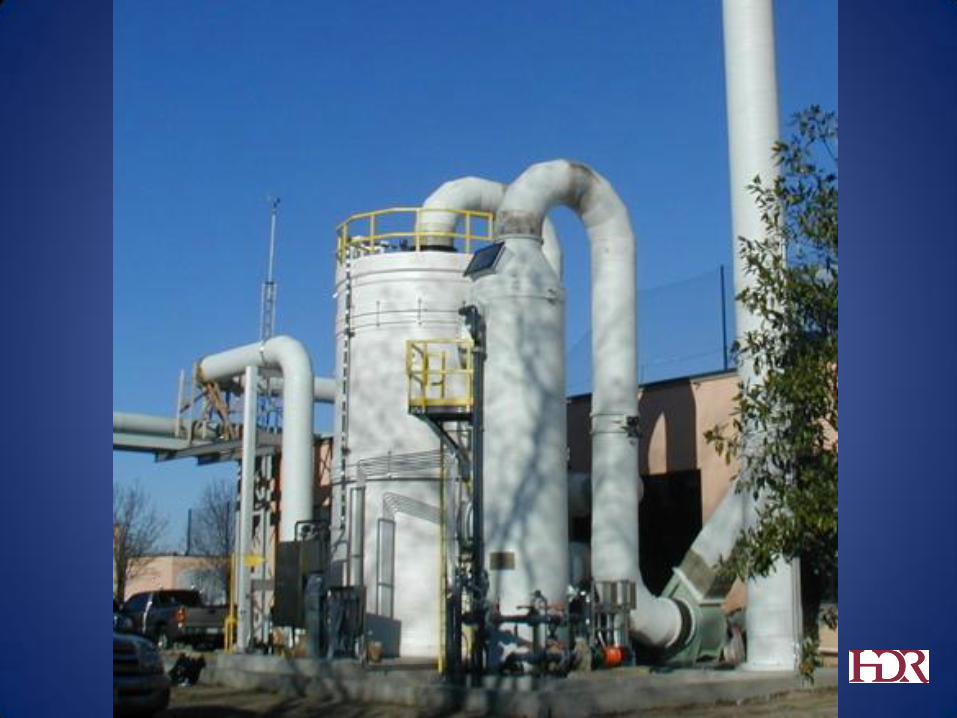
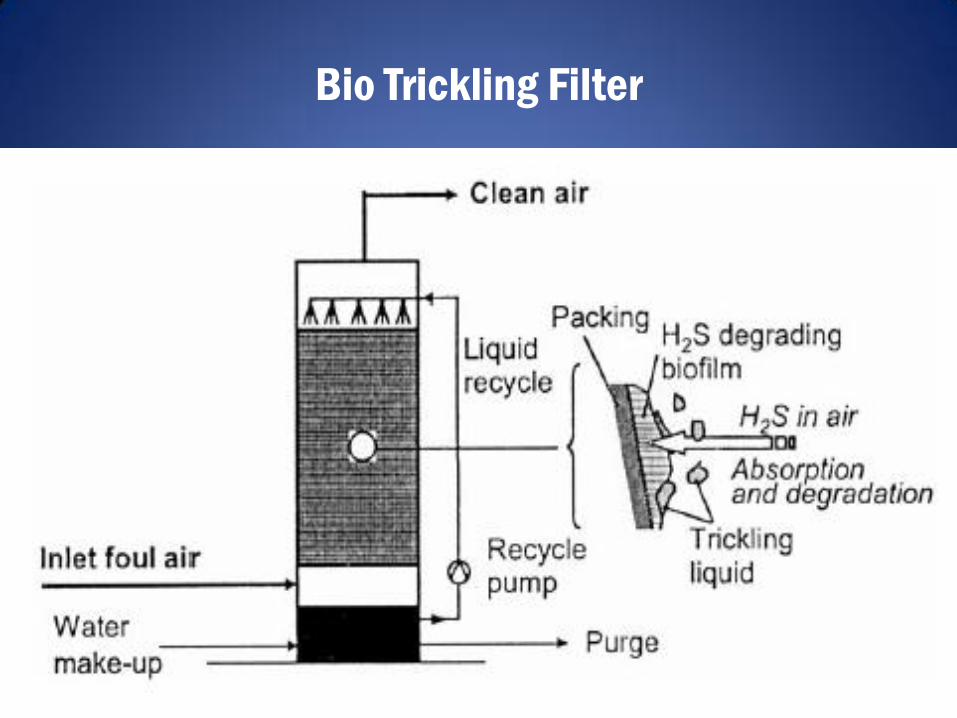
Bio Trickling Filter
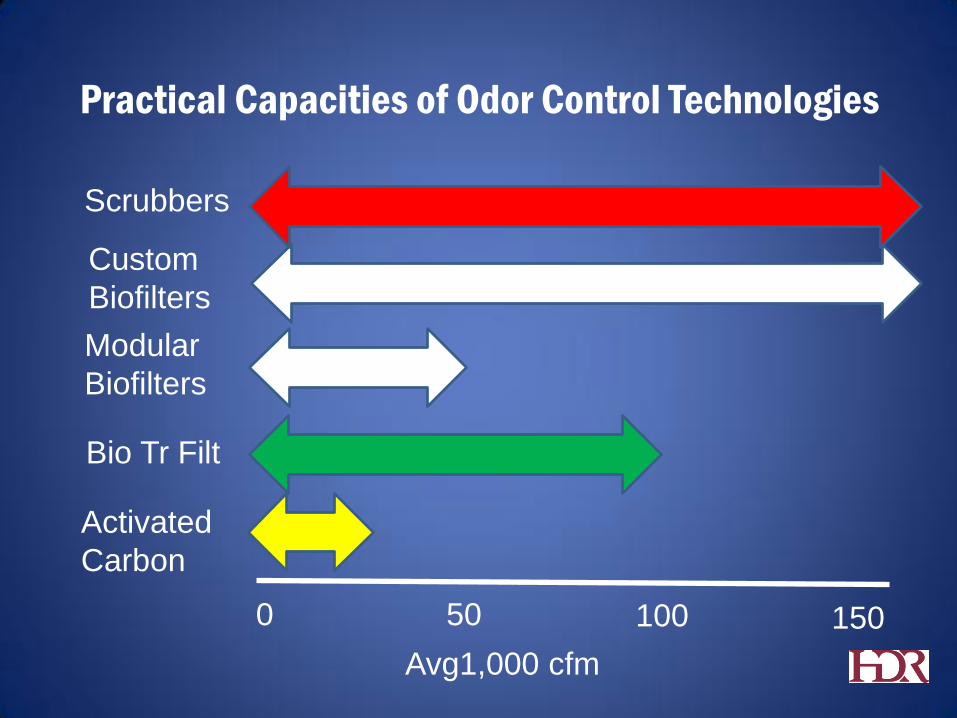
Practical Capacities of Odor Control Technologies
Scrubbers
Activated
Carbon
Modular
Biofilters
50 0 100 150
Bio Tr Filt
Custom
Biofilters
Avg1,000 cfm
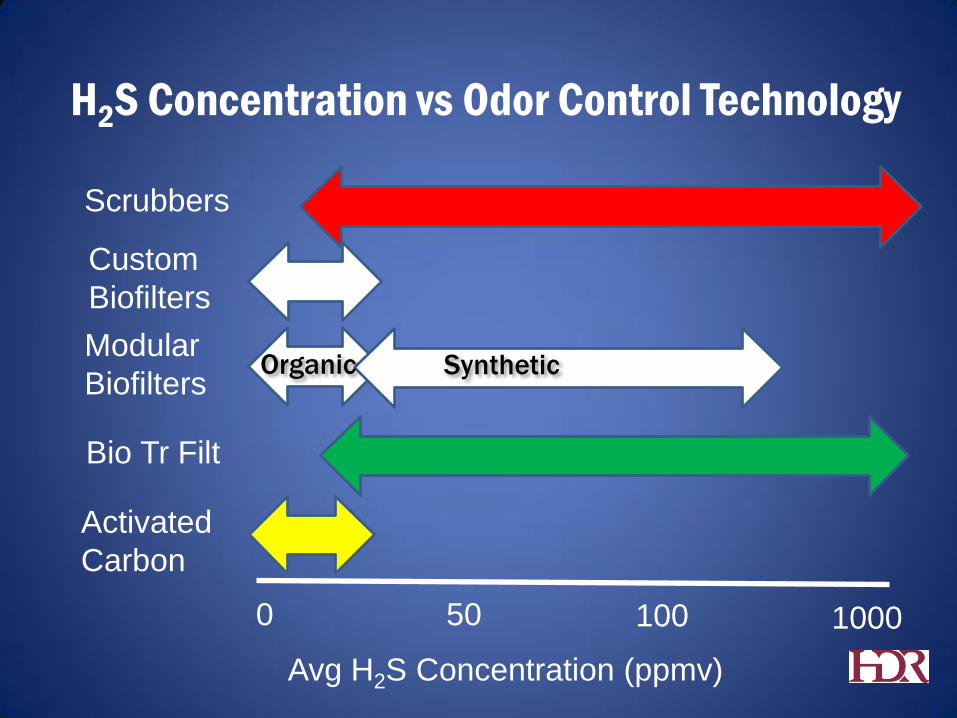
H2S Concentration vs Odor Control Technology
50 0 100 1000
Avg H2S Concentration (ppmv)
Scrubbers
Activated
Carbon
Modular
Biofilters
Bio Tr Filt
Custom
Biofilters
Organic Synthetic
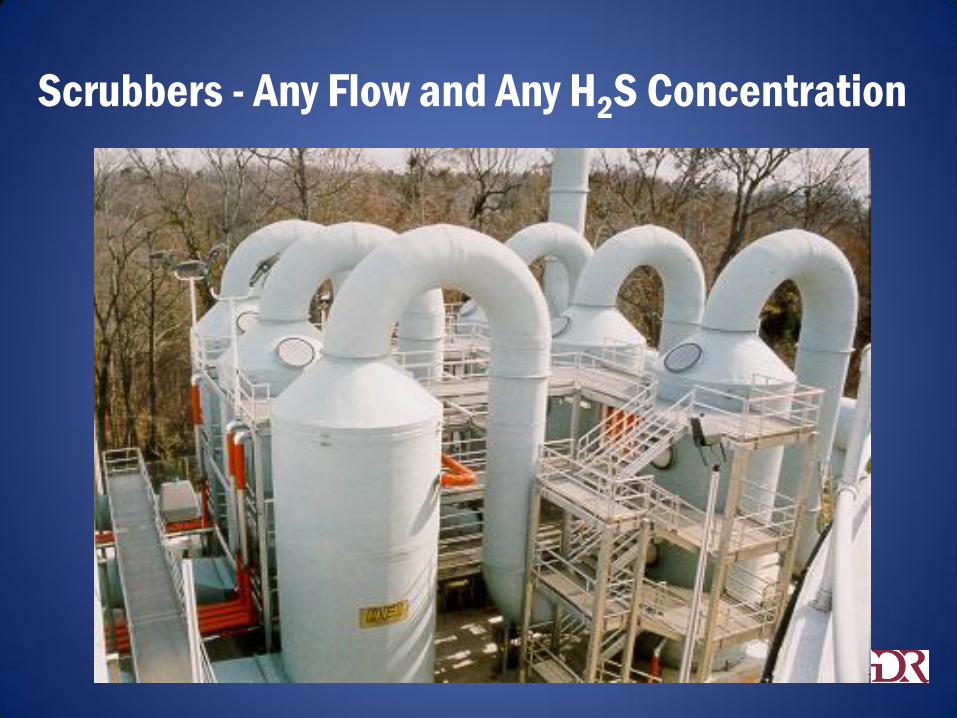
Scrubbers - Any Flow and Any H2S Concentration
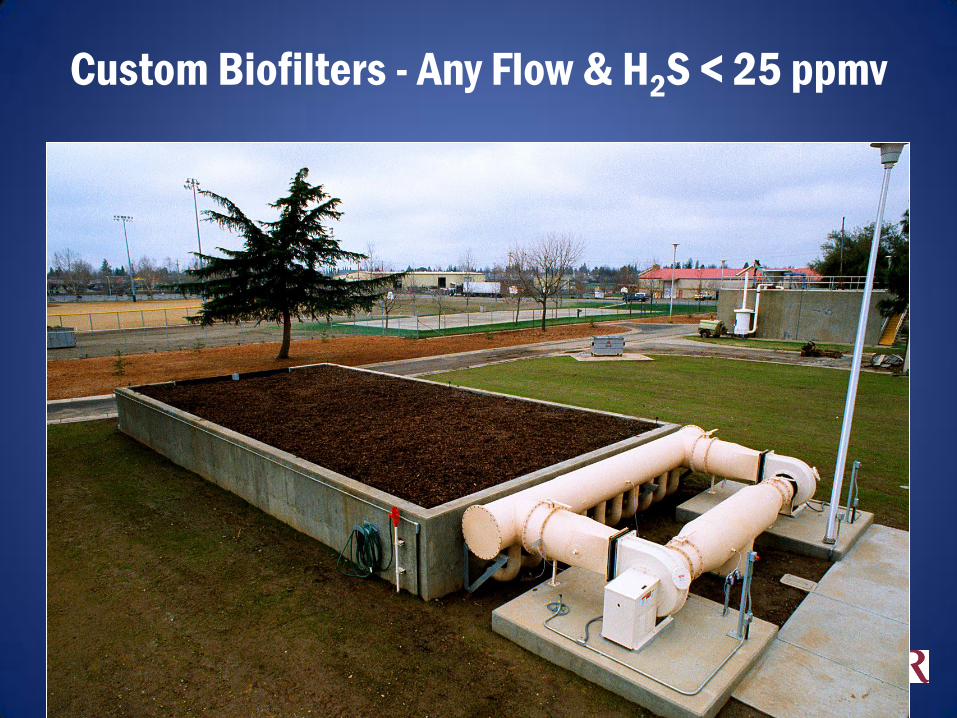
Custom Biofilters - Any Flow & H2S < 25 ppmv
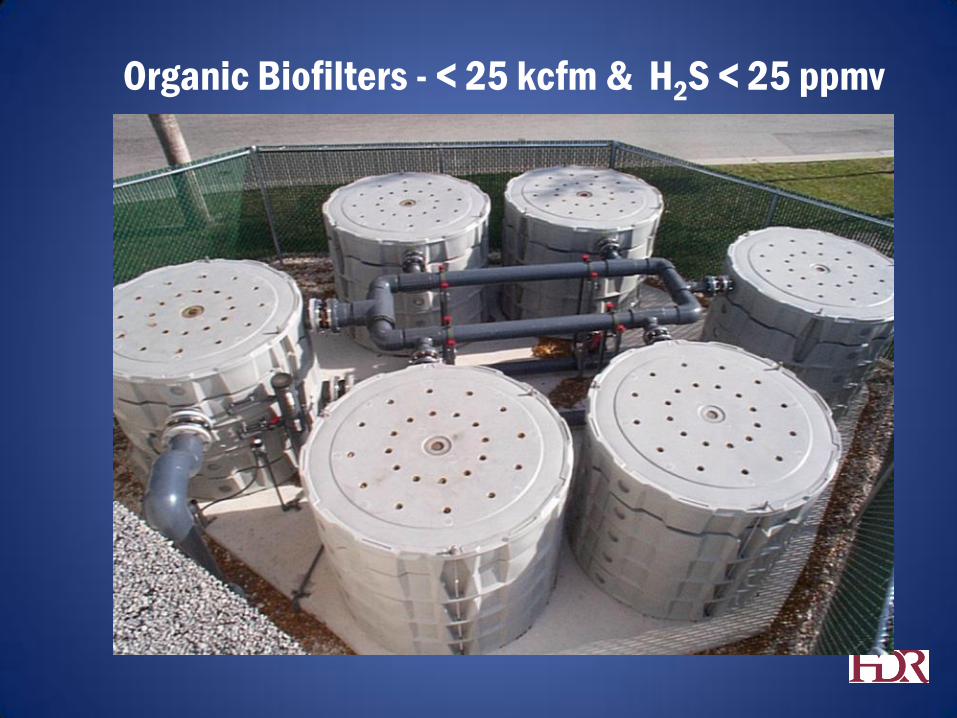
Organic Biofilters - < 25 kcfm & H2S < 25 ppmv
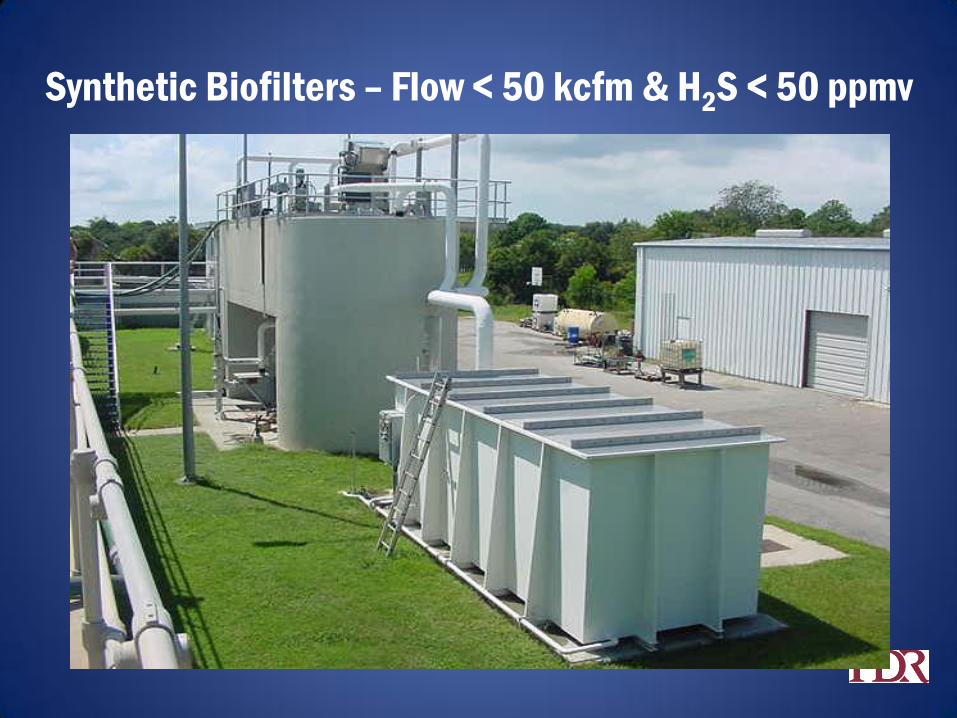
Synthetic Biofilters – Flow < 50 kcfm & H2S < 50 ppmv
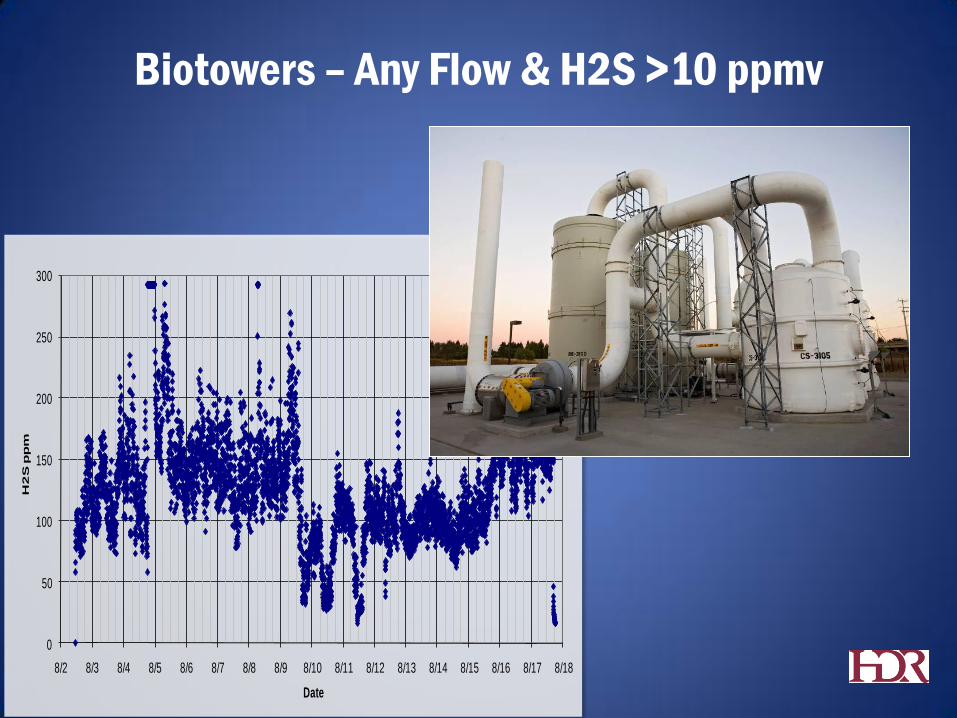
Biotowers – Any Flow & H2S >10 ppmv
0
50
100
150
200
250
300
8/2 8/3 8/4 8/5 8/6 8/7 8/8 8/9 8/10 8/11 8/12 8/13 8/14 8/15 8/16 8/17 8/18
H2
S p
pm
Date
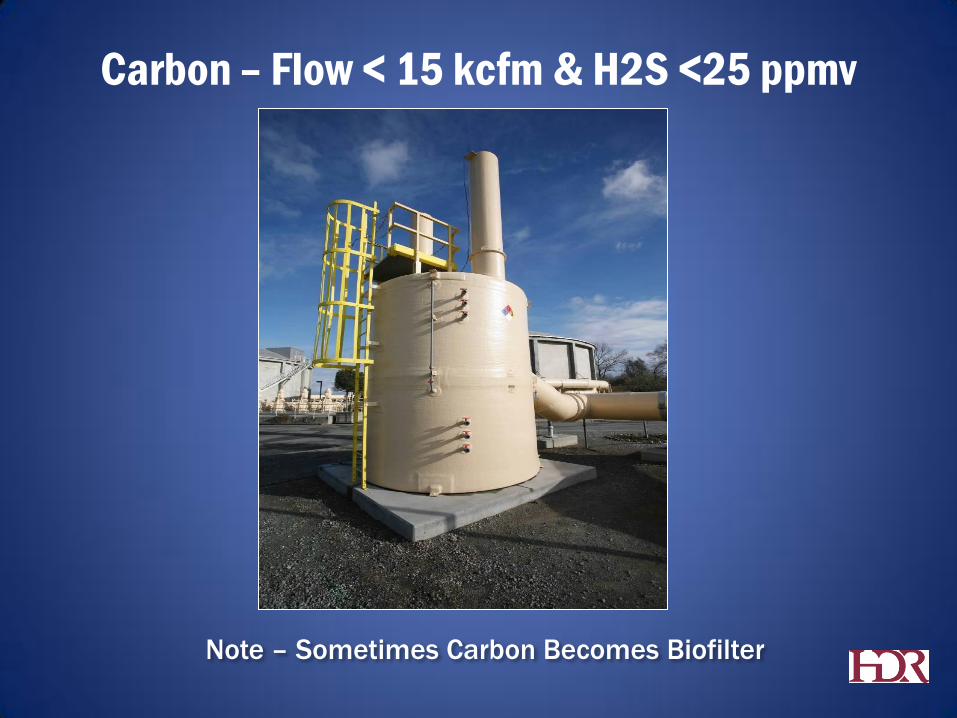
Carbon – Flow < 15 kcfm & H2S <25 ppmv
Note – Sometimes Carbon Becomes Biofilter
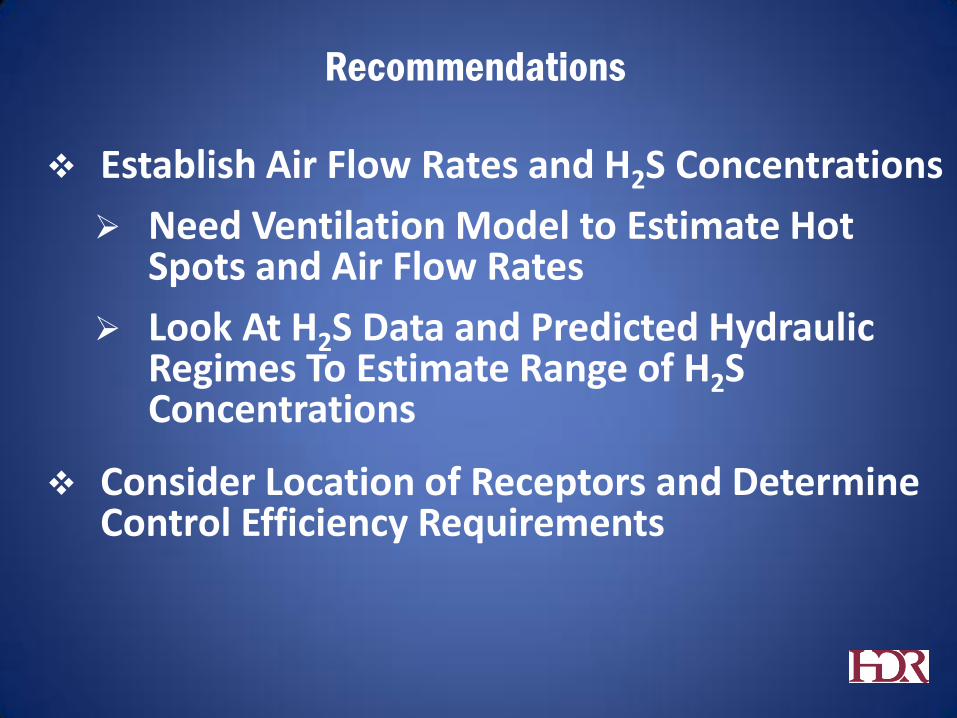
Recommendations
Establish Air Flow Rates and H2S Concentrations
Need Ventilation Model to Estimate Hot Spots and Air Flow Rates
Look At H2S Data and Predicted Hydraulic Regimes To Estimate Range of H2S Concentrations
Consider Location of Receptors and Determine Control Efficiency Requirements
Recommendations
Use Estimated Flow and Estimated H2S Concentrations to Establish Type(s) of Control Technologies Most Appropriate
Evaluate Options and Costs – Pick a Solution
Develop a Plan for Higher Flow Rates and/or Higher H2S Concentrations
Parallel Ducts and Controls
Multiple Stages or Technologies
An Ounce is Worth a Pound of Cure