Embed Size (px)
DESCRIPTION
Reading Literature 9-12.2: Determine Theme and Analyze Its Development Reading Informational Text 9-12.2: Determine Central Idea and Analyze Its Development Reading Literature/ Informational Text Standard 9-12.1: Cite Strong and Thorough Textual Evidence. Venn Diagram. - PowerPoint PPT Presentation
Citation preview

Venn Diagram
Please print this slide show, follow the directions, Please print this slide show, follow the directions, and staple it to your reading response.and staple it to your reading response.
• Reading Literature 9-12.2: Determine Theme and Analyze Its Development
Reading Literature 9-12.2: Determine Theme and Analyze Its Development
• Reading Informational Text 9-12.2: Determine Central Idea and Analyze Its Development
Reading Informational Text 9-12.2: Determine Central Idea and Analyze Its Development
• Reading Literature/ Informational Text Standard 9-12.1: Cite Strong and Thorough Textual Evidence
Reading Literature/ Informational Text Standard 9-12.1: Cite Strong and Thorough Textual Evidence
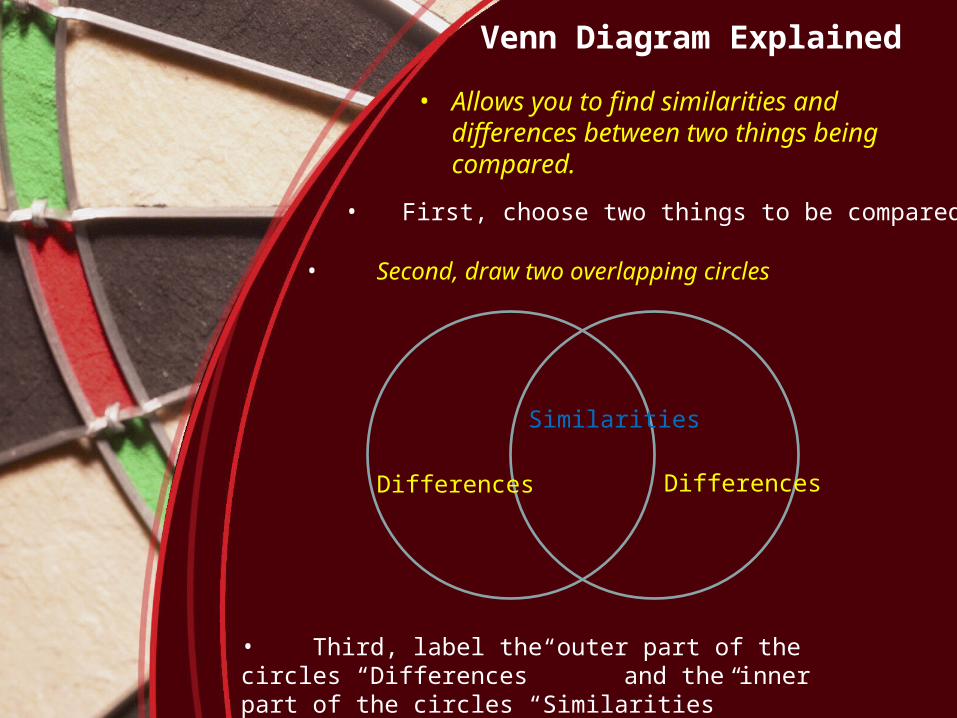
Venn Diagram Explained
• Allows you to find similarities and differences between two things being compared.
• First, choose two things to be compared
• Second, draw two overlapping circles
• Third, label the outer part of the circles “Differences” and the inner part of the circles “Similarities”
Differences Differences
Similarities
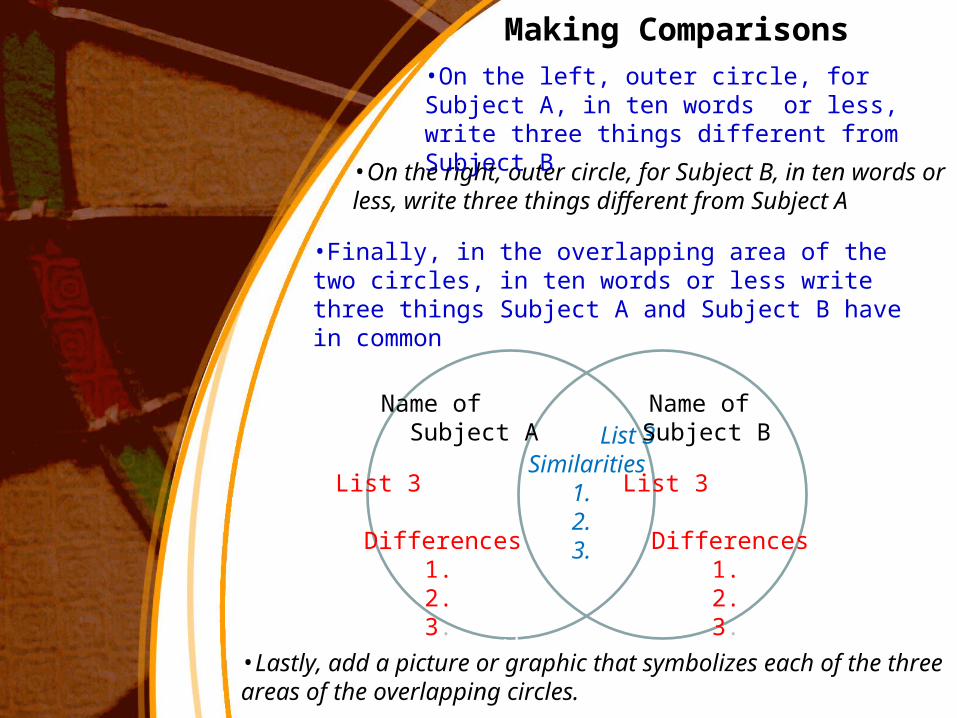
Making Comparisons
• Third, Label the outer part of the circles “Differences” and the inner part of the circle “Similarities”
List 3 Differences
1. 2. 3.
List 3Similarities 1. 2. 3.
•On the right, outer circle, for Subject B, in ten words or less, write three things different from Subject A
•Finally, in the overlapping area of the two circles, in ten words or less write three things Subject A and Subject B have in common
•Lastly, add a picture or graphic that symbolizes each of the three areas of the overlapping circles.
•On the left, outer circle, for Subject A, in ten words or less, write three things different from Subject B
Name of Subject A
Name of Subject B
List 3 Differences
1. 2. 3.
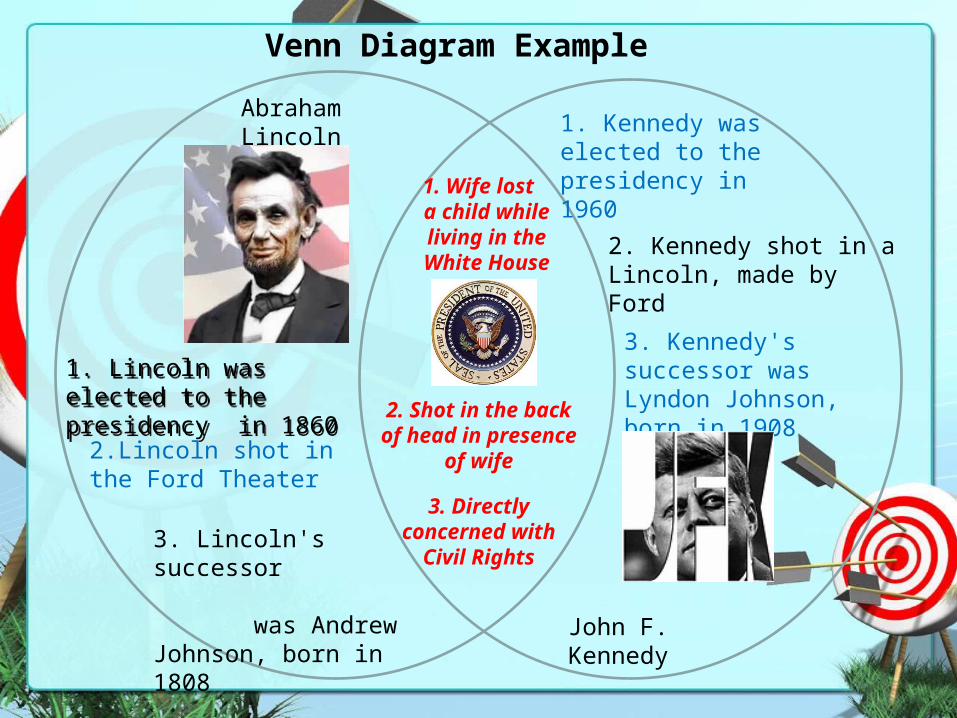
2. Shot in the back of head in presence
of wife
Venn Diagram Example
2.Lincoln shot in the Ford Theater
2. Kennedy shot in a Lincoln, made by Ford
1. Lincoln was elected to the presidency in 18601. Lincoln was elected to the presidency in 1860
1. Kennedy was elected to the presidency in 1960
3. Lincoln's successor was Andrew Johnson, born in 1808
3. Kennedy's successor was Lyndon Johnson, born in 1908
1. Wife lost a child while living in the White House
3. Directly concerned with
Civil Rights
Abraham Lincoln
John F. Kennedy
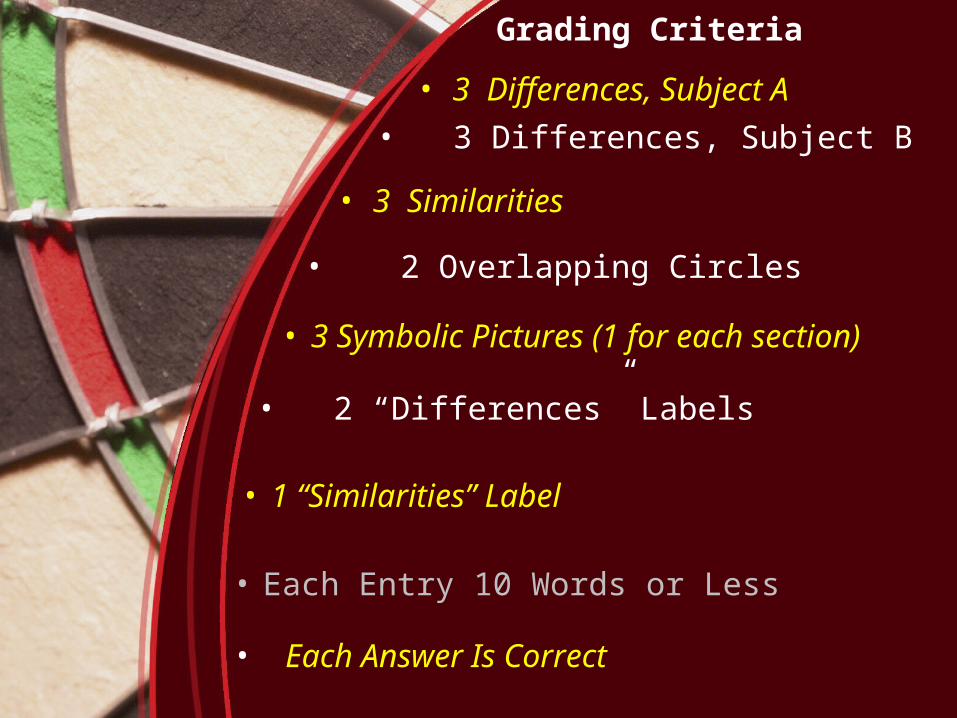
Grading Criteria
• 3 Similarities
• 3 Differences, Subject B
• 2 Overlapping Circles
• 2 “Differences” Labels
• 3 Symbolic Pictures (1 for each section)
• Each Entry 10 Words or Less
• 1 “Similarities” Label
• 3 Differences, Subject A
• Each Answer Is Correct
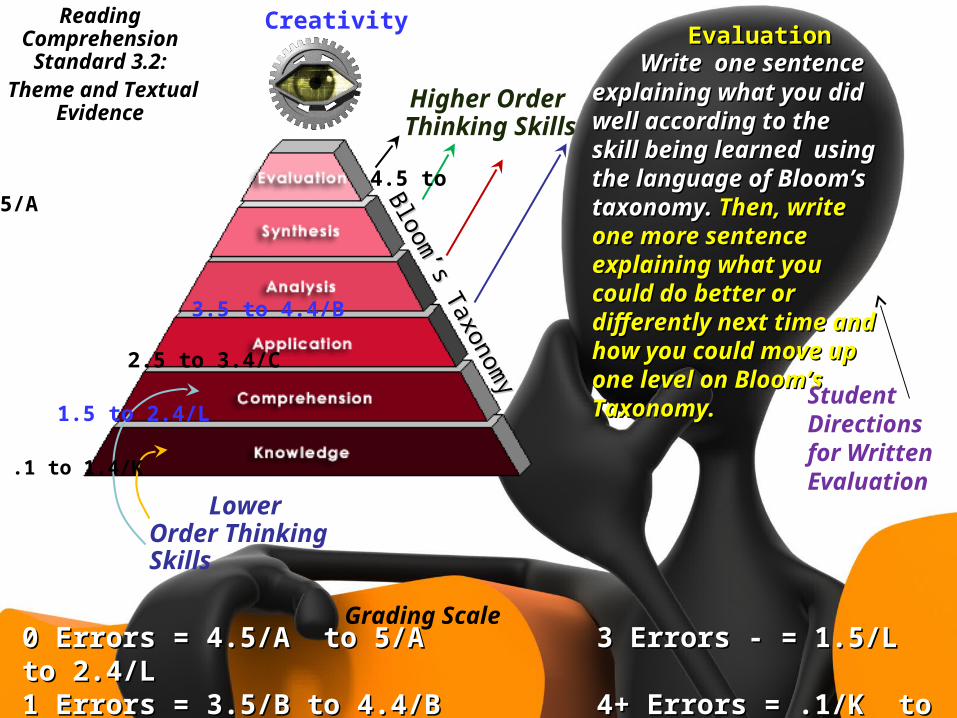
Higher Order Thinking Skills
Lower Order Thinking Skills
Creativity
Bloom
’s Taxonomy
Bloom
’s Taxonomy
4.5 to 5/A
3.5 to 4.4/B
2.5 to 3.4/C
1.5 to 2.4/L
.1 to 1.4/K
Write one sentence Write one sentence explaining what you did well explaining what you did well according to the skill being according to the skill being learned using the language learned using the language of Bloom’s taxonomy. of Bloom’s taxonomy. Then, Then, write one more sentence write one more sentence explaining what you could explaining what you could do better or differently next do better or differently next time and how you could time and how you could move up one level on move up one level on Bloom’s Taxonomy.Bloom’s Taxonomy.
Student Directions for Written Evaluation
0 Errors = 4.5/A to 5/A 0 Errors = 4.5/A to 5/A 3 Errors - = 1.5/L to 2.4/L3 Errors - = 1.5/L to 2.4/L1 Errors = 3.5/B to 4.4/B 1 Errors = 3.5/B to 4.4/B 4+ Errors = .1/K to 1.4/K4+ Errors = .1/K to 1.4/K2 Errors = 2.5/C to 3.4/C2 Errors = 2.5/C to 3.4/C
EvaluationEvaluation
Grading Scale
Reading Comprehension
Standard 3.2: Theme and Textual
Evidence

Printing Directions
1. On the tool bar, click on “File,” click on “Print.”
2. In the “Print” dialogue box, in the lower left corner under “Print What,” click on the drop down arrow and select “Handouts.”
3. Then, under “Color/Grayscale,” select the best on for your printer.
4. Next, under “Handouts,” click on “Slides per Page,” and choose “9.”
5. Lastly, click on “OK,” and the file will print.