Embed Size (px)
Citation preview

© Vattenfall AB
VattenfallQ3 Results 2008
Presentations by
Lars G. Josefsson, CEO andDag Andresen, CFO
30 October 2008
Photo
c

30 October 2008© Vattenfall AB
2Agenda
CEO Lars G. Josefsson:• Sales & earnings• Generation volumes• CCS pilot inaugurated• Nuclear update• Moorburg update• Transmission update• UK acquisitions• Strategy update
– Making electricity clean
CFO Dag Andresen:• Prices & hedge position• P&L and EBIT development• Capex• Liquidity & debt position
30 October 2008© Vattenfall AB
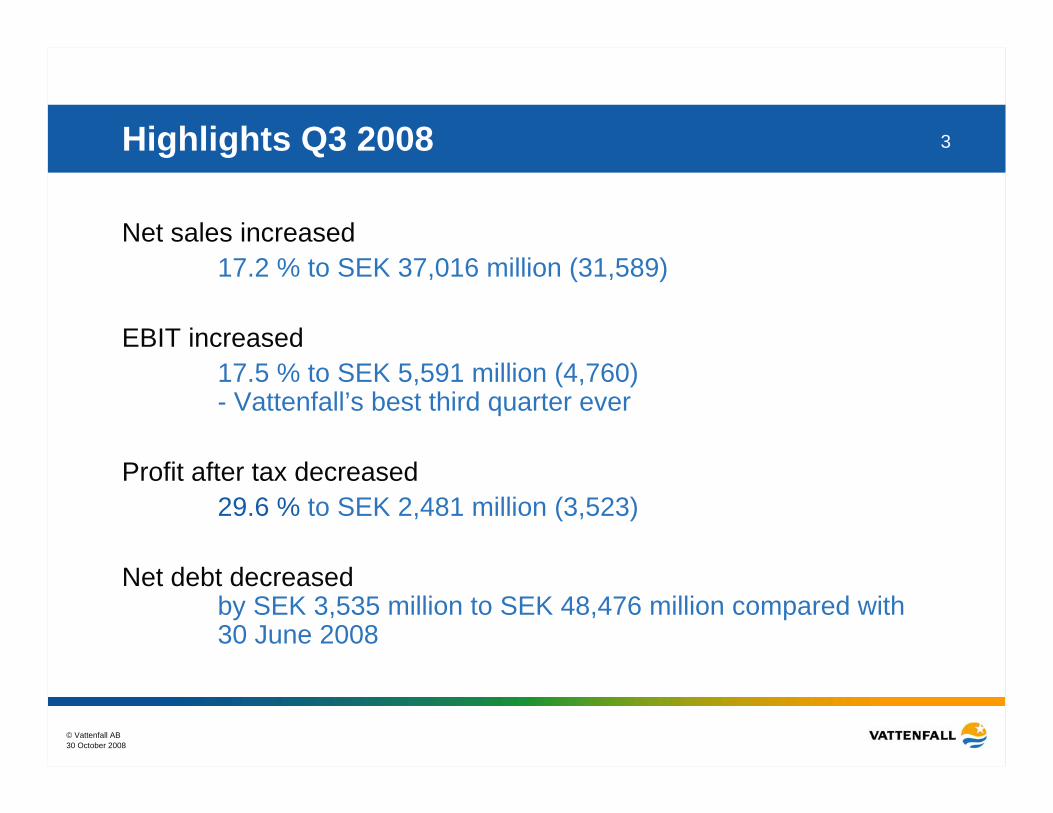
3Highlights Q3 2008
Net sales increased17.2 % to SEK 37,016 million (31,589)
EBIT increased17.5 % to SEK 5,591 million (4,760)- Vattenfall’s best third quarter ever
Profit after tax decreased29.6 % to SEK 2,481 million (3,523)
Net debt decreased by SEK 3,535 million to SEK 48,476 million compared with 30 June 2008

30 October 2008© Vattenfall AB
4Highlights Q1-Q3 2008
Net sales increased11.7 % to SEK 117,679 million (105,310)
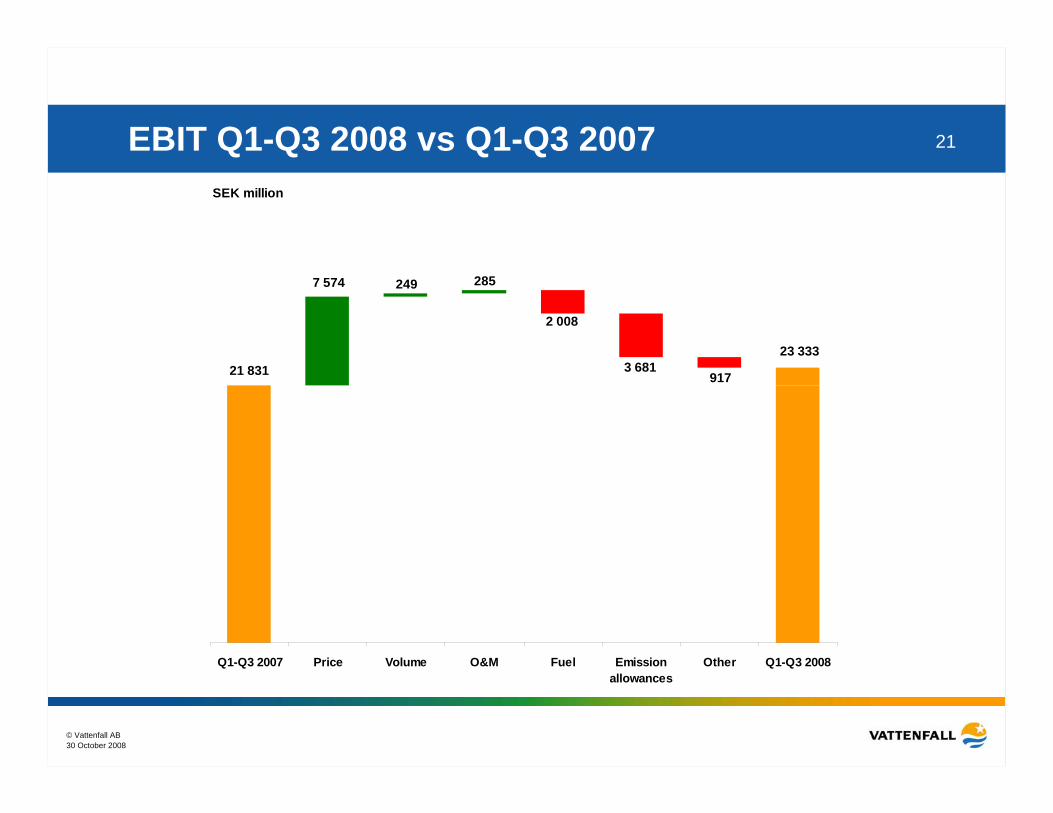
EBIT increased 6.9 % to SEK 23,333 million (21,831)
Profit after tax decreased17.4 % to SEK 13,708 million (17,010)
Net debt increased by SEK 4,736 million to SEK 48,476 million compared with 31 December 2007

30 October 2008© Vattenfall AB
5
Return on Net Assetswas 16.0% LTM (FY 2007: 16.6%)- target is 11%.
Return on Equitywas 14.0 % LTM (FY 2007: 17.6%)- long-term target 15%.
Highlights Q3 2008
LTM = last twelve months
30 October 2008© Vattenfall AB
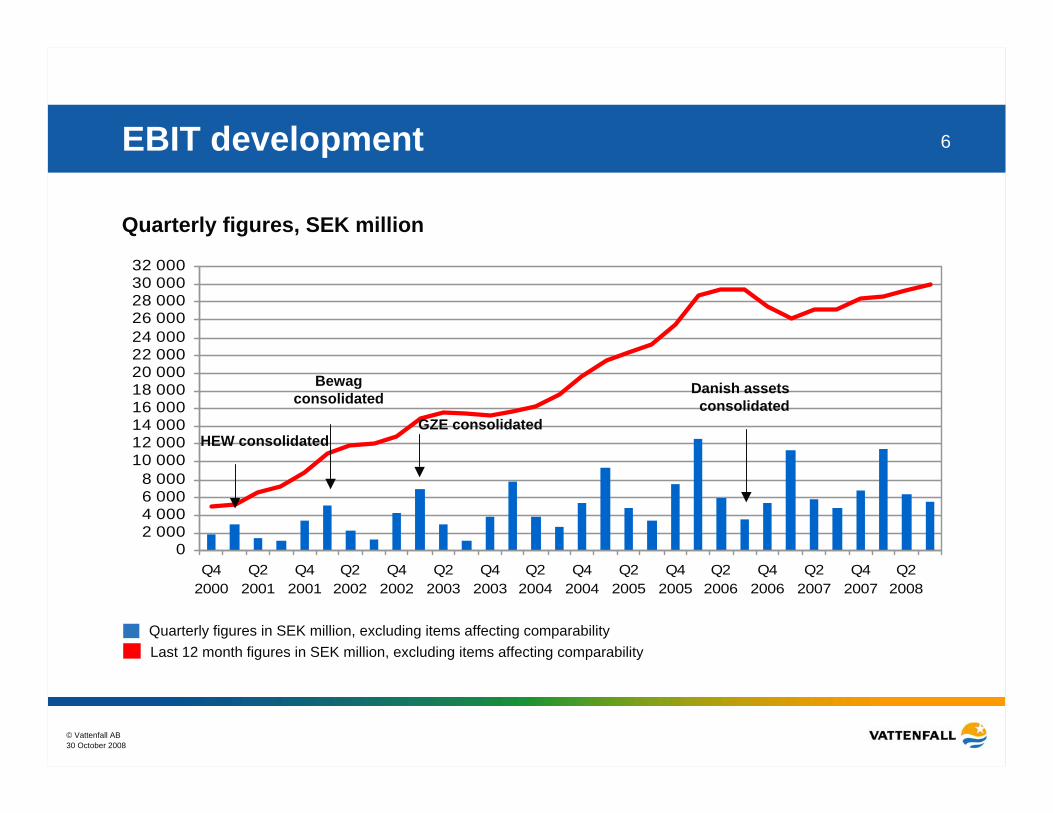
6EBIT development
Quarterly figures, SEK million
Quarterly figures in SEK million, excluding items affecting comparabilityLast 12 month figures in SEK million, excluding items affecting comparability
02 0004 0006 0008 000
10 00012 00014 00016 00018 00020 00022 00024 00026 00028 00030 00032 000
Q42000
Q22001
Q42001
Q22002
Q42002
Q22003
Q42003
Q22004
Q42004
Q22005
Q42005
Q22006
Q42006
Q22007
Q42007
Q22008
HEW consolidated
Bewagconsolidated
GZE consolidated
Danish assets consolidated
30 October 2008© Vattenfall AB
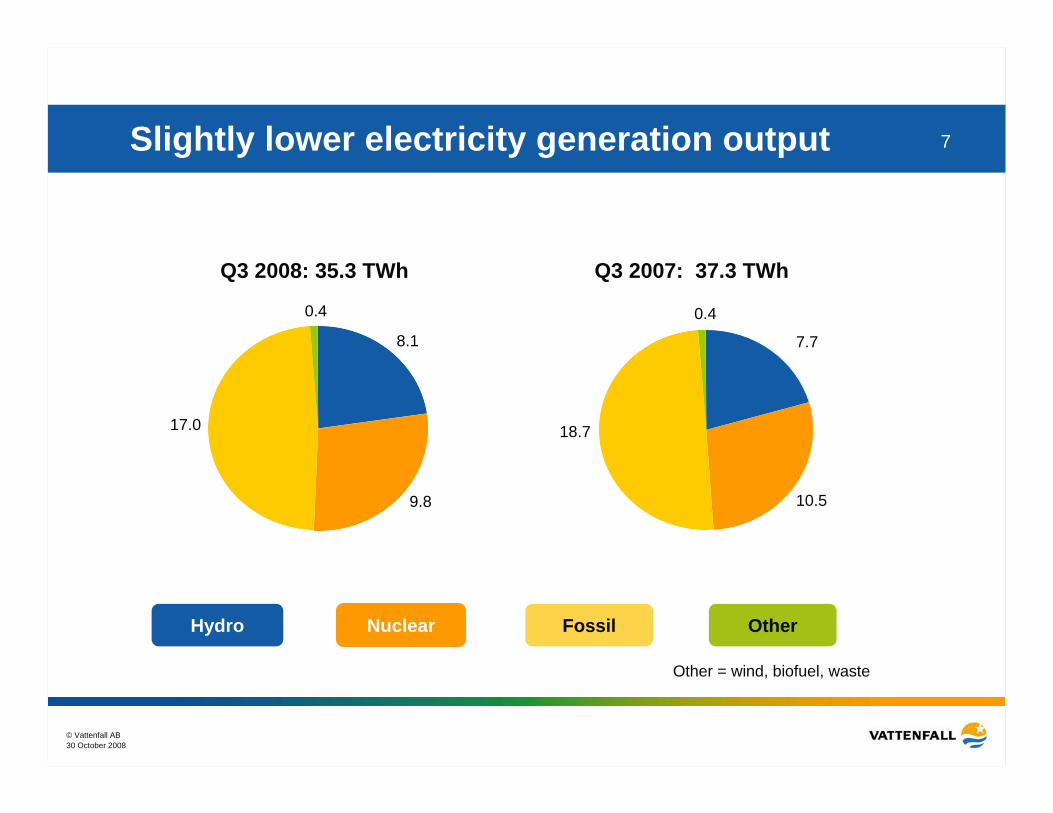
7Slightly lower electricity generation output
Q3 2007: 37.3 TWhQ3 2008: 35.3 TWh
Nuclear FossilHydro Other
Other = wind, biofuel, waste
8.1
9.8
17.0
0.4
7.7
10.5
18.7
0.4

30 October 2008© Vattenfall AB
8
Q3 2008: 3.6 TWh Q3 2007: 3.8 TWh
Central EuropeNordic
1.0
2.6
1.2
2.6
Virtually unchanged heat sales
30 October 2008© Vattenfall AB
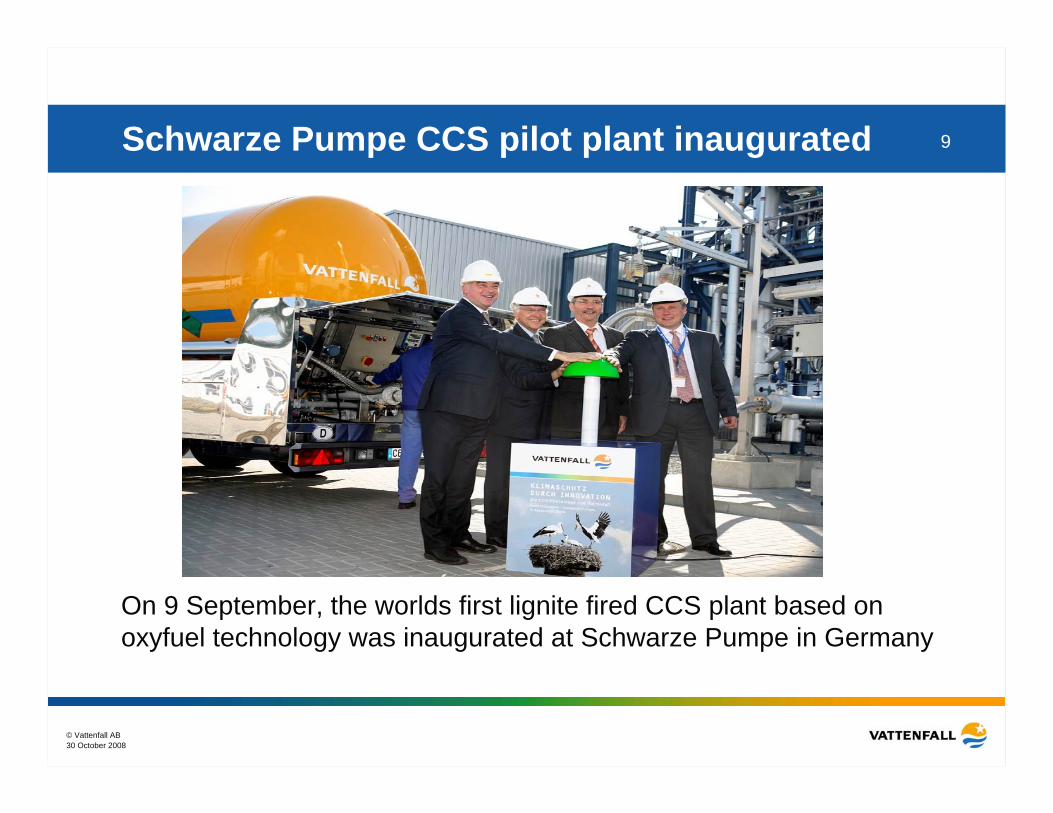
9Schwarze Pumpe CCS pilot plant inaugurated
On 9 September, the worlds first lignite fired CCS plant based onoxyfuel technology was inaugurated at Schwarze Pumpe in Germany

30 October 2008© Vattenfall AB
10Nuclear update - Germany• The two German nuclear power plants are still off-line due to technical problems
detected during the inspection and testing programmes:– Cracks in valves– Impermissibly mounted dowels– Refurbishment of steel-platforms
• The plants will remain shut down until all necessary renovation work is fully completed. Re-start date is still open.
• Financial impact (EBIT):Q3 2008: EUR -120 million (SEK -1,143 million).Q1-Q3 2008: EUR -404 million (SEK -3,817 million)
Krümmel (1,346 MW) Brunsbüttel (771 MW)
30 October 2008© Vattenfall AB
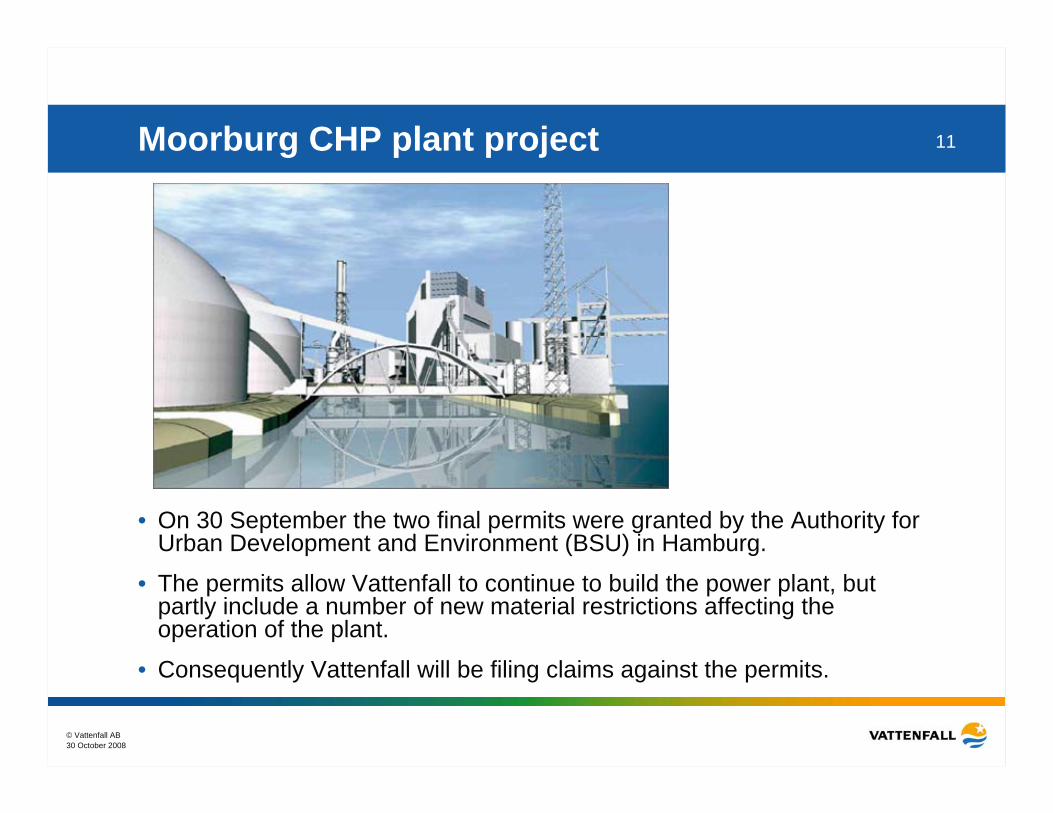
11Moorburg CHP plant project
• On 30 September the two final permits were granted by the Authority for Urban Development and Environment (BSU) in Hamburg.
• The permits allow Vattenfall to continue to build the power plant, but partly include a number of new material restrictions affecting the operation of the plant.
• Consequently Vattenfall will be filing claims against the permits.
30 October 2008© Vattenfall AB
12Potential sale of Transmission operations
• End of July Vattenfall approached potential investors for the possible sale of our German Transmission operations(Vattenfall Europe Transmission GmbH)
• Indicative bids received in October – high level of interest
• Important criteria to be applied on investors
Investors must:• have a long-term focus• ensure substantial investments in network extension• grant continued free grid access for all power producers• promote the flow of electricity across European borders
• No decision made yet

30 October 2008© Vattenfall AB
13Vattenfall development in the UKInvestment highlights
• AMEC Wind – now Vattenfall Wind Power Ltd
23 employees with complete wind power development experience/resources
Total pipeline over 1 000 MW incl. extensions
Acquired for £ 126.7 million
• Eclipse Energy UK PLC – Offer document posted on Oct 10, 2008
8 employees with significant wind power development experience
Total pipeline 300 MW, of which 150 MW are fully consented offshore
Offer made at an implied equity value of £ 51.5 million
• Continued effort to secure 3 000 MW target for UK Round III
* - AMEC Wind portfolio in combination with Eclipse Energy UK PLC (Offer currently on-going) – Ormonde wind, Ormonde gas and Gwynt yr Hafan are owned by Eclipse
UK pipeline*
Aultmore, 30MW
Edinbane, 30MWUnder construction
Aberdeen Bay, 86MW
Clashindarroch, 41MW
Kyle, 255MW
Lewis, 162MW
Logiealmond, 32MWMinch Moor, 28MW
Ray, 48MW
Whitton, 23MW
Total pipeline of ~1 000 MW + 360 MW (extensions)
Ormonde wind, 150MW
Ormonde gas, 90MW
Gwynt yr Hafan, 60MW Kentish
Flats, 90MW
30 October 2008© Vattenfall AB
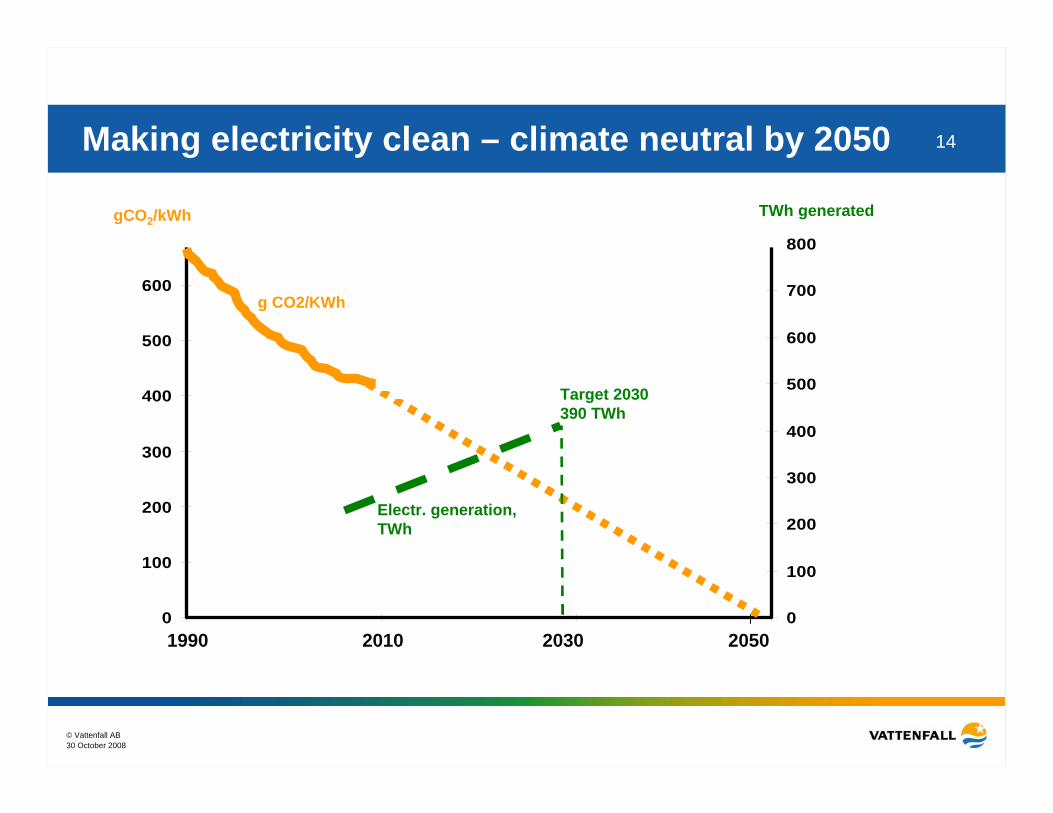
14Making electricity clean – climate neutral by 2050
TWh generated
0
100
200
300
400
500
600
1 2 30
100
200
300
400
500
600
700
800
1990 205020302010
Target 2030390 TWh
gCO2/kWh
g CO2/KWh
Electr. generation,TWh

© Vattenfall AB
Financials
Dag Andresen, CFO
30 October 2008© Vattenfall AB
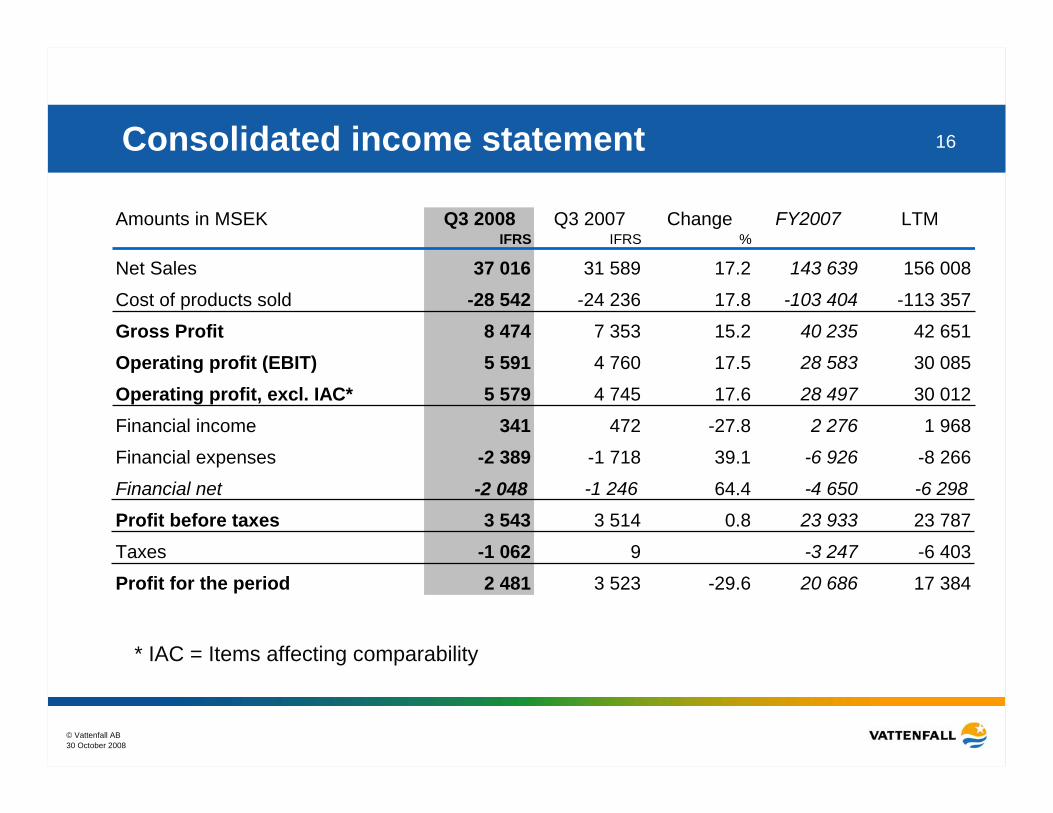
16Consolidated income statement
Amounts in MSEK Q3 2008 Q3 2007 Change FY2007 LTMIFRS IFRS %
Net Sales 37 016 31 589 17.2 143 639 156 008
Cost of products sold -28 542 -24 236 17.8 -103 404 -113 357
Gross Profit 8 474 7 353 15.2 40 235 42 651
Operating profit (EBIT) 5 591 4 760 17.5 28 583 30 085
Operating profit, excl. IAC* 5 579 4 745 17.6 28 497 30 012
Financial income 341 472 -27.8 2 276 1 968
Financial expenses -2 389 -1 718 39.1 -6 926 -8 266
Financial net -2 048 -1 246 64.4 -4 650 -6 298
Profit before taxes 3 543 3 514 0.8 23 933 23 787
Taxes -1 062 9 -3 247 -6 403
Profit for the period 2 481 3 523 -29.6 20 686 17 384
* IAC = Items affecting comparability
30 October 2008© Vattenfall AB
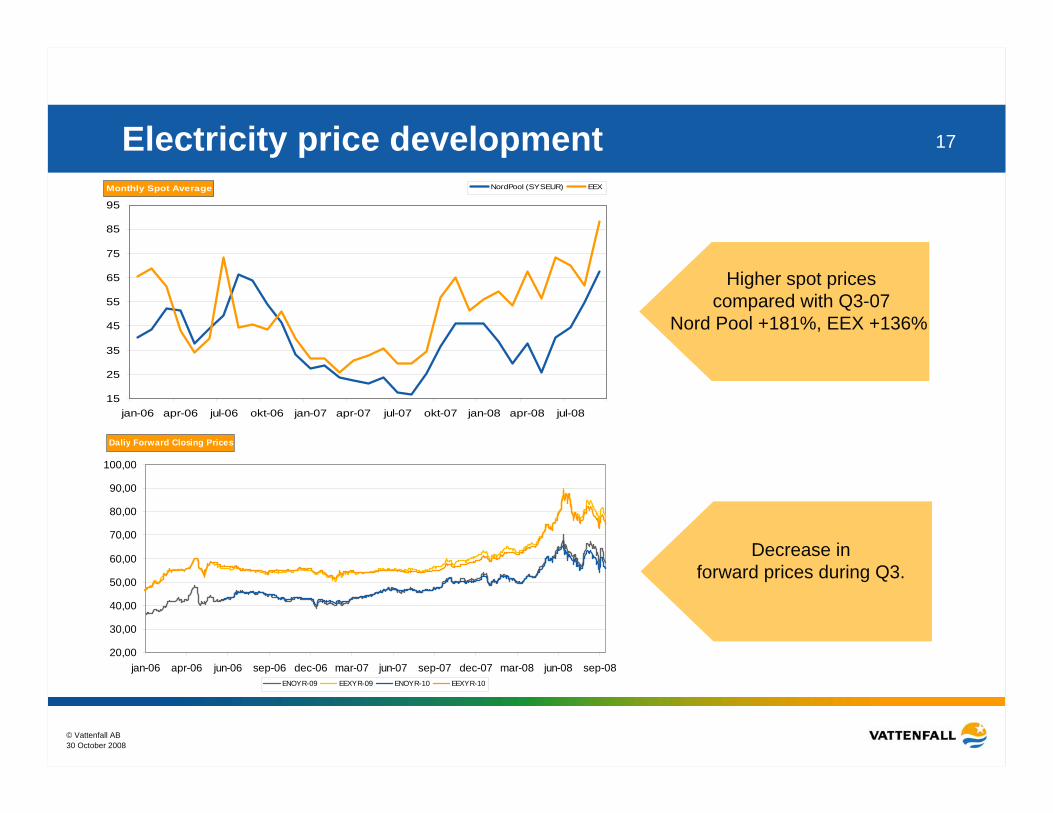
17Electricity price development
Higher spot pricescompared with Q3-07
Nord Pool +181%, EEX +136%
Decrease in forward prices during Q3.
Monthly Spot Average
15
25
35
45
55
65
75
85
95
jan-06 apr-06 jul-06 okt-06 jan-07 apr-07 jul-07 okt-07 jan-08 apr-08 jul-08
NordPool (SYSEUR) EEX
Daliy Forward Closing Prices
20,00
30,00
40,00
50,00
60,00
70,00
80,00
90,00
100,00
jan-06 apr-06 jun-06 sep-06 dec-06 mar-07 jun-07 sep-07 dec-07 mar-08 jun-08 sep-08ENOYR-09 EEXYR-09 ENOYR-10 EEXYR-10

30 October 2008© Vattenfall AB
18Oil, coal, gas and CO2 allowances
0
50
100
150
200
250
jan-
06
apr-0
6
jul-0
6
okt-0
6
jan-
07
apr-0
7
jul-0
7
okt-0
7
jan-
08
apr-0
8
jul-0
8
0
10
20
30
40
50
60
70
80
Oil (USD/bbl), Brent Front Month Coal (USD/t), API#2, Front Year Emission allowances CO2 (EUR/t), 2009 Gas (EUR/MWh), NBP, Front Year
USD EUR
30 October 2008© Vattenfall AB
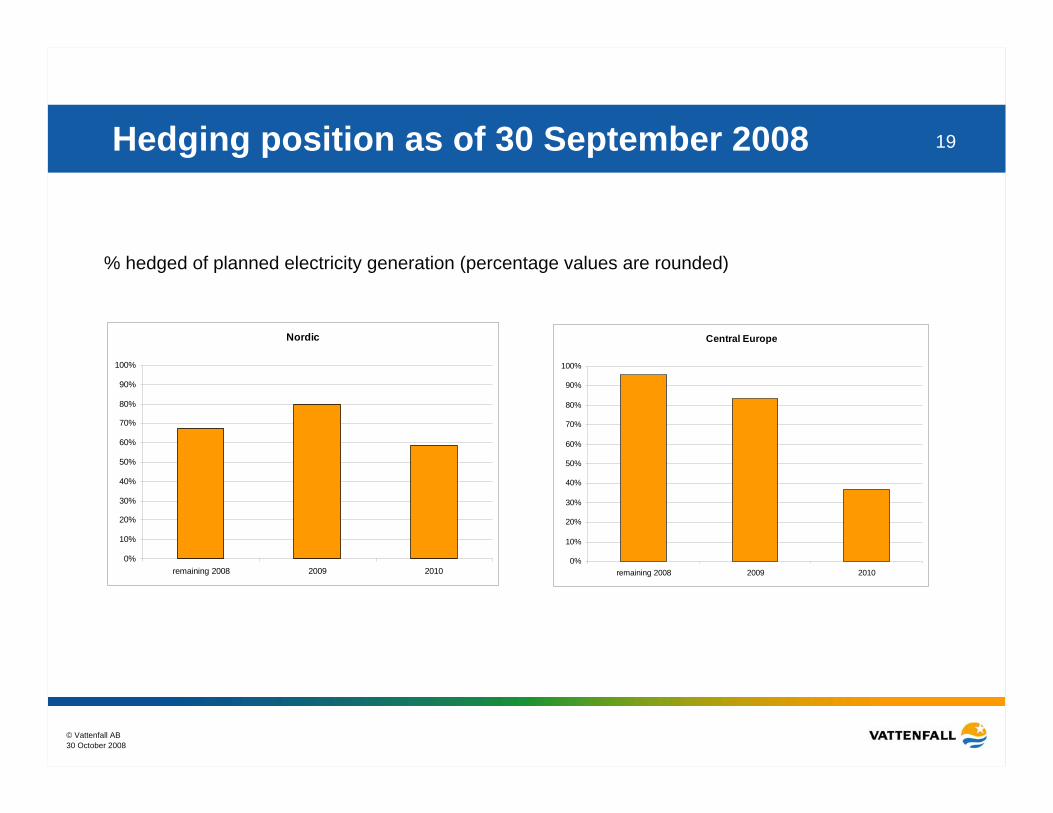
19Hedging position as of 30 September 2008
% hedged of planned electricity generation (percentage values are rounded)
Nordic
0%
10%
20%
30%
40%
50%
60%
70%
80%
90%
100%
remaining 2008 2009 2010
Central Europe
0%
10%
20%
30%
40%
50%
60%
70%
80%
90%
100%
remaining 2008 2009 2010

30 October 2008© Vattenfall AB
20EBIT Q3 2008 vs Q3 2007
rights
4 760
688473
1 199
225160
2 629
5 591
Q3 2007 Price Volume O&M Fuel Emissionallowances
Other Q3 2008
SEK million
30 October 2008© Vattenfall AB
21EBIT Q1-Q3 2008 vs Q1-Q3 2007
21 831 3 681
2 008
285249
917
7 574
23 333
Q1-Q3 2007 Price Volume O&M Fuel Emissionallowances
Other Q1-Q3 2008
SEK million

30 October 2008© Vattenfall AB
22EBIT Q3 2008 vs Q3 2007 – secondary segments
5 591
4 760256
18
446147512
Q3 2007 Generation Heat Networks Markets Other Q3 2008
SEK million

30 October 2008© Vattenfall AB
23EBIT Q1-Q3 -08 vs Q1-Q3 -07 – secondary segments
21 83123 333989 431
917
459 375
Q1-Q3 2007 Generation Heat Networks Markets Other Q1-Q3 2008
SEK million

30 October 2008© Vattenfall AB
24Cash flow development
1) Figures according to Sw GAAP until Q4 2004 and according to IFRS from Q1 2005
-40 000
-30 000
-20 000
-10 000
0
10 000
20 000
30 000
Q4
Q1
Q2
Q3
Q4
Q1
Q2
Q3
Q4
Q1
Q2
Q3
Q4
Q1
Q2
Q3
Q4
Q1
Q2
Q3
Q4
Q1
Q2
Q3
Q4
Q1
Q2
Q3
Q4
Q1
Q2
Q3
Q4
Q1
Q2
Q3
-99 2000 2001 2002 2003 2004 2005 2006 2007 -08
Quarter/Year
MSE
K
Free cash flow from operations - Rolling 4 quarter (1)Cash flow before financing activities - Rolling 4 quarter

30 October 2008© Vattenfall AB
25Increased capex in Q3 2008
Total SEK 6.3 billion Maintenance / Growth, %By Business Group, %
0.2
1.9
4.2
Electr and Heat Networks Other
2,6; 41%3,7; 59%
41%59%
Centr Europe Nordic
4,7; 75%
1,6; 25%
75%
25%
Maintenance Growth

30 October 2008© Vattenfall AB
26Break down of group liquidity and credit lines
SEK million30 Sept. 2008
Treasury Germany Poland Nordic Total %
Cash and bank 2,577 784 365 917 4,643 17
Cash equivalents and short term investments 11,846 10,689 74 626 23,235 83
Total 14,423 11,473 439 1,543 27,878 1) Of which CSA, Credit support Annex (Margin calls); 2,536 million2) Available cash amounts to 18,337 million
13,764Total undrawn100SEK 100 millionOverdraft facility (Dec. 2009)
3,904EUR 400 millionBilateral (April 2009) 9,760EUR 1,000 millionRCF (Febr. 2013)
Committed credit facilities
1)
2)

30 October 2008© Vattenfall AB
27Net debt development
SEK million
Capital Securities SEK 9.3 billion
Acquisition of Elsam shares
0
10000
20000
30000
40000
50000
60000
70000
80000
90000
Q4 2000
Q2 2001
Q4 2001
Q2 2002
Q4 2002
Q2 2003
Q4 2003
Q2 2004
Q4 2004
Q2 2005
Q4 2005
Q2 2006
Q4 2006
Q2 2007
Q4 2007
Q2 2008
Dividend paid
Acquisition of Bewag and GZE
shares

30 October 2008© Vattenfall AB
28Vattenfall debt maturity profile
Sept 30, 2008 Sept 30, 2007Duration (years) 3.1 1) 3,7 Average time to maturity (years) 6.4 1) 6,5Net debt (SEK bn) 48.511.. 44,5
SEK million
Excluding loans from associated companies and minority owners
1) Based on external debt. Excluding Capital Securities the duration is 2,5 years and average time to maturity 6,4 years.
Capital Securities
0
2000
4000
6000
8000
10000
12000
14000
2007 2009 2011 2013 2015 2017 2019 2021 2023 2025 2027 2029 2031 2033 2035 2037
2008 09 30
30 October 2008© Vattenfall AB
29Financials - summary and conclusions
• Strong Q3 results– Vattenfall’s best ever Q3 EBIT
• The financial turbulence has not affected Vattenfall’s results
• Vattenfall has a strong liquidity position and no immediate debt refinancing needs
• Well defined financial risk management policies
• Prudent hedging strategy
• Our geographical diversification and generation mix is a key strength
30 October 2008© Vattenfall AB
30
Questions and Answers
© Vattenfall AB
Back-up slides

30 October 2008© Vattenfall AB
32Financial targets and outcome
Q3 2008
Single A category ratingCredit Rating
3.5 – 4.5 timesCash flow interest coverage after maintenance investments
11 % before tax (= 15 % RoE recalculated into the Groups RoNA requirement)
Return on Net Assets(RoNA, excl. IAC)
Return on Equity (RoE)
TargetsKey Ratio
15 % on average equity 14.0%*
16.0%*
4.6*
A2/A-Stable outlook
40-60 %Dividend pay-out 40.5 %
*Q3 2008 figure = LTM
30 October 2008© Vattenfall AB
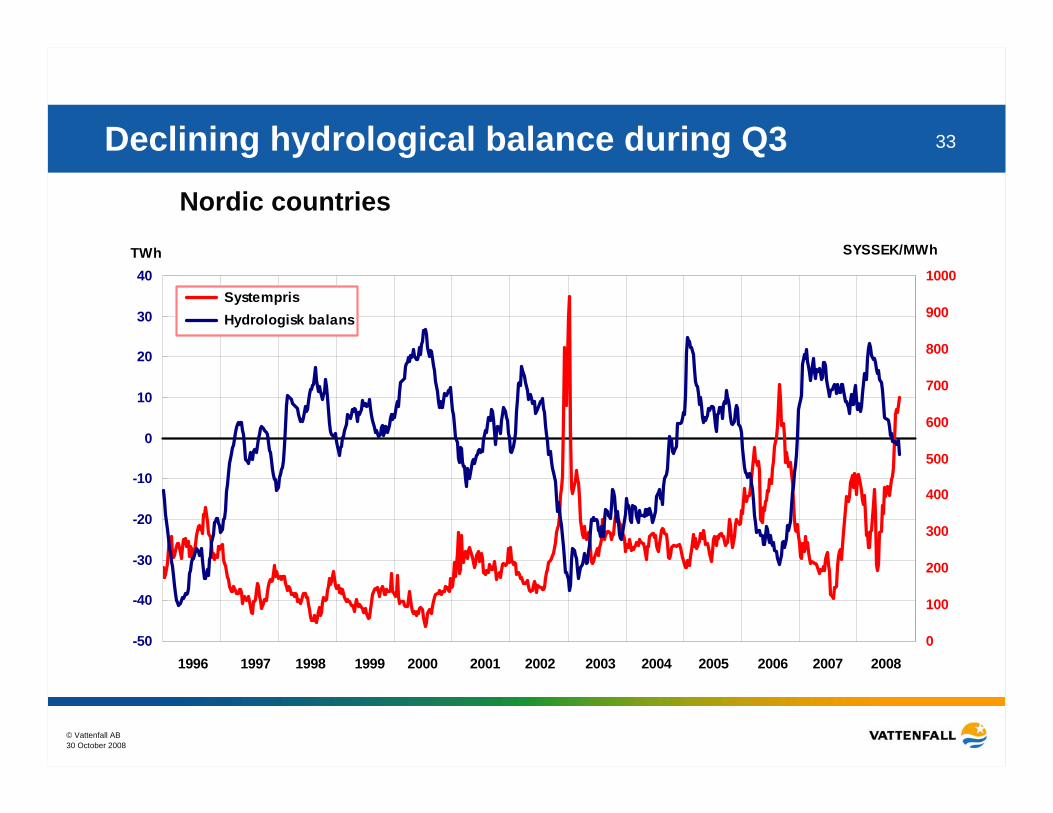
33Declining hydrological balance during Q3
-50
-40
-30
-20
-10
0
10
20
30
40
0
100
200
300
400
500
600
700
800
900
1000 Systempris Hydrologisk balans
SYSSEK/MWhTWh
1996 199919981997 2003200220012000 2004 2005 2006 2007 2008
Nordic countries
30 October 2008© Vattenfall AB
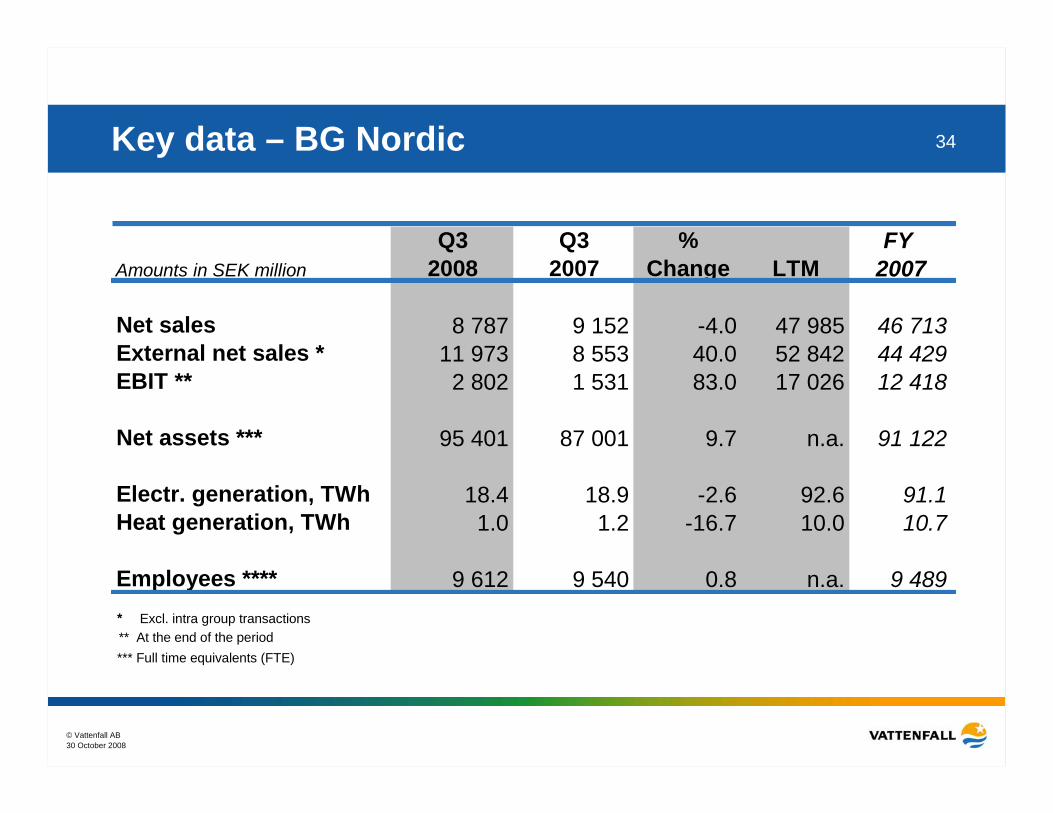
34Key data – BG Nordic
* Excl. intra group transactions** At the end of the period*** Full time equivalents (FTE)
Q3 Q3 % FY Amounts in SEK million 2008 2007 Change LTM 2007
Net sales 8 787 9 152 -4.0 47 985 46 713External net sales * 11 973 8 553 40.0 52 842 44 429EBIT ** 2 802 1 531 83.0 17 026 12 418
Net assets *** 95 401 87 001 9.7 n.a. 91 122
Electr. generation, TWh 18.4 18.9 -2.6 92.6 91.1Heat generation, TWh 1.0 1.2 -16.7 10.0 10.7
Employees **** 9 612 9 540 0.8 n.a. 9 489

30 October 2008© Vattenfall AB
35Key data – BG Central Europe
* Excl. intra group transactions** At the end of the period*** Full time equivalents (FTE)
Q3 Q3 % FY Amounts in SEK million 2008 2007 Change LTM 2007
Net sales 32 544 27 912 16.6 134 379 122 256External net sales * 22 796 19 803 15.1 94 500 86 736EBIT ** 2 847 3 460 -17.7 14 366 16 517
Net assets *** 82 158 77 386 6.2 n.a. 78 714
Electr. generation, TWh 16.9 18.4 -8.2 73.6 76.6Heat generation, TWh 2.6 2.6 0.0 26.2 25.5
Employees **** 22 544 22 478 0.3 n.a. 22 396
30 October 2008© Vattenfall AB
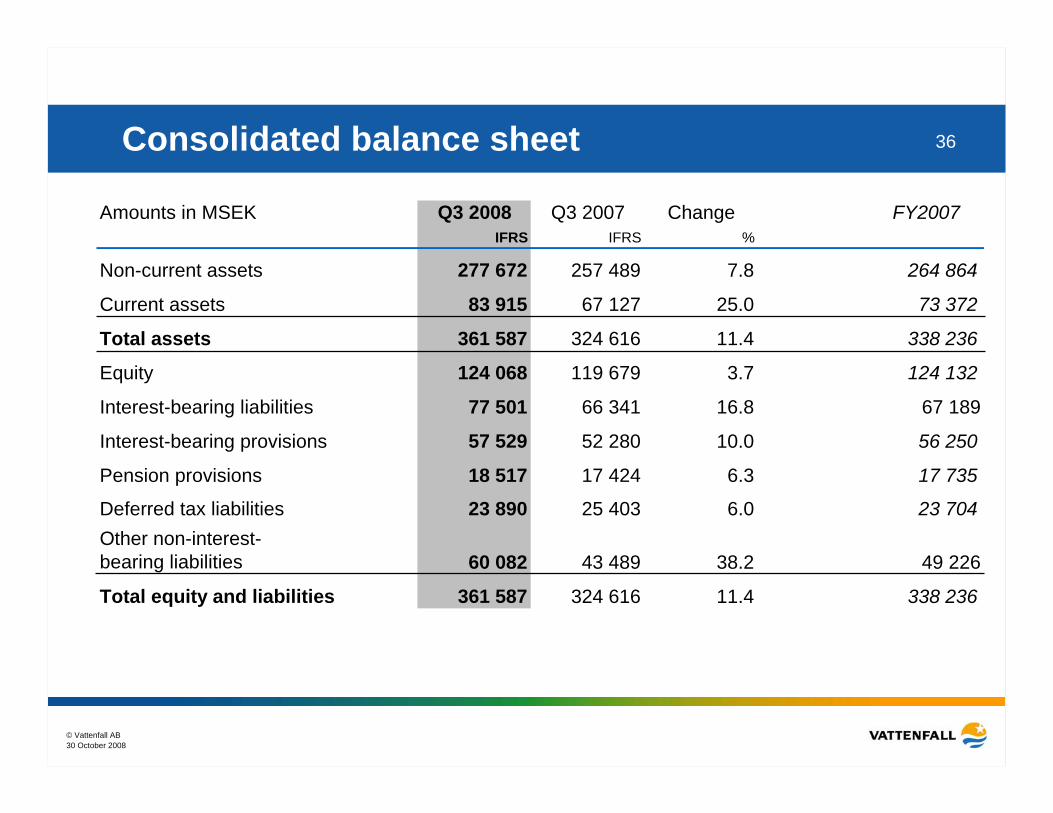
36Consolidated balance sheet
Amounts in MSEK Q3 2008 Q3 2007 Change FY2007IFRS IFRS %
Non-current assets 277 672 257 489 7.8 264 864
Current assets 83 915 67 127 25.0 73 372
Total assets 361 587 324 616 11.4 338 236
Equity 124 068 119 679 3.7 124 132
Interest-bearing liabilities 77 501 66 341 16.8 67 189
Interest-bearing provisions 57 529 52 280 10.0 56 250
Pension provisions 18 517 17 424 6.3 17 735
Deferred tax liabilities 23 890 25 403 6.0 23 704Other non-interest-bearing liabilities 60 082 43 489 38.2 49 226
Total equity and liabilities 361 587 324 616 11.4 338 236

30 October 2008© Vattenfall AB
37
0
20000
40000
60000
80000
100000
120000
140000
160000
180000
200000
Q4 2000
Q2 2001
Q4 2001
Q2 2002
Q4 2002
Q2 2003
Q4 2003
Q2 2004
Q4 2004
Q2 2005
Q4 2005
Q2 2006
Q4 2006
Q2 2007
Q4 2007
Q2 2008
Net asset development
SEK millionAcquisitionof Elsamshares
Acquisitionof Bewagand GZE shares
Consolidationof Danish
assets

30 October 2008© Vattenfall AB
38Consolidated cash flow statementAmounts in MSEK Q3 2008 Q3 2007 Change FY2007 LTM
IFRS IFRS %
Funds from operations (FFO) 8 687 6 002 44.7 34 049 30 758Change in working capital 3 526 261 1251.0 -1 718 6 260Cash Flow fromoperating activities 12 213 6 263 95.0 32 331 37 018Investments -6 312 -4 310 46.5 -18 964 -30 865Divestments 84 239 -64.9 925 833Cash and cash equivalentsin aquired/divested companies 4 2 100.0 2 11Cash Flow from investing activities -6 224 -4 069 53.0 -18 037 -30 021Cash Flow beforefinancing activities 5 989 2 194 173.0 14 294 6 997Cash Flow from financing activities -4 548 -8 259 -44.9 -18 662 938Cash Flow for the period 1 441 -6 065 123.8 -4 368 7 935Net debt at the end of the period -48 476 -44 524 8.9 -43 740 -48 476

30 October 2008© Vattenfall AB
39Return on equity
Group - Return on EquityNine months interim accounts - 2008
0%
5%
10%
15%
20%
25%
30%
1992
1993
1994
1995
1996
1997
1998
1999
2000
2001
2002
2003
2004
2005
2006
2007
Period
Rolling 4-quarterIFRS excl IAC
Rolling 4-quarter SwGAAP excl IAC
Average 4-years (16quarter) Sw. GAAP.IFRS from Q42004. Excl. IACRequirement 15%
30 October 2008© Vattenfall AB
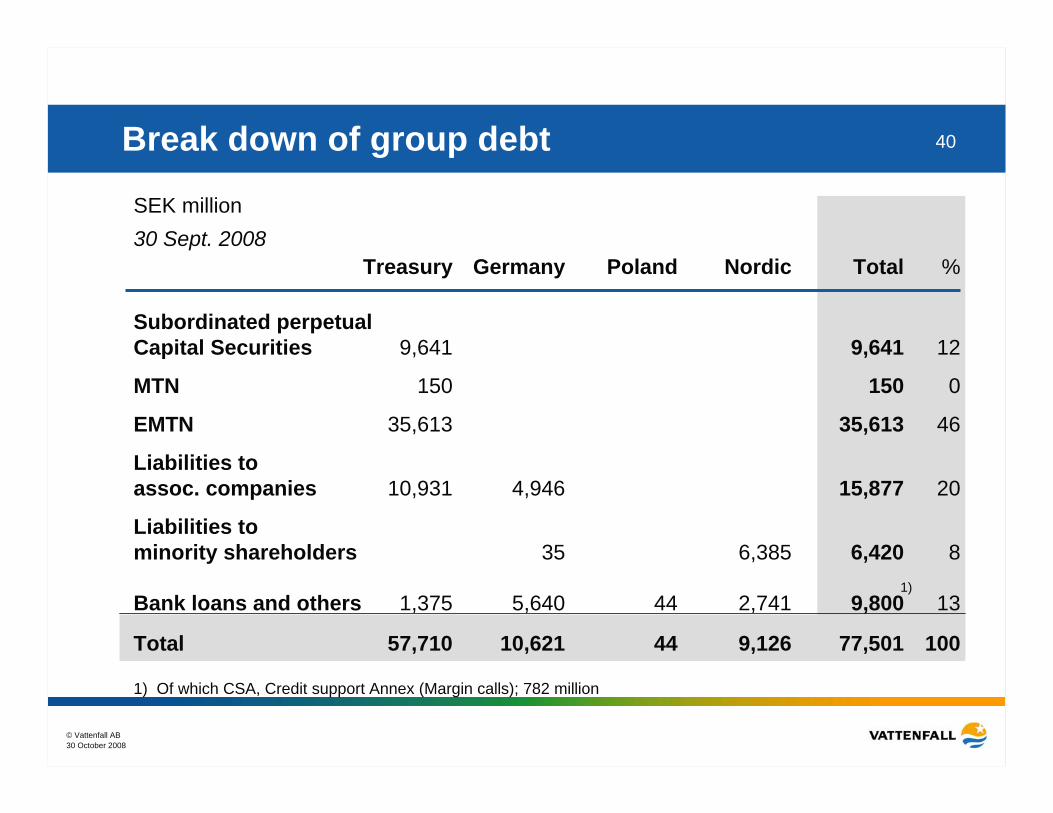
40
SEK million30 Sept. 2008
Treasury Germany Poland Nordic Total %
Subordinated perpetual Capital Securities 9,641 9,641 12
MTN 150 150 0
EMTN 35,613 35,613 46
Liabilities to assoc. companies 10,931 4,946 15,877 20
Liabilities to minority shareholders 35 6,385 6,420 8
Bank loans and others 1,375 5,640 44 2,741 9,800 13
Total 57,710 10,621 44 9,126 77,501 100
1) Of which CSA, Credit support Annex (Margin calls); 782 million
Break down of group debt
1)

30 October 2008© Vattenfall AB
41Adjusted gross and net debt30 Sept 2008 31 Dec 2007SEK million
-75 662-82 967= Adjusted net debt15 90420 873
= Adjusted cash, cash equivalents & short terminvestments
-3 531-3 682Minority owner´s share of German nuclear subsidiaries cash position
-3 224-3 323German nuclear "Solidarvereinbarung"
22 65927 878Reported cash, cash equivalents & short term investments -91 566-103 840= Adjusted gross debt
4 6714 82050% of Capital securities (hybrid capital)-11 975-12 524Mining & environmental provisions-17 073-18 635
Present value of net pension obligations (incl. actuarial gains/losses)
-67 189-77 501Reported gross debt
1) Of which CSA, Credit Support Annex (Margin calls) 783 million
2) Of which CSA, Credit Support Annex (Margin calls) 2,536 million
1)
2)

30 October 2008© Vattenfall AB
42Group provisions (IFRS)
30 September 2008
SEK 99,936 million30 September 2007
SEK 95,107 million
18517
30488
12525
23890
2544
47647208
PensionsNuclearMiningTaxesOtherPersonnelLegal
17424
28140
11308
25403
1476
43547002
30 October 2008© Vattenfall AB
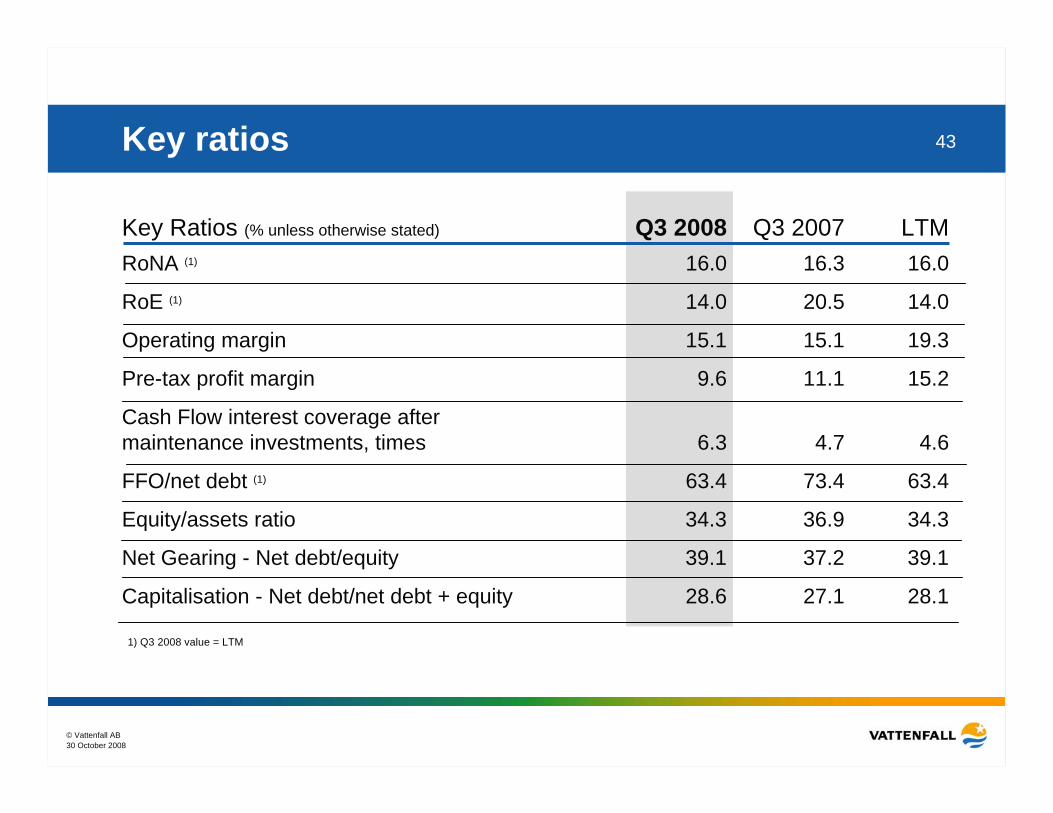
43Key ratios
Key Ratios (% unless otherwise stated) Q3 2008 Q3 2007 LTMRoNA (1) 16.0 16.3 16.0
RoE (1) 14.0 20.5 14.0
Operating margin 15.1 15.1 19.3
Pre-tax profit margin 9.6 11.1 15.2
Cash Flow interest coverage aftermaintenance investments, times 6.3 4.7 4.6
FFO/net debt (1) 63.4 73.4 63.4
Equity/assets ratio 34.3 36.9 34.3
Net Gearing - Net debt/equity 39.1 37.2 39.1
Capitalisation - Net debt/net debt + equity 28.6 27.1 28.1
1) Q3 2008 value = LTM