Embed Size (px)
Citation preview

VARI-ROTM DESALTING PILOT PLANTTESTING AND EVALUATION
FINAL TECHNICAL REPORT
Science Applications International Corporation16701 West Bernard0 Drive
San Diego, CA 92127
bYWillard D. Childs, P. E. (VPC)
Ali E. Dabiri, Ph. D. (SAIC)
Assistance Agreement No. 14255-FC-Sl-20410
Water Treatment Technology Program Report No. 30
May 1998
U. S. DEPARTMENT OF THE INTERIORBureau of Reclamation
Technical Service CenterWater Treatment Engineering & Research Group

REPORT DOCUMENTATION PAGE I OM~~P6~&%8ak&c rapor6p buQn fw this dl&tim of inform8tion is ednated to average 1 how per resp0nse. indting the time for reviewi~ instwcfions, searching axidng data sources, @wing 111kahthhg the data needed, md oompling and mvimving the cdlsccion of idwmafion. Send~qgdmafwre&&qthisbwdenmWa#hingionHeadquatas
~repardinethisbudsn~mimsta~~~~ofthisodleetiarofinformstiorSUvicaS. Dirkmats for InfmMbon Dpsr8tion~ md Re+wts. 1215 Jafferson Davis Highway. Suit 1204. Arfingta
A 222024302, ad to tha Dffies of Mv and 8ud@t. Paperwork Raduclion Rapm (0704-0188), WashiwQm DC 20503.
_ AGENCY USE ONLY &mve 6hnk) 2. REPORT DATE 3. REPORT TYPE AND DATES COVERED
May 1!998 F i i‘. TITLE AND SUBTITLE 5. FUNDING NUMBERS
VARI-ROm DESALTING PILOT PLANT TESTING AND EVALUATION -FINAL TECHNICAL REPORT Assistance Agreemem No.
14255-FC-81-204108. AUTHOR(SI
Willard D. Childs, P.E. (VPC)Ali E. Dabiri, Ph.D. (SAIC)
, FERFORMING ORGANI2ATlON NAME(S) AND ADDRESHESI
Science Applications International Corporation16701 West Ikrnardo DriveSanDiego, CA 92127
8. PERFORMING ORGANUZATIONREPORT NUMBER
I. SPONSORlNGIMONlTORING AGENCY NAME(S) AND ADDRESS
Bureau of ReclamationDenver Federal CenterP.O. Box 25007Denver,CO 802254007
10. SFONSORlNG/MONlTORlNGAGENCY MPORT NUMBER
Water Treatment TechnologyProgram Report No. 30
1. SUPPLEMENTARY NOTES
2a. DISTRlBUTION/AVAIlABllJlY STATEMENT
Available from the National Technical Information Service, Operations Division,5285 Port Royal Road, Springfield, Virginia 22161
12b. DlSTWBUTlON CODE
:3. A68TRACT fMadmm 266 words)
The VARI-RO technology (Patent Pending) reduces the cost of desalting, primarily by reducing the energy consumption. It ian integmted pumping and energy recovery system for reverse osmosis desalination of seawater (SWRO) and brackish water(EWRO). The pilot plant project has validated that this technology can reduce energy consumption by 20 to 50 percent asampared to conventional methods that are pmently available. In addition, it has been shown that the technology provides otheoperational benefits for startup, shutdown, and optimimtion of operation. This capability makes it especially suitable for hi@capacity applicati~. By rrdwing energy consum@on, this technology helps to make desalting cost effective as a viable methoto augment natural water sources, and to mitigate water shortages in many locations in the U.S. and other regions of the world
This technology advancement has resulted from the cross-fertilization of modern hydraulic power transmission and controltechnologies with desalting technologies.
14. SUBJECT TERMS- -
desalting/pumpiug/pilot plant/energy recovery/reverse osmosis/variable flow/low pulsation/water tmatmentfhydraulic drive
15. NUMBER OF PAGES
5 816. PRICE CODE
17. ~FCXIRURtXASSlflCATION 18. SECURlTY ClASSIFlCATlON 19. ~$W&fC~SSlFlCATlDN 20. LlMlTATlON OF ABSTRAClOF THlS PAGE
UL UL UL UL
NSN 754001-280-5506

VARI-ROm DESALTING PILOT PLANTTESTING AND EVALUATION
FINAL TECHNICAL REPORT
Science Applications International Corporation16701 West Bernard0 Drive
San Diego, CA 92127
bYWillard D. Childs, P. E. (VPC)
Ali E. Dabiri, Ph. D. (SAIC)
Assistance Agreement No. 1425-5-FC-81-20410
Water Treatment Technology Program Report No. 30
May 1998
U. S. DEPARTMENT OF THE INTERIORBureau of Reclamation
Technical Service CenterWater Treatment Engineering & Research Group
ACKNOWLEDGMENTS
We would like to thank the numerous research organizations, utilities, desaltingconsultants, and equipment suppliers that assisted in the success of this project.These team members are SuJr * d in the introduction of this final technicalreport. Special thanks go to the following individuals for their contributionsduring the design evolution, technical reviews, and system testing: Orrin Albert,Cat-West Machining, Inc.; Kurt Frank, Carol10 Eugineers; Dave Furukawa andFrank Oudkirk, consultants to Electric Power Research Institute; Jack Laughlin,Lmghlin Associates; Paul Laverty, Membrane Systems Corporation; TedKuepper and Mark Silbernagel, Naval Seawater Desalination Laboratory; JackSwerlein, San Diego City; Bob Yamada, San Diego County Water Authority;Skip Fralick and Murry Slater, San Diego Gas & Electric; Bart Bartholomew andRon Woyski, Shore Western Manufacturing, Inc.; Dan Paviolo, Parker Han&inCorporation; Mike May and Bill Weatherholt, Wheatley Gaso, Inc.; and BobLauck, Zemark Corporation.
In addition, we would like to extend our appreciation to the Bureau ofReclamation for their support in the implementation of the pilot plant project.
Bureau of ReclamationMission Statement
The mission of the Bureau of Reclamation is to manage, develop, and protectWaterdrelated resomm in an environmemally and economically sound mannerin the interest of the American public.
U.S. Depamnent of the InteriorMission Statement
As the Nation’s prim&d CODSerVation agency, the Depammt of the Interior hasresponsibility for most of our nationally-owned public lands and naturalresources. This inch&s fostering sound use of our land and water resources;protecting our fish, wildlife, and biological diversity; preserving theeln&mEd and culm values of our national parks and historical places; andproviding for the enjoyment of life through outdoor recmation. The Depattmentassessesourenergyaudminerall and works to ensure that theirdevelopment is in the best interests of all people by encouraging stewardship andcitimn participation in their care. The Department also has a major responsibilityfor American Jndian reservation communities and for people who live in islandterritories under U.S. Administration.
Difdaimer
Idmnalioncontained in tbis report regarding commercial products or fnms wassupplied by those firms. It may not be used for advertising or promotionalpurposessmdisnattobe~~~asanendorsementofanyproductor~bythe Bureau of Reclamation.
The information contained in this report was developed for the Bureau ofReclamation; no warranty as to the accumcy, usefulness, or completeness isexpressed or implied.
CONTENTS
page1. INTRODUCTION .............................................................................................................................. 1
1.1 ProjectDefinitionandTeam.. ..................................................................................................... 11.2 Pilot Plant Objectives and Technical Benefits ............................................................................. 21.3 Specific Water Problem Discussion ............................................................................................ 21.4 Scope of Work and Methodology ................................................................................................ 4
2. CONCLUSIONS AND RECOMMENDATIONS ............................................................................. 53. GENERAL COMPARISON TO CONVENTIONAL PUMPING METHODS .................................. 6
3.1 VARI-ROm System Overview.. ................................................................................................. 63.2 Conventional Systems Overview ................................................................................................ 73.3 Advantages of the VARI-RO System.. ..................................................................................... 123.4 Energy Conservation and Global Warming Benefits................................................................. 13
4. PILOT PLANT PARAMETERS AND CONFIGURATION.. ......................................................... 164.1 Pilot Plant System General Parameter Selection ........................................................................ 164.2 VARI-RO System Sub-assemblies and Configuration.. ............................................................. 16
5 . TESTlNG AND PERFORMANCE RESULTS ............................................................................... 215.1 Test Setup and Methodology .................................................................................................... 215.2 Electronic Control, Diagnostics, Data Acquisition, and Analysis............................................... 215.3 Functional Results .................................................................................................................... 225.4 Performance Results at “Bench Mark” Operating Conditions .................................................... 23
6. PERFORMANCE COMPARISONS TO CONVENTI ONAL METHODS ...................................... 276.1 VARI-RO System, Specific Energy Consumption Equations .................................................... 276.2 Conventional System, Specific Energy Consumption Equations ................................................ 286.3 Performance of Pilot Plant Unit, Actual and Projected ................................................................. 296.4 Performance comparisons for the Santa Barbara Application.. ..................................................... 30
7 . FACILITY OPTIMIZATION WITH THE VARI-RO SYSTEM.. ................................................... 3 17.1 Lower Energy Consumption at Low Recovery Ratio Characteristic ............................................. 32
8 . ECONOMIC ANALYSIS.. ............................................................................................................. 349. CONTINUED TECHNOLOGY DEVELOPMENT RECOMMENDATIONS ................................. 36
9.1 Pilot Plant Unit ......................................................................................................................... 369.2 Demonstration of Full-Scale Capacity Unit.. ............................................................................. 37
10. BIBLIOGRAPHY.. ......................................................................................................................... 38
FIGURES
FIGURE 1-l Prehminary Tampa Region Seawater Desalination Costs ................................................................... 3FIGURE 3-l Total Energy Consumption of Desalting Processes and the SWP.. .................................................... 1 4FIGURE 4-l VARI-RO System Block Diagram.. ................................................................................................. 1 7FIGURE 4-2 VAEU-RO System General Anangement ......................................................................................... 1 8FIGURE 4-3 Pilot Plant, Electronic Control Unit Display.. ................................................................................... 1 9FIGURE 4-4 Pilot Plant, Hydraulic Drive Unit.. ................................................................................................... 1 9FIGURE 4-5 Pilot Plant, Water Displacement Unit .............................................................................................. 20FIGURE 5-l SDG&E Power Meter Calibxalion Check.. ....................................................................................... 24FIGURE 5-2 Performance Change with WDU Improvements .............................................................................. 25FIGURE 6-l VARI-RO System, Diagram and Equations ..................................................................................... 27FIGURE 6-2 Conventional System, Diagram and Equations.. ............................................................................... 28FIGURE 6-3 Pilot Plant Performance Based on Derived Equations ...................................................................... 29FIGURE 6-4 VARI-RO System versus Method used at Santa Barbara.. ................................................................ 30FIGURE 7-1 Lower Specific Energy Consumption at Lower Recovery Ratio ....................................................... 32FIGURE 7-2 VARI-RO System, Lower Energy Use at Lower Recovery Ratios.. ................................................. .33FIGURE 8 - 1 Economic Analysis Comparative Summary.. ................................................................................... 35
APPENDICES
A Test Reporting from Naval Seawater Desalination Laboratory (NFESC) 39B Performance Projections of FILMTEC Membranes at Various Recovery Ratios (DOW) 46C Economic Comparison of VARI-RO vs. Conventional Technology (Laughlin Associates) 49
AFA F YB A RBEPBWROCco2CPMCPCRACT
dpM
iCUE R VFFTVF T RF W VGPDGPHGPMHCHDUl/mkidkpaIwhkgalk&/m3m31cl1 OOOms/d
MEDMGDMSF
NPSHPP CPDP MPDPPPPm
GLOSSARY
acre-foot = 326,000 U. S. gallons (approximately)acre-feet per yearmetric pressure unit = 100 kpa = 14.5 PSI = 0.9869 atmospheresbest-efficiency-pointBrackish Water Reverse Osmosis processConcentrateCarbon DioxideCycles Per Minutecentrifugal PumpColorado River AqueductCentrifugal pump, Turbine, and variable speed drive; reverse osmosispumping and energy recovery system (combined system)delta pressure (pressure drop) MembranesefficiencyElectronic Control UnitEnergy Recovery ValvesFeedFlow Throttle ValvesFinal Technical ReportFeed Water ValvesU. S. Gallons Per DayU. S. Gallons Per HourU. S. Gallons Per MinuteHydraulic CylinderHydraulic Drive Unitliters per minute1000 U. S. gallonskilopascal =kilowatt hours per 1000 U. S. gallonskilowatt hours per cubic metermeters cubed per day1fKKlmeterscubedperdayMetropolitan Water District of Southern CaliforniaMulti-Effect Distillation processMillion U. S. Gallons per DayMulti-Stage Flash distillation processMegawatts of electric powerNet Positive Suction HeadProductpressure, Concentratepressure, Dischargepressure, MembranePositive DisplacementPlunger Pumpparts per million
. . .lu

PSIPSIDPW
LPR OROWPURPMR R
SDCWASDG&E
i;SWPSWP NthX3.hSWROTDSTWCVFDVARI-ROmVROWCWDU
Existing Methods
Base Case
pounds per square inchpounds per square inch differentialPelton Wheel turbinequantity rate = flow rateReverse Flow Pump turbineReverse Osmosis desalting processReverse Osmosis Water Purification UnitRevolutions Per MinuteRecovery Ratio of reverse osmosis process
= Product flow rate / Feed flow rateSan Diego County Water AuthoritySan Diego Gas & Electricspecific energy consumption = kwhkgal or kwh/m3sump PumpingCalifornia State Water ProjectCalifornia State Water Project from Northern to Southern CaliforniaSeawater Reverse Osmosis processTotal Dissolved Solids in parts per millionTotal Water CostVariable Frequency DriveVariable flow pumping and energy recovery technology for ROVARI-RO reverse osmosis pumping and energy recovery systemWater CylinderWater Displacement Unit
DEFINITIONS
= methods presently being used to desalt seawater, includingMSF, MED, and RO. In this report, the existing methodsoften refer to RO desalting systems using conventional highpressure feed water pumping and energy recovery,consisting of: centrifugal pumps, phmger pumps, energyrecovery turbines, and variable frequency drives for electricmotors.
= is a case that is used for comparison.
TRADEMARKS
SAIC is a registered trademark of Science Applications International Corporation. VARI-ROW,VROm, VPCY, and VARI-POWERTM are trademarks of the VARI-POWER Company.
SI Metric ConversionsFrom T o Multi~lv bvft m 3.048OOOE-01in m 2.540 000 E - 02t-P m2 9.290 304 E - 02w m3 3.785 412WM m3 3.785 412 E + 3aCre-fl m3 1.233 489 E + 3lb/in2 kpa 6.894 757lb/in2 B A R 6.894 757 E - 02OF “C pc = (6’~ - 32)/1.8
i v
I. INTRODUCTION
1.1 Project Definition and Team
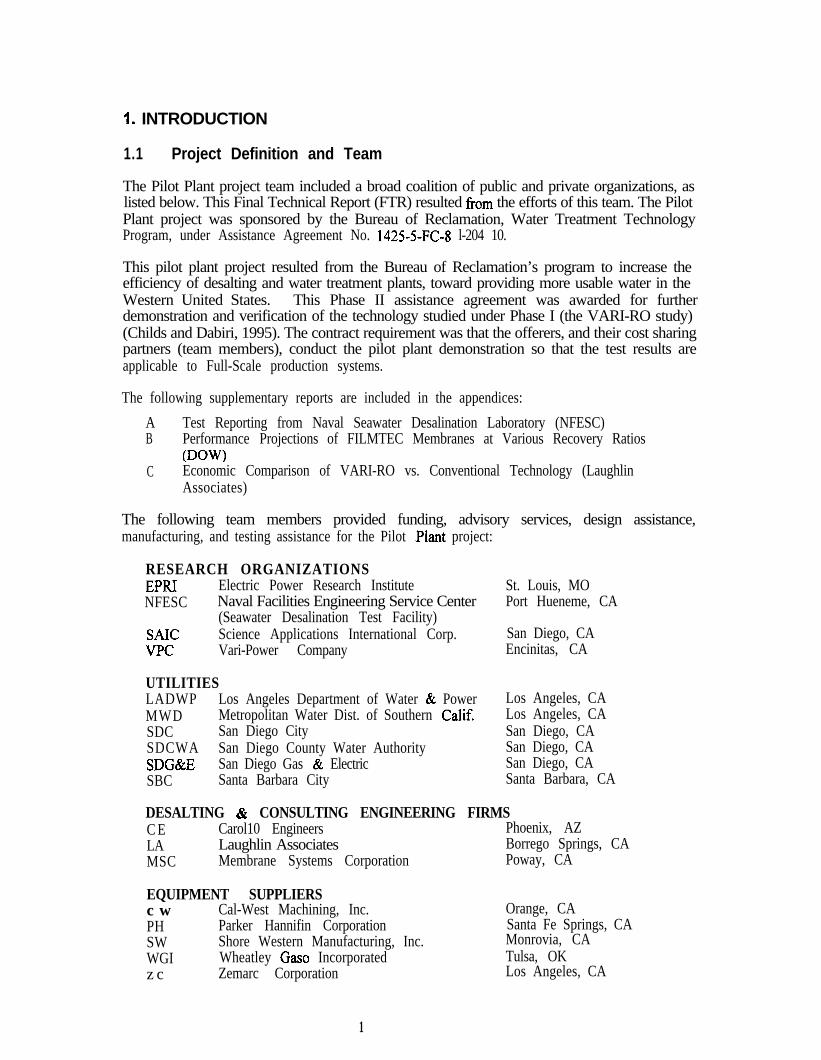
The Pilot Plant project team included a broad coalition of public and private organizations, aslisted below. This Final Technical Report (FTR) resulted from the efforts of this team. The PilotPlant project was sponsored by the Bureau of Reclamation, Water Treatment TechnologyProgram, under Assistance Agreement No. 1425-5-FC-8 l-204 10.
This pilot plant project resulted from the Bureau of Reclamation’s program to increase theefficiency of desalting and water treatment plants, toward providing more usable water in theWestern United States. This Phase II assistance agreement was awarded for furtherdemonstration and verification of the technology studied under Phase I (the VARI-RO study)(Childs and Dabiri, 1995). The contract requirement was that the offerers, and their cost sharingpartners (team members), conduct the pilot plant demonstration so that the test results areapplicable to Full-Scale production systems.
The following supplementary reports are included in the appendices:
A Test Reporting from Naval Seawater Desalination Laboratory (NFESC)B Performance Projections of FILMTEC Membranes at Various Recovery Ratios
(DOW)C Economic Comparison of VARI-RO vs. Conventional Technology (Laughlin
Associates)
The following team members provided funding, advisory services, design assistance,manufacturing, and testing assistance for the Pilot .Plant project:
RESEARCH ORGANIZATIONSEPR.I Electric Power Research InstituteNFESC Naval Facilities Engineering Service Center
(Seawater Desalination Test Facility)SAIC Science Applications International Corp.VPC Vari-Power Company
UTILITIESLADWP Los Angeles Department of Water & PowerMWD Metropolitan Water Dist. of Southern Calif.SDC San Diego CitySDCWA San Diego County Water AuthoritySDG&E San Diego Gas & ElectricSBC Santa Barbara City
St. Louis, MOPort Hueneme, CA
San Diego, CAEncinitas, CA
Los Angeles, CALos Angeles, CASan Diego, CASan Diego, CASan Diego, CASanta Barbara, CA
DESALTING & CONSULTING ENGINEERING FIRMSC E Carol10 Engineers Phoenix, AZLA Laughlin Associates Borrego Springs, CAMSC Membrane Systems Corporation Poway, CA
EQUIPMENT SUPPLIERSc w Cal-West Machining, Inc. Orange, CAPH Parker Hannifin Corporation Santa Fe Springs, CASW Shore Western Manufacturing, Inc. Monrovia, CAWGI Wheatley Gaso Incorporated Tulsa, OKz c Zemarc Corporation Los Angeles, CA
1

The benefits provided toward this desalting advancement, by the strategic affiliation of the teammembers, includes:
Research Organizations and Utilities:Provide seed capital to stimulate the development.Provide expertise in system engineering, testing, and project management.Participation allows first hand evaluation for future Full-Scale application needs.
Desalting and Consulting Organizations:Provide desalting knowledge to the project.Provide economic analysis capabilities.Gain knowledge of benefits for future projects.
Equipment Suuoliers:Provide valuable assistance with the design evolution,Provide manufacturing knowledge.Reduce the capital investment for manufacturing of future Full-Scale products.
1.2 Pilot Plant Objectives and Technical Benefits
The overall objective of the Pilot Plant effort was to perform technology development andtesting toward reducing the cost of potable water produced by desalination. More specifically,this Pilot Plant was directed at the use of alternate pumping and energy recovery technologies forthe reverse osmosis (RO) desalination process, which are more energy efficient andenvironmentally attractive than existing RO and thermal methods.
The focus of this Pilot Plant project was toward the validation of a new approach to pumping andenergy recovery (the VARI-RO technology) for reverse osmosis desalination. This technologyoffers the potential to substantially reduce energy consumption, and provide other operationalbenefits, when compared to existing RO methods that are presently being used commercially.
This Pilot Plant project has shown that the technology works, can provide energy savings, andcan provide other operational benefits for seawater reverse osmosis desalination (SWRO), andthat it can also be configured for brackish water reverse osmosis desalination (BWRO). Theproject has answered some of the practical questions relative to the implementation of this newapproach for large scale desalination. These practical questions included: mechanical design,performance, maintenance, and economic benefits.
1.3 Specific Water Problem Discussion
Presently 90% of the water for the San Diego region is imported, with the remaining 10% comingfrom runoff stored in local reservoirs. Also, other Southern California regions, including LosAngeles, import a high percentage of the water for urban and other needs. A major portion of thewater comes from Northern California, via the State Water Project (SWP); or f?om the ColoradoRiver, via the Colorado River Aqueduct (CRA). Population increase, the six year drought (1985 -1991), projected shortage of water supply from the SWP and CRA, and contingency plans forsupply disruption (such as earthquakes) have stimulated a search for alternative water supplies forthe Southern California region.
2

The alternative supplies under consideration, or are in process of being implemented, include:
1. Paying farmers to improve conservation methods, thus making agricultural wateravailable for importation to urban regions.
2. Sewage water reclamation for irrigation (freeway landscaping, golf courses, etc.), andindustrial uses.
3. Sewage water repurification, which adds additional steps to the reclamation process toallow this water source to be added to the domestic water supply.
4 . Seawater desalting, which would be added directly to the domestic water supply.
Of these alternatives, only seawater desalting adds new water to a water supply system that ispresently considered to be nearing maximum capacity. Under the combination of increasedpopulation, and emergencies such as severe drought, seawater desalination would help todisaster-proof the water supply system.
Previous studies in the San Diego region indicated that seawater desalination was more costlythan other water supply alternatives at the time. However, recent proposals for seawaterdesalination indicate that this may no longer be the case. Recent proposals (December 3, 1997)have shown that seawater desalination can be accomplished at a substantially lower cost thanprevious estimates for the San Diego region. These proposals were for a facility near TampaBay, Florida in the capacity close to 20 MGD (76,000m3/d), about 20,000 acre-feet (AF) per year.At the time of this report, these proposals are being evaluated; however, the preliminary watercost results are shown in FIGURE 1 - 1:
Developer CapacityTeam No. MGD
Desal
Type
No. ofTrains
Capital Cost Total Water Cost (TWC)$ Million $&gal 1 $/m3 1 $/AF
1 2 0
2 2 0
3 2 0
4 2 3
5 2 0
Tampa Bay MED 4 134.808 Brackish w/Blend
Gulf of RO 7 78.60Mexico
Tampa Bay RO& 4 &I 91.85tVlVC
Tampa Bay RP 5 2 72.17
Tampa Bay RO 6 93.17
3.98 1.05 1297
2.80 0.74 913
3.18 0.84 1037
2.12 0.56 6 9 1
2.90 0.77 945
FIGURE l-l Preliminary Tampa Region Seawater Desalination Costs
FIGURE l-l shows the potential to desalt seawater at a total water cost (TWC) in the range of$2.12 to $2.9 per 1000 gallons ($0.56 to $0.74 per cubic meter), about $700 to $950 per acre-foot. This is substantially less than the present perception in California of $1200 to $2000 perAF, as stated in the January 1998 DRAFT of The California Water Plan Update, Bulletin 160-98,Page 6-80. In the past, the water agencies in California have been looking forward to the timewhen the increasing cost of imported supplies intercepts the decreasing cost of seawaterdesalting. It is quite possible that this time has been reached.
A 50% increase in California’s population is projected by the year 2020. For SouthernCalifornia, this will likely mean that the existing aqueducts, and other delivery systems, willexceed existing capacity. While the present cost of importing water through the existing
3

infrastructure is now less than seawater desalting, it is very likely that the construction cost ofnew aqueducts will be in the billions of dollars, and the TWC could very well be greater than thecost of seawater desalination. Also, the energy required desalt seawater can be lower than theenergy requred to pump water through the SWP from Northern to Southern California (SWP Nth> Sth) (see FIGURE 3-l). Furthermore, it has been found that the sewage water reclamation andrepurification costs are much higher than originally estimated.
The result is that seawater desalination may now be of equal, or in some cases lower, cost thanthe other alternatives. This lower seawater desalination cost has resulted from advancements inthe reverse osmosis technology in general. This advancement is illustrated by the low seawaterdesalination water cost in the Tampa proposals. The lower energy consumption of the VARI-ROsystem can provide an additional cost reduction, thus making this source even more competitivewith other alternatives.
The reasons that seawater desalination should now be considered as a viable alternative include:
1. new water is added to the water supply system that is reaching maximum capacity;2. drought and disruption proofing capability;3. reverse osmosis desalination is a proven method and is in use around the world;4 . energy consumption can now be lower by using the VARI-RO system;5. costs are now competitive to other alternatives; and6. acceptance by the public can readily be obtained.
These reasons provide ample incentive to continue the development, and improvement, of theVARI-RO system. This will assure that this advanced technology becomes a proven method tosupply desalted seawater when it is needed in California, and elsewhere around the world.
1.4 Scope of Work and Methodology
The methodology for conducting the work for the Pilot Plant project was to define the capacity sothat the test results would be applicable to Full-Scale production plants. To do this, variouscapacities of existing small desalination facilities were considered. This was discussed with theother team members at the kickoff meeting, which resulted in a capacity selection of around30,000 GPD (114 m3/d) at about 30% recovery ratio (RR).
The work for this Pilot Plant project was divided into key tasks as follows:
TASK 0 Project Management, Reports, and Presentations.TASK 1 Defining Pilot Plant.TASK 2 Pilot Plant Design.TASK 3 Pilot Plant Equipment Manufacture and Shop Testing.TASK 4 Evaluation Testing.TASK 5 Operational Testing.TASK 6 Defining Full-Scale Unit, Preliminary Full Scale Design, Economic
Evaluation, and Water Cost Projections.TASK 7 Higher Recovery Ratio Design, Manufacture, and Test.
The results of the work from these tasks have been summarized in this report, along withconclusions and recommendations (see SECTION 2.).
4

2. CONCLUSIONS AND RECOMMENDATIONS
The VARI-RO technology is an integrated pumping and energy recovery system for reverseosmosis desalination. This Pilot Plant project has shown that the technology can significantlyreduce the cost of desalted water, primarily by reducing the energy requirements. It has also beenshown that the VARI-RO system has installation and operational advantages over commerciallyavailable conventional pumping and energy recovery systems. For some site locations, whereelectric power rates are high, other economic benefits can be provided by operating at lowerrecovery ratios, The economic and operational benefits over other methods indicate that thetechnology is suitable for both seawater and brackish water reverse osmosis (SWRO & BWRO)desalting.
From the work performed during this Pilot Plant project, including the technical and economicevaluations, the conclusions and recommendations below were reached about the VARI-ROtechnology. The economic analysis was based on parameters provided by the contractor for theexisting Santa Barbara Seawater Desalination Facility of 7.2 MGD (27,250 m3/d) capacity.
1. The technology is technically viable and is suitable for desalting facilities of low,medium, or high capacity.
2. The Pilot Plant testing has demonstrated that the technology can provide energysavings under seawater operating conditions. The technology can also provideenergy savings under brackish water operating conditions, especially for moderateto high salinity brackish water.
3. Because the VARI-RO system is positive displacement, it has particular advantagefor desalination systems that operate under variable membrane pressure conditions.The variable membrane pressures result from changes of salinity, feed waterpressure, and membrane fouling.
4. The economic analysis has shown energy savings of 26% and 35% for the VARI-RO Pilot Plant and Commercial systems, respectively.
5. Water cost reductions were shown from $3.14/kgal ($0.83/m3) for theconventional plant to $2.97/kgal ($0.785/m3) and $2.88/kgal ($0.761/m3) for theVARI-RO Pilot Plant and Commercial systems, respectively. This is a savings of5% and 8%.
6. It is recommended that the Pilot Plant development be continued to incorporatesome of the improvements that were identified under this project.
7. It is recommended that a full-scale demonstration project be initiated, with acapacity in the 0.3 to 0.6 MGD range. The goals of this project would be to showthat the improved efficiencies for a VARI-RO Commercial unit can be achieved,and to show to the desalting professionals and users that the technology is a viablealternative to conventional methods that are now in use.
8. It is further recommended that desalting professionals design desalting facilities sothat these facilities can be easily retrofitted to VARI-RO systems, therebyproviding the user an easy option to save operating costs in the future.
5

3. GENERAL COMPARISON TO CONVENTIONAL PUMPING METHODS
3.1 VARI-ROTM System Overview
The VARI-RO system (Patent Pending) is an integrated variable flow, positive displacement,pumping and energy recovery system for seawater and brackish water reverse osmosis (SWRO &BWRO) desalination. This unique system utilizes modem hydraulic power transmission andelectronic control to provide the following key features:
. Variable flow control for optimization and start up.
. Positive displacement pumping and energy recovery.
. Low cycle speed, low pulsation.. High efficiency.
Because the vibrations and accelerations are low, the system does not require special mountingfoundations and can be installed on conventional concrete floors. This feature is particularlybeneficial for retrofitting of existing installations with more energy efficient pumping and energyrecovery equipment. In addition, it is suitable for low, medium, and high capacity desalinationplants; with units up to 5 MGD (million gallons per day) per train being feasible.
As compared to conventional systems using centrifugal pumps, reverse flow pump turbines, andvariable frequency drives (CP-RFP-VFD), the VARI-RO technology controls flow and recoveryratio independent of the membrane system pressure changes, because it is positive displacement.Also, the technology has a higher BEP (best efficiency point) than a centrifugal system, and thishigher BEP is maintained over a wider range of flow and pressure operation. This wider range ofhigh efficiency operation assists in optimizing plant operation under variable membrane pressureconditions. For example, the delivery pressure will automatically adjust for changes due tosalinity, temperature, fouling, and/or when new membrane improvements become available. Toaccommodate pressure changes with a centrifugal pump and turbine system, it is necessary to useflow throttle valves, and/or variable frequency drives. With centrifugal pumps, it is sometimesnecessary to trim impellers, or reduce pump stages, to provide an efficient match of headcharacteristics.
As compared to conventional phmgef pumps, the VARI-RO system has low pressure pulsation,low cycle speed, and variable flow; which makes it suitable for higher capacity applications. Itdoes not require pulsation dampeners, and at 15 CPM cycle speed as compared to 300 RPM for aplunger pump, it would take 20 years to equal the same number of cycles that a plunger pumpwould get in one year. Due to vibration, and high plunger accelerations, plunger pumps requirespecial mounting foundations for facility installation. This results in additional engineering andcapital cost for the facility.
As compared to Pelton wheel (PW) energy recovery turbines, the VARI-RO system can acceptfull concentrate discharge pressure without an efficiency loss penalty. Since PW turbines musthave an unrestricted exhaust, it is often necessary to have sumps to collect the discharge andsump pumps (with associated electric power and control) to deliver the concentrate to thedischarge point. This results in an additional capital cost and electric power cost.
In summary, the integrated VARI-RO system provides a unique solution to reverse osmosisdesalination and energy recovery. In addition to providing electric power cost savings, it canprovide capital cost and operational benefits as compared to conventional systems. Theseconventional systems are composed of some combination of the following components:
6

. Centrifugal pumps, variable frequency drives, and/or valves for throttle and start up.. Plunger pumps, pulsation dampeners, belt drives, and mounting foundations.. Reverse flow pump turbines, Pelton wheel turbines, sumps, and sump pumps.
In addition, the VARI-RO system can provide capital cost savings in the electric power supply tothe facility, because the power requirements are lower and the electric motors are startedunloaded.
3.2 Conventional Systems Overview
There are several pumping and energy recovery methods that are presently commerciallyavailable for RO desalination. In addition to these commercially available methods, the flowwork exchanger (FWE) system (sometimes known as the work exchanger system) is being usedfor BOOT (build-own-operate-transfer) type contracts in the Caribbean region. Presently theFWE system is only being used in locations where the electric power rates are quite high.
The following are general comments about the primary methods presently being used, and theaccessories that are used with these methods:
CP-RF&VFD - - Centrifwal Pump, Reverse Flow Puma, turbine, and VariableFreauencv Drive
coi%mENTsl Presently the RFP is the most
common energy recovery methodbeing used for high capacityapplications.
l It has lower efficiency than someother alternatives.
. It is considered to be the mostsimple method presently in use.
ACCESSORIESl Variable fieauencv drives are
needed for the most efficientoperation over a range ofmembrane pressure conditions, toavoid flow throttle valve losses.
l High power electric SUDD& andelectric motor are rewired.
l Substantial concrete foundationsare often used for installation of thetxun~. turbine. and electric motor.

CP-HTC-VFD - - Centrifwal Puma, Hvdraulic Turbo Chamer. and VariableFreuuencv Drive, and
PP-HT.c-ccv - - Pluwer Pump, Hvdraulic Turbo Charper, and ConcentrateControl Valve
COMMENTSl The HTC development is a
relatively recent addition for ROenergy recovery. It has evolvedover several years. Early problemsincluded bearing failures at the highspeed rotors.
l Efficiency of the HTC with a CP issimilar to that of the RPP turbine.The HTC system efficiency can beimproved by using it with the moreefficient PP.
l The key advantage of the HTC isthat it is a compact unit, whichresults from the very high operatingspeeds.
l In general, the PP operates ataround 300 RPM, which means thatthe suction valves, dischargevalves, and plunger packings arecycled 300 times per minute. Theseitems wear during operation, andare considered to be “expendables”.These expendable components arereplaced periodically when thepumping performance degrades.
ACCESSORIESl Variable frequency drives are
needed for most efficient operationwhen the HTC is used with acentrifugal pump, to preventadditional losses from flow throttlevalves.
l Concentrate Control Valves are’ needed to match the flow and
pressure conditions of themembranes and the main pump,which results in additional losseswhen operating away frommaximum design conditions.
l Substantial concrete foundationsare required for the PP, because ofthe reaction loads of the high speedplunger and crank accelerations.
l Pulsation dampeners are requiredto attenuate the pressure pulsations,and minimize field piping vibrationfrom the PP.
l Sound enclosures are definitelyneeded to attenuate the high-pitched
Isound of the HTC high speedimpellers.

CP-PW-VFD-SP - - Centrifwal Pump, Pelton Wheel turbine, Variable FrequencvDrive, and Sump Pumps
COMMENTSl Development of the PW has
evolved over many years. Earlyproblems included impellerfractures and erosion.
l The PW has higher efficiency thaneither the RPP or the HTC turbines,and it can operate efficiently over awider range of pressure conditions.
l Automatic controls can be added tothe flow control valve to adjust forvarying pressure and pump speedconditions.
ACCESSORIES. Variable frequency drives are
needed for most efficientoperation of the centrifugal pump,to eliminate the losses that wouldresult if feedwater control valvesare used instead.
l Sumps and pumping; equipmentare usually required to dischargethe reject concentrate back to theocean, which will result in anadditional electric power loss, andalso capital cost. The sumps areneeded because the PW mustdischarge directly to atmospheric
l Sound enclosures are generallyconsidered to be desirable.
9

PP-PW-SP - - Plunger Pump, with Pelton Wheel turbine and Sumu Pumps
COMMENTS. Development of the PW has
evolved over many years. Earlyproblems were impeller fracturingand erosion.
l The combination of the PP withPW energy recovery provideshigher efficiency than systemsusing CP, RFP, and HTC methods.
l A manual PW flow control valvecan be used to adjust the membranepressure, since the PP speed andflow is constant.
l In general, the PP operates ataround 300 RPM, which means thatthe suction valves, dischargevalves, and plunger packings arecycled 300 times per minute. Theseitems wear during operation, andare considered to be “expendables”.These expendable components arereplaced periodically when thepumping performance degrades.
ACCESSORIESl Belt drives are used to match the
plunger pump and Pelton wheelspeeds to give the proper flow forthe application. These belts resultin additional losses.
l Sumps and pump& equipmentare usually required to dischargethe reject concentrate throughdegassifiers and back to theocean. This additional pumpingresults in an additional electricpower loss, and also capitalequipment cost for the facility.The need for sumps, and sumppumping, is because the PW mustdischarge directly to atmosphericpressure.
l Substantial concrete foundationsare required for the PP, because ofthe reaction loads of the highspeed plunger and crankaccelerations.
l Pulsation dampeners are requiredto attenuate the pressurepulsations, and minimize fieldpiping vibration from the PP.
l Separate sound enclosures aredesirable, however, soundvibration is still transmitted intothe field piping, which is difficultto attenuate.
10

PP-FWE -CP-VFD - PlunPer Puma, Flow Work Exchanper, Centrifupal Pump,Variable Frequencv Drive
COMMENTSl The use of the FWE has been
limited to BOOT contracts in theCaribbean, where electric powerrates are relatively high. Theorganizations that are selling waterhave their own maintenance staff tokeep the systems operating. Thisextra staffing is justified by theenergy cost savinns.
l The combination of the PP withFWE energy recovery has energyconsumption rates that are lowerthan the PP-PW system, and issimilar to the VARI-RO system.Since the system is positivedisplacement, except for thecentrifugal boost pump, thepressure adjusts automatically tothe operating membrane pressure.
. The water directional valves for theFWE switch the concentrate (brine)full flow rate to the pressureexchange vessels at the rate ofabout 1 CPM. Because the valveswitching occurs at full flow rate,significant hydraulic shock iscreated. Field reports indicate thatthe valves must be frequentlymaintained.
ACCESSORIESl Variable f?eauencv drives are
needed for the centrifugal boosterpump, which boosts the pressureTom the FWE to the membraneoperating pressure.
l Additional floor snace, andfacility volume, is required in thefacility to accommodate the largebulk of the pressure exchangevessels.
l Substantial concrete foundationsare required for the PP, because ofthe reaction loads of the highspeed plunger and crankaccelerations.
l Pulsation damneners are requiredto attenuate the pressurepulsations, and minimize fieldpiping vibration.
l Separate sound enclosures aredesirable, however, soundvibration is still transmitted intothe field piping from the PP andFWE.
11
3.3 Advantages of the VARI-RO System
There are several advantages of the VARI-RO technology over conventional pumping and energyrecovery methods, including: centrifugal pumps, crank type plunger pumps, reverse flow pumpturbines, Pelton wheel turbines, and variable frequency drives. The inherent advantages aresummarized as follows.
A . Variable Flow, Positive Displacement:
1. Higher efficiency than centrifugal pumps.2. Matches system head (back pressure) at any flow rate.3. Separate variable speed drives are not required.4 . Holds constant flow rate (flux) setting as membrane pressure changes due to
temperature, salinity, and fouling variations.5. Electric motors can be started unloaded, and at zero flow rate.6. Flow can be increased gradually from zero to maximum setting during startup,
and from maximum to zero during shutdown.
B. Smooth Flow (suction and discharge):
1. Low pulsation output flow, similar to centrifugal pumps, minimizing pipingvibration.
2. Pulsation dampeners and suction stabilizers are not required, as withconventional crank type piston or plunger pumps.
C. Low Cycle Speed:
1. Reduces wear and operating cycles on expendable parts, such as valves andpackings.
2 . At 15 CPM, it would take 20 years to equal the number of cycles of a cranktype plunger pump operating at 300 RPM for one year.
3. Results in low operating and maintenance cost, as compared to conventionalcrank type pumps.
4 . Low accelerations allow installation on conventional concrete floors, withoutspecial mounting foundations.
D. Highly Effkient Energy Recovery Is Integrated:
1. Provides for high efficiency recovery of reject concentrate energy.2. Does not have the intermediate losses of turbines, centrifugal pumps,
generators, and/or electric motors.3. Energy consumption is relatively flat versus recovery ratio, which assists in the
optimization of a desalting system for improved membrane performance, andcan reduce membrane related costs.
E. Electric Power Requirements Are Lower, Plus Unloaded Starting andStopping Minimizes Power Surges:
1. Reduces capital cost of sub-stations, transformers, and other electric powerequipment. Also, variable frequency drives are not required.
2 . Demand factor can be reduced, providing lower electric rates.3 . Electric power cost is reduced, which is a significant desalting facility
operating cost.
HEAD & FLOW MATCHING: One of the inherent advantages of positive displacementpumping is the direct matching of system head at any flow rate. This means that, as there issystem head change due to salinity, temperature, and membrane fouling, the pumping pressurewill simply follow the system head while maintaining a constant flow rate through themembranes. For example, the pressure will automatically drop back to the initial pressure afterthe membranes are cleaned, replaced, or new membranes added; without requiring a separatevariable frequency drive.
With the selection of centrifugal pumps during initial design, careful matching of the head/flowcharacteristics of the centrifugal pump with the head characteristics of the system head is needed.The result is that the selection is based on the maximum expected head; however, at start up theclean membrane head (pressure) is usually much lower that the maximum head. To compensatefor this discrepancy, throttle valves are needed to maintain the specified flow rates. Anotheralternative is to use a separate variable frequency drive to adjust the pump speed to give thespecified membrane flow rate.
SYSTEM START-UP CHAIUCTEFUSTICS: The variable flow feature, and low rotatinginertia, of the VARI-RO technology allows for unloaded across-the-line starting of the electricmotors. After starting the system flow can be gradually increased to design conditions. Withconventional pumps, it is often necessary to over-size the electric motor to provide sufficientpower for start-up.
The capability to easily start and stop the system, without large electric power surges, isparticularly advantageous to allow operating during periods of low electric power demand (OFFPEAK). This allows the RO plant owner to take advantage of the lower “interruptible load”electric power rate schedule.
The lower power requirement, variable flow capability, and start/stop ease, provides thefollowing benefits as compared to conventional pumping methods:
1) lower capacity electric power transmission lines to the facility;2) lower capacity sub-station transformers;3) lower electrical switch gear capacity;4) lower installed electric motor capacity;5) no separate variable frequency drives are needed; and6) improved capability for operating at lower electric power rates.
The above benefits can result in lower capital cost for the desalination facility, in addition toelectric power cost savings. This can result in a lower total water cost (TWC).
3.4 Energy Conservation and Global Warming Benefits
Currently there are various systems for seawater desalination, which include: multi-stage flash(MSF), multi-effect distillation (MED), mechanical vapor compression (MVC), and reverseosmosis (RO). Many of the present facilities (some over 20 years old) use the MSF process, andare located in Middle East countries. In recent years, however, the use of the RO process hasbeen growing, primarily due to its lower energy consumption (about 1/6th of MSF withconventional RO, and about l/lOth with the VARI-RO system). In addition, RO popularity isincreasing due to its easier implementation. The total energy consumption for seawaterdesalination is shown on FIGURE 3-l. Also, for purposes of reference, the total energyconsumption of the California SWP from Northern to Southern California is shown (SWP Nth >Sth). As shown on this figure, the energy conservation of the conventional RO process is quite
1 3

substantial as compared to the other desalting processes. It is also shown that additionalconservation can be achieved when the VARI-RO system is used.
In addition to the Middle East countries, there are major seawater desalting facilities in otherlocations around the world, including: Spain, Canary Islands, Malta, Okinawa, and theCaribbean. Many of the desalting system in these locations use RO. The potential applicationsfor the VARI-ROTM system include: the replacement of existing distillation facilities (MSF,MED, and MVC) that have excessive energy consumption and emissions (or are at the end oftheir useful life); the retrofitting of existing RO facilities with more efficient pumping systems;and providing improved technology for new RO desalting facilities.
84
CONVENTIONAL REVERSE OSMOSIS EASED ON:wo PSI
40% RECOVERY RATIO
CP-RFP-VFD SYSTEM.
(bbl oilA#G) I3.785 = bbl oil/lDODm3
(WI oil/MG) x 0.326 = bM oiUAF
0 t + + -t- +
MSF MED MVC CENT. SWP VRO-Nth > EMD
(2)%K?eSWasW.DES&ENGY.Req.B9’2 CHTSE
FIGURE 3-1 Total Energy Consumption of Desalting Processes and the SWP
At the 1997 Global Warming Conference, Kyoto, Japan, the proposed treaty emphasized the needto cut carbon dioxide (CO2) emissions, one of the “greenhouse” gases. In February 1998, theClinton administration proposed a $6.3 billion package to ‘!.. mobilize cutting-edge technologiesin the j?ght against global warming ._. “ . The motivation is to: I’... overcome the challenge ofglobal climate change and create new avenues of growth for our economy . . . “.
In 1995, the world desalination capacity was 5.4 billion gallons per day (20 million ms/d), whichresulted from an average growth rate of 250 MGD (about one million m3/d) per year over thepast 10 years. It is projected that the future growth in desalination capacity will be at an evengreater rate. The chart in FIGURE 3-1 shows that the use of VARI-RO technology for this newcapacity, and the retrofitting of antiquated existing installations, could provide an enormousreduction in CO;! emissions.
14

The sale of this technology on a world wide basis would help to meet the Bureau of ReclamationWater Treatment Technology Program objectives, as follows:
. Help United States industry compete in major international markets for desaltingsystems, by fostering the development and use of new cost-effective andtechnologically advanced desalting processes.
. Promote partnerships between government and industry in the use of desalting tomeet critical water needs.
. Promote technologies that are more energy efficient and environmentally attractivethan existing methods.
The VARI-RO technology developments can also help to meet a key objective of the globalwarming treaty, which is to reduce CO;! emissions by a substantial amount by the year 20 10.
15

4 . PILOT PLANT PARAMETERS AND CONFIGURATION
The design for a VARI-RO Pilot Plant included the selection of the most suitable configuration,plus the selection of equipment sizes for the selected capacity and RR. It also included theselection of the key system components and electronic control.
4.1 Pilot Plant System General Parameter Selection
ORIGINAL CAPACITY SELECTION: At the Team Member Kickoff Meeting for the PilotPlant project, several capacity options were considered. With the consensus from the meeting,and considering the standard components available, the selected capacity for the original unit was32,000 GPD (113.6 m3/d) and 29% recovery ratio, with a cycle speed of 13.7 CPM. A designpressure range of 800 PSI (55 BAR) to 1000 PSI (69 BAR) was selected.
HIGHER RECOVERY RATIO SELECTION: Later in the program, the unit was modified to seehow it would function under higher recovery ratio conditions. The new capacity was projected tobe about 49,000 GPD (185 m3/d) and 43% recovery ratio, with a cycle speed of 13.7 CPM.
BENCH MARK TEST PARAMETERS: It was decided to do all of the initial testing at 800 PSI(55 BAR) and 12 CPM. While lower than the original design conditions of 1000 PSI and 13.7CPM, these parameters provide a “Bench Mark” reference point for comparisons during thesystem development. During a further testing program, the system will be operated at the higherdesign condition parameters, after additional system upgrades.
4.2 VARI-RO System Sub-assemblies and Configuration
The sub-assemblies of the VARI-RO system include:
SUB-ASSEMBLY CONSISTING OF:
ELECTRONIC CONTROL UNIT (ECU) ComputerServo ControllerInstrumentation
HYDRAULIC DRIVE UNIT (HDU) Electric Motor (EM)Hydraulic Pumps (HP)Hydraulic Accessories
WATER DISPLACEMENT UNIT (WDU)
WW
Hydraulic Cylinders (HC)Water Cylinders (WC)Feed Water Valves (FWV)Energy Recovery Valves
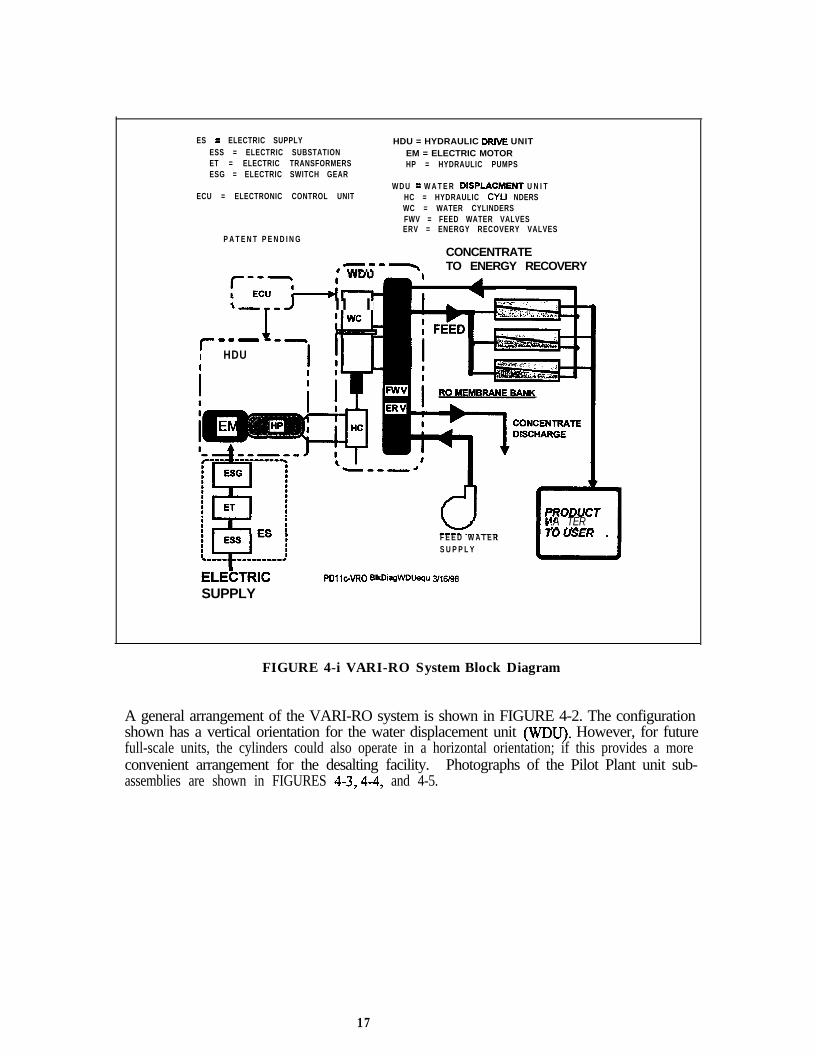
A block diagram of the VARI-RO integrated pumping and energy recovery system is shown inFIGURE 4-l. This figure also shows the relationship to the other systems in a reverse osmosisdesalting facility. The other systems include the electric power supply system, the feed watersupply and treatment system, and the reverse osmosis membrane bank system.
16
ES = ELECTRIC SUPPLYESS = ELECTRIC SUBSTATIONET = ELECTRIC TRANSFORMERSESG = ELECTRIC SWITCH GEAR
ECU = ELECTRONIC CONTROL UNIT
HDU = HYDRAULIC DRlVE UNITEM = ELECTRIC MOTORHP = HYDRAULIC PUMPS
W D U = W A T E R DISPLACMENT U N I THC = HYDRAULIC CYLI NDERSWC = WATER CYLINDERSFWV = FEED WATER VALVESERV = ENERGY RECOVERY VALVES
P A T E N T P E N D I N G
CONCENTRATE----
4 .-*-.. TO ENERGY RECOVERY\ A
i-,-J II I
f- --- --l HDUI
.A TER_- __---F E E D W A T E RS U P P L Y
ELEi=TRICSUPPLY
PDllc-VRO BlkDiagWDUequ 316198
FIGURE 4-i VARI-RO System Block Diagram
A general arrangement of the VARI-RO system is shown in FIGURE 4-2. The configurationshown has a vertical orientation for the water displacement unit (WIN). However, for futurefull-scale units, the cylinders could also operate in a horizontal orientation; if this provides a moreconvenient arrangement for the desalting facility. Photographs of the Pilot Plant unit sub-assemblies are shown in FIGURES 4-3,4-4, and 4-5.
17

LWUV
FPH
1 r JI I
FIGURE 4-2 VARI-RO System General Arrangement
18

FIGURE 4-3 Pilot Plant, Electronic Control Unit Display
FIGURE 4-4 Pilot Plant, Hydraulic Drive Unit
19

-
FIGURE 4-5 Pilot Plant, Water Displacement Unit
20
5. TESTING AND PERFORMANCE RESULTS
The shop testing was performed at Shore Western’s facility, Monrovia, California, and theperformance testing was performed at San Diego City’s San Pasqual Water Reclamation Facility,near Escondido, California.
5.1 Test Setup and Methodology
The VARI-RO system testing was performed under simulated conditions. Fresh water was usedas the testing medium for convenience, and to conserve project cost. Since the primaryobjectives, of this relatively short duration testing program, were to prove function andperformance; testing with fresh water provides the same results as testing with seawater. Testingwith seawater is only important for long duration testing to determine corrosion effects, which isplanned for a subsequent testing program.
The basic test setup simulated the components external to the VARI-RO system shown inFIGURE 6- 1. The feed water supply consisted of a water tank and a pump for supply pressure(pS). The membrane simulator consisted of a throttle needle valve to create membrane backpressure (PM), and a ball valve to simulate concentrate pressure drop (dpM) through themembranes. The concentrate discharge included a pressure gage (pD) and a visual flow meter.
The measurement of product water flow rate was accomplished using three different methods.The general purpose methods were a visual meter to provide a quick indication of product flowrate, and a bucket and stop watch method to give a more accurate flow. For verification, a largerwater tank, weighing scale, and stop watch were used for more precise measurement of flow rateover a longer elapsed time period. During test runs, the product flow measurements values weremanually input into the computer for recording and performance calculations.
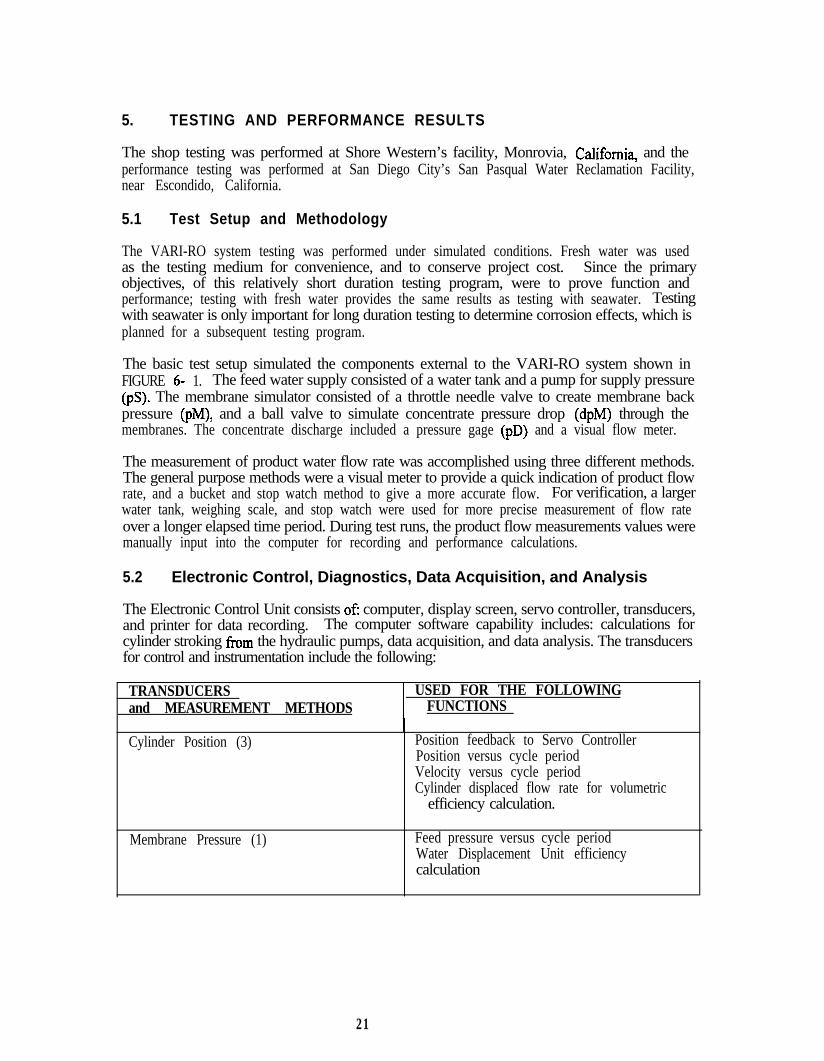
5.2 Electronic Control, Diagnostics, Data Acquisition, and Analysis
The Electronic Control Unit consists of: computer, display screen, servo controller, transducers,and printer for data recording. The computer software capability includes: calculations forcylinder stroking from the hydraulic pumps, data acquisition, and data analysis. The transducersfor control and instrumentation include the following:
TRANSDUCERS USED FOR THE FOLLOWINGand MEASUREMENT METHODS FUNCTIONS
Cylinder Position (3) Position feedback to Servo ControllerPosition versus cycle periodVelocity versus cycle periodCylinder displaced flow rate for volumetric
efficiency calculation.
Membrane Pressure (1) Feed pressure versus cycle periodWater Displacement Unit efficiencycalculation
21

Hydraulic Pressure (2) Hydraulic cylinder pressure versus cycleperiod
Differential cylinder pressureHydraulic cylinder force calculationMechanical efftciencyPower input to the WDU.
Differential Pressure (1) Pressure drop measurements,such as membrane simulation (dpM), andenergy recovery valves.
Power Visual power meterRecording of power inputSpecific energy consumption calculations
Product flow measurement(tank, scale, and stop watch)
Recording of product flow rate, which ismanually input into the computer.
Volumetric efficiency calculationsSpecific energy consumption calculations
The computer control, diagnostics, data acquisition, and data analysis system developed for thePilot Plant unit testing is quite sophisticated. A wide variety of operating parameters(individually or together) can be dynamically displayed on the computer screen for -each cycleperiod, or for multiple periods. This allows the operator to look for variations from one cycle, ortest run, to the next for diagnostic purposes. In addition, certain parameters are displayed on thescreen in engineering units for monitoring of performance. The dynamic data, and theengineering unit data., can be recorded for subsequent analysis after the test runs have beencompleted.
The extensive data analysis and recording, that is provided in the computer software, provides theoperator information for monitoring the performance of the unit, and the capability to troubleshoot malfunctions.
5.3 Functional Results
The Pilot Plant testing of the VARI-RO system has demonstrated the following functionalfeatures for startup, shutdown, optimization, and diagnostics:
1. UNLOADED ELECTRIC MOTOR STARTUP: The ability to start the electricmotors unloaded and under low inertia was demonstrated. This feature avoids highsurge electrical currents for long time periods that can occur with conventionalpumping methods. This can become an important feature for high capacityfacilities that can minimize the electrical power supply requirements.
2 . PRE-PUMPING CHECKOUT: If desired, the operation of the various sub-systems can be checked out before starting of the main pumping operation. Forexample, all of the energy recovery valves (ERV) can be set to the “OPEN’position, and the cylinders stroked under low supply pressure. This function isuseful for assuring that the air has been bled from the system. In addition, eachERV can be individually operated to check for function, and trouble shooting.
22
3. LOW CYCLE SPEED STARTUP: For the Pilot Plant unit, the typical startupcycle speed was 3 CPM, with the cylinders moving from the “HOME” position tothe normal cycling position. After checking that everything was functioningproperly, the cycle speed was gradually increased to normal cycle speed, usually 12CPM; which brought the flow up to normal conditions. Other startup cycleconditions can be readily setup to optimize the facility operation.
4. VARIABLE CYCLE SPEED: By varying the cycle speed, the output flow is alsovaried. This is an important feature for optimization of the desalting operation.
5. NORMAL OPERATION MONITORING: By watching the computer displayscreen, the various operating parameters can be monitored by the operator. Thevarious parameters can be turned on and off, and the screen refreshed to check outindividual functions and/or parameters. This capability is particularly important forequipment diagnostics.
6. PARAMETER MONITORING: At the end of each cycle, the recorded data isupdated and displayed, for example every 5 seconds at 12 CPM. During thesystem operation, the operator can note deviations of a particular parameter fromnormal operation. This can provide advanced notice of the possible need forsystem maintenance.
7. ENERGY RECOVERY VALVES SHIFTING AT ZERO FLOW: A key feature ofthe VARI-RO system is the high efficiency energy recovery. To accomplish thishigh efficiency, the energy recovery valves (ERV) switch the total flow betweenthe three water cylinders in a complementary fashion. The unique control methodprovides that the flow to each ERV is brought to zero before it is closed or opened.This eliminates hydraulic shock, and this feature will be particularly important forfuture high capacity systems. However, while the flow through any individualvalve goes from zero to maximum in a gradual manner, the total flow from theVARI-RO system is constant and with low pulsation, due to the uniquecomplementary operation.
8. CONTROLLED SHUTDOWN: Upon receiving the signal to shutdown, thecylinders sequentially go the “HOME” position and stop. This provides for slowdeceleration of the flow during shutdown, and avoids the mechanical shock thatcan occur with conventional systems. This also is an important feature for highcapacity systems that have long intake and discharge piping systems.
In summary, the Pilot Plant testing has demonstrated the unique features of the VARI-RO systemthat makes this variable flow, positive displacement system suitable for high capacity desaltingapplications.
5.4 Performance Results at “Bench Mark” Operating Conditions
A series of tests were made by Mark Silbernagel of the NFESC. Mark’s trip report is included asAppendix . These tests were run at the “Bench Mark” operating conditions as described inSECTION 4-1, at 800 PSI and 12 CPM.
23
CALIBRATION CHECKSFor these series of tests, the pressure transducers were calibrated against a master pressure gage.The calibration of the master gage was checked against a dead weight tester. The product andconcentrate flow rates were determined using a tank, weigh scale, and stop watch.
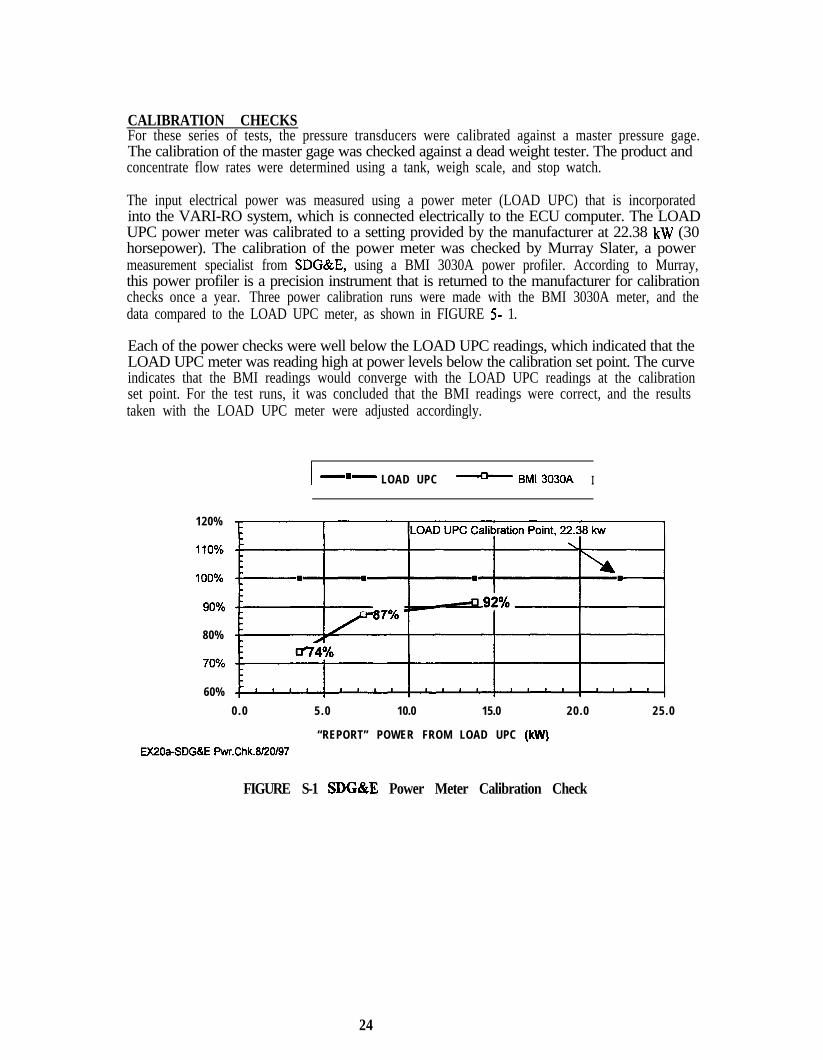
The input electrical power was measured using a power meter (LOAD UPC) that is incorporatedinto the VARI-RO system, which is connected electrically to the ECU computer. The LOADUPC power meter was calibrated to a setting provided by the manufacturer at 22.38 kW (30horsepower). The calibration of the power meter was checked by Murray Slater, a powermeasurement specialist from SDG&E, using a BMI 3030A power profiler. According to Murray,this power profiler is a precision instrument that is returned to the manufacturer for calibrationchecks once a year. Three power calibration runs were made with the BMI 3030A meter, and thedata compared to the LOAD UPC meter, as shown in FIGURE 5- 1.
Each of the power checks were well below the LOAD UPC readings, which indicated that theLOAD UPC meter was reading high at power levels below the calibration set point. The curveindicates that the BMI readings would converge with the LOAD UPC readings at the calibrationset point. For the test runs, it was concluded that the BMI readings were correct, and the resultstaken with the LOAD UPC meter were adjusted accordingly.
I -.- LOAD UPC - BMI 303OA I
120%
80%
60%0.0 5.0 10.0 15.0 20.0 25.0
“REPORT” POWER FROM LOAD UPC (kw)EX20a-SDG&E Pwr.Chk.8/20/97
FIGURE S-1 SDG&E Power Meter Calibration Check
24
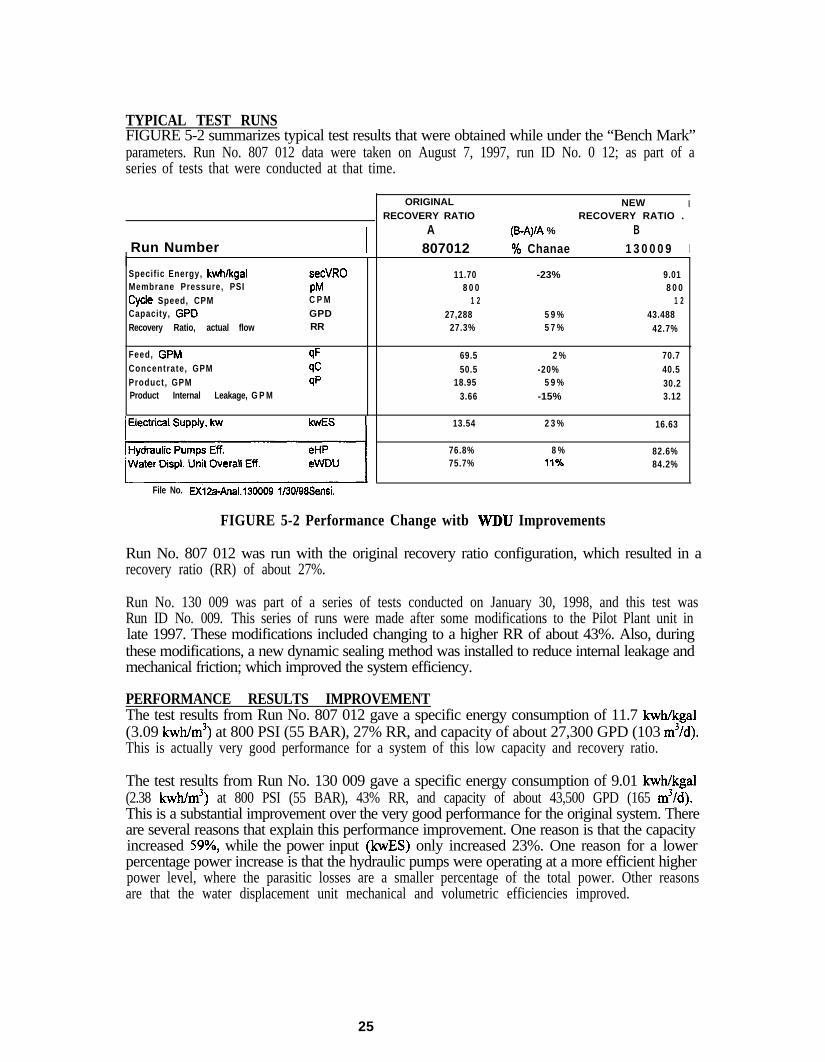
TYPICAL TEST RUNSFIGURE 5-2 summarizes typical test results that were obtained while under the “Bench Mark”parameters. Run No. 807 012 data were taken on August 7, 1997, run ID No. 0 12; as part of aseries of tests that were conducted at that time.
Run Number I
ORIGINAL
RECOVERY RATIO
A
807012
NEW IRECOVERY RATIO .
(S-A)/A % B
% Chanae 1 3 0 0 0 9 I
Specific Energy, kwh/kgalMembrane Pressure, PSI
Cycle Speed, CPMCapacity, GPO
Recovery Ratio, actual flow
secVR0
PMC P M
GPDRR
11.70 -23% 9.018 0 0 8 0 0
1 2 1 2
27,288 5 9 % 43.48827.3% 5 7 % 42.7%
Feed, GPM qF 69.5 2 % 70.7Concentrate, GPM 6 50.5 -20% 40.5Product, GPM qp 18.95 5 9 % 30.2Product Internal Leakage, G P M 3.66 -15% 3.12
~1File No. EX&-Anal.130009 1/30/98Sensi.
13.54 2 3 % 16.63
76.8% 8 % 82.6%75.7% Ii?44 84.2%
FIGURE 5-2 Performance Change witb WDU Improvements
Run No. 807 012 was run with the original recovery ratio configuration, which resulted in arecovery ratio (RR) of about 27%.
Run No. 130 009 was part of a series of tests conducted on January 30, 1998, and this test wasRun ID No. 009. This series of runs were made after some modifications to the Pilot Plant unit inlate 1997. These modifications included changing to a higher RR of about 43%. Also, duringthese modifications, a new dynamic sealing method was installed to reduce internal leakage andmechanical friction; which improved the system efficiency.
PERFORMANCE RESULTS IMPROVEMENTThe test results from Run No. 807 012 gave a specific energy consumption of 11.7 kwhkgal(3.09 kwh/m3) at 800 PSI (55 BAR), 27% RR, and capacity of about 27,300 GPD (103 m3/d).This is actually very good performance for a system of this low capacity and recovery ratio.
The test results from Run No. 130 009 gave a specific energy consumption of 9.01 kwh/kgal(2.38 kwh/m3) at 800 PSI (55 BAR), 43% RR, and capacity of about 43,500 GPD (165 m3/d).This is a substantial improvement over the very good performance for the original system. Thereare several reasons that explain this performance improvement. One reason is that the capacityincreased 59%, while the power input @ES) only increased 23%. One reason for a lowerpercentage power increase is that the hydraulic pumps were operating at a more efficient higherpower level, where the parasitic losses are a smaller percentage of the total power. Other reasonsare that the water displacement unit mechanical and volumetric efficiencies improved.
25
EXPECTED FUTURE PILOT PLANT UNIT PERFORMANCE IMPROVEMENTAs noted above, the test results were taken under the “Bench Mark” conditions (SECTION 4.1).It is expected that the Pilot Plant unit performance will improve when the unit is operated atdesign operation conditions of 13.7 CPM versus 12 CPM. One reason for the expected futureperformance improvement is that the hydraulic pumps will be operating at closer to the ratedconditions. Another reason is that the product water flow rate is expected to increase about 14%to about 49,000 GPD (185 m3/d), while the mechanical friction and internal leakage losses areexpected to remain about the same. If these expectations hold true, the specific energyconsumption could decrease from the present 9 kwh/kgal (2.38 kwh/m3) to about 8.5 kwh/kgal(2.25 kwh/m3), about a 5% reduction.
With this improvement to 8.5 kwh/kgal at 800 PSI (55 BAR), then a specific energy consumptionof 10.6 kwh/kgal(2.8 kwh/m3) at 1000 PSI (69 BAR) appears to be achievable.
NOTE: As a reference consideration, the present hydraulic drive unit (HDU) hastwo hydraulic pumps that are of the correct capacity, and one that has excesscapacity. This resulted from a component delivery problem when the unit wasmanufactured. The over capacity hydraulic pump is only operating at about 70%of its design capacity. It has been estimated that if the correct hydraulic pumpwas installed, the energy consumption would improve another 2%. If this provesto be the case, then the specific energy consumption of about 10.4 kwmgal(2.75kwh/m3), at 1000 PSI (69 BAR), appears to be possible with the Pilot Plant unit.
EXPECTED FUTURE FULL-SCALE UNIT PERFORMANCEFrom the knowledge obtained during the Pilot Plant operation, several design improvements havebeen devised that are expected to improve performance. Also, for higher capacity units, theparasitic losses are expected to be a smaller percentage of the total power. Based on this, it hasbeen projected that the specific energy consumption will improve, perhaps to about 10 kwh/kgal(2.64 kwh/m3) at 1000 PSI (69 BAR) and 45% RR.
EXPECTED FUTURE FULL-SCALE SMOOTH OUTPUT FLOWDuring Pilot Plant operation, pressure pulsations were noted during each cycle. This wasdescribed in Mark Silbemagel’s report, APPENDIX B, as exceeding the +/- 5% maximumrecommend by a pumping manual. This pressure pulsation was reduced when a small dampenerwas connected to the system. It should be noted that this pressure pulsation was at a lowfrequency (12 CPM), as compared to conventional positive displacement plunger pumps(typically 300 RPM). Also, this pressure pulsation was a relatively gentle pressure variationduring each cycle period, as compared to the higher frequency pulsation of plunger pumps.
The primary reason for this pressure variation, during each cycle of the Pilot Plant unit, was thatone of the hydraulic pumps in the hydraulic drive unit is a different capacity than the other two.The reason for this hydraulic pump capacity difference is mentioned in the NOTE above. Thisresulted in the control system not providing a perfect match of the stroking characteristics of thepump, that was different, with the other two hydraulic pumps. This difference caused a pressurevariation during each cycle.
In future full-scale units, all of the hydraulic drive pumps will be identical; and the control systemwill be more precise. It is expected that these measures will provide smooth output flow, withlow pressure pulsations, as compared to conventional positive displacement pumping equipment.
26

6. PERFORMANCE COMPARISONS TO CONVENTIONAL METHODSA general comparison of the VARI-RO system to conventional pumping and energy recoverymethods was given in SECTION 3. This section provides a performance comparison to typicalconventional systems that are presently being used for reverse osmosis desalination facilities.
For these comparisons, equations were derived for both the VARI-RO system and theconventional system, as shown in SECTIONS 6.1 and 6.2
6.1 VARI-RO System, Specific Energy Consumption Equations
The VARI-RO system is an integrated pumping and energy recovery method for reverse osmosisdesalination. Because of the integrated functions, the usual specific energy consumptionequations used for conventional pumping and energy recovery systems do not apply. Newequations have been derived for the VARI-RO system, which are shown in FIGURE 6- 1.
/-- MEMBRANESC
FEED WATERSUPPLY
ps :Q I ,,- qp--._
--__--sI
II
W CII Fwv I
CONCENTRATEERV I
IDISCHARGE I
I qc
II
I
-w-B
HDU WDU
qP = flow, Product = MGD/0.00144 = GPMRR = Recovery Ratio = qP/qFqF = flow, Feed = qPlRRqC = flow, Concentrate = qP(l - RR)/RR
P S = pressure, Supply = PSIP M = pressure, MembranesdpM = delta pressure, MembranespC = pressure, ConcentratepD = pressure, Discharge
eEM = efficiency, Electric MotoreHP = efficiency, Hydraulic PumpseWDU = effk%sncy, Water Displ. Unit
0.302 (MGD)kwES = (RR)(eEM)(eHP)(eWDU) C
(PM-PS)- (I-RR )(pM-dpM-pD ) =kwlNPUT1secvRO = 0.024 (kW=)
MGD= kWhikgal
FIGURE 6-l VARI-RO System, Diagram and Equations
In these new equations, the power input from the electrical supply (kwES) is defined in terms ofthe efficiencies of the electric motor (eEM), the hydraulic pumps (eHP), and the integrated waterdisplacement unit (eWDU). The system characteristic is defined in terms of the product waterproduced (MGD), the recovery ratio (RR), and the system pressures as shown. The specificenergy consumption of the VARI-RO system (secVR0) is then the input power (kwES) dividedby the product water production (MGD), giving the result in kilowatt hours per 1000 gallons(kwh/kgal).
27

6.2 Conventional System, Specific Energy Consumption Equations
Specific energy consumption equations that apply to conventional pumping and energy recoverysystems are shown in FIGURE 6-2. The equations are for conventional systems composed of acentrifugal pump, reverse flow pump turbine, and variable frequency drive (CP-RFP-VFD).With slight variations, these equations also apply to Pelton wheel turbine systems with centrifugalpumps (CP-PW-VFD-SP), and systems with plunger pumps and Pelton wheel turbines (PP-PW-SP). Since Pelton wheel turbines must exhaust to atmospheric pressure, additional energyconsumption needs to be added for sump pumping, when this is needed to move the water to thepoint of discharge. For plunger pump systems, the efficiencies used would also need to includethe drive belts. As an example, for a plunger pump with 90% efficiency and a belt drive with95% efficiency, the efficiency (ePP) would be for the combined components, or 85.5%.
NOTE: The variable frequency drives would not be used for the plunger pumpsystems. Also, if these are not used with the centrifugal pump systems, thenappropriate flow throttle valve (FTV) losses need to be added to the analysis,
MEMBRANESFEED WATER
RR = Recovery Ratio = qP/qF
flow, Concentrate = qP(l - RR)/RR
VFD
ES
0
ELECTRIC‘nput SUPPLY
SUMP PUMPING (SP)(when neededfor Pelton wheelturbines)
SP
0‘nput
pS = pressure, Supply = PSIpM = pressure, MembranesdpM = delta pressure, MembranespC = pressure, ConcentratepD = pressure, DischargepD’ = pressure, Discharge (Pelton wheel)
eEM = efficiency, Electric MotoreP = efficiency, PumpeT = efficiency, Turbine
kwES = (RR) (eVFD) (eEM) r(PM - PS)eP
-eT (1 -RR )(pM-dpM-pD ) =kwlNPUT10.302 (MGD)
kwSP =0.302 (MGD) (1 - RR) ( DD)
secCONVEN. =0.024 (kwES + kwSP)
(RR)(eVFD)(eEM)(eP) MGD= kWh/kgal
FIGURE 6-2 Conventional System, Diagram and Equations
The electric supply power input (kwES) of the system is the power of the pump less the power ofthe turbine, divided by the efficiencies of the variable frequency drive (eVFD) and the electricmotor (eEM). If the system includes sump pumping, then this power (kwSP) would need to beadded to the kwES power before calculating the specific energy consumption (secCONVEN.) ofthe conventional system.
28
6.3 Performance of Pilot Plant Unit, Actual and Projected
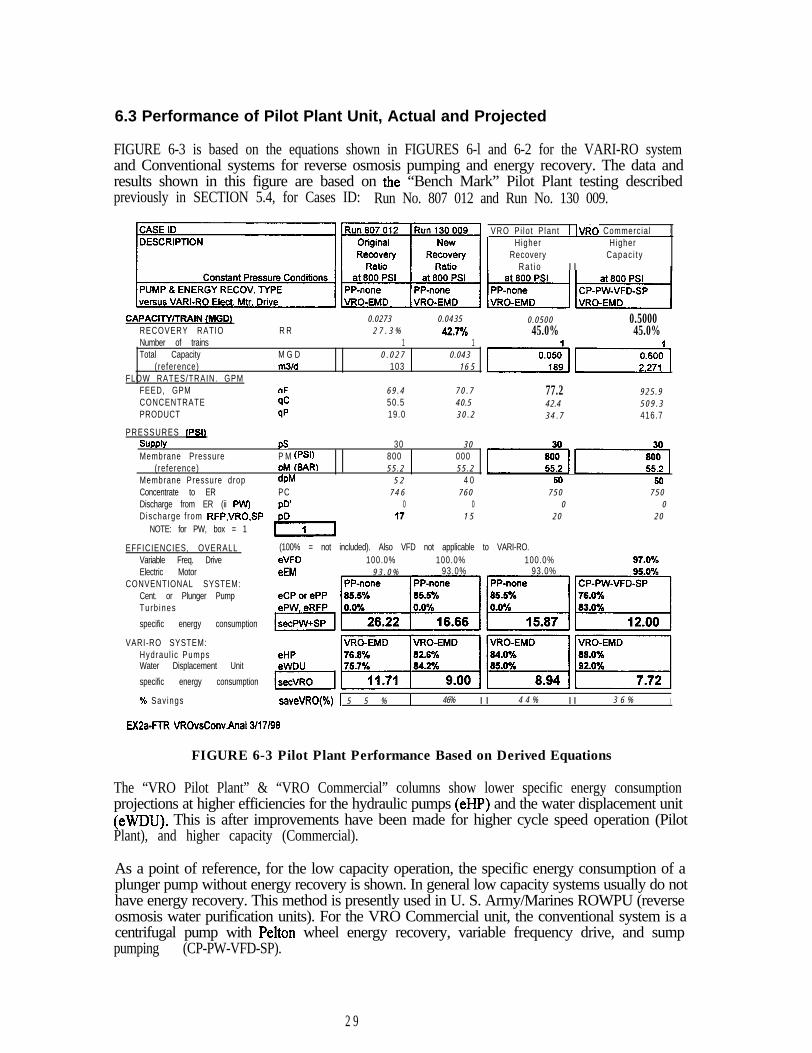
FIGURE 6-3 is based on the equations shown in FIGURES 6-l and 6-2 for the VARI-RO systemand Conventional systems for reverse osmosis pumping and energy recovery. The data andresults shown in this figure are based on the “Bench Mark” Pilot Plant testing describedpreviously in SECTION 5.4, for Cases ID: Run No. 807 012 and Run No. 130 009.
CAPAClTYlTRAfN tMGD)RECOVERY RATIONumber of trainsTotal Capacity
(reference)
R R
M G Dm3ld
0 . 0 2 7 3 0 . 0 4 3 5
2 7 . 3 % 42.w1 1
0 . 0 2 7 0 . 0 4 3
103 1 6 5
FLOW RATES/TRAIN. GPMFEED, GPMCONCENTRATEPRODUCT
PRESSURES fPSl)SUDPIVMembrane Pressure
(reference)
CIF 6 9 . 4 7 0 . 7
SC 50.5 4 0 . 5
qp 19.0 3 0 . 2
PS 30 3 0
P M (PSI) 800 000Dtd (BAR) 5 5 . 2 5 5 . 2
Membrane Pressure dropConcentrate to ERDischarge from ER (ii PW)Discharge f rom RFP,VRO,SP
NOTE: for PW, box = 1
dpM 5 2 4 0PC 7 4 6 7 6 0
CID’ 0 01 5
rTi-I<l50 50
7 5 0 7 5 0
0 0
2 0 2 0
EFFICIENCIES, OVERALLVariable Freq. DriveElectric Motor
CONVENTIONAL SYSTEM:Cent. or Plunger PumpTurb ines
specific energy consumption
(100% = not included). Also VFD not applicable to VARI-RO.eVFD 100.0% 100.0% 100.0%eEM 9 3 . 0 % 93.0% 93.0%
VARI-RO SYSTEM:Hydrau l ic PumpsWater Displacement Unit
specific energy consumption
% Sav ings saveVRO(%) 1 5 5 % t 46% I I 4 4 % I I 3 6 % I
VRO P i lo t P lan t 1 lvR0 Commercia l 1
I Higher
I I
HigherRecovery Capac i t y
R a t i o
0 . 0 5 0 0 0.500045.0% 45.0%
rYigJ~[
77.2 9 2 5 . 9
4 2 . 4 5 0 9 . 3
3 4 . 7 416.7
EXZa-FTR VROvsConv.Anal3l17l90
FIGURE 6-3 Pilot Plant Performance Based on Derived Equations
The “VRO Pilot Plant” & “VRO Commercial” columns show lower specific energy consumptionprojections at higher efficiencies for the hydraulic pumps (eHP) and the water displacement unit(eWDU). This is after improvements have been made for higher cycle speed operation (PilotPlant), and higher capacity (Commercial).
As a point of reference, for the low capacity operation, the specific energy consumption of aplunger pump without energy recovery is shown. In general low capacity systems usually do nothave energy recovery. This method is presently used in U. S. Army/Marines ROWPU (reverseosmosis water purification units). For the VRO Commercial unit, the conventional system is acentrifugal pump with Pelton wheel energy recovery, variable frequency drive, and sumppumping (CP-PW-VFD-SP).
2 9

6.4 Performance comparisons for the Santa Barbara Application
For the Economic Analysis, the existing Santa Barbara Seawater Desalination Facility is beingused as the reference plant to predict the cost of water. The facility has 12 trains of 0.6 MGD(2,270 m3/d) capacity. The pumping and energy recovery system for this facility incorporatescentrifugal pumps, Pelton wheel turbines, variable frequency drives, and also sump pumps todischarge the concentrate. FIGURE 6-4 provides a comparison of performance, using theequations in FIGURES 6-1 and 6-2.
CASE IDDESCRIPTION
I IVRO Pilot Plent vs Conven
I I Santa Barbara I
I I Seawater RO Seawater ROStart-Up De&Qll I I StN-Up I D&m I
PUMP 8 ENERGY RECOV. lYPEI I et665PSI I atQ55PSII I CP-PWMDSP I C P - P W - V F D S P
versus VARCRO Elect. Mtr. Drive I IvR~-EMD IVRO-EMD
CAPAClTYlTRAlN iMG0)RECOVERY RATIO
0.600 0.600R R 45.0% 45.0%
Number of trainsTotal Cepecity
OBfW3llW)FLOW RATPSKRAIN. GPM
FEED, GPMCONCENTRATEPRODUCT
PRESSURES (F’S11SUPPIVMembrane Pressure
trefsrellW)
M G Dm3ld
qFGqp
PSPM (PSI)DM (BAR)
12 127.2 7.2
27,252 21,252
926 926503 509417 417
S O 30665 96559.7 65.9
Membrane Prassure dropDirge fmm ER (if PW)D i i ti-om RFP.VRO.SP
NOTE: fw PW. box = 1
EFFICIENCIES. OVERALLVariable Freq. DriveEte&ic Motor
CONVENTIONAL SYSTEM:Cent or Plunger PumpTllrbiiS
s$dic energy consumption
VARl-RO SYSTEM:Hydraulic PumpsWater Displacement Unit
smc energy consumption
% savings
EX4e-FTR SanteBehOrig S/18/96
W 64 64
(100% = not included). Also MD not epplicebie lo VARI-RO.eVFDeEM
samvRO(%) 26% I 26% I
VRO Commerciel ve Conven.Bank Barbara
81665PSI I etQ55Ps1CP-PW-VFDSP I CP-PW-VFDSP
IVRC-EMD IVRO-EMD I
0.666 0.60045.0% 45.0%
12 127.2 7.2
27.252 27.252
926 926509 509417 417
30 30665 95559.7 65.9
94 640 00 0
91.6% 97.5%
-1
/igJEq
1 35% I 35% 1
FIGURE 6-4 VARI-RO System versus Method used at Santa Barbara
For this facility, the start-up membrane pressure was 865 PSI (60 BAR); and the design pressurewas 955 PSI (66 BAR). The higher design pressure provides a margin for membrane pressurevariation due to salinity, temperature, and fouling. For the assumed efficiencies, VARI-ROsystem energy consumption savings of 26% and 35% have been projected, for the VRO PilotPlant and VRO Commercial versus Conventional cases, respectively.
The effkiencies used for the centrifugal pumps, Pelton wheel turbines, variable frequency drives,and electric motors were provided by the facility contractor. The efficiencies for the VARI-ROsystem are based on extrapolations from the Pilot Plant test data, and data from equipmentmanufacturers for higher capacity units. The VRO Pilot Plant case is based on the lowestexpected efficiencies, and the VRO Commercial case is based on effkiencies that can reasonablybe expected for VARI-RO systems of higher capacity, in the 0.3 to 5 MGD (1,135 to 18,925m3/d) capacity range.
30
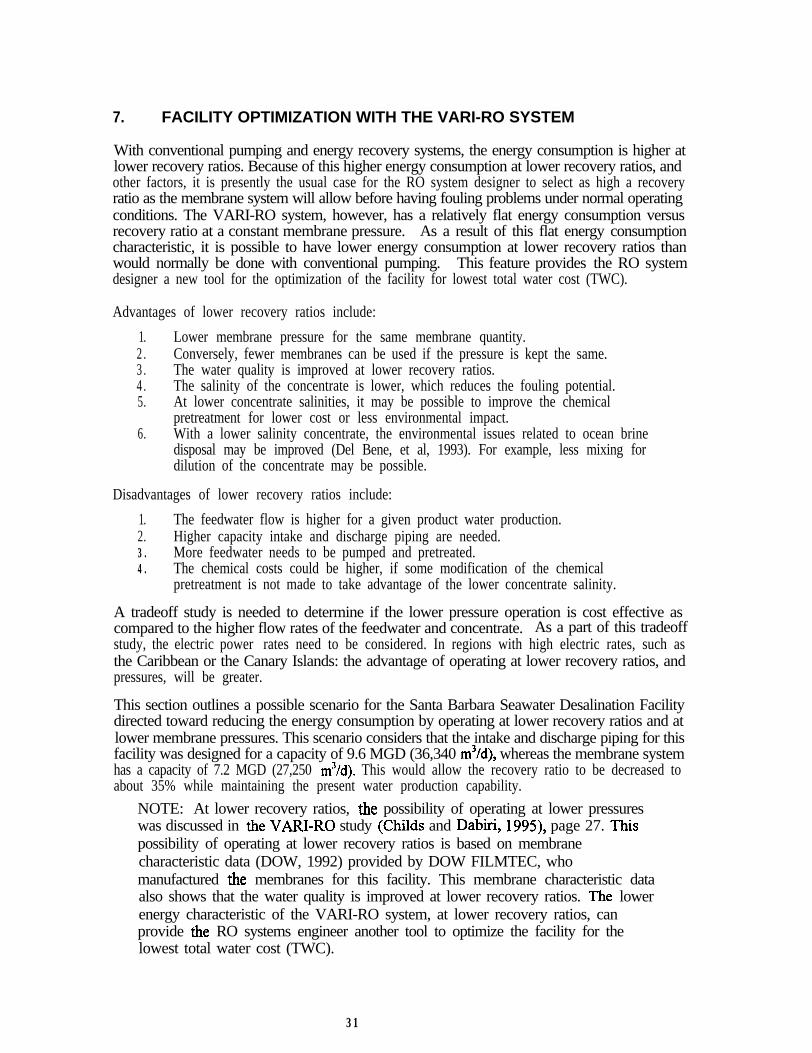
7. FACILITY OPTIMIZATION WITH THE VARI-RO SYSTEM
With conventional pumping and energy recovery systems, the energy consumption is higher atlower recovery ratios. Because of this higher energy consumption at lower recovery ratios, andother factors, it is presently the usual case for the RO system designer to select as high a recoveryratio as the membrane system will allow before having fouling problems under normal operatingconditions. The VARI-RO system, however, has a relatively flat energy consumption versusrecovery ratio at a constant membrane pressure. As a result of this flat energy consumptioncharacteristic, it is possible to have lower energy consumption at lower recovery ratios thanwould normally be done with conventional pumping. This feature provides the RO systemdesigner a new tool for the optimization of the facility for lowest total water cost (TWC).
Advantages of lower recovery ratios include:
1.2 .3 .4 .5.
6.
Lower membrane pressure for the same membrane quantity.Conversely, fewer membranes can be used if the pressure is kept the same.The water quality is improved at lower recovery ratios.The salinity of the concentrate is lower, which reduces the fouling potential.At lower concentrate salinities, it may be possible to improve the chemicalpretreatment for lower cost or less environmental impact.With a lower salinity concentrate, the environmental issues related to ocean brinedisposal may be improved (Del Bene, et al, 1993). For example, less mixing fordilution of the concentrate may be possible.
Disadvantages of lower recovery ratios include:
1.2.3 .4 .
The feedwater flow is higher for a given product water production.Higher capacity intake and discharge piping are needed.More feedwater needs to be pumped and pretreated.The chemical costs could be higher, if some modification of the chemicalpretreatment is not made to take advantage of the lower concentrate salinity.
A tradeoff study is needed to determine if the lower pressure operation is cost effective ascompared to the higher flow rates of the feedwater and concentrate. As a part of this tradeoffstudy, the electric power rates need to be considered. In regions with high electric rates, such asthe Caribbean or the Canary Islands: the advantage of operating at lower recovery ratios, andpressures, will be greater.
This section outlines a possible scenario for the Santa Barbara Seawater Desalination Facilitydirected toward reducing the energy consumption by operating at lower recovery ratios and atlower membrane pressures. This scenario considers that the intake and discharge piping for thisfacility was designed for a capacity of 9.6 MGD (36,340 m3/d), whereas the membrane systemhas a capacity of 7.2 MGD (27,250 m3/d). This would allow the recovery ratio to be decreased toabout 35% while maintaining the present water production capability.
NOTE: At lower recovery ratios, the possibility of operating at lower pressureswas discussed in the VARl-RO study (Cbilds and Dabiri, 1995), page 27. Thispossibility of operating at lower recovery ratios is based on membranecharacteristic data (DOW, 1992) provided by DOW FILMTEC, whomanufactured the membranes for this facility. This membrane characteristic dataalso shows that the water quality is improved at lower recovery ratios. The lowerenergy characteristic of the VARI-RO system, at lower recovery ratios, canprovide the RO systems engineer another tool to optimize the facility for thelowest total water cost (TWC).
31
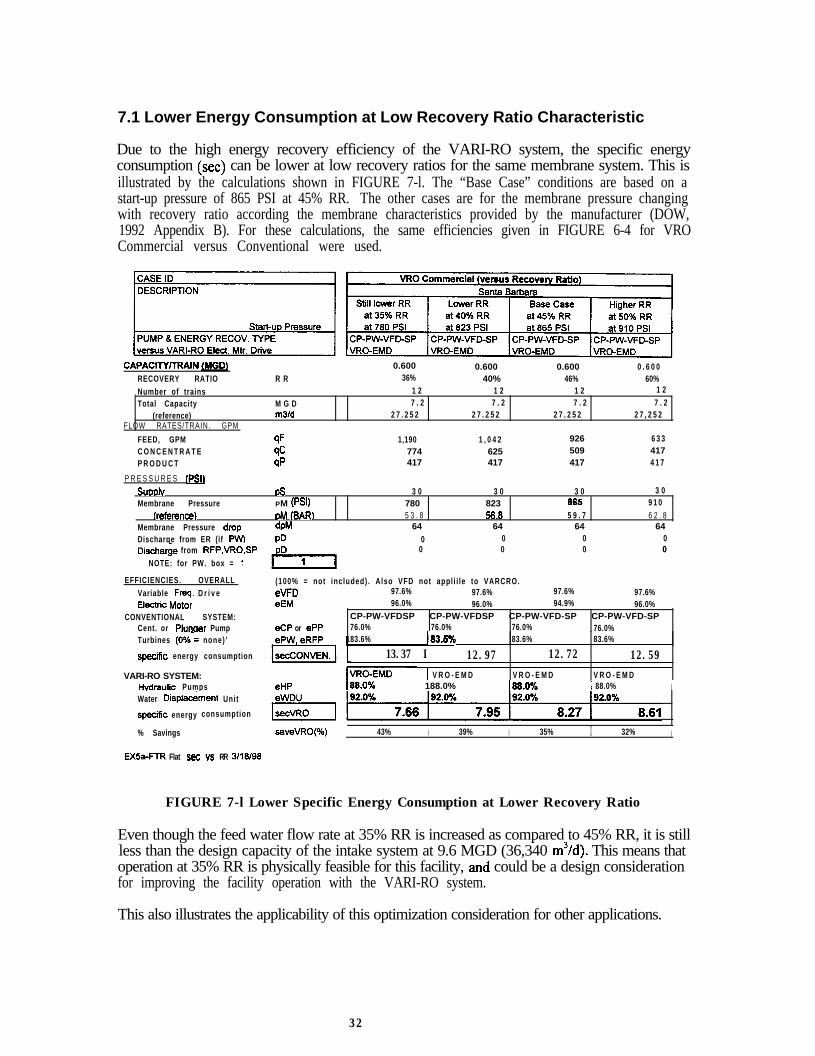
7.1 Lower Energy Consumption at Low Recovery Ratio Characteristic
Due to the high energy recovery efficiency of the VARI-RO system, the specific energyconsumption (set) can be lower at low recovery ratios for the same membrane system. This isillustrated by the calculations shown in FIGURE 7-l. The “Base Case” conditions are based on astart-up pressure of 865 PSI at 45% RR. The other cases are for the membrane pressure changingwith recovery ratio according the membrane characteristics provided by the manufacturer (DOW,1992 Appendix B). For these calculations, the same efficiencies given in FIGURE 6-4 for VROCommercial versus Conventional were used.
CAPACITYMN (MGDl 0.600 0.600 0.600 0 . 6 0 0RECOVERY RATIO R R 36% 40% 46% 60%
Number of trainsTotal Capacity
(reference)FLOW RATES/TRAIN. GPM
1 2 1 2 1 2 1 2
M G D 7 . 2 7 . 2 7 . 2 7 . 2m3ld 2 7 . 2 5 2 2 7 . 2 5 2 2 7 . 2 5 2 2 7 , 2 5 2
FEED, GPMC O N C E N T R A T EP R O D U C T
P R E S S U R E S (PSI)
qF 1,190 1 , 0 4 2 926 6 3 3
qc 774 625 509 417
qp 417 417 417 4 1 7
SUPDIV PS 3 0 3 0 3 0 3 0
Membrane Pressure PM (PSI) 780 823 066 9 1 0
Ireference) PM (BAR) 5 3 . 8 66.8 5 9 . 7 6 2 . 8Membrane Pressure drop W 64 64 64 64
Discharge from ER (if F’W) PD 0 0 0 00 0 0Discharge from RFP,VRO,SP
NOTE: for PW. box = I
0
EFFICIENCIES. OVERALL (100% = not included) . Also VFD not appl i i le to VARCRO.Variable Free. D r i v e eVFD 97.6% 97.6% 97.6% 97.6%
Elecbic laoto;CONVENTIONAL SYSTEM:
Cent. or Plunw Pump
eEM
eCP or ePP
96.0% 96.0% 94.9% 96.0%CP-PW-VFDSP CP-PW-VFDSP CP-PW-VFD-SP CP-PW-VFD-SP76.0% 76.0% 76.0% 76.0%
Turbines (O%= none) ’
specific energy consumption
VARI-RO SYSTEM:Hvdraulic Pumps eHP
183.6% 183.6% 83.6% 83.6%
13.37 I 12.97 12.72 12.591 V R O - E M D V R O - E M D V R O - E M D
[r 188.0% 188.0% i 88.0% IWater Displacement Unit
specih energy consumption
% Savings saveVRO(%) 43% I 39% I 35% I 32% I
Ex5a-FTR Flat set vs RR 3/16/96
FIGURE 7-l Lower Specific Energy Consumption at Lower Recovery Ratio
Even though the feed water flow rate at 35% RR is increased as compared to 45% RR, it is stillless than the design capacity of the intake system at 9.6 MGD (36,340 m3/d). This means thatoperation at 35% RR is physically feasible for this facility, and could be a design considerationfor improving the facility operation with the VARI-RO system.
This also illustrates the applicability of this optimization consideration for other applications.
32
As shown in FIGURE 7-2, with the conventional system the specific energy consumptionincreases from 12.72 to 13.37 kwh/kgal (3.36 to 3.53 kwh/m3) with a RR decrease from 45% to35%, respectively. Whereas, with the VARI-RO system the energy consumption decreases from8.27 to 7.66 kwh/kgal (2.18 to 2.02 kwh/m3) under the same conditions. The result is that theenergy consumption can actually be lower with the VARI-RO system at lower recovery ratios.
- secCONVEN. -+- secVRC --m--- saveVRO(%)
2 0 . 0 0 -
1 5 . 0 0 -
Lower RR Higher RR
Lower Pressure Base Case Higher Pressure
ck'3-37 m 12.59
1 0 . 0 0 -
e-7.58 -+.-o-e 8.51
5.00 43% 5 0 %----=----- --.------..32%
-- 25%
0.00 1 0 %
30% 3 5 % 40% 4 5 % 5 0 % 5 5 %
EX5a-FTR Flat set vs RR 3l18198Recovery Ratio, (RR), %
FIGURE 7-2 VARI-RO System, Lower Energy Use at Lower Recovery Ratios
In addition to saving energy, operation at lower recovery ratios could provide additionaladvantages, such as improved water quality, reduced membrane fouling potential, and lowersalinity in the discharge concentrate. The latter could reduce the need for further dilution prior todischarging the concentrate back to the source.
Operating at lower recovery ratios requires a tradeoff study to determine the most economicaloperation. In regions with higher electric power rates, the operation at lower recovery ratios maybe of particular advantage, and show a savings in total water cost (TWC).
For inland brackish water reverse osmosis (BWRO) applications, the disposal of the concentratecan be costly. This usually results in the use of high recovery ratios for the total facility. Thiscan be accomplished with lower recovery ratios for the first stages, and using subsequent stagesfor further concentration of the concentrate. A tradeoff study would be necessary to determine inthe high energy recovery efficiency of the VARI-RO system would provide operationaladvantages for these types of applications.
33

8. ECONOMIC ANALYSIS
A report by Laughlin Associates is included as Appendix C, entitled: “Economic Comparison ofVARI-RO vs. ConventionaI High Pressure Pumping and Energy Recovery Technology”(Laughlin, 1998). This report uses as the base case the 7.2 MGD (27,250 m3/d) seawaterdesalination facility at Santa Barbara, California. The present pumping system consists of 12trains of 0.6 MGD (2,270 m3/d) each at 45% recovery ratio. The initial operating pressure was865 PSI (59.6 BAR), and the design operating pressure for the facility is 955 PSI (65.8 BAR).The initial operating pressure is used for the comparative analysis of the VARI-RO system versusthe conventional system.
The conventional pumping and energy recovery system consists of centrifugal pumps, Peltonwheel energy recovery turbines, variable speed drives, and sump pumping to discharge theconcentrate back to the ocean (CP-PW-VFD-SP). The efficiencies for these components, used inthis comparison, were provided by the facility contractor. The method for calculating specificenergy consumption for the conventional system is given in FIGURE 6-2.
For the VARI-RO system, two cases are considered, which are identified as VARI-RO Pilot Plantand VARI-RO Commercial. The efficiencies for the hydraulic pumps and the water displacementunits were determined as follows. The Pilot Plant efficiencies are based on extrapolations fromthe Pilot Plant testing. The Commercial efftciencies are based on higher capacity units and amore mature design, where higher efficiencies are expected. The method for calculating specificenergy consumption for the VARI-RO system is given in FIGURE 6-l.
A comparative summary of the relative energy consumption between the VARI-RO systems andthe conventional system are shown in FIGURE 8-l. This information has been extracted fromthe Laughlin report. This shows an energy consumption savings of 26% and 35% for the VARI-RO Pilot Plant and Commercial systems, respectively. At an electric power rate of $O.O6/kwh,this is an annual savings of $0.486 and $0.646 million per year, respectively. The savings wouldbe even greater at higher electric power rates, and when the facility is operating at higheroperating pressures. The higher operating pressures can result from changes in salinity, feedwater temperature, and membrane fouling.
It should be noted that this analysis did not consider the losses attributed to the sump pumping.These losses would result from the efficiency of the electrical supply, electric motors, pumpingequipment, and flow throttling valves (if any). The sump pumping for the Santa Barbara facilitywas required to discharge the concentrate from the Pelton wheel energy recovery back to theocean. The VARI-RO system can take full discharge back pressure, and does not require aseparate sump pumping system.
The total water cost considers the capital cost of the facility, amortized over the expected life ofthe facility. In the case of this facility, the intake and outfall structures were sized for 9.6 MGD(36,300 m3/d) capacity, while the balance of the facility was sized for 7.2 MGD (27,250 m3/d). Itis expected that the total water cost would reduce if the facility was upgraded to full capacity.
Based on the system parameters for the 7.2 MGD (27,250 m3/d) capacity, the total water cost isgiven in FIGURE 8-1, which shows a savings of 5% and 8% for the VARI-RO Pilot Plant andCommercial units, respectively.
34

FACILITY PARAMETERSCapacity, MGDRecovery Ratio, %Membrane Pressure, PSIPlant Availability Factor, %
EFFICIENCIES, %Variable Frequency DriveElectric Motor
Centrifugal PumpPelton WheelSump Pump
Hydraulic PumpsWater Displacement Unit
SPECIFIC ENERGY CONSUMPTION, setHigh Pressure Pumping (HPP), kwh/kgalVARI-RO Savings, %
ECONOMIC COMPARISONElectric Power Rate, $/kwhAnnual Energy Cost for HPP, $million/yearVARI-RO Savings, $million/year
Total Water Cost, $/AFTotal Water Cost, $/m3Total Water Cost, $/kgalVARI-RO Savings, %
EX7a-FTR EconAnalSum 4/2/98
VARI-RO VARI-RO ConventionalPilot Plant Commercial Plant
7 .2 7 .2 7 .24 5 % 4 5 % 4 5 %865 865 865
9 2 % 92% 92%
97.5%95%
76%83%
(not considered in this comparison)
6 4 % 86%85% 92%
9.37 8.27 12.722 6 % 35%
0.06 0.06 0.061.359 1.200 1.8450.486 0.646
967 939 1,0240.785 0.761 0.830
2.97 2.68 3.145 % 8 %
FIGURE 8-l Economic Analysis Comparative Summary
A key consideration in the selection of high pressure pumping equipment is that after thedesalting facility has been placed in operation, the saving of operating expenses is of particularimportance. This analysis indicates that the VARI-RO system would save about $0.6 million peryear, which would be a saving of $6 million over a 10 year operating period for the 7.2 MGD(27,250 m3/d) facility. These savings would be even greater at higher electric power rates, and athigher operating pressures.
Another consideration is the potential to provide additional energy savings by operating at lowerrecovery ratios as discussed in Section 7.1. A tradeoff study would be needed to determine if thiswould result in lower total water cost. A desalting system design that operates at lower recoveryratios, and lower membrane pressures, would likely show water cost savings for regions withhigh electric power rates.
35
9. CONTINUED TECHNOLOGY DEVELOPMENT RECOMMENDATIONS
9.1 Pilot Plant Unit
There have been two primary goals for the present Pilot Plant unit, as follows:
1.2 .
To prove the function and operational benefits of the VARI-RO system.To prove the energy consumption potential with a low capacity unit, and projectthe energy consumption to higher capacity units.
With respect to these two goals, the project has been very successful. As the project progressedthrough the development phase certain items were identified for improvement. Some of theseimprovements have been incorporated, including:
. Electronic Controls and Data Accluisition Enhancements: Some improvementswere made to the computer software, which improved the data acquisition andanalysis.
. New energy recovery valves: Four out of 12 of a new design were manufacturedand installed. These valves have proven that the new design is a substantialimprovement over the original design. Not only does this design improvereliability, it also improves the appearance of the system.
. Recoverv ratio and internal dynamic seals: As part of the energy performanceimprovement, some water cylinder internal parts were changed. These changesincluded increasing the recovery ratio, using a ceramic ratio rod, and going to aspecial segmented ratio rod seal. These changes made a substantial improvementto the volumetric and mechanical efftciency, which resulted in the specific energyconsumption improvement from 11.7 to 9.0 1 kwh/kgal (see Section 5.4).
The planned future improvements include improving the functionality of the system, andreducing manufacturing cost for full-scale units. It would be desirable to test these improvementson a pilot scale basis before proceeding with a full-scale demonstration capacity unit. Some ofthese improvements include the following:
. Fiberglass reinforced plastic 0 barrels, and other de&n imwovements:For the Pilot Plant unit, and future full-scale units, conceptual design improvementshave been made. These design improvements indicate that manufacturing costs canbe reduced, and improvements made in reliability and maintainability for thecorrosive seawater environment. One improvement would be using FRP barrels inplace of stainless steel. The implementation of this change requires changes to thecylinder heads, porting, and valve interfaces, as mentioned below.
. Electronic Controls and Hydraulic Drive Unit: Update the performanceanalysis computations to agree with the latest methodology. Improve the controlresponse of the hydraulic pumps to assure that the pressure control will be suitablefor higher capacity units.
36
. New enerPY recoverv valves: Incorporate into the design the latest configurationthat evolved from the full-scale design effort, and incorporate a design interfacesuitable for the change to FRP barrels.
. Recoverv ratio and internal dynamic seals: Make necessary changes, andimprovements, to allow the FRP barrel change.
It is recommended that a program to continue the VARI-RO system development be undertaken.
9.2 Demonstration of Full-Scale Capacity Unit
It is recommended that a demonstration project be implemented to des$n, manufacture, and test afull-scale unit in the 300,000 to 600,000 GPD (1135 to 2,270 m /d) capacity range. Theobjectives for this project include the following:
. Show that the efficiency projections for a Commercial capacity unit can beachieved.
. Demonstrate to the desalting industry that the technology is viable and should beconsidered as a preferred method for future desalting plants, and as a retrofit forexisting facilities.
. Put the VARI-RO system side-by-side with a conventional system to show theinstallation, operational, and energy saving features of the technology.
37

10. BIBLIOGRAPHY
Childs, Willard D., Ali E. Dabiri, Ph. D.; “Desalination Cost Savings of VARI-ROTMPumping Technology”, National Water Supply Improvement Association (NWSIA)conference, Newport Beach, California, August 1992.
Childs, Willard D., Ali E. Dabiri, Ph. D.; “VARI-RO TM “Low Energy” Desalting for theSan Diego Region”, American Desalination Association (ADA) conference, Florida,August 1994.
Childs, Willard D., Ali E. Dabiri, Ph. D.; “VARI-ROTM “Low Energy” Desalting for theSan Diego Region”, (the VARY-RO study), Final Technical Report, WTTP ReportNo. 4, Bureau of Reclamation, June 1995.
Del Bene, J. V.; Gerhard Jirka; John Largier; “Ocean Brine Disposal”, IDA WorldConference on Desalination, Yokohama, Japan, VOL. II, page. 89, November 3-6,1993.
DOW Chemical Company (Loos, John F.); “Performance Projections of FILMTECMembranes at Various Recovery Ratios”, letter report dated April 10, 1992.
Laughlin, Jack K., Laughlin Associates, “Economic Comparison of VARI-RO vs.Conventional High Pressure Pumping and Energy Recovery Technology”,March 1998.
Silbemagel, Mark A., NFESC, “Trip report San Pasqual Water Reclamation Facility toobserve testing of the VAR.&R0 prototype pump”, 3 1 August 1997.
38

Appendix A
Test Reporting fromNaval Seawater Desalination Laboratory
Naval Facilities Engineering Service Center (NFESC)
39

31 August 1997
TO: Wilt ChRds, VARI-RO Power Co.FROM: Mark A. Silbemagef, U.S. Naval Facilities Engineering Service Center
Seawater Desalination Test Facility1100 23d AvePort Hueneme, CA 93043
SUBJ: Trip report San Pasqual Water Reclamation Facility to observe testing of theVARI-RO prutotype pump.
The following report summarizes NFESC’s evaluation of the VARI-RO pump for reverseosmosis systems. The report is in chronological order with specific recommendationsand overall test summary provided at the end.
17 July 1997 Pre-test Trip to Inspect Pump and Test S&IQ:
On 17 July 1997 a tip was made to the San Pasqual Water Reclamation Facility toobserve testing of the VARbRO prototype pump. The purpose of the trip was tobecome familiar with the design and operation of the pump and to evaluate the testsetup. Based on this trip, an additional trip was scheduled for 6 to 8 August 1997 to
assist in a performance evaluation Of the pump. The following suggestions were madein order to conduct the performance evaluation:
l Prepare a means of timing and weighing the concentrate and permeate ROWrates in order to verify volumetric efficiencies. A 55 gallon capacity drumand 1000 lb. range scak was judged to be adequate wKch should give aflow measurement accuracy of less than 0.2%.
= Install a new concentrate pressure gauge to measure the pressure of thede-pressurized concentrate.
s Install vacuum gauge in the suction line for the hydrostatic pumps to verifyadequate suction pressure to the hydrostatic pumps.
rn Check high pressure relief valve located in the feed pressure header toverify that it is not relieving during normal operation.
. NFESC would provide a dead weight tester to verify transducer calibration.
9 Get SDG8E to provide an additional means of verifying the powermeasurement since this measurement is critical to the evaluation.
l Conduct tests with the gas charged dampener located in the feed pressureheader valved on in order to reduce pulsation. Peak to peak pulsations’were measured for test run 717014 at 844 psi operating pressure withoutthe dampener and 822 psi operating pressure with the dampener. The peak
\_
4 0

to peak vafues were z&ppmhateIy 155 psi without the dampener and 69 psiwith the dampener. This test showed that the pulsaticn levels of theprototype pump withuut the dampener definitefy exceed the recommended+J- 5% of operating prctssure (Pumping Manual, by R-H. Warring, 7”Edition, pg. 303.). In some cases, the manual recommends a +I- 2% criteriabe used. On typical plunger pump tests we conducted at NFESC we weremeasuring peak to peak pressures of less than 50 psi with dampenersi~Sblled.
l It was also noticed that significant pukations were present in the suctiiheader based on the oscilMons observed on the suction header pressuregauge. ‘These sh0u1d be measured to verify that they are not causing a lowNPSH condition in the suction header.
l &-check the range of the power meter in&Ned to see if better accuracycould be obtainable through multiple wraps through the current transformers.
6 August 1997 Review of Test Setup and Transducer Calibration:
On 6 August the pressure transducer calibration was checked using a dead weighttester by first calibrating the test gauge over a range of 338 to 964 psi and then thetransducers were calibrated according to the test gauge. This method was performedto avoid getting oil from the dead weight tester in the transducers and the transducermanifold. The test gauge showed an accuracy of approximately 0.8% over thecalibration range compared to tie dead weight tester. The transducers were thencalibrated according to the test gauge.
The Load Controls power meter installed on the VARf-RO unit is a 30 hp range unit SOadditional wraps through the CT were not necessary to obtain any more accuratemeasurements.
The tank and scale for Bow rate measurements were inspected and judged to be morethan adequate for getting accurate flow measurements to within 0.3%.
Two software configurations were setup on the pump control and data collectionprogram. One configuration would utilize the differential pressure transducer and thesecond or default configuration would utilize the hydraulic cylinder transducers.
A O-100 psi range pressure gauge was installed in the de-pressurized concentrate line.
The equations for calculating the efficiencies were reviewed.
A performance evaluation plan was developed which would indude test runs at 800and 600 psi for cycie speeds of 12,6, and 9 cycfes per minute (cpm). Theperformance evaluation would indude:
l Stroke and cycle speed would be verified.l Flow rates would be measured by weighing the water (converting to gallons
assuming a density of 8.34 lb./gal) and timing the flow.
41

l The ba(d v&e for simulating membrane pressure drop would be set to give a50 psi differentid when qm-atii at 800 psi and I2 cpm The diierentialpressure muid then be measured for l &e same valve setting at 800 psi andspeeds of 6 and 9 cpm.
w Comparisons of power measurements wouid be made between the metersupplied by SDG&E and the Load Controls power meter installed on theunit.
- After the performance measurements, leakage tests on the cylinders wouldbe performed by dosing the ER valves manually and stroking the hydrauliccyfinders individually.
7 - 8 Auaust 1997 Performance Testins:
In the differential pr8ssure software configuration, the valve for simulating membranepressure drop was adjusted to give a.52 psi differential at 12 cpm speed and 800 psi(test run 807002 and 807003). The valve was then left in the same position and thepressurg drop was measurt?d at 33 psi at 9 cpm (test run 807065), and 14.5 psi at 6cpm (test run 807004). These values w&d be manually e&wed in-to the data analysisspreadsheet. The software configuration was then changed to the default configurationwith transducers located on the hydrauiic cylinders.
The measured cycle speed was v8fified by timing and counting the strokes and wasfound to be within 0.5%. The measured stroke was verified and was found to be wi&1% {test run 807001). The measured Stroke by th8 position sensors is probably moreaccurate then what we could verify through a manual measurement
The SDG&E power meter was installed. The power meter was a Synergistic ControlSystems Model Cl20E meter/tecardet. Since the unit was equipped with 100 ampcurrent transducers (CT), three turns of wire were routed through the CTs to improvethe accuracy of the measurement Power measurements from the meter were thendivided by 3 for comparison to the Load Controls meter. The SDG&E meterconsistently read higher than the Load Controls meter by about 4.1Y0 in the 14.5 kwrange and 7.1% in the 7 kW range. The reiationship was very {inear with the
load controls mefer reading = -0.9832’SDGE meter - 0.3695 R’ = 1.0An additional meter was installed after the 7 - 8 August test period with catibratiancurves provided by VARI-RO. The third meter readings have been used in theanalyses as it was felt that this meter was the more aCCUfat8 of the three metersinstalled. (see note on power measurement recommendations)
The performance testing was then started with test runs at 806 and 600 psi for 12.6,and 9 cpm.
Results of Performance Tests:The results of the performance tests labeled run numbers 807006B throu&~ 807072have been summ&ed in detail by VARI-RO in the various spreadsheets-entitledHYDRAUUC POWER SlJPPf Y (HPS) AND WATER DlSPLACEMENT UNlT(u/DU)EFFlClENCY EVALUATION AND PROJECTlONS FOR THE VARY-RO SYSTEM. The- - - -e_-
42
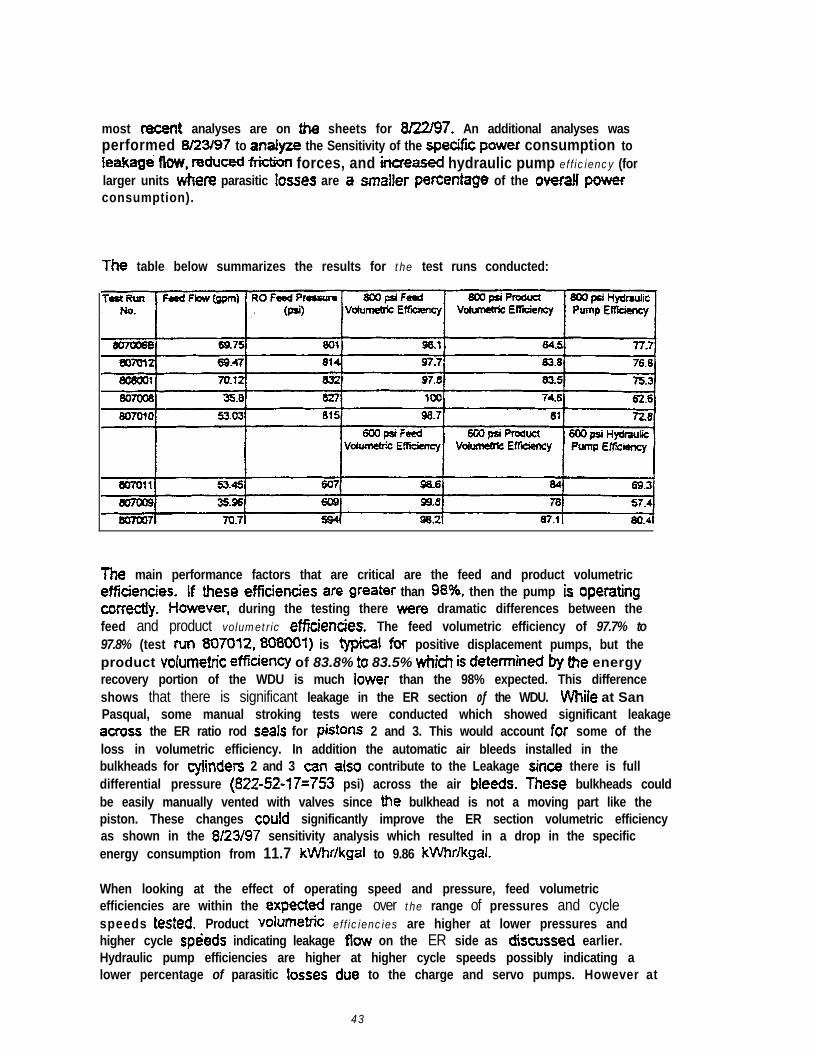
most recent analyses are on the sheets for 8fZZ97. An additional analyses wasperformed 8/B/97 to analyze the Sensitivity of the specific power consumption toleakagei flow, m&iced frictron forces, and incfeased hydraulic pump efficiency (forlarger units tier8 parasitic toSS8S are a smaller percentage of the overaH powerconsumption).
Th8 table below summarizes the results for the test runs conducted:
The main performance factors that are critical are the feed and product volumetric8ffid8nCi8S. If these 8ffki8nCieS afe greater than 98%, then the pump iS Op8ratingcorrectly. However, during the testing there were dramatic differences between thefeed and product volumetric effici8nci8s. The feed volumetric efficiency of 97.7% to97.8% (test MI 807012,808~1) is typical for positive displacement pumps, but theproduct volum8tn’C 8fiCi8nCy of 83.8% t0 83.5% wffch is d8t8rhIed by th8 energyrecovery portion of the WDU is much iower than the 98% expected. This differenceshows that there is significant leakage in the ER section of the WDU. While at SanPasqual, some manual stroking tests were conducted which showed significant leakageacross the ER ratio rod Seals for pistons 2 and 3. This would account for some of theloss in volumetric efficiency. In addition the automatic air bleeds installed in thebulkheads for C@d8rj 2 and 3 can aiS contribute to the Leakage since there is fulldifferential pressure (822~52-17=753 psi) across the air bleeds. These bulkheads couldbe easily manually vented with valves since the bulkhead is not a moving part like thepiston. These changes could significantly improve the ER section volumetric efficiencyas shown in the 8/23/97 sensitivity analysis which resulted in a drop in the specificenergy consumption from 11.7 kWhr/kgal to 9.86 kWhr/kgaf.
When looking at the effect of operating speed and pressure, feed volumetricefficiencies are within the expected range over the range of pressures and cyclespeeds tested. Product vokrm8tric efficiencies are higher at lower pressures andhigher cycle spieds indicating leakage flow on the ER side as discuss8d earlier.Hydraulic pump efficiencies are higher at higher cycle speeds possibly indicating alower percentage of parasitic kXs8s due to the charge and servo pumps. However at
43
the 12 cpm sped (70 gpm flow) the hydrauiic pump effkziency is lower at 600 psivem~s 800 psi which amid indicate some leakage Row fof the hydraulic cylinders at thehigher pressures.
Additional measurements were made on a/8/97 to determine the idle power in the HPSsystem, This power is due to the charge pumps and the servo pump. Assuming an80% motor efficiency at 15% of fuJl load the parasitic losses are approximately 2.52kW. At normal operating pressure of 800 psi and 12 cpm this parasitic loss isapproximately 17% of the power. This Ioss measurement has also been incorporatedinto the spreadsheet
Overill Summaw of Test Results:
Then overall results of the testing have shown a specific power consumption of 11.7kWhr/kgal at 800 p&i operating pressure. This is as law as any commercially avaitabiesystem. With projected improvements in the ER volumetric efficiency, there is noreason that the specific power consumption shouk! not fall into the 8 to 10 kWhr/kgal.
VARI-RO Pump Recommendations:
It would be better if all the hydraulic pumps were identical since one of the pumps is notoperating at maximum displacement and is pro&ably causing some efficiency lasses
Eliminate automatic air bleeds wherever possible.
Power Measurement Recommendations:
Power measurements are critical to evaluating the performance and concern mebecause there is significant variability between the three meters. I have had samediscussions with electrica engineers at NFESC who are experts in powermeasurement. They see no reason why a $500 to $1000 meter should not give anaccuracy of 0.596. This cost range is typical of power meters installed by utilities. Utilitypower meters must meet a minimum of 7% accuracy with OS% the typical accuracy ofmeters installed. The critical factor in power measurement is calibration of the powermeter with the CT’s that are used with the meter. The CT’s are tile main source of errorin power measurement. Examining the numbers you took for the latest meter whereyou averaged them, the standard deviations are too high to be able to say that meter ismore accurate than the Load Controls meter. At this po*int I tend to be!ieve the LoadControls meter since t know it was calibrated with the CTs and that the averagingtechnique of the computer is probably better than manuaify recording numbers andaveraging them. One other suggestion our expMs had was to insM a kWhr meter likeis used for residential use and then monitor kWhr over a reasonable time period andthen back out the power.
Test Setup Recommendations:
44
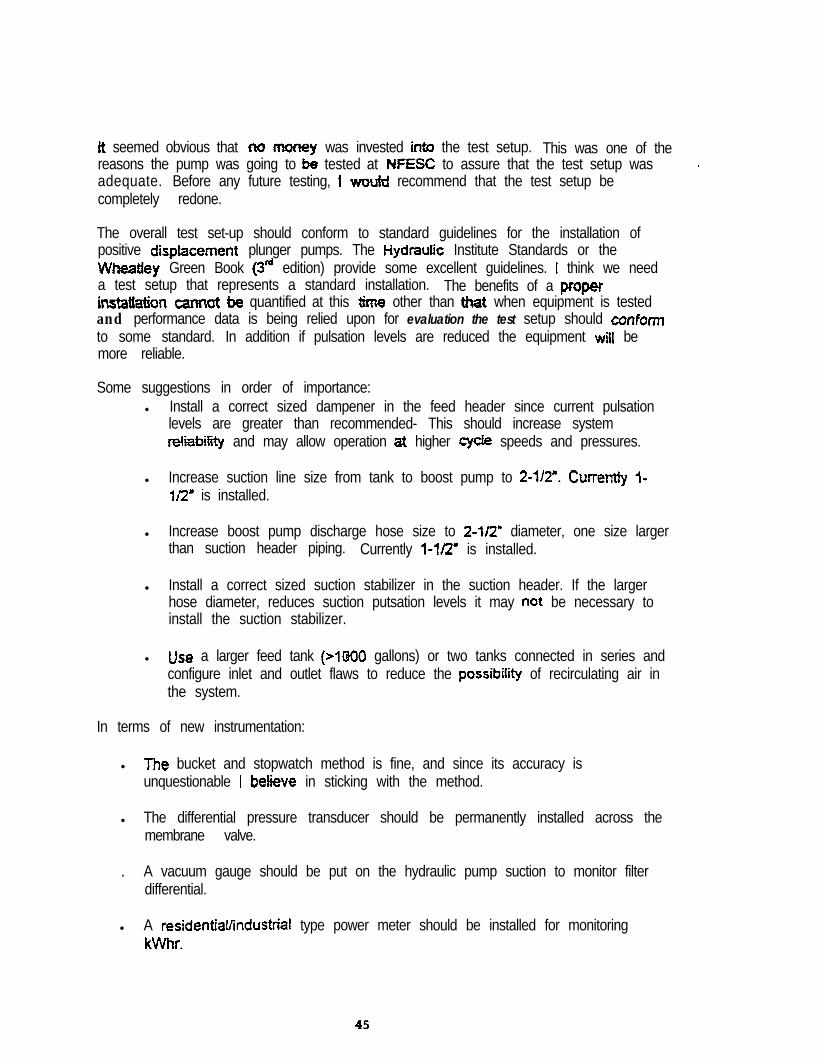
it seemed obvious that no mmey was invested into the test setup. This was one of thereasons the pump was going to be tested at NFESC to assure that the test setup was aadequate. Before any future testing, 1 would recommend that the test setup becompletely redone.
The overall test set-up should conform to standard guidelines for the installation ofpositive dispfacement plunger pumps. The Hydraulic Institute Standards or theWheatJey Green Book {3d edition) provide some excellent guidelines. 1 think we needa test setup that represents a standard installation. The benefits of a propsinstatt&on cannut be quantified at this time other than that when equipment is testedand performance data is being relied upon for evaluation the test setup should wnfomto some standard. In addition if pulsation levels are reduced the equipment will bemore reliable.
Some suggestions in order of importance:l Install a correct sized dampener in the feed header since current pulsation
levels are greater than recommended- This should increase systemtdiatitity and may allow operation at higher cycIe speeds and pressures.
l Increase suction line size from tank to boost pump to 2-j/2-. Currentiy 1-112’ is installed.
l Increase boost pump discharge hose size to Z-IQ” diameter, one size largerthan suction header piping. Currently l-142” is installed.
l Install a correct sized suction stabilizer in the suction header. If the largerhose diameter, reduces suction putsation levels it may not be necessary toinstall the suction stabilizer.
l Use a larger feed tank (>lCaOO gallons) or two tanks connected in series andconfigure inlet and outlet flaws to reduce the possibility of recirculating air inthe system.
In terms of new instrumentation:
l The bucket and stopwatch method is fine, and since its accuracy isunquestionable 1 bekeve in sticking with the method.
l The differential pressure transducer should be permanently installed across themembrane valve.
. A vacuum gauge should be put on the hydraulic pump suction to monitor filterdifferential.
l A residentiaf/industriaI type power meter should be installed for monitoringkWhr.
45
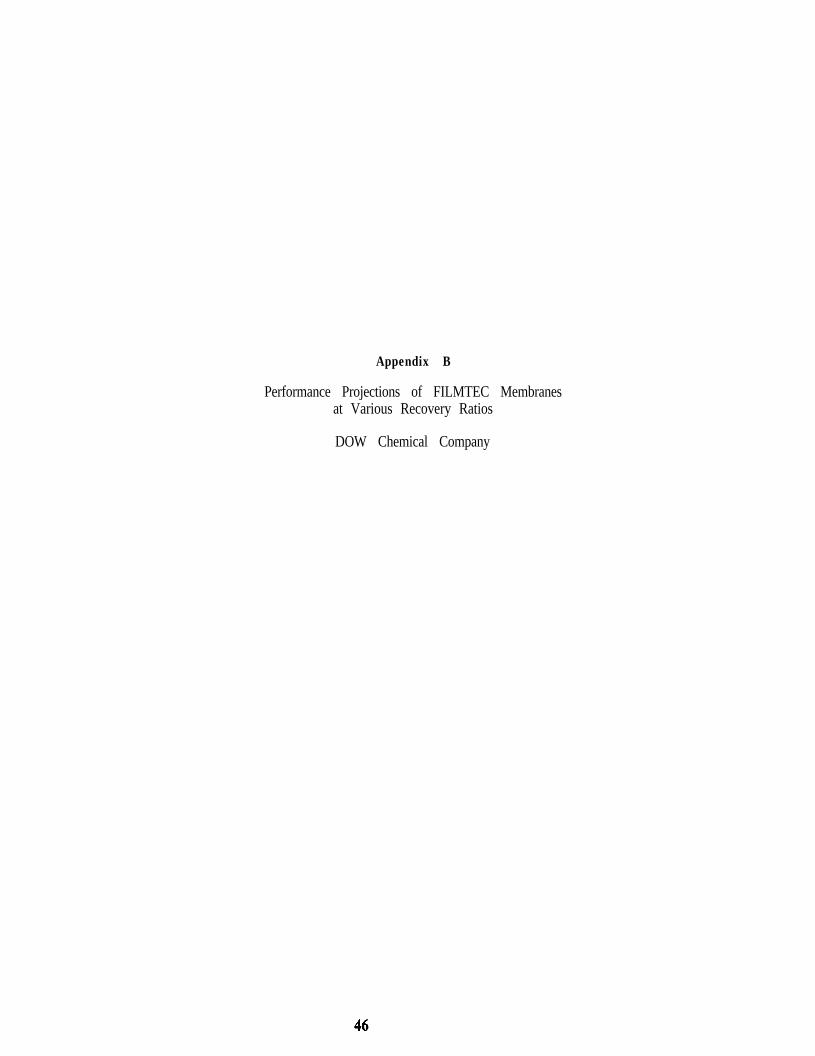
Appendix B
Performance Projections of FILMTEC Membranesat Various Recovery Ratios
DOW Chemical Company

Dow4.I.S.A. ’The OCW Chemccal ampany
10919 Tecnnoror~ Placefar 3.aoc r;, ;z:;:
61: . 485-7840
April 10, 1992
Willard ChildsSAIC'4161 Campus Point CourtSan Diego, CA 92121
Performance Projectionsof F?LMTEC Mernhanesat Various Recovery Ratios
Dear Will,
Attached are computer performance projections for variousreverse osmosis configurations operating on normal seawater(36143 mg/l TDS) at 17OC. I arbitrarily chose to size a 1.0HGD system operating over a recovery range of 50 to 20%recovery.
To determine the amount of membrane required, using ifouling factor = 0.80, I varied the amount of membrane untilthe projected operating pressure was as near to 1,000 psi aspossible* With this membrane/pressure vessel configurationthus defined, I then ran the svstem with a foulins factor =sand calculated the projected operating pressures. Allof these calculations are based on using, FilmTec modelSW3OXR-8040 membrane elements.
Computer print-out pages 1-28 show these calculations. Thefollowing lists the various parameters as a function ofrecnvery:
REDUCED MEMBRANE QUAM O~ONRecovery No. of Type of No. of Permeate Permeate .
0 Elements P.V. P.V. TDS Flux-GFD
50 4 7 6 7 Elem. 68 425 7.145 420 7 Elexn. 60 347 8.140 378 7 Elem. 54 298 9.035. 350 7 Elem,. 50 261 9.730 324 6 Elem. 54 230 10.525 304 .3 Elem. 76 210 11.12 0 288 4 Elem. 72 190 11.7
For the secund group of calxlations I selected the amountof membrane used in the 45% recovery case above, i.e., 420FilmTec model SW3OHR-8040 membrane elements. With this keptconstant, I varied the projected operating pressure toproduce 1.0 MGD of permeate at izhe various recoveries. Theprojected performance print-outs are shown on attached pages29-42 an summarized below.
4 7
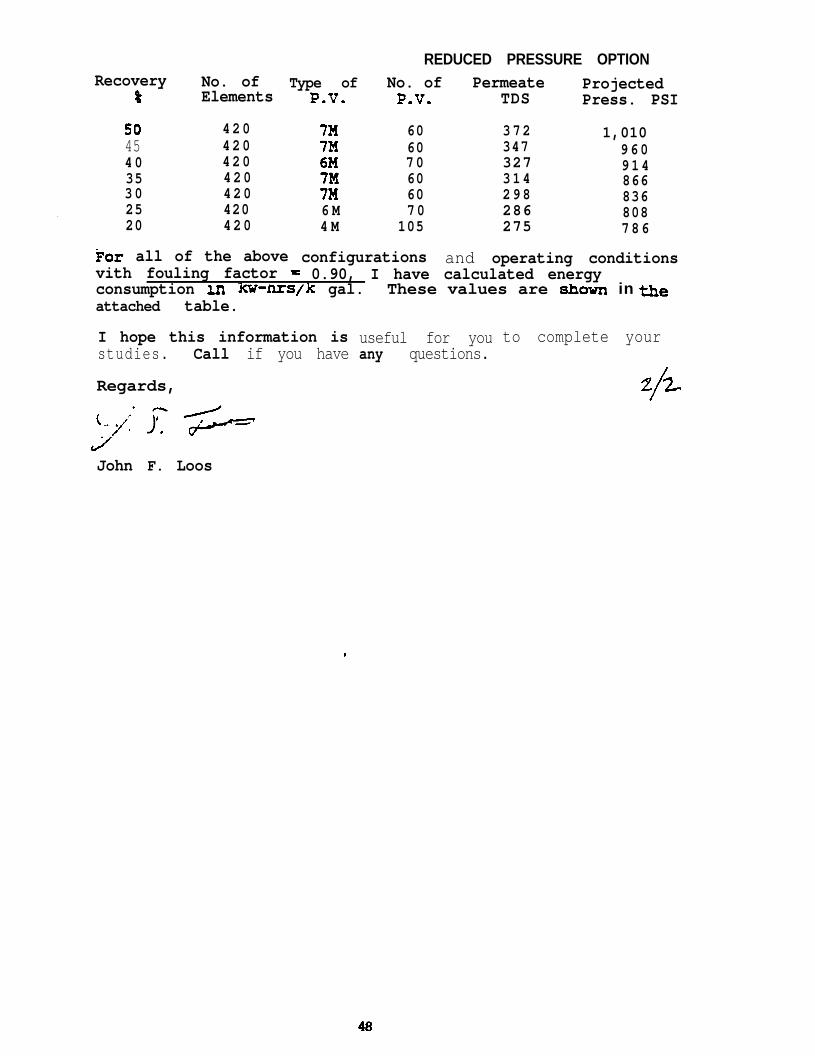
REDUCED PRESSURE OPTIONRecovery No. of Type of No. of Permeate
z Elements P.V.Projected
P.V. TDS Press. PSI
50 4 2 0 7x 60 3 7 245 4 2 0 7M
1,01060 347 9 6 0
4 0 4 2 0 6M 70 327 91435 4 2 0 7M 60 3 1 4 8663 0 4 2 0 7M 60 2 9 8 83625 420 6 M 7 0 286 80820 4 2 0 4 M 105 275 786
For all of the abovevith fouling factor =
configurations and operating conditions0.90, I have calculated energy
consumption m Ku-*s/k gal. These values are 8hovn in theattached table.
I hope this information isstudies. Call if you have
Regards,
useful for youany questions.
to complete your
2/Z
John F. Loos
48
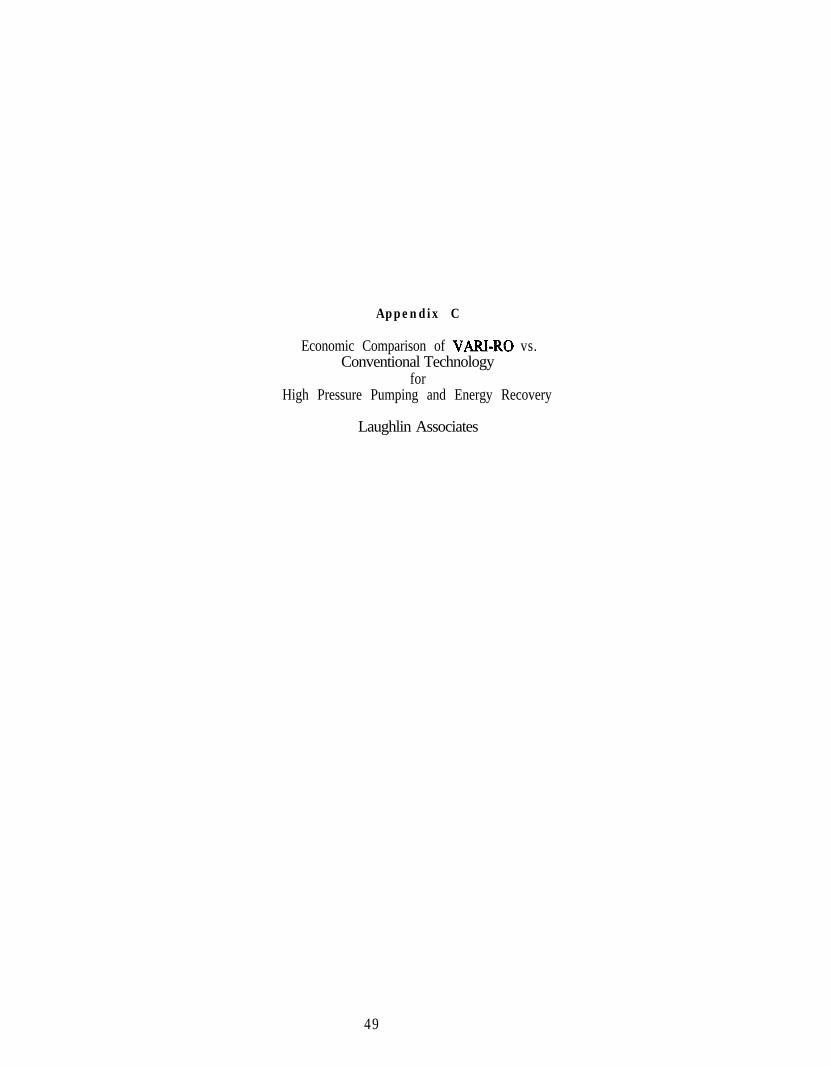
Appendix C
Economic Comparison of VARI-RO vs.Conventional Technology
forHigh Pressure Pumping and Energy Recovery
Laughlin Associates
49

ECONOMIC COMPARISON OF VARI-RO vs. CONVENTIONALHIGH PRESSURE PUMPING AND ENERGY RECOVERY TECHNOLOGY
1.0 INTRODUCTION
This report summarizes an economic comparison of VARI-RO versus conventional high pressurepumping and energy recovery technology in a full-scale seawater reverse osmosis desalting plant.The comparison is based on capital cost and performance data from the 7.2 MGD Santa BarbaraDesalting Plant which is located in Santa Barbara, California. The financing assumptions for theoriginal Santa Barbara plant were modified to reflect 1997 dollars and a 30 year plant financiallife.
Performance assumptions for the VARI-RO system were developed through a pilot plant testingprogram conducted at the City of San Diego’s San Pasqual Water Reclamation Plant. Theseassumptions were confirmed by U.S. Navy participants in the project. Capital cost data forVARl-RO equipment were provided by VARI-RO, based on estimates by participating suppliers.The analysis of VARI-RO performance and cost factors was conducted over a two year periodinvolving several stages of component and pilot plant testing and economic modeling.
2.0 REFERENCE DESALTING PLANT DESCRIPTION
The 7.2 MGD Santa Barbara Desalting Plant was chosen as a reference for this study because itrepresents the largest operational seawater RO desalting plant on the West Coast of the UnitedStates. The plant was designed and installed by Ionics Incorporated for the City of SantaBarbara. The plant was operated for a brief period of time, then shutdown because the drought inCalifornia diminished and lower cost water supplies became available. The plant has beenincorporated as a permanent part of Santa Barbara’s water supply and will be operated if futurewater supply shortages are encountered.
The reference desalting plant includes the following major components
0 Seawater supply system0 Pretreatment systeml High pressure pumping and energy recovery systeml Seawater RO plantl Product water treatment and storage systeml Concentrate disposal system
The plant was designed for a total product water capacity of 9.6 MGD at a recovery ratio of 45%.The initial phase of construction provided full capacity systems for the seawater supply system,the product treatment and storage system and the concentrate disposal system. The other systemswere designed for the initial capacity of 7.2 MGD.
The seawater supply system includes an offshore intake with submersible pumps which pumpwater to the pretreatment system. The pretreatment system includes chemical addition andhorizontal pressure filters. Filter backwash is treated in a clarifier, then routed to the
50

concentrate discharge system for ocean disposal. From the pressure filters, feedwater atapproximately 30 psi is routed to twelve RO trains each with a product water capacity of 600,000gallons per day (gpd).
Each seawater RO train is supplied by a high pressure feed pump with a Pelton wheel for energyrecovery. The RO plant includes banks of thin film composite spiral membrane elementsoperating at a design feedwater pressure of 955 psi.
Product water is transferred to a holding tank where chemicals are added prior to transfer to anearby water main. Concentrate from the energy recovery units is routed to a local sewagetreatment plant where it is combined with sewage effluent and discharged through an oceanoutfall.
3.0 ECONOMIC ANALYSIS
The process and economic comparisons of VARI-RO versus conventional pumping and energyrecovery technology are shown on Tables 3-l and 3.2 and summarized on Table 3.3. Thecomparisons include two cases for VARI-RO performance: (1) “Pilot Plant” and (2)“Commercial”, The Pilot Plant case is based directly on pilot plant performance data, withcapital cost for VARI-RO estimated in manufacturing lots of ten. The Commercial case assumesdesign and production improvements in full-scale units which result in higher energy efficienciesand lower capital costs. Reference desalting plant costs are based on 1992 project data, escalatedto 1997 dollars.
3.1 Process Design Assumptions and Data Sources
The process assumptions for the reference desalting plant were provided by the turnkeyequipment supplier, Ionics Incorporated of Watertown, Massachusetts. The process designreflects equipment and RO membrane element technology which was state-of-the-art when theplant was commissioned in 1992.
The process design assumptions for VARI-RO equipment were provided by Vari-PowerCompany and confirmed by Navy participants in the pilot plant test program.
3.1.1 Conventional Pumping and Energy Recovery System Assumptions
The high pressure pumping and energy recovery system for each train includes an electric motorsized for the net energy of the high pressure pump and Pelton wheel , a variable frequency drive(VFD), a high pressure pump and a Pelton wheel. The high pressure pumps are horizontalmultistage centrifugal units provided by Dresser Industries. The motor, VFD, pump and Peltonwheel are mounted as an integral assembly. The pumps have a design pressure of 955 psi and aninitial operating pressure of approximately 865 psi. The pump efficiency at rated designconditions is 76%. The Pelton wheel efficiency is rated at 83%. The combined specific energyof the high pressure pumping and energy recovery system is rated at 12.72 kilowatt hours per1,000 gallons of product (kwh/kgal) at a feedwater pressure of 865 psi.
51

3.1.2 VARI-RO Pumping and Energy Recovery System Assumptions
VARI-RO technology is assumed to operate at the same flow and pressure conditions as theconventional pumping and energy recovery system technology. Efficiencies assumed for VARI-RO equipment for the Pilot Plant and Commercial cases are shown on Table 3.1. The hydraulicdrive effkiency is 84% for the Pilot Plant case and 88% for the Commercial case. Theimprovement in hydraulic unit efficiency for the Commercial case is based on specificimprovements in hydraulic system design and scale-up to larger units.
The efficiencies assumed for the water displacement unit are 85% for the Pilot Plant case and92% for the Commercial case. The Pilot Plant case efficiency was calculated from pilot testresults. The efficiencies assumed for the Commercial case were estimated based onimprovements in internal leakage rate and other design factors.
The specific energy factor of 9.37 kwhkgal for the Pilot Plant case was calculated by VARI-RObased on pilot plant results, assuming a feedwater pressure of 865 psi and an RO system recoveryof 45%. The specific energy value of 8.27 kwhkgal for the commercial case was calculated byVARI-RO, based on efficiency improvements in the hydraulic drive system and the waterdisplacement unit.
3.2 Economic Assumptions and Data Sources
Economic assumptions and comparative results are shown on Table 3.2. The installed capitalcost of major components for the reference desalting plant was provided by Ionics based on theoriginal 1992 project costs. These costs were escalated at an average CPI rate of 2.7% per yearto 1997 dollars for the study. The capital costs of VARI-RO high pressure pumping and energyrecovery equipment for the Pilot Plant case were estimated by the equipment suppliers involvedin the pilot test program, assuming manufacturing lots of ten. These costs were reduced by 15%for the Commercial case, assuming improved production methods and increased productionquantities.
Engineering, environmental and permitting costs were provided by Ionics in 1992 dollars andescalated to 1997 dollars. The cost of electricity was assumed as $O.O6/kwh. A sensitivityanalysis was conducted to determine the effect of power costs ranging from $O.O4/kgal to$O.l6/kgal. The cost of chemicals, insurance and miscellaneous, solid waste disposal andoperating labor were estimated from typical values for operating seawater desalting plants. Themaintenance factor of 2% of the installed capital cost was provided by Ionics, along with themembrane replacement cost. Operating labor and maintenance factors were assumed to be thesame for VARI-RO equipment and conventional equipment.
Total water cost in $/acre-ft was calculated on a basis of annualized capital cost plus first yearoperating and maintenance cost. The annualized capital cost calculation assumed a cost ofcapital of 6.5% and a 30 year plant life. These economic assumptions differ from the originalSanta Barbara project, which started with a five year water purchase contract with Ionics andfollowed with a purchase of the system by the City of Santa Barbara.
52

Table: 3.1Process Assumption and EI
DESCRIPTION
IE
Ibasic Process Factors‘ype of Service:eedwater Salinity, ppm TDS:eedwater Temperature Range, deg C‘ype of RO Element!ecovery Ratio, %‘otal Product Water Capacity, mgdlo. of RO Trains‘roduct Water Capacity Per Train, mgd‘Iant Availability Factor, %innual Water Production Rate, mgdinnual Water Production, mgal
IP Pumping and Energy Recovery System PCiP Pump Inlet Pressure, psiiP Pump Design Discharge Pressure, psi(P Pump Operating Pressure, psi<O Unit Differential Pressure, psidiR Unit Inlet Pressure, psiiR Unit Discharge Pressure, psiElectric Motor Efficiency,%SARI-RO HP Pumping and ER System
VARI-RO Hydraulic Drive Efficiency,%VARI-RO Water Displacement UnitEfficiency,%VARI-RO Net Power Per Train, kwTotal VARI-RO System Power, kwVARI-RO Specific Energy, kwh/kgal
>onventional HP Pumping and ER SystemVariable Frequency Drive Efficiency,%Centrifugal Pump Efficiency,%Energy Recovery Unit Efficiency,%Centrifugal Pump Net Power Per Train, kwCentrifugal Pump Total Power, kwCentrifugal Pump Specific Energy, kwh/kgal
lncillary Power-ieawater Supply Pumps Total Power, kw‘roduct Water and Concentrate Transfer Pumps
Total Power, kw‘otal Ancilliaty Power, kwrncillary Specific Energy, kwh/lOOO gal
‘otai Power‘otal Power, kw‘otal Specific Energy, kwh/lOOO gal
53
!rgy CalculationsVARI-RO VARI-ROPilot Plant Commercial
Seawater Seawater34,000 34,000
11 to 19 11 to ISSpiral TFC Spiral TFC
er
4 57.212
0.692
6.62,418
Seawater34,000
11 to 19Spiral TFC
4 57.212
0.69 2
6.62,418
3c9 5 5865
64801
C95.c
88.C
92.oc207
2,4818.27
309 5 58 6 5
6 4801
a95.0
97.576.C83.531E
3,81E12.72
7 0 5 7 0 59 8 7 9 8 7
1,692 1,6925.64 5.64
5,50818.36
ZonventionalPlant

Table 3.2Economic Comparison
COST CALCULATION
nstalled Capital Costjeawater Supply System (9.6 mgd product
capacity)‘retreatment Equipment (7.2 mgd product
capacity)Desalination Equipment (exclusive of HP
pumping and ER)‘roduct Delivery System (9.6 mgd product
capacity)loncentrate Disposal System (9.6 mgd
product capacity)‘ARI-RO High Pressure Pumping andinergy Recovery System
Electric Power Supply Components forHP PumpsElectronic Control UnitsHydraulic Drive Unit Electric MotorsHydraulic Drive Unit Motor StartersHydraulic Drive UnitsWater Displacement Unit CylindersWater Piping Headers and CouplingsHydraulic PipingMiscellaneousVARI-RO HP Pumping and ER SystemCost Per TrainEngineering and AssemblyTotal VARI-RO HP Pumping and ERSystem Cost
:onventional High Pressure Pumping andnergy Recovery System
Electric Power Supply Components forHP PumpsHigh Pressure Pump MotorsHigh Pressure Pump Variable FrequencyDrivesEnergy Recovery UnitsSkids, Interconnections and ShopCheckoutTotal Conventional HP Pumping and ERSystem Cost
‘otal Equipment CostIngineeringInvironmental and Permitting-otal Installed Capital Cost
VARI-ROPilot Plant
$ 3,857,98r
$ 8,396,79’
$ 12,931,061
$ 1,361&l:
$ 2,950,22(
$ 240,00(incinc
$ 1,020,00($ 1,500,00(
t240,00(
24,00($ 60,00($ 3,084,00(
! § 33,159,32:$ 4,765,751
: 38,::;;;:
VARI-ROCommercial
$ 3,857,98i
$ 8,396,79
$ 12,931,061
$ 1,361&l:
$ 2,950,22(
$ 204,00(incinc
$ 867,00($ 1,275,00(
:204,00(
20,40($ 51 ,OO($ 2,621,40[
$ 490,96($ 3,112,36(
$ 32,610,08:$ 4,765,75($ 907,76:$ 38,283,59:
ConventionaPlant
$ 3,857,98l
$ 8,396,79’
$ 12,931,061
$ 1,361,64:
$ 2,950,22(
inc
incinc
incinc
$ 2,954,76!
$ 32,452,48;
$ 4,765y75(907,76:$ 38,125,994
54

Table 3.2Economic Comparison
(Continued)
COST CALCULATION
Operating and Maintenance CostCost of electricity, $/kwhAnnual Cost of Power for HP Pumping and
ER SystemsAnnual Cost of Power for Balance of PlantTotal Annual Power CostAnnual Cost of ChemicalsAnnual Cost of Membrane ReplacementAnnual Cost of Solid Waste DisposalAnnual Cost of Insurance andMiscellaneousAnnual Cost of Operating LaborAnnual Cost of Maintenance for HP Pump
and ER Systems @ 2.0%Annual Cost of Maintenance for Balance of
Plant @ 2.0%Total Annual O&M Cost
Cost of WaterAnnualized Cost of Capital at 6.5% and 30
Year Plant LifeTotal Annual O&M CostTotal First Year CostCost of Water, $/Acre-FtCost of Water, $/kgal
VARI-RO VARI-RO ConventionalPilot Plant Commercial Plant
0.060 0.060 0.060$ 1,359,265 $ 1,199,693 $ I,845234
$ 818,170$ 2,177,435$ 687,827f 168,144 65,000
$ 183,229
$ 818,170 $ 818,170$ 2,017,862 $ 2,663,404
f 687,827 65,000 $ $ 687,827 65,OOC
x 168,144 183,229 $ $ 168,144 183,229
t 259,444 73,232 $ $ 259,444 62,247 $ $ 259,444 59,095
$ 589,954 $ 589,954 $ 589,954
$ 4,204,265 $ 4,033,708 $ 4,676,098
$ 2,973,719 ! § 2,931,660 $ 2,919,591
$ 4,204,265 $ 4,033,708 $ 4,676,098$ 7,177,984 $ 6,965,368 $ 7,595,69@
x 2.97 967 $ $ 2.88 939 $ $ 1,024 3.14
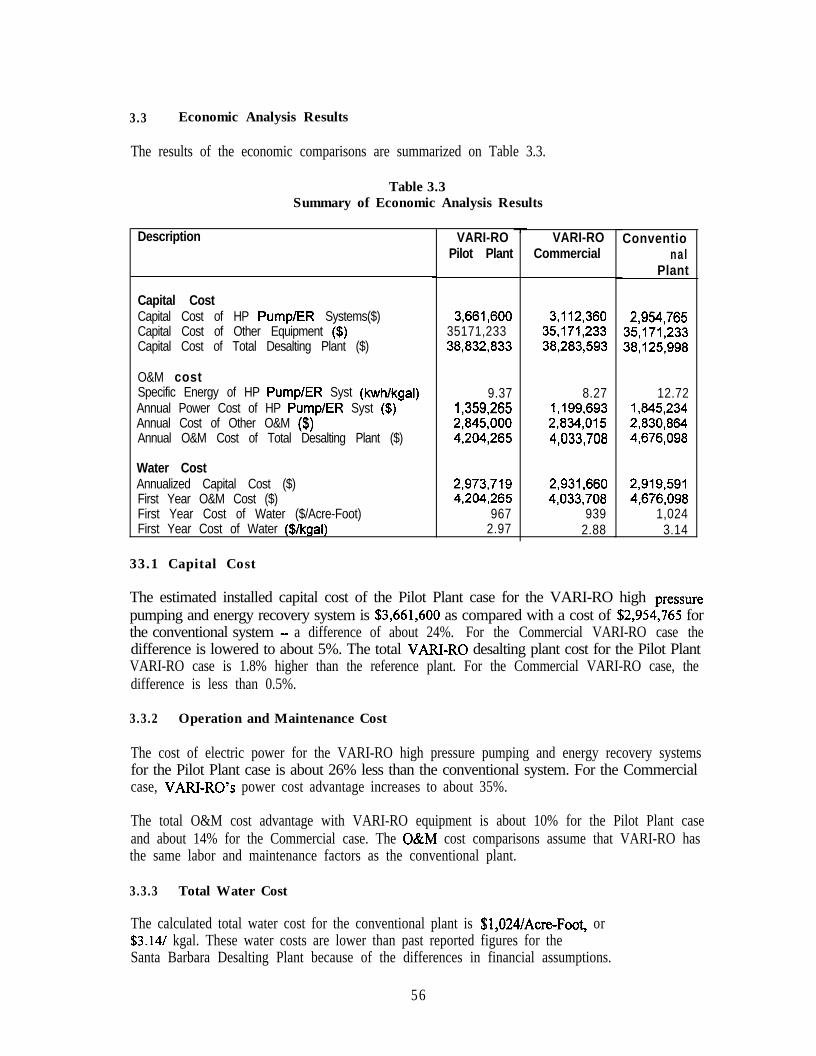
3.3 Economic Analysis Results
The results of the economic comparisons are summarized on Table 3.3.
Table 3.3Summary of Economic Analysis Results
Description VARI-ROPilot Plant
VARI-ROCommercial
Conventional
Plant
Capital CostCapital Cost of HP Pump/ER Systems($) 3,661,600 3,112,360 2,954,765Capital Cost of Other Equipment ($) 35171,233 35,171,233 35,171,233Capital Cost of Total Desalting Plant ($) 38,832,833 38,283,593 38,125,998
O&M costSpecific Energy of HP PumplER Syst (kwh/kgal)Annual Power Cost of HP Pump/ER Syst ($)Annual Cost of Other O&M ($)Annual O&M Cost of Total Desalting Plant ($)
9.37 8.27 12.721,359,265 1,199,693 l&5,2342,845,OOO 2,834,015 2,830,8644,204,265 4,033,708 4,676,098
Water CostAnnualized Capital Cost ($) 2,973,719 2,931,660 2,919,591First Year O&M Cost ($) 4,204,265 4,033,708 4,676,098First Year Cost of Water ($/Acre-Foot) 967 939 1,024First Year Cost of Water ($/kgal) 2.97 2.88 3.14
33.1 Capital Cost
The estimated installed capital cost of the Pilot Plant case for the VARI-RO high pressure
pumping and energy recovery system is $3,661,600 as compared with a cost of $2,954,765 forthe conventional system - a difference of about 24%. For the Commercial VARI-RO case thedifference is lowered to about 5%. The total VAN-R0 desalting plant cost for the Pilot PlantVARI-RO case is 1.8% higher than the reference plant. For the Commercial VARI-RO case, thedifference is less than 0.5%.
3.3.2 Operation and Maintenance Cost
The cost of electric power for the VARI-RO high pressure pumping and energy recovery systemsfor the Pilot Plant case is about 26% less than the conventional system. For the Commercialcase, VARI-RO’s power cost advantage increases to about 35%.
The total O&M cost advantage with VARI-RO equipment is about 10% for the Pilot Plant caseand about 14% for the Commercial case. The O&M cost comparisons assume that VARI-RO hasthe same labor and maintenance factors as the conventional plant.
3.3.3 Total Water Cost
The calculated total water cost for the conventional plant is $l,024/Acre-Foot, or$3.14/ kgal. These water costs are lower than past reported figures for theSanta Barbara Desalting Plant because of the differences in financial assumptions.
56
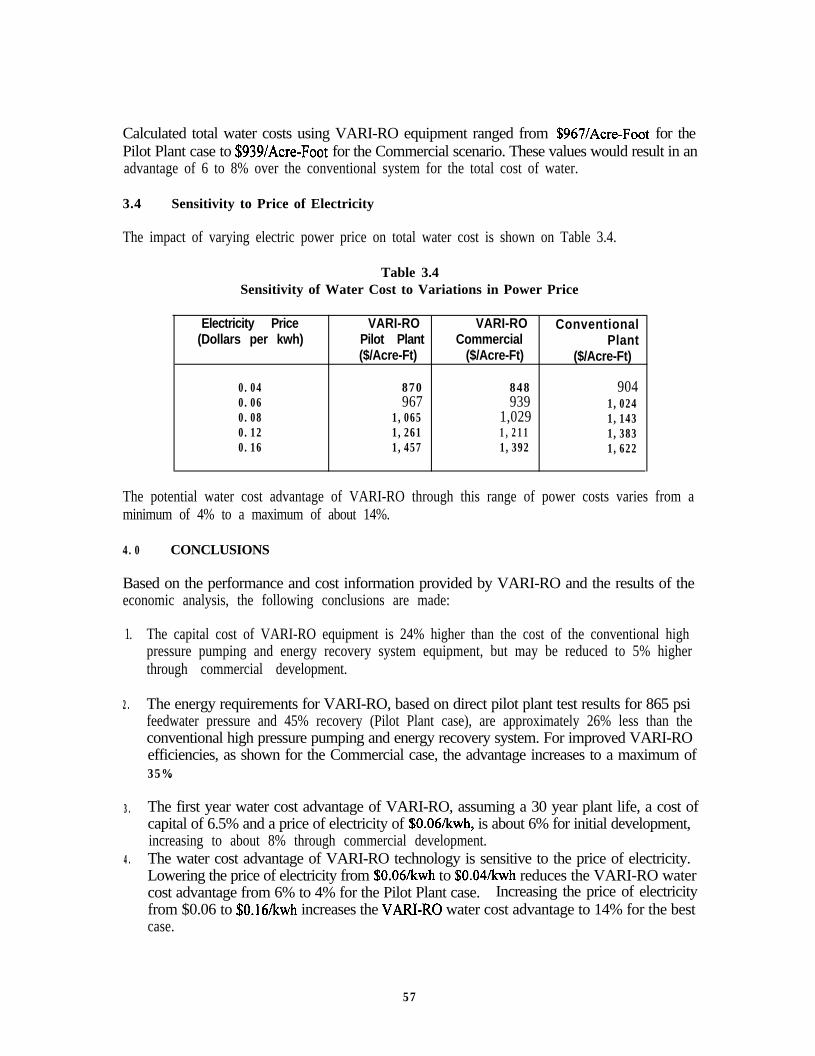
Calculated total water costs using VARI-RO equipment ranged from $967/Acre-Foot for thePilot Plant case to $939/Acre-Foot for the Commercial scenario. These values would result in anadvantage of 6 to 8% over the conventional system for the total cost of water.
3.4 Sensitivity to Price of Electricity
The impact of varying electric power price on total water cost is shown on Table 3.4.
Table 3.4Sensitivity of Water Cost to Variations in Power Price
Electricity Price(Dollars per kwh)
0.040.060.080.120.16
VARI-RO VARI-RO ConventionalPilot Plant Commercial Plant($/Acre-Ft) ($/Acre-Ft) ($/Acre-Ft)
870 848 904967 939 1,024
1,065 1,029 1,1431,261 1,211 1,3831,457 1,392 1,622
The potential water cost advantage of VARI-RO through this range of power costs varies from aminimum of 4% to a maximum of about 14%.
4.0 CONCLUSIONS
Based on the performance and cost information provided by VARI-RO and the results of theeconomic analysis, the following conclusions are made:
1.
2.
3.
4.
The capital cost of VARI-RO equipment is 24% higher than the cost of the conventional highpressure pumping and energy recovery system equipment, but may be reduced to 5% higherthrough commercial development.
The energy requirements for VARI-RO, based on direct pilot plant test results for 865 psifeedwater pressure and 45% recovery (Pilot Plant case), are approximately 26% less than theconventional high pressure pumping and energy recovery system. For improved VARI-ROefficiencies, as shown for the Commercial case, the advantage increases to a maximum of35%.
The first year water cost advantage of VARI-RO, assuming a 30 year plant life, a cost ofcapital of 6.5% and a price of electricity of $O.O6/kwh, is about 6% for initial development,increasing to about 8% through commercial development.The water cost advantage of VARI-RO technology is sensitive to the price of electricity.Lowering the price of electricity from $O.O6/kwh to $O.O4kwh reduces the VARI-RO watercost advantage from 6% to 4% for the Pilot Plant case. Increasing the price of electricityfrom $0.06 to $O.l6/kwh increases the VARl-RO water cost advantage to 14% for the bestcase.
57
The reference desalination plant assumed 1992 technology and did not account for improvementswhich have occurred in commercially available high pressure pumping and energy recoveryequipment and in seawater RO membrane element performance. Improvements in commercialpumping and energy recovery systems would reduce the advantage shown for VARLROtechnology. Improvements in seawater RO membrane element performance, along withimprovements in overall desalting plant design, would reduce the total cost of water.
The cost of water, as calculated in the economic analysis, is site specific and highly dependent onthe cost of peripheral systems such as seawater supply, product delivery and concentratedisposal. It is also highly dependent on the financing assumptions and the cost of electricity.The water costs shown in the study, while lower than some previously reported costs for theSanta Barbara plant, are consistent with current large RO projects under evaluation in the UnitedStates.
The results of the pilot test program, especially the final phase, basically confirmed theperformance predictions made by SAIC and Vari-Power Company and validated the calculationmethodology used to predict the performance of larger-scale units. The VARI-RO equipmentcosts were developed by qualified suppliers with long-term experience in their respective areasof expertise. The combination of these factors provides confidence that the economiccomparisons are reasonable for the current level of technology development.
Full validation of VARI-RO technology will require the development of larger-scaleVARI-RO systems, improvements in design details and long-term demonstration plant operationto confum operating labor and maintenance requirements.
5 8