Embed Size (px)
Citation preview
Valuing Common Assets for Public Revenue in Vermont
Prepared for Blue Ribbon Tax CommissionDecember 8, 2009
Gary Flomenhoft, UVM
COMMON ASSETS
DEFINITIONS
COMMONS: Things produced by Nature, government, or society as a whole that we all share such as air, water, roads, parks, libraries, music, etc.
COMMON ASSETS: Parts of the commons with market valueSuch as spectrum, minerals, water, land, internet, forests, wildlife, seigniorage. Often privatized.
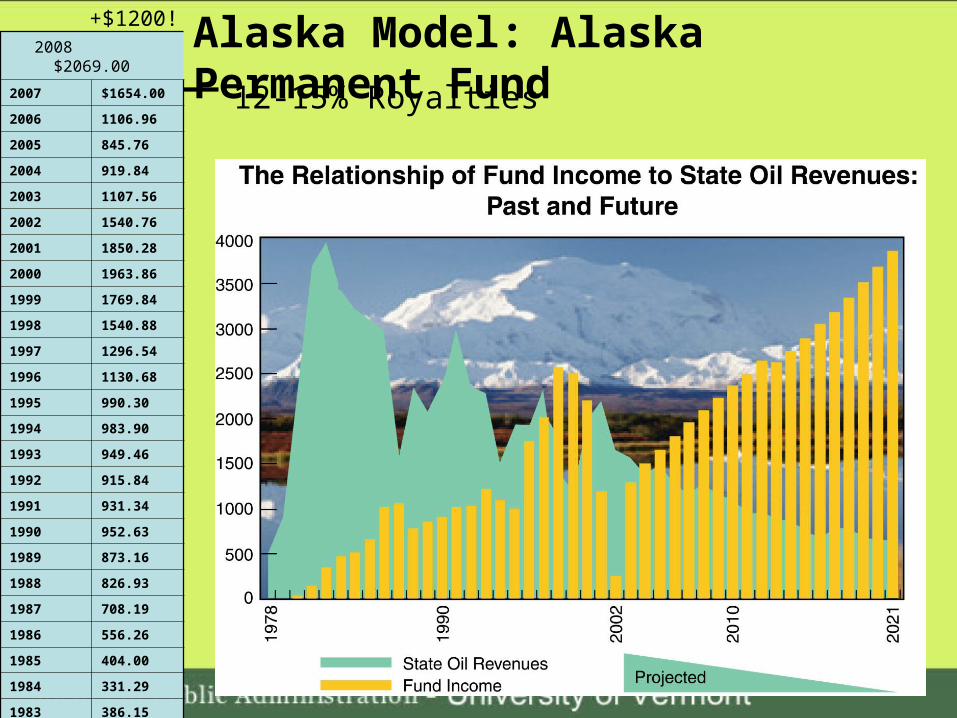
Alaska Model: Alaska Permanent Fund
12-15% Royalties
2008 $2069.00
2007 $1654.00
2006 1106.96
2005 845.76
2004 919.84
2003 1107.56
2002 1540.76
2001 1850.28
2000 1963.86
1999 1769.84
1998 1540.88
1997 1296.54
1996 1130.68
1995 990.30
1994 983.90
1993 949.46
1992 915.84
1991 931.34
1990 952.63
1989 873.16
1988 826.93
1987 708.19
1986 556.26
1985 404.00
1984 331.29
1983 386.15
1982 1000.00
+$1200!
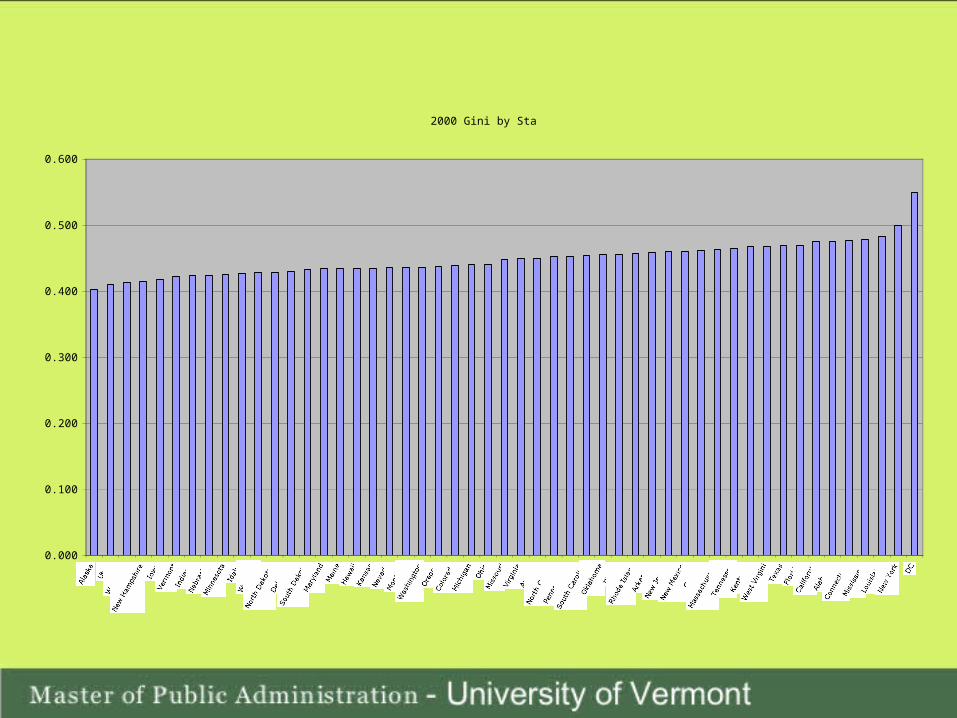
2000 Gini by State
0.000
0.100
0.200
0.300
0.400
0.500
0.600
AlaskaUtah
Wisconsin
New Hampshire
Iowa
VermontIndianaNebraskaMinnesota
Idaho
Wyoming
North Dakota0
Delaware
South Dakota
MarylandMaineHawaiiKansasNevadaMontana
Washington
OregonColoradoMichigan
Ohio
MissouriVirginiaArizona
North CarolinPennsylvaniaSouth Carolina
Oklahoma
Illinois
Rhode Island
ArkansasNew JerseyNew Mexico
Georgia
Massachusetts
Tennessee KentuckyWest Virgini
TexasFloridaCaliforniaAlabama
ConnecticutMississippiLouisianaNew York
DC
Question 1
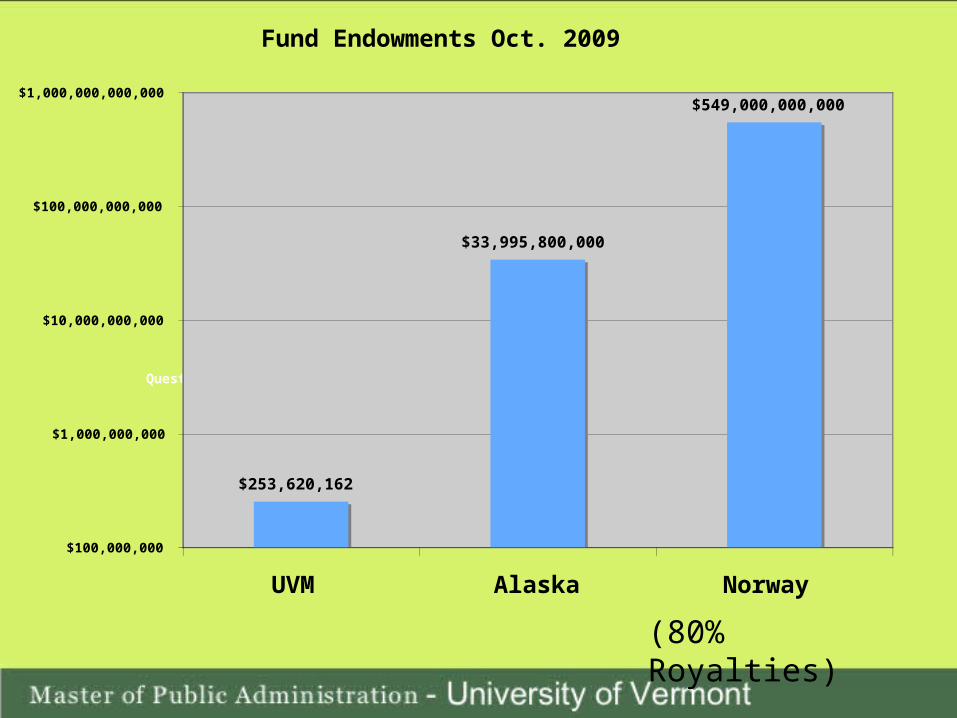
Fund Endowments Oct. 2009
$253,620,162
$33,995,800,000
$549,000,000,000
$100,000,000
$1,000,000,000
$10,000,000,000
$100,000,000,000
$1,000,000,000,000
UVM Alaska Norway
(80% Royalties)
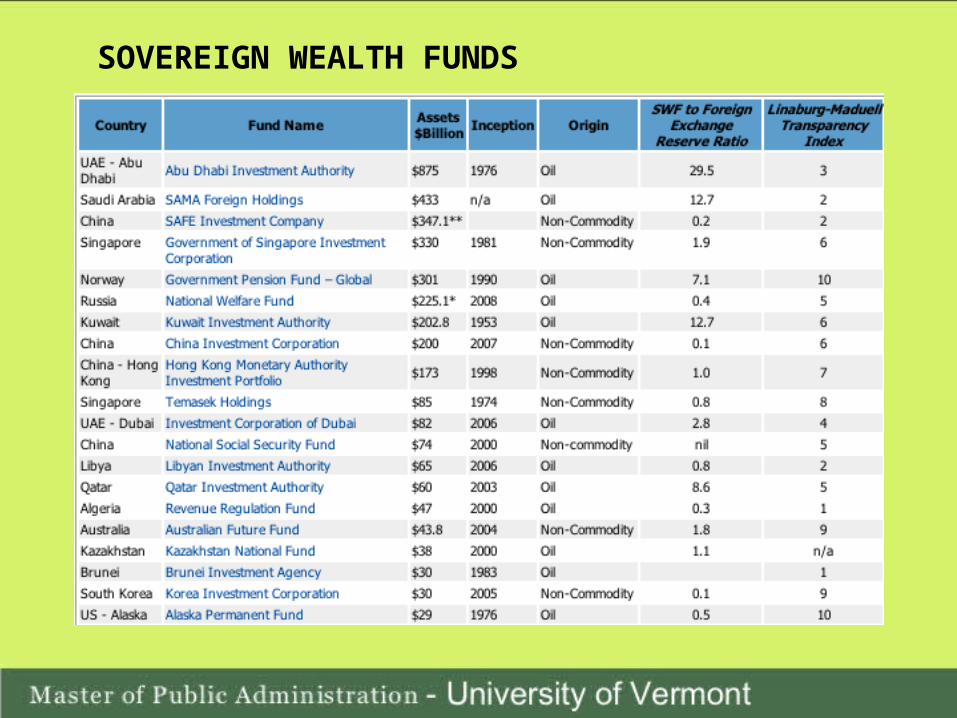
SOVEREIGN WEALTH FUNDS
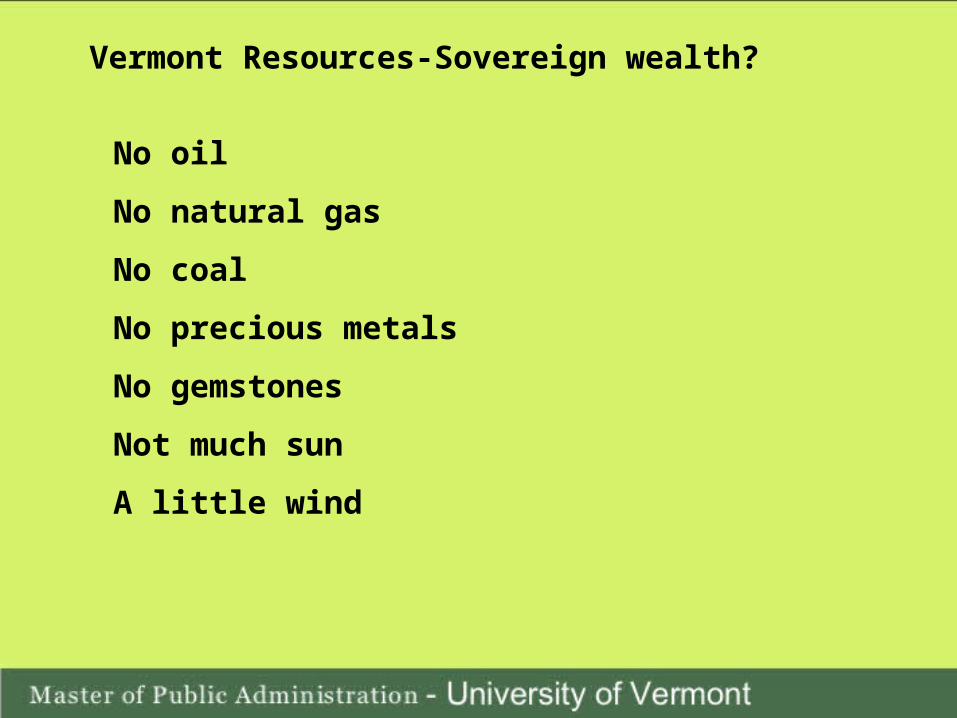
Vermont Resources-Sovereign wealth?
No oil
No natural gas
No coal
No precious metals
No gemstones
Not much sun
A little wind
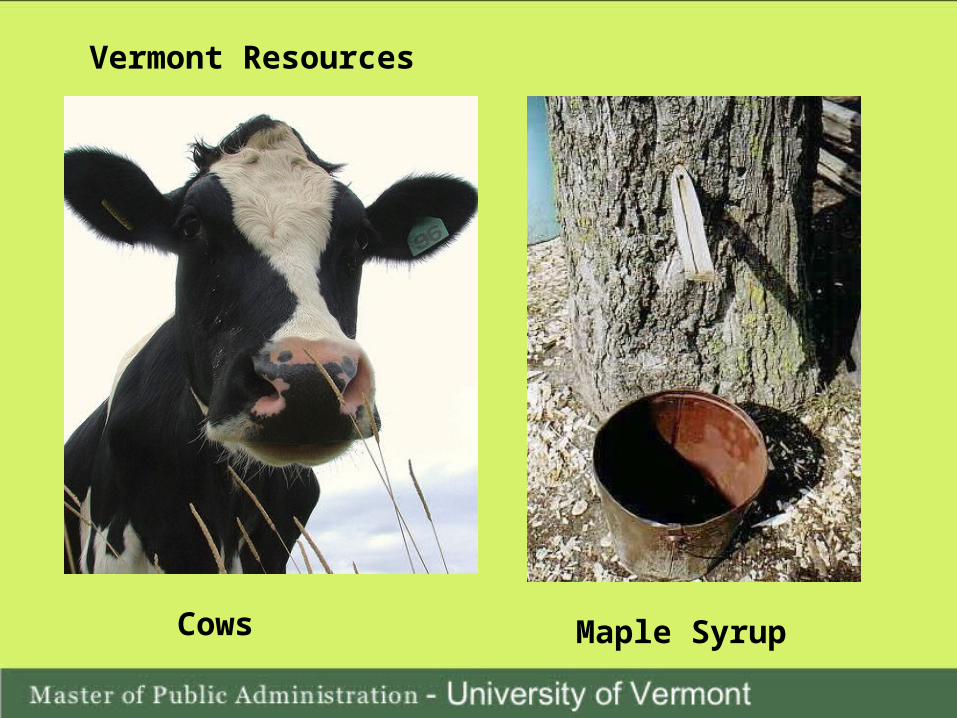
Vermont Resources
Cows Maple Syrup
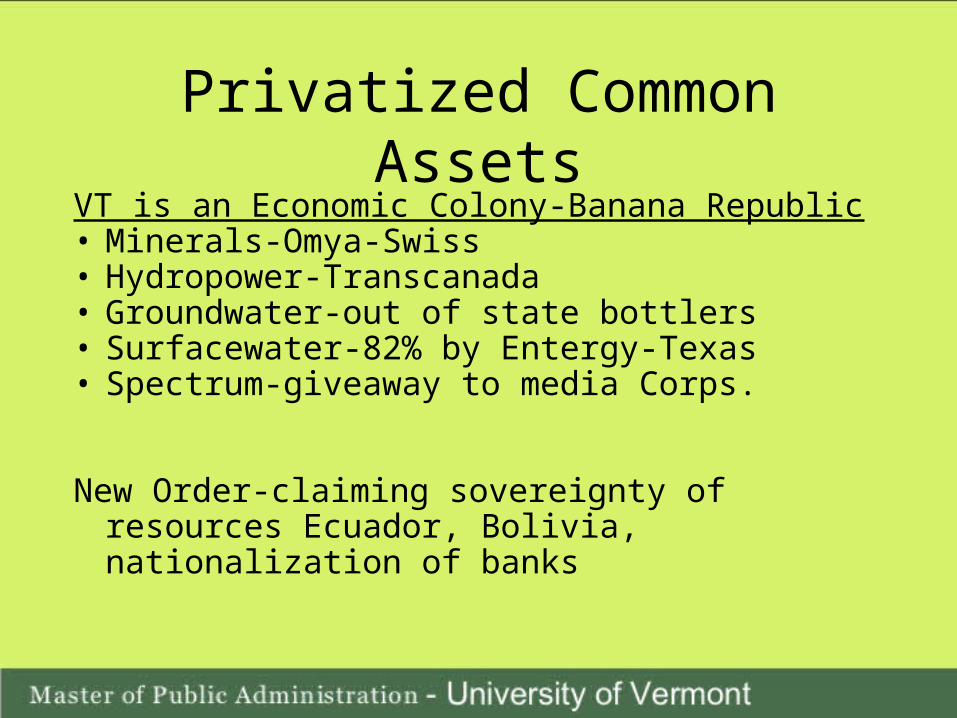
Privatized Common AssetsVT is an Economic Colony-Banana Republic• Minerals-Omya-Swiss• Hydropower-Transcanada • Groundwater-out of state bottlers• Surfacewater-82% by Entergy-Texas • Spectrum-giveaway to media Corps.
New Order-claiming sovereignty of resources Ecuador, Bolivia, nationalization of banks
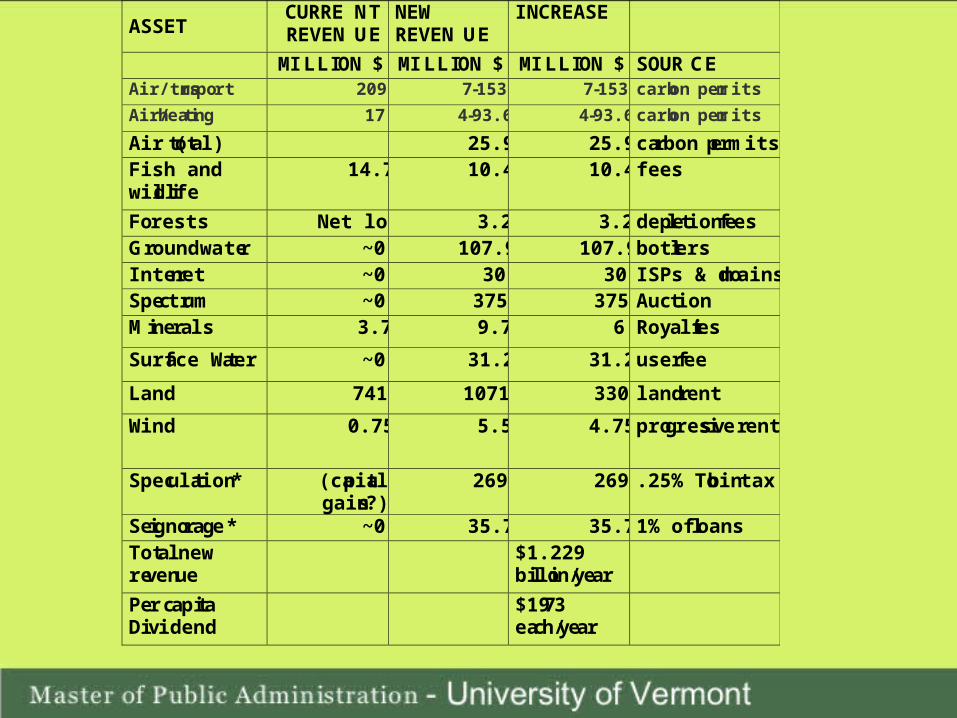
ASSET CURRENT REVENUE
NEW REVENUE
INCREASE
MILLION $ MILLION $ MILLION $ SOURCE Air/transport 209 7-153 7-153 carbon permits
Air/heating 17 4-93.6 4-93.6 carbon permits
Air (total) 25.9 25.9 carbon permits Fish and wildlife
14.7 10.4 10.4 fees
Forests Net loss 3.2 3.2 depletion fees Ground water ~0 107.9 107.9 bottlers Internet ~0 30 30 ISPs & domains Spectrum ~0 375 375 Auction Minerals 3.7 9.7 6 Royalties
Surface Water ~0 31.2 31.2 user fee
Land 741 1071 330 land rent
Wind 0.75 5.5 4.75 progressive rent
Speculation * (capital gains?)
269 269 .25% Tobin tax
Seignorage * ~0 35.7 35.7 1% of loans Total new revenue
$1.229 billion/year
Per capita Dividend
$1973 each/year
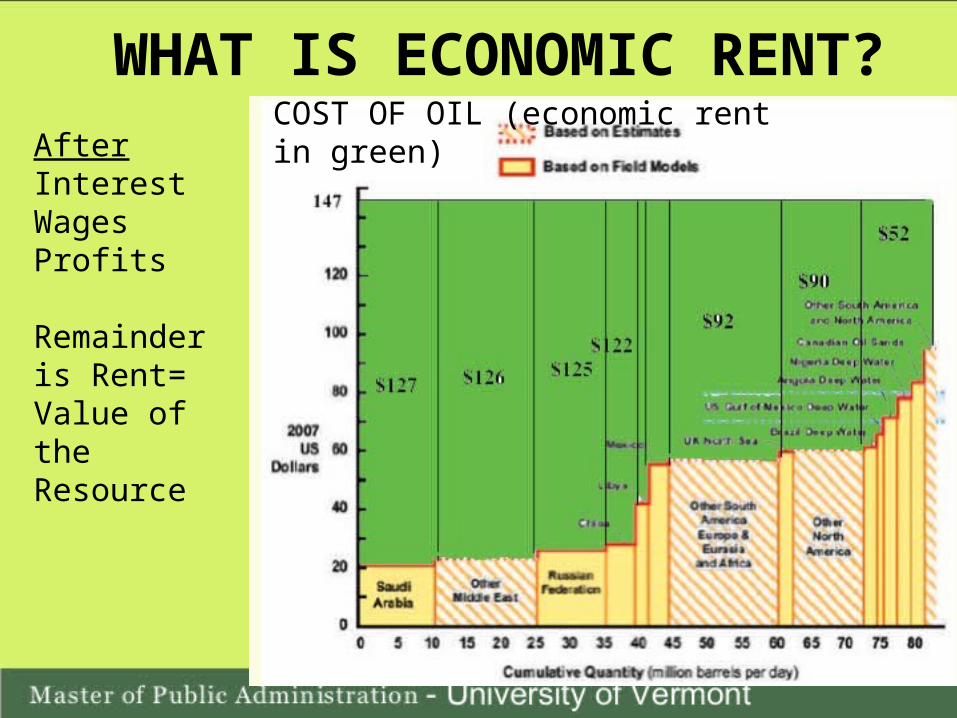
WHAT IS ECONOMIC RENT?COST OF OIL (economic rent in green)
AfterInterestWagesProfits
Remainder is Rent=Value of the Resource
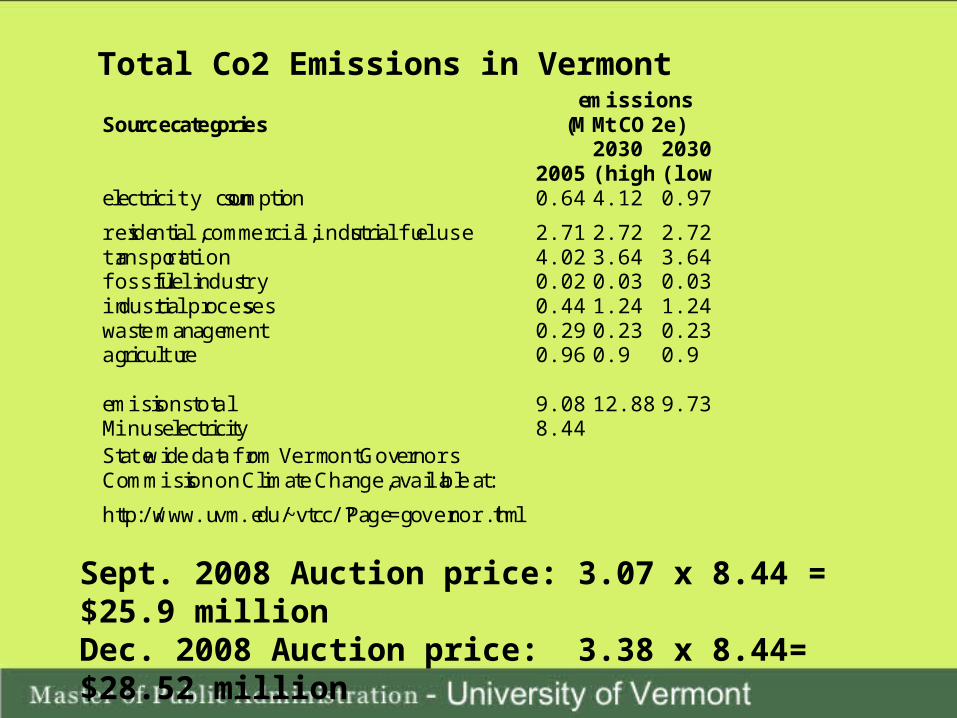
Source categories emissions
(MMtCO2e)
2005 2030 (high)
2030 (low)
electricity consumption 0.64 4.12 0.97
residential, commercial, industrial fuel use 2.71 2.72 2.72 transportation 4.02 3.64 3.64 fossil fuel industry 0.02 0.03 0.03 industrial processes 0.44 1.24 1.24 waste management 0.29 0.23 0.23 agriculture 0.96 0.9 0.9 emissions total 9.08 12.88 9.73 Minus electricity 8.44 Statewide data from Vermont Governors Commission on Climate Change, available at:
http://www.uvm.edu/~vtcc/?Page=governor.html
Total Co2 Emissions in Vermont
Sept. 2008 Auction price: 3.07 x 8.44 = $25.9 millionDec. 2008 Auction price: 3.38 x 8.44= $28.52 million
Fish and Wildlife Rent
Ross Saxton
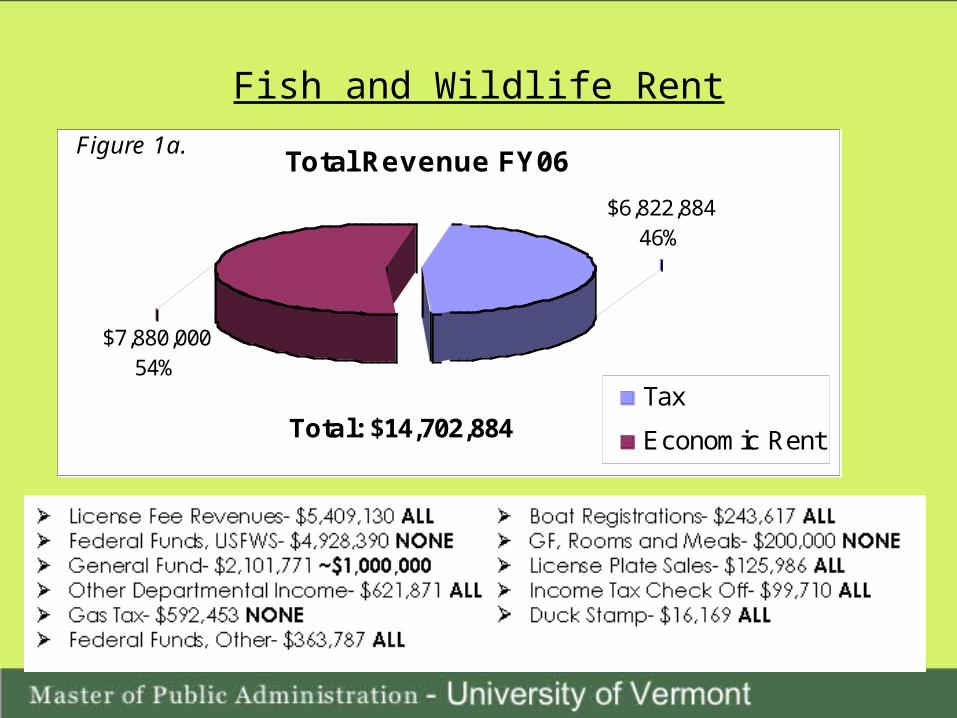
Fish and Wildlife Rent
Total Revenue FY06
$7,880,00054%
$6,822,88446%
Tax
Economic RentTotal: $14,702,884
Figure 1a.
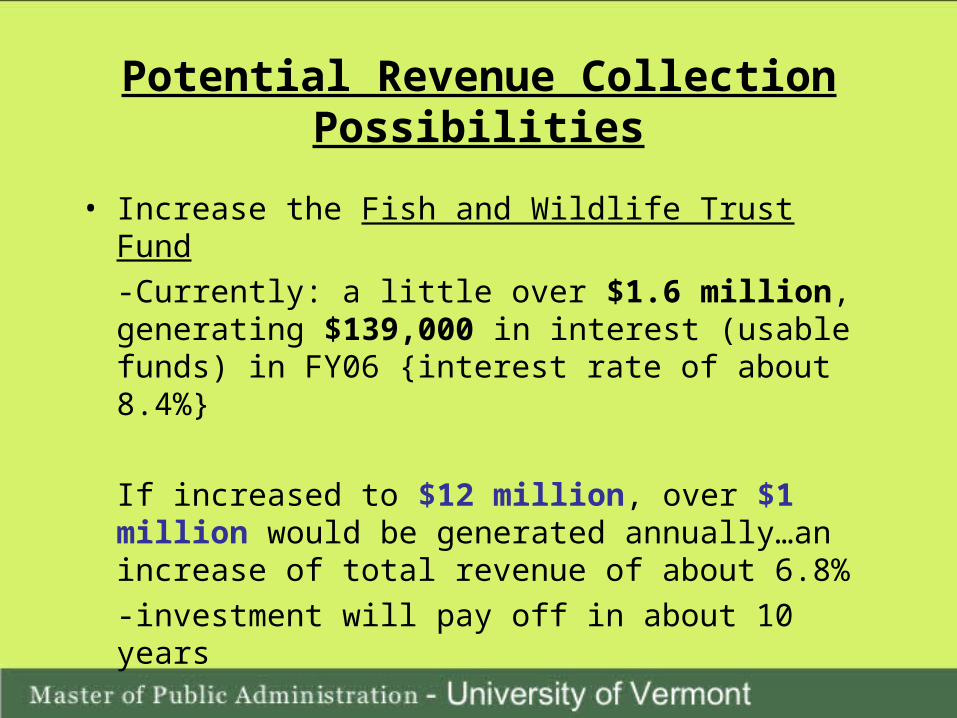
Potential Revenue Collection Possibilities
• Increase the Fish and Wildlife Trust Fund
-Currently: a little over $1.6 million, generating $139,000 in interest (usable funds) in FY06 {interest rate of about 8.4%}
If increased to $12 million, over $1 million would be generated annually…an increase of total revenue of about 6.8%
-investment will pay off in about 10 years
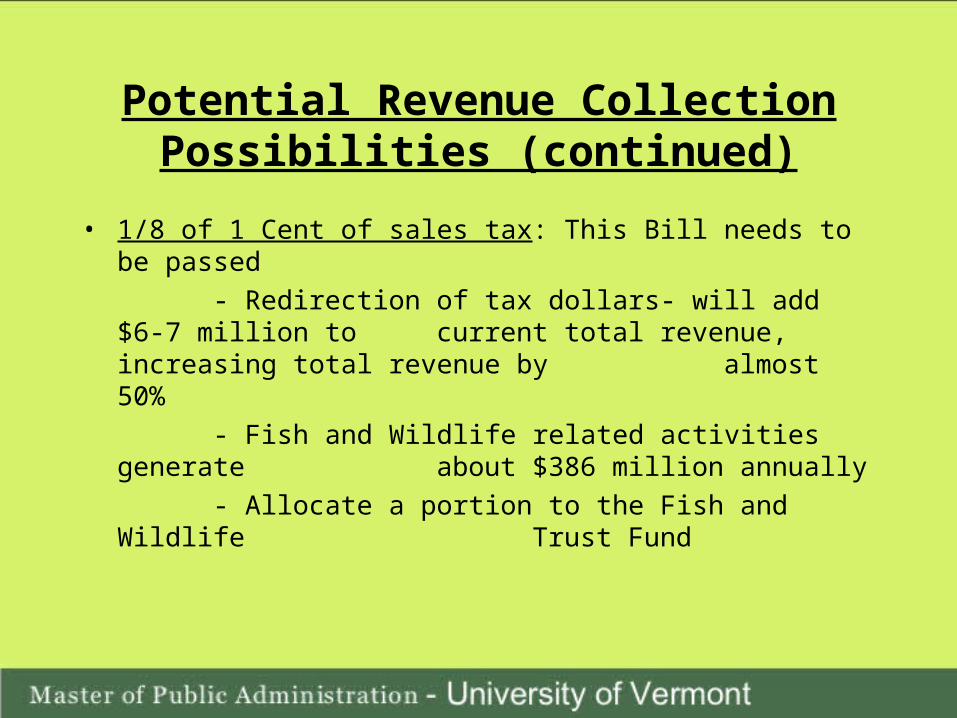
Potential Revenue Collection Possibilities (continued)
• 1/8 of 1 Cent of sales tax: This Bill needs to be passed
- Redirection of tax dollars- will add $6-7 million to current total revenue, increasing total revenue by almost 50%
- Fish and Wildlife related activities generate about $386 million annually
- Allocate a portion to the Fish and Wildlife Trust Fund
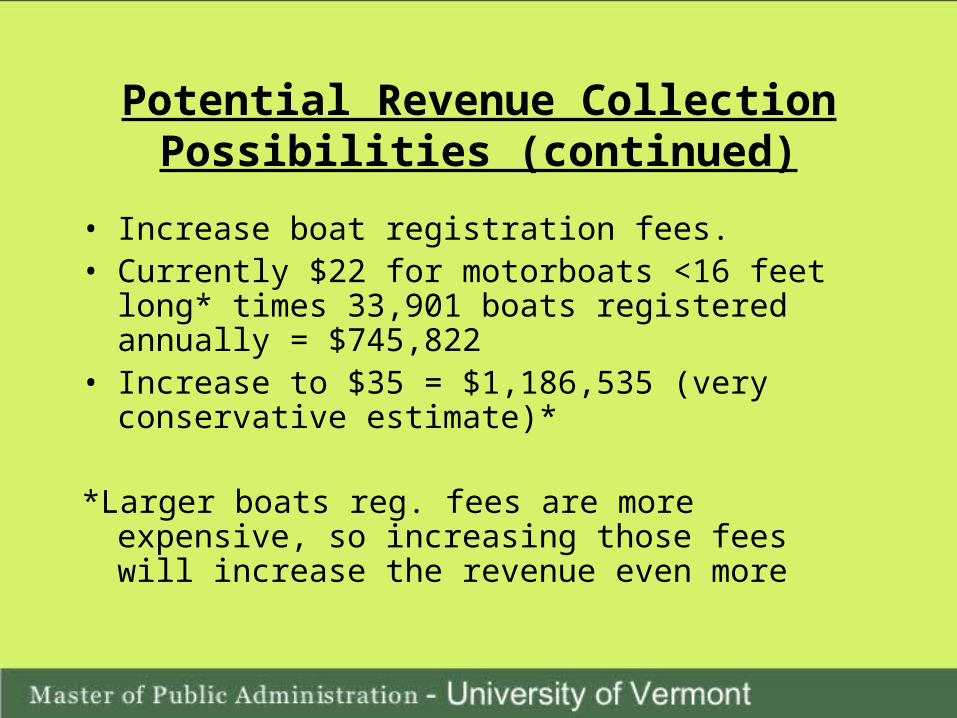
Potential Revenue Collection Possibilities (continued)
• Increase boat registration fees.• Currently $22 for motorboats <16 feet long* times
33,901 boats registered annually = $745,822• Increase to $35 = $1,186,535 (very conservative
estimate)*
*Larger boats reg. fees are more expensive, so increasing those fees will increase the revenue even more
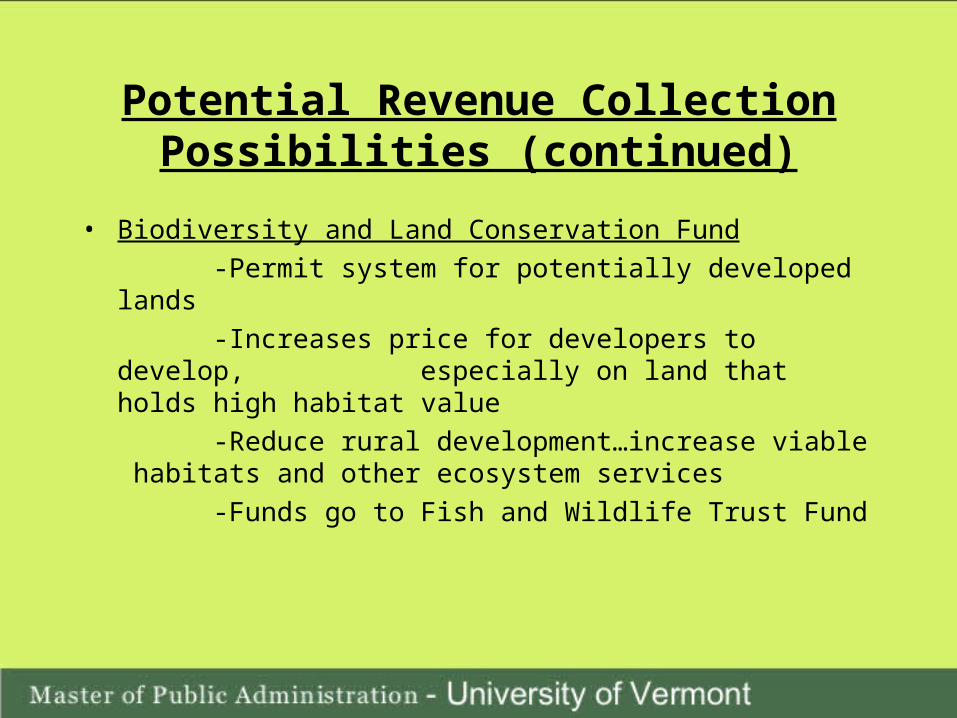
Potential Revenue Collection Possibilities (continued)
• Biodiversity and Land Conservation Fund
-Permit system for potentially developed lands
-Increases price for developers to develop, especially on land that holds high habitat value
-Reduce rural development…increase viable habitats and other ecosystem services
-Funds go to Fish and Wildlife Trust Fund
Management of Vermont’s Forest Revenue
Mark Kolonoski
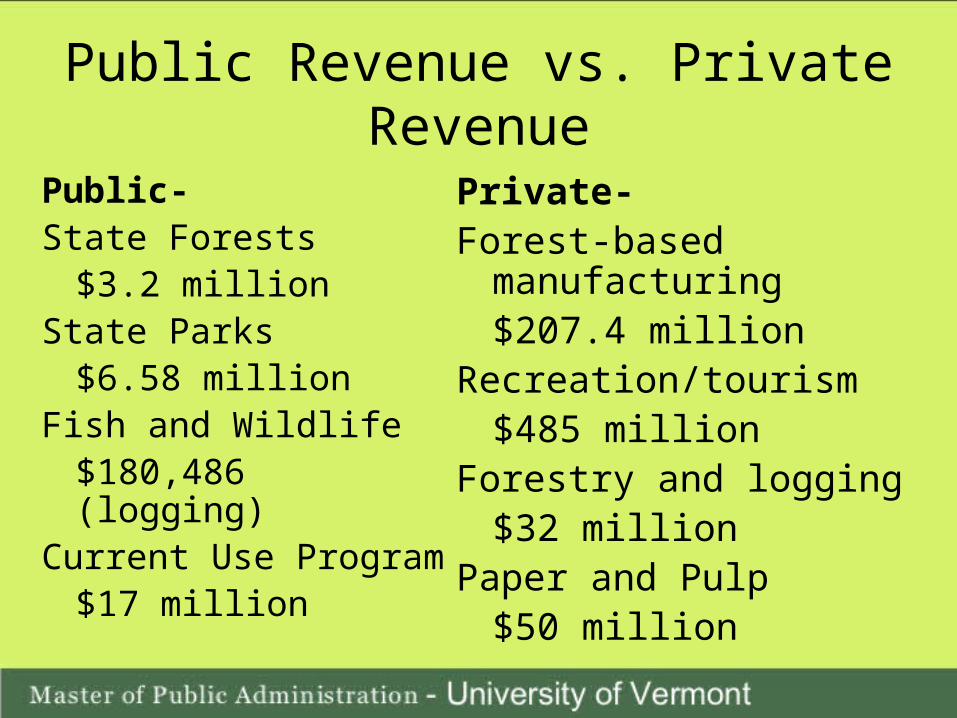
Public Revenue vs. Private Revenue
Public-State Forests
$3.2 millionState Parks
$6.58 millionFish and Wildlife
$180,486 (logging)Current Use Program
$17 million
Private-Forest-based manufacturing
$207.4 millionRecreation/tourism
$485 millionForestry and logging
$32 millionPaper and Pulp
$50 million
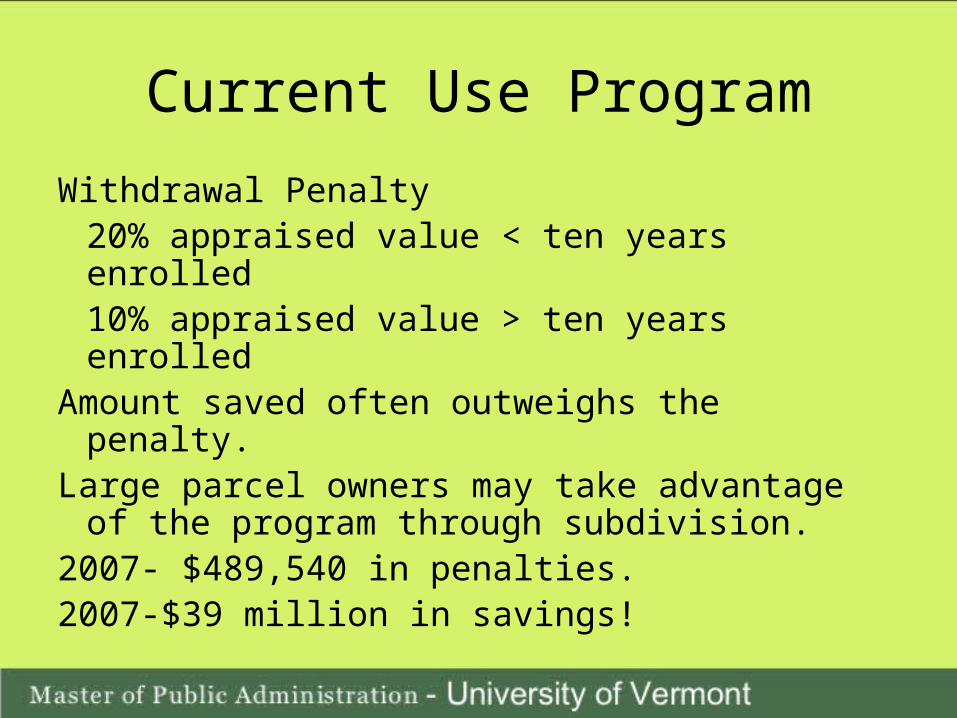
Current Use Program
Withdrawal Penalty20% appraised value < ten years enrolled 10% appraised value > ten years enrolled
Amount saved often outweighs the penalty.Large parcel owners may take advantage of
the program through subdivision.2007- $489,540 in penalties.2007-$39 million in savings!
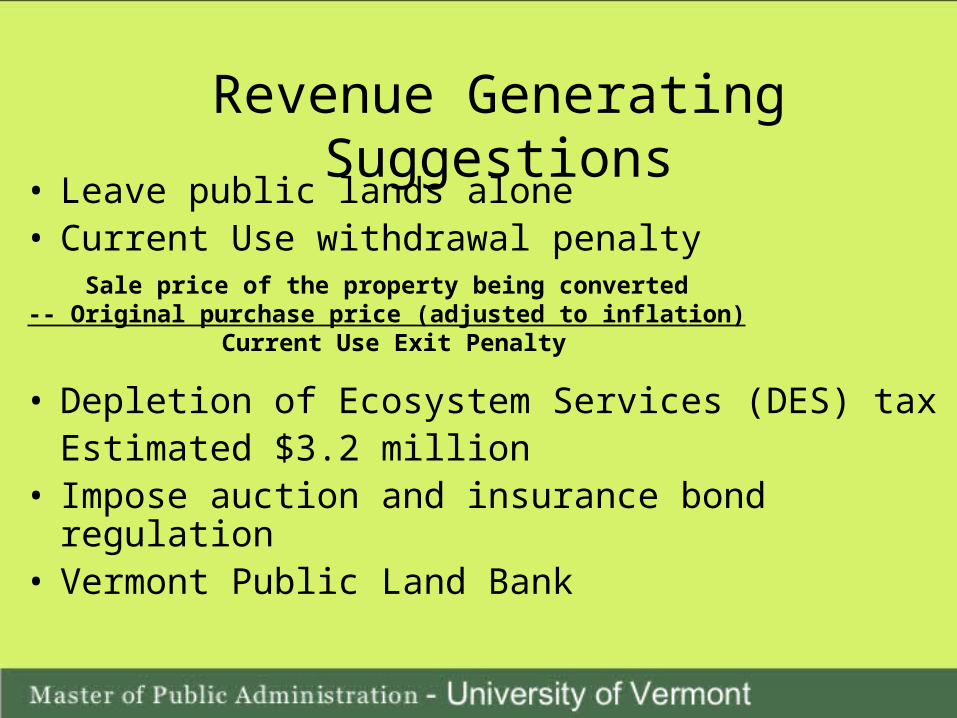
Revenue Generating Suggestions• Leave public lands alone• Current Use withdrawal penalty
• Depletion of Ecosystem Services (DES) taxEstimated $3.2 million
• Impose auction and insurance bond regulation• Vermont Public Land Bank
Sale price of the property being converted -- Original purchase price (adjusted to inflation)
Current Use Exit Penalty
Public Trust Resource-2009
• “Held by the people in their character as sovereign in trust for public uses for which they are adapted”
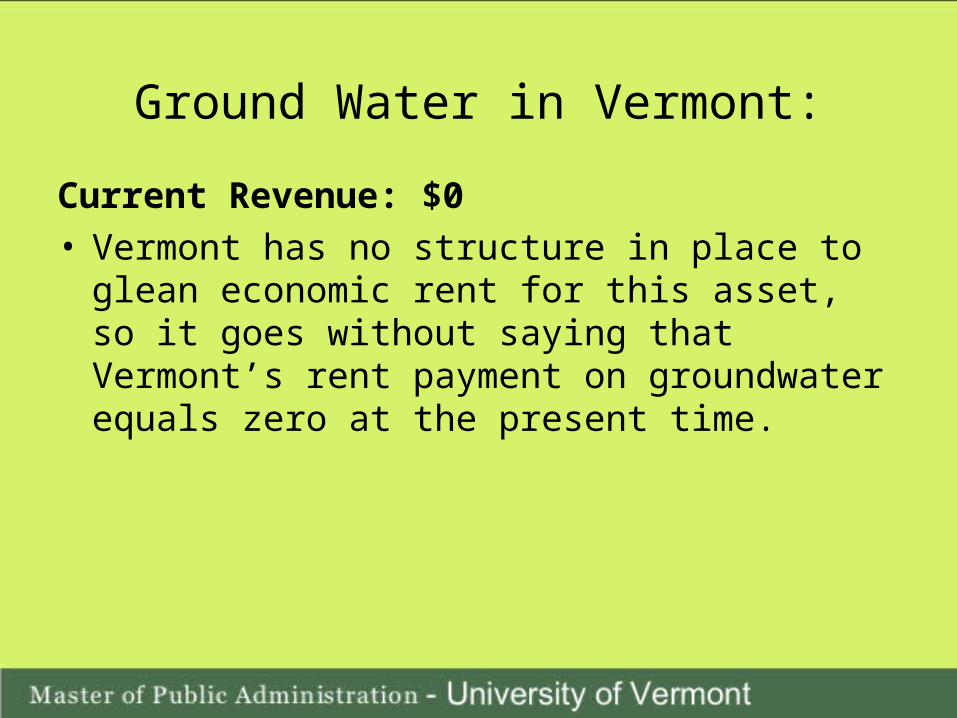
Ground Water in Vermont:
Current Revenue: $0• Vermont has no structure in place to glean
economic rent for this asset, so it goes without saying that Vermont’s rent payment on groundwater equals zero at the present time.
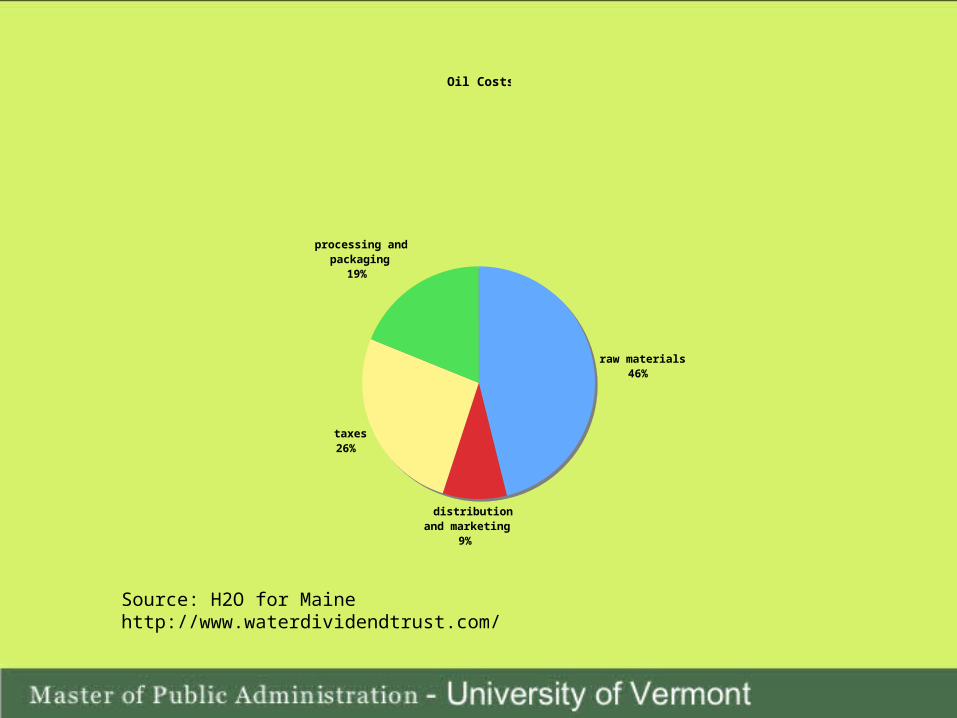
Oil Costs
raw materials46%
distribution and marketing
9%
taxes26%
processing and packaging
19%
Source: H2O for Maine http://www.waterdividendtrust.com/
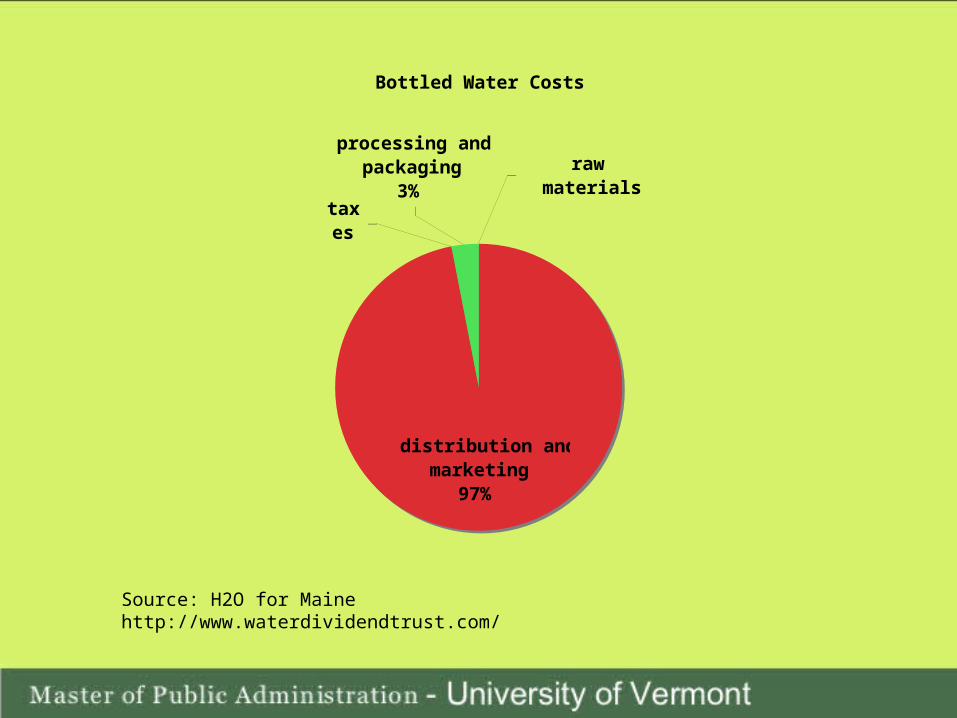
Bottled Water Costs
distribution and marketing
97%
processing and packaging
3%taxes
raw materials
Source: H2O for Maine http://www.waterdividendtrust.com/
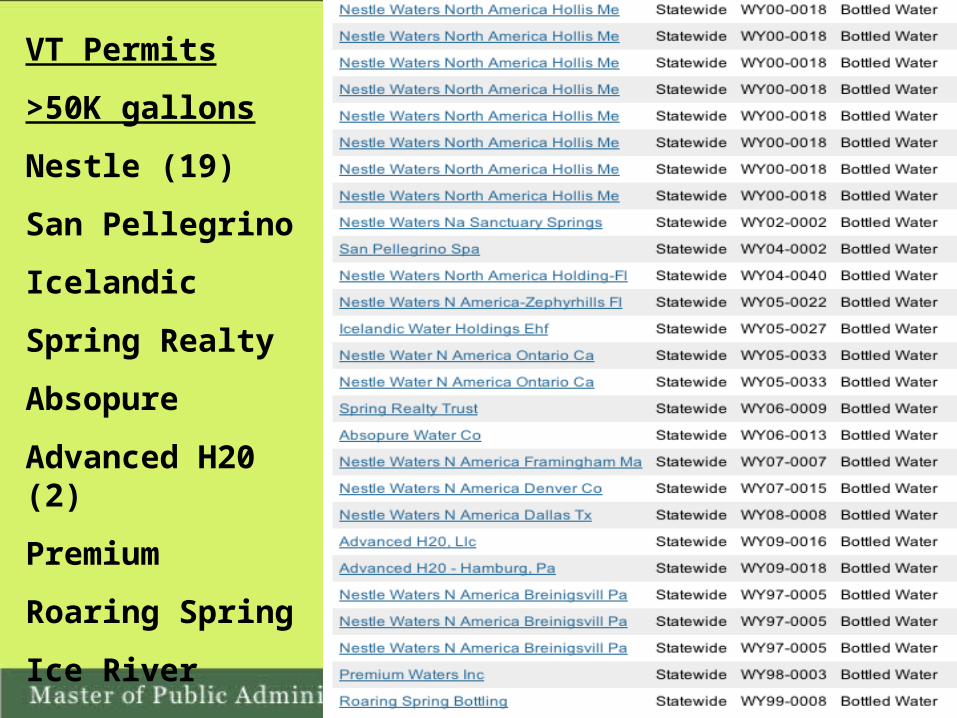
VT Permits
>50K gallons
Nestle (19)
San Pellegrino
Icelandic
Spring Realty
Absopure
Advanced H20 (2)
Premium
Roaring Spring
Ice River
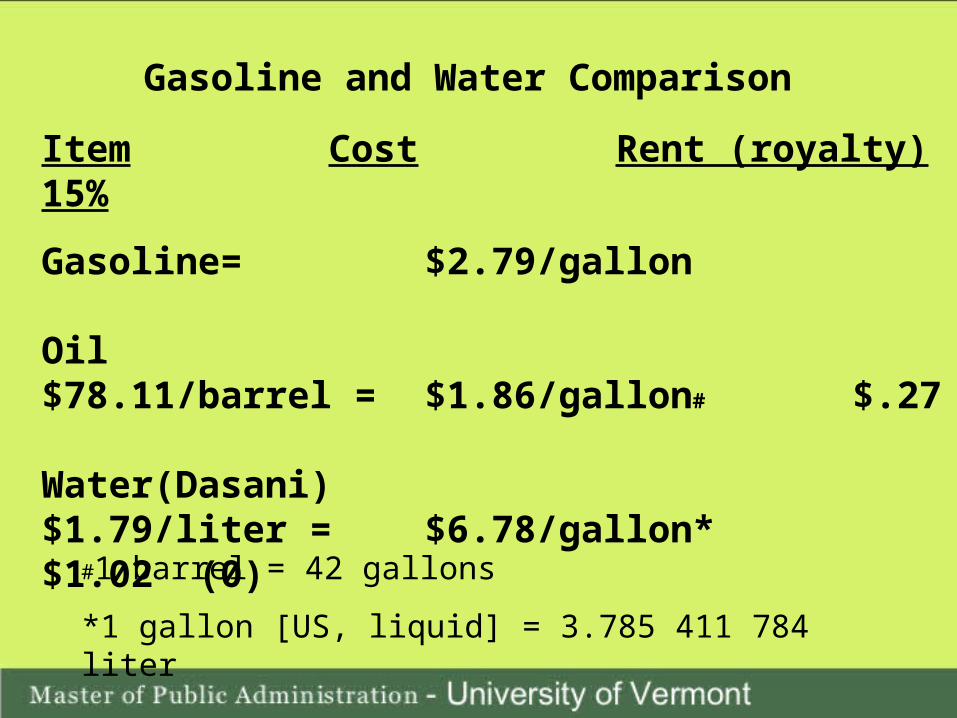
Gasoline and Water Comparison
Item Cost Rent (royalty) 15%
Gasoline= $2.79/gallon
Oil $78.11/barrel = $1.86/gallon# $.27
Water(Dasani) $1.79/liter = $6.78/gallon* $1.02 (0)
#1 barrel = 42 gallons
*1 gallon [US, liquid] = 3.785 411 784 liter

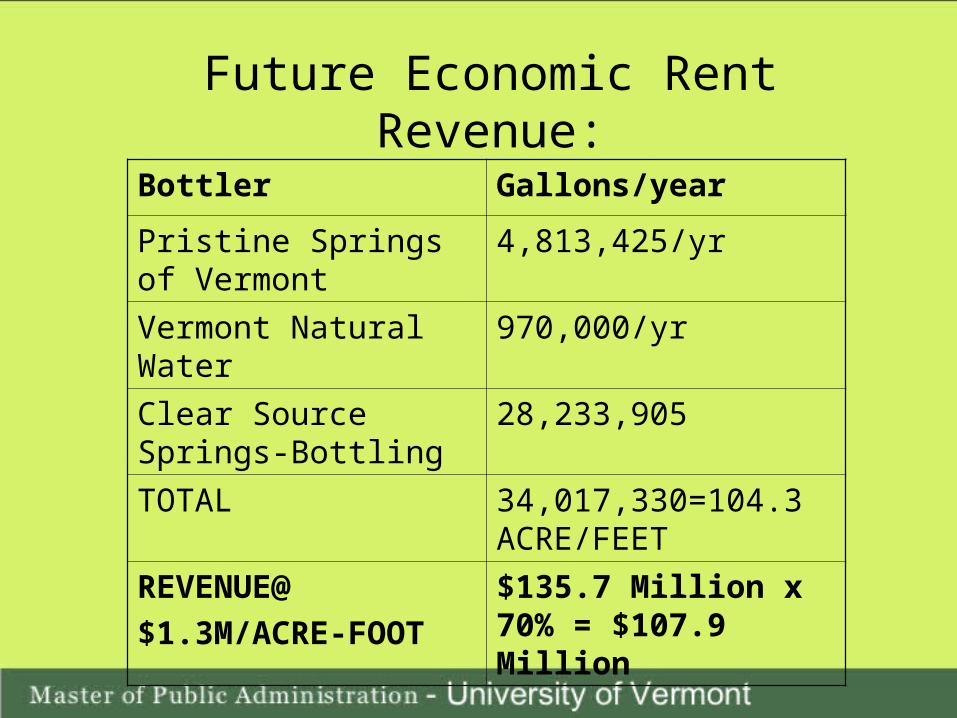
Future Economic Rent Revenue:
Bottler Gallons/year
Pristine Springs of Vermont
4,813,425/yr
Vermont Natural Water 970,000/yr
Clear Source Springs-Bottling
28,233,905
TOTAL 34,017,330=104.3 ACRE/FEET
REVENUE@
$1.3M/ACRE-FOOT
$135.7 Million x 70% = $107.9 Million
Future Economic Rent Revenue:
Bottler Gallons/year
Pristine Springs of Vermont
4,813,425/yr
Vermont Natural Water 970,000/yr
Clear Source Springs-Bottling
28,233,905
TOTAL 34,017,330=104.3 ACRE/FEET
REVENUE@
$1.3M/ACRE-FOOT
$135.7 Million x 70% = $107.9 Million
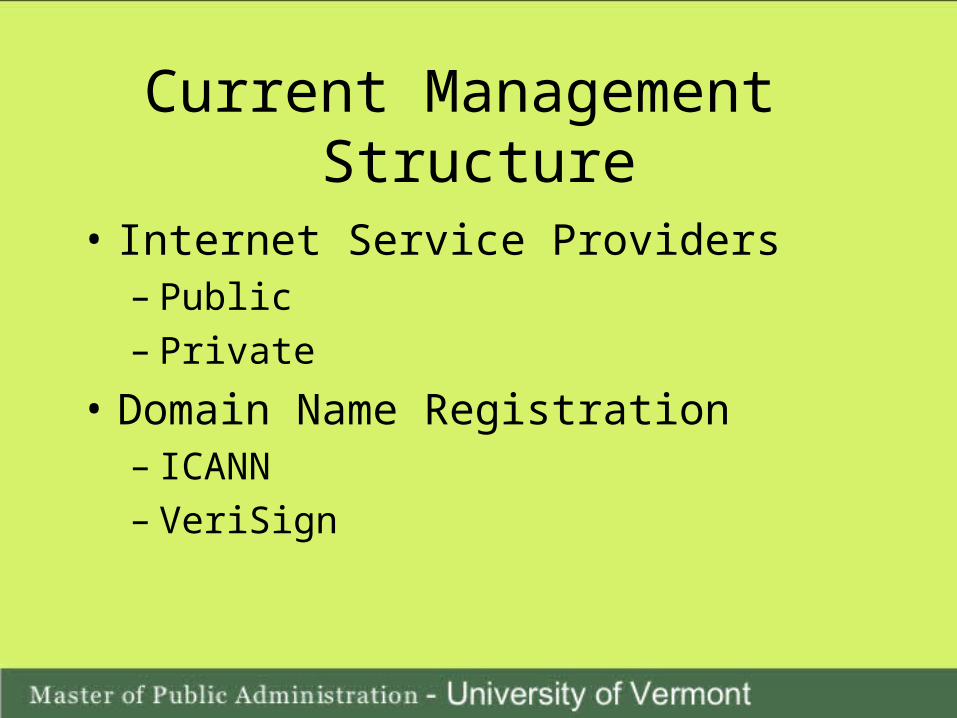
Current ManagementStructure
• Internet Service Providers– Public– Private
• Domain Name Registration– ICANN– VeriSign
Current Revenue
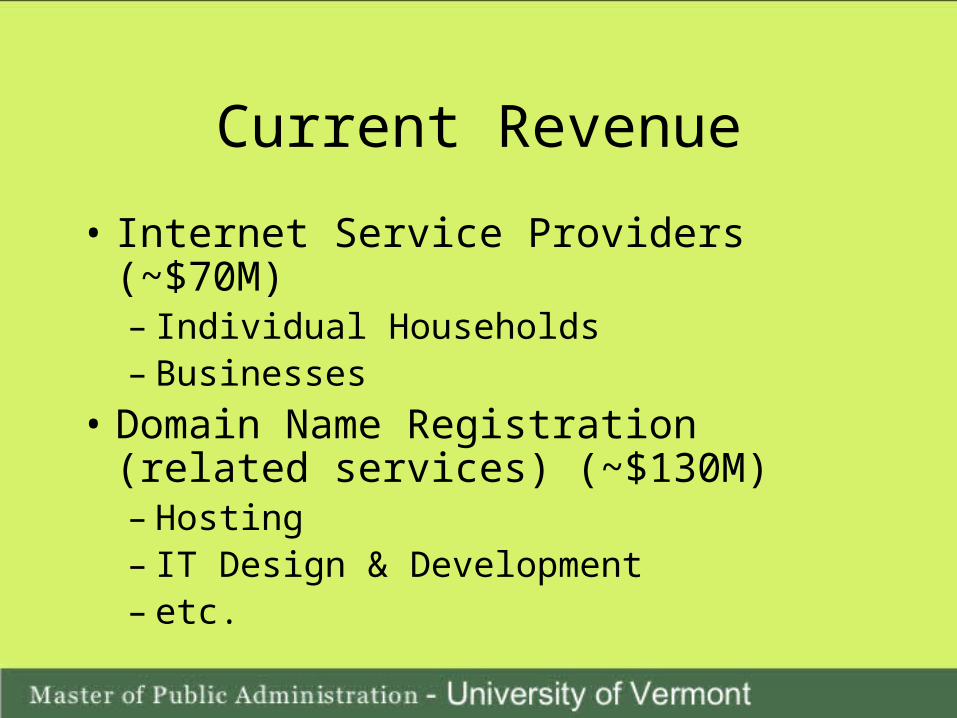
• Internet Service Providers (~$70M)– Individual Households– Businesses
• Domain Name Registration (related services) (~$130M)– Hosting– IT Design & Development– etc.
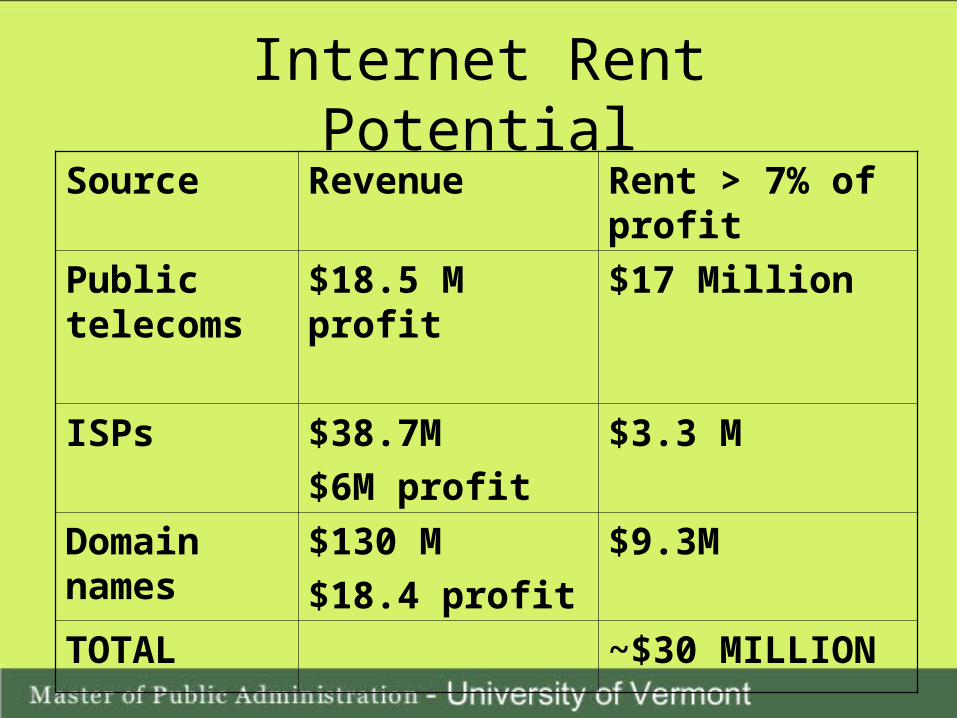
Internet Rent PotentialSource Revenue Rent > 7% of
profit
Public telecoms
$18.5 M profit $17 Million
ISPs $38.7M
$6M profit
$3.3 M
Domain names
$130 M
$18.4 profit
$9.3M
TOTAL ~$30 MILLION
Land Rent Current Management
• Current State Property Taxes are set at ~1.05%, with municipalities adding additional rates.– This ratio is based on a lumping of land & building values
• Money collected goes towards the state education fund
• Additional taxes are assessed for buying, selling, and patterns of current use– Current Use Tax, Property Gains Tax, Property Transfer Tax
Current Revenue
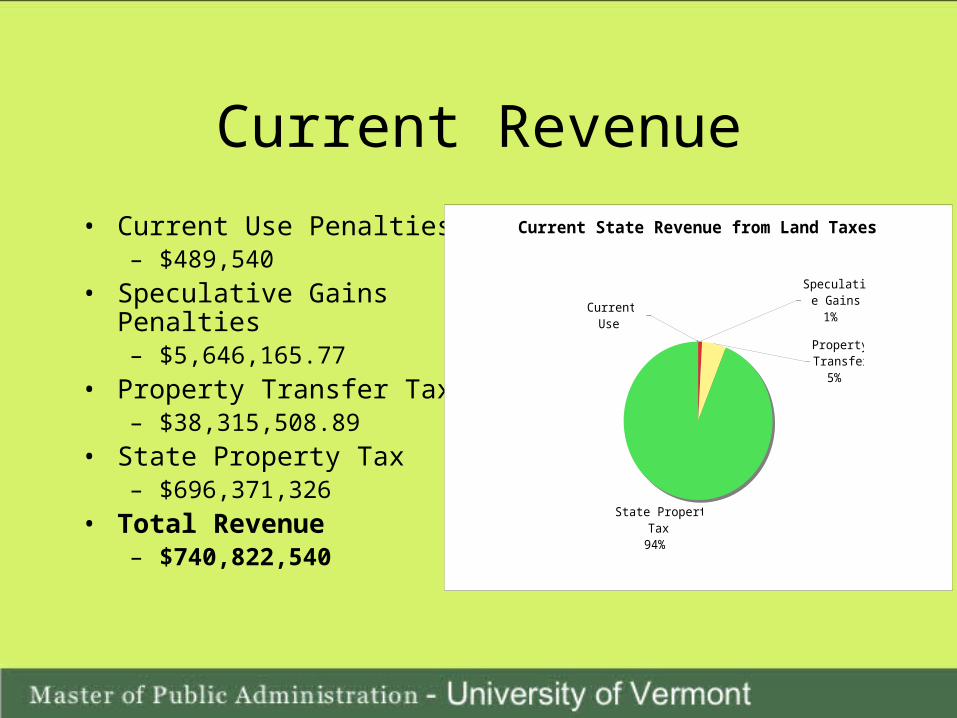
• Current Use Penalties– $489,540
• Speculative Gains Penalties– $5,646,165.77
• Property Transfer Tax– $38,315,508.89
• State Property Tax– $696,371,326
• Total Revenue– $740,822,540
Current State Revenue from Land Taxes
State Property Tax
94%
Speculative Gains
1%
Property Transfer
5%
Current Use
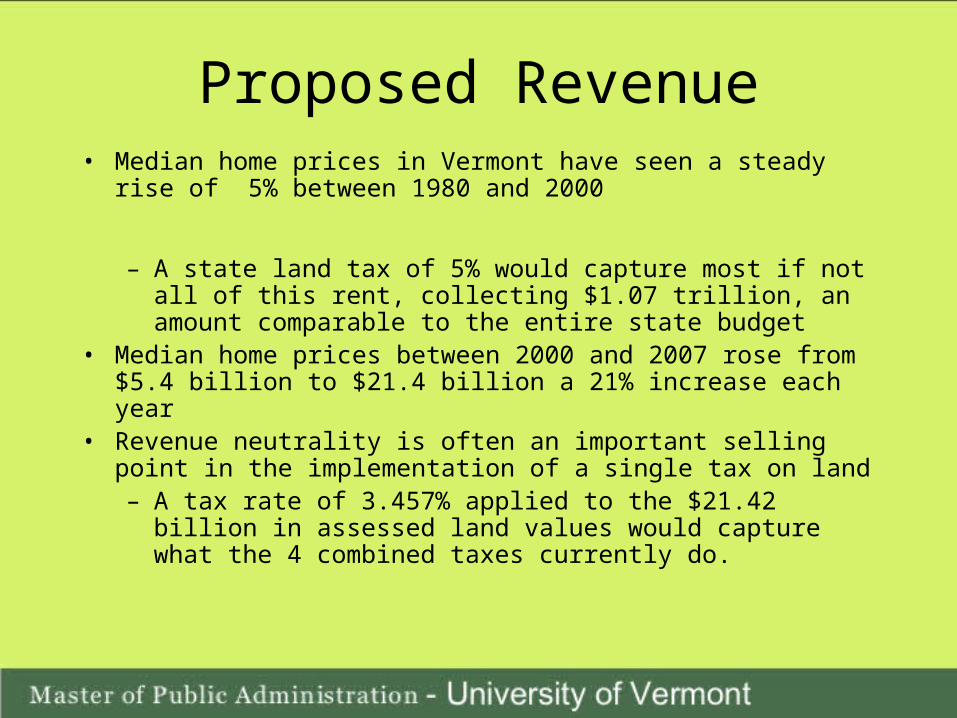
Proposed Revenue• Median home prices in Vermont have seen a steady rise of 5%
between 1980 and 2000
– A state land tax of 5% would capture most if not all of this rent, collecting $1.07 trillion, an amount comparable to the entire state budget
• Median home prices between 2000 and 2007 rose from $5.4 billion to $21.4 billion a 21% increase each year
• Revenue neutrality is often an important selling point in the implementation of a single tax on land– A tax rate of 3.457% applied to the $21.42 billion in
assessed land values would capture what the 4 combined taxes currently do.
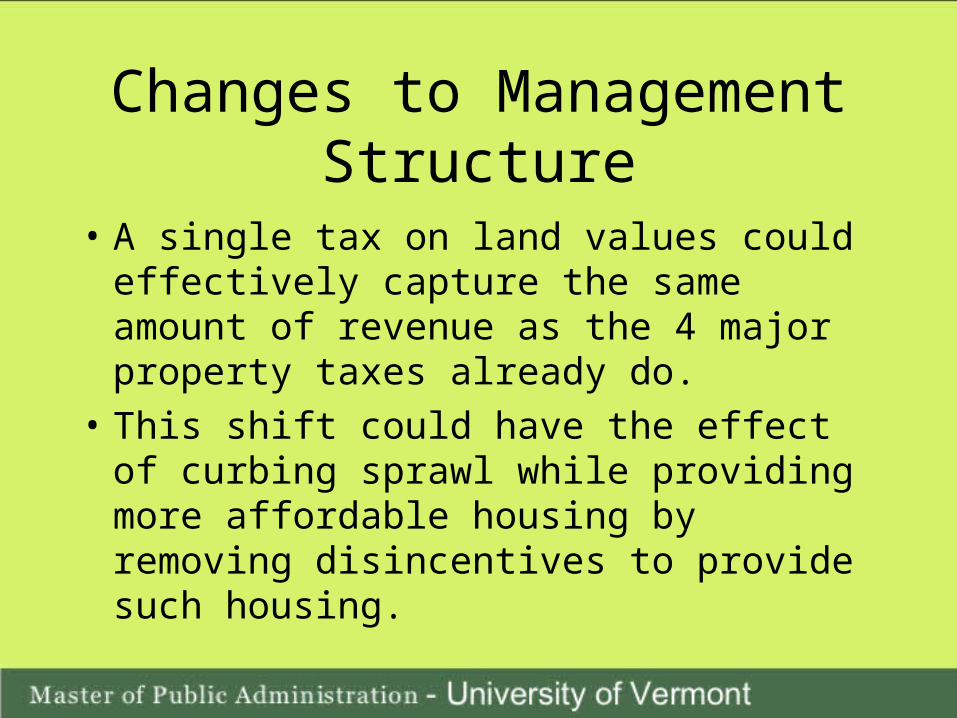
Changes to Management Structure
• A single tax on land values could effectively capture the same amount of revenue as the 4 major property taxes already do.
• This shift could have the effect of curbing sprawl while providing more affordable housing by removing disincentives to provide such housing.
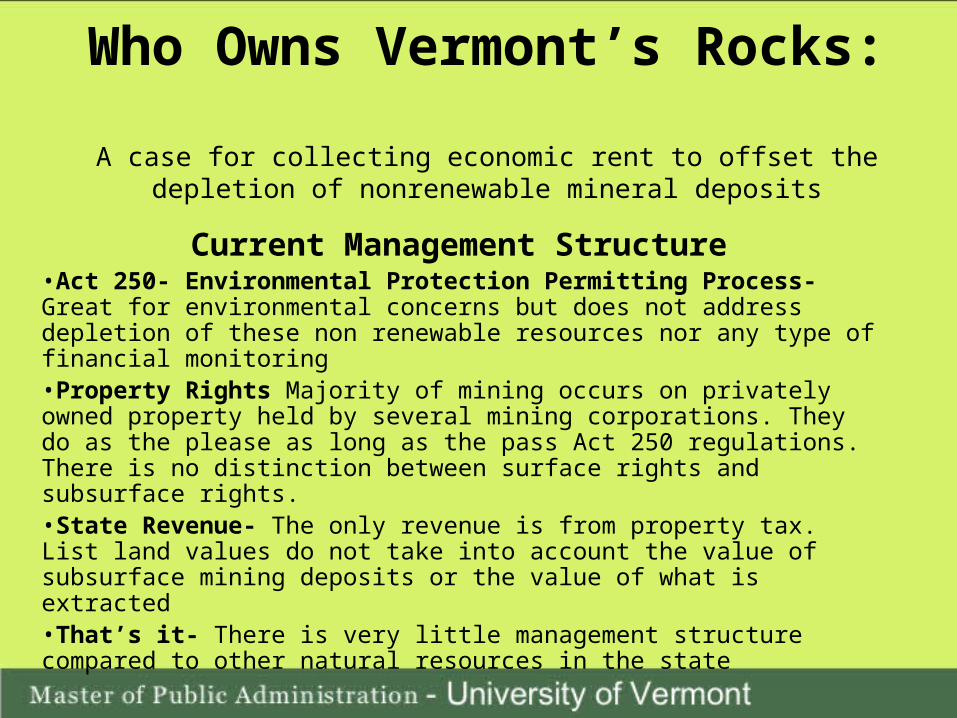
Who Owns Vermont’s Rocks: A case for collecting economic rent to offset the depletion of nonrenewable
mineral deposits
Current Management Structure•Act 250- Environmental Protection Permitting Process- Great for environmental concerns but does not address depletion of these non renewable resources nor any type of financial monitoring•Property Rights Majority of mining occurs on privately owned property held by several mining corporations. They do as the please as long as the pass Act 250 regulations. There is no distinction between surface rights and subsurface rights.•State Revenue- The only revenue is from property tax. List land values do not take into account the value of subsurface mining deposits or the value of what is extracted•That’s it- There is very little management structure compared to other natural resources in the state
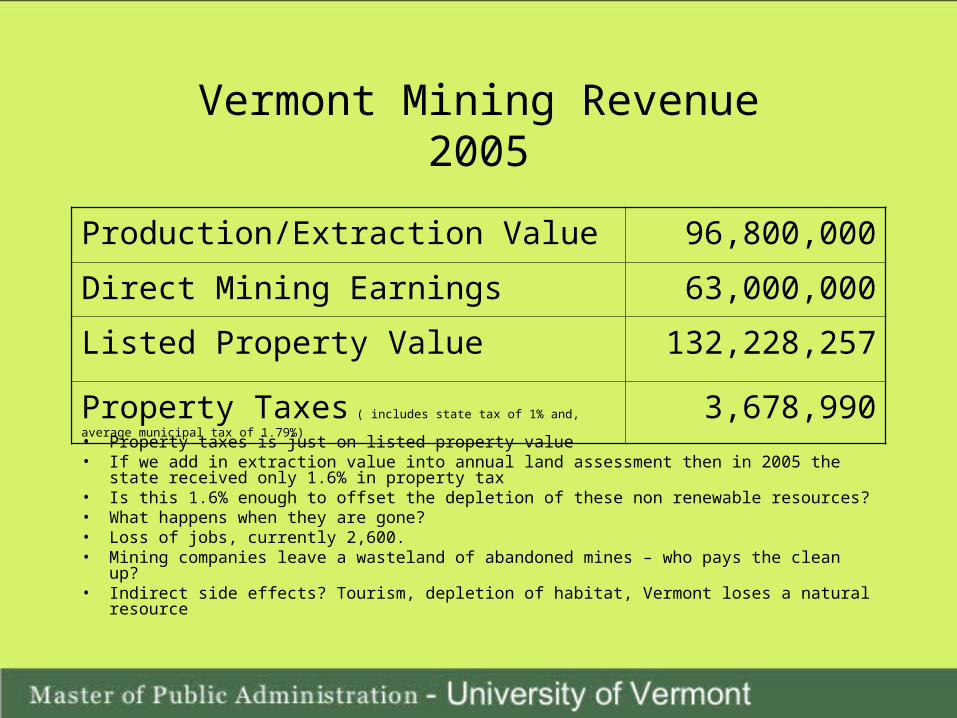
Vermont Mining Revenue2005
Production/Extraction Value 96,800,000
Direct Mining Earnings 63,000,000
Listed Property Value 132,228,257
Property Taxes ( includes state tax of 1% and, average municipal tax of 1.79%) 3,678,990• Property taxes is just on listed property value• If we add in extraction value into annual land assessment then in 2005 the state received
only 1.6% in property tax• Is this 1.6% enough to offset the depletion of these non renewable resources?• What happens when they are gone?• Loss of jobs, currently 2,600.• Mining companies leave a wasteland of abandoned mines – who pays the clean up?• Indirect side effects? Tourism, depletion of habitat, Vermont loses a natural resource
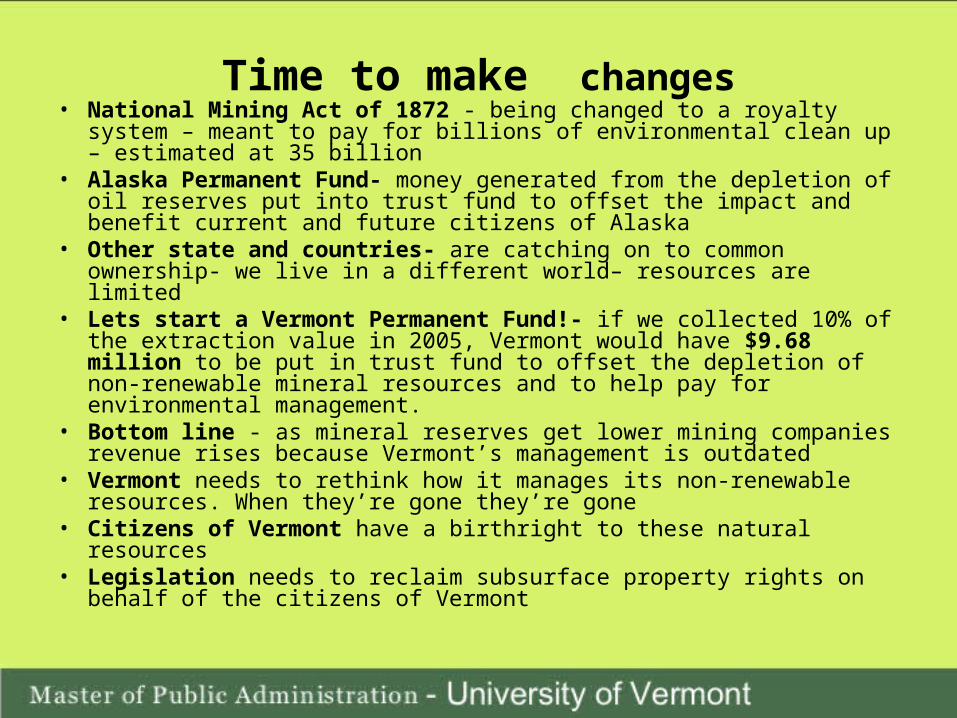
Time to make changes• National Mining Act of 1872 - being changed to a royalty system – meant
to pay for billions of environmental clean up – estimated at 35 billion• Alaska Permanent Fund- money generated from the depletion of oil
reserves put into trust fund to offset the impact and benefit current and future citizens of Alaska
• Other state and countries- are catching on to common ownership- we live in a different world– resources are limited
• Lets start a Vermont Permanent Fund!- if we collected 10% of the extraction value in 2005, Vermont would have $9.68 million to be put in trust fund to offset the depletion of non-renewable mineral resources and to help pay for environmental management.
• Bottom line - as mineral reserves get lower mining companies revenue rises because Vermont’s management is outdated
• Vermont needs to rethink how it manages its non-renewable resources. When they’re gone they’re gone
• Citizens of Vermont have a birthright to these natural resources• Legislation needs to reclaim subsurface property rights on behalf of the
citizens of Vermont
Spectrum in Vermont
William Murray
Spectrum
“It is the purpose of this Act, among other things, to maintain the control of the United States over all the channels of interstate and foreign radio transmissions; and to provide for the use of such channels, but not the ownership thereof, by persons for limited periods of time, under licenses granted by federal authority, and no such license shall be construed to create any right, beyond the terms, conditions, and periods of the license.”
-The Communication Act of 1934
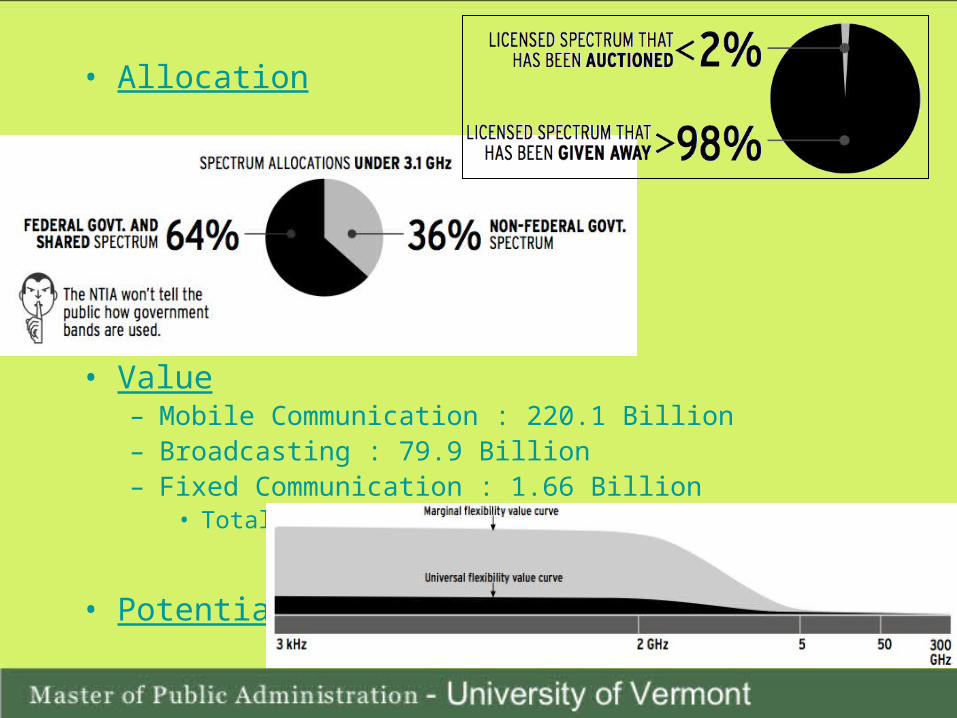
• Allocation
• Value– Mobile Communication : 220.1 Billion– Broadcasting : 79.9 Billion– Fixed Communication : 1.66 Billion
• Total: $301.78 Billion Annual use value
• Potential
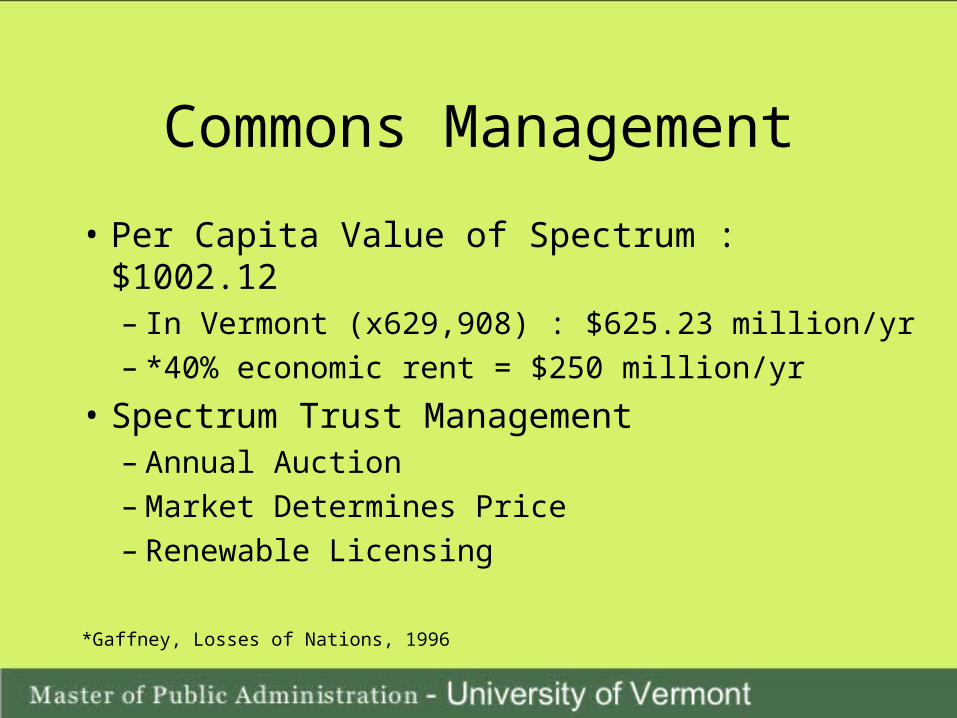
Commons Management
• Per Capita Value of Spectrum : $1002.12– In Vermont (x629,908) : $625.23 million/yr– *40% economic rent = $250 million/yr
• Spectrum Trust Management– Annual Auction– Market Determines Price– Renewable Licensing
*Gaffney, Losses of Nations, 1996
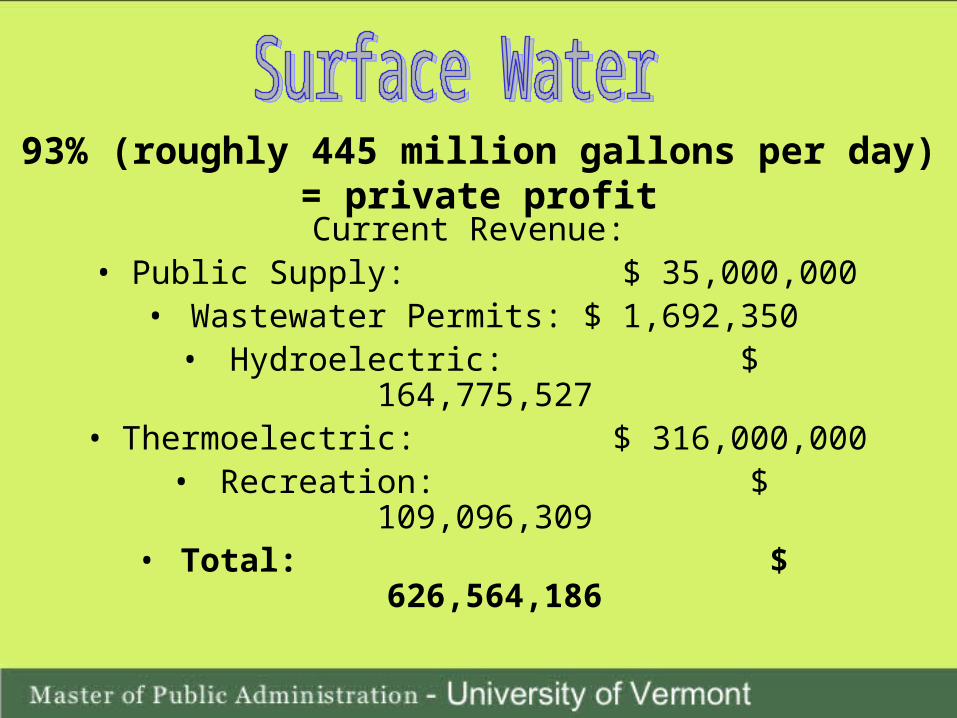
93% (roughly 445 million gallons per day) = private profit
Current Revenue: • Public Supply: $ 35,000,000• Wastewater Permits: $ 1,692,350
• Hydroelectric: $ 164,775,527 • Thermoelectric: $ 316,000,000 • Recreation: $ 109,096,309 • Total: $ 626,564,186
Thermoelectric Withdrawals
QuickTime™ and aTIFF (Uncompressed) decompressor
are needed to see this picture.
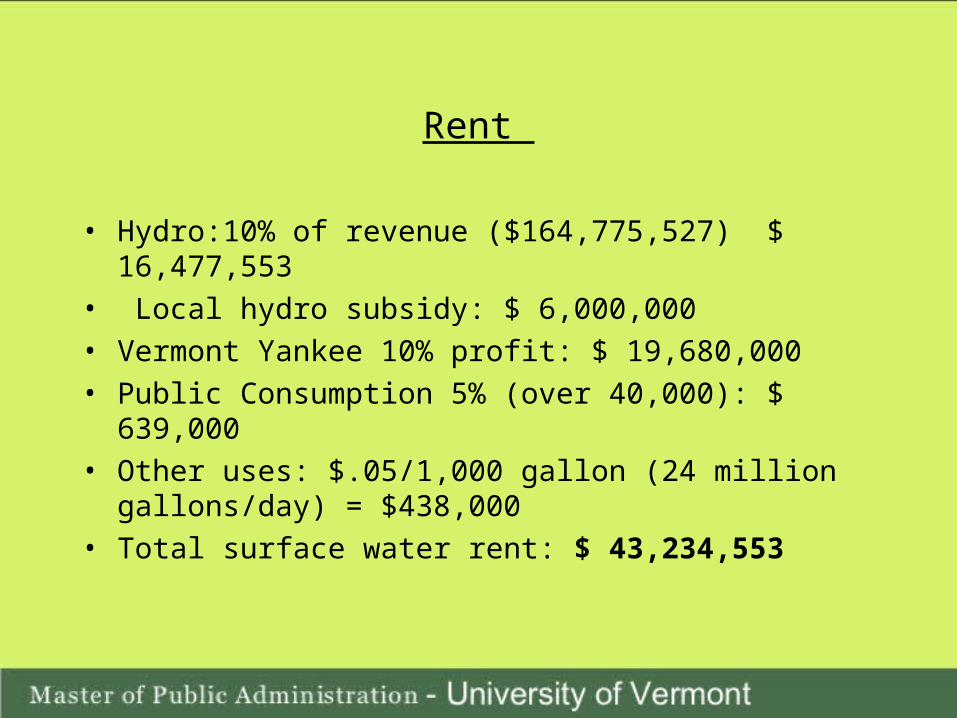
Rent
• Hydro:10% of revenue ($164,775,527) $ 16,477,553
• Local hydro subsidy: $ 6,000,000
• Vermont Yankee 10% profit: $ 19,680,000
• Public Consumption 5% (over 40,000): $ 639,000
• Other uses: $.05/1,000 gallon (24 million gallons/day) = $438,000
• Total surface water rent: $ 43,234,553
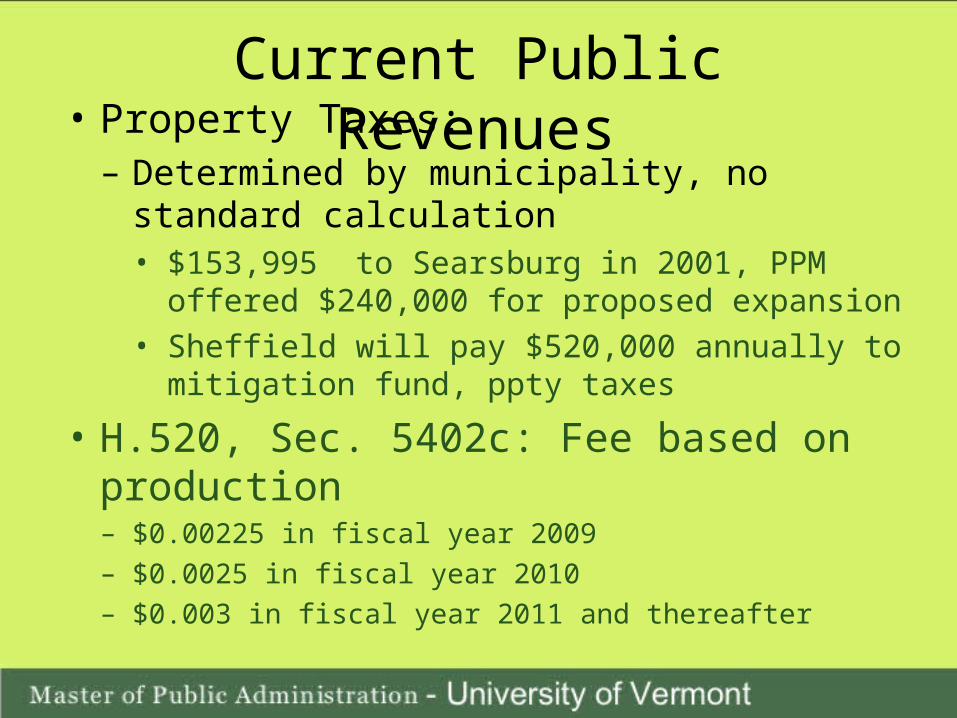
Current Public Revenues• Property Taxes:
– Determined by municipality, no standard calculation• $153,995 to Searsburg in 2001, PPM offered
$240,000 for proposed expansion• Sheffield will pay $520,000 annually to mitigation
fund, ppty taxes
• H.520, Sec. 5402c: Fee based on production – $0.00225 in fiscal year 2009
– $0.0025 in fiscal year 2010
– $0.003 in fiscal year 2011 and thereafter
Potential Public Revenue • Capture economic rent on resource use
• Different fiscal structures could be used– Economic analysis by energy economist would
be needed to determine which would work best– Would need to not discourage production of wind
energy– Instead of taxing production (which is a cost),
take portion of economic rent (not a cost)
• Revenue could go into a fund– Fund management would need to be discussed
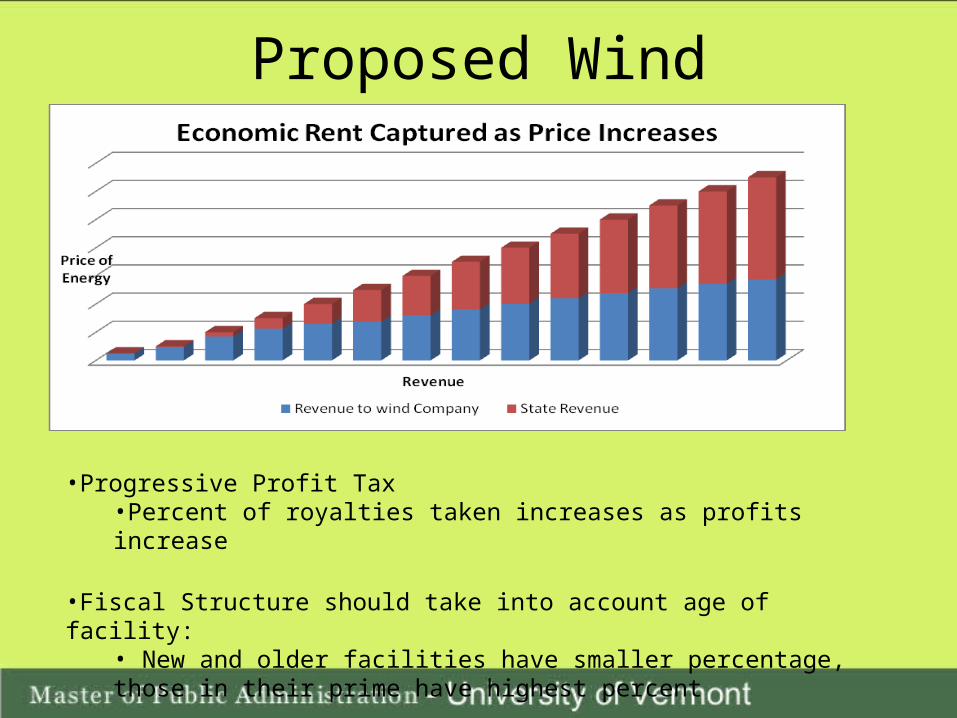
Proposed Wind Guidelines
•Progressive Profit Tax•Percent of royalties taken increases as profits increase
•Fiscal Structure should take into account age of facility:• New and older facilities have smaller percentage, those in their prime have highest percent
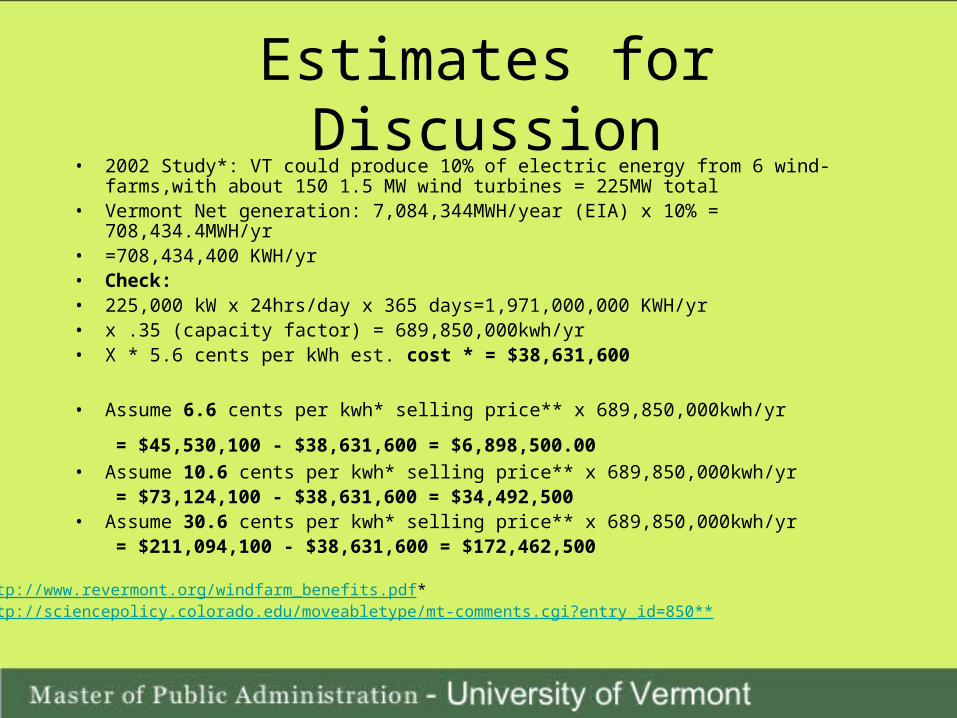
Estimates for Discussion• 2002 Study*: VT could produce 10% of electric energy from 6 wind-farms,with about
150 1.5 MW wind turbines = 225MW total• Vermont Net generation: 7,084,344MWH/year (EIA) x 10% = 708,434.4MWH/yr• =708,434,400 KWH/yr• Check:• 225,000 kW x 24hrs/day x 365 days=1,971,000,000 KWH/yr• x .35 (capacity factor) = 689,850,000kwh/yr• X * 5.6 cents per kWh est. cost * = $38,631,600
• Assume 6.6 cents per kwh* selling price** x 689,850,000kwh/yr
= $45,530,100 - $38,631,600 = $6,898,500.00 • Assume 10.6 cents per kwh* selling price** x 689,850,000kwh/yr
= $73,124,100 - $38,631,600 = $34,492,500• Assume 30.6 cents per kwh* selling price** x 689,850,000kwh/yr
= $211,094,100 - $38,631,600 = $172,462,500http://www.revermont.org/windfarm_benefits.pdf*http://sciencepolicy.colorado.edu/moveabletype/mt-comments.cgi?entry_id=850**
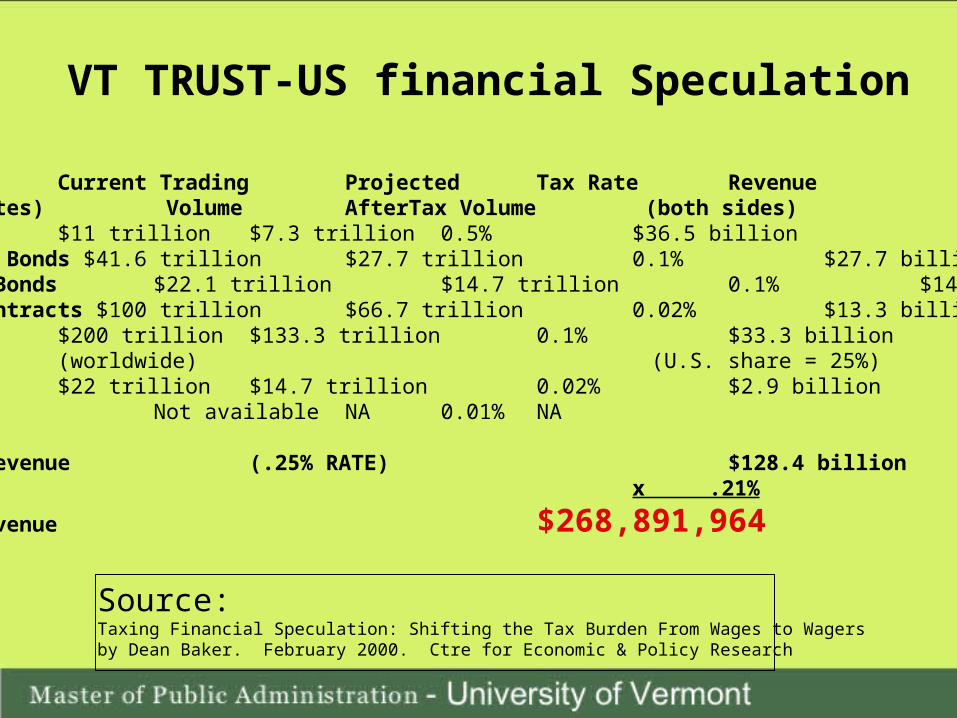
VT TRUST-US financial Speculation
Current Trading Projected Tax Rate Revenue(Annual Rates) Volume AfterTax Volume (both sides) Stocks $11 trillion $7.3 trillion 0.5% $36.5 billionGovernment Bonds $41.6 trillion $27.7 trillion 0.1% $27.7 billionCorporate Bonds $22.1 trillion $14.7 trillion 0.1% $14.7 billionFutures Contracts $100 trillion $66.7 trillion 0.02% $13.3 billionCurrency $200 trillion $133.3 trillion 0.1% $33.3 billion
(worldwide) (U.S. share = 25%)Swaps $22 trillion $14.7 trillion 0.02% $2.9 billionOptions Not available NA 0.01% NA
Total US Revenue (.25% RATE) $128.4 billionx .21%
Vermont Revenue $268,891,964
Source: Taxing Financial Speculation: Shifting the Tax Burden From Wages to Wagersby Dean Baker. February 2000. Ctre for Economic & Policy Research
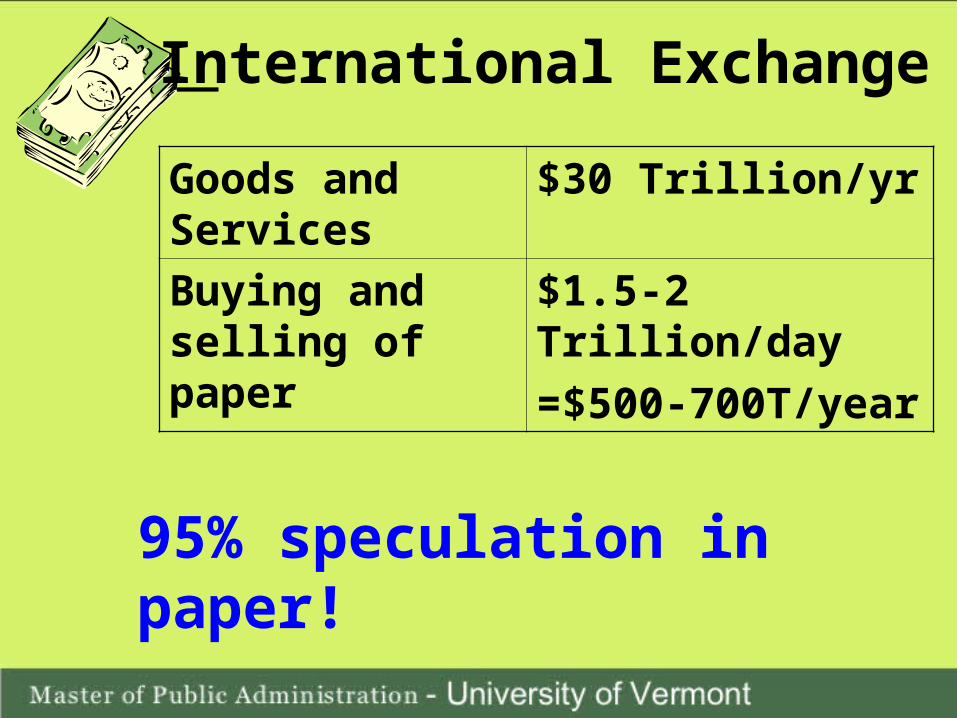
International Exchange
Goods and Services
$30 Trillion/yr
Buying and selling of paper
$1.5-2 Trillion/day
=$500-700T/year
95% speculation in paper!
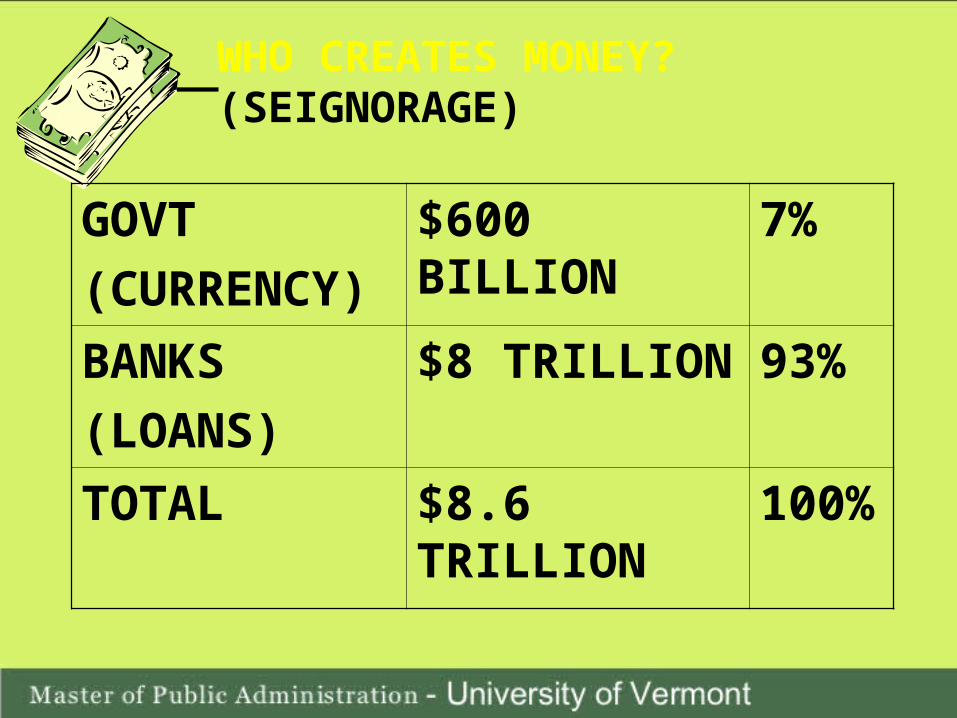
WHO CREATES MONEY? (SEIGNORAGE)
GOVT
(CURRENCY)
$600 BILLION 7%
BANKS
(LOANS)
$8 TRILLION 93%
TOTAL $8.6 TRILLION
100%
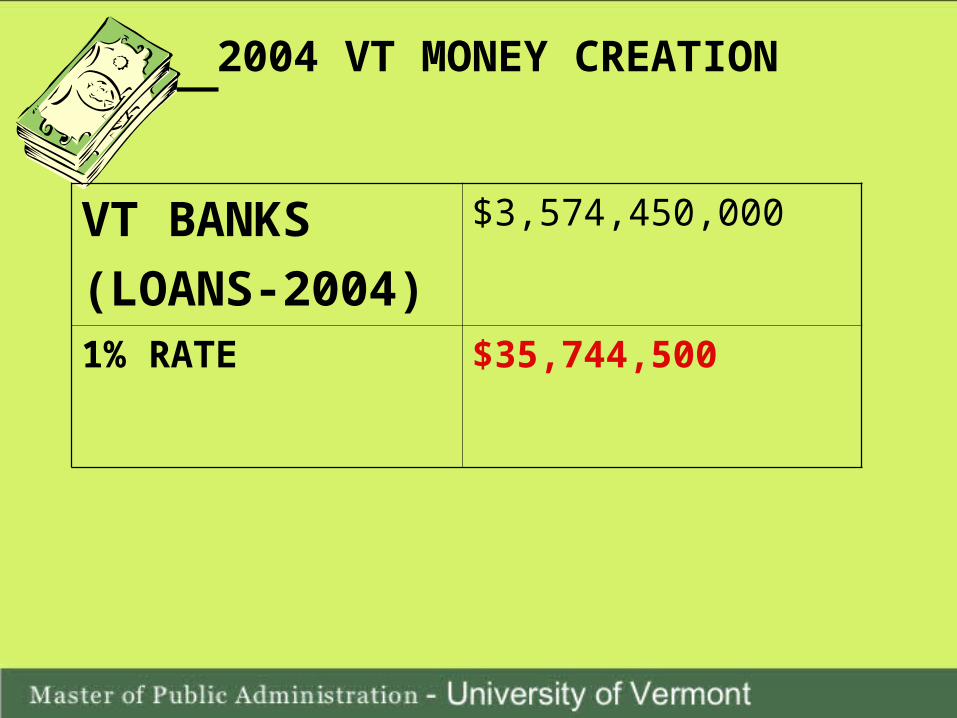
2004 VT MONEY CREATION
VT BANKS
(LOANS-2004)
$3,574,450,000
1% RATE $35,744,500
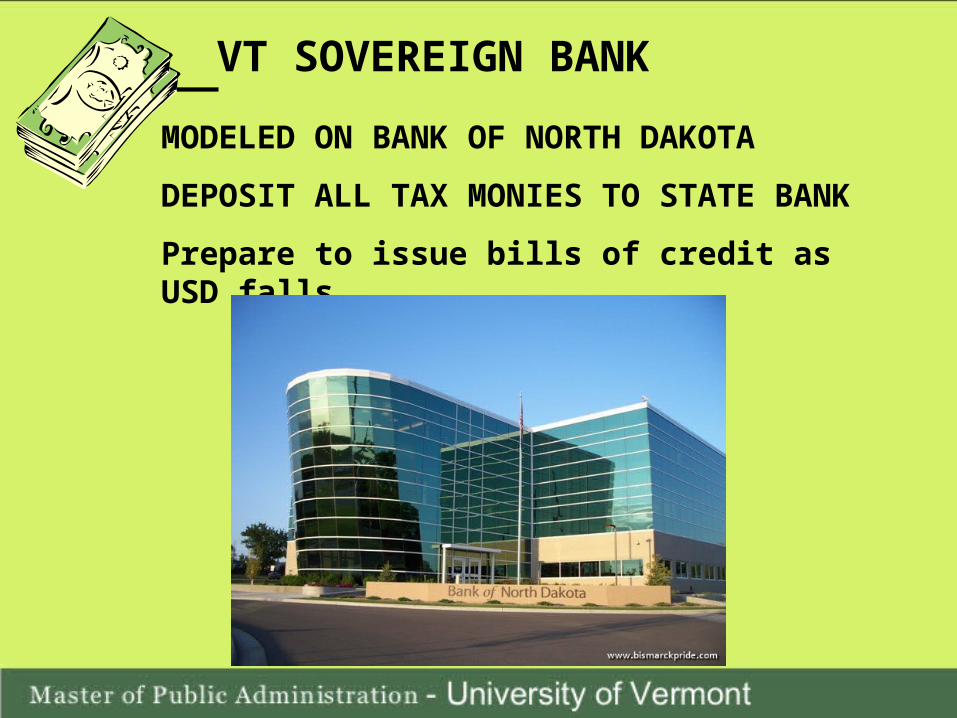
VT SOVEREIGN BANK
MODELED ON BANK OF NORTH DAKOTA
DEPOSIT ALL TAX MONIES TO STATE BANK
Prepare to issue bills of credit as USD falls
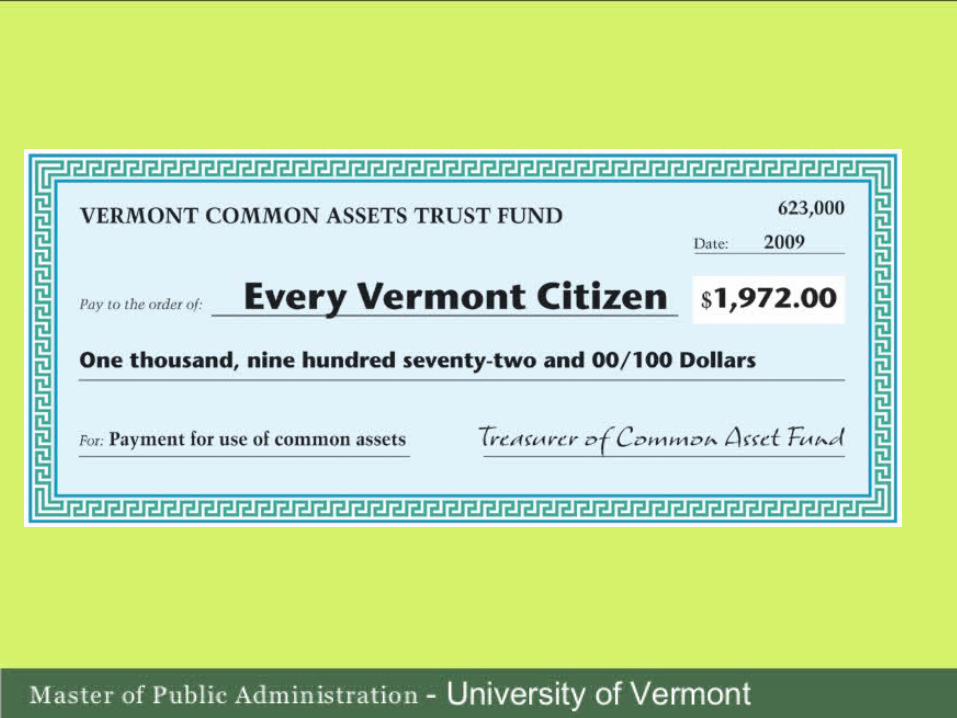
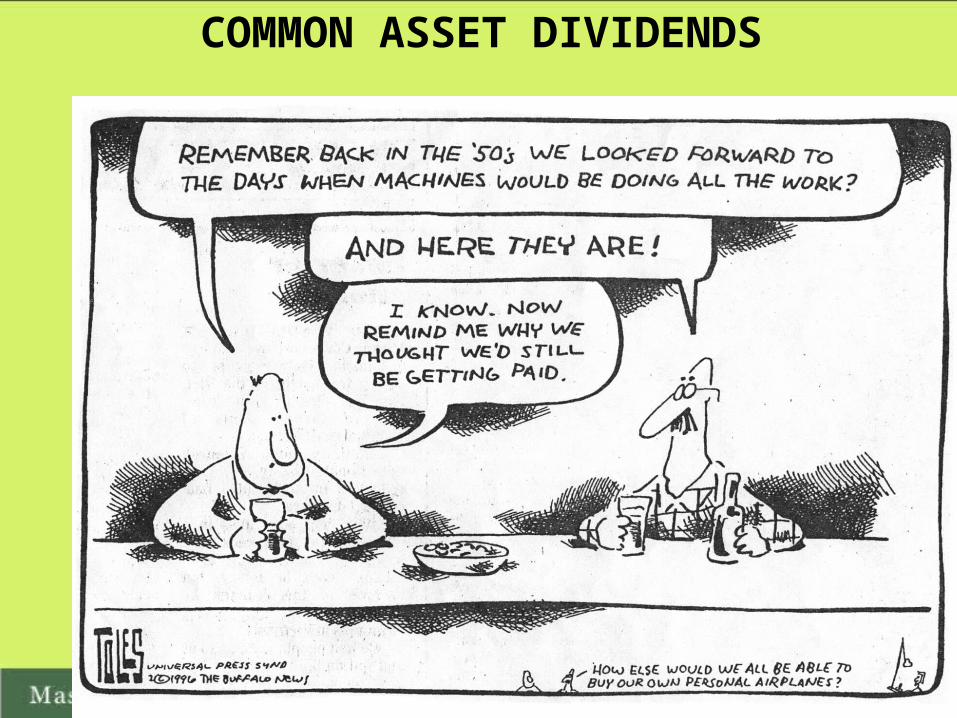
COMMON ASSET DIVIDENDS
Cutting Wasteful & Environmentally Harmful Spending
Subsidy Reform
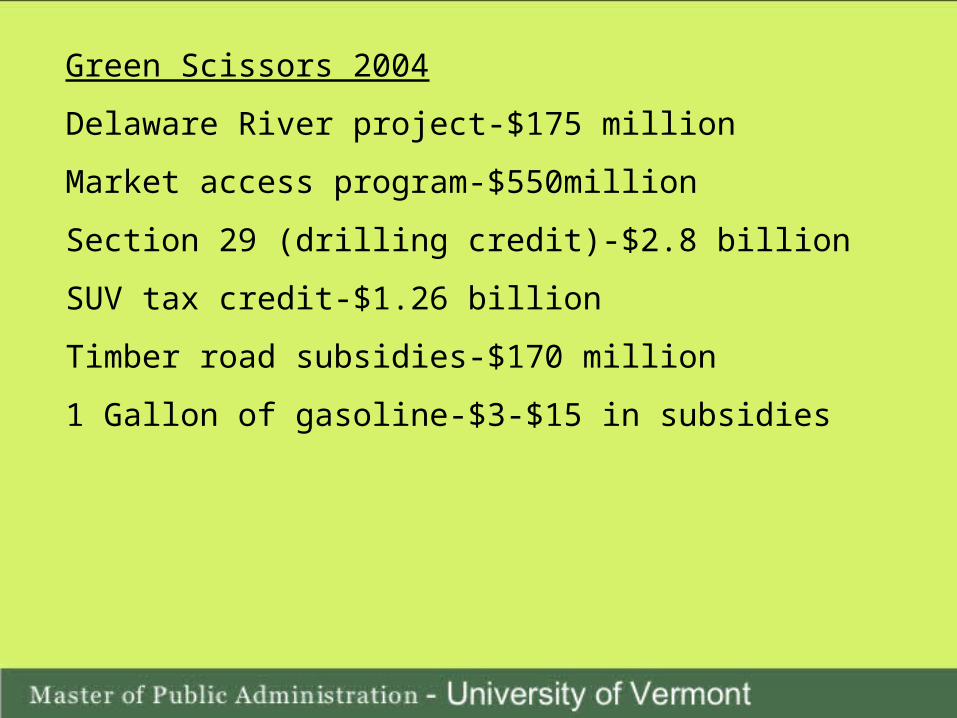
Green Scissors 2004
Delaware River project-$175 million
Market access program-$550million
Section 29 (drilling credit)-$2.8 billion
SUV tax credit-$1.26 billion
Timber road subsidies-$170 million
1 Gallon of gasoline-$3-$15 in subsidies