Embed Size (px)
Citation preview

You are here: FPA Net > FPA Journal > Past Issues & Articles > 2006 Issues > 2006 January Issue - Article 7
LoginSearchHomepage
Past Issues & ArticlesPast IssuesFind ArticlesLarge-Quantity ReprintsPermission to Reprint
Contributions Value Investing and the Business Cycle by Seung-Woog (Austin) Kwag, Ph.D., and Sang Whi Lee, Ph.D.
Executive Summary
Although developed in the 1920s, value investing is still a major investment strategy. This research examines value investing in the context of the business cycle. The study compares a value-oriented portfolio with a growth-oriented portfolio in an expansion and a contraction period of the business cycle. The value portfolio includes stocks with a high book-to-market ratio (B/P), earnings-to-price ratio (E/P), cash flow-to-price ratio (C/P), and dividend yield (DY), while the growth portfolio contains stocks with low values of B/P, E/P, C/P, and DY. Three risk-adjusted performance measures—Sharpe (total risk-adjusted), Treynor (market risk-adjusted), and the information ratio (portfolio-specific risk-adjusted)-are used to compare the performance of the two portfolios. Evidence suggests that the value portfolio consistently outperforms the growth portfolio throughout the business cycle.
Seung-Woog (Austin) Kwag, Ph.D., is an assistant professor of finance in the Department of Business Administration at Utah State University in Logan, Utah.
Sang Whi Lee, Ph.D., is an assistant professor in the School of Economics and International Trade & Business in Kyung Hee University in Seoul, Korea.
Value investing originated in the 1920s at a time when investors were guided mostly by speculation and insider information (Graham and Dodd). Its introduction represented the first rational basis for investment decisions. The underlying principle of value investing is to invest in companies trading below their true value. This can be measured using fundamentals such as book value of equity, earnings, cash flow, and dividends. Despite significant changes in the economy and securities markets during the last several decades, value investing has proved to be one of the most successful investment strategies, and its success verifies not only its validity but its competitiveness, compared with modern portfolio theory based on the efficient market hypothesis. Several strategies for value investing exist. These include investing in companies with high valuation ratios such as book-to-market (B/P), earnings-to-price (E/P), and cash flow-to-price (C/P) ratios, and in companies with high dividend yields (DY). In contrast, growth investing strategies are generally defined as those involving investments in companies with low valuation ratios. This study examines these two
Page 1 of 11FPA Journal - Value Investing and the Business Cycle
1/27/2006http://www.fpanet.org/journal/articles/2006_Issues/jfp0106-art7.cfm

strategies in the context of the business cycle—specifically, contraction and expansion of the economy. This is important to investors since business downturns (contractions) and upturns (expansions) may have different impacts on value investing than they do on demand for industrial products. For instance, demand for technological goods benefits more from upturns and suffers more from downturns than does demand for durable goods. If returns from value investing are sensitive to the business cycle, investors should pursue value investing with caution, taking into account economic conditions. Although an extensive body of previous research on value investing has documented the tendency of stocks with high valuation ratios to outperform stocks with low valuation ratios, no studies have explicitly investigated the impact of the business cycle on value investing. Given that the business cycle reflects economic risks, it is important that investors and financial planners understand the relationship between value investing and the business cycle. We analyze this relationship for the two states of economy: contraction and expansion. The focus of this study is mean monthly performance of value investments adjusted for total risk, market risk (beta), and portfolio-specific risk, measured during two distinct economic periods—economic contraction and expansion. Performance is measured using well-known risk-adjusted measures of portfolio performance: the Sharpe measure, the Treynor measure, and the information ratio. We find that value investing works in both contraction and expansion markets. More interestingly, the empirical evidence suggests that value investing is more valuable during the contraction period. Therefore, understanding the linkage of the contraction risk to value investing will help investors and financial planners optimally allocate funds across investment assets. Specifically, financial planners who predict a contraction must take the contraction risk into consideration in their asset allocation decision, especially for growth stocks.
Prior Evidence on Value Investing
Researchers and practitioners have found a plethora of evidence that value investing generates higher returns than growth investing. Chan, Hamao, and Lakonishok (1991) examined the relationship between returns on Japanese stocks and E/P, B/P, and C/P. They found that stocks with high valuation ratios generated higher returns than stocks with low valuation ratios. Chin, Prevost, and Gottesman (2002) demonstrated the usefulness of various value investing strategies using valuation ratios in New Zealand. Consistent with most of the evidence drawn from the U.S. and Japanese markets, value investing strategies produced superior returns to growth-oriented strategies. Proponents of the market efficiency theory suggest that value investing must generate high returns to compensate for their high risk (Fama and French 1992, Chen and Zhang 1998). They argue that price multiples are themselves proxies for unobservable common risk factors and simply control for dimensions of risk not captured by market risk. This argument has an important implication. The seemingly abnormal returns from value investing that have not been fully adjusted for unknown risk factors may be merely compensation for these additional risks. On the other hand, proponents of the inefficiency of markets suggest that the superior performance of value investing relative to growth investing is due to investor irrationality. La Porta, Lakonishok, Shleifer, and Vishny (1997) maintain that the superior performance of value investing is the result of expectational errors made by irrational market participants. They contend that valuation ratios are proxies for such expectational errors. Consequently, value investing results in superior returns by exploiting the suboptimal behavior of these market participants. Lakonishok, Shleifer, and Vishny (1994) refute the risk-based explanation by showing that value
Page 2 of 11FPA Journal - Value Investing and the Business Cycle
1/27/2006http://www.fpanet.org/journal/articles/2006_Issues/jfp0106-art7.cfm

investing is not fundamentally riskier than growth investing.
What Our Sample Represents
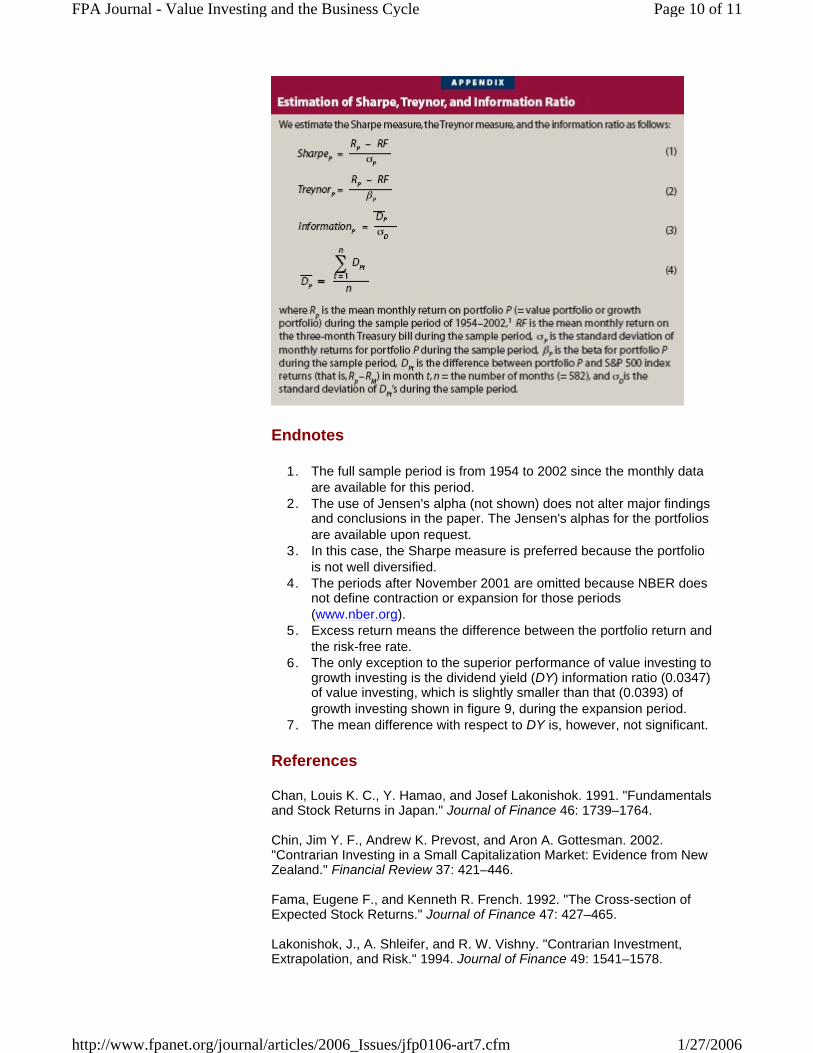
Value-weighted monthly returns for B/P-, E/P-, C/P-, and DY-based quintile portfolios from the lowest (bottom 20 percent) to the highest (top 20 percent) observations are available via Wharton Research Data Services. The lowest quintile portfolio (P1) represents the bottom 20 percent of stocks with low values of B/P, E/P, C/P, and DY, while the highest quintile portfolio (P5) contains the top 20 percent of stocks with high values of B/P, E/P, C/P, and DY. The focus here is on these two extreme portfolios. The latter portfolio represents value investing, while the former represents growth investing. By excluding the middle portfolios (that is, portfolios P2-P4), the analysis mitigates the effects of classification error due to growth-investing stocks co-mingling with value-investing stocks. The sample covers the period from July 1954 to December 2002, and includes 582 monthly observations for each portfolio.¹ To allow for variation in risk among portfolios, three risk-adjusted portfolio performance measures—the Sharpe measure, the Treynor measure, and the information ratio—are used.² These measures are all computed on a monthly basis. Estimation equations for the measures are described in the appendix. In this research, the types of portfolios are not specified. Therefore, when the empirical evidence shows conflict among the three performance measures, the interpretation of evidence can differ among investors depending on what type of portfolios they are holding. Suppose, for example, that the evidence indicates that value investing is more valuable than growth investing in terms of the Treynor measure, while growth investing is more profitable than value investing in terms of the Sharpe measure. If an investor were holding only one risky active portfolio of stocks with low valuation ratios, he or she would be motivated to invest more funds in the current portfolio because the Sharpe measure would be the more relevant performance measure.³ If the investor's risky portfolio contained stocks with high valuation ratios, the investor would liquidate the current portfolio and form a new active portfolio of stocks with low valuation ratios. Investors should, therefore, interpret our evidence with caution.
Value Investing Versus Growth Investing During the Whole Sample Period
Figure 1 presents results for the Sharpe performance measure. Results show differences between value and growth investing. The Sharpe measures for value investing (0.1776, 0.2056, 0.2096, and 0.1698) are all larger than those for growth investing (0.0926, 0.0675, 0.0797, and 0.0989). Average total risk-adjusted returns from value investing are typically more than double those from growth investing.
Page 3 of 11FPA Journal - Value Investing and the Business Cycle
1/27/2006http://www.fpanet.org/journal/articles/2006_Issues/jfp0106-art7.cfm

Figure 2 also shows that value investing generates higher returns than growth investing with regard to the Treynor measure. The Treynor measures of value investing (0.7952, 0.9008, 0.9023, and 0.7580) are all larger than those for growth investing (0.4574, 0.3423, 0.4025, 0.4830). For the E/P and C/P ratios, the Treynor measures for value investing are more than double those for growth investing.
The performance difference between value and growth investing is even larger when using the information ratio (shown in Figure 3). Three of four growth-investing strategies have negative information ratios, while the fourth has only a very small, positive ratio. In contrast, information ratios for
Page 4 of 11FPA Journal - Value Investing and the Business Cycle
1/27/2006http://www.fpanet.org/journal/articles/2006_Issues/jfp0106-art7.cfm

all four value-investing strategies are positive and significantly larger than those for growth investing. The pair-wise comparison test (that is, mean test) indicates that for all valuation ratios, the risk-adjusted return of value investing is significantly higher than that of growth investing at the 1 percent level. These results suggest that value investing is a more profitable investment strategy than growth investing, even after adjusting for total, market, and portfolio-specific risks.
Impact of the Business Cycle on Value Investing
To examine the impact of economic conditions on value investing, the three performance measures were analyzed over two distinct economic periods: economic contraction and expansion. According to the National Bureau of Economic Research (NBER), contraction and expansion occurred in the time periods between 1960 and 2001 that are shown in Table 1.4
Value Investing During Periods of Contraction
Figures 4 through 9 summarize the performance of value investing relative to growth investing over the two economic periods. Figure 4 presents results for the Sharpe measure during contraction periods. Absolute values
Page 5 of 11FPA Journal - Value Investing and the Business Cycle
1/27/2006http://www.fpanet.org/journal/articles/2006_Issues/jfp0106-art7.cfm
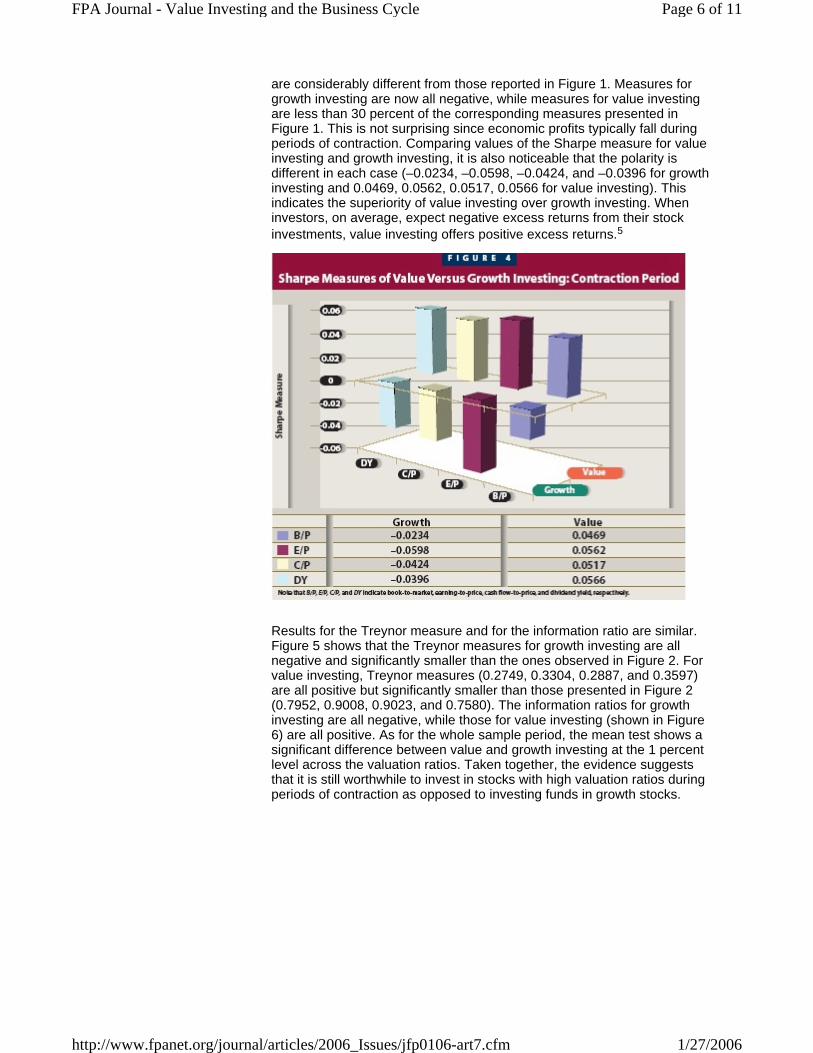
are considerably different from those reported in Figure 1. Measures for growth investing are now all negative, while measures for value investing are less than 30 percent of the corresponding measures presented in Figure 1. This is not surprising since economic profits typically fall during periods of contraction. Comparing values of the Sharpe measure for value investing and growth investing, it is also noticeable that the polarity is different in each case (–0.0234, –0.0598, –0.0424, and –0.0396 for growth investing and 0.0469, 0.0562, 0.0517, 0.0566 for value investing). This indicates the superiority of value investing over growth investing. When investors, on average, expect negative excess returns from their stock investments, value investing offers positive excess returns.5
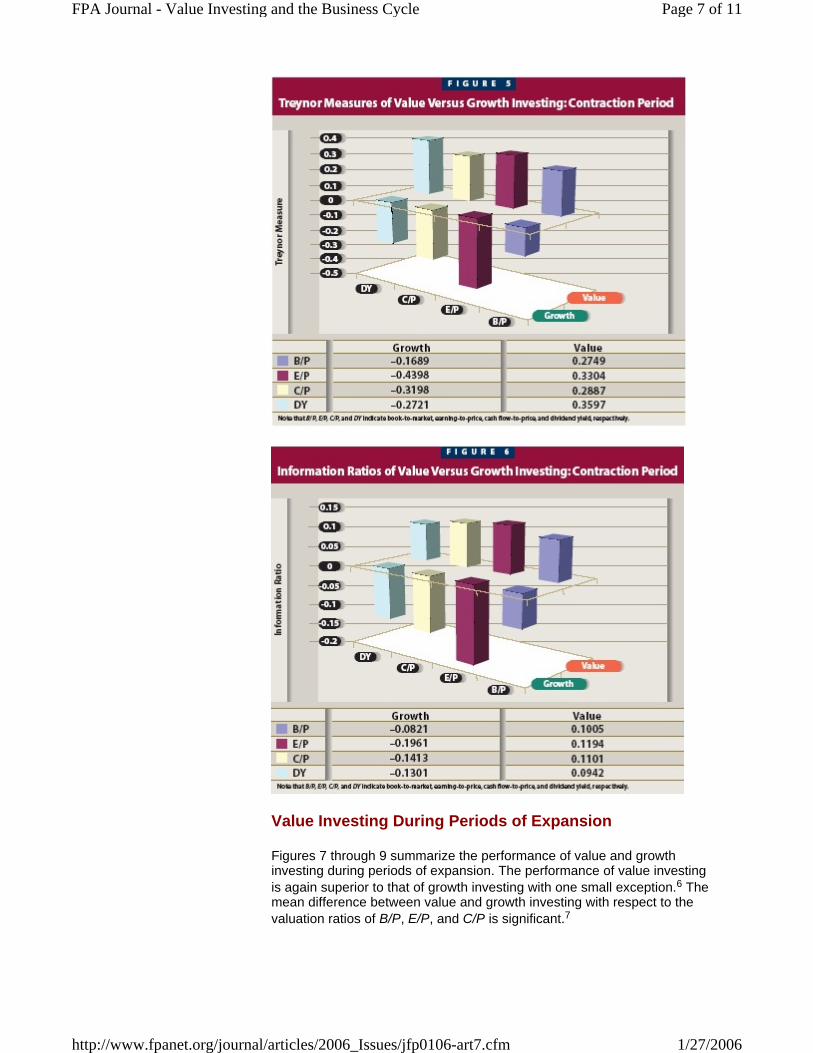
Results for the Treynor measure and for the information ratio are similar. Figure 5 shows that the Treynor measures for growth investing are all negative and significantly smaller than the ones observed in Figure 2. For value investing, Treynor measures (0.2749, 0.3304, 0.2887, and 0.3597) are all positive but significantly smaller than those presented in Figure 2 (0.7952, 0.9008, 0.9023, and 0.7580). The information ratios for growth investing are all negative, while those for value investing (shown in Figure 6) are all positive. As for the whole sample period, the mean test shows a significant difference between value and growth investing at the 1 percent level across the valuation ratios. Taken together, the evidence suggests that it is still worthwhile to invest in stocks with high valuation ratios during periods of contraction as opposed to investing funds in growth stocks.
Page 6 of 11FPA Journal - Value Investing and the Business Cycle
1/27/2006http://www.fpanet.org/journal/articles/2006_Issues/jfp0106-art7.cfm
Value Investing During Periods of Expansion
Figures 7 through 9 summarize the performance of value and growth investing during periods of expansion. The performance of value investing is again superior to that of growth investing with one small exception.6 The mean difference between value and growth investing with respect to the valuation ratios of B/P, E/P, and C/P is significant.7
Page 7 of 11FPA Journal - Value Investing and the Business Cycle
1/27/2006http://www.fpanet.org/journal/articles/2006_Issues/jfp0106-art7.cfm

Page 8 of 11FPA Journal - Value Investing and the Business Cycle
1/27/2006http://www.fpanet.org/journal/articles/2006_Issues/jfp0106-art7.cfm
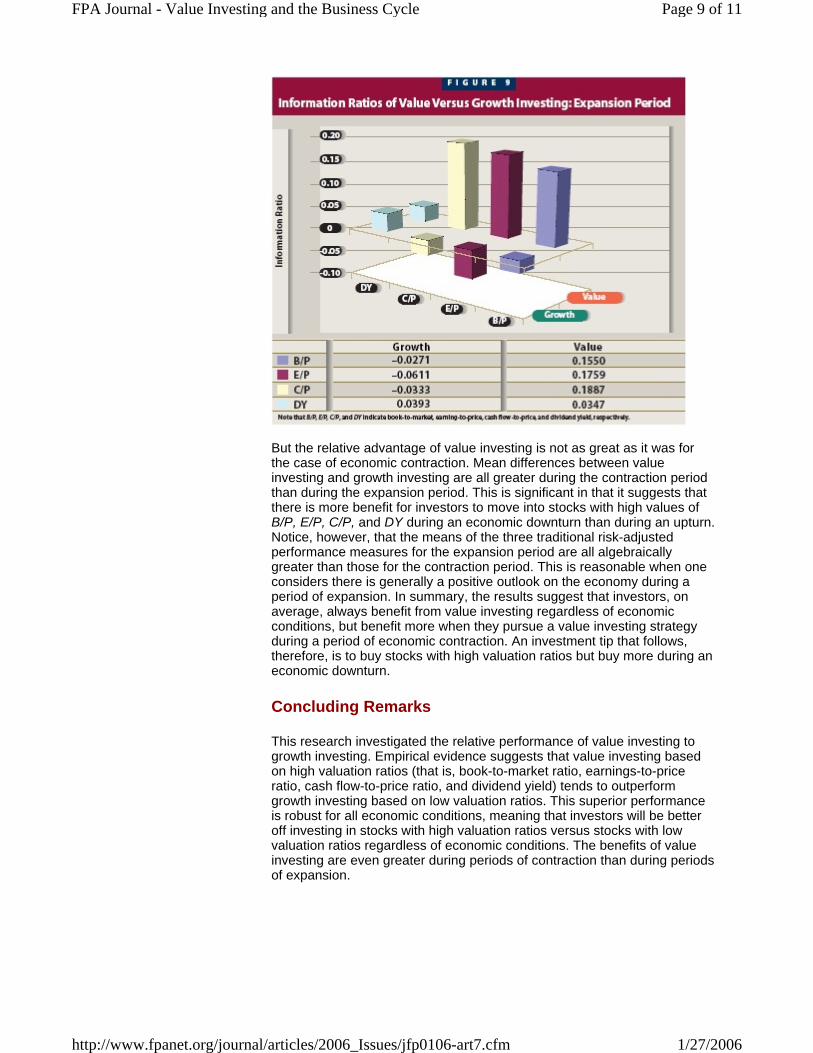
But the relative advantage of value investing is not as great as it was for the case of economic contraction. Mean differences between value investing and growth investing are all greater during the contraction period than during the expansion period. This is significant in that it suggests that there is more benefit for investors to move into stocks with high values of B/P, E/P, C/P, and DY during an economic downturn than during an upturn. Notice, however, that the means of the three traditional risk-adjusted performance measures for the expansion period are all algebraically greater than those for the contraction period. This is reasonable when one considers there is generally a positive outlook on the economy during a period of expansion. In summary, the results suggest that investors, on average, always benefit from value investing regardless of economic conditions, but benefit more when they pursue a value investing strategy during a period of economic contraction. An investment tip that follows, therefore, is to buy stocks with high valuation ratios but buy more during an economic downturn.
Concluding Remarks
This research investigated the relative performance of value investing to growth investing. Empirical evidence suggests that value investing based on high valuation ratios (that is, book-to-market ratio, earnings-to-price ratio, cash flow-to-price ratio, and dividend yield) tends to outperform growth investing based on low valuation ratios. This superior performance is robust for all economic conditions, meaning that investors will be better off investing in stocks with high valuation ratios versus stocks with low valuation ratios regardless of economic conditions. The benefits of value investing are even greater during periods of contraction than during periods of expansion.
Page 9 of 11FPA Journal - Value Investing and the Business Cycle
1/27/2006http://www.fpanet.org/journal/articles/2006_Issues/jfp0106-art7.cfm
Endnotes
1. The full sample period is from 1954 to 2002 since the monthly data are available for this period.
2. The use of Jensen's alpha (not shown) does not alter major findings and conclusions in the paper. The Jensen's alphas for the portfolios are available upon request.
3. In this case, the Sharpe measure is preferred because the portfolio is not well diversified.
4. The periods after November 2001 are omitted because NBER does not define contraction or expansion for those periods (www.nber.org).
5. Excess return means the difference between the portfolio return and the risk-free rate.
6. The only exception to the superior performance of value investing to growth investing is the dividend yield (DY) information ratio (0.0347) of value investing, which is slightly smaller than that (0.0393) of growth investing shown in figure 9, during the expansion period.
7. The mean difference with respect to DY is, however, not significant.
References
Chan, Louis K. C., Y. Hamao, and Josef Lakonishok. 1991. "Fundamentals and Stock Returns in Japan." Journal of Finance 46: 1739–1764. Chin, Jim Y. F., Andrew K. Prevost, and Aron A. Gottesman. 2002. "Contrarian Investing in a Small Capitalization Market: Evidence from New Zealand." Financial Review 37: 421–446. Fama, Eugene F., and Kenneth R. French. 1992. "The Cross-section of Expected Stock Returns." Journal of Finance 47: 427–465. Lakonishok, J., A. Shleifer, and R. W. Vishny. "Contrarian Investment, Extrapolation, and Risk." 1994. Journal of Finance 49: 1541–1578.
Page 10 of 11FPA Journal - Value Investing and the Business Cycle
1/27/2006http://www.fpanet.org/journal/articles/2006_Issues/jfp0106-art7.cfm

Sharpe, William F. "Mutual Fund Performance." 1996. Journal of Business 39: 119–138. Sharpe, William F. "The Sharpe Ratio." 1994. Journal of Portfolio Management 21: 49–59. Treynor, Jack L. "How to Rate Management of Investment Funds." 1965. Harvard Business Review 43: 63–75.
Value-Investing Web Sites
Global value investing: www.numeraire.com Value investing terminology: www.investopedia.com Discussions on value versus growth investing: www.morningstar.com Value investing education: www.gsb.columbia.edu/execed/open/programs/vi.cfm
Page 11 of 11FPA Journal - Value Investing and the Business Cycle
1/27/2006http://www.fpanet.org/journal/articles/2006_Issues/jfp0106-art7.cfm