Embed Size (px)
Citation preview
Validation of Analytical Methods for Biological Products –
A CBER Reviewer’s Experience
Presentation at the The IVT’s Analytical Procedure andMethods Validation EuropeDublin, Ireland June 20, 2017
Lokesh BhattacharyyaLab Chief, DBSQC,FDA/CBER/OCBQ
2
Presentation Outline
Regulations, guidelines and guidances
Method validation characteristics
Application of statistical methods
Validation of a previously validated method for a different product
Robustness

3
Regulations
21 CFR 211.194(a)(2): ● The statement shall indicate the location of data that establish that the
methods used in the testing of the sample meet proper standards of
accuracy and reliability as applied to the product tested.
● “(If the method employed is in the current revision of the United States
Pharmacopeia, National Formulary, AOAC INTERNATIONAL, Book of
Methods, or in other recognized standard references, or is detailed in an
approved new drug application and the referenced method is not modified,
a statement indicating the method and reference will suffice).”
● The suitability of all testing methods used shall be verified under actual
conditions of use.

4
Guidelines and Guidances
FDA Guidance : Analytical Procedures and Methods Validation for Drugs and Biologics – issued July 2015
ICH Q2(R1) Guideline : Validation of Analytical Procedures: Text and Methodology – November 2005
FDA Guidance: Bioanalytical Method Validation
USP General Chapter <1225> : Validation of Compendial Procedures
USP General Chapter <1226> : Verification of Compendial Procedures
USP General Chapter <1224> : Transfer of Analytical Procedures
5
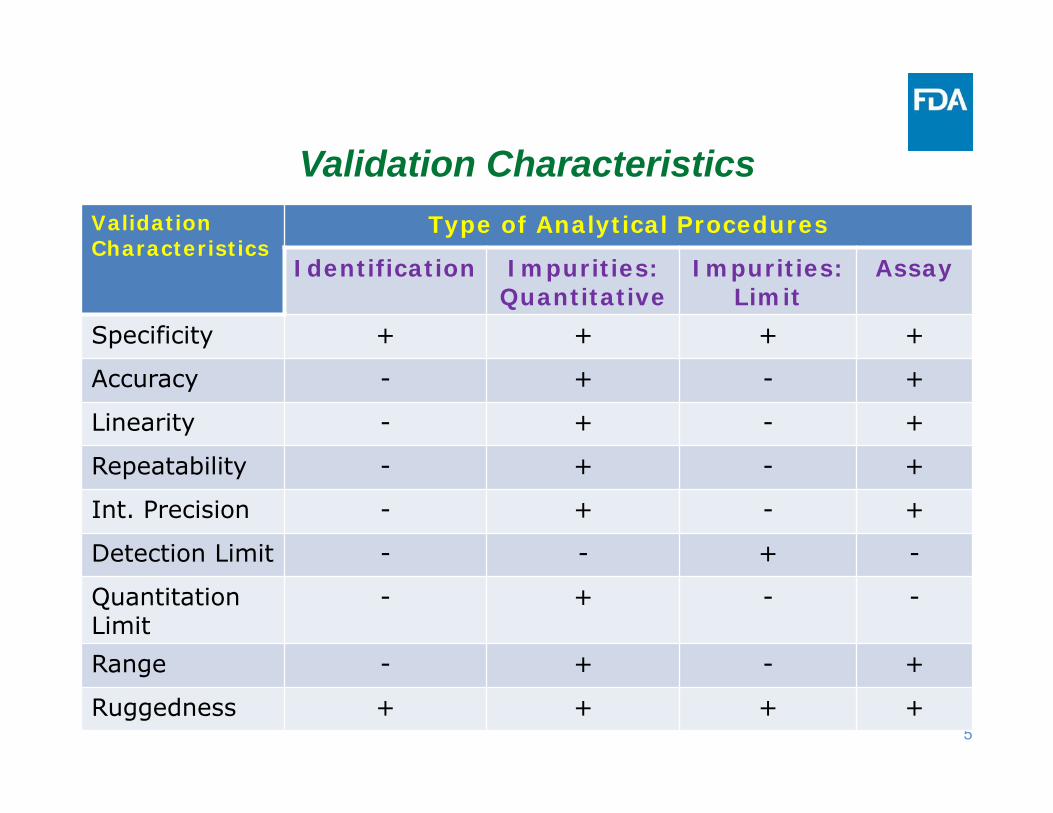
Validation CharacteristicsValidationCharacteristics
Type of Analytical Procedures
Identification Impurities: Quantitative
Impurities:Limit
Assay
Specificity + + + +
Accuracy - + - +
Linearity - + - +
Repeatability - + - +
Int. Precision - + - +
Detection Limit - - + -
Quantitation Limit
- + - -
Range - + - +
Ruggedness + + + +
6
Method Validation - General Experiments for assessing validation characteristics should
follow the procedure to be validated (including, number of replicates, calculations), unless justified otherwise (e.g., spiking, orthogonal method)
Validation experiments must be conducted using the article(s) (DS or DP) for which the method validation is conducted.
● Matrix effect
A standard (e.g., WHO, CBER, etc.) may have the same activity, which
may be modified by excipients, which may affect validation results
Sometimes standards may be used in lieu of DS/DP
● If matrix is not significantly different from that of DS/DP
Addition of standard (spiking) should not alter matrix significantly
7
Method Validation - General Validation characteristics should be evaluated in terms of
reportable results
● Exception – linearity : Response vs reportable result (conc., activity,
peak percent)
Representative Lots of Appropriate Materials
● Intermediates, Bulk, Final Container
● Multiple lots recommended for Biological Product Assays
● Exceptions possible in certain cases
Concentrations/potency covers at least the specification range -Data above and below the specification range are not relevant
Experimental Design to Evaluate Various Validation Parameters Simultaneously
8
Specificity
ICH Q2(R1) – Specificity is the ability to assess unequivocally the analyte in the presence of components which may be expected to be present [p. 8]
Implications ● Identification: ensure the identity of an analyte.
● Purity Tests: ensure that all the analytical procedures performed allow an accurate statement of the content of impurities of an analyte, i.e. related substances test, heavy metals, residual solvents content, etc.
● Assay (content or potency): provide an exact result which allows an accurate statement on the content or potency of the analyte in a sample.
9
Specificity
Accuracy, linearity and precision are part of Specificity for Assay (content) and Quantitative tests for purity/impurity.● This is an often misunderstood point
Specificity should show:● Lack of matrix interference, including suppression or
enhancement of response by matrix components
If there is matrix interference, the procedure must be able to subtract or correct for the interference (e.g. correction factor)
● Resolution: Ability to resolve analyte from other components
Ensure that there is no peak underneath an apparent single peak (peak purity analysis)
10
Specificity
Unique response from the analyte under test conditions● Positive response from a positive control, and none or negligibly
small response from a negative control
● Chromatographic method – retention time, peak resolution, elution profile, comparison with an authentic standard
● Spectroscopic method – unique wavelength, unique pattern
● Unique reagents (e.g., Karl Fischer method) supported by available knowledge
● Recovery (expected vs actual) unaffected by the matrix
Issue: How to know what is expected? Same method is circular. An
orthogonal method may be the answer
Difficult to get an orthogonal method for biological assays
11
Specificity Representative matrix vs sample
● Matrix without analyte may not be available for biological products
● Mock/laboratory formulation of representative matrix may be acceptable in some cases
Residual from sample linearity study
● Random distribution around 0 response at 0 conc./potency
● This is not possible for many biological products – e.g., the standard curve is a log-log or a semi-log plot
Stability indicating assays
● Analyze in the presence of all actual and potential degradants
● Samples subjected to stress conditions (heat, humidity, light)
12
Accuracy
ICH Q2(R1) – The accuracy of an analytical procedure expresses the closeness of agreement between the value which is accepted either as a conventional true value or an accepted reference value and the value found [p. 8]
● How do we know what the true value is?
● How do we know the reference value in a drug substance or a drug product?
Potential Approaches
● Orthogonal method – “comparison of the results of the proposed analytical procedure with those of a second well-characterized procedure” [ICHQ2(R1), p. 13]
13
Accuracy Potential Approaches
● Spike recovery – addition of known amount of an analyte to the actual drug substance/product by spiking with a reference standard (assigned value)
● Spike recovery is also possible by spiking to a representative lab scale formulation – difficult for biological samples due to their complexity
● Recovery should be calculated based on known quantity spiked, not total (amount present in the unspiked sample plus spiked amount)
Problem - How do you determine amount present in the unspiked sample
● For methods that have digestion or extraction step, spiking should be done before such steps
14
Accuracy
Here is a confusing statement in ICH Q2(R1)
● “Accuracy may be inferred once precision, linearity and specificityhave been established” – [ICHQ2(R1), p. 13]
● This line is often misinterpreted – we receive many BLAs or Supplements in which accuracy is not assessed but “inferred” citing ICHQ2(R1)
● Determination of accuracy is necessary to “establish” specificity
● This line simply says that one does not have to do accuracy twice – once as part of specificity and again as stand-alone
15
Case Study # 1 A polysaccharide, which is an active component of a vaccine, is
quantitated by hydrolyzing the sample and quantitating one of its constituent monosaccharides by HPAEC-PAD
An OOS investigation shows that the bacteria have another polysaccharide, which is not an active component but has the similar monosaccharide composition – all but one constituent monosaccharide is the same
A small amount of the second polysaccharide co-purifies with the first polysaccharide during manufacturing
Validation was done using an immunopurified material, which did not contain the second polysaccharide – not a representative DS
Specificity study did not look into the complete matrix (representative formulation minus the active polysaccharide) because the manufacturer believed that it did not contain any other sugar component
16
Linearity
ICH Q2(R1) – The linearity of an analytical procedure is its ability (within a given range) to obtain test results which are directly proportional to the concentration (amount) of analyte in the sample [p. 9]
In some cases, … the test data may need to be subjected to a mathematical transformation prior to the regression analysis [p. 12]
Examples: (1) most of the biological assays, including immunoassays,
(2) Chromatographic assays with electrochemical detection, when the analyte is a weak electrolyte and ELSD
17
Linearity
A few questions: Why do we need to evaluate linearity for method validation?
What to plot against what? Why?
What is the role of standard curve in linearity study
Is it necessary to study linearity if no standard curve is used? For example, Molecular Size Distribution assay using SEC
Typically parallelism should be evaluated as part of linearity for biological assays.
● Why?
● Is it necessary to evaluate parallelism for all assays?
18
Linearity Linearity shows that the response is related to attribute (e.g.,
concentration or reportable result) by a mathematical function. That is, if you know the response, you can measure the attribute● Simplest and most common mathematical function is straight line (y
= mx + c)
● In general : R = Aƒ(c) + B [R = response]
● Over the assay range
● Weighting or use of complex regression should be adequately justified
For standard curve-based assays, it is a test to show that the standard curve is adequate● Parallelism
For assays that do not involve standard curve, linearity shows that the results are independent of the analyte conc.
19
Linearity Parallelism between standard curve and sample dilution curve
● Does the analyte in the standard behave in the same way as the analyte in the drug substance/product.
● Is the response modified by the matrix?
Do we need to demonstrate parallelism for chromatographic or other separation-based methods?● Depends – no, if the analyte is the same chemical in both standard
and samples
Actual product matrix is replaced by the eluent, which is same for the analyte in standard and sample – eluent is the matrix
● Parallelism should be demonstrated when that is not the case –retention times of analyte in standard and samples are different or analyte in standard is different from that in sample (surrogate standard)
20
Linearity
What if a drug substance/product lot is qualified as the standard?● Matrices of the standard and samples are the same
How is the standard qualified? – generally against an authoritative standard (e.g., FDA, USP, WHO/NIBSC standard)● Matrices are likely not the same
● If not, parallelism should be demonstrated at the time of qualification of the standard, which shows that the analyte in the authentic standard behave in the same way as that in the to be qualified standard (secondary standard)
Demonstrate that the qualified values are adequate and linked to the authentic standards

21
Linearity Plot of expected (theoretical) conc. vs measured conc.
● Seen frequently in submissions to demonstrate linearity
● Such plots show correlation between expected and measured concentrations
● Such correlation is a measure of accuracy – correlation between measured and true/reference/expected values
● A slope of ~1.0 shows good correlation/accuracy
● How is the expected concentration determined – by the same method (circular) or a different method (acceptable)?
Hence the concept of orthogonal method for accuracy
“Linearity should be evaluated … a plot of signals as a function of analyte concentration or content.” – [ICH Q2(R1), p. 12]
● At the minimum 5 conc. levels
22
Range It is established by confirming that the analytical procedure
provides an acceptable degree of linearity, accuracy and precision – [ICHQ2(R1) p. 12]
Expressed as reportable results, same units as the specification● Exception – e.g., when the specification is based on results of two
tests
Should be evaluated from sample data, not from standard data Minimally,
● For assays: 80 – 120% of the target test concentration
● For the determination of an impurity: from the reporting level of an impurity to 120% of the specification
Linearity, accuracy and precision should be determined over this range
Why 80 – 120%?● To allow for manufacturing, formulation and analytical variations

23
Precision Repeatability
● A minimum of 6 determinations at 100% of the test concentration, or
● a minimum of 9 determinations covering the specified range for the procedure (e.g., 3 concentrations/3 replicates each) – my preference to cover the assay range.
Intermediate Precision● Impact of controllable variables – days, analysts, equipment, etc.
Difference from robustness – impact of normal variations – small variations of temp., flow rate, reagent concentration, etc.
● Use DOE to minimize number of experiments to evaluate the effects of each variable
We often see data above the assay/specification range during validation of assays for impurities – not relevant
24
Detection and Quantitation Limits The detection limit of an individual analytical procedure is the
lowest amount of analyte in a sample which can be detected but not necessarily quantitated
The quantitation limit of an individual analytical procedure is the lowest amount of analyte in a sample which can be quantitatively determined with suitable precision and accuracy.● Range (and linearity) should include QL as its lower limit
● QL should be supported by precision and accuracy data
● ICH Q2(R1) provides methods for estimation of DL and QL (pp. 15-16) but estimated values must be verified experimentally
For DL: actual detection of response/signal at DL
For QL: demonstration of accuracy and precision at QL
● DL and QL should be in the same unit in which the test result is expressed (not in terms of the unit of the response)
25
Case Study # 2 : Quantitation Limit for MSD Analysis by SEC
Molecular size distribution analysis (MSD) by SEC
A critical test for the determination aggregates and fragments of proteins as impurities of proteins
● Required quality control tests for IgG, blood coagulation factors and their antidotes, monoclonal antibodies
Measures percents of aggregates and fragments from peak area percent
It is not possible to estimate QL using the methods described in ICH Q2(R1) [part 7.3] : QL = 10σ/S
σ = the standard deviation of the response
S = the slope of the calibration curve
● There is no standard curve
● Peak percent does not change with concentration
● Relevance of peak percent vs conc. (a flat line) plot in this assay?
26
Case Study # 2 : Quantitation Limit for MSD Analysis by SEC
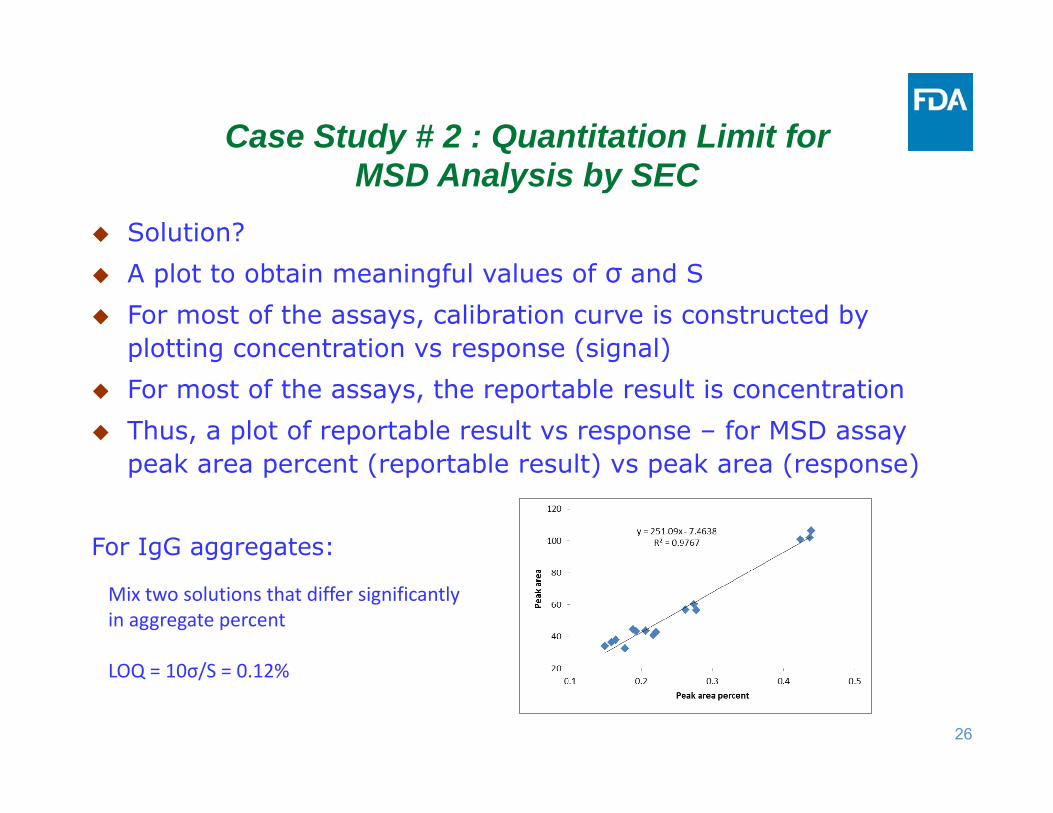
Solution? A plot to obtain meaningful values of σ and S For most of the assays, calibration curve is constructed by
plotting concentration vs response (signal) For most of the assays, the reportable result is concentration Thus, a plot of reportable result vs response – for MSD assay
peak area percent (reportable result) vs peak area (response)
For IgG aggregates:
Mix two solutions that differ significantlyin aggregate percent
LOQ = 10σ/S = 0.12%
27
Limit Test
Not appropriate simply because of a “less than” specification
Should be justified – a limit test is often used to establish clearance of process-related impurities
Depends upon
● How much is present in DS/DP
● Capability of your method (< method LOQ)
● Nature of the analyte – toxicity; is the method adequate?
● Reporting requirement (ICH Q3)
Quantitative determination of impurities preferred when technologically feasible
28
Robustness
Not part of method validation; should be evaluated during Method Development – ICHQ2(R1)
● Impact of normal, expected, uncontrollable variations (method optimization)
Capacity of a method to remain unaffected by small, but deliberate variations in method parameters and provides an indication of its reliability during normal usage [ICHQ2(R1)]
OFAT: One-factor-at-a-time
● While keeping others at nominal level
Factorial (full or fractional) – DOE approach
• Multifactor design
• Allows evaluation of interaction effects of multiple changes
• Significant reduction in number of experiments
29
Statistical Considerations Widely used in method validation to draw conclusions Statistics can give correct conclusions only if,
● There is adequate statistical power, which requires large number of data points
● Correct null hypothesis is chosen
A null hypothesis may not be rejected for many reasons, including lack of adequate statistical power; that does not mean that the null hypothesis is acceptable● One cannot conclude that two data sets are equivalent just because
a null hypothesis of equivalence cannot be rejected.
It is only when a null hypothesis can be rejected conclusively that the reverse of null hypothesis is acceptable● An equivalence conclusion can be accepted only if a non-equivalency
null hypothesis can be rejected conclusively
30
Frequent Comments on Method Validation
Method Validation not performed citing that the method is compendial (USP-NF or EP). However,
● There is no USP-NF monograph for the article (DS or DP)
● No method in USP-NF or USP-NF procedure is substantially altered
What is a compendial method?
● A method described in a monograph is compendial for that article
● A method described in a USP-NF General Chapter becomes compendial when it is referenced in a USP-NF monograph and only for the monograph article in which it is referenced (USP General Notices and Requirements: General Chapters)
Most of the biological products have no monograph in USP-NF. Thus, methods employed for quality control of biological products are not compendial even if they are described in USP-NF General Chapters
EP, JP, etc. are not compendia in US
31
Frequent Comments on Method Validation Improper selection of test category Not all validation characteristics addressed (for the test
category) Impurity that should be quantified and monitored categorized as
a limit test Failure to include all data – only final data provided in a table;
no description/explanation how the data were obtained Samples used in method validation were not clearly described Conclusions regarding validation characteristics are made based
on a related study, which is referenced in the validation report but is not included in the submission
Validation conducted at concentration levels above the specification limit
Linearity evaluated with standard only; not with the product
32
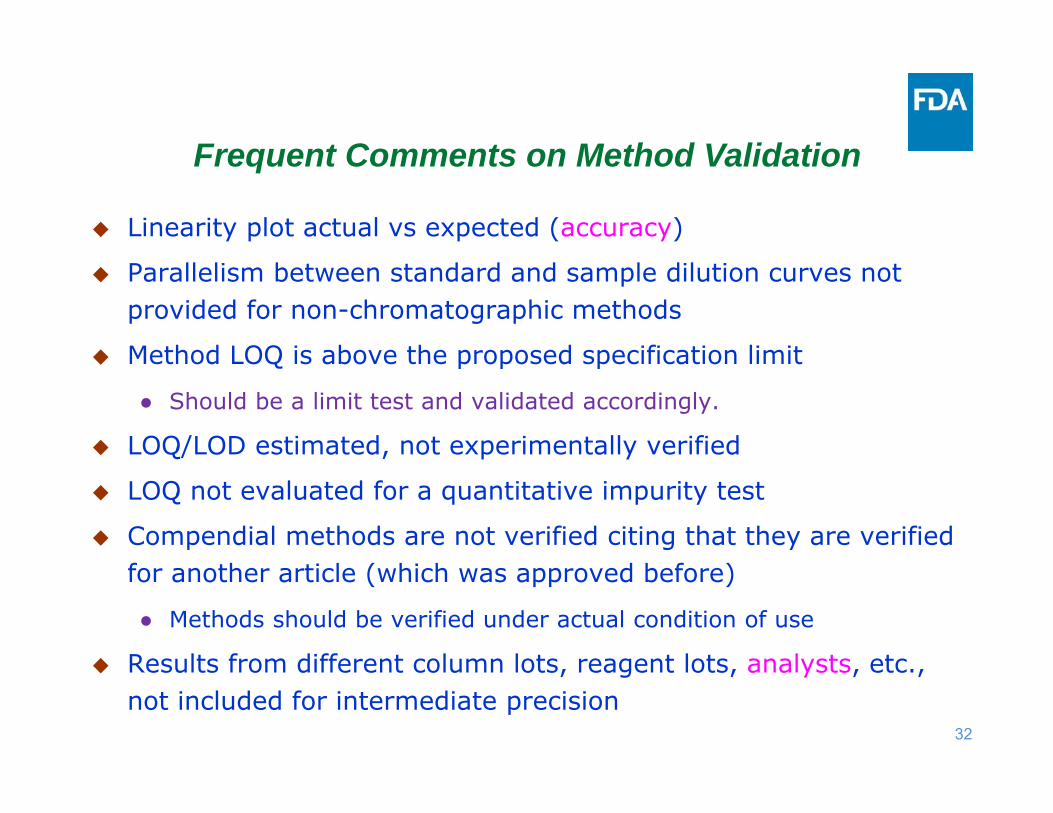
Frequent Comments on Method Validation
Linearity plot actual vs expected (accuracy)
Parallelism between standard and sample dilution curves not provided for non-chromatographic methods
Method LOQ is above the proposed specification limit
● Should be a limit test and validated accordingly.
LOQ/LOD estimated, not experimentally verified
LOQ not evaluated for a quantitative impurity test
Compendial methods are not verified citing that they are verified for another article (which was approved before)
● Methods should be verified under actual condition of use
Results from different column lots, reagent lots, analysts, etc., not included for intermediate precision
33
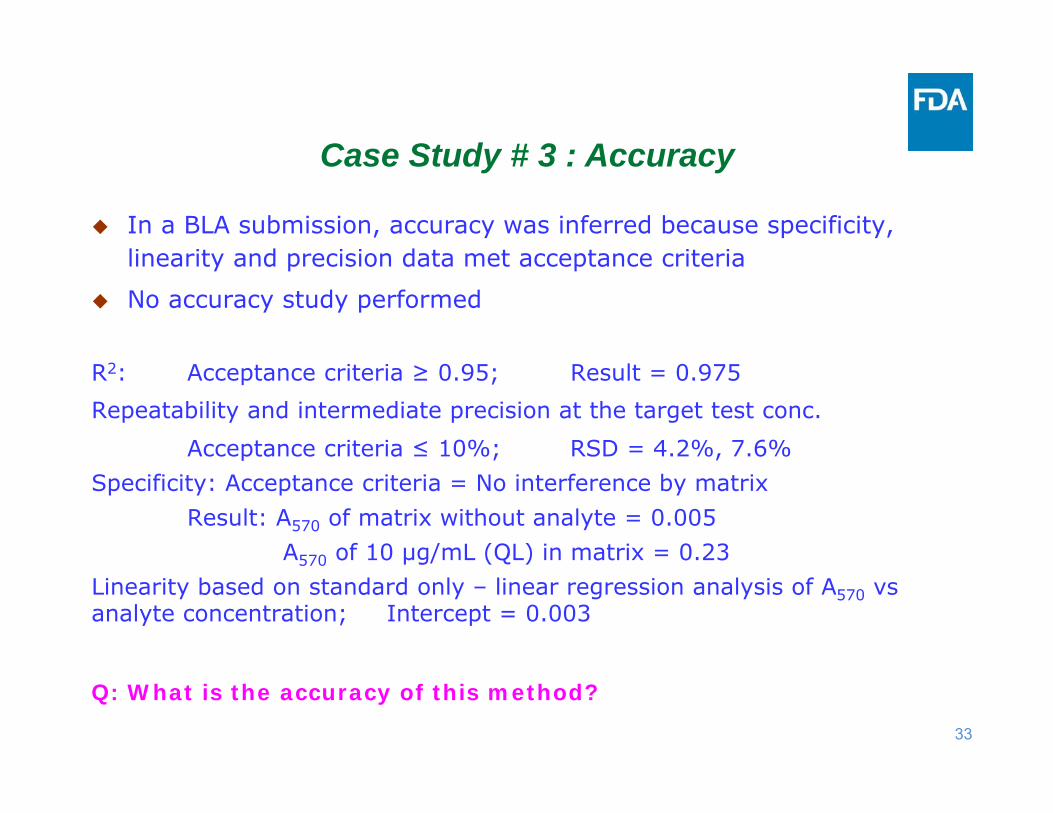
Case Study # 3 : Accuracy
In a BLA submission, accuracy was inferred because specificity, linearity and precision data met acceptance criteria
No accuracy study performed
R2: Acceptance criteria ≥ 0.95; Result = 0.975Repeatability and intermediate precision at the target test conc.
Acceptance criteria ≤ 10%; RSD = 4.2%, 7.6% Specificity: Acceptance criteria = No interference by matrix
Result: A570 of matrix without analyte = 0.005A570 of 10 µg/mL (QL) in matrix = 0.23
Linearity based on standard only – linear regression analysis of A570 vs analyte concentration; Intercept = 0.003
Q: What is the accuracy of this method?
34
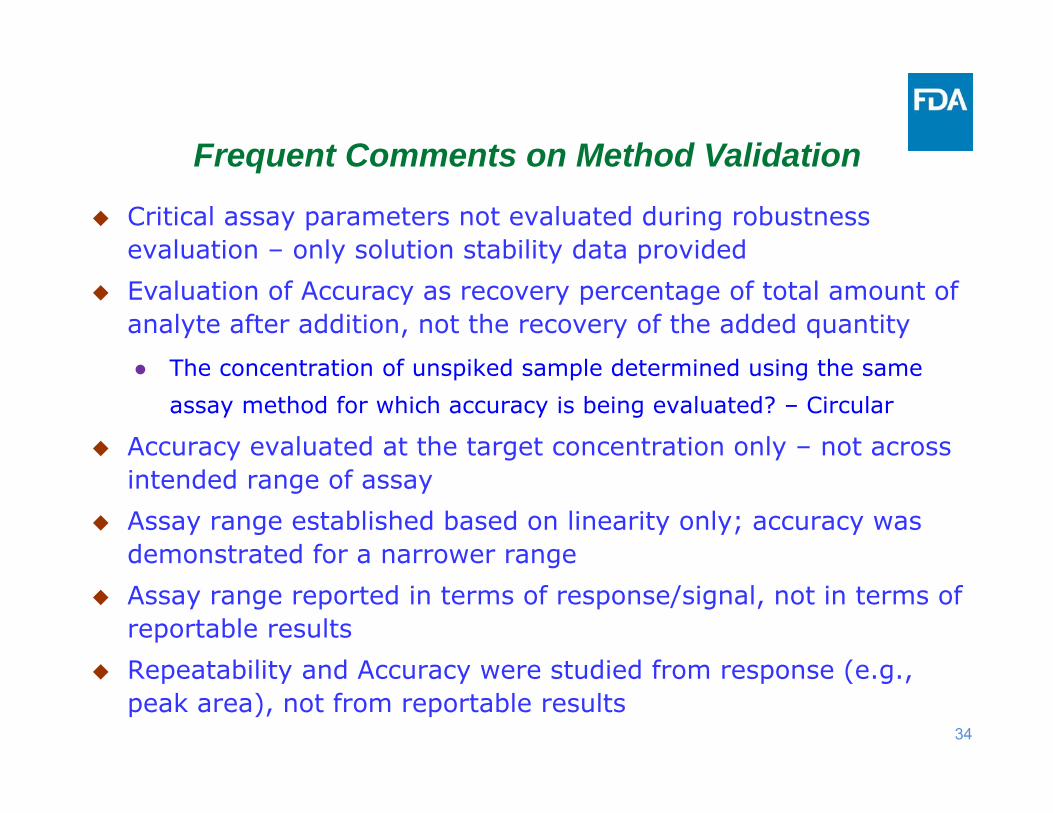
Frequent Comments on Method Validation
Critical assay parameters not evaluated during robustness evaluation – only solution stability data provided
Evaluation of Accuracy as recovery percentage of total amount of analyte after addition, not the recovery of the added quantity
● The concentration of unspiked sample determined using the same assay method for which accuracy is being evaluated? – Circular
Accuracy evaluated at the target concentration only – not across intended range of assay
Assay range established based on linearity only; accuracy was demonstrated for a narrower range
Assay range reported in terms of response/signal, not in terms of reportable results
Repeatability and Accuracy were studied from response (e.g., peak area), not from reportable results

35
Thank you
Questions?
www.fda.gov