Embed Size (px)
Citation preview
UNIVERSITY OF WISCONSIN–MILWAUKEE
UWM INTEGRATED SUPPORT SERVICESPROPOSAL FOR EXPLORATION
August 4, 2015
PRESENTATION OBJECTIVES
I. UNDERSTANDING THE CURRENT CONTEXT• UWM• Planning Resources• Higher Ed Environment and Shared Services Initiatives
II. EXPLORING ALTERNATIVES – “WHAT IF”
III. EXPLORING ALTERNATIVES – PROJECT APPROACH
IV. BUILDING SUPPORT FOR PROJECT APPROACH AND STAKEHOLDERENGAGEMENT
2
THE CONTEXTUWM – Service Models
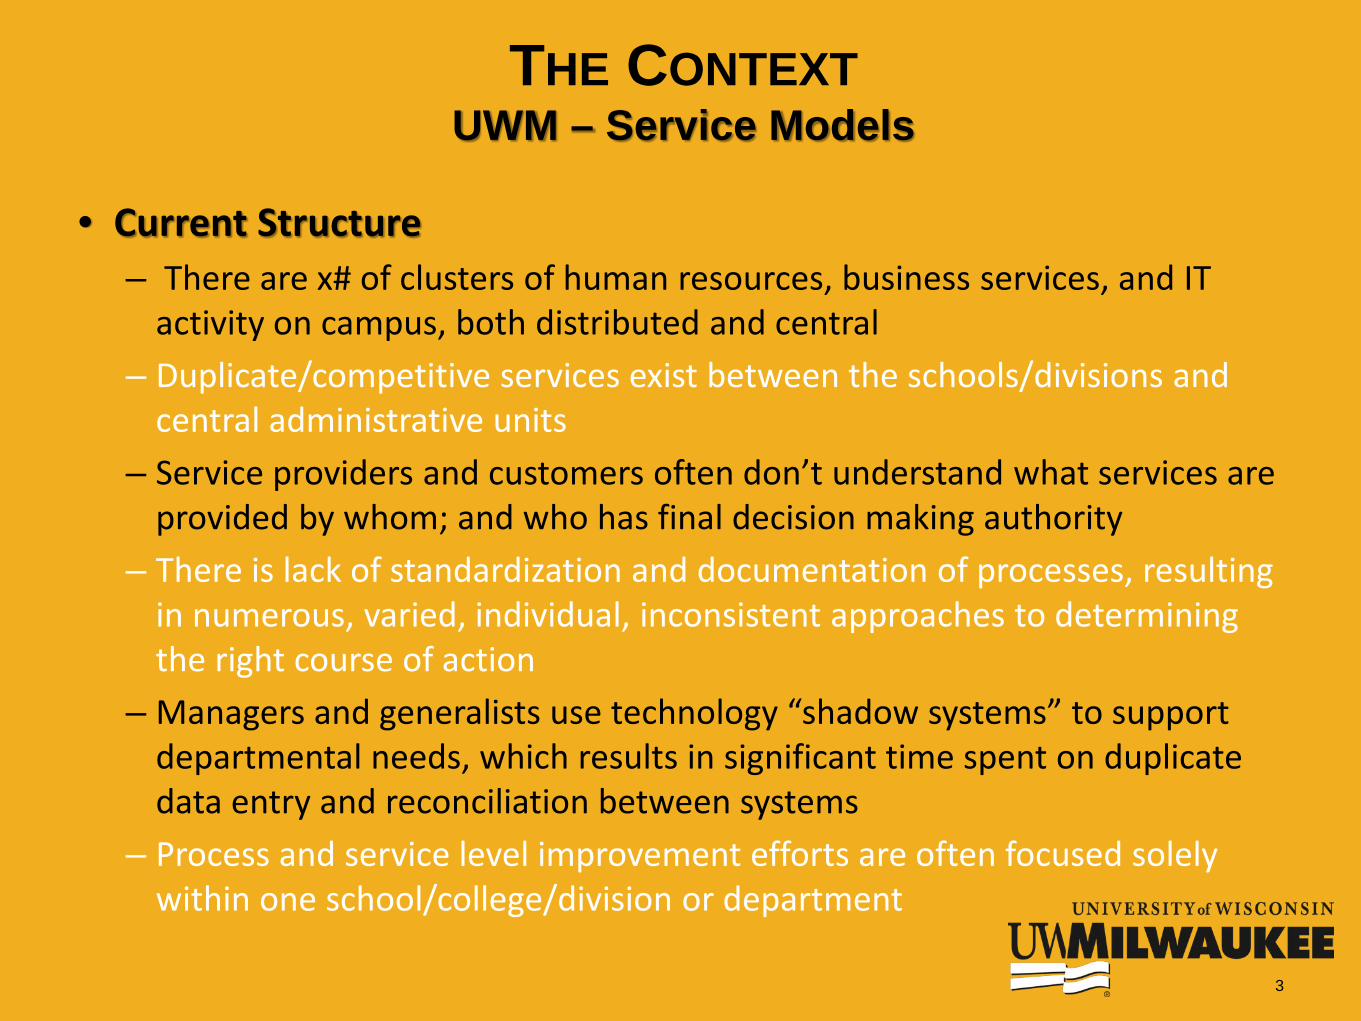
• Current Structure– There are x# of clusters of human resources, business services, and IT
activity on campus, both distributed and central– Duplicate/competitive services exist between the schools/divisions and
central administrative units– Service providers and customers often don’t understand what services are
provided by whom; and who has final decision making authority– There is lack of standardization and documentation of processes, resulting
in numerous, varied, individual, inconsistent approaches to determining the right course of action
– Managers and generalists use technology “shadow systems” to support departmental needs, which results in significant time spent on duplicate data entry and reconciliation between systems
– Process and service level improvement efforts are often focused solely within one school/college/division or department
3
THE CONTEXTUWM - Financials
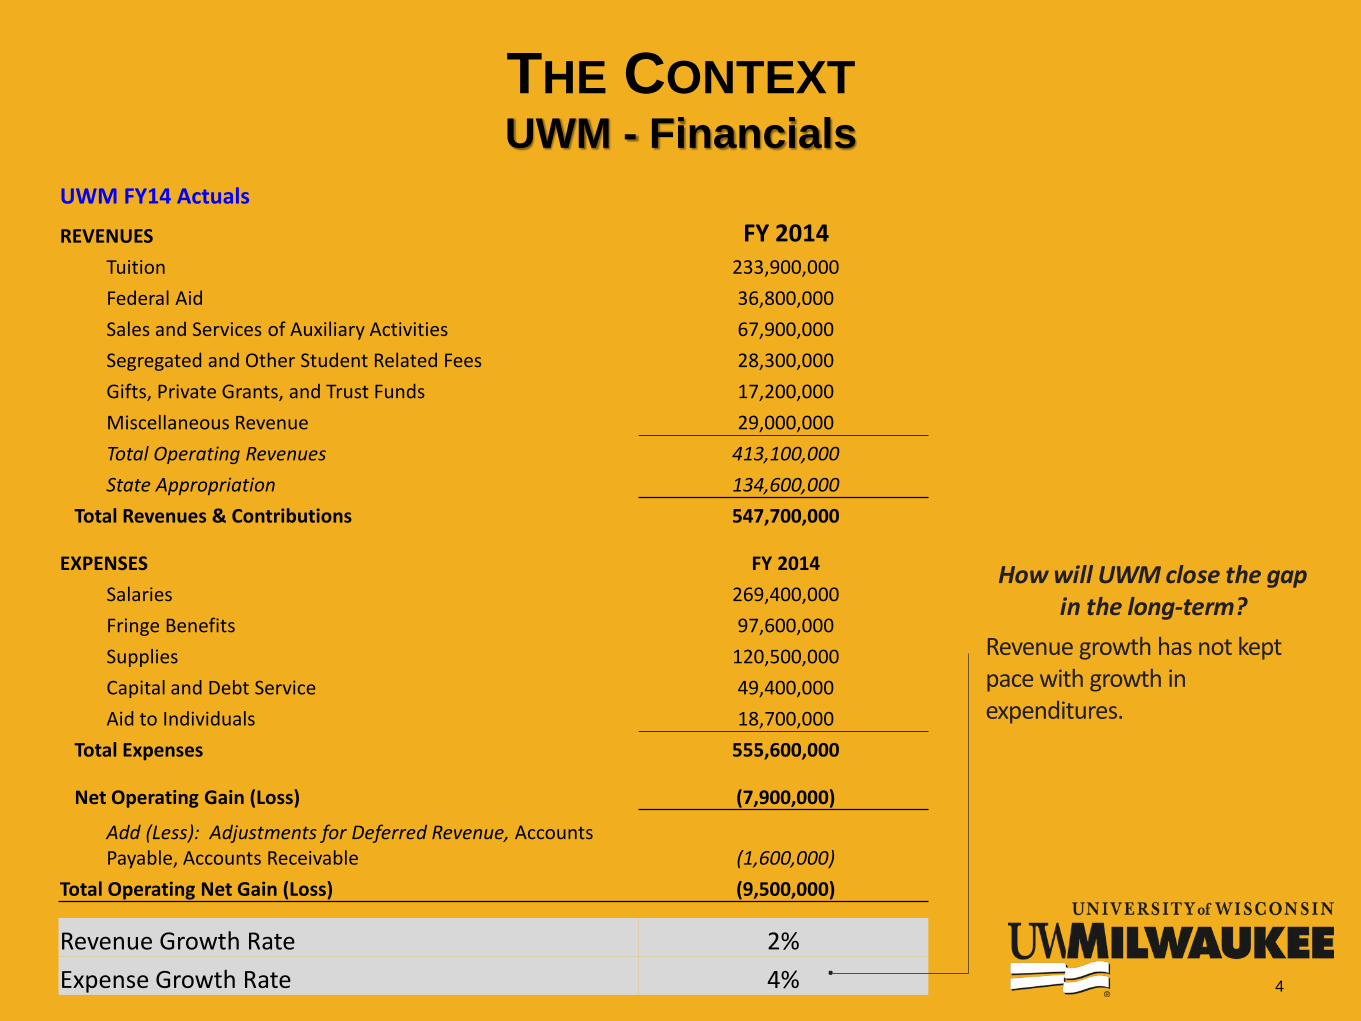
UWM FY14 Actuals
REVENUES FY 2014 Tuition 233,900,000 Federal Aid 36,800,000 Sales and Services of Auxiliary Activities 67,900,000 Segregated and Other Student Related Fees 28,300,000 Gifts, Private Grants, and Trust Funds 17,200,000 Miscellaneous Revenue 29,000,000 Total Operating Revenues 413,100,000 State Appropriation 134,600,000
Total Revenues & Contributions 547,700,000
EXPENSES FY 2014 Salaries 269,400,000 Fringe Benefits 97,600,000 Supplies 120,500,000 Capital and Debt Service 49,400,000 Aid to Individuals 18,700,000
Total Expenses 555,600,000
Net Operating Gain (Loss) (7,900,000)
Add (Less): Adjustments for Deferred Revenue, Accounts Payable, Accounts Receivable (1,600,000)
Total Operating Net Gain (Loss) (9,500,000)
Revenue Growth Rate 2%Expense Growth Rate 4%
How will UWM close the gapin the long-term?
Revenue growth has not kept pace with growth in expenditures.
4
95,000,000
100,000,000
105,000,000
110,000,000
115,000,000
120,000,000
125,000,000
130,000,000
2007 2008 2009 2010 2011 2012 2013 2014 2015 2016
SupportingActual
SupportingIHC Control
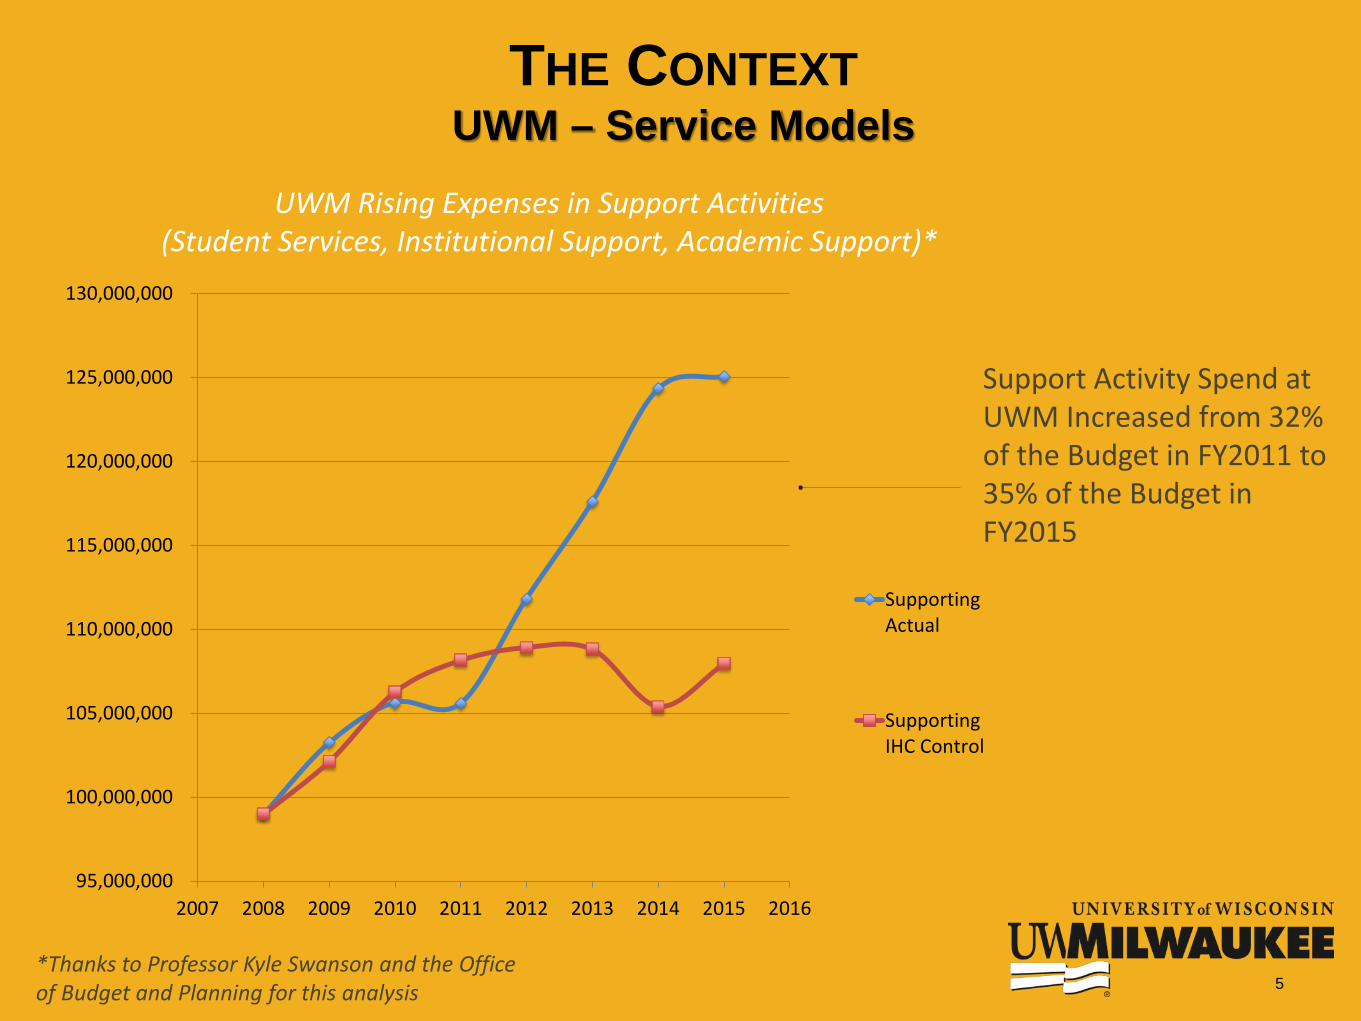
UWM Rising Expenses in Support Activities(Student Services, Institutional Support, Academic Support)*
Support Activity Spend at UWM Increased from 32% of the Budget in FY2011 to 35% of the Budget in FY2015
*Thanks to Professor Kyle Swanson and the Office of Budget and Planning for this analysis
THE CONTEXTUWM – Service Models
5
THE CONTEXTPlanning Resources and Trends in Higher Education
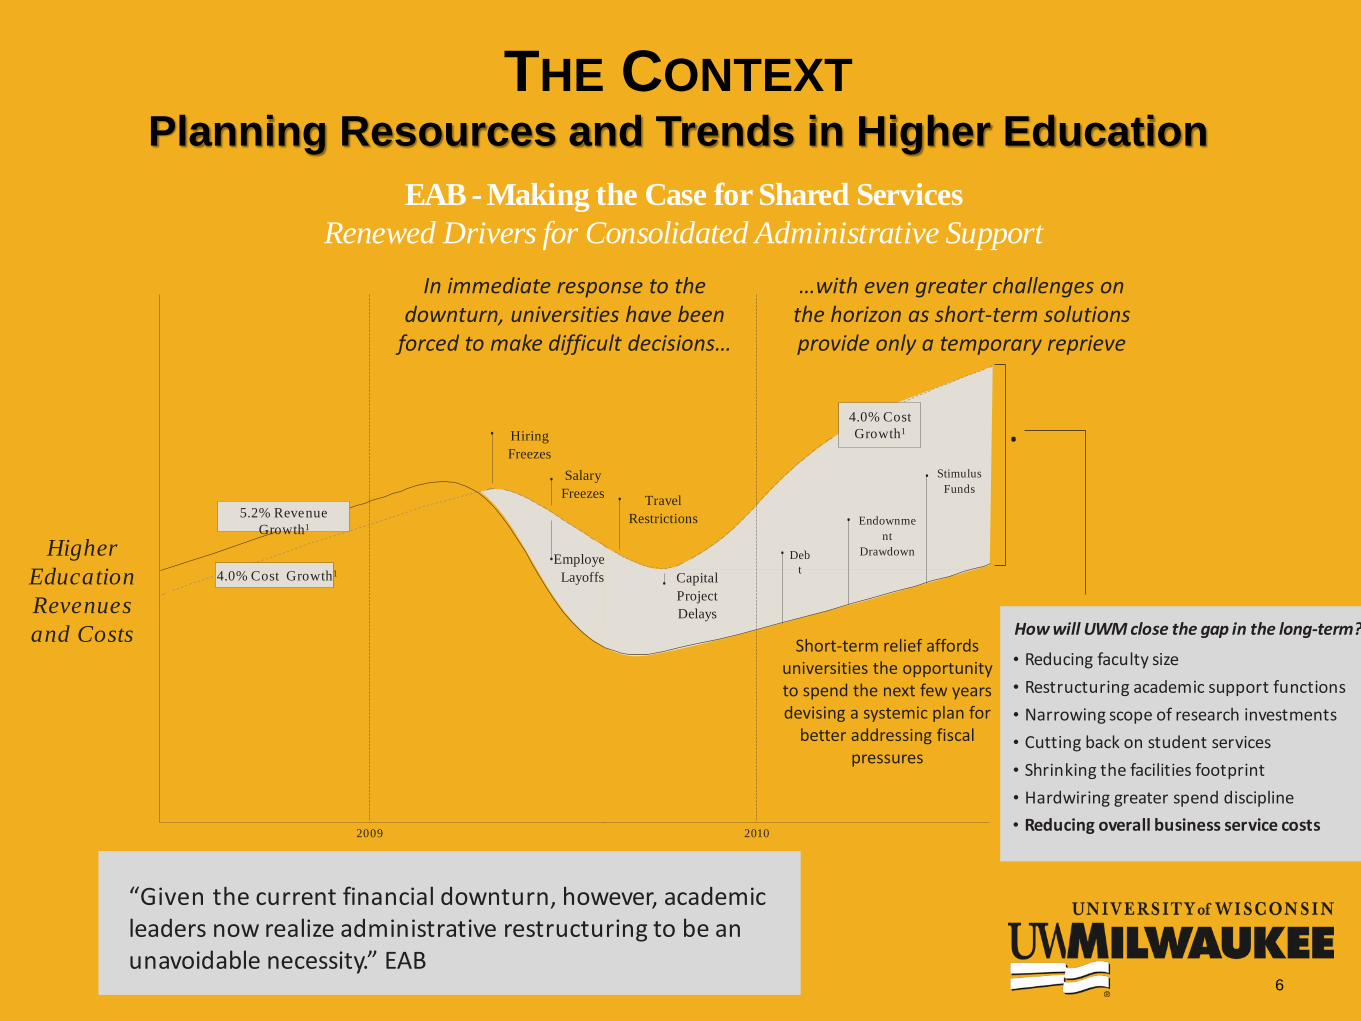
“Given the current financial downturn, however, academicleaders now realize administrative restructuring to be anunavoidable necessity.” EAB
How will UWM close the gap in the long-term?
• Reducing faculty size• Restructuring academic support functions• Narrowing scope of research investments• Cutting back on student services• Shrinking the facilities footprint• Hardwiring greater spend discipline• Reducing overall business service costs
HigherEducationRevenuesand Costs
2009
HiringFreezes
SalaryFreezes
Employee Layoffs4.0% Cost Growth1
5.2% RevenueGrowth1
Debt
Endownment
Drawdown
Stimulus Funds
4.0% CostGrowth1
2010
Capital ProjectDelays
Travel Restrictions
Short-term relief affordsuniversities the opportunity to spend the next few years devising a systemic plan for
better addressing fiscal pressures
In immediate response to the downturn, universities have been
forced to make difficult decisions…
…with even greater challenges on the horizon as short-term solutions provide only a temporary reprieve
EAB - Making the Case for Shared ServicesRenewed Drivers for Consolidated Administrative Support
6
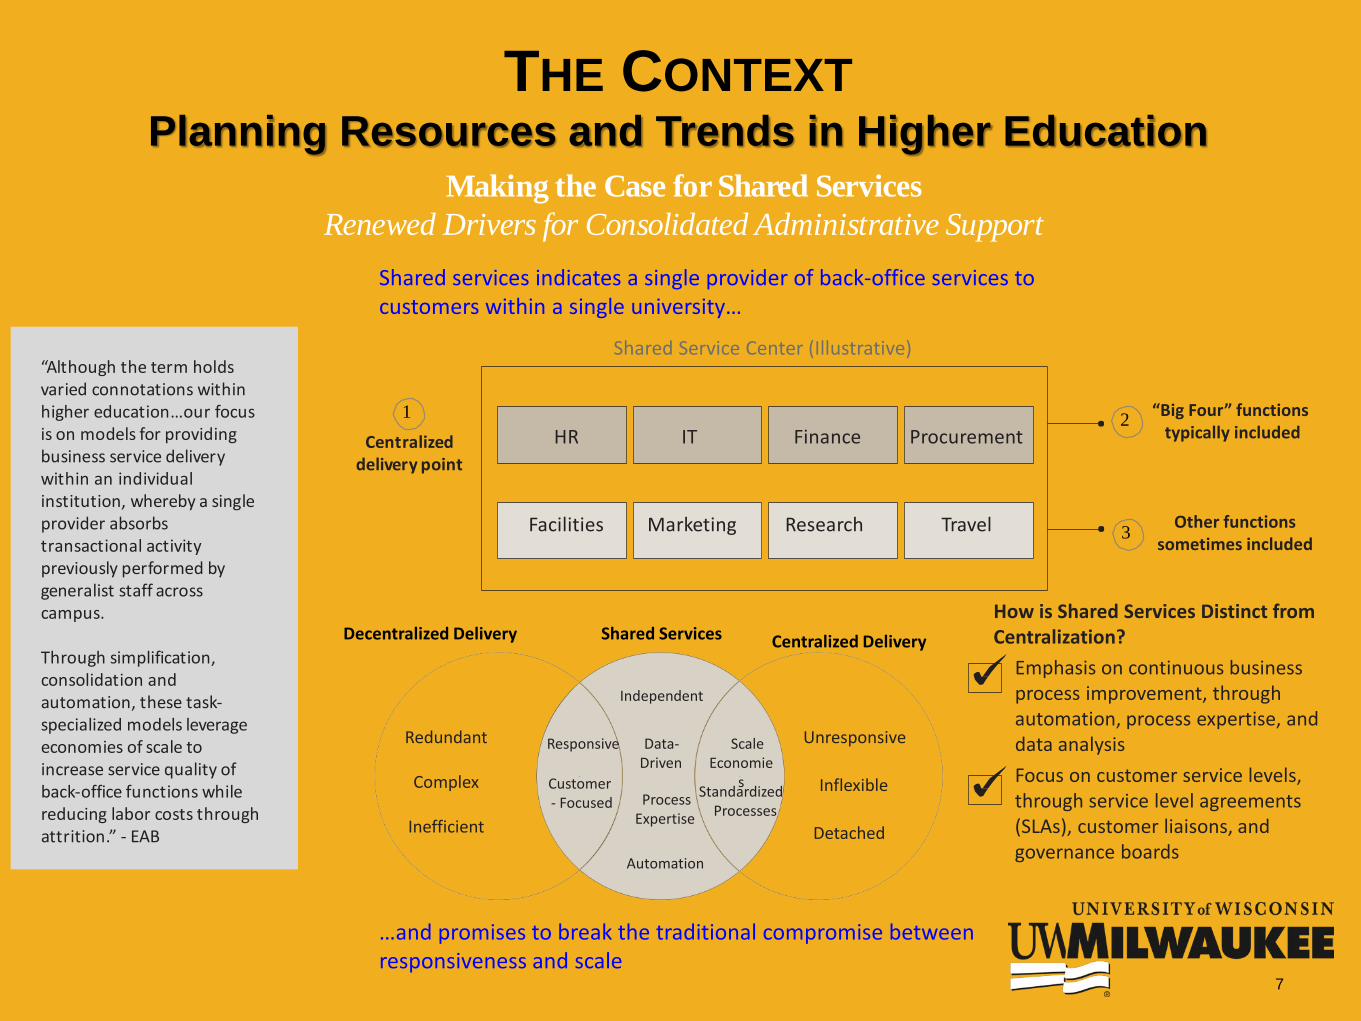
Making the Case for Shared ServicesRenewed Drivers for Consolidated Administrative Support
“Although the term holdsvaried connotations withinhigher education…our focusis on models for providingbusiness service deliverywithin an individualinstitution, whereby a singleprovider absorbstransactional activitypreviously performed bygeneralist staff acrosscampus.
Through simplification, consolidation andautomation, these task-specialized models leverageeconomies of scale toincrease service quality ofback-office functions whilereducing labor costs throughattrition.” - EAB
Shared services indicates a single provider of back-office services to customers within a single university…
…and promises to break the traditional compromise between responsiveness and scale
Shared Service Center (Illustrative)
Detached
Process Expertise
Automation
Standardized Processes
Shared ServicesDecentralized Delivery Centralized Delivery
Redundant
Complex
Inefficient
Unresponsive
Inflexible
Independent
Data-Driven
Scale Economie
s
1Centralized
delivery point
2 “Big Four” functions typically included
3 Other functions sometimes included
How is Shared Services Distinct from Centralization?
Emphasis on continuous business process improvement, through automation, process expertise, and data analysisFocus on customer service levels, through service level agreements (SLAs), customer liaisons, and governance boards
Responsive
Customer- Focused
HR IT Finance Procurement
Facilities Marketing Research Travel
7
THE CONTEXTPlanning Resources and Trends in Higher Education
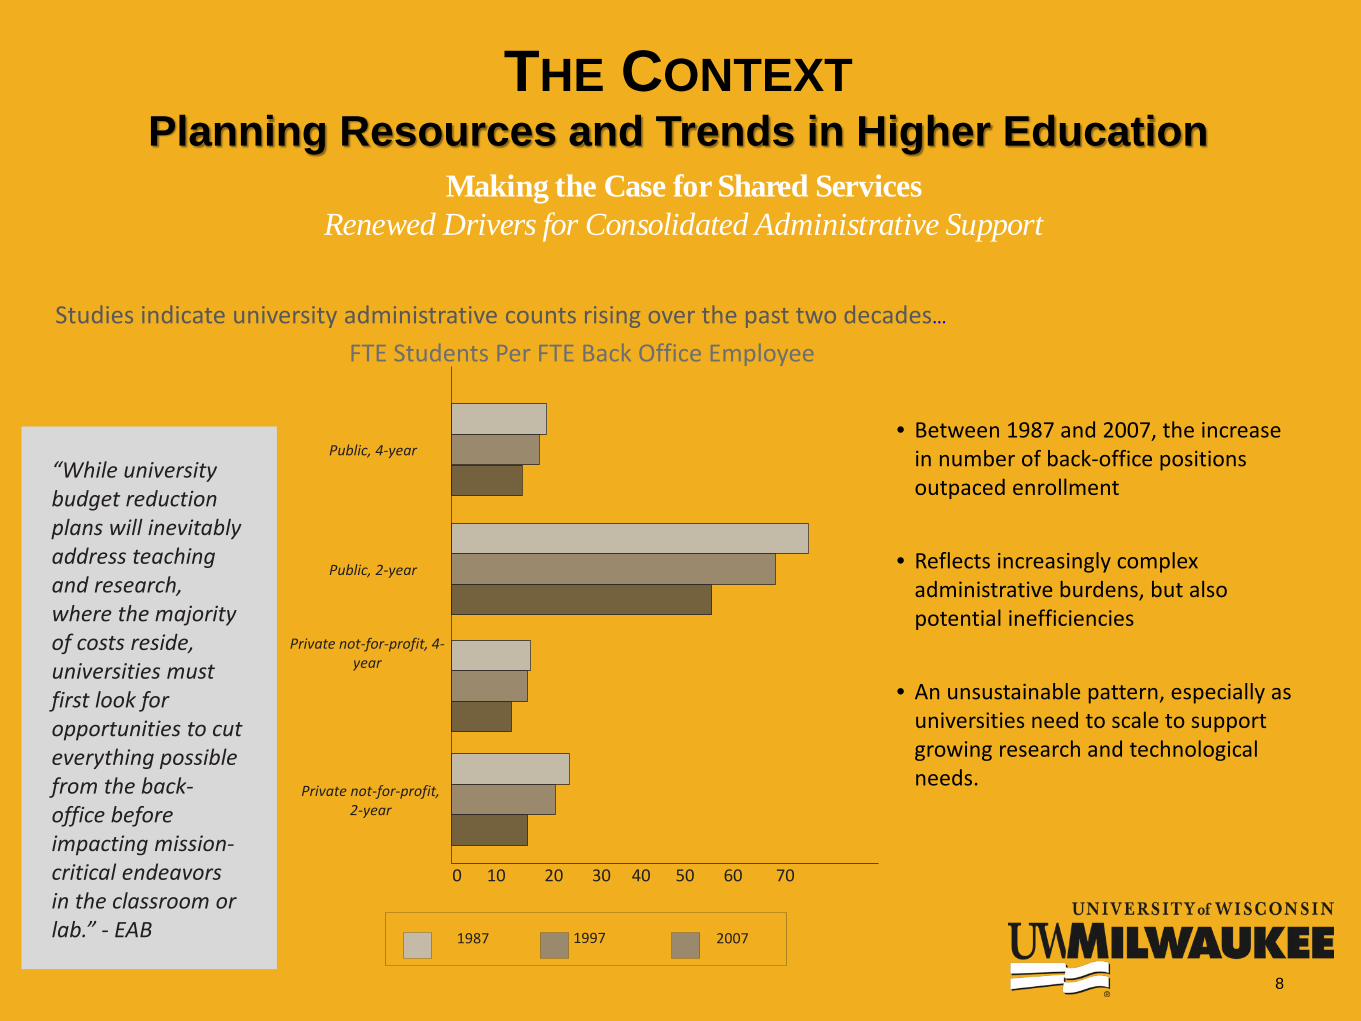
“While university budget reduction plans will inevitably address teaching and research, where the majority of costs reside, universities must first look for opportunities to cut everything possible from the back-office before impacting mission-critical endeavors in the classroom or lab.” - EAB
Studies indicate university administrative counts rising over the past two decades…
FTE Students Per FTE Back Office Employee
Private not-for-profit, 2-year
Private not-for-profit, 4-year
Public, 2-year
Public, 4-year
0 10 20 30 40 50 60 70
1987 1997 2007
• Between 1987 and 2007, the increase in number of back-office positions outpaced enrollment
• Reflects increasingly complex administrative burdens, but also potential inefficiencies
• An unsustainable pattern, especially as universities need to scale to support growing research and technological needs.
Making the Case for Shared ServicesRenewed Drivers for Consolidated Administrative Support
8
THE CONTEXTPlanning Resources and Trends in Higher Education
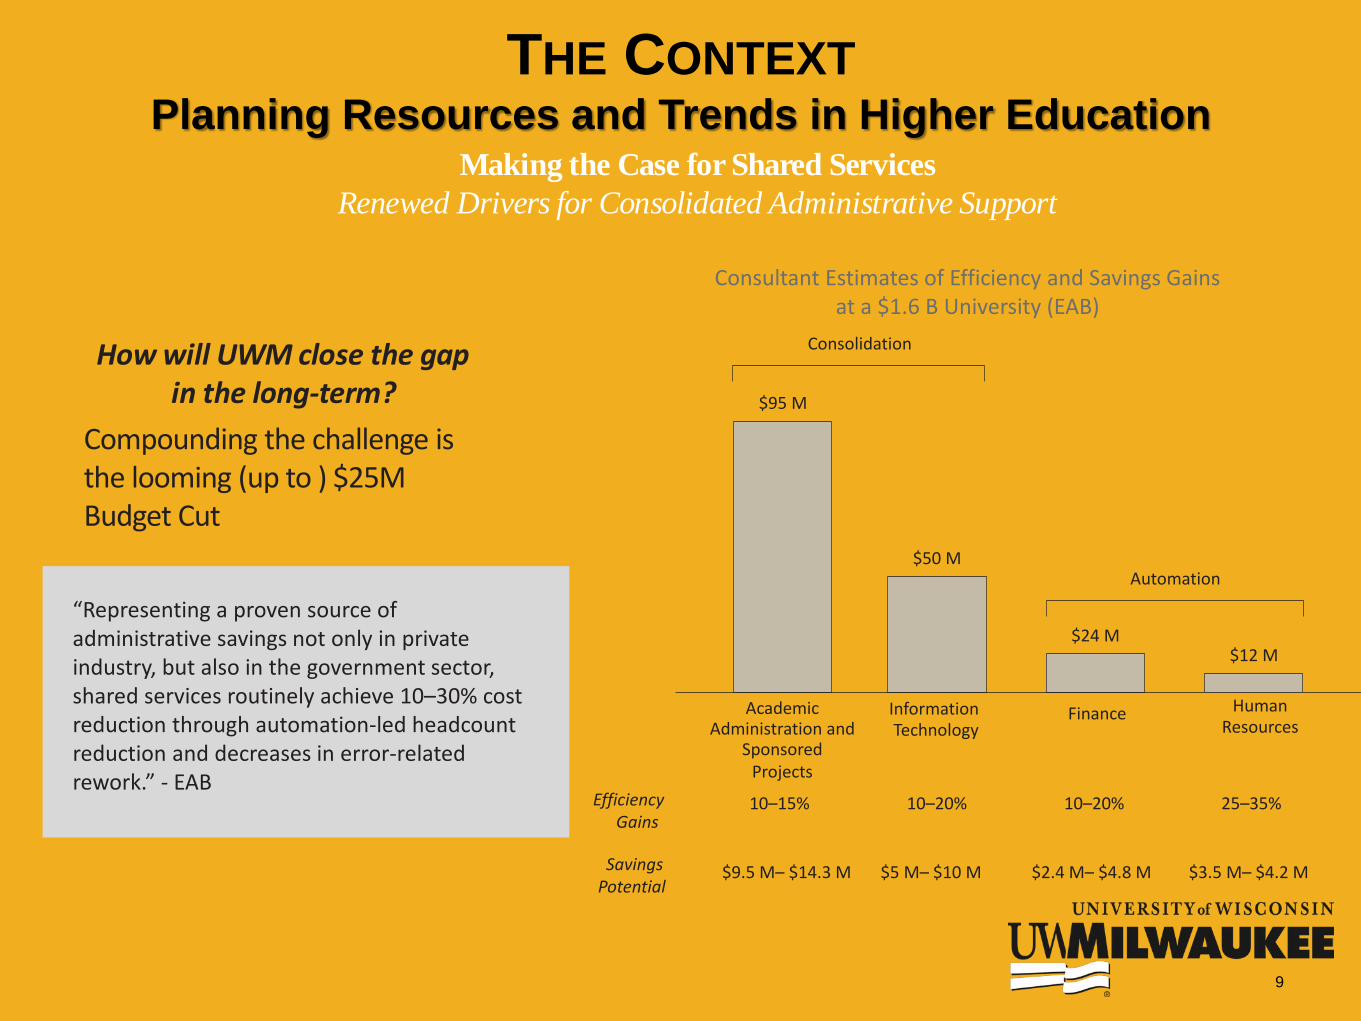
“Representing a proven source of administrative savings not only in private industry, but also in the government sector, shared services routinely achieve 10–30% cost reduction through automation-led headcount reduction and decreases in error-related rework.” - EAB
Consultant Estimates of Efficiency and Savings Gains at a $1.6 B University (EAB)
EfficiencyGains
10–15% 10–20% 10–20% 25–35%
Savings Potential
$9.5 M– $14.3 M $5 M– $10 M $2.4 M– $4.8 M $3.5 M– $4.2 M
Academic Administration and
SponsoredProjects
InformationTechnology
Finance Human Resources
$95 M
$50 M
$24 M$12 M
Consolidation
Automation
How will UWM close the gapin the long-term?
Compounding the challenge is the looming (up to ) $25M Budget Cut
Making the Case for Shared ServicesRenewed Drivers for Consolidated Administrative Support
9
THE CONTEXTPlanning Resources and Trends in Higher Education
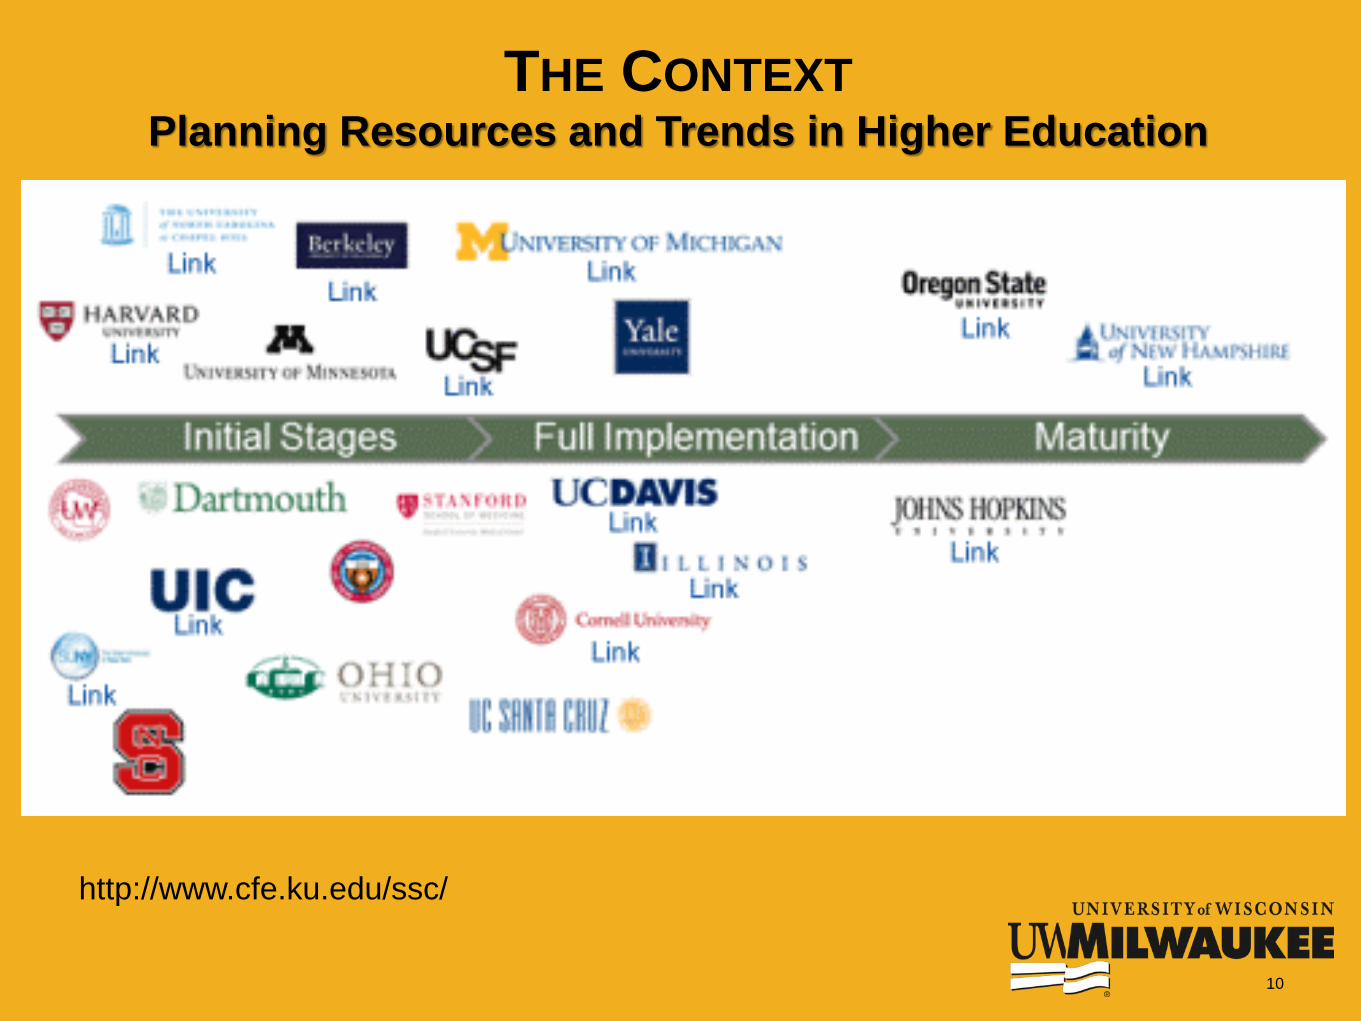
http://www.cfe.ku.edu/ssc/
10
THE CONTEXTPlanning Resources and Trends in Higher Education
EXPLORING ALTERNATIVES
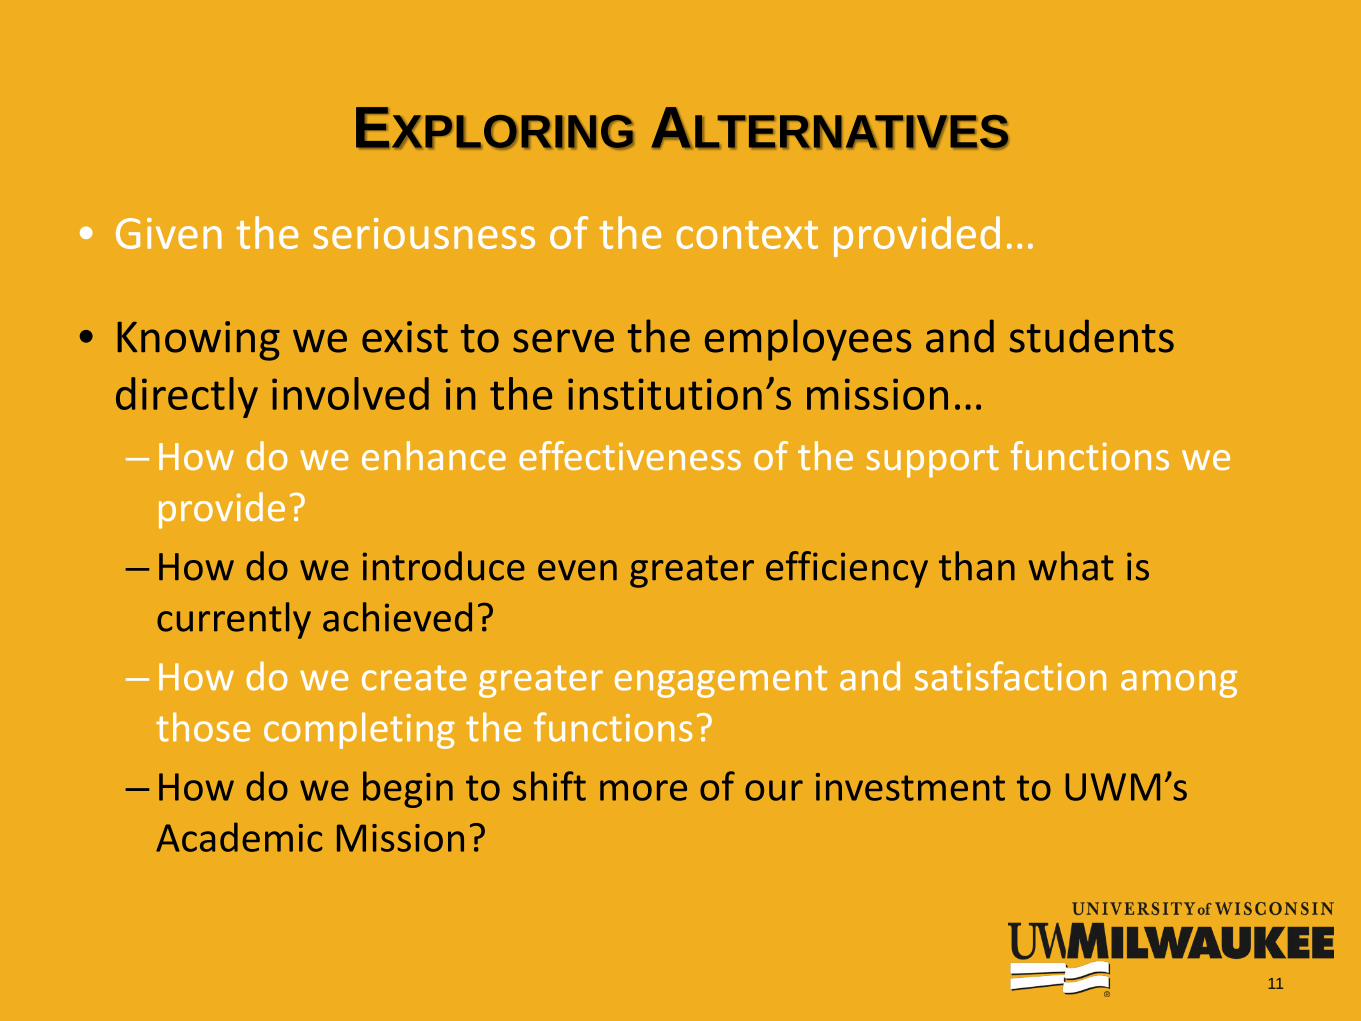
• Given the seriousness of the context provided…
• Knowing we exist to serve the employees and students directly involved in the institution’s mission…– How do we enhance effectiveness of the support functions we
provide?– How do we introduce even greater efficiency than what is
currently achieved?– How do we create greater engagement and satisfaction among
those completing the functions? – How do we begin to shift more of our investment to UWM’s
Academic Mission?
11
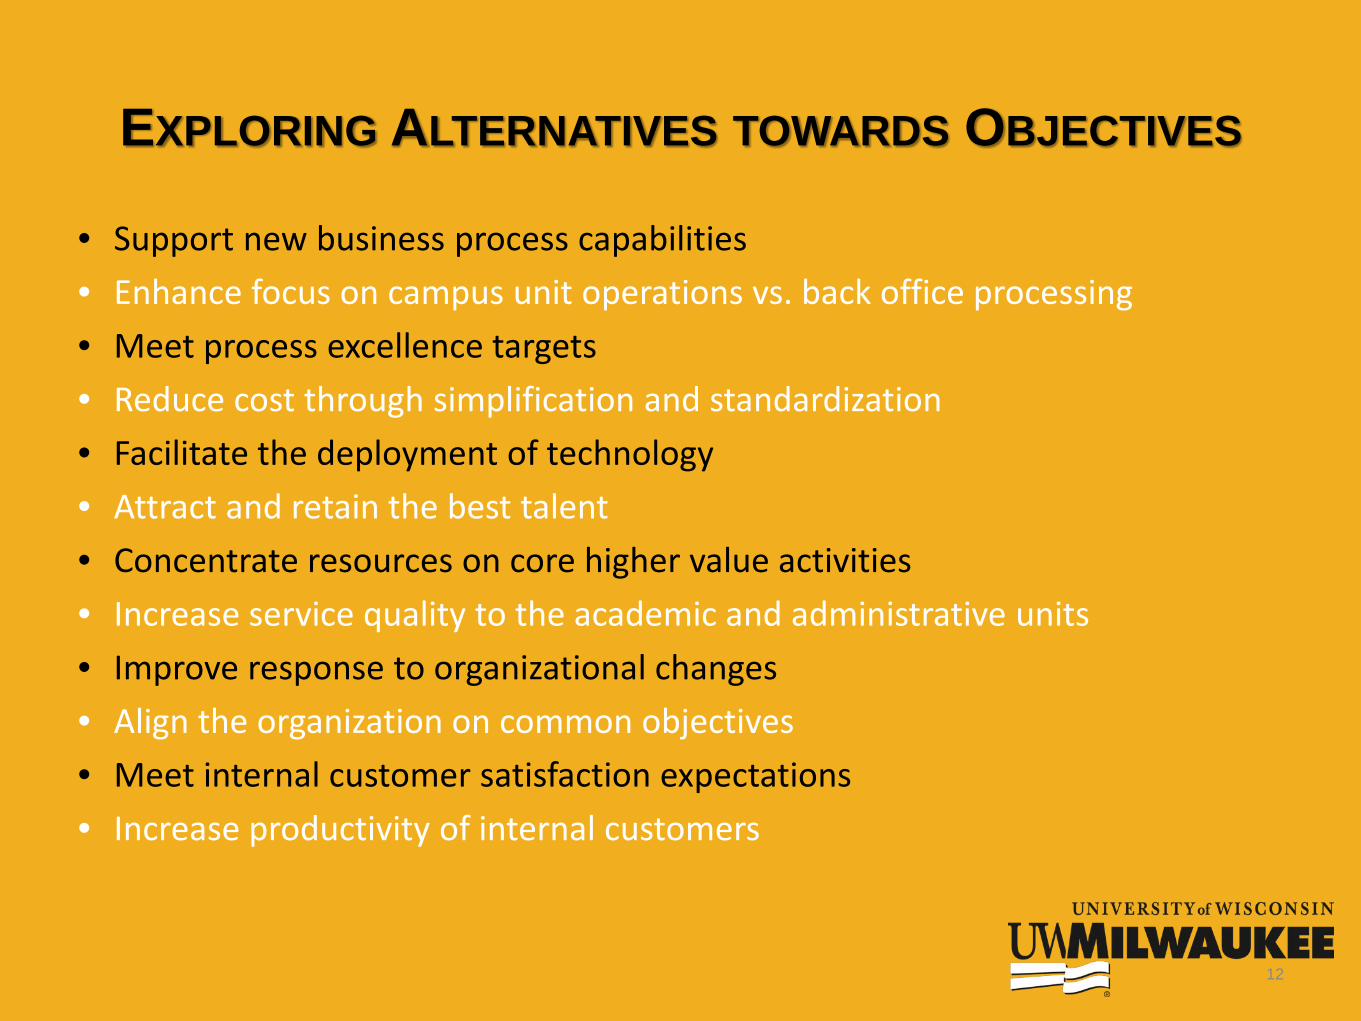
EXPLORING ALTERNATIVES TOWARDS OBJECTIVES
• Support new business process capabilities• Enhance focus on campus unit operations vs. back office processing• Meet process excellence targets• Reduce cost through simplification and standardization• Facilitate the deployment of technology • Attract and retain the best talent• Concentrate resources on core higher value activities• Increase service quality to the academic and administrative units• Improve response to organizational changes• Align the organization on common objectives• Meet internal customer satisfaction expectations• Increase productivity of internal customers
12
EXPLORING ALTERNATIVESPROJECT APPROACH
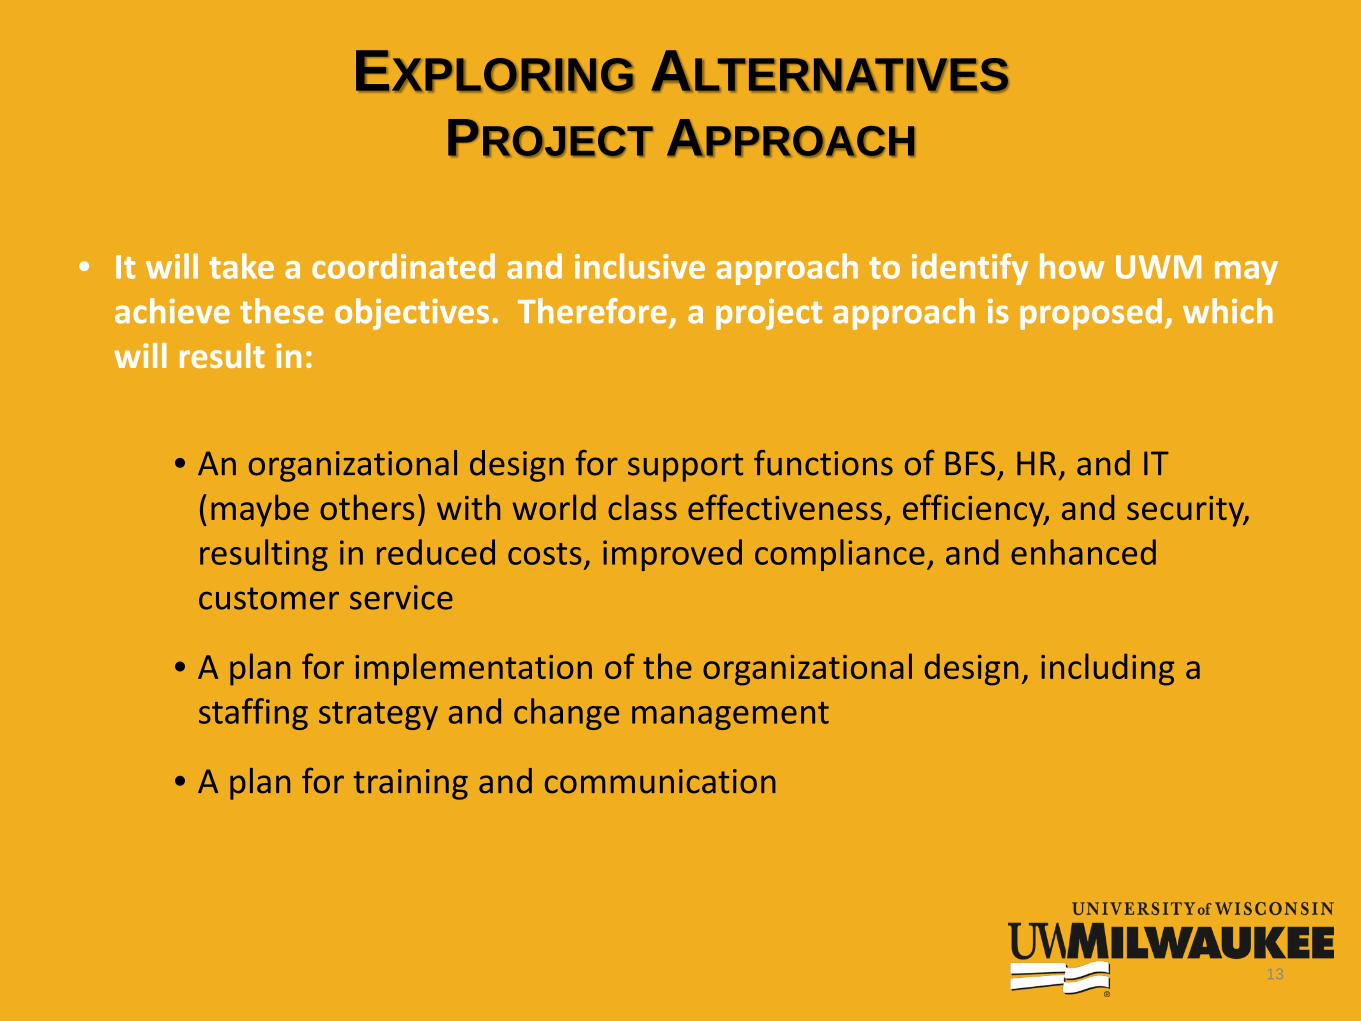
• It will take a coordinated and inclusive approach to identify how UWM may achieve these objectives. Therefore, a project approach is proposed, which will result in:
• An organizational design for support functions of BFS, HR, and IT (maybe others) with world class effectiveness, efficiency, and security, resulting in reduced costs, improved compliance, and enhanced customer service
• A plan for implementation of the organizational design, including a staffing strategy and change management
• A plan for training and communication
13
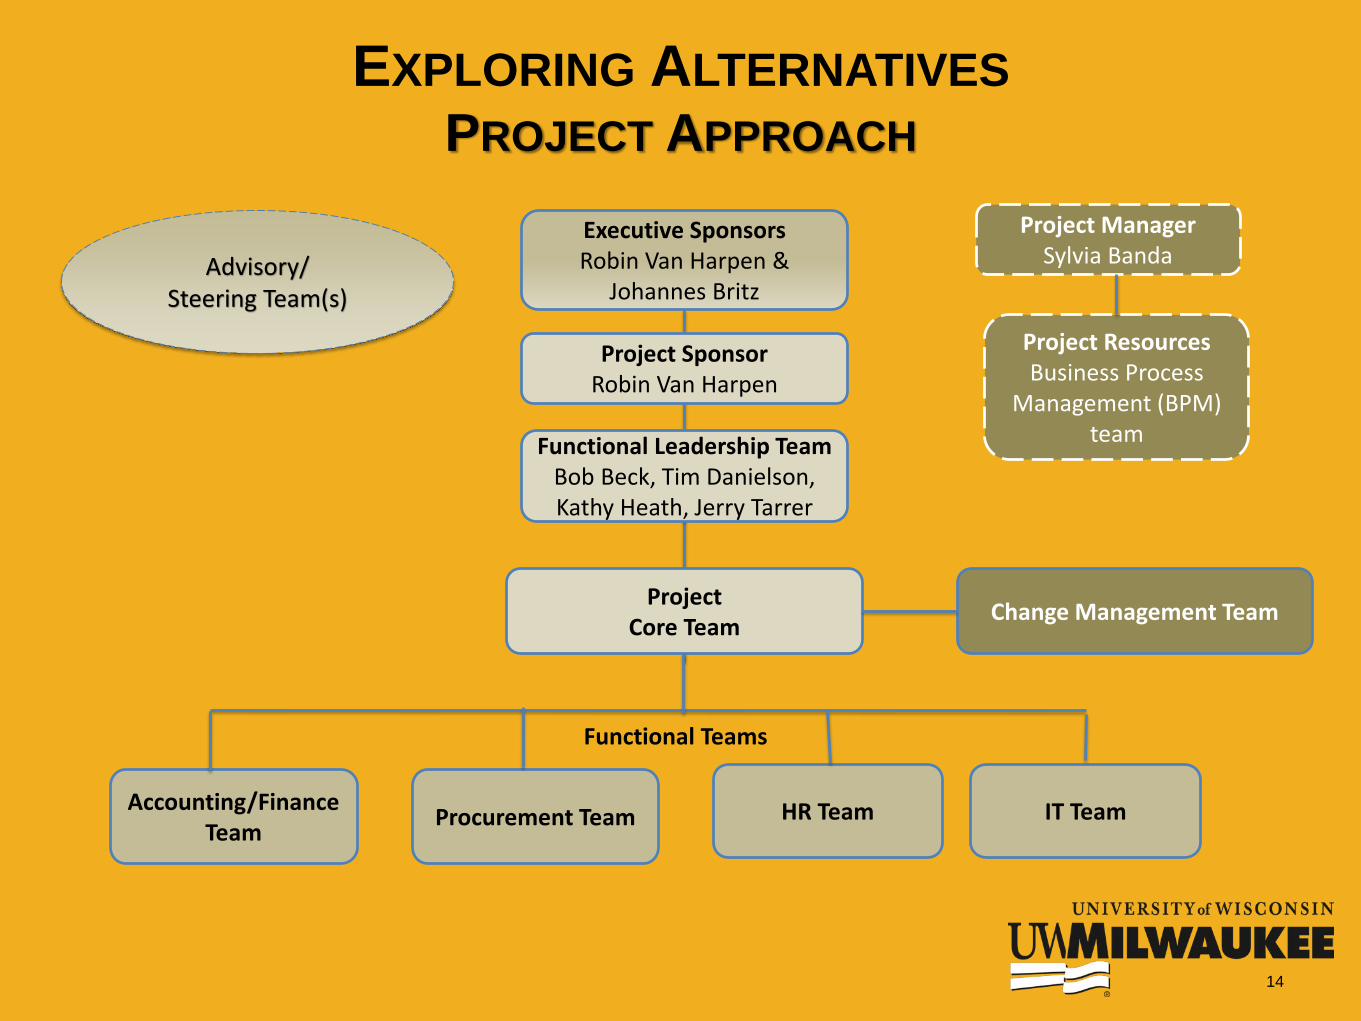
Project SponsorRobin Van Harpen
Functional Leadership TeamBob Beck, Tim Danielson, Kathy Heath, Jerry Tarrer
Project ManagerSylvia Banda
ProjectCore Team
Project ResourcesBusiness Process
Management (BPM) team
Procurement Team IT TeamHR Team
Functional Teams
Advisory/Steering Team(s)
Executive SponsorsRobin Van Harpen &
Johannes Britz
EXPLORING ALTERNATIVESPROJECT APPROACH
14
Accounting/Finance Team
Change Management Team
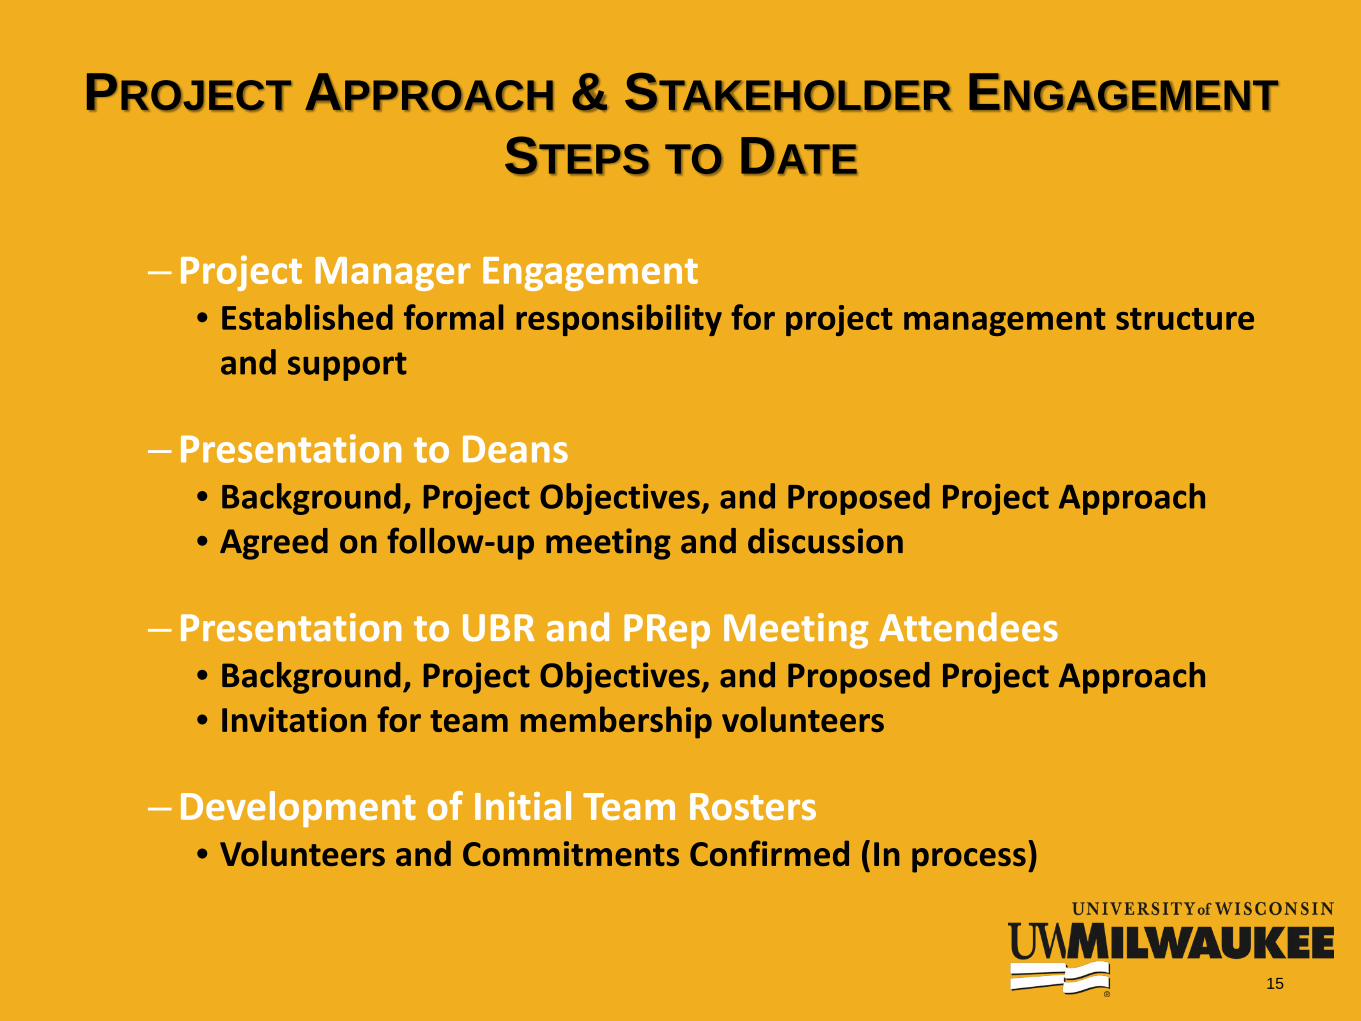
– Project Manager Engagement• Established formal responsibility for project management structure
and support
– Presentation to Deans• Background, Project Objectives, and Proposed Project Approach• Agreed on follow-up meeting and discussion
– Presentation to UBR and PRep Meeting Attendees• Background, Project Objectives, and Proposed Project Approach• Invitation for team membership volunteers
– Development of Initial Team Rosters • Volunteers and Commitments Confirmed (In process)
PROJECT APPROACH & STAKEHOLDER ENGAGEMENTSTEPS TO DATE
15
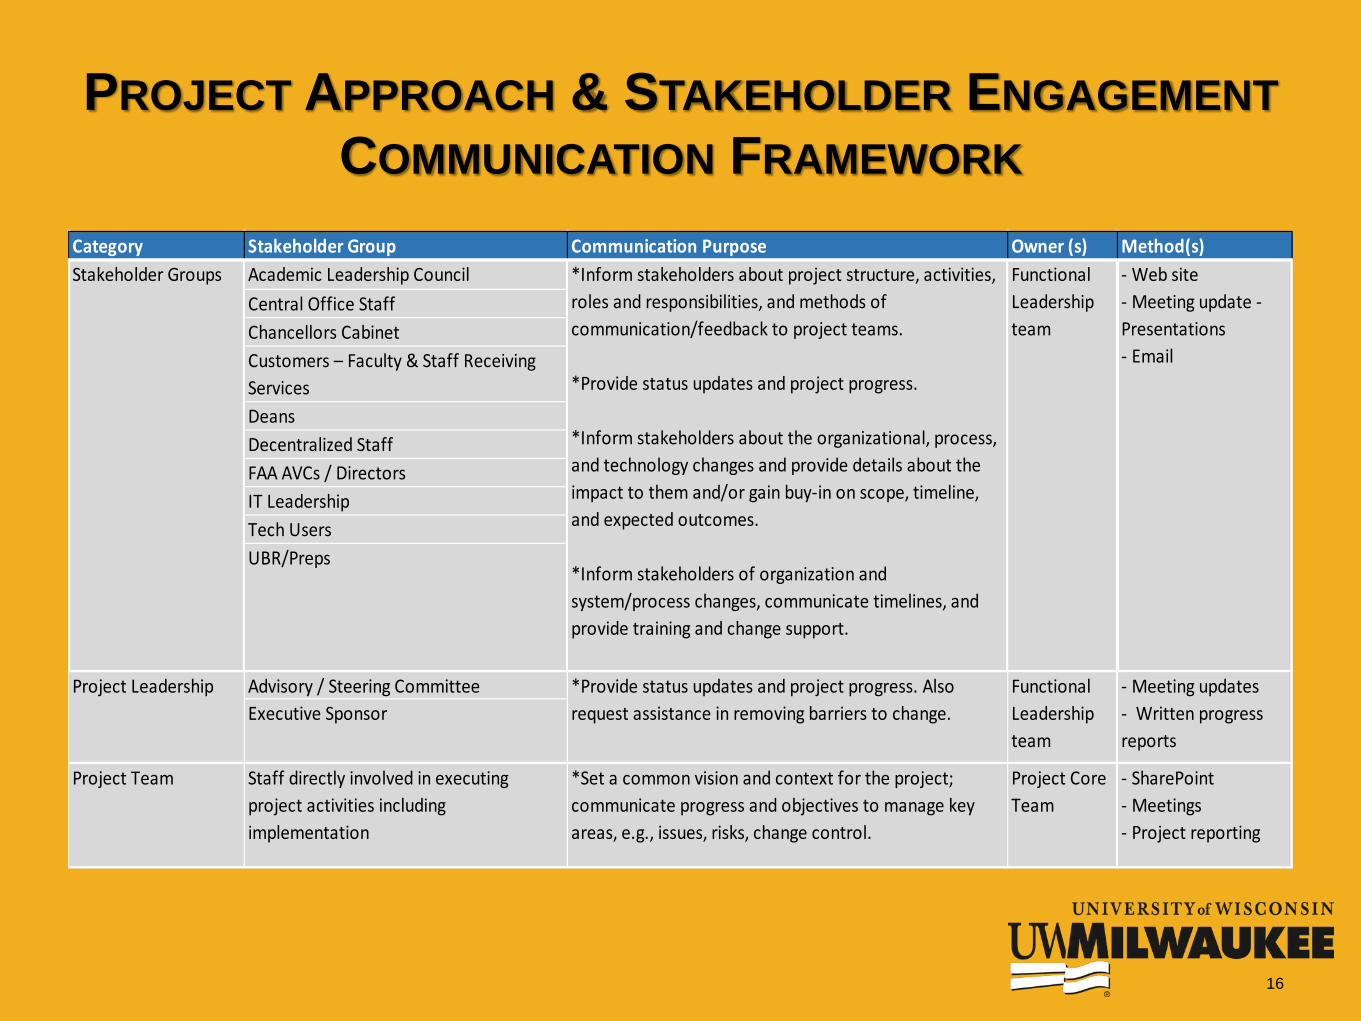
PROJECT APPROACH & STAKEHOLDER ENGAGEMENTCOMMUNICATION FRAMEWORK
16
Category Stakeholder Group Communication Purpose Owner (s) Method(s)Academic Leadership CouncilCentral Office StaffChancellors CabinetCustomers – Faculty & Staff Receiving ServicesDeansDecentralized StaffFAA AVCs / DirectorsIT LeadershipTech UsersUBR/Preps
Advisory / Steering CommitteeExecutive Sponsor
Project Team Staff directly involved in executing project activities including implementation
*Set a common vision and context for the project; communicate progress and objectives to manage key areas, e.g., issues, risks, change control.
Project Core Team
- SharePoint- Meetings- Project reporting
- Web site- Meeting update -Presentations- Email
- Meeting updates- Written progress reports
Stakeholder Groups
Project Leadership *Provide status updates and project progress. Also request assistance in removing barriers to change.
Functional Leadership team
*Inform stakeholders about project structure, activities, roles and responsibilities, and methods of communication/feedback to project teams.
*Provide status updates and project progress.
*Inform stakeholders about the organizational, process, and technology changes and provide details about the impact to them and/or gain buy-in on scope, timeline, and expected outcomes.
*Inform stakeholders of organization and system/process changes, communicate timelines, and provide training and change support.
Functional Leadership team
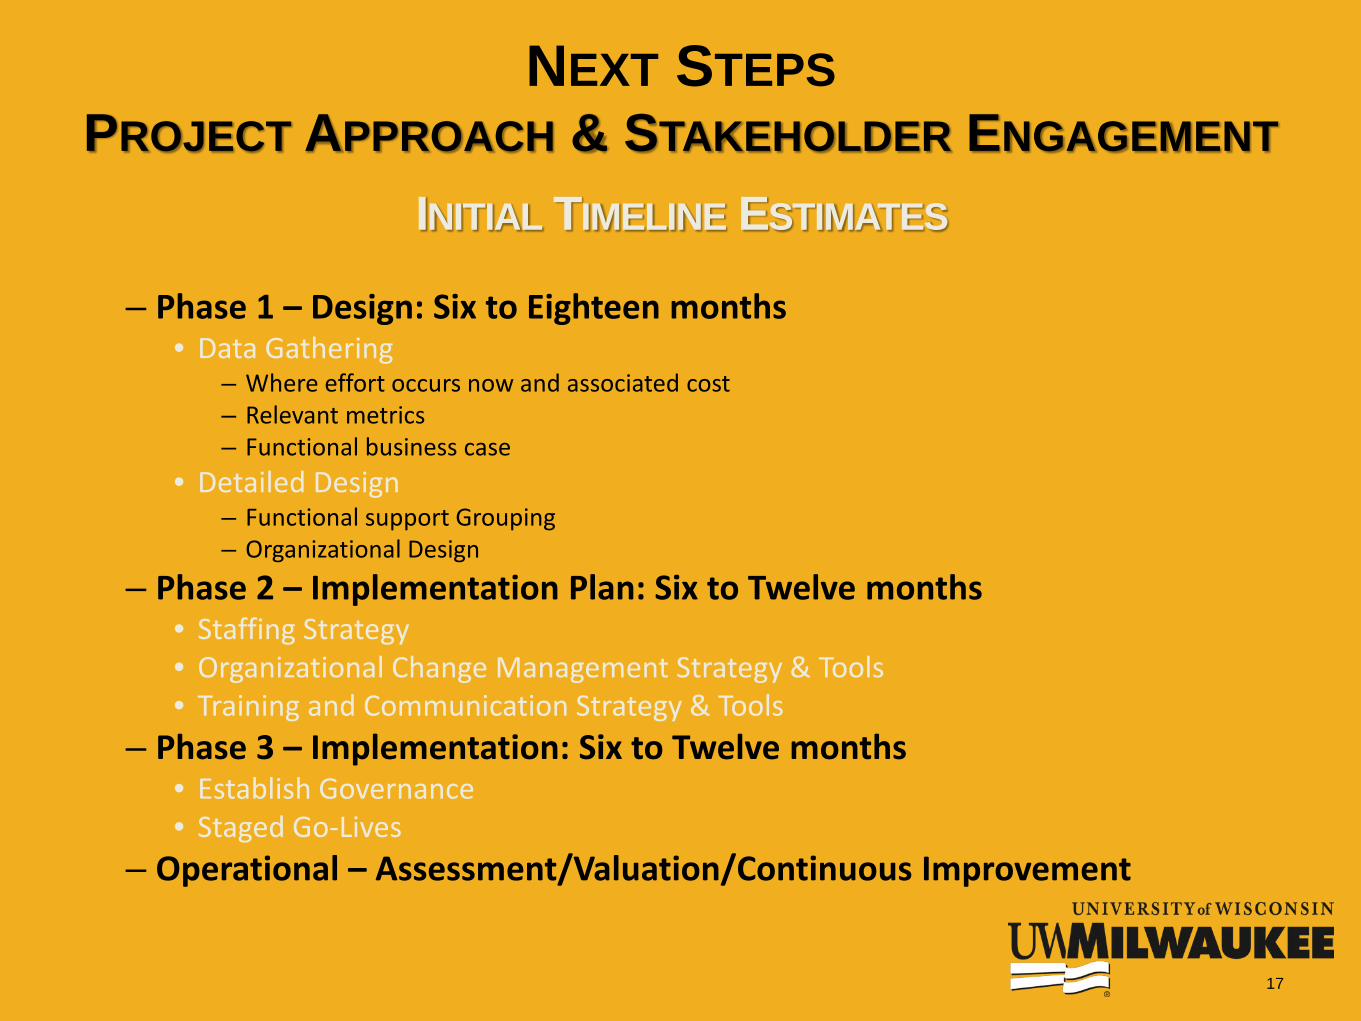
– Phase 1 – Design: Six to Eighteen months• Data Gathering
– Where effort occurs now and associated cost– Relevant metrics– Functional business case
• Detailed Design– Functional support Grouping– Organizational Design
– Phase 2 – Implementation Plan: Six to Twelve months• Staffing Strategy• Organizational Change Management Strategy & Tools• Training and Communication Strategy & Tools
– Phase 3 – Implementation: Six to Twelve months• Establish Governance• Staged Go-Lives
– Operational – Assessment/Valuation/Continuous Improvement
NEXT STEPSPROJECT APPROACH & STAKEHOLDER ENGAGEMENT
INITIAL TIMELINE ESTIMATES
17
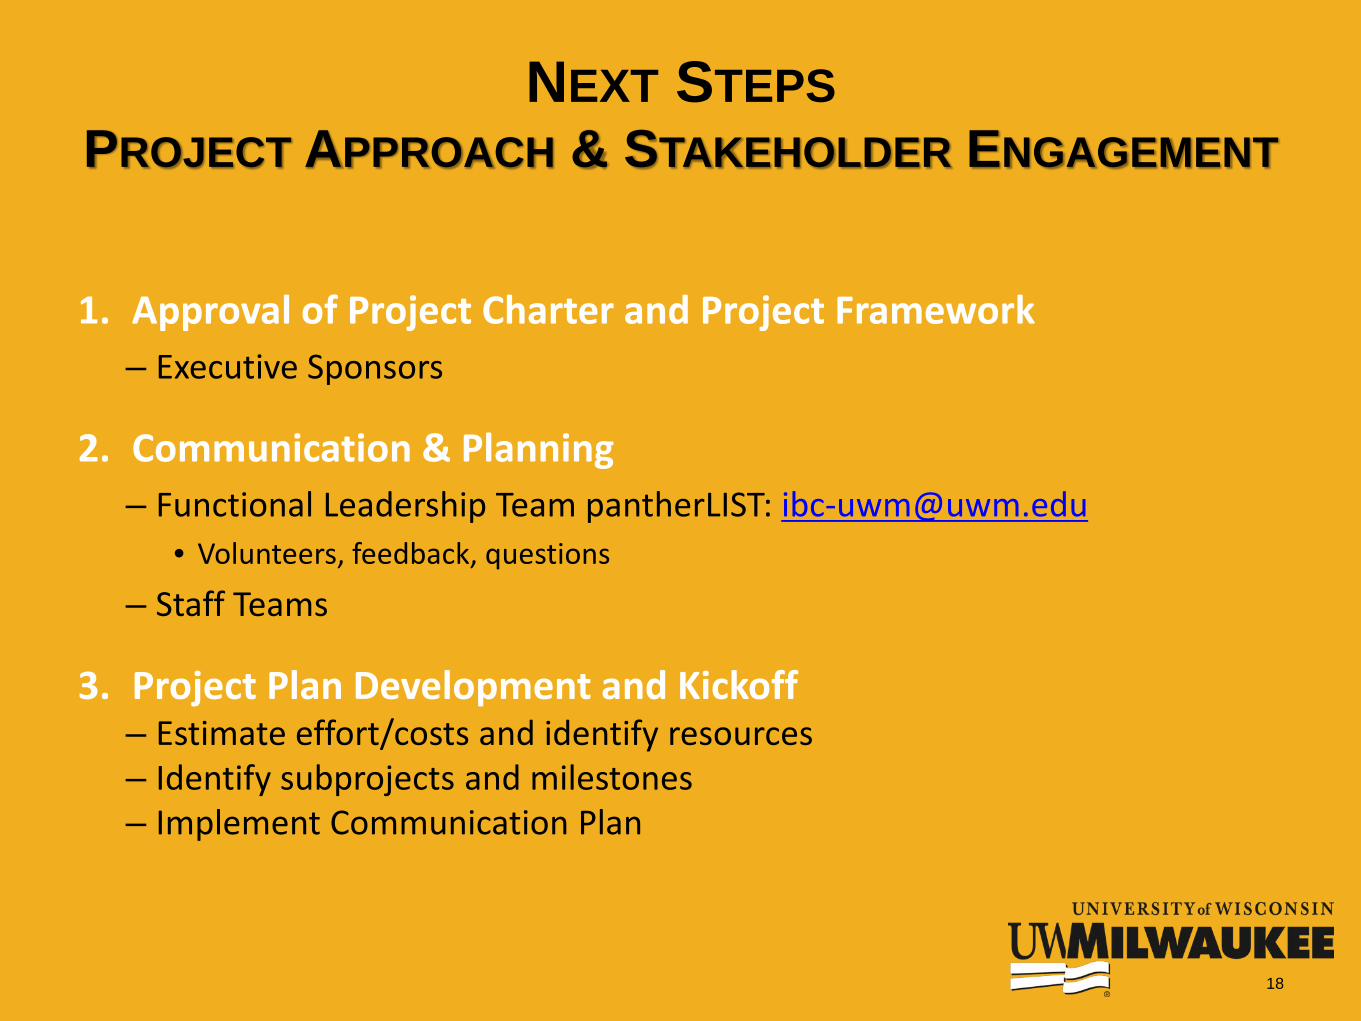
1. Approval of Project Charter and Project Framework – Executive Sponsors
2. Communication & Planning– Functional Leadership Team pantherLIST: [email protected]
• Volunteers, feedback, questions
– Staff Teams
3. Project Plan Development and Kickoff– Estimate effort/costs and identify resources– Identify subprojects and milestones– Implement Communication Plan
NEXT STEPSPROJECT APPROACH & STAKEHOLDER ENGAGEMENT
18