Embed Size (px)
DESCRIPTION
uterus elektromiografi
Citation preview
16
An Uterine Electromyographic Activity as a Measure of Labor Progression
Jerneja Vrhovec and Alenka Maček Lebar University of Ljubljana,
Slovenia
1. Introduction
Understanding the physiology of the uterus during term and preterm parturition is essential to solving clinical problems related to gestation and labor. The uterus is a smooth muscle organ. It undergoes specific changes during gestation and is known for its unique contractility during the labor. At the term the uterus is 10 to 20 times heavier than it is before pregnancy (from 50 g to 1000 g). This enormous expansion during pregnancy is mostly due to the increase of the size of muscle cells (hypertrophy) and less due to the proliferation of muscle cells (hyperplasia). The uterus should accommodate the growing fetus, and support the fetus through sustained muscle tone, without generating propagated contractions. This state of quiescence – the absence of the coordinated contractions – is critical to the successful outcome of pregnancy. Therefore the delicate balance should be obtained between the maintenance of tone and the resistance to propagated uterine contractions until the end of gestation and the onset of labor. At the onset of labor the uterus becomes active and at the labor’s end it empties its contents through rhythmic, forceful, organized and synchronous contractions that are crucial for the successful outcome of pregnancy.
1.1 Uterine structure and activity
Functionally the pregnant human uterus can be divided into two parts: the upper part (the uterine corpus) and the lower part (the cervix). The uterine corpus is mainly composed of smooth muscle and can be divided into upper part named fundus, which is contracting and thickening during labor, and the lower part of uterus corpus named isthmus. During the labor, isthmus’ main part is the junction between the fundus and the cervix; it thins and dilates around fetus (Schwalm & Dubrauszky, 1966; Chard & Grudzinskas, 1994). The uterine corpus is composed of three layers. The uterine mucosa or endometrium is the innermost layer that lines the cavity of the uterus (inner wall). Its function is nourishing the fetus during pregnancy. The middle layer of the uterus is a smooth muscle named myometrium. The outermost layer, or serosa, is a thin fibrous layer contiguous with extrauterine connective tissue structures such as ligaments that give mechanical support to the uterus within the pelvic cavity (Devedeux et al., 1993; Chard & Grudzinskas, 1994). The smooth muscle of myometrium is formed by three distinct anatomical layers of smooth muscle fibers organized in different ways. The outermost layer has longitudinal and circular orientation of fibers. In the middle layer of myometrium the origins of muscle
www.intechopen.com
Applications of EMG in Clinical and Sports Medicine
244
fibers are tubes of horns. These muscle fibers are diagonally interlaced with each other. The innermost layer comprises muscle fibers which are mostly in a circular orientation. The distinct organization of anatomical layers of smooth muscle fibers ensures efficient contractility. While the majority of uterus corpus is composed of smooth muscle fibers, in cervix the actual count of smooth muscle fibers is from 10% - 40%. The smooth muscle fibers in cervix lay mostly in a circular orientation (Pajntar et al., 1998; Pajntar et al., 2001; Rudel & Pajntar, 1999; Word et al., 2007; Oláh, 1994). The role of the smooth muscle in cervix is namely that by contractions of muscle fibers contributes to the closing of cervical canal during pregnancy, while in the course of labor muscle fibers dilate, or through a different kind of contraction actively participate in the dilatation and retraction of the cervix. Few weeks prior to the onset of labor uterine contractions, the cervix undergoes tangible changes in consistency and length. Results from different studies using serial measurements of cervical length indicate that cervical ripening precedes myometrial contractions of labor by several weeks, suggesting that parturition in women is a process of long duration and that uterine contractions of labor are late events in the parturition progress (Word et al., 2007).
1.2 Labor and its monitoring
Labor is a physiologic process during which the products of conception (i.e. the fetus, membranes, umbilical cord and placenta) are expelled from the uterus. The onset of labor is defined as regular, painful uterine contractions resulting in progressive cervical effacement and dilatation. Labor is achieved with rhythmic uterine contractions of sufficient frequency, intensity and duration and changes in the connective tissue resulting in dilatation of the cervix (Pajntar et al., 1998). The labor is divided into three stages that delineate milestones in a continuous process. The first stage begins with regular uterine contractions and ends with complete cervical dilatation at 10 cm. The first stage is subdivided into the latent phase and the active phase. The latent phase begins with mild, irregular uterine contractions that soften and shorten the cervix. The contractions become progressively more rhythmic and stronger. The latent phase is followed by the active phase of labor, which usually begins at about 3-4 cm of cervical dilation and is characterized by rapid cervical dilation and descent of the presenting fetal part. The first stage of labor ends with complete cervical dilation at 10 cm (Kilpatrick S.J. & Russell K.L., 1989; Albers et al., 1996). The mean frequency of contractions over the active phase of labor is four contractions in 10 min, rising to five in 10 min in the late first stage (Sabry-Rizk et al., 2000). The duration of contractions remains remarkably constant, between 70 s and 90 s. The second stage begins with complete cervical dilatation and ends with the delivery of the fetus (Chard & Grudzinskas, 1994). The third stage of labor is defined by the time period between the delivery of the fetus and the delivery of the placenta and fetal membranes. During the labor the medical staff monitors the state of the woman and the fetus (FDA, n.d.). The monitoring of the response of the fetal heart to the uterine activity is named cardiotocography. To monitor the fetal brain activity a fetal electroencephalographic monitor is used. Ultrasonic devices can be used to determine and monitor accurately the position of the fetal head and the configuration of the cervix as well as the fetal heart rate. During the labor the blood pressure, the temperature of the patient and contractions are routinely and constantly monitored. Especially when complications occur, e.g., when labor shows poor progress, quantitative assessment of uterine contraction efficiency can guide the
www.intechopen.com
An Uterine Electromyographic Activity as a Measure of Labor Progression
245
physician to choose a uterine contractions induction or augmentation, a Caesarean section, or other therapies. The devices for monitoring uterine contractions range in complexity from simple self-awareness of contractions to complex electronic pressure sensors. The currently used devices for monitoring uterine contractions are noninvasive tocodynamometer or ‘toco’ and invasive intrauterine pressure catheter. By tocodynamometers changes in abdominal contour are detected as an indirect indication of uterine contractions. The disadvantages of currently available ‘tocos’ are their uncomfortableness and inaccurateness (Schlembach et al., 2009). The intrauterine pressure catheters provide the best information concerning uterine contractions, but their invasiveness can increase the risk of infection and insertion requires rapture of the membranes (Maner &Garfield, 2007). A lot of effort has been put in quantitative evaluation of uterine contractions to measure their efficiency. For example Montevideo units (MVU) was defined as a measure of uterine contraction intensity expressed as the sum of the intensity of each contraction within a 10-min period, with intensity defined as the peak pressure achieved by the contraction minus the baseline tone (Chard & Grudzinskas, 1994). Although MVU are commonly used in practice, they do not differ between labor outcomes (Cesarean section according to dystocia vs. vaginal delivery) in patients with abnormally progressing labor undergoing augmentation (Euliano et al., 2009). Another method is estimation of cumulative uterine contractions intensity defined as uterine activity units (UAU) per fixed time unit (Gibb et al., 1984; Miller et al., 1976). A correlation between UAU and MVU, was shown (Gibb et al., 1984). The method closely related to UAU is the uterine activity integral (UAI) and is defined as the integral of the intrauterine pressure above the baseline over the contraction duration (Bakker et al., 2007). One of the simplest methods for monitoring the progress of labor is a partogram. It is a graphical representation of the head station and cervical dilatation in centimeters against the duration of labor in hours. This graph is used by labor medical staff and is based on the assumption that it facilitates early recognition of dystocia, thereby optimizing the timing of appropriate intervention, such as amniotomy, oxytocin augmentation, or, most importantly, Caesarean section (Sharf et al., 2007; Neilson et al., 2003; Windrim et al., 2007; Luria et al., 2009; Sizer et al., 2000; Basu et al., 2009). The method which could be used to help medical stuff to decide how the management of the labor should proceed is the Bishop Score. The Bishop Score (total score) is achieved by the vaginal examination and is composed of five components: fetal station, cervical dilation, cervical effacement, cervical position and cervical consistency (Bishop, 1964; Marconi et al., 2008; Newman et al., 2008). Intrapartum assessment of uterine activity is routinely employed to guide active management of labor and delivery. The goal of such management is 2-fold: first the progress in labor resulting in vaginal delivery, and secondly the identification of unsuccessful labor that requires Caesarean delivery (Euliano et al., 2009). While the gold standard for assessing labor progress is serial cervical examinations, the risk of infection coupled with the inherent inaccuracy of the measure limits its use to the 2-3 hours intervals. Although sufficient for normal labors, in the slowly dilating patient, the inaccuracies of such judgment can complicate the diagnosis of labor arrest (Euliano et al., 2009). Only the continuous cervical dilation and fetal head station monitoring would improve the labor monitoring of this kind (Euliano et al., 2009). For now, no method is available for non-invasive monitoring and quantification of uterine contractions (Vinken et al., 2010; Euliano et al., 2006), therefore accurate measuring methods and uterine contractions understanding is a challenge for research groups for years.
www.intechopen.com
Applications of EMG in Clinical and Sports Medicine
246
1.3 Uterine electromyography
Among approaches that has been applied to improve the methods for monitoring gestation and labor changes in uterine activity, noninvasive and invasive procedures based on recording of uterine electrical signals was developed. Their aim was mainly to quantitatively evaluate the uterine activity. An outcome was the method that was called uterine electromyography (EMG) or also electrohysterography (EHG). Uterine electromyography (uterine EMG) is a monitoring technique developed for medical diagnostics in obstetrics, like some other better known techniques, electrocardiography and electroencephalography. The technique is used for providing information about uterine activity during the pregnancy and labor. This is accomplished by measuring the action potential changes that are associated with the uterine contractions. Nowadays it is well established that uterine contractions are the results of the electrical activity propagation through the uterine muscle cells (Vinken et al., 2010). During the measurement of action potential changes the measuring electrodes are in most cases placed on the maternal abdomen. The first reports of uterine EMG studies were published in 1912 (Veit, 1912). Since 1950s uterine electromyography has been extensively investigated. The uterine electromyography was recorded either internally with endouterine electrodes, or externally with abdominal electrodes, both in animals and humans (Devedeux et al., 1993). It was assumed that abdominal electromyograms could be useful for clinical evaluations of uterine activity during pregnancy due to its noninvasive nature (Devedeux et al., 1993). For registration of the cervical EMG activity adapted spiral fetal scalp electrodes were used, which were inserted directly in cervical tissue from the vaginal side (Pajntar et al., 2001; Pajntar et al., 1998; Rudel & Pajntar, 1999). It was ascertained that the EMG signal records from the cervix reflected the actual activity of cervical smooth muscle cells. Therefore cervical EMG signal can be either independent from myometrial contractions or related to them (Rudel & Pajntar, 1999; Pajntar et al., 1998). The abdominal uterine EMG records had poor quality comparing to uterine EMG records measured invasively. The amplitude of externally recorded bursts of spikes (from 50 to 200 µV) was about five times lower than the amplitude of the bursts obtained from the internal electrodes. The amplitude of the uterine EMG recorded from the abdominal wall can be affected by various conditions: the type and location of electrodes, the distance between them, as well as the skin impedance of the patient. Attenuation of myometrial signals occurs more for some patients and less for others, depending on a variance in subcutaneous tissues and a variance in conductivity of the skin – electrode interference. A thicker layer of the tissue between the myometrium and pickup electrodes will result in the better signal. In addition, poor conductivity due to high impedance, possibly related to salinity levels or other chemical factors on the skin surface, serves to reduce the measured uterine signal strength and to increase the background noise in the recordings of some patients. Therefore the amplitude and other connected parameters cannot be used directly to compare uterine EMG from different patients. Only the trend of variation of amplitude-based parameters can be useful in clinical applications (Jezewski et al., 2005; Maner et al., 2003). The uterine EMG is a non-stationary signal (Terrien et al., 2008). The complete information concerning the uterine electrical activity can be obtained by recording the abdominal signal in frequency range from 0 to 5 Hz (Jezewski et al., 2005). The uterine EMG signal frequency spectrum is mainly composed of two frequency intervals, one of low frequencies between 0.1 and 1.2 Hz and the other of high frequencies between 1.2 and 4.7 Hz. They has been named fast wave low (FWL) and fast wave high (FWH) (Leman et al., 1999; Terrien et al.,
www.intechopen.com
An Uterine Electromyographic Activity as a Measure of Labor Progression
247
2008). Although the definition of FWL and FWH was made by observation of monkey’s uterine activity, it is often used in human uterus activity analysis as well. The FWL is presumed to be related to the propagation of the electrical activity along the uterus and FWH is related to excitability of the uterus. The main frequency position of FWH may change as the gestation progresses (Terrien et al., 2010), as well as between individuals and species (Devedeux et al., 1993). The characterization of FWL and FWH may be used to detect a potential risk of preterm delivery, even in the early gestational stage (Leman et al., 1999; Terrien et al., 2008; Jezewski et al., 2005). Most of the studies have focused on the analysis of contractility of uterus using two or four electrodes. It is generally supposed that the increase in contractility is mainly observable through an increase in frequency and/or amplitude (Terrien et al., 2009). But for investigation of propagation of electrical activity through the whole uterus the increase of system electrodes is necessary (Terrien et al., 2009). Mainly uterine EMG signal was studied only on specific parts of the records - characteristic intermittent “bursts” of action potentials that correspond to mechanical contractions of uterus (Maul et al., 2003). The EMG segments taken during bursts of uterine activity were usually analyzed with observing amplitude distribution of the signal (Garfield & Maner, 2007; Doret et al., 2005; Jezewski et al., 2005) or calculating the power density spectrum and its modus and/or median frequency (Jezewski et al., 2005; Doret et al., 2005). Recently, approaches based on wavelet transform were used to detect a risk of preterm labor (Hassan et al., 2010). It was demonstrated that during most of the pregnancy, uterine activity was minimal, consisting of infrequent and low amplitude electromyographic bursts. During term and preterm labor bursts of electromyographic activity were frequent and of large amplitude (Buhimschi et al., 1997). It was assumed that root mean square RMS value denotes the woman’s risk for preterm delivery, independent of other possible causes (Verdenik et al., 2001). The importance of an independent activity of the smooth muscle cells in the cervix was also shown by a calculation of RMS values (Pajntar & Verdenik, 1995); namely the RMS value calculated over the intervals of cervical EMG signal is significantly greater in very unripe cervices then in riper cervices at the onset of amniotomy and oxytocin induced labors (Pajntar & Verdenik, 1995). The shifting of the uterine EMG signal energy to higher frequencies as delivery approaches is also one of the phenomena observed in the literature (Buhimschi et al., 1997; Doret et al., 2005; Garfield et al., 2002; Maner & Garfield, 2007; Vinken et al., 2010; Maner et al., 2003). In particular, the modus frequency of the uterine EMG signal power spectral density (PSD) was commonly tested. Maner et al. reported that the modus frequency of power density spectrum increases as the measurement-to-delivery interval decreases from more than 4 days before the labor to less than 24 hours (Maner et al., 2003). It was shown that nifedipine is an effective tocolytic agent for suppressing preterm contractions with the shift of modus frequency of PSD to lower frequencies when it is expected to rise, with approaching delivery (Vinken et al., 2010). Fele-Žorž et al. showed that also the value of median frequency is higher, when the gestation is coming to the end, which may be associated with term delivery (Fele-Žorž et al., 2008). For classifying the EMG signals recorded from patients in different state (non-laboring, in labor) the researchers used artificial neural networks, which are usually used for solving artificial intelligence problems without necessarily creating a model of a real biological system (Maner & Garfield, 2007). The bursts of uterine EMG were grouped in different
www.intechopen.com

Applications of EMG in Clinical and Sports Medicine
248
groups due to the patient’s state during the recording: preterm-non-laboring, term-non-laboring, term and preterm labor. The bursts were quantified by their duration, the mean value and/or standard deviation and the modus frequency of PSD. For each EMG record also the number of bursts per unit time was evaluated. According to all these measures the artificial neural networks classified the majority of bursts correctly (Maner & Garfield, 2007; Diab et al., 2009). Oczeretko et al. showed that spontaneous uterine activity of non-pregnant uterus evaluated by inside uterus pressure measurements contains nonlinear features (Oczeretko et al. 2005). Therefore techniques that are able to characterize the dynamic behavior of underlying physiological system were applied also on uterine EMG signals. It was shown that the nonlinear synchronization measures, like the mutual correlation dimension and the cross-approximate entropy, may have a diagnostic value (Oczeretko et al. 2010). The results of synchronization between contractions were promising, especially when for evaluation the fundal and the cervical signals were used. The Sample entropy was proven to be a promising method to differ between preterm and term labors (Fele-Žorž et al. 2008). It was also shown that it would be possible to evaluate the progress of the labor with Sample entropy (Vrhovec et al. 2010; Vrhovec 2009). Sabry-Rizk et al. examined the nonlinear dynamics of the uterus EMG signals on normal and abnormal labor contractions in the first stage of the labor. An attractor structures have been calculated on abdominal EMG signals at various relaxation and contraction periods. The observed black inertness of attractors was called nucleus. Precisely, by studying its fractal behavior it was shown that the size of the nucleus increases with cervical dilatation until it takes over the entire phase-space. The weak labor contractions, typical for failure in progress in the first stage of labor, showed predominantly periodic structures with or without small-size nuclei (Sabry-Rizk et al. 2000). Maner et al. used wavelet transform on the bursts' traces and then calculated fractal dimension of the resulting transformed EMG burst-trace. They showed that this wavelet – decomposition - generated fractal dimension can successfully discern between patients who will deliver spontaneously within 24 h and those who will not; moreover, it can classify antepartum versus labor patients (Maner et al. 2006). But all nonlinear methods do not perform as expected, as it was shown with maximal Lyapunov exponent and correlation dimension (Fele-Žorž et al. 2008). Fele-Žorž et al. showed on 27 min long EMG signals segments, that there is no significant difference between preterm and term labors according to Lyapunov exponent and correlation dimension. Researchers on the field agree that for efficient labor synchronization of uterine electrical activity is of crucial importance. Uterine EMG activity on different parts of the uterus can be observed from the abdominal surface using multi-electrode measuring systems. Jiang et al. simultaneously measured uterine EMG activity by 16 digitized channels. During the study 297 contractions were observed obtained from twenty patients who went under labor. They calculated energy on the frequency range between 0.2 and 0.45 Hz and between 0.8 and 3 Hz. The results were imaged by calculating the intermediary value of those measured by the electrodes. Visual presentation displayed the synchronization of uterine contractions (Jiang et al. 2007). It was postulated that observation of synchronization together with the classical time – frequency analysis may increase the prediction of labor (Terrien et al., 2010). Using eight channel measuring system and continuously calculating frequencies of movement patterns from normalized and filtered signals, the authors identified the center of uterine activity; Euliano et. al. (Euliano et al., 2009) followed the direction of its propagation and movement. Interestingly, the study reports that the center of uterine activity had a
www.intechopen.com
An Uterine Electromyographic Activity as a Measure of Labor Progression
249
predominant fundal direction in women who delivered successfully. This implies that the lower uterine segment begins to relax earlier than the upper portion of the uterus in women who deliver vaginally (Euliano et al. 2009; Buhimschi 2009).
1.4 Dystocia and its recognition
Arrest in the active phase of labor or dystocia is labor abnormality refers to prolonged or slowly progressing labor. It is common in nulliparous women, as indicated by the number requiring augmentation, operative vaginal delivery, or cesarean section (Joseph et al., 2003; Kjaergaard et al., 2009). Women with a diagnosed dystocia had more often non-clear amniotic fluid, more post-partum hemorrhage, significantly increased odds of chorioamnionitis and their children were more often given low one-minute neonatal Apgar scores as compared to women delivered without a diagnosed dystocia (Kjaergaard et al., 2009; Pitkin, 2003). Although many reasons were identified such as inappropriate position or size of the fetus, congenital anomalies, cephalopelvic disproportion, abnormal uterine contractions and others (Chard & Grudzinskas, 1994), diagnosis of dystocia and optimal management recommendations are still under consideration (Shields et al., 2007). One of the reasons for slow diagnosis of dystocia in labor progress is a lack of qualitative measurement methods for evaluating the uterus activity during labor (Euliano et al., 2009). The measurement of the uterine EMG activity provides information about myocyte electrical activity directly and investigations have indicated that it is a sensitive method having a potential in a clinical practice as a supplement tool used for monitor labor (Garfield & Maner, 2007; Doret et al., 2005; Jezewski et al., 2005). In the previous studies researchers evaluated the characteristic of the final number of burst segments, which did not describe the progress of the labor (Garfield & Maner, 2007; Doret et al., 2005; Jezewski et al., 2005). Although majority of studies are done on bursts, there are studies which showed that during labor the activity between bursts is also related to the course of labor (Pajntar et al., 1998; Verdenik et al., 2001). In this work we presented how the characteristics of uterine EMG bursts change during the last eight weeks of gestation and the evaluation of normally progressing labor as well as labor with a diagnosis of dystocia using continuously monitored uterine EMG signals. Two types of uterine EMG signal segmentation were used: successive non-overlapping segments of uterine EMG record and successive burst segments of EMG activity. By analyzing the successive non-overlapping segments of uterine EMG record we could avoid the time-consuming procedure of the bursts of EMG activity extraction. For interpretation of the uterine EMG signals Sample entropy (SampEn), the measure of time series complexity, was used.
2. Uterine EMG measurements and patients
For the purpose of the studies we used two databases. Measuring protocol that was used for recording of the “contractions” database, is described in details in Karlsson et all (Karlsson et al., 2007). The measurements were performed at the Landspitali University hospital in Iceland using a protocol approved by the relevant ethical committee. The “contraction” database was recorded by Karlsson et all (Karlsson et al., 2007) and was given to us for analysis. The subjects were seven healthy patients monitored from 32nd week of gestation to labor. The “contraction” database consists of 45 EMG signals recorded during the contractions. The EMG signals were recorded on the woman’s abdominal wall by a 16-channel multi-purpose physiological signal recorder resulting in 12 bipolar EMG signals.
www.intechopen.com
Applications of EMG in Clinical and Sports Medicine
250
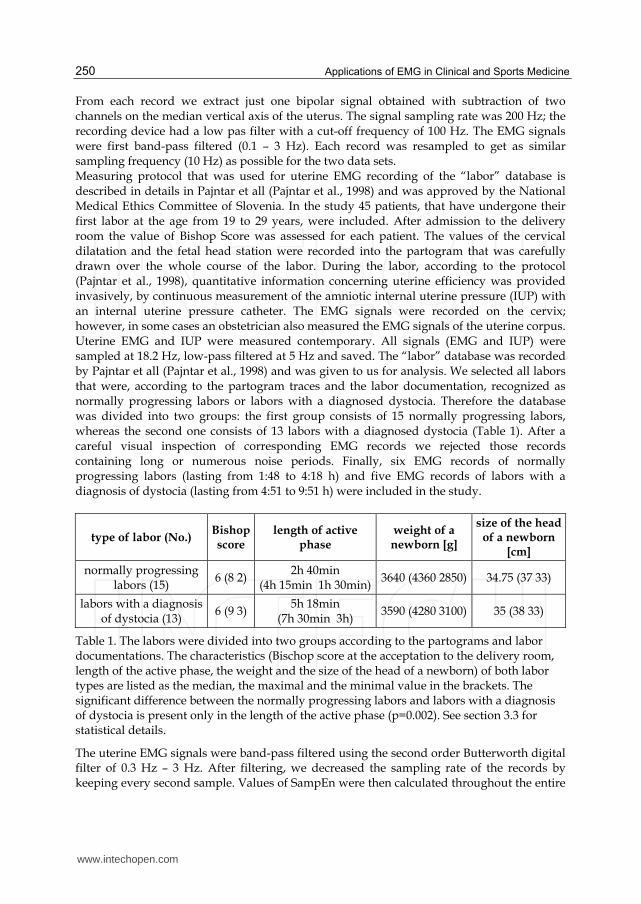
From each record we extract just one bipolar signal obtained with subtraction of two channels on the median vertical axis of the uterus. The signal sampling rate was 200 Hz; the recording device had a low pas filter with a cut-off frequency of 100 Hz. The EMG signals were first band-pass filtered (0.1 – 3 Hz). Each record was resampled to get as similar sampling frequency (10 Hz) as possible for the two data sets. Measuring protocol that was used for uterine EMG recording of the “labor” database is described in details in Pajntar et all (Pajntar et al., 1998) and was approved by the National Medical Ethics Committee of Slovenia. In the study 45 patients, that have undergone their first labor at the age from 19 to 29 years, were included. After admission to the delivery room the value of Bishop Score was assessed for each patient. The values of the cervical dilatation and the fetal head station were recorded into the partogram that was carefully drawn over the whole course of the labor. During the labor, according to the protocol (Pajntar et al., 1998), quantitative information concerning uterine efficiency was provided invasively, by continuous measurement of the amniotic internal uterine pressure (IUP) with an internal uterine pressure catheter. The EMG signals were recorded on the cervix; however, in some cases an obstetrician also measured the EMG signals of the uterine corpus. Uterine EMG and IUP were measured contemporary. All signals (EMG and IUP) were sampled at 18.2 Hz, low-pass filtered at 5 Hz and saved. The “labor” database was recorded by Pajntar et all (Pajntar et al., 1998) and was given to us for analysis. We selected all labors that were, according to the partogram traces and the labor documentation, recognized as normally progressing labors or labors with a diagnosed dystocia. Therefore the database was divided into two groups: the first group consists of 15 normally progressing labors, whereas the second one consists of 13 labors with a diagnosed dystocia (Table 1). After a careful visual inspection of corresponding EMG records we rejected those records containing long or numerous noise periods. Finally, six EMG records of normally progressing labors (lasting from 1:48 to 4:18 h) and five EMG records of labors with a diagnosis of dystocia (lasting from 4:51 to 9:51 h) were included in the study.
type of labor (No.) Bishop score
length of active phase
weight of a newborn [g]
size of the head of a newborn
[cm]
normally progressing labors (15)
6 (8 2)2h 40min
(4h 15min 1h 30min)3640 (4360 2850) 34.75 (37 33)
labors with a diagnosis of dystocia (13)
6 (9 3)5h 18min
(7h 30min 3h) 3590 (4280 3100) 35 (38 33)
Table 1. The labors were divided into two groups according to the partograms and labor documentations. The characteristics (Bischop score at the acceptation to the delivery room, length of the active phase, the weight and the size of the head of a newborn) of both labor types are listed as the median, the maximal and the minimal value in the brackets. The significant difference between the normally progressing labors and labors with a diagnosis of dystocia is present only in the length of the active phase (p=0.002). See section 3.3 for statistical details.
The uterine EMG signals were band-pass filtered using the second order Butterworth digital filter of 0.3 Hz – 3 Hz. After filtering, we decreased the sampling rate of the records by keeping every second sample. Values of SampEn were then calculated throughout the entire
www.intechopen.com
An Uterine Electromyographic Activity as a Measure of Labor Progression
251
labor records in two ways. Firstly, each uterine EMG signal was divided into successive non-overlapping segments that lasted 8.2 min, contained 4500 samples and at least one uterine contraction. From these 4500 samples we calculated one value of SampEn. Secondly, all burst segments that correspond to successive uterine contractions were extracted from uterine EMG signal. The concurrently recorded intrauterine pressure (IUP) was used in order to ease the identification of contractions in recorded time. After identification, burst segments of the uterine EMG activity were manually extracted. All bursts segments were visually inspected and we rejected those burst segments that did not exhibit concurrent increase in IUP. The recorded uterine contractions lasted from 27.1 s to 224.3 s, therefore corresponding burst segments of the uterine EMG activity contained from 431 to 2095 samples. In this case we calculated one value of SampEn for individual burst segment.
3. Methods
Time- and frequency- domain methods have been used for evaluation of uterine EMG signals for years (see chapter 1.5), but they have not been designed to yield information on systems’ inherent dynamic properties (Kuusela et al. 2002). Nonlinear time series analysis techniques can be more useful when characterizing the dynamic behavior of physiological systems (Rezek & Roberts 1998). There are many studies in which the complexity of a physiological signal was found as an important characterization of an underlying physiological process and was even proposed as a diagnostic tool (Abasolo et al. 2006; Costa et al. 2003; Costa et al. 2005; Pincus et al. 1993; Radhakrishnan & Gangadhar 1998; Radhakrishnan et al. 2000; Rezek & Roberts 1998; Richman & Moorman 2000; Xu et al. 2007; Zhang et al. 2001). In this work, both time- and frequency- domain methods, as well as nonlinear methods (measures of complexity) were used. All the analyses were made in MATLAB software (version R2010a; Inc, 2010 U.S.).
3.1 Time- and frequency- domain methods
The power spectral density (PSD), was calculated using the Welch method. Hamming window was used, which was the same length as the segment of uterine EMG signal. We evaluate median frequency of PSD and modus frequency of PSD. Additionally root mean square (RMS) was calculated.
3.2 Measures of complexity
The techniques of time series analysis measuring the complexity can be grouped: 1) information theory estimates of complexity like entropy; 2) chaos – based estimates of complexity like Lyapunov exponent; 3) Komologrov estimates like Lempel-Ziv complexity (Šliupaitė et al. 2009). In our work we concentrate on information theory estimates of complexity. In particular we focus on entropy methods especially on Sample entropy and Approximate entropy. However we also tested Lampel-Ziv complexity.
3.2.1 Approximate entropy
Approximate entropy (ApEn) was introduced as a quantification of complexity in sequences and time series data, initially motivated by applications to relatively short, noisy data sets (Rezek & Roberts, 1998; Pincus, 1991; Hornero et al., 2005). ApEn detects changes in underlying episodic behavior not reflected in a peak occurrences or amplitudes. Moreover it
www.intechopen.com
Applications of EMG in Clinical and Sports Medicine
252
can be applied to finite stochastic, noisy deterministic and composite processes. Regular signals are expected to have low ApEn values (Rezek & Roberts 1998), while complex ones take on higher ApEn values. The exact algorithm is described elsewhere (Pincus, 1991).
3.2.2 Sample entropy
Richman et.al (Richman & Moorman 2000) showed that ApEn values are inconsistent due to two important expected properties. First ApEn depends on record length and is uniformly lower than expected for short records. Secondly, it lacks relative consistency. Meaning, if the value of ApEn of one data set is higher than another data set, it should remain higher for all conditions although it does not. Therefore a related complexity measure was developed as improved ApEn where self-matches are not included in calculating the probability (Richman & Moorman 2000). The exact algorithm of Sample entropy (SampEn) is described elsewhere (Richman & Moorman, 2000).
3.2.3 Lampel-Ziv complexity
Lampel-Ziv complexity (LZ) C(n) measures the generation rate of new patterns along a digital sequence (Zhang et al. 2001; Lempel & Ziv 1976). The signal has to be transformed into a sequence whose elements are only a few symbols. In the context of biomedical signal analysis, typically the discrete-time signal segment {x(t)},{ t={1,…, N} is converted into a binary sequence P=s1, s2, s3, …, sn, where si is 0 if x(i)<Td otherwise it takes value 1. Usually the median is used as a threshold Td (Radhakrishnan & Gangadhar 1998). The sequence P is scanned from left to right and the complexity counter c(n) is increased by one every time a new subsequence of consecutive characters is encountered in the scanning process. After normalization, the complexity measure reflects the rate of new pattern occurrences with time. The exact algorithm is described elsewhere (Radhakrishnan & Gangadhar, 1998).
3.2.4 Uterine activity integral
Uterine activity integral (UAI) is defined as the integral of the intrauterine pressure above the baseline over the contraction duration (Bakker et al. 2007) and it represents uterine contractions intensity. The UAI are calculated from the IUP record for each successive uterine contraction. The IUP record has a specific shape; the values of IUP increase from the basal value at the beginning of uterine contraction and decrease back to the basal value at the end of uterine contraction. Usually the IUP record is first detrended to avoid possible linear trends in the signal. The UAI is then calculated as the area under the IUP curve during contraction while the basal tone is excluded from calculation.
3.3 Statistical analysis
Statistical analyses were performed by using SYSTAT software (version 11; Inc, 2004; Chicago). Descriptive data are presented as medians unless otherwise indicated. Nonparametric Friedman Two-Way Analysis was used to compare the measures between normal labors and labors with a diagnosis of dystocia, as well as to compare the measures between latent and active phase of the labors. The p value < 0.05 was accepted as significant. The values being calculated with SampEn and ApEn showed a specific trend of each labor group. Therefore we fitted polynomials to SampEn and ApEn values calculated in the first stage of labor. The fit of the polynomials was conditioned with statistic measure how successful the fit was with R–square. We required R–square 0.50 ± 0.10 or better at the
www.intechopen.com
An Uterine Electromyographic Activity as a Measure of Labor Progression
253
lowest polynomial degree. First the polynomials were circumscribed to the values of SampEn and ApEn, which were calculated on successive non-overlapping segments of the EMG signal, since the values of SampEn and ApEn in this case were less spread out at the visual inspection. The polynomial degree was fixed. With fixed polynomial degree the polynomials were circumscribed also to the values of SampEn and ApEn, which were calculated on the burst segments of the EMG activity that correspond to successive uterine contractions. R–square of the fit of polynomial was calculated.
4. Before and during the labor evaluations using uterine EMG signal
The records of uterine EMG signals from “contraction” database were measured during the last two months of gestation. The uterine EMG signals were recorded only during uterine contractions; therefore the analyses were done on the burst segments of EMG activity. The recording of uterine EMG signals in “labor” database began at the patient’s arrival to the delivery room. Therefore the EMG records have different lengths and are recorded in different phases of the labor although all EMG signals were recorded during the first stage of labor without discontinuance. As such they are not easy to compare even in the same labor group. To get an impression how the labors of normally progressing labor and labor with a diagnosed dystocia look like, we outlined a labor per group, to characterize each labor group.
4.1 End of gestation and the latent phase of the labor
We compared the bursts segments of EMG activity record in the last two months of gestation and the latent phase of the normally progressing labor. For the comparison we used the “contraction” database and 73 burst segments of the uterine EMG activity extracted from the latent phase of normally progressing labors in “labor” database.
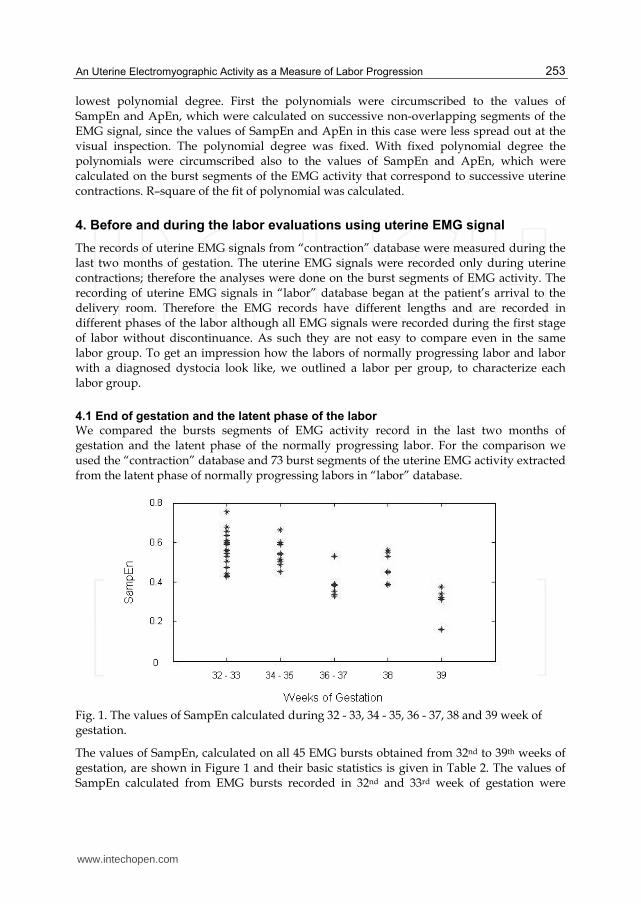
Fig. 1. The values of SampEn calculated during 32 - 33, 34 - 35, 36 - 37, 38 and 39 week of gestation.
The values of SampEn, calculated on all 45 EMG bursts obtained from 32nd to 39th weeks of gestation, are shown in Figure 1 and their basic statistics is given in Table 2. The values of SampEn calculated from EMG bursts recorded in 32nd and 33rd week of gestation were
www.intechopen.com
Applications of EMG in Clinical and Sports Medicine
254
gathered in one group. They ranged from 0.43 to 0.76 (median value is 0.56). The values of SampEn calculated from EMG bursts recorded in 34th and 35th week of gestation were very similar (min 0.45, max 0.66, median 0.54) and showed no statistically significant difference from those measured in weeks 32 and 33. The values of SampEn calculated from EMG bursts recorded in 36th and 37th week of gestation ranged from 0.33 to 0.53; the median value (0.38) was significantly lower than in previous two cases. SampEn values obtained from EMG bursts in 38th week of gestation ranged from 0.39 to 0.56 with median value 0.45. The values of SampEn calculated from EMG bursts recorded in 39th week of gestation ranged from 0.16 to 0.38. The median value was 0.32. It was significantly lower than median SampEn value calculated in any other period of gestation. In the latent phase of the labor the values of SampEn increase. The values of SampEn calculated from EMG bursts record in the latent phase ranged from 0.07 to 1.03 with median value 0.71. This value is much higher then the median values obtained in any period of gestation.
Week of gestation 32-33 34-35 36-37 38 39 Latent phase
Minimal value 0.43 0.45 0.33 0.39 0.16 0.07
Maximal value 0.76 0.66 0.53 0.56 0.38 1.03
Median value 0.56 0.54 0.38 0.45 0.32 0.71
Table 2. Characteristic values of SampEn during weeks of gestation and latent phase of the labor.
The SampEn has already been presented as a promising method for analyzing the term and preterm labor. Fele-Žorž et al. (Fele-Žorž et al., 2008) used 20 min long EMG records measured before 26th week of gestation and they have shown that the values of SampEn for term labor records are higher than those for preterm labor. Moreover, due to our results the SampEn values calculated on EMG bursts significantly drop in 36th - 37th week of gestation and are even lower approaching the term; while the beginning of the labor is characterized by relatively high SampEn values.
4.2 Normally progressing labor
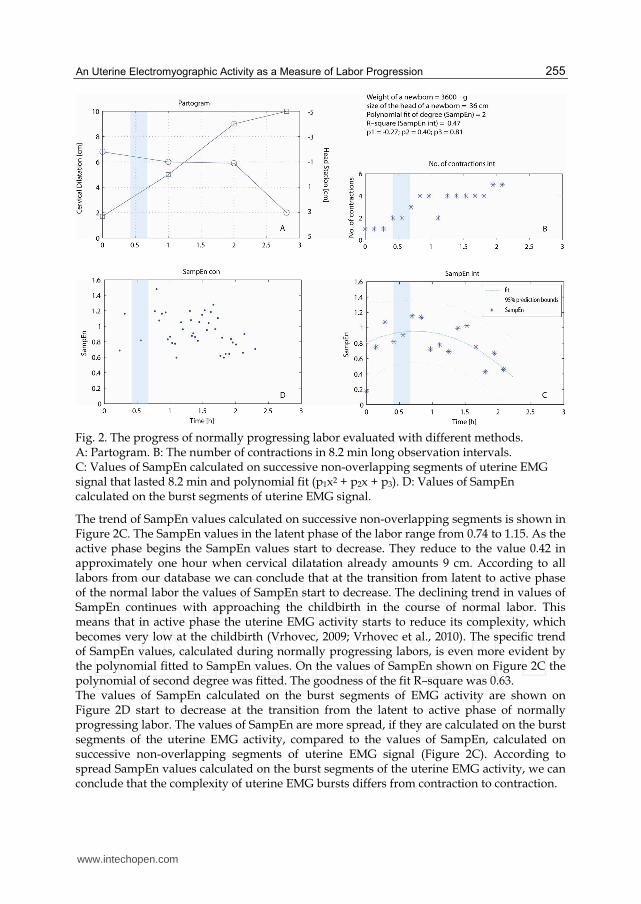
A typical progress of normal labor with a short latent phase is presented in Figures 2. The trace of the normally progressing labor is outlined as the partogram in the Figure 2A. The time in hours is on the abscissa; on the ordinate there are cervical dilatation (squares) and head station range (circles). The observation of the labor started at 1.8 cm cervical dilatation. The latent phase of the labor lasted for 40 minutes. In the active phase of the normal labor dilatation of cervix was progressing in the course of time and the head of the fetus was evenly drooping with no delays. The grey zone in Figures 2 marks the border between the latent and the active phase. It is marked according to partogram from 3 to 4 cm cervical dilatation. In Figure 2B the number of contractions in 8.2 min long observation intervals (which correspond to successive non-overlapping segments of the EMG signal) in the course of time is shown. In the latent phase of the normally progressing labor only one contraction was present in 8.2 min long observation intervals. With labor progression the number of contractions in 8.2 min long intervals increased to 3 contractions at the end of the latent phase. The number of contractions was stationary around 4 contractions in 8.2 min long intervals during the active phase.
www.intechopen.com
An Uterine Electromyographic Activity as a Measure of Labor Progression
255
Fig. 2. The progress of normally progressing labor evaluated with different methods. A: Partogram. B: The number of contractions in 8.2 min long observation intervals. C: Values of SampEn calculated on successive non-overlapping segments of uterine EMG signal that lasted 8.2 min and polynomial fit (p1x2 + p2x + p3). D: Values of SampEn calculated on the burst segments of uterine EMG signal.
The trend of SampEn values calculated on successive non-overlapping segments is shown in Figure 2C. The SampEn values in the latent phase of the labor range from 0.74 to 1.15. As the active phase begins the SampEn values start to decrease. They reduce to the value 0.42 in approximately one hour when cervical dilatation already amounts 9 cm. According to all labors from our database we can conclude that at the transition from latent to active phase of the normal labor the values of SampEn start to decrease. The declining trend in values of SampEn continues with approaching the childbirth in the course of normal labor. This means that in active phase the uterine EMG activity starts to reduce its complexity, which becomes very low at the childbirth (Vrhovec, 2009; Vrhovec et al., 2010). The specific trend of SampEn values, calculated during normally progressing labors, is even more evident by the polynomial fitted to SampEn values. On the values of SampEn shown on Figure 2C the polynomial of second degree was fitted. The goodness of the fit R–square was 0.63. The values of SampEn calculated on the burst segments of EMG activity are shown on Figure 2D start to decrease at the transition from the latent to active phase of normally progressing labor. The values of SampEn are more spread, if they are calculated on the burst segments of the uterine EMG activity, compared to the values of SampEn, calculated on successive non-overlapping segments of uterine EMG signal (Figure 2C). According to spread SampEn values calculated on the burst segments of the uterine EMG activity, we can conclude that the complexity of uterine EMG bursts differs from contraction to contraction.
www.intechopen.com
Applications of EMG in Clinical and Sports Medicine
256
The ApEn values give similar results to the SampEn values, while no specific trends were found in values of median frequency, modus frequency, RMS or LZ in the course of normally progressing labor whatever type of uterine EMG signal segmentation had been used.
4.3 Examination of the labor with a diagnosed dystocia
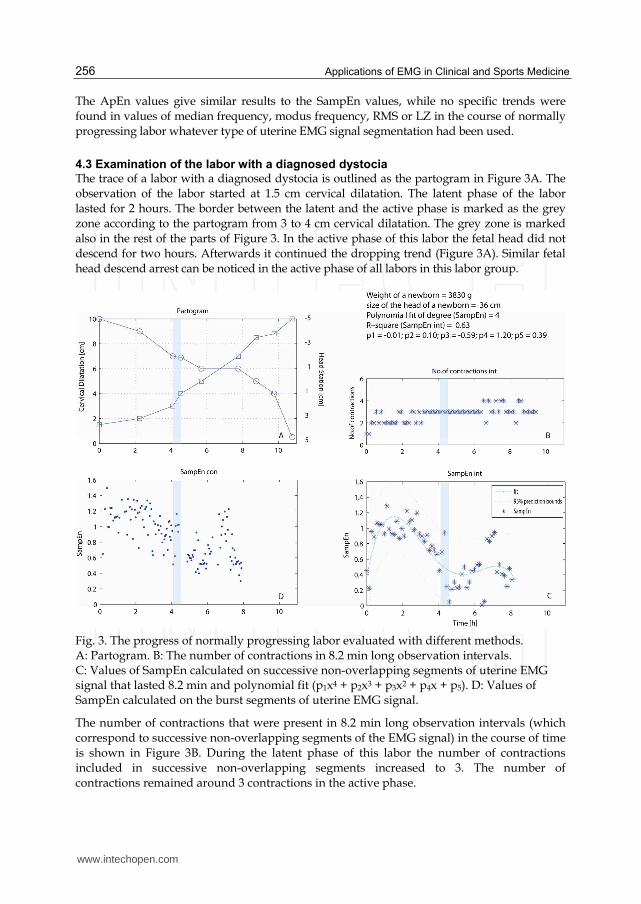
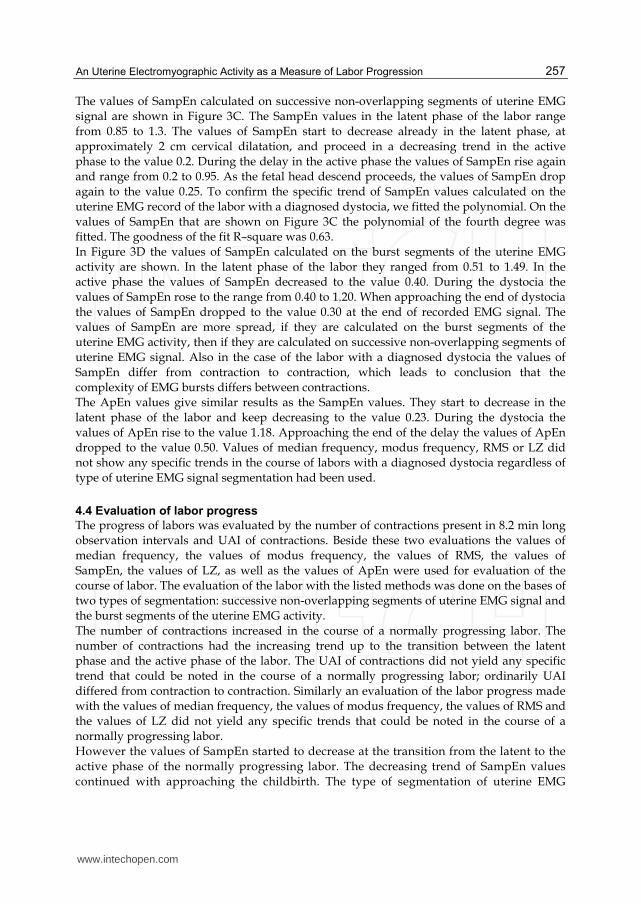
The trace of a labor with a diagnosed dystocia is outlined as the partogram in Figure 3A. The observation of the labor started at 1.5 cm cervical dilatation. The latent phase of the labor lasted for 2 hours. The border between the latent and the active phase is marked as the grey zone according to the partogram from 3 to 4 cm cervical dilatation. The grey zone is marked also in the rest of the parts of Figure 3. In the active phase of this labor the fetal head did not descend for two hours. Afterwards it continued the dropping trend (Figure 3A). Similar fetal head descend arrest can be noticed in the active phase of all labors in this labor group.
Fig. 3. The progress of normally progressing labor evaluated with different methods. A: Partogram. B: The number of contractions in 8.2 min long observation intervals. C: Values of SampEn calculated on successive non-overlapping segments of uterine EMG signal that lasted 8.2 min and polynomial fit (p1x4 + p2x3 + p3x2 + p4x + p5). D: Values of SampEn calculated on the burst segments of uterine EMG signal.
The number of contractions that were present in 8.2 min long observation intervals (which correspond to successive non-overlapping segments of the EMG signal) in the course of time is shown in Figure 3B. During the latent phase of this labor the number of contractions included in successive non-overlapping segments increased to 3. The number of contractions remained around 3 contractions in the active phase.
www.intechopen.com
An Uterine Electromyographic Activity as a Measure of Labor Progression
257
The values of SampEn calculated on successive non-overlapping segments of uterine EMG signal are shown in Figure 3C. The SampEn values in the latent phase of the labor range from 0.85 to 1.3. The values of SampEn start to decrease already in the latent phase, at approximately 2 cm cervical dilatation, and proceed in a decreasing trend in the active phase to the value 0.2. During the delay in the active phase the values of SampEn rise again and range from 0.2 to 0.95. As the fetal head descend proceeds, the values of SampEn drop again to the value 0.25. To confirm the specific trend of SampEn values calculated on the uterine EMG record of the labor with a diagnosed dystocia, we fitted the polynomial. On the values of SampEn that are shown on Figure 3C the polynomial of the fourth degree was fitted. The goodness of the fit R–square was 0.63. In Figure 3D the values of SampEn calculated on the burst segments of the uterine EMG activity are shown. In the latent phase of the labor they ranged from 0.51 to 1.49. In the active phase the values of SampEn decreased to the value 0.40. During the dystocia the values of SampEn rose to the range from 0.40 to 1.20. When approaching the end of dystocia the values of SampEn dropped to the value 0.30 at the end of recorded EMG signal. The values of SampEn are more spread, if they are calculated on the burst segments of the uterine EMG activity, then if they are calculated on successive non-overlapping segments of uterine EMG signal. Also in the case of the labor with a diagnosed dystocia the values of SampEn differ from contraction to contraction, which leads to conclusion that the complexity of EMG bursts differs between contractions. The ApEn values give similar results as the SampEn values. They start to decrease in the latent phase of the labor and keep decreasing to the value 0.23. During the dystocia the values of ApEn rise to the value 1.18. Approaching the end of the delay the values of ApEn dropped to the value 0.50. Values of median frequency, modus frequency, RMS or LZ did not show any specific trends in the course of labors with a diagnosed dystocia regardless of type of uterine EMG signal segmentation had been used.
4.4 Evaluation of labor progress
The progress of labors was evaluated by the number of contractions present in 8.2 min long observation intervals and UAI of contractions. Beside these two evaluations the values of median frequency, the values of modus frequency, the values of RMS, the values of SampEn, the values of LZ, as well as the values of ApEn were used for evaluation of the course of labor. The evaluation of the labor with the listed methods was done on the bases of two types of segmentation: successive non-overlapping segments of uterine EMG signal and the burst segments of the uterine EMG activity. The number of contractions increased in the course of a normally progressing labor. The number of contractions had the increasing trend up to the transition between the latent phase and the active phase of the labor. The UAI of contractions did not yield any specific trend that could be noted in the course of a normally progressing labor; ordinarily UAI differed from contraction to contraction. Similarly an evaluation of the labor progress made with the values of median frequency, the values of modus frequency, the values of RMS and the values of LZ did not yield any specific trends that could be noted in the course of a normally progressing labor. However the values of SampEn started to decrease at the transition from the latent to the active phase of the normally progressing labor. The decreasing trend of SampEn values continued with approaching the childbirth. The type of segmentation of uterine EMG
www.intechopen.com
Applications of EMG in Clinical and Sports Medicine
258
signal (successive non-overlapping segments of the EMG signal and the burst segments of the uterine EMG activity) did not affect the main behavior of SampEn values in the course of a normal labor. The SampEn values were more spread when they were calculated on the burst segments of the uterine EMG activity compared to the values of SampEn, calculated on successive non-overlapping segments of uterine EMG signal. According to the spread values of SampEn, calculated on the burst segments of the uterine EMG activity during the labor, we conclude that the complexity of EMG signal differs from contraction to contraction even in the same labor phase. A specific trend of values of SampEn calculated in the course of a normally progressing labor was confirmed with polynomial fit. When we fitted the polynomials, we required R–square 0.50 ± 0.10 or better at the lowest polynomial degree. First we fitted the polynomials on the SampEn values, calculated on successive non-overlapping segments of the EMG signal, since the values were, according to visual inspection less spread out. The polynomial fit was of the first degree in the case when recorded latent phase was short. In normally progressing labors with a longer latent phase, the values were fitted with polynomial of the second degree (Table 3). The mean value of R–square was 0.52 (min: 0.47; max 0.67). If the polynomials were fitted on the values of SampEn calculated on the burst segments of the uterine EMG activity, the mean value of R–square was 0.07 (min 0.01; max 0.21). These results confirm that the values of SampEn are much more spread out when calculated on the burst segments of the uterine EMG activity. When the normally progressing labors were evaluated with ApEn, the results were similar to those evaluated with SampEn. At the transition from the latent to the active phase of labor the values of ApEn started to decrease. The decreasing trend of ApEn values continued with approaching the childbirth in the course of a normal labor. The values of ApEn were more spread when they were calculated on the burst segments of the uterine EMG activity compared to the values of ApEn, calculated on successive non-overlapping segments of uterine EMG signal. The specific trend of values of ApEn, calculated in the course of normally progressing labor, was confirmed with polynomial fit. The polynomial fit was of the first or second degree, depending on the length of the recorded latent phase (Table 3). In the course of labor with a diagnosed dystocia, the number of contractions increased up to the transition between the latent and the active phase of the labor, while in active phase of the labor it remained constant. The UAI of contractions did not yield any specific trend in the course of labor with a diagnosed dystocia as well as the values of median frequency, the values of modus frequency, the values of RMS and values of LZ. The values of SampEn started to decrease with approaching the end of the latent phase or at the transition from the latent to the active phase of the labor. The decreasing trend of SampEn values continued in the active phase until, according to the partogram, the dystocia occurred. During the dystocia of the labor the values of SampEn rose. When approaching the end of the dystocia the values of SampEn dropped. The values of SampEn were, when visually inspected, more spread when for calculation the burst segments of the uterine EMG were used, although the trends were similar to the trends of SampEn values calculated on successive non-overlaping segments of the uterine EMG signal. The specific trend of SampEn values calculated in the course of labor with a diagnosed dystocia was confirmed with polynomial fit of degree. The polynomial fit was of the third degree in the case, when the record of the labor with a diagnosed dystocia had short latent phase. The labors with a
www.intechopen.com
An Uterine Electromyographic Activity as a Measure of Labor Progression
259
diagnosed dystocia and longer recorded latent phase were fitted with polynomials of the fourth degree. The mean value of R–square was 0.51 (min 0.45; max 0.63). The successfulness of the fit on the values of SampEn calculated on the burst segments of the uterine EMG activity, using the same degree of polynomials as in previous uterine EMG Normally progressing labors Labors with a diagnosed dystocia
Active phase
Polynomial fit of degree (SampEn) 1 or 2 4
R–square (SampEn) 0.52 (0.47 0.67) 0.51 (0.45 0.63)
Polynomial fit of degree (ApEn) 1 or 2 4
R–square (ApEn) 0.52 (0.41 0.61) 0.43 (0.38 0.57)
Values of SampEn 0.21 (0.02 1.03)* 0.71 (0.07 1.79)*
0.42 (0.01 1.40)* 0.69 (0.15 1.58)*
Values of ApEn 0.49 (0.09 1.26)* 0.77 (0.17 1.24)*
0.67 (0.12 1.46)* 0.76 (0.20 1.44)*
Median frequency value 0.36 Hz (0.18 Hz 0.75 Hz) 0.44Hz(0.18 Hz 2.06 Hz)*
0.39 Hz (0.21 Hz 1.96 Hz) 0.36 Hz(0.18 Hz 1.92 Hz)*
Modus frequency value 0.25 Hz (0.07 Hz 0.68 Hz)* 0.36 Hz(0.14 Hz 2.38 Hz)*
0.28 Hz (0.18 Hz 1.92 Hz)* 0.28 Hz (0.04 Hz 2.42 Hz)*
RMS value 80.48µV (10.84 µV 470.09µV) 70.20 µV (2.91µV 836.03µV)*
65.20 µV (7.40 µV 413.15 µV) 65.36µV (7.140 µV 386.65 µV)*
LZ value 0.6338 (0.3937 0.8360) 0.6720 (0.2699 1.4426)
0.6621 (0.4854 0.8684) 0.6927 (0.3616 1.5127)
Late latent phase
Values of SampEn 0.45 (0.04 1.16)* 0.58 (0.09 1.44)*
0.68 (0.05 1.29)* 0.87 (0.32 1.49)*
Values of ApEn 0.70 (0.17 1.31)* 0.70 (0.23 1.24)*
0.93 (0.17 1.41)* 0.89 (0.44 1.37)*
Median frequency value 0.39 Hz (0.25 Hz 1.24 Hz) 0.39 Hz (0.21 Hz 0.99Hz)
0.39 Hz (0.21 Hz 1.31 Hz) 0.39 Hz (0.21 Hz 1.63 Hz)
Modus frequency value 0.32 Hz (0.18 Hz 1.35 Hz) 0.32 Hz (0.04 Hz 1.31 Hz)*
0.28 Hz (0.04 Hz 1.42 Hz) 0.28 Hz (0.18 Hz 1.70 Hz)*
RMS value 54.54 µV (5.50 µV 342.32 µV) 54.35 µV (9.15 µV 318.37 µV)*
40.60 µV (9.17 µV 227.51 µV) 38.94 µV (8.52 µV 180.06 µV)*
LZ value 0.6149(0.4450 0.7281)* 0.6659 (0.3891 1.1583)*
0.6796 (0.4935 0.8765)* 0.7261 (0.3821 1.3288)*
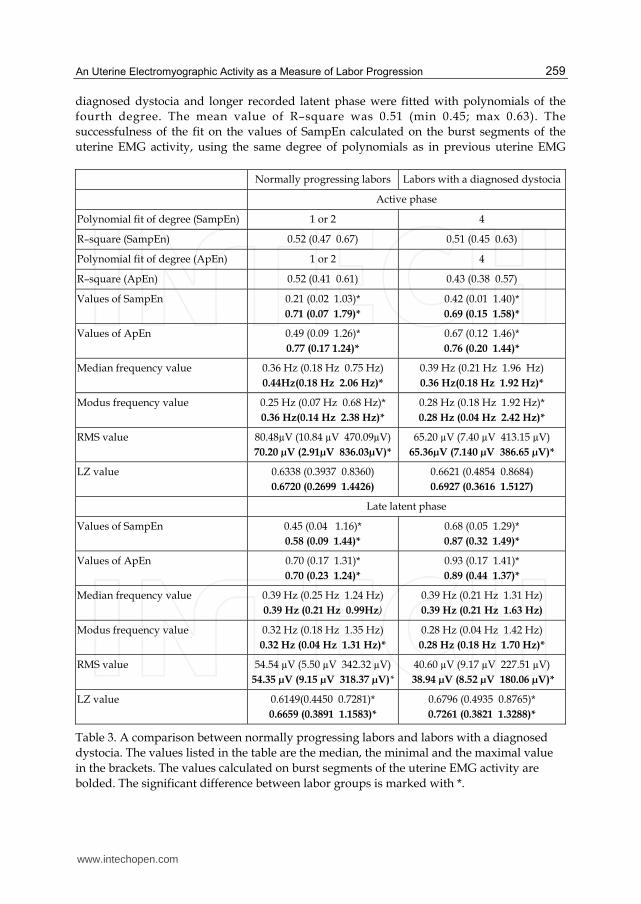
Table 3. A comparison between normally progressing labors and labors with a diagnosed dystocia. The values listed in the table are the median, the minimal and the maximal value in the brackets. The values calculated on burst segments of the uterine EMG activity are bolded. The significant difference between labor groups is marked with *.
www.intechopen.com
Applications of EMG in Clinical and Sports Medicine
260
signal segmentation, was 0.29 (min 0.19; max 0.51). From the results of polynomial fit we can conclude that in the case of labors with a diagnosed dystocia the degree of polynomial fit was usually two degrees higher than in the case of normally progressing labors. When the labors with a diagnosed dystocia were evaluated with ApEn, the results were similar to those evaluated with SampEn. The values of ApEn started to decrease with approaching the end of the latent phase or at the transition from the latent to the active phase of the labor. The decreasing trend of ApEn values continued in the active phase until, according to the partogram, the dystocia occurred. During the dystocia of the labor the values of ApEn rose. When approaching the end of the dystocia, the values of ApEn dropped. The values of ApEn were more spread when they were calculated on the burst segments of the uterine EMG activity. The specific trend of values of ApEn calculated in the course of the labor with a diagnosed dystocia was confirmed with polynomial fit. The polynomial fit was of the third or fourth degree (Table 3), depending on the length of the recorded latent phase. From the results we can assume that in the case of labors with a diagnosed dystocia the degree of polynomial fit is usually one or two degrees higher than in the case of normally progressing labors. Median, maximal and minimal values of all chosen measures for labor evaluation are presented in Table 3. The values of SampEn calculated on the uterine EMG records of normally progressing labors are significantly lower than the ones calculated on the uterine EMG records of labors with a diagnosed dystocia, regardless of the used segmentation (successive non-overlapping segments of the EMG signal or burst segments of the uterine EMG activity) or the labor phase (latent or active). Significantly higher SampEn values calculated in the latent phase of the labor with a diagnosed dystocia, compared to the ones calculated on normally progressing labor records, imply SampEn potential as a diagnostic tool. Namely, high values of SampEn in the latent phase of the labor suggest the dystocia occurrence. The same significant difference between the labor’s groups in the latent phase could be observed when ApEn or LZ was used as a measure for labor evaluation (Table 3). In the latent phase of the labor with a diagnosed dystocia also significantly lower RMS values and the values of modus frequency were obtained, compared to the ones calculated on normally progressing labor records (Table 3). The differences were significant only, if the values were calculated on the burst segments of the uterine EMG activity. According to Table 3 there is no difference between the labor groups in the values of median frequency calculated in the latent phase, regardless of used segmentation. The values of median frequency showed a significant difference between a normally progressing labor and the labor with a diagnosed dystocia only in the active phase, when they were calculated on burst segments of the uterine EMG activity.
5. Discussion and conclusions
It is well known that in active phase of normal labor uterine muscles contractions, that are strong and long enough, should be present. Although lot of effort has been put in quantitative evaluation of uterine contractions to measure their efficiency (Gibb et al., 1984; Miller et al., 1976), studies have shown that various contraction-based measures (Montevideo units, uterine activity units) do not differ between labor outcomes (Euliano et al., 2009).
www.intechopen.com
An Uterine Electromyographic Activity as a Measure of Labor Progression
261
On the other hand obstetricians agree that a contractile pattern of the uterine muscles, that provide sufficient descending pressure gradient force, is obvious in active phase of normal labor. Therefore recognition of ineffective uterine muscles contractile patterns may be helpful in diagnosis of dystocia. Measurement of the uterine EMG activity provides information about myocyte electrical activity directly and investigations have indicated that it is a sensitive method having a potential in a clinical practice as a supplement tool used to monitor labor. Through the years researchers have studied different characteristics of the uterine EMG activity. Mostly they were based on time- and frequency- domain methods. Generally, time- and frequency- domain methods are useful and have been widely adopted in studies of the physiological signals (Rezek & Roberts, 1998), but they have not been designed to yield information on systems’ inherent dynamic properties. For this purpose nonlinear time series analysis techniques can be more suitable (Richman & Moorman, 2000). Indeed, there are many studies in which the complexity of a physiological signal was found as an important characterization of an underlying physiological process and was even proposed as a diagnostic tool (Abasolo et al., 2006; Rezek & Roberts, 1998; Zhang et al., 2001). The uterine EMG is a non-stationary signal (Terrien et al., 2008); therefore we evaluated the uterine EMG signals recorded in the last two months of gestation, during normally progressing labors and during labors with a diagnosed dystocia by measures of complexity (ApEn, SampEn and LZ) as well as by time- and frequency- domain methods (median frequency, modus frequency and RMS). The SampEn has already been presented as a promising method for distinguishing the term and preterm labor according to 20 min long EMG signals measured before 26th week of gestation (Fele-Žorž et al., 2008). They have shown that the values of SampEn for term labor records are higher than those for preterm labor. Moreover, due to our results the SampEn values calculated on EMG bursts significantly drop in 36th - 37th week of gestation and are even lower approaching the term; while the beginning of the labor is characterized by relatively high SampEn values. Observations of normally progressing labors showed that the values of SampEn calculated on successive non-overlapping segments of the EMG signal or burst segments of the uterine EMG activity start to decrease at the transition from the latent to the active phase. The decreased trend of SampEn values continued with approaching the childbirth. Therefore we could conclude that the uterine EMG activity is regulated in the course of normally progressing labor (Vrhovec, 2009; Vrhovec et al., 2010). Observations of the labors with a diagnosed dystocia showed specific trend in SampEn values. The trend of SampEn values is similar to the trend observed in the case of normally progressing labors, until in the case of labors with a diagnosed dystocia, according to the partogram, the dystocia occurs. During the dystocia the values of SampEn rise. With approaching the end of the dystocia the values of SampEn drop again. The values of SampEn were more spread when they were calculated on the burst segments of the uterine EMG activity compared to the values of SampEn calculated on successive non-overlapping segments of uterine EMG signal. According to the spread values of SampEn calculated on the burst segments we conclude that the complexity of EMG signals differs between contractions. Whatever type of segmentation was used to evaluate the labor (successive non-overlapping segments of the EMG signal and the burst segments of the uterine EMG activity), the trends were similar, typical for the type of labor. A specific trend of SampEn values calculated in the course of both labor groups was confirmed with
www.intechopen.com
Applications of EMG in Clinical and Sports Medicine
262
polynomial fit. The polynomial fit is of the first degree in the case when normally progressing labors have a limit recorded latent phase. Normally progressing labors with a longer latent phase are fit with polynomial of the second degree. The polynomial fit is usually of the fourth degree when the labor has a diagnosed dystocia. As it could be observed in Tables 3 the same conclusions and the results can be outlined when the values were calculated with ApEn or when they were calculated with SampEn. The correlation between EMG parameters and course of gestation shows that with duration of pregnancy the frequency of recorded electrical activity becomes lower, which is expressed as lower median frequency of uterine electrical activity (Verdenik et al., 2001). However, another study show that when the gestation is coming to an end, the higher value of median frequency occurs, which may be associated with term delivery (Fele-Žorž et al., 2008). According to our results the values of median frequency do not yield any specific trend in the course of labors. But statistical evaluation of all values of median frequency calculated on EMG segments that were recorded during both labor groups showed some differences. However, the values of the median frequency are significantly lower in labors with a diagnosed dystocia calculated on the burst segments in the active phase compared to the latent phase of the labor. The values of median frequency show a significant difference between both labor groups in the active phase, when they are calculated on burst segments of the uterine EMG activity. Shifting of the uterine EMG signal energy to higher frequencies as delivery approaches is the phenomenon observed in the literature (Buhimschi et al., 1997; Doret et al., 2005; Garfield et al., 2002; Maner & Garfield, 2007; Vinken et al., 2010; Maner et al., 2003). In particular, the modus frequency of the uterine EMG signal power spectral density (PSD) is commonly tested. Term and preterm labors can be successfully monitored and evaluated for preparedness for labor. The modus frequency of PSD increased as the measurement-to-delivery interval decreased from more than 4 days before the labor to less than 24 hours (Maner et al., 2003). According to our results the values of modus frequency do not yield any specific trend in the course of labor. Anyway, the statistical evaluation of all values of modus frequency calculated on EMG segments that were recorded in both labor groups show some characteristics. The values of the modus frequency calculated on the burst segments are significantly higher in the active phase in the case of normally progressing labors compare to the labors with a diagnosed dystocia. However values of the modus frequency calculated on the successive non-overlapping segments are lower in the active phase in the case of normally progressing labors compare to the labors with a diagnosed dystocia. It was shown that RMS value changes only a few days before the true labor begins (Verdenik et al., 2001). According to our results the values of RMS do not yield any specific trend in the course of both labor groups. Results of statistical evaluation show that the significantly higher RMS values are in the active phase compared to the latent phase of both observed labor groups, when for calculation burst segments of the uterine EMG activity are used. However, the significant difference is shown only in the case when the values of RMS are calculated on successive non-overlapping segments of the EMG signal and a normally progressing labor is observed. Although the RMS values have some diagnostic potential, all useful analyses can be done afterwards. The values of LZ do not yield any specific trend in the course of normally progressing labors or labors with a diagnosed dystocia. Although the values of LZ have some diagnostic
www.intechopen.com
An Uterine Electromyographic Activity as a Measure of Labor Progression
263
potential, all useful information can be calculated afterwards. The results of LZ between the labor groups are significantly different in the latent phase of labor regardless of the used segmentation. The median value of the LZ values is higher in the case of labors with a diagnosed dystocia regardless of the used segmentation (successive non-overlapping segments of the EMG or the burst segments of the uterine EMG activity). The values of LZ are also significantly different between the latent phase and the active phase calculated on burst segments of labors with a diagnosed dystocia. The median value of the LZ values is higher in the case of normally progressing labors calculated on the on burst segments of labors in the latent phase. According to calculated values of LZ, non of used segmentations shows any promising results. The majority of the studies are done on bursts segments of uterine EMG. However there is one study that showed that during the labor the activity between bursts is also related to the course of labor (Pajntar et al., 1998; Verdenik et al., 2001). They proposed that the analysis of uterine EMG signals during bursts only is not as efficient as it would be if the activity between contractions is included (Pajntar et al., 1998; Verdenik et al., 2001). We use two segmentations of uterine EMG signal: segmentation on successive non-overlapping segments of the EMG signal and segmentation on the burst segments of the uterine EMG activity. From the results we can assume that segmentation on successive non-overlapping segments of the EMG signal is better in the case when the SampEn values or the ApEn values are used for characterization. However, the segmentation on the burst segments of the uterine EMG activity is a better choice in the case of values of modus frequency, values of median frequency and values of RMS. Previous studies showed that uterine activity can be successfully monitored during pregnancy and labor using uterine EMG. Uterine EMG signals give direct assessment of uterine contractility and as such have great potential as a diagnostic or labor monitoring tool. Due to specific characteristic of uterine EMG signal during pregnancy and labor, the methods for uterine EMG signal evaluation should be carefully picked out. In this chapter we summarized the methods based on uterine EMG signals for the determination of the labor progress. The main focus was the evaluation of normally progressing labor as well as labor with a diagnosis of dystocia using continuously monitored uterine EMG signals. According to our results time series complexity measures, especially SampEn and ApEn, calculated on successive non-overlapping segments of the uterine EMG signal, are most promising for uterine EMG signals interpretation during labour.
6. References
Abasolo, D. et al. (2006). Entropy analysis of the EEG background activity in Alzheimer's disease patients. Physiological Measurement, Vol.27, No. 3, pp. 241-253, ISSN 0967-3334.
Albers, L.L.; Schiff, M. & Gorwoda, J.G. (1996). The length of active labor in normal pregnancies. Obstetrics and Gynecology, Vol.87, No.3, pp. 355-359, ISSN 1526-9523.
Bakker, P.C. et al. (2007). Uterine activity monitoring during labor. Journal of Perinatal
Medicine, Vol.35, No.6, pp. 468-477, ISSN 0300-5577.
www.intechopen.com
Applications of EMG in Clinical and Sports Medicine
264
Basu, J.K.; Buchmann, E.J. & Basu, D. (2009). Role of a second stage partogram in predicting the outcome of normal labour. The Australian & New Zealand Journal of Obstetrics &
Gynaecology, Vol.49, No.2, pp.158-161, ISSN 1479-828X. Bishop, E.H. (1964). Pelvic Scoring for Elective Induction. Obstetrics and Gynecology, Vol.24,
pp.266-268, ISSN 0029-7844. Buhimschi, C.; Boyle, M. & Garfield, R. (1997). Electrical activity of the human uterus during
pregnancy as recorded from the abdominal surface. Obstetrics and Gynecology, Vol.90, No.1, pp.102-111, ISSN 0029-7844.
Chard, T. & Grudzinskas, J. (1994). The uterus, Cambridge: Cambridge University Press, ISBN 9780521424530.
Devedeux, D. et al. (1993). Uterine Electromyography - a Critical-Review. American Journal of
Obstetrics and Gynecology, Vol.169, No.6, pp.1636-1653, ISSN 0002-9378. Diab, M.O.; Marque, C. & Khalil, M. (2009). An unsupervised classification method of
uterine electromyography signals: classification for detection of preterm deliveries. The Journal of Obstetrics and Gynaecology Research, Vol.35, No.1, pp.9-19, ISSN 1341-8076.
Doret, M. et al. (2005). Uterine electromyography characteristics for early diagnosis of mifepristone-induced preterm labor. Obstetrics and Gynecology, Vol.105, No.4, pp.822-830, ISSN 0029-7844.
Euliano, T. et al. (2006). Prediction of intrauterine pressure waveform from transabdominal electrohysterography. The Journal of Maternal-Fetal & Neonatal Medicine: The Official
Journal of the European Association of Perinatal Medicine, the Federation of Asia and
Oceania Perinatal Societies, the International Society of Perinatal Obstetricians, Vol.19, No.12, pp.811-816, ISSN 1476-7058.
Euliano, T.Y. et al. (2009). Spatiotemporal electrohysterography patterns in normal and arrested labor. American Journal of Obstetrics and Gynecology, Vol.200, No.1, pp.54.e1-54.e7, ISSN 0002-9378.
FDA. (n.d.). Obstetrical and gynecological devices. U.S. Food and Drug Administration (FDA), 17.12. 2010, Available from: http://www.accessdata.fda.gov/scripts/cdrh/cfdocs/
cfcfr/CFRSearch.cfm?CFRPart=884 Fele-Žorž, G. et al. (2008). A comparison of various linear and non-linear signal processing
techniques to separate uterine EMG records of term and pre-term delivery groups. Medical & Biological Engineering & Computing, Vol.46, No.9, pp.911-922, ISSN 0140-0118.
Garfield, R. & Maner, W. (2007). Physiology and electrical activity of uterine contractions. Seminars in Cell & Developmental Biology, Vol.18, No.3, pp.289-295, ISSN 1084-9521.
Garfield, R. et al. (2002). Uterine electromyography and light-induced fluorescence in the management of term and preterm labor. Journal of the Society for Gynecologic
Investigation, Vol.9, No.5, pp.265-275, ISSN 1071-5576. Gibb, D.M. et al. (1984). Characteristics of uterine activity in nulliparous labour.
British Journal of Obstetrics and Gynaecology, Vol.91, No.3, pp.220-227, ISSN 0306- 5456.
www.intechopen.com
An Uterine Electromyographic Activity as a Measure of Labor Progression
265
Hassan, M. et al. (2010). Interactions between Uterine EMG at Different Sites Investigated Using Wavelet Analysis: Comparison of Pregnancy and Labor Contractions. Eurasip Journal on Advances in Signal Processing, Vol. 2010, pp. 1-10, ISSN 1687- 6172.
Hornero, R. et al. (2005). Interpretation of approximate entropy: Analysis of intracranial pressure approximate entropy during acute intracranial hypertension. IEEE
Transactions on Biomedical Engineering, Vol.52, No.10, pp.1671-1680, ISSN 0018- 9294.
Jezewski, J. et al. (2005). Quantitative analysis of contraction patterns in electrical activity signal of pregnant uterus as an alternative to mechanical approach. Physiological
Measurement, Vol.26, No.5, pp.753-767, ISSN 0967-3334. Joseph, K. et al. (2003). Changes in maternal characteristics and obstetric practice and recent
increases in primary cesarean delivery. Obstetrics and Gynecology, Vol.102, No.4, pp.791-800, ISSN 0029-7844.
Karlsson, B. et al. (2007). Abdominal EHG on a 4 by 4 grid: mapping and presenting the propagation of uterine contractions. In 11th Mediterranean Conference on Medical and
Biomedical Engineering and Computing 2007. pp. 139–143, Ljubljana, Slovenia, June 26-30, 2007.
Kilpatrick S.J. & Russell K.L. (1989). Characteristics of Normal Labor. Obstetrics and
Gynecology, Vol.74, No.1, pp.85-87. Kjaergaard, H. et al. (2009). Incidence and outcomes of dystocia in the active phase of labor
in term nulliparous women with spontaneous labor onset. Acta Obstetricia et
Gynecologica Scandinavica, Vol.88, No.4, pp.402-407, ISSN 0001-6349. Leman, H.; Marque, C. & Gondry, J. (1999). Use of the electrohysterogram signal for
characterization of contractions during pregnancy. IEEE Transactions on Biomedical
Engineering, Vol.46, No.10, pp.1222-1229, ISSN 0018-9294. Luria, O. et al. (2009). Effects of the individual uterine contraction on fetal head descent and
cervical dilatation during the active stage of labor. European Journal of Obstetrics,
Gynecology, and Reproductive Biology, Vol.144 Suppl 1, pp.S101-107, ISSN 1872-7654. Maner, W. & Garfield, R. (2007). Identification of Human Term and Preterm Labor using
Artificial Neural Networks on Uterine Electromyography Data. Annals of Biomedical
Engineering, Vol.35, pp.465-473, ISSN 0090-6964. Maner, W. et al. (2003). Predicting term and preterm delivery with transabdominal uterine
electromyography. Obstetrics and Gynecology, Vol.101, No.6, pp.1254-1260, ISSN 0029-7844.
Marconi, A. et al. (2008). Comparing two dinoprostone agents for cervical ripening and induction of labor: A randomized trial. European Journal of Obstetrics Gynecology and
Reproductive Biology, Vol.138, No.2, pp.135-140, ISSN 0301-2115. Maul, H. et al. (2003). The physiology of uterine contractions. Clinics in Perinatology, Vol.30,
No.4, pp.665-676, ISSN 0095-5108. Miller, F.C. et al. (1976). Quantitation of uterine activity in 100 primiparous patients.
American Journal of Obstetrics and Gynecology, Vol.124, No.4, pp.398-405, ISSN 0002-9378.
Neilson, J.P. et al. (2003). Obstructed labour. British Medical Bulletin, 67, pp.191-204.
www.intechopen.com
Applications of EMG in Clinical and Sports Medicine
266
Newman, R. et al. (2008). Preterm Prediction Study: Comparison of the Cervical Score and Bishop Score for Prediction of Spontaneous Preterm Delivery. Obstetrics and
gynecology, Vol.112, No.3, pp.508-515, ISSN 0029-7844. Oláh, K.S. (1994). Changes in cervical electromyographic activity and their correlation with
the cervical response to myometrial activity during labour. European Journal of
Obstetrics, Gynecology, and Reproductive Biology, Vol.57, No.3, pp.157-159, ISSN 0301-2115.
Pajntar, M. (1994). The Smooth Muscles of the Cervix in Labor. European Journal of Obstetrics
Gynecology and Reproductive Biology, Vol.55, No.1, pp.9-12, ISSN 0301-2115. Pajntar, M. et al. (2001). Contribution of cervical smooth muscle activity to the duration of
latent and active phases of labour. British Journal of Obstetrics and Gynaecology, Vol.108, No.5, pp.533-538, ISSN 0306-5456.
Pajntar, M. & Verdenik, I. (1995). Electromyographic activity in cervices with very low Bishop score during labor. International Journal of Gynaecology and Obstetrics: The
Official Organ of the International Federation of Gynaecology and Obstetrics, Vol.49, No.3, pp.277-281, ISSN 0020-7292.
Pajntar, M. et al. (1998). Activity of smooth muscles in human cervix and uterus. European
Journal of Obstetrics Gynecology and Reproductive Biology, Vol.79, No.2, pp.199-204, ISSN 0301-2115.
Pincus, S. (1991). Approximate Entropy as a Measure of System-Complexity. Proceedings of
the National Academy of Sciences of the United States Of, Vol.88, No.6, pp.2297-2301, ISSN 0027-8424.
Pitkin, R. (2003). Commentary on Pelvic scoring for elective induction (Reprinted from Obstet Gynecol, vol 24, pg 266-8, 1964). Obstetrics and Gynecology, Vol.101, No.5, pp.846-846, ISSN 0029-7844.
Radhakrishnan, N. & Gangadhar, B. (1998). Estimating regularity in epileptic seizure time-series data. Engineering in Medicine and Biology Magazine, IEEE, Vol.17, No.3, pp.89-94, ISSN 0739-5175.
Rezek, I. & Roberts, S. (1998). Stochastic complexity measures for physiological signal analysis. IEEE Transactions on Biomedical Engineering, Vol.45, No.9, pp.1186-1191, ISSN 0018-9294.
Richman, J. & Moorman, J. (2000). Physiological time-series analysis using approximate entropy and sample entropy. American Journal of Physiology-Heart and Circulatory
Physiology, Vol.278, No.6, pp.H2039-H2049, ISSN 0363-6135. Rudel, D. & Pajntar, M. (1999). Active contractions of the cervix in the latent phase of labour.
British Journal of Obstetrics and Gynaecology, Vol.106, No.5, pp.446-452, ISSN 0306-5456.
Sabry-Rizk, M. et al. (2000). Nonlinear dynamic tools for characterizing abdominal electromyographic signals before and during labour. Transactions of the Institute of
Measurement and Control, Vol.22, No.3, pp.243-270, ISSN 0142-3312. Schlembach, D. et al. (2009). Monitoring the progress of pregnancy and labor using
electromyography. European Journal of Obstetrics, Gynecology, and Reproductive
Biology, Vol.144 Suppl 1, pp.S33-39, ISSN 1872-7654.
www.intechopen.com
An Uterine Electromyographic Activity as a Measure of Labor Progression
267
Schwalm, H. & Dubrauszky, V. (1966). The structure of the musculature of the human uterus--muscles and connective tissue. American Journal of Obstetrics and Gynecology, Vol.94, No.3, pp.391-404, ISSN 0002-9378.
Sharf, Y. et al. (2007). Continuous monitoring of cervical dilatation and fetal head station during labor. Medical Engineering & Physics, Vol.29, No.1, pp.61-71, ISSN 1350-4533.
Shields, S. et al. (2007). Dystocia in nulliparous women. American Family Physician, Vol.75, No.11, pp.1671-1678, ISSN 0002-838X.
Sizer, A.R. et al. (2000). A second-stage partogram. Obstetrics and Gynecology, Vol.96, No.5 Pt 1, pp.678-683, ISSN 0029-7844.
Terrien, J.; Marque, C. & Germain, G. (2008). Ridge Extraction From the Time–frequency Representation (TFR) of Signals Based on an Image Processing Approach: Application to the Analysis of Uterine Electromyogram AR TFR. Biomedical
Engineering, IEEE Transactions on, Vol.55, No.5, pp.1496-1503, ISSN 0018-9294. Terrien, J. et al. (2009). Sources of Bias in Synchronization Measures and how to Minimize
Their Effects on the Estimation of Synchronicity: Application to the Uterine Electromyogram, Recent Advances in Biomedical Engineering, Ganesh, R. N. pp. (73-100), InTech., ISBN 978-953-307-004-9.
Terrien, J. et al. (2010). Uterine electromyogram database and processing function interface: An open standard analysis platform for electrohysterogram signals. Computers in
Biology and Medicine, Vol.40, No.2, pp.223-230, ISSN 0010-4825. Veit, J. (1912). Das Electrometrogram. Zentralbl Gynaekol, Vol.36, pp.161. Verdenik, I.; Pajntar, M. & Leskosek, B. (2001). Uterine electrical activity as predictor
of preterm birth in women with preterm contractions. European Journal of
Obstetrics, Gynecology, and Reproductive Biology, Vol.95, No.2, pp.149-153, ISSN 0301- 2115.
Vinken, M.P.G.C. et al. (2010). Nifedipine-induced changes in the electrohysterogram of preterm contractions: feasibility in clinical practice. Obstetrics and Gynecology
International, Vol. 2010, pp.1-8, ISSN 1687-9597. Vrhovec, J. (2009). Evaluating the progress of the labour with sample entropy calculated
from the uterine EMG activity. Elektrotehniski vestnik - Electrotechnical Review, Vol.76, No.4, pp.165-170.
Vrhovec, J. et al. (2010). A uterine electromyographic activity as a measure of labour progression. Zdravniski Vestnik-Slovenian Medical Journal, Vol.79, No.2, pp.109-116, ISSN 1318-0347.
Windrim, R. et al. (2007). A randomized controlled trial of a bedside partogram in the active management of primiparous labour. Journal of Obstetrics and Gynaecology Canada:
JOGC = Journal D'obstétrique Et Gynécologie Du Canada: JOGC, Vol.29, No.1, pp.27-34, ISSN 1701-2163.
Word, R. et al. (2007). Dynamics of cervical remodeling during pregnancy and parturition: Mechanisms and current concepts. Seminars in Reproductive Medicine, Vol.25, No.1, pp.69-79, ISSN 1526-8004.
www.intechopen.com

Applications of EMG in Clinical and Sports Medicine
268
Zhang, X.; Roy, R. & Jensen, E. (2001). EEG complexity as a measure of depth of anesthesia for patients. Biomedical Engineering, IEEE Transactions on, Vol.48, No.12, pp.1424-1433, ISSN 0018-9294.
www.intechopen.com
Applications of EMG in Clinical and Sports MedicineEdited by Dr. Catriona Steele
ISBN 978-953-307-798-7Hard cover, 396 pagesPublisher InTechPublished online 11, January, 2012Published in print edition January, 2012
InTech EuropeUniversity Campus STeP Ri Slavka Krautzeka 83/A 51000 Rijeka, Croatia Phone: +385 (51) 770 447 Fax: +385 (51) 686 166www.intechopen.com
InTech ChinaUnit 405, Office Block, Hotel Equatorial Shanghai No.65, Yan An Road (West), Shanghai, 200040, China
Phone: +86-21-62489820 Fax: +86-21-62489821
This second of two volumes on EMG (Electromyography) covers a wide range of clinical applications, as acomplement to the methods discussed in volume 1. Topics range from gait and vibration analysis, throughposture and falls prevention, to biofeedback in the treatment of neurologic swallowing impairment. The volumeincludes sections on back care, sports and performance medicine, gynecology/urology and orofacial function.Authors describe the procedures for their experimental studies with detailed and clear illustrations andreferences to the literature. The limitations of SEMG measures and methods for careful analysis arediscussed. This broad compilation of articles discussing the use of EMG in both clinical and researchapplications demonstrates the utility of the method as a tool in a wide variety of disciplines and clinical fields.
How to referenceIn order to correctly reference this scholarly work, feel free to copy and paste the following:
Jerneja Vrhovec and Alenka Mac ̌ek Lebar (2012). An Uterine Electromyographic Activity as a Measure ofLabor Progression, Applications of EMG in Clinical and Sports Medicine, Dr. Catriona Steele (Ed.), ISBN: 978-953-307-798-7, InTech, Available from: http://www.intechopen.com/books/applications-of-emg-in-clinical-and-sports-medicine/an-uterine-electromyographic-activity-as-a-measure-of-labor-progression